
Abstract
The mechanical behavior of deep tight sandstone reservoirs, particularly the brittle–plastic transition under high confining pressure, is critical for drilling safety and efficient reservoir development. However, under deep-reservoir confinement (typically >90 MPa), the micro–macro origin of the brittle–plastic transition and the phase-dependent damage pathway remain insufficiently quantified. This study investigates the intrinsic relationship between macroscopic mechanical response and microscale damage mechanisms of tight sandstone under high confinement. Tight sandstone from the Permian Jiamuhe Formation in the Junggar Basin was selected, and a digital rock model was constructed using a three-dimensional Voronoi polyhedron algorithm informed by mineral composition (XRD) and mechanical parameters, with pores and clay units incorporated to represent heterogeneity. The model parameters were calibrated, and the digital-rock scale was assessed by comparison with laboratory stress–strain curves at σ3 = 0–60 MPa, and then extended to numerical triaxial compression tests under confining pressures of 0–200 MPa. Damage evolution was simulated using the equivalent modulus method to analyze stress–strain characteristics, damage progression, and equivalent stress distribution. The results show that: (1) At the macroscopic scale, compressive strength and Young's modulus increase significantly with confinement, reaching 1005 MPa and 86.1 GPa, respectively, at 200 MPa, while post-peak behavior shifts from brittle fracture to plastic softening. (2) At the microscale, confinement fundamentally alters the damage path. At 0 MPa, damage initiates in hard minerals (quartz, K-feldspar) due to localized stress concentrations (>133 MPa), coalescing into macroscopic cracks. At 200 MPa, the sequence reverses: softer minerals (albite, muscovite) yield plastically under stresses of 576–672 MPa (damage factor <0.8), whereas quartz, even under stresses up to 1152 MPa, remains intact because confinement suppresses crack propagation, acting instead as the load-bearing skeleton in the plastic stage. (3) The brittle–plastic transition is controlled by three cooperative mechanisms: stress-field homogenization, reversal of the damage path, and transformation of the damage mode.
Keywords
Introduction
With the progressive extension of oil and gas exploration and development into deeper formations, tight sandstone reservoirs, characterized by great burial depth, high in-situ stress, and complex lithology, exhibit mechanical behavior, particularly brittle–plastic transition patterns, that strongly affect drilling safety, reservoir stimulation, and production optimization (Rezaei et al., 2020; Wan et al., 2022; Wong and Baud, 2012). Core sampling in deep formations is often difficult, and the acquisition of intact cores is prohibitively costly. Conventional laboratory experiments are therefore limited in their ability to systematically characterize the evolution of microscale damage and macroscale mechanical responses of rocks under high confining pressures (exceeding 90 MPa). By contrast, digital rock technology, employing non-destructive techniques such as CT scanning and numerical reconstruction, provides an effective pathway to address this challenge (De Boever et al., 2015; Gaboreau et al., 2016; Hemes et al., 2015). However, under deep-reservoir confinement (typically >90 MPa), the intrinsic linkage between macroscopic stress–strain response and mineral-/pore-scale damage evolution remains insufficiently quantified, which limits mechanistic interpretation of the brittle–plastic transition and its engineering implications.
Existing studies have confirmed that confining pressure is the key factor regulating rock brittle–plastic behavior. Baud et al. (2009), through systematic triaxial compression experiments on high-porosity carbonate rocks, demonstrated that with increasing confining pressure, the failure mode undergoes a marked transition: at low confining pressure, localized compaction shear bands dominate, whereas at higher confining pressure, distributed failure characterized by strain hardening and cataclastic flow prevails. Beyond experimental studies, discrete element method (DEM) simulations provide powerful tools for exploring the micromechanical mechanisms of brittle–plastic transition. Duan et al. (2017), using triaxial DEM simulations of sandstone, showed that the evolution of rock failure from localized brittle fracture to distributed damage is not only governed by the minimum principal stress (σ₃) but also strongly affected by the intermediate principal stress (σ₂). Their particle-scale analysis further revealed that higher confining pressure promotes a more homogeneous distribution of contact forces.
In digital rock modeling, numerical models based on DEM and Voronoi tessellation techniques have recently shown considerable advantages in simulating both microscopic structure and macroscopic mechanical behavior of rocks. Al Balushi and Dahi Taleghani (2022), by integrating micro-CT imaging, finite element modeling, and the lattice Boltzmann method, developed a predictive workflow for stress-dependent permeability and demonstrated that the degree of intergranular cementation is a critical factor controlling permeability sensitivity to stress. Zhang et al. (2023) proposed a Voronoi-based discontinuous deformation analysis (DDA) approach that, through modifications to contact constitutive relations, eliminated mesh dependence caused by preferential failure along short edges. They further conducted systematic parameter calibration to achieve accurate simulations of rock fracture processes under confining pressure. Wang et al. (2021) developed a three-dimensional Voronoi-block particle model in which Voronoi cells were coupled with agglomerated particle logic, thereby substantially enhancing the nonlinear fitting of both the uniaxial compressive strength–tensile strength ratio and the overall strength envelope. Such 3D digital-rock frameworks are particularly suited to tracking phase-dependent stress redistribution and damage accumulation, thereby enabling a direct micro-mechanical explanation of macroscopic brittle–plastic behavior under high confinement.
However, current research has primarily concentrated on medium to low confining pressures (≤60 MPa) or on individual mechanical parameters such as compressive strength and elastic modulus (Hu et al., 2025; Miao et al., 2024; Wang et al., 2020; Wen et al., 2024; Zeng et al., 2019. Systematic investigations remain lacking on the micromechanisms of brittle–plastic transition in tight sandstone under high confining pressure, including mineral grain damage evolution, variations in crack-type proportions, quantitative characterization such as confining pressure–brittleness index association models, and the influence of digital rock scale effects. Specifically, phase-specific damage (e.g., quartz/feldspar versus clay-rich regions), pore-related deformation, and the evolution of tensile–shear crack proportions with increasing σ3 are rarely integrated into a unified micro–macro interpretation at σ3 > 90 MPa. In particular, in deep and ultra-deep formations (burial depth >4000 m), high confining pressure not only alters the macroscopic strength of rocks but may also suppress crack propagation and remodel stress distributions, thereby inducing cross-scale transformations from brittle to ductile–plastic behavior. Yet numerical simulations and mechanistic interpretations of this process remain inconclusive.
To address these gaps, this study investigates tight sandstone from the Permian Jiamuhe Formation in the Junggar Basin. A three-dimensional digital rock model incorporating mineral composition and pore structure was constructed. Numerical uniaxial and triaxial compression tests were then performed under high confining pressures ranging from 0 to 200 MPa, combined with the equivalent modulus method, to systematically examine how confining pressure regulates brittle–plastic changes in tight sandstone and to elucidate the micromechanical–macroscopic associations of damage and mechanical behavior. The findings provide theoretical support for safe drilling and efficient development of deep tight sandstone reservoirs, while extending the applicability of digital rock technology to rock mechanics research under extreme geological conditions.
Digital rock model of tight sandstone
Core compression experiments
The experimental samples were collected from tight sandstone cores of the Permian Jiamuhe Formation in the Junggar Basin, at burial depths of 4998–5045 m. Based on drilling records for the cored interval, the in-situ formation temperature is 129–137 °C and the formation pressure is 125–128 MPa. The formation is dominated by gray sandstone with relatively thin strata. Core preparation followed ASTM D443-04: the cores were cut into cylindrical specimens with a diameter of 25 mm and a height-to-diameter ratio of 2 (i.e., a height of 50 mm). Both ends were lathed and polished with a precision machine tool to ensure end-face non-parallelism of less than 0.015 mm. The processed samples are shown in Figure 1.

Core samples used in the experiment.
Tests were performed on a servo-controlled rock mechanics testing machine. Standard cylindrical specimens were placed between the loading platens, and axial loading was applied under displacement control at a constant rate of 0.001 mm/s until failure. For uniaxial compression tests, no lateral confinement was applied (σ3 = 0). For triaxial compression tests, specimens were first subjected to hydrostatic confining pressure (σ3) ramped to the target value and then maintained constant throughout the subsequent axial loading stage, following the conventional triaxial stress path where σ2 = σ3 (constant) while σ1 increases monotonically. Stress and strain were recorded synchronously to obtain stress–strain curves. The peak stress corresponded to the compressive strength, and elastic modulus and Poisson's ratio were calculated from the stress–strain relationship. The macroscopic morphology of the specimens before and after testing is shown in Figure 2, and the stress–strain curves of four representative specimens are presented in Figure 3.

Comparison of specimens before and after testing.

Stress–strain curves of uniaxial and triaxial compression tests.
The deformation process of sandstone under compression can be divided into four characteristic stages (Zhang et al., 1998; Zhou et al., 2025):
Pore compaction stage (OA segment): Pre-existing microcracks and pores progressively close under loading, causing densification. The stress–strain curve shows nonlinear growth.
Elastic stage (AB segment): The rock undergoes linear elastic deformation, fully recoverable upon unloading. The stress–strain curve is linear.
Stable microcrack development stage (BC segment): The rock enters plastic deformation, with new microcracks nucleating and expanding steadily. Point B marks the elastic limit; beyond this point, deformation is irreversible.
Post-failure stage (CD segment): Microcracks rapidly coalesce into macroscopic cracks and fracture surfaces. Point C corresponds to the peak stress (compressive strength). After this stage, load-bearing capacity decreases sharply, leading to large-scale failure.
Under uniaxial compression (confining pressure = 0 MPa), the specimens, due to pores and pre-existing microcracks, exhibited a pronounced pore compaction stage. With increasing load, they entered the elastic stage. Plastic deformation commenced at a strain of 0.64%, with a yield strength of 108 MPa (approximately 69% of peak strength). At 0.81% strain, the specimens entered the post-failure stage. Without confining pressure, splitting failure occurred under axial loading, with fractures propagating along weak planes and forming axial-parallel through-going cracks. Within the confining pressure range of 0–40 MPa, the specimens showed no evident plastic characteristics; stress dropped rapidly after peak strength, consistent with the brittle failure mode of rocks (Brideau et al., 2009; Scholz, 1968). The mechanical parameters of the tight sandstone cores are summarized in Table 1.
Mechanical parameters of tight sandstone cores.

Construction of the digital rock model
The construction of the digital rock model for tight sandstone was guided by the correlation between microscale structure and macroscale mechanical behavior. A three-dimensional Voronoi polyhedron (Voronoi cell) approach was employed to simulate the random distribution of mineral grains (Ghazvinian et al., 2014; Liu et al., 2021; Qiu et al., 2021). In this method, a set of discrete points is generated in space, partitioning the rock volume into contiguous, non-overlapping polyhedral cells. Each cell represents a mineral grain, and the geometry of cell boundaries reflects the irregular grain-to-grain contacts characteristic of natural rocks. Compared with CT-based modeling, which strongly depends on mineral contrast, the Voronoi approach can be directly constructed from mineralogical data of cuttings (e.g., X-ray diffraction, XRD), making it especially suitable for tight sandstone formations where core recovery from deep reservoirs is limited.
The study focused on tight sandstone from the Permian Jiamuhe Formation in the Junggar Basin (see Figure 1). XRD analysis of core samples revealed the following mineral composition: quartz (78.8%), feldspar (K-feldspar 3.6% + albite 0.5%), muscovite (6.2%), pyrite (1.0%), and clay minerals (9.9%). Mechanical parameters of these minerals were obtained from the literature (Zhang et al., 2023) and further calibrated by laboratory tests; values are summarized in Table 2.
Mechanical parameters of major mineral constituents.

Considering the low porosity (<12%) of tight sandstone, pores in the model were represented as randomly distributed micro-units (equivalent radius 0.01–0.1 mm) embedded along mineral grain boundaries, together with clay minerals, to simulate weakly cemented regions.
The digital rock model was constructed as a cylindrical specimen with dimensions φ25 mm × 50 mm. Within this volume, n discrete points were randomly generated and partitioned into Voronoi polyhedral cells. Secondary development in Python was used to assign mineral types randomly, ensuring that volumetric proportions matched those of the actual cores. Each Voronoi cell was assigned the calibrated mechanical parameters of its mineral phase, while clay and pore cells were placed along grain boundaries to reproduce natural heterogeneity (Li et al., 2022). Edge cells with excessively small dimensions (<0.1 mm) were removed to avoid numerical distortion. The model was meshed using C3D8R linear reduced integration elements, with element sizes controlled between 0.5 and 1.0 mm to balance accuracy and efficiency. For boundary conditions, rigid plates were attached to the top and bottom surfaces. The bottom plate was fixed, while the top plate was constrained to axial movement only and subjected to axial displacement loading (0.1 mm/s). For triaxial simulations, a uniform confining pressure (σ3) was first applied on the cylindrical lateral surface, ramped to the target value, and then maintained constant during the subsequent axial loading stage (σ2 = σ3); for uniaxial simulations, σ3 = 0. Confining pressures ranging from 0 to 200 MPa were considered, as illustrated in Figure 4. Note that the Voronoi-based digital rock is a stochastic and idealized representation rather than a micro-CT-reconstructed microstructure; therefore, the detailed grain topology, cementation texture, and pore morphology are simplified. Accordingly, the model is intended to reproduce the macroscopic response and the relative evolution of damage patterns, while absolute values—especially those obtained by extrapolation to high confining pressures beyond the experimental calibration range—should be interpreted primarily in terms of trends and mechanisms.

Schematic diagram of uniaxial and triaxial stress environments for digital core.
The damage evolution of sandstone during triaxial compression is a core aspect of its macroscopic mechanical behavior and requires precise simulation through dynamic adjustment of microscale parameters. In this study, the equivalent modulus method was adopted to represent mineral damage processes, as described below.
Damage criterion: Based on the fourth strength theory, a mineral grain is considered to initiate damage once its stress level exceeds the yield strength. The equivalent stress is given by:
Damage factor and elastic modulus degradation (Yu et al., 2021): A damage factor D is introduced to quantify the degree of mineral damage, with its evolution controlled by the strain 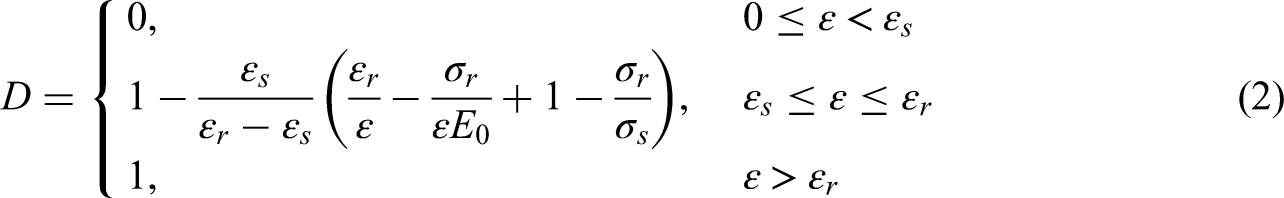
Dynamic adjustment of equivalent modulus under confining pressure: Considering the pressure sensitivity of mechanical parameters under triaxial conditions, the equivalent modulus 
At high confining pressures (≥60 MPa), the material response shifts from brittle fracture–dominated behavior to plastic deformation–dominated behavior. The equivalent modulus method employed here dynamically adjusts stiffness and strength through the confining pressure function (equation 3), effectively operating as a continuous plastic damage model. This framework not only simulates damage softening but also implicitly captures plastic flow and strain-hardening behavior under high confinement by incorporating the strengthening effect of pressure on stiffness and strength. In doing so, it avoids numerical instabilities and physical distortions commonly associated with element deletion.
To further improve the accuracy of particle interactions under high confinement, an advanced modeling strategy was adopted in which shared-node connections between Voronoi polyhedra were replaced by frictional contacts. Specifically, surface-to-surface contact was defined between all grains with an assigned friction coefficient
Experimental–numerical comparative assessment
This section provides a comparative assessment between triaxial compression laboratory tests and numerical simulations using the digital rock model for tight sandstone, aiming to evaluate qualitative and quantitative consistency. The comparison focuses on the stress–strain curve characteristics and key mechanical parameters, including compressive strength and Young's modulus.
The numerical simulations were conducted using the previously constructed digital rock model, with confining pressure conditions, loading rate, and boundary constraints set identical to those in the laboratory tests. Uniaxial and triaxial compression simulations were performed in ABAQUS, achieving “experiment–simulation” condition matching.
The comparison of stress–strain curves under different confining pressures is shown in Figure 5. To evaluate the scale effect of the digital rock, we conducted a sensitivity check using 5000-, 7500-, and 10,000-cell Voronoi models. The results indicate that the 10,000-cell model provides the best overall agreement with the experimental curves over σ3 = 0–60 MPa; it is therefore adopted for subsequent simulations under higher confining pressures. Overall, the simulated and experimental responses are highly consistent. In the elastic stage, the rock remains elastically deforming when strain is below 0.64% (σ3 = 0 MPa), 0.75% (σ3 = 20 MPa), 0.83% (σ3 = 40 MPa), and 0.81% (σ3 = 60 MPa). The slopes of the simulated and experimental curves (i.e., Young's modulus) are nearly identical, indicating consistent elastic behavior. Once strain exceeds these thresholds, the response becomes inelastic. The simulated hardening trend and peak strain (strain at peak stress) agree well with the experiments. After peak strength, the simulated curves at σ3 = 0–40 MPa exhibit a sharp stress drop, consistent with the rapid post-peak loss of load-bearing capacity observed experimentally, thereby capturing the transition from inelastic deformation to damage-induced failure.

Comparison between laboratory experiments and numerical simulations under σ3 = 0–60 MPa for different digital rock scales: (a) 5000 cells; (b) 7500 cells; (c) 10,000 cells.
A comparative summary of compressive strength (peak stress) and Young's modulus (slope of the elastic segment of the stress–strain curve) under different confining pressures is presented in Table 3. The relative differences between numerical simulations and laboratory tests are within 9.5%, indicating good quantitative agreement for the present comparative assessment.
Comparison of experimental and simulated mechanical parameters under different confining pressures.

Numerical simulation results
Strength analysis of tight sandstone under high confining pressure
Using tight sandstone from the Permian Jiamuhe Formation in the Junggar Basin as the study material, uniaxial and triaxial compression simulations were performed under confining pressures
The stress–strain curves of tight sandstone under different confining pressures are shown in Figure 6, exhibiting a clear dependence on confining pressure. At low confinement (

Stress–strain curves of tight sandstone under confining pressures of 0–200 MPa.
Statistical analysis of compressive strength (peak stress) and Young's modulus under different confining pressures (Table 4) yields the following findings:
Compressive strength increases almost linearly with confining pressure. As confinement rises from 0 to 200 MPa, compressive strength increases from 162 MPa to 1005 MPa, a rise of 519.1%. On average, every 20 MPa increase in confinement raises compressive strength by about 84.3 MPa, highlighting the strong strengthening effect of high confinement. Young's modulus also increases with confinement. As pressure rises from 0 to 200 MPa, Young's modulus increases from 30.3 GPa to 86.1 GPa, an increase of 184.2%. This reflects suppression of micropore compaction and initial microcrack growth, making the elastic response of the rock approach that of a “denser medium.”
Compressive strength and Young's modulus of tight sandstone under different confining pressures.

Failure mode analysis (Figure 7) further demonstrates that confining pressure regulates both rock strength and fracture morphology by constraining intergranular sliding and crack propagation. At low confinement (

Failure modes of tight sandstone digital rock model under different confining pressures.

Equivalent stress distribution of rock at different strain stages (0 MPa).

Simulated damage evolution of rock at different strain stages (0 MPa).

Equivalent stress distribution of rock at different strain stages (200 MPa).

Simulated damage evolution of rock at different strain stages (200 MPa).
Brittle–plastic behavior of tight sandstone under high confining pressure
Digital rock simulations were used to analyze the damage evolution and equivalent stress distribution of tight sandstone under confining pressures of 0 and 200 MPa at different strain stages, revealing the microscale mechanisms underlying the brittle–plastic transition. This confinement-dependent transition from localized brittle faulting to more distributed inelastic deformation (often described as cataclastic/compactive flow in porous rocks) and the associated suppression of stress/strain localization have been widely documented in experimental and micromechanical studies (Wong and Baud, 2012).
At 0 MPa, damage evolution displays typical brittle characteristics. During the linear elastic stage (strain ≈0.40%), clay minerals are completely damaged, while high-strength minerals such as quartz and K-feldspar exhibit scattered micro-damage. By contrast, softer minerals such as pyrite and albite, owing to greater elastic strain tolerance, remain intact. At the elastic limit (strain ≈0.58%), localized damage begins to appear in quartz and K-feldspar, whereas softer minerals remain largely unaffected, consistent with the conventional observation that “high-strength minerals, with smaller strain capacity, yield earlier.” Upon reaching the yield point (strain ≈0.64%), damage develops rapidly and coalesces into macroscopic cracks in the lower part of the specimen, ultimately producing through-going fracture. Stress distribution further supports this process: in the elastic stage, stress is relatively dispersed (62–171 MPa); at the elastic limit, high-stress zones (>124 MPa) in pyrite and muscovite initiate damage, while albite remains intact with lower uniform stress levels (62–124 MPa). Quartz and K-feldspar bear higher stresses (>133 MPa) but sustain only minor damage. During yielding, overall stress increases to 150–187 MPa, and high-stress zones coincide with concentrated damage, indicating that brittle failure is controlled by stress localization. This localization-dominated damage evolution is consistent with the classical low-confinement brittle regime in sandstones/porous rocks, where dilatant microcracking and progressive coalescence lead to macroscopic faulting and pronounced post-peak softening (Paterson and Wong, 2005).
At 200 MPa, the mechanical response is fundamentally transformed. During the elastic stage (strain ≈0.40%), the specimen remains intact, with clay minerals compacted into a continuous medium. At the elastic limit (stress ≈1140 MPa), the damage mechanism exhibits a “reversal”: albite and muscovite (576–672 MPa, with local regions >642 MPa) are the first to undergo plastic damage, whereas quartz and K-feldspar, although subjected to higher stresses, remain largely undamaged because confinement enhances crystal stability. At the yield limit (stress ≈1220 MPa), albite, muscovite, and K-feldspar display diffuse plastic damage (damage factor <0.8), without the formation of macroscopic cracks. Quartz, despite bearing extremely high stresses (up to 1152 MPa), does not fracture; instead, confinement suppresses crack propagation and allows quartz to act as the load-bearing skeleton during plastic deformation. Stress evolution confirms this shift: even at the elastic stage, stress is highly uniform (280–480 MPa), far exceeding stress levels under 0 MPa confinement. After plastic yielding, stress rises to 864–1152 MPa, but distribution remains homogeneous, with no evidence of stress concentration. Such homogenized stress redistribution and diffuse inelastic damage under high confinement are consistent with reported high-effective-pressure deformation modes in sandstones, including distributed cataclastic/compactive flow and (in some cases) compaction-band-related inelasticity (Baud et al., 2006; Meng et al., 2025).
These results demonstrate that high confining pressure induces the brittle–plastic transition of tight sandstone through three coupled mechanisms: (1) stress-field homogenization, whereby confinement enforces cooperative load-sharing among minerals, markedly increasing stiffness and suppressing local stress concentration; (2) reversal of the damage path, as the initiation of damage shifts from hard minerals (quartz) to softer minerals (albite), which dissipate energy preferentially through inelastic deformation; and (3) transformation of the deformation/damage mode, in which unstable microcrack propagation (damage factor = 1.0) is replaced by distributed inelastic (plastic-like) deformation represented phenomenologically in the present continuum damage framework (damage factor < 0.8), producing macroscopic diffuse deformation rather than localized fracture. Note that crystal-scale mechanisms (e.g., dislocation slip or deformation twinning) are not explicitly simulated in this model; they are discussed only as possible microphysical interpretations under high confinement. At a deeper level, this transition arises because confinement increases interfacial frictional resistance between mineral grains, suppressing crack opening and propagation. Therefore, rock failure shifts from tensile-controlled brittle fracture to shear-controlled plastic flow. This finding provides theoretical guidance for wellbore stability and hydraulic fracturing design in deep resource extraction. Collectively, these microscale observations provide a direct mechanistic explanation for the macroscopic brittle–plastic transition reported in Section 3.1, namely the reduced post-peak stress drop and the shift from localized fracture to distributed damage with increasing confinement.
Conclusions
Using digital rock technology, this study systematically investigated the mechanical response, damage evolution, and brittle–plastic transition of tight sandstone from the Jiamuhe Formation in the Junggar Basin under high confining pressures (0–200 MPa). The main conclusions are as follows:
Macroscopic strengthening and modification under high confinement. Compressive strength and Young's modulus increase almost linearly with confining pressure. At 200 MPa, compressive strength reaches 1005 MPa (a 519.1% increase), while Young's modulus rises to 86.1 GPa (a 184.2% increase). The stress–strain curve evolves from a steep post-peak drop at low confinement (brittle behavior) to gradual strain softening at high confinement (plastic behavior). Failure mode correspondingly shifts from single through-going cracks to multiple-crack coalescence and diffuse damage. Reconstruction of microscale damage evolution and stress distribution. At low confinement (0 MPa), damage follows a “hard-mineral-first” brittle fracture path: high-strength minerals such as quartz and K-feldspar develop microcracks early due to localized stress concentrations (>133 MPa), which eventually coalesce into macroscopic fractures. At high confinement (200 MPa), the mechanism reverses, showing ‘soft-mineral-first’ inelastic yielding: albite and muscovite exhibit earlier distributed inelastic deformation (damage factor < 0.8) under stresses of 576–672 MPa, while quartz, although bearing stresses up to 1152 MPa, does not fracture because confinement suppresses crack propagation. Instead, quartz serves as the load-bearing skeleton in the inelastic stage. Microscale mechanisms of brittle–plastic transition. The transition is governed by three cooperative mechanisms: (i) stress-field homogenization, where confinement enforces cooperative load-sharing among minerals and suppresses stress concentration; (ii) reversal of the damage path, as initiation shifts from hard minerals to soft minerals; and (iii) transformation of the deformation/damage mode, as unstable microcrack propagation is replaced by distributed inelastic (plastic-like) deformation within the continuum damage framework. At a fundamental level, confinement enhances interfacial frictional resistance between minerals, suppressing crack opening and propagation, and thereby shifts rock failure from tensile-controlled brittle fracture to shear-controlled inelastic flow.
This study reveals the microscale mechanisms that underpin the brittle–plastic transition of tight sandstone under high confining pressure. It should be noted that the quantitative transition range and the dominant accommodating phases may vary with lithology (e.g., clay content and cementation/pore structure), although the qualitative confinement-controlled mechanism remains applicable. The findings provide a theoretical foundation and a numerical evaluation framework for safe and efficient drilling of deep tight sandstone reservoirs (wellbore stability control) and for hydraulic fracturing design (prediction of plastic zones and fracture propagation). Future work will focus on improving microstructural realism by incorporating more structure-constrained digital rock construction and refined representations of pores/cement/clay, and on enhancing quantitative predictability by further constraining key constitutive/contact parameters with additional laboratory data over a wider range of confining pressures. When available, in-situ pore-fluid and temperature information will also be integrated to extend the present framework toward coupled field-relevant conditions.
Footnotes
Funding
The authors received no financial support for the research, authorship, and/or publication of this article.
Declaration of conflicting interests
The authors declared no potential conflicts of interest with respect to the research, authorship, and/or publication of this article.