
Abstract
In situ thermal injection modification is an effective approach to address issues such as low production efficiency and poor safety in deep coal mining. During pyrolysis, the pore structure of coal significantly changes, which in turn alters the permeability of pyrolyzed coal seams. Research on porosity evolution models during pyrolysis is crucial for evaluating oil and gas production efficiency and assessing groundwater environmental impacts in mining areas. To address the current limitations of experimental methods that cannot achieve real-time continuous measurement and quantitative description, a universal porosity evolution model for coal during pyrolysis is established in this study. The model is based on the mechanism of organic matter decomposition and is combined with pyrolysis reaction kinetics. Taking the No.2 coal seam of Cixi Mine in Fengfeng Mining Area and the No.12 coal seam of Zhaogezhuang Mine in Kailuan Mining Area, both with a burial depth of over 1000 m, as the research objects, the calculated values were compared with the measured data. The error was relatively small, and the simulated curve of coal porosity variation during pyrolysis was highly consistent with the measured curve, which proves that the established model can accurately and quantify the porosity evolution process of pyrolyzed coal.
Introduction
In situ thermal injection modification mining is an emerging mining technology that involves injecting heat into deep coal seams to induce in situ pyrolysis underground (Figure 1). This process generates high-calorific value combustible gases (H2, CO, CH4) and carbon-free or low-carbon energy sources such as coal tar while retaining most of the carbon (semicoke) for underground storage (Zhao et al., 2008; Ge, 2017; Xie et al., 2017a, 2017b, 2018; Zhao et al., 2019). Compared with conventional underground mining, this method reduces investment costs by 60% and production costs by 70%, increases the coal recovery rate to 95%, decreases land reclamation by 80%, and decreases carbon emissions by nearly 80% (Ge, 2017; Xue et al., 2023). The entire process is green, safe, and efficient, not only avoiding many safety hazards associated with deep underground mining (Li et al., 2021; Du et al., 2024; Wu et al., 2025; Liu et al., 2025; Zhang et al., 2025), but also significantly improving coal utilization efficiency. It holds promise for fundamentally addressing current issues in deep coal mining, such as poor safety and low resource recovery rates, ultimately achieving the eco-friendly mining goal of “no coal above ground, no people underground.”
Despite the advantages of in situ thermal injection modification mining technology, the physical properties of deep coal seams inevitably undergo significant changes during pyrolysis, potentially affecting pyrolysis oil and gas production efficiency and the groundwater environment in mining areas (e.g., increased porosity and permeability of pyrolyzed coal seams may alter groundwater flow patterns and cause pollution). Currently, researchers (Liu et al., 2023; Kou et al., 2024; Li et al., 2025) have conducted preliminary experimental studies on the evolution of coal seam pore structures induced by “in situ thermal injection modification mining.” Niu et al. (2014, 2019) employed X-ray computed tomography (X-CT) scanning technology and a self-developed high-temperature triaxial permeability testing platform to systematically study the mesoscopic characteristics of overheated steam pyrolyzing lignite and its high-temperature permeability. Their findings revealed that porosity increases with temperature and that higher gas pressure at the same temperature leads to greater porosity; overall, the permeability of lignite increases with temperature under different pore pressures. Wang et al. (2020) utilized high-precision micro-CT technology to investigate the evolution of microporous fracture structures in anthracite under varying temperatures. They reported an increasing trend in anthracite porosity with rising temperature, performed 3D reconstruction of pore fractures using MATLAB and AVIZO, and conducted statistical analysis of 3D pore fracture characteristic parameters. Chen et al. (2022) studied the pore structures of lignite and long-flame coal under different pyrolysis temperatures and reported that the pore volume, average pore diameter, specific surface area, and fractal dimension all increase with increasing temperature. Shi et al. (2023) investigated the pore structure of thermally treated bituminous coal using low-field nuclear magnetic resonance and cryogenic nitrogen adsorption techniques. This study revealed that both the number and volume of pores increased with rising temperature, with high-temperature condensation polymerization reactions playing crucial roles in enlarging pore size and increasing pore density. Du et al. (2024) examined the formation and heterogeneity of new pores in oil-rich coal during microwave pyrolysis. After entering the pyrolysis temperature range, the coal generated numerous pores, with the pore volume expanding overall as the temperature increased. The heterogeneity of the pore distribution initially increased but then decreased. Chen et al. (2024) employed in situ small-angle near-field scattering imaging to reveal the temperature-dependent evolution of nanopores in subbituminous coal. An increase in temperature caused the expansion of nanopores by 88.1% to 150.5%, particularly within the 300°C to 500°C range, where high-temperature phases formed new nanopores and enhanced structural complexity. Gao et al. (2025) conducted detailed multiscale pore structure analysis of oil-rich coal samples using micro-CT scanning technology. As the temperature increased, the pore structure and connectivity of the samples gradually changed, with the porosity and permeability gradually increasing. These studies, involving different coal grades and pyrolysis methods with advanced testing techniques, consistently demonstrated that porosity and permeability improved progressively with increasing pyrolysis degree and were characterized primarily by gradual increases in accordance with rising temperature. However, owing to the limitations of current experimental conditions that cannot achieve real-time continuous measurement of coal porosity during pyrolysis, existing studies predominantly focus on temperature factors and concentrate mainly on comparative analyses of porosity before and after pyrolysis. These studies lack consideration of temporal factors, and their descriptions of patterns remain at the qualitative stage. Even when quantitative descriptions exist, they are often statistically based, with poor generalizability, and fail to meet the refined quantitative evaluation requirements for pyrolysis-related hydrocarbon migration and groundwater impacts in mining areas. Establishing a mathematical model that accurately describes the evolution characteristics of coal porosity with respect to temperature and time has become a critical challenge for researchers.
This study takes the No.2 coal of Cixi Mine in Fengfeng Mining Area and the No.12 coal of Zhaogezhuang Mine in Kailuan Mining Area, both with a burial depth of over 1000 m, as the research objects. By analyzing the porosity evolution mechanism of pyrolytic coal and integrating pyrolysis reaction kinetics, we aim to develop a universal model for predicting porosity changes during coal pyrolysis. This model not only provides theoretical support for large-scale in situ thermal injection modification technology in deep coal seam mining but also has significant implications for investigating groundwater environmental responses in deep coal seam pyrolysis mining areas.
Experimental scheme and research methods
Experimental scheme
Pyrolysis and weight loss experiments
The coal was ground into powder and sieved through a 200-mesh fine sieve. An appropriate sample was placed in a custom-made corundum crucible. Both the sample crucible and a blank crucible were then loaded into an STA449 F5 synchronous thermogravimetric analyzer, where the sample mass was precisely measured using a built-in high-precision balance. The heating rate was set to 10°C/min, with the temperature range extending from room temperature to 1000°C. The experimental protective gas was high-purity nitrogen (99.99%) supplied at a flow rate of 30 mL/min. After these settings were implemented, the test commenced, with the computer continuously recording the weight loss during the heating process.
Porosity testing experiment
To clarify the evolution characteristics and regularities of the coal porosity during pyrolysis, and also to compare and verify the proposed porosity model of coal in the pyrolysis process, the coal porosity during the pyrolysis process was measured by means of the conversion method and the mercury intrusion method.
Sample preparation
First, large and well-layered coal samples were extracted using a glass drill bit to drill cylindrical samples (1 cm diameter) perpendicular to the bedding direction, with three samples per group. One group was placed in a tube furnace, and nitrogen was used as the protective gas. The temperature was maintained at 100°C for 60 min before stopping. Nitrogen flow was continued to rapidly cool the sample to room temperature, and the end of this test group was marked. Next, another sample group was placed in the furnace at 200°C, following the same procedure. The experiments were repeated at temperatures of 300°C, 350°C, 400°C, 500°C, and 600°C. With the exception of the 100°C–300°C range (maintained for 60 min), each temperature condition included four constant heating periods: 15, 30, 45, and 60 min. Under each set of temperature and time conditions, two groups of coal sample specimens were prepared. The porosity was measured by the conversion method and mercury intrusion method respectively. After eliminating the abnormal values according to the Grubbs’ criterion, the arithmetic mean value was taken as the true value of porosity.
Conversion method
The conversion method is a conventional approach for measuring the porosity of rock and soil masses. It utilizes the wax-sealing method (with a paraffin melting point of approximately 60°C, which does not affect the coal structure) and the pycnometer method to determine the bulk density and specific gravity of coal samples under different pyrolysis conditions, respectively, and then calculates the porosity of coal samples under the corresponding conditions. Theoretically, this method can detect all pores within the coal; however, the manual operation process is cumbersome and prone to errors. To avoid the impact of experimental errors caused by a single method on the test results, this study supplemented mercury intrusion experiments to measure the porosity of coal samples under various pyrolysis conditions.
Mercury intrusion method
Coal specimens under different pyrolysis conditions were screened to select those without obvious cracks. The selected specimens were dried in an oven at a constant temperature of 105°C for 12 h and then placed in a desiccator for subsequent use. The pretreated coal samples were loaded into the test tube of the AUTOPORE IV 9505 mercury intrusion porosimeter, which was then sealed and evacuated to a vacuum degree of less than 1 Pa. After maintaining the vacuum state for 30 min, a low-pressure test (1.5–350 KPa) was performed first, followed by a high-pressure test (140–231 MPa) with the test tube placed in a high-pressure chamber. The pore size distribution was calculated based on the mercury intrusion volume in pores under different pressures, and then the pore structure parameters such as porosity were obtained.
Research methods
Establishment mechanism and methodology of the coal porosity evolution model in the pyrolysis process
Organic matter constitutes a crucial form of carbon in coal and serves as the primary target for exploitation. In terms of coal pyrolysis mechanisms (Johnson et al., 1988; Li et al., 2014; He et al., 2025), organic components undergo complex condensation and polymerization reactions, ultimately forming products such as coal tar and pyrolysis gases. As these products progressively precipitate, the coal matrix becomes increasingly porous, leading to corresponding changes in porosity. Therefore, organic matter pyrolysis is the primary cause of increased porosity in coal.
After clarifying the mechanism of porosity change in pyrolysis coal, to ensure that the established quantitative model of porosity in the pyrolysis process reflects the true physical nature and is not overly complicated, the following basic assumptions are introduced:
Pyrolysis of organic matter is the main reason for the increase in porosity of coal. Without considering the heat transfer process, the sample is heated to the preset temperature, which is assumed to be reached with a uniform temperature distribution. The pyrolysis oil and gas are completely released, and there are no residual pyrolysis products in the coal sample.
In accordance with the above hypothesis, the porosity of the coal sample in the pyrolysis process can be expressed as follows:

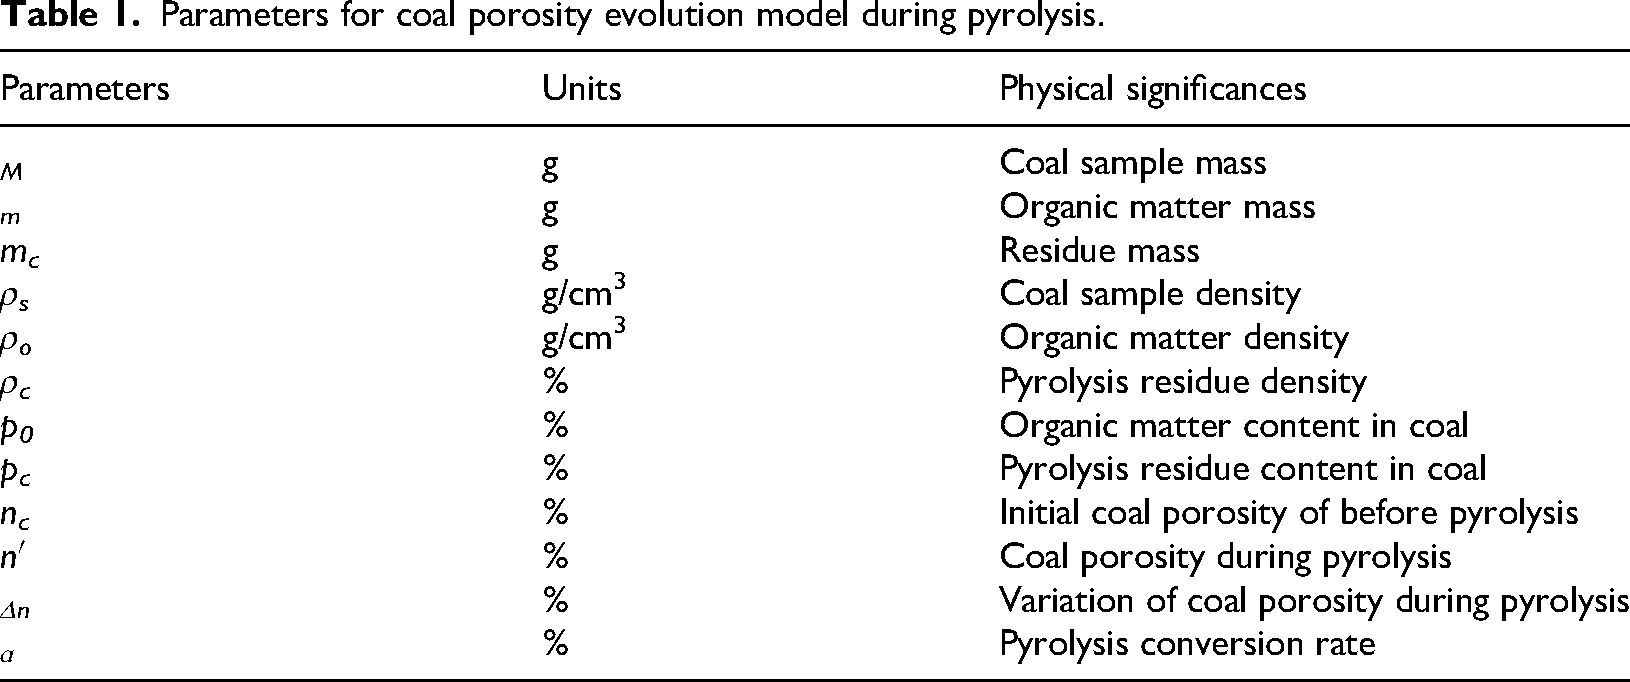
The parameters, units, and physical significances in the above equation are detailed in Table 1.
Parameters for coal porosity evolution model during pyrolysis.
The initial porosity
Method of establishing the pyrolysis reaction rate equation
To better characterize the relationships between the decomposition rate and temperature, and the temperature and reaction process of deep coal at high temperatures, the Coats–Redfern (C–R) method (Coats, 1964a; Coats, 1964b) was used to conduct a kinetic analysis on the coal pyrolysis mass–temperature curve, and then the coal pyrolysis rate equation was established under different temperature conditions. The kinetic equation integral formula followed by this method is as follows:

In the formula, 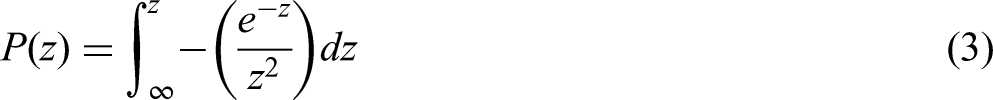
Let the thermal decomposition kinetic mechanism function be 
By substituting Equation (4) into the kinetic mechanism function and its integral 
After integrating Equation (5) and taking logarithms on both sides, we obtain the following:

For most pyrolysis reactions, when D/RT≫1, 
The pyrolysis reaction rate equation at any temperature T is obtained as follows:
Many studies have shown that coal pyrolysis can be described as a first-order reaction (Yang et al., 2010; Ling et al., 2022; Fan et al., 2025), so equation (9) can be changed to the following equation:
The integral of the above expression is obtained as follows:
This is the kinetic equation for coal pyrolysis at temperature T. The parameters, units, and physical significances in the equations are detailed in Table 2.
Parameters for coal pyrolysis kinetic equation.

Results and discussion
Results
Results and analysis of pyrolysis loss weight
Figure 2 displays the TG (mass-temperature) and DTG (mass change rate–temperature) curves of the No.2 coal seam of Cixi Mine and the No.12 coal seam of Zhaogezhuang Mine. It can be clearly seen from the figure that the pyrolysis weight loss of both No.2 coal and No.12 coal has gone through three stages.

Schematic diagram of in situ injection heat modification fluidized mining technology (Zhao et al., 2019).
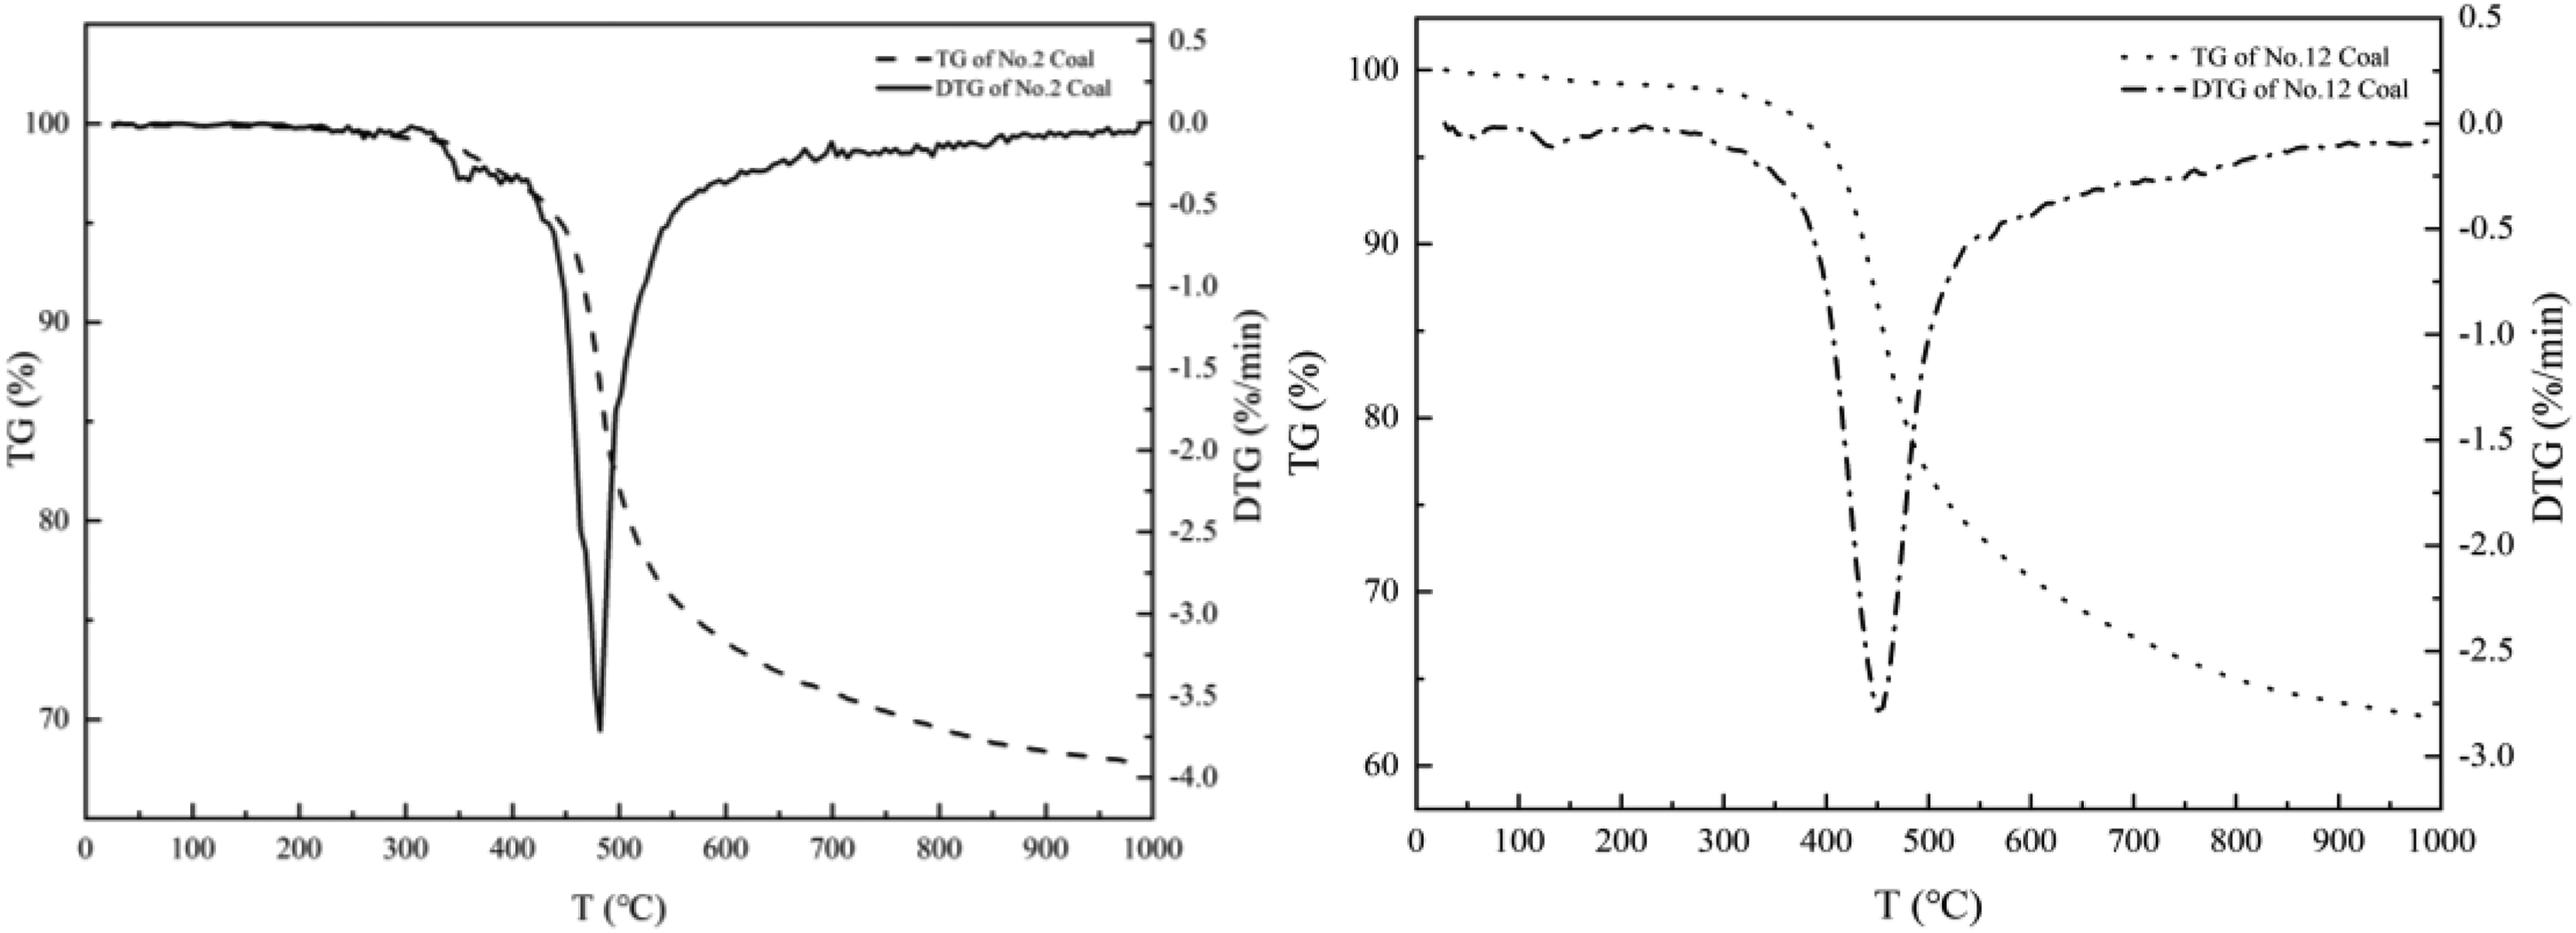
Tg and DTG curves of No.2 coal and No.12 coal.
In the first stage, both the TG and DTG curves show a slight decline, which is mainly caused by the release of water in different forms (such as structural water and bound water) in the coal. During this stage, the weight loss rates of No.2 coal (room temperature = 350°C) and No.12 coal (room temperature = 300°C) account for 1.18% and 1.26% of the sample mass, respectively.
In the second stage, the TG curve drops rapidly and significantly, while the DTG curve first decreases sharply, reaches an extreme value, and then quickly rises back to the level before the change, indicating that the pyrolysis weight loss is the fastest during this stage. The massive and rapid pyrolysis of organic matter in coal, accompanied by the extensive and quick release of generated coal tar and gaseous products, is the main reason for the weight loss in this stage. This stage witnesses the largest variation range of weight loss; the weight loss of No.2 coal (350–600°C) and No.12 coal (300–600°C) accounts for 24.86% and 27.95% of the sample mass, respectively.
In the third stage (above 600°C), the TG curve continues to decline, but the thermal decomposition of minerals in the coal. In this stage, the weight loss of No.2 coal and No.12 coal accounts for 6.15% and 7.99% of the sample mass, respectively.
The above analysis indicates that the pyrolysis of No.2 coal mainly occurs in the temperature range of 350–600°C, while that of No.12 coal mainly takes place in the range of 300–600°C.
Establishment of pyrolysis reaction rate equation
As mentioned earlier, the Coats–Redfern (C–R) method was employed to conduct kinetic analysis on the pyrolysis mass–temperature curve of No. 2 coal and No. 12, thereby establishing the pyrolysis reaction rate equations under various temperature conditions.
The linear fits of
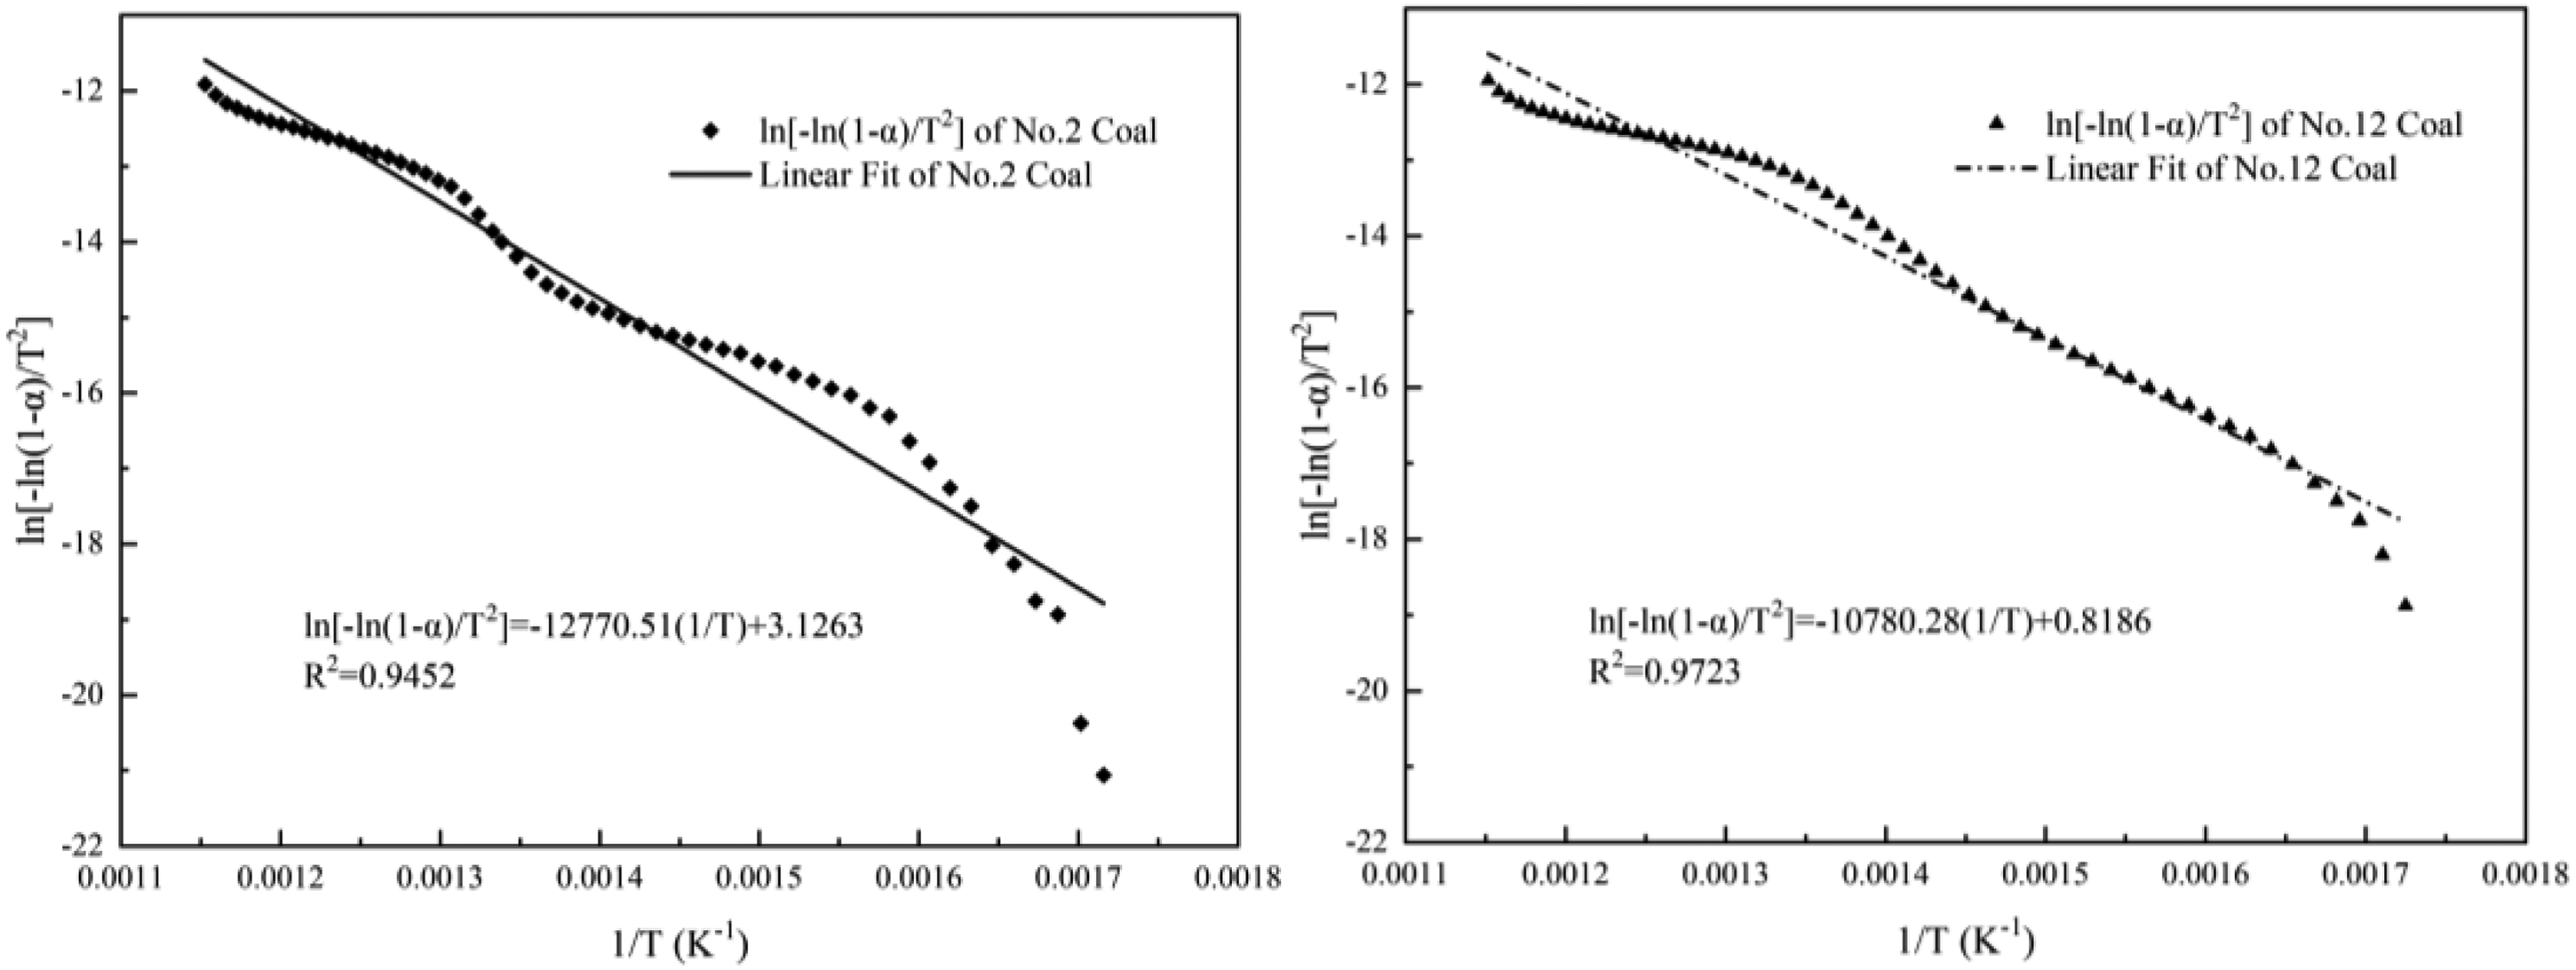
Linear fitting results of ln[-ln(1-α)/T2] and 1/T for No. 2 coal and No. 12 coal.
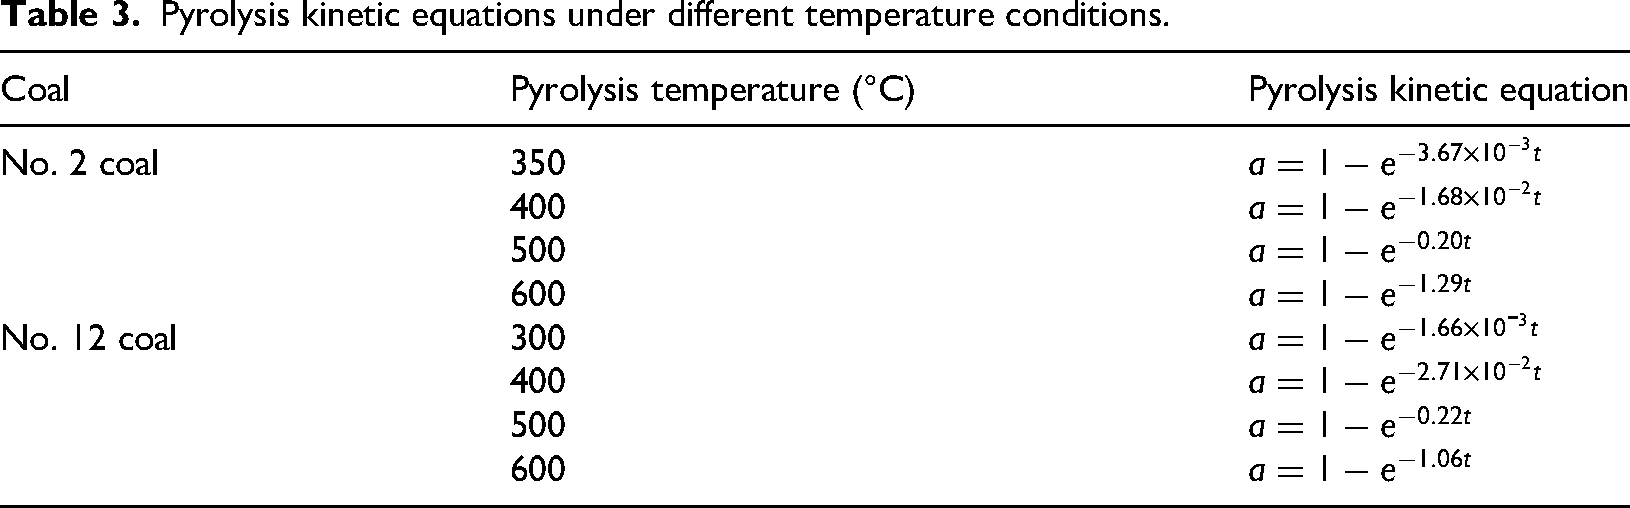
Based on the aforementioned method, the pyrolysis kinetic equations of No.2 coal and No.12 coal can be further obtained, as detailed in Table 3.
Pyrolysis kinetic equations under different temperature conditions.
According to the above pyrolysis kinetic equations, the time required for the pyrolysis of No.2 coal and No.12 coal (calculated at a pyrolysis conversion rate of 99%) under different temperature conditions can be obtained. The results are shown in Table 4.
Time required for the complete pyrolysis of coal at different temperatures.
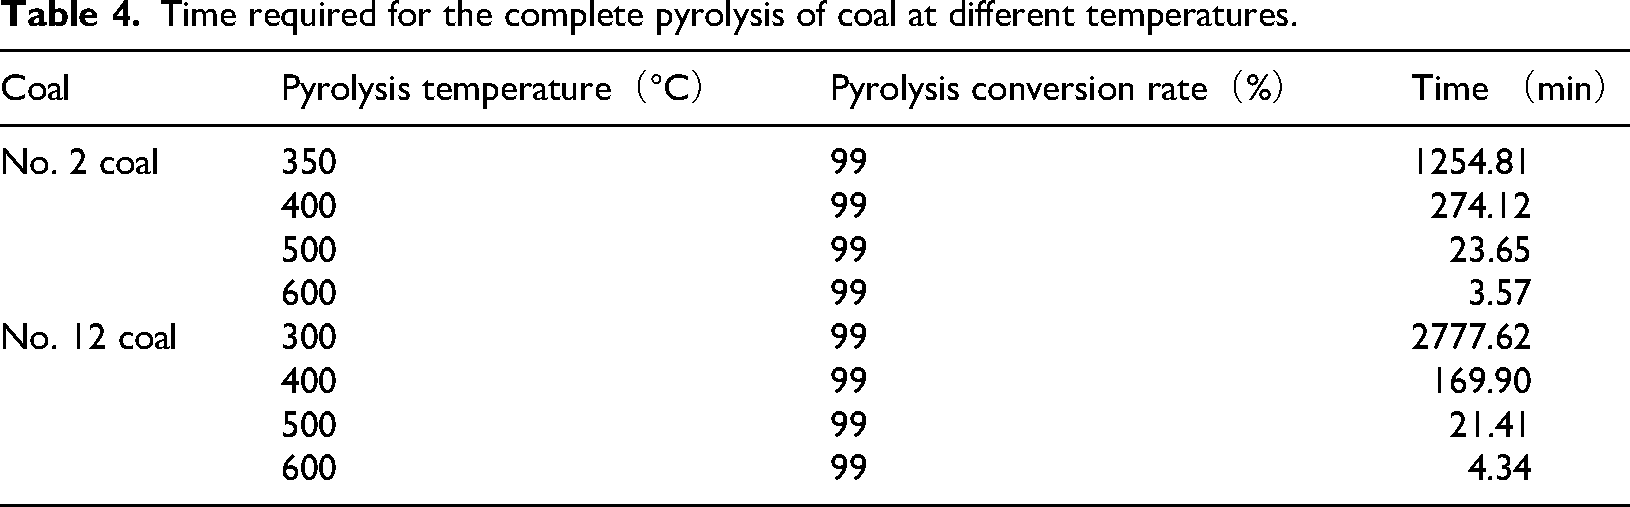
As shown in Table 4, the time required for the complete pyrolysis of coal decreases sharply with the increase in temperature. Taking No.2 coal as an example, it takes 20.91 and 4.57 h to achieve complete pyrolysis at 350°C and 400°C, respectively, while only tens of minutes or even several minutes are needed at 500°C and 600°C.
Evolution law of the porosity of pyrolysis coal
Figure 4 shows the porosity evolution of No.2 coal and No.12 coal with temperature. Details regarding the porosity evolution of No.2 coal with temperature and time during pyrolysis are presented in Figure 5.
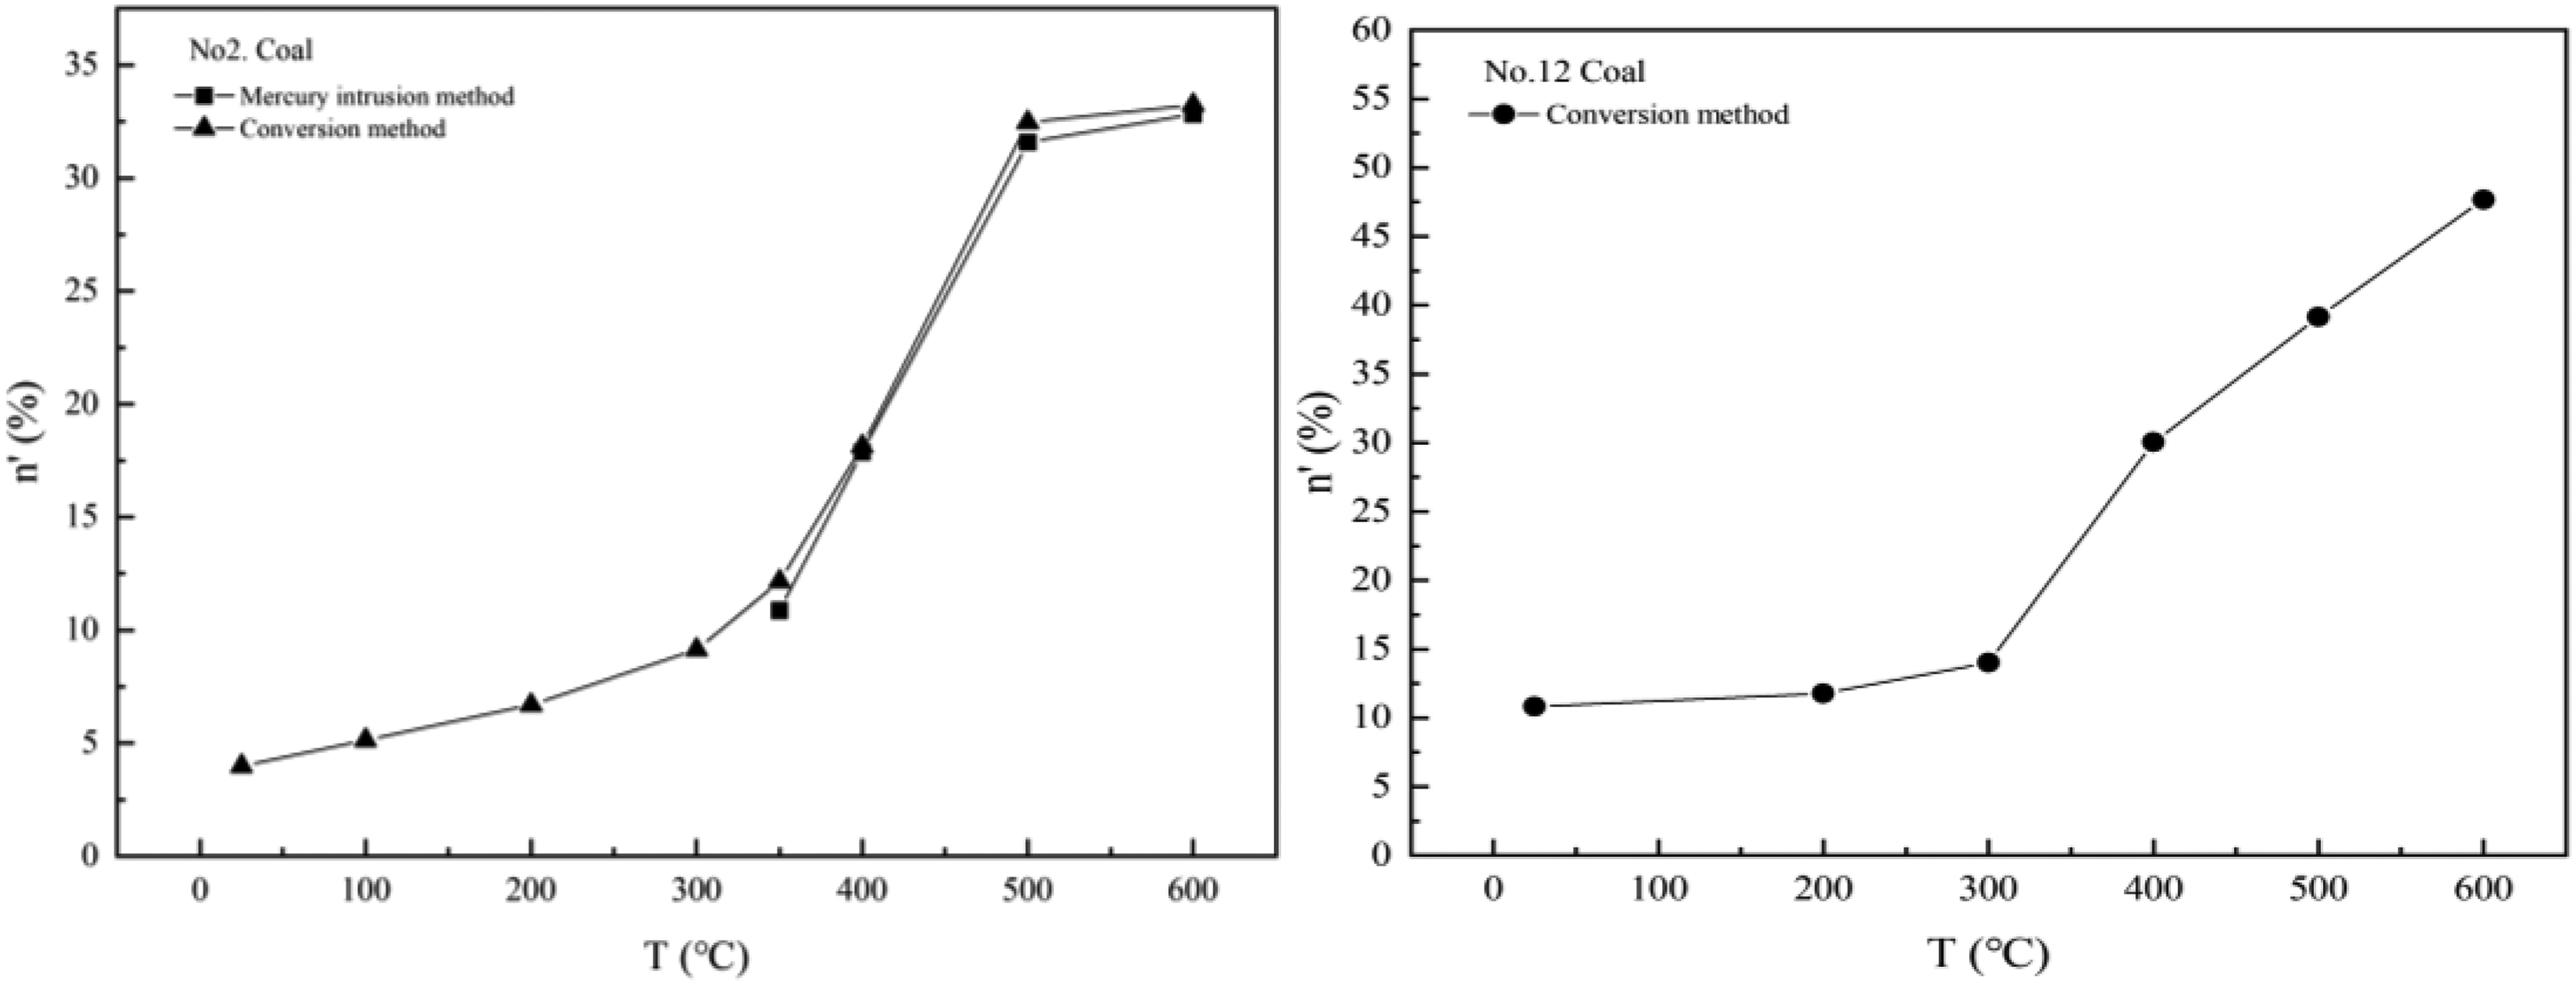
Variation of porosity of No.2 coal and No.12 coal with temperature.

Variation of porosity of No.2 coal with time under different pyrolysis temperatures.
In terms of the evolution law of porosity with pyrolysis temperature. The porosity values of the No.2 coal sample at room temperature, 100°C, 200°C, 300°C, 350°C, 400°C, 500°C, and 600°C are 3.99%, 5.13%, 6.69%, 9.14%, 12.16%, 18.14%, 32.46%, and 33.24%, respectively. The porosity values of the No.12 coal sample at room temperature, 200°C, 300°C, 400°C, 500°C, and 600°C are 10.83%, 11.79%, 14.01%, 30.03%, 39.15%, and 47.67%, respectively. The porosity of both coals increases continuously with the rise of temperature.
In terms of the evolution law of porosity with pyrolysis time. Taking No.2 coal as an example, within the 350–600°C pyrolysis temperature range, the porosity also increased gradually with the extension of heating time. Notably, the porosity growth rate was relatively slow at 350°C and 400 °C, with increases of only 8.17% and 14.15%, respectively, after 60 min of heating. However, significant porosity growth occurred during the initial pyrolysis stage at 500°C and 600°C, with increases reaching 24.48% and 26.15%, respectively, after just 15 min of heating, followed by a gradual slowdown in the growth rate.
Calculation of coal porosity evolution during pyrolysis
In the previous section, the coal porosity was measured under various pyrolysis conditions (different temperatures and durations), and the evolution characteristics were analyzed. However, owing to practical limitations, real-time monitoring of porosity under arbitrary conditions is not feasible. Only measurements at specific temperatures and time points can be obtained. To determine the coal porosity under any pyrolysis conditions, the previously established porosity evolution model must be utilized for computational estimation.
Values of relevant parameters
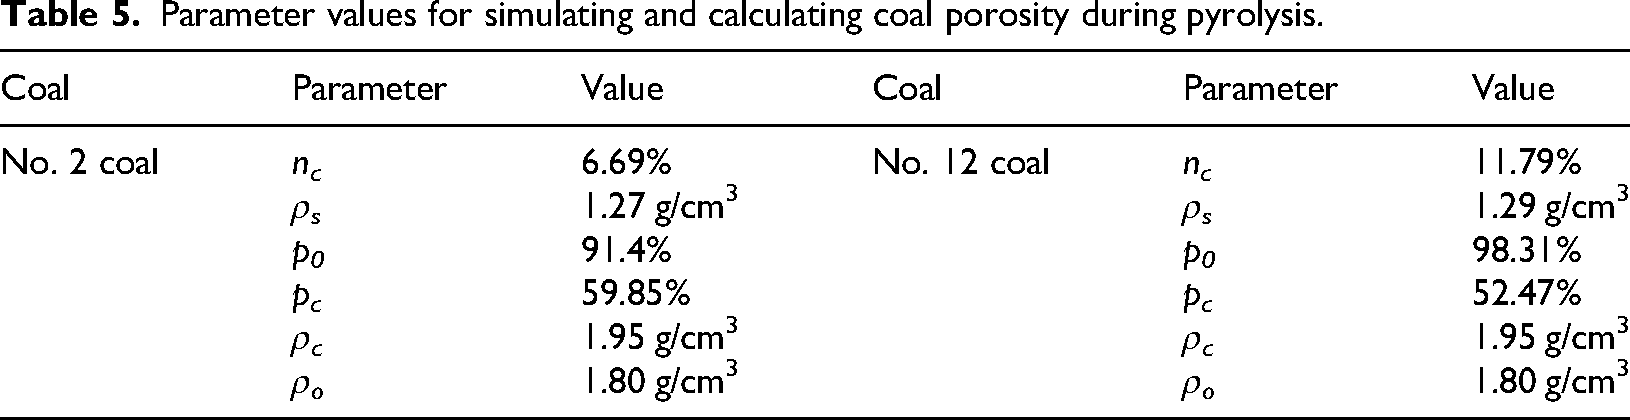
As mentioned above, the No.2 coal and the No.12 coal start to pyrolyze at 350°C and 300°C, respectively. To eliminate the influence of moisture on porosity, the porosity of coal samples heated at 200°C for 60 min is taken as the porosity before pyrolysis. The values of relevant parameters are shown in Table 5.
Parameter values for simulating and calculating coal porosity during pyrolysis.
Calculation of coal porosity during pyrolysis
The porosity of No.2 coal and No.12 coal during pyrolysis was continuously calculated according to Equation (1), and the calculation results are shown in Figure 6.
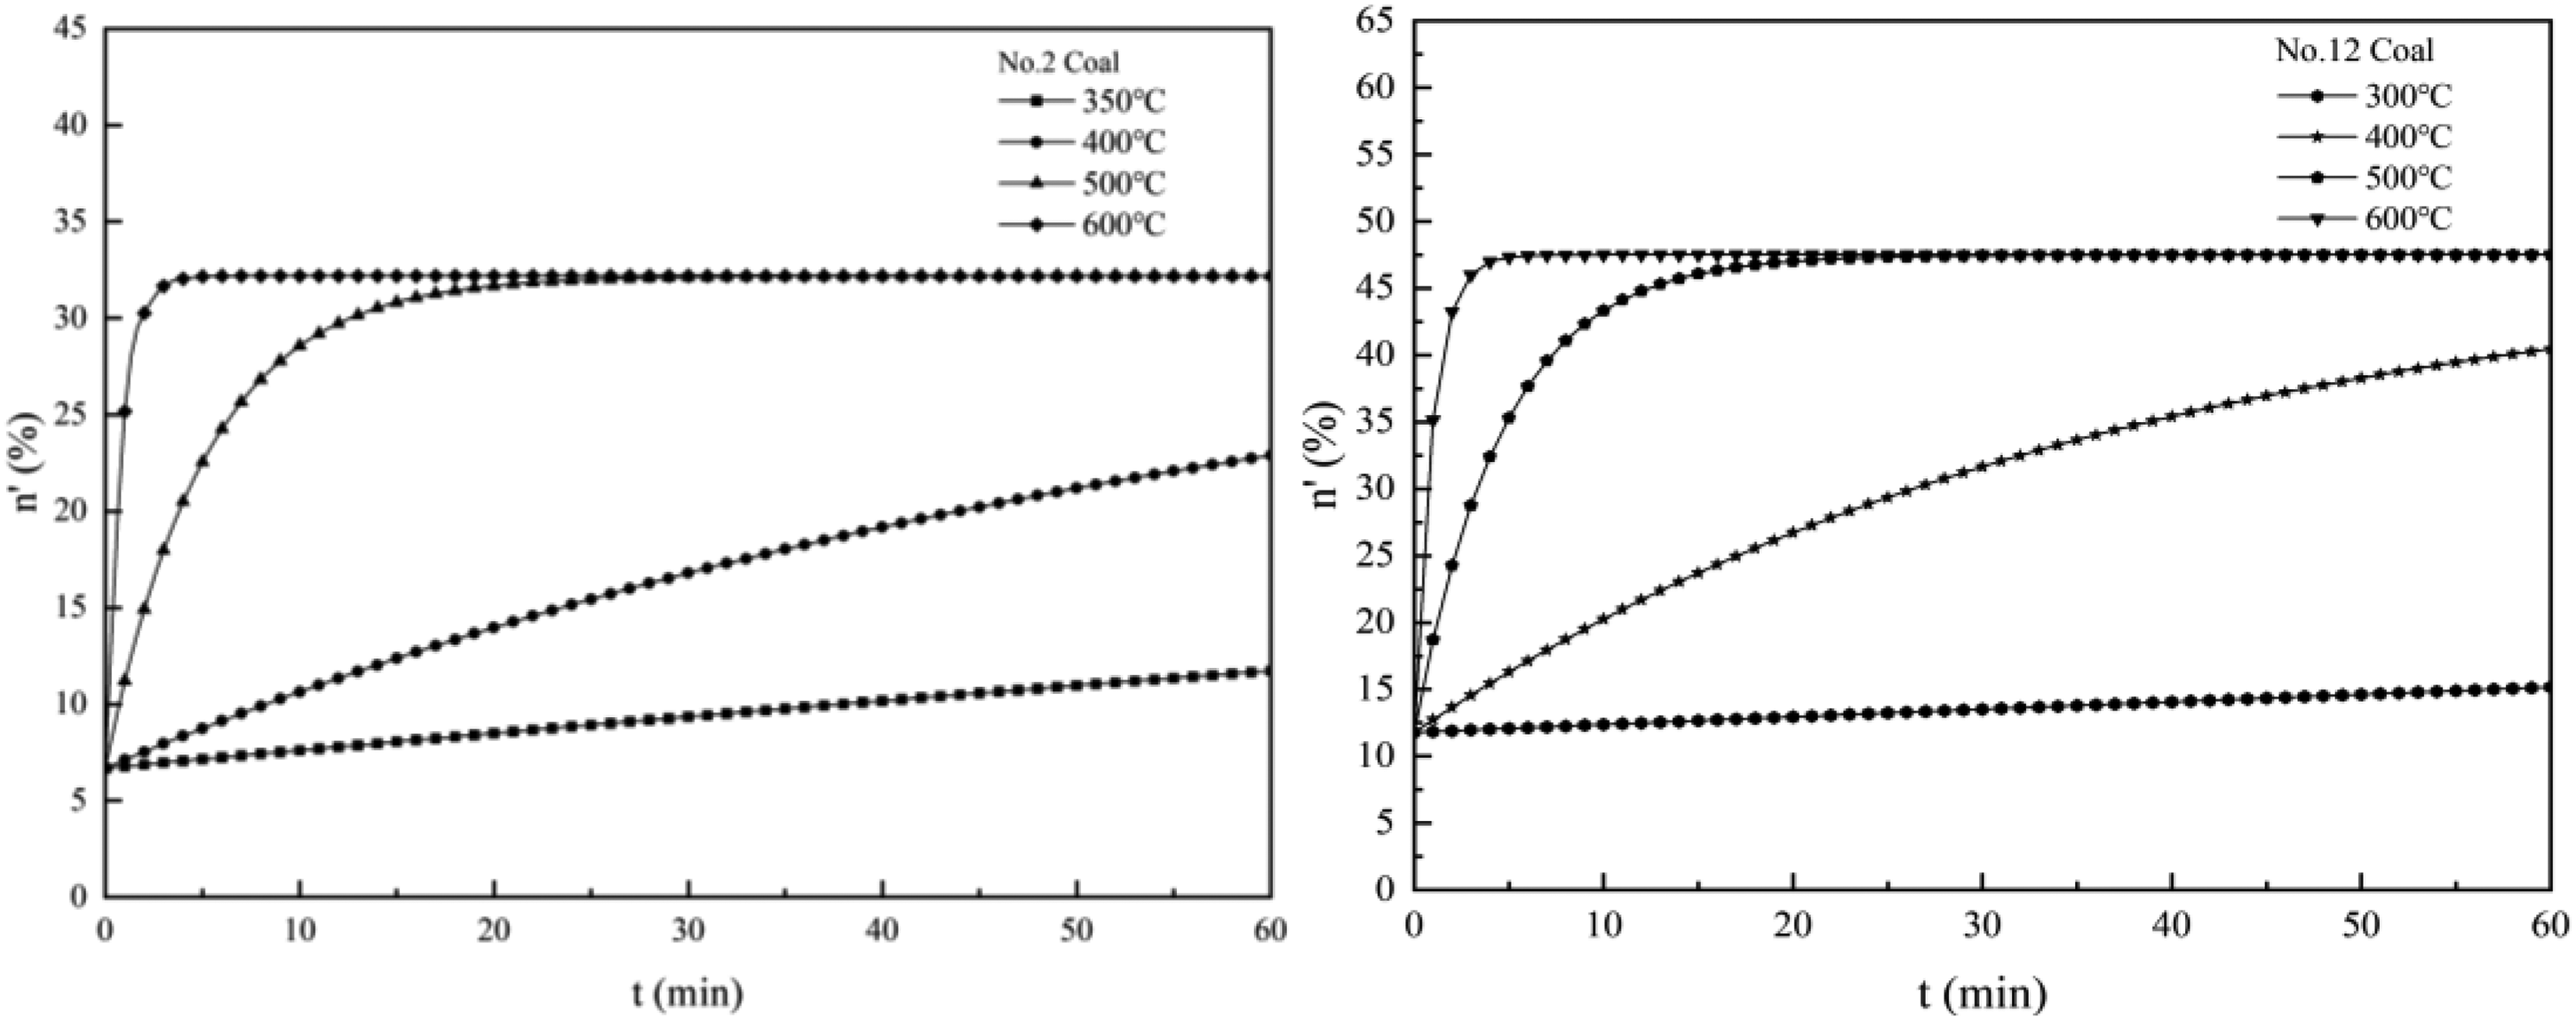
Simulated variation curves of porosity of No.2 coal and No.12 coal during pyrolysis.
In terms of the variation trend, the porosity of both No.2 coal and No.12 coal increases continuously with the rise in temperature and the extension of time during the pyrolysis process. At the same pyrolysis time, the higher the pyrolysis temperature, the greater the porosity increment. Taking No.2 coal as an example, when pyrolyzed for 15 min, the porosity is 8.06% at 350°C with an increment of only 1.37%; the porosity rises to 12.87% at 400°C with the increment increasing to 5.68%; the porosity surges to 30.82% at 500°C with a soaring increment of 24.13%; and the porosity reaches 32.20% at 600°C with a substantial increment of 25.1%. At the same pyrolysis temperature, the longer the pyrolysis duration, the higher the porosity. Still taking No.2 coal as an example, at 400°C, the porosity is only 12.37% after 15 min of pyrolysis, increases to 16.79% after 30 min, rises rapidly to 20.22% after 45 min, and further grows to 22.89% after 60 min.
With respect to the rate of change, the coal porosity rapidly increases with increasing temperature. As shown in Figure 6, the porosity growth rate under low-temperature conditions is relatively slow, with a gentle slope in the porosity curve. Taking the No.2 coal at 350°C and 400°C as examples, the porosity curves exhibit a nearly linear, gently inclined trend. When the pyrolysis proceeds to 60 min, the porosity at these temperatures increases to only 11.73% and 22.89%, respectively. In contrast, the porosity growth rate increases significantly at high temperatures. Taking the No.2 coal at 500°C and 600°C as examples, the porosity curve during the initial pyrolysis stage has a nearly vertical slope, following an approximate exponential function. However, the curve gradually flattened in the latter half, with porosities reaching 30.82% and 32.20% at 500°C and 600°C, respectively, after just 15 min of pyrolysis.
The porosity variation curve plotted by the coal porosity evolution model during pyrolysis (Figure 6) is highly consistent with the measured porosity curve during pyrolysis (Figure 5). Specifically, the higher the temperature, the more intense the pyrolysis reaction, the faster the generation and escape of pyrolysis products, and the greater the increment and growth rate of porosity under the same pyrolysis time. This indicates that the established model can accurately describe the evolution law of porosity with pyrolysis temperature and time.
Verification of coal porosity evolution model during pyrolysis
In the previous section, this study qualitatively validated the established model of coal porosity evolution during pyrolysis by demonstrating a high degree of similarity between the theoretical and experimental curves of porosity changes. To further verify the accuracy of the model, a comparative analysis was conducted between the simulated porosity values under different pyrolysis temperatures and time conditions and the experimental porosity measurements under equivalent conditions. The results are presented in Table 6.
Comparison between calculated values and experimental values of coal porosity during pyrolysis.
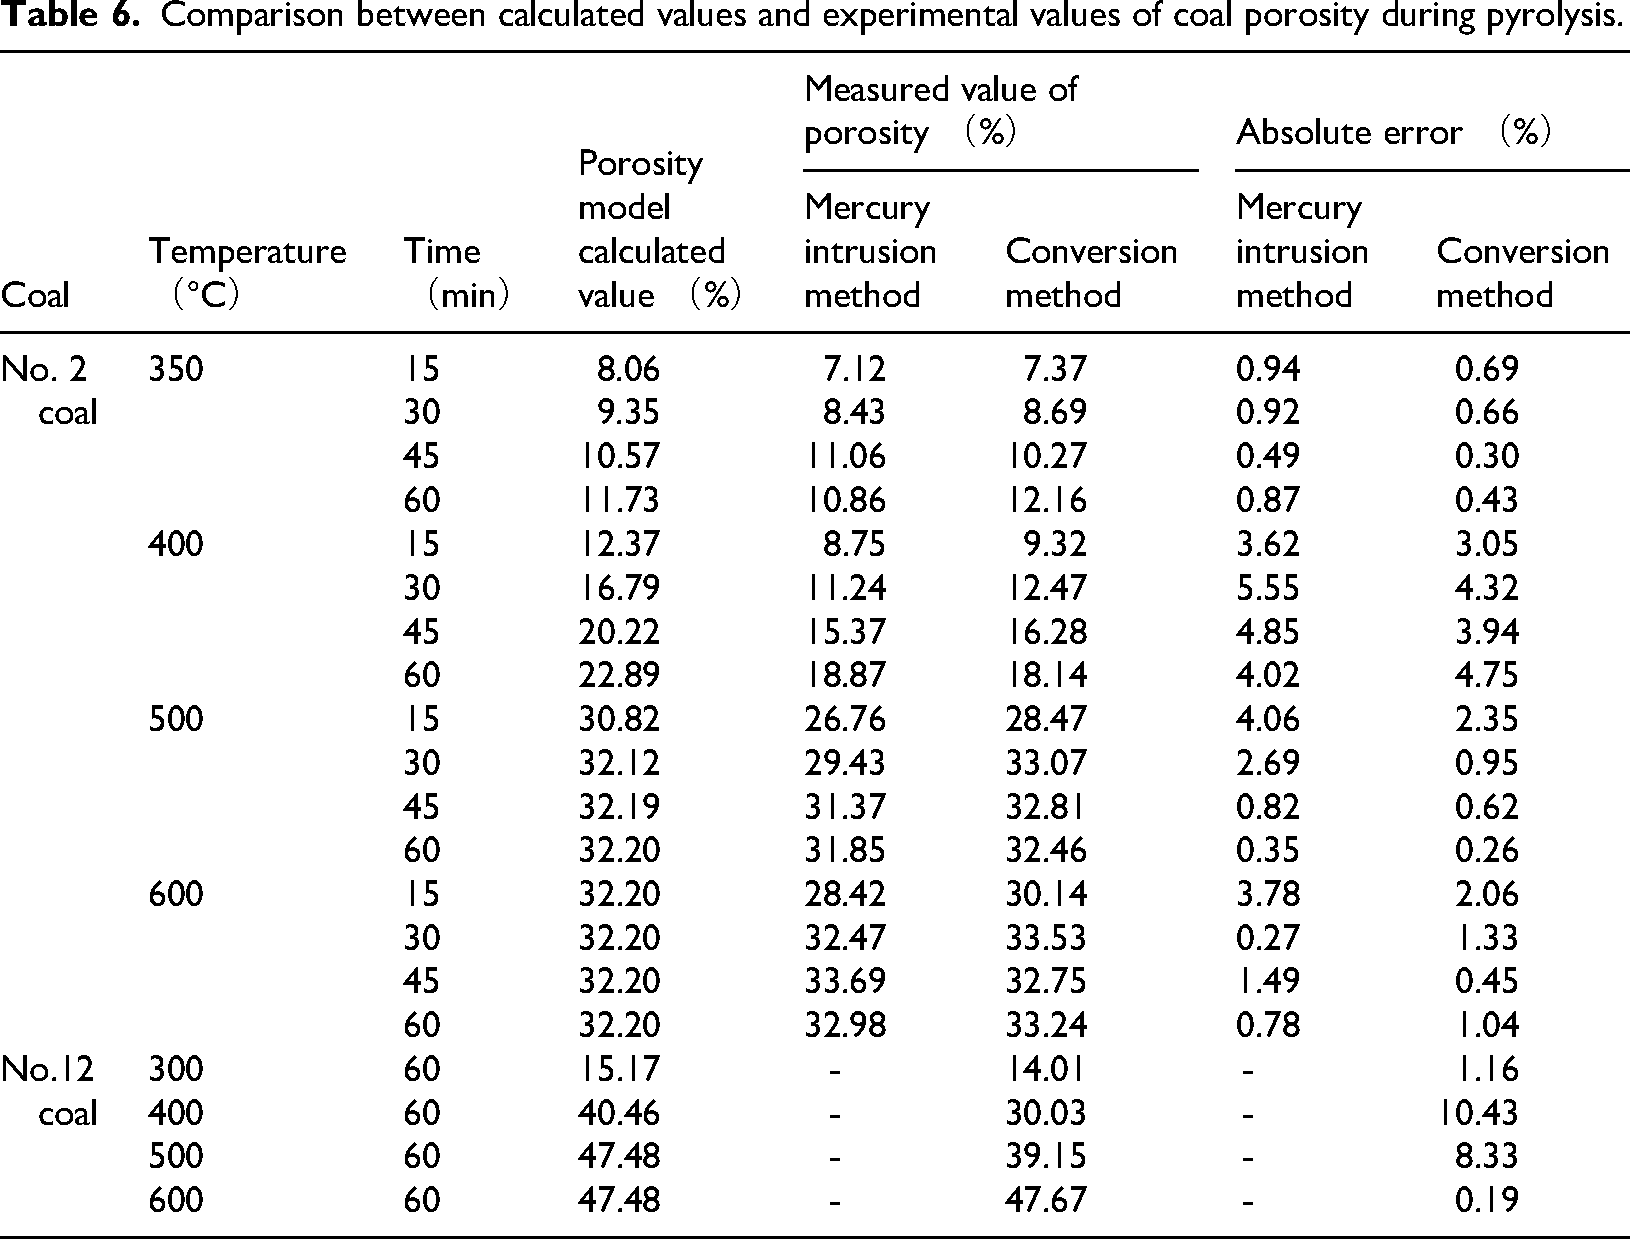
In this study, two methods were employed to measure the porosity of No. 2 coal during pyrolysis: the mercury intrusion method and the conversion method (combining the wax-sealing method with the pycnometer method), while only the conversion method was adopted for the porosity measurement of No.12 coal. As shown in Table 6, the measured values obtained by both the mercury intrusion porosimetry and the conversion method are close to the calculated values of the model, with the absolute errors basically within 5%. This indicates that the established coal porosity evolution model during pyrolysis can accurately describe the variation law of porosity with temperature and time. Notably, the measured values were consistently lower than the model predictions, primarily because of the model's assumption that “pyrolysis-generated hydrocarbons are fully released.” As a matter of fact, the escape of pyrolysis oil and gas requires a certain period of time, and some substances inevitably remain in newly formed pores, which will inevitably result in the measured values being lower than the calculated values.
The absolute errors between the model-calculated values and measured values of coal porosity vary significantly under different pyrolysis temperatures, which is mainly manifested as follows: the absolute errors of porosity are relatively small in the low-temperature and high-temperature stages, but relatively large in the medium-temperature stage. This is mainly related to the influence of the sample heat transfer time on the pyrolysis effect. For coal samples in a high-temperature environment, the internal heat transfer and temperature rise process cannot be achieved overnight, but require a certain period of time. The higher the temperature and the larger the particle size, the longer the required heat transfer time. On the premise that the sample size and pyrolysis environment remain consistent, different pyrolysis temperatures require different heat transfer times. Under the same heating time, the time left for sample pyrolysis will naturally differ, which leads to deviations in the actual pyrolysis degree of coal samples.
Taking No.2 coal as an example. In the low-temperature section (350°C), owing to the lower target temperature, the time required for the internal temperature of the No. 2 coal sample to reach uniformity is relatively short, which has a minor effect on the pyrolysis time. Additionally, the pyrolysis rate below 350°C is very slow (it takes 1254.81 min to achieve a 99% pyrolysis conversion rate), further reducing the effect on the actual pyrolysis degree of the No. 2 coal sample. Therefore, the absolute error in porosity is small. In the high-temperature section (500°C and 600°C), the No. 2 coal pyrolyzes rapidly, and the time required to achieve a 99% pyrolysis conversion rate is significantly reduced (23.65 min at 500°C and only 3.57 min at 600°C). Even though the time required for the internal temperature of the No. 2 coal sample to reach uniformity is relatively long, there is still ample time for the actual pyrolysis conversion rate to approach the theoretical conversion rate, resulting in a small difference. Thus, the absolute error in porosity is also small. However, in the medium-temperature section (400°C), as the heat transfer time is extended further, the pyrolysis time is further reduced. Additionally, the time required for the No. 2 coal to achieve a 99% pyrolysis conversion rate is longer (274.12 min), inevitably leading to a significant gap between the actual and theoretical pyrolysis conversion rates of the No. 2 coal sample, resulting in a greater error in porosity. Moreover, under all temperature conditions, the absolute error in porosity of the No. 2 coal gradually decreases over time, indirectly confirming the validity of the above explanation.
With respect to the principles of the two testing methods, the mercury intrusion method can measure only the porosity of open pores, whereas the conversion method can determine the porosity of all pore types. Under identical pyrolysis conditions, the porosity measured by the mercury intrusion method is generally lower than that obtained through the conversion method. Compared with the mercury intrusion method, the conversion method results in smaller absolute errors in the porosity measurement. The testing principle determines that the porosity measured by the conversion method is more accurate, while the small absolute error of the measured values obtained via this method further verifies the accuracy of the coal porosity evolution model during pyrolysis established in this study.
In summary, although the measured porosity values of pyrolyzed coal are generally lower than the model-calculated values due to the effects of internal heat transfer of coal samples and residual substances, the errors are relatively small. The porosity model established in this study can accurately calculate and describe the evolution process of coal porosity during pyrolysis.
Discussion
This study established a coal porosity evolution model during pyrolysis based on a series of assumptions. First, the content of organic matter in coal is much higher than that of pyrolyzable minerals (kaolinite, calcite), and the pore volume formed by thermal decomposition of minerals is far smaller than that formed by pyrolysis of organic matter. Therefore, the pyrolysis of organic matter is the main reason for the increase in coal porosity. Second, the temperature rise of coal depends entirely on its internal heat conduction process. The coal samples used in this study are small-sized specimens, and their temperature can quickly rise to the set pyrolysis temperature in a short time, so the heat transfer process can be ignored. Finally, the precipitation rate of coal pyrolysis products depends on the product pressure. The higher the pyrolysis temperature, the faster the formation rate of oil and gas products, the higher the product pressure in the narrow pore space and the faster the precipitation rate naturally. Since the temperature set in this study is relatively high, it can be considered that the pyrolysis oil and gas are completely generated and escaped immediately after formation. The rationality of the above assumptions fully ensures the accuracy of the model, and the measured results show that the absolute error is usually less than 5%.
The composition of substances in coal is complex. Different types of organic matter have distinct pyrolysis mechanisms, and there are even multi-step chain decomposition reactions, with certain differences in their respective pyrolysis temperature ranges. However, considering that the core objective of this study is to establish a universal model for the evolution of coal porosity during pyrolysis, a single first-order reaction is adopted to describe the coal pyrolysis kinetic process on the basis of the satisfactory linear fitting results (Figure 3). Undoubtedly, the accuracy of simulation calculations could be further improved if multiple first-order reactions were used to calculate the pyrolysis rates in different temperature ranges by combining the material composition of coal and their respective pyrolysis mechanisms. Nevertheless, the measured results show that the effect of this optimization is limited.
The method of calculating coal porosity during pyrolysis using pyrolysis reaction kinetics is feasible, but the heat transfer process needs to be taken into account. For small-sized coal samples at the laboratory scale, the temperature of the samples can be homogenized within a relatively short period of time, so the model established in this study has good applicability. For in-situ large-sized coal bodies, the internal heat conduction process has become a key controlling factor affecting the accuracy of simulation results of porosity evolution during pyrolysis. To accurately simulate porosity evolution in large coal samples, thermodynamic parameters such as thermal diffusion coefficients, specific heat capacity, and thermal conductivity must be integrated. By establishing heat transfer equations to clarify temperature distribution patterns and then combining them with pyrolysis reaction rate equations, the proposed model can be refined. The development of a porosity evolution model for large coal samples during pyrolysis remains a key research direction for future studies.
High-temperature pyrolysis will cause a substantial increase in coal porosity, leading to a synchronous rise in coal permeability, which exerts a significant impact on the groundwater environment of in-situ pyrolysis mining areas. However, under in-situ confining pressure conditions, pyrolyzed coal is prone to compressive deformation, and the porosity will decrease to a certain extent, which may further affect the evolution law of porosity. Under deep in situ pyrolysis conditions, what changes ultimately occur in the porosity of pyrolyzed coal seams? Will they transition from impermeable to permeable layers? Since compressive deformation is directly correlated with the elastic modulus of pyrolyzed coal, establishing a model for elastic modulus evolution during pyrolysis is essential. This model should be integrated with the porosity evolution model developed in this study to ultimately formulate a comprehensive porosity evolution model for in situ pyrolysis. This represents a key research direction for future breakthroughs.
Conclusions
With the deepening of pyrolysis degree, the porosity of coal increases continuously. The growth rate of coal porosity increases with the rise in temperature: the porosity grows relatively slowly under low-temperature conditions; under high-temperature conditions, the porosity increases sharply in the initial stage of pyrolysis and then the growth rate gradually slows down.
On the basis of the porosity evolution mechanism of pyrolytic coal and the pyrolysis reaction rate equation, a coal porosity evolution model for the pyrolysis process was initially established. Taking the No.2 coal seam of Cixi Mine in Fengfeng Mining Area and the No.12 coal seam of Zhaogezhuang Mine in Kailuan Mining Area as examples, the porosity evolution during pyrolysis was simulated. The simulated curve was highly consistent with the experimental data, with minimal discrepancies. The model accurately describe the evolution law of coal porosity with pyrolysis temperature and time..
While the pyrolysis kinetics-based method for calculating coal porosity is feasible, the size effect must be considered. The internal heat conduction process has become the key step affecting coal pyrolysis. Establishing a porosity model applicable to large-sized coal in situ pyrolysis under comprehensive temperature and pressure conditions will be crucial for future research.
Footnotes
Acknowledgements
This research was supported by Hebei Provincial Key Research Projects (Grant No. 21374104D), the Open Fund of Key Laboratory of Groundwater Resources Development and Protection in the Songnen-Sanjiang Plain of Heilongjiang Province (Grant No. GRDPSPH202402), Shanxi Natural Science Foundation, China (Grant No. 202403021211009), and Science Research Project of Hebei Education Department (Grant No. ZD2021309). We are grateful to the anonymous reviewers for their constructive feedback and suggestions.
Funding
The author(s) disclosed receipt of the following financial support for the research, authorship, and/or publication of this article: This work was supported by Hebei Provincial Key Research Projects (Grant No. 21374104D), the Open Fund of Key Laboratory of Groundwater Resources Development and Protection in the Songnen-Sanjiang Plain of Heilongjiang Province (Grant No. GRDPSPH202402), Shanxi Natural Science Foundation, China (Grant No. 202403021211009), and Science Research Project of Hebei Education Department (Grant No. ZD2021309).
Declaration of conflicting interests
The authors declared no potential conflicts of interest with respect to the research, authorship, and/or publication of this article.