
Abstract
Wind energy has become a key constituent in Japan's developing electricity sector. However, the fluctuation of wind speed in its deployment poses operational and economic risk, which puts the generators at risk for energy price imbalances (EPIM). The forecast errors between predicted and actual wind output, which can result in imbalance penalties, negatively impact renewable producers’ profitability, obstruct deeper integration of renewables, and stagnate economic growth. Herein, a comprehensive optimization mechanism has been introduced in this work by integrating state-of-the-art machine-learning (ML) models, that is, Random Forest (RF) and Long Short-Term Memory (LSTM), with numerous metaheuristic optimization techniques, that is, Whale Optimization Algorithm, American Zebra Optimization (AZO) Algorithm, along with Sequential Quadratic Programing to maximize the system economy. The framework forecasts wind power and load demand concurrently through 24 h by embedding these into an optimal power flow framework: Maximizing profit for the system, and minimizing imbalance costs. It makes use of the real wind speed data of Tokyo for validation of the proposed method. The LSTM provides better forecasts than RF, and AZO continuously yields the best economic results after the implementation of the presented approach. The ML-metaheuristic approach facilitates dispatch efficiency, while simultaneously decreasing imbalance penalties and increasing the market profitability significantly. The proposed method is a technically feasible and operationally relevant approach to implementing a higher wind integration scale in Japan's deregulated market structure.
Keywords
Introduction
Electrical energy is essential for both the social and economic growth of any nation. Due to its enormous importance, state agencies have traditionally owned and run the power sector. The deregulation of the power supply business over the past few decades has been one of the most significant international energy developments. Following the introduction of deregulation, the conventional monopolistic structure of the electrical industry was replaced by competition between generation companies (GENCOs), transmission companies, and distribution companies (DISCOs) to improve the social benefit and maximize the efficiency of the power generation (Das et al., 2022a). Renewable energy has the potential to play a significant role in the world's energy supply because it can optimize energy structures, close the gap between supply and demand, and, most importantly, protect the environment (Malik et al., 2023). Many power plant developers are keen to invest their money in setting up wind farms (WFs) due to the lack of requirements for fuel and other advantages. As a result, wind energy has risen to the top spot over the past few decades as the source of electrical energy with the highest global annual growth rate. An accurate control mechanism has to be created for the excess capacity because, in a deregulated system, the generation and transmission of resources are employed more efficiently (Biswal et al., 2024). Energy storage can be crucial in this situation by allowing the utility to exploit the use of resources. Renewable energy sources (RESs) are becoming progressively prevalent as substitute energy sources. However, there are numerous issues with RES, including their propensity to generate irregular power, their dependence on weather circumstances, and their inability to compete with non-renewable energy sources. In recent times, noteworthy advances have been made in overcoming some of these problems, with the application of energy storage systems and hybrid energy systems.
Wind power is now among the world's top renewable electricity sources to generate electricity because of its clean nature, abundant availability, scalability, and flexibility (Das et al., 2022b). Solar also has wide utility value, lighting and heating, industrial use, and a growing attraction for renewables (Ranjan et al., 2021). With the deregulatory process over the power sector, it had to change the model of monopolistically dominated grids into competitive marketplaces; however, the integration of renewables adds new problems. Wind and solar production are inconsistent, dependent on the weather, leading to uncertainty over the supply. In a deregulated environment, both the DISCOs and GENCOs are equally responsible for generating and distributing electricity to promote the efficient generation and supply of electricity where it is needed, and for the generation/distribution of power in response to the energy supply. Such coordination helps to provide a reliable supply to consumers. Users are also shielded from being charged more for their energy use through government oversight of electricity prices. Imbalance penalties, also regulated by the independent system operator (ISO), make generators and consumers liable for differences between scheduled and actual power. These penalties incentivize both accurate forecasting and contribute to the stabilization of the service system. The ISO leads to safe operation and continuous supply and demand balance in the power system.
RES remain favored among more sustainable energy sources than non-renewables, due to their environmental benefits. Their utilization is constrained with increasing frequency, their production is varied due to seasonally dependent inputs, and they have a lower competitive position in comparison to the traditional sources (Dawn et al., 2016; Dawn et al., 2019). Research on RES is continuing to enhance the efficiency, reliability, and economy, & make RES more efficient as their potential future energy system players. Solar energy has emerged as a major RES due to its clean production capability, availability, scalability, and applicability in a range of applications, including residential systems and large-scale industrial applications (Xia et al., 2021). Deregulation has also turned electricity markets from monopolistic to competitive, stimulating innovation and favoring consumers as much as producers. GENCOs and DISCOs ensure a reliable and consistent supply of electricity in these market situations and are assisted by public supervision by the government to prevent excessive pricing. The day-ahead market, which necessitates production forecasts being submitted to the ISO, further increases efficiency. In contrast to thermal-based units, renewable generators often experience forecast uncertainty for weather variability, putting them at risk for penalties or incentives due to imbalance pricing. This will address the impact of imbalanced prices on systems’ economics and machine-learning (ML)-based forecasting methods that have been adopted to mitigate these impacts, as previously studied (Gaboitaolelwe et al., 2023; Queen et al., 2021).
The primary aim of renewable energy forecasting is to enhance the stability and reliability of the grid by allowing operators to balance supply and demand more effectively. Superior forecasting supports greater integration of RES and provides a basis for more resilient and sustainable power systems. Several techniques with advanced forecasting and energy management have been developed in the recent past. The IMLEA-STLF approach (Mehedi et al., 2021) further improves short-term predictability of load using feature selection via Wavelet Transform (WVT), prediction with Elman Neural Networks, and optimization and convergence through Oppositional Artificial Fish Swarm Optimization and Oppositional-Based Learning. The Combined Bootstrap and Cumulant approach (Wan et al., 2023) also enhances the application of probabilistic wind forecasting by including higher orders of statistics to better model the uncertainty. Research by Faraji et al. (2020) offers Energy Management Systems for Prosumer-Microgrids in which weather and load predictions are employed to reduce operational uncertainties. Del Ser et al. (2022) developed randomization-based models for solar radiation estimation, applicable to solar power generation as well as other environmental settings. Moreover, Mostafa et al. (2022) emphasize that ML enhances the effectiveness of energy management in smart grids, which includes renewable integration and safe cloud management of data.
Several recent works work on other ML applications in renewable energy. Roy et al. (2024) analyse hybrid RES configurations for remote Indian islands and develop ML models to predict technical, economic, and environmental performance. ML algorithms for predicting the solar irradiance have been thoroughly reviewed by Allal et al. (2024a), and the analysis is useful in the optimization of designing and operating the solar system. Tziolis et al. (2023) report on the efficacy of Bayesian neural networks for short-term net load prediction in renewable-integrated microgrids. Alazemi et al. (2024) give an overview of ML-based power output forecasting methods, which contribute to increased accuracy, power allocation, and better grid stability. Lin et al. (2022) prove the predictive power of ML for revenue prediction in energy generation and storage systems, supporting revenue-maximizing operational decisions. Karthikeyan et al. (2024) present a hybrid optimization model that considers the fluctuations of the fuel price and the battery cost to improve the economic performance of remote photovoltaic (PV)–wind–storage systems. El-Aziz (2022) proposes a hybrid ML framework with Multilayer Perceptron, Support Vector Regression, and CatBoost integrated to predict renewable energy consumption accurately. Likewise, Dimd et al. (2022) investigated the effect of meteorological characteristics on PV forecast accuracy within Nordic climates and recommended some ensemble and optimization methods to improve forecasts. In addressing energy trading problems, Jia et al. (2022) present a decentralized solution for peer-to-peer energy trading by improving energy trades in grids containing renewable energy. Shamsi and Cuffe (2021) sets out a binary prediction market for simulating weather power derivatives on renewable energy, hence enhancing their financial stability. Roy et al. (2023) showcased a different application where long short-term memory (LSTM) is combined with feed-forward neural network and a back-propagation algorithm for better fault detection and secure operation. Nabavi et al. (2021) set forth the DWT-LSTM method, fusing deep learning to forecast with energy storage management for maximizing building energy demand and supply, cutting the need to access the grid and electricity prices.
The wide-ranging research outlined in the present study (Roy et al., 2024) thoroughly reveals that hybrid renewable energy systems (HRESs), that seamlessly integrate PV generation technology, wind turbines (WT), battery storage (BAT), converters (CONV), and distributed generation (DG) technologies, accomplish an extremely low levelized cost of energy, which was set at an astonishingly low rate of 0.319/kWh, along with net present cost of 6.81 million per kilowatt-hour, demonstrating significant economic efficiency among all selected hybrid renewable configurations evaluated in this study. In addition, the simultaneous deployment of PV systems and WTs in partially fossil-fuel-fired HRES will also substantially reduce diesel fuel consumption, bringing the renewable energy proportion to 86.7% and a staggering improvement in sustainability indicators. Moreover, the study (Roy et al., 2025) confirms that diverse combinations of HRES configuration can provide the power supply to remote villages, and deliver detailed investigations of different combinations of PV panels, WT, biogas generators, batteries, and converters, to assess their operation performance and efficiencies in those same areas. The paper (Parvathareddy et al., 2025) concludes that the results of the proposed hybrid framework present a notable increase in prediction accuracy and operational performance, both for the field of industrial energy management, with a 48% improvement over conventional energy management models, confirming its significant effect in the field. Moreover, an optimization part of the framework is a key aspect in performing its purposefully, as peak demand variation reduces peaks by 27%, further evidence of the advantages of the multi-objective optimization methodologies emphasized in energy management practices. According to the work (Pérez-Rodríguez et al., 2024), metaheuristic algorithms show good results, and Particle Swarm Optimization (PSO) is the most utilized algorithm due to its accuracy in solar radiation prediction of the PSO algorithm from current literature. The importance of employing hybrid models is emphasized by authors, such as the Adaptive Differential Swarm Optimization Algorithm integrated with networks, given its remarkably low root mean square error (RMSE) level and the remarkable performance achieved under the system, which implies the existence of a high-predictive capacity by combining optimization algorithms with ML methods. Additionally, incorporating HRES with the primary electrical grid is becoming more popular for applications that are associated with urban energy efficiency, where there is also balancing in the use of renewable and non-renewable energy sources for energy consumption at relatively less cost (Abdullah et al., 2023). Finally, Allal et al. (2024b) undertake a wide review of the merits and weaknesses of the modern RES, while a detailed survey of different ML algorithms and how they can be used in the framework of RES gives context to this important topic.
The demand for a clean and sustainable energy supply has increased worldwide; hence, conventional fossil-fuel-based power generation has been gradually replaced with RES generation. Of these, wind power is particularly attractive as it is fast-growing, has low environmental impact, and is potentially applicable at a significant scale. Nonetheless, the variability and unpredictability of wind power create tremendous difficulties associated with stabilizing a power system, particularly in deregulated markets where imbalance costs are essential considering overall profit. A major reason for this work is to investigate how power from wind affects system stability and its economic cost when the imbalance penalty is considered, to get acquainted with the real-world dynamics of operation of modern power systems. In addition to that, with artificial intelligence research in development, ML technology holds promise in forecasting the accuracy of wind power generation and electricity demand. These prediction techniques play an essential role in reducing uncertainty and imbalance costs by enhancing the profitability and reliability of real-time systems integrated with renewables. The main highlights of the work are as follows:
WFs cannot always be integrated with the grid due to the variability of wind speed, and this leads to the need for optimization methods that promote social welfare, consumer surplus, and producer revenue. Fluctuations of wind also present considerable risk to electricity market contracts, and precise forecasting has become part of effective strategic planning. In deregulated markets, profit asymmetries due to disparities between predicted and real wind generation are particularly consequential, meaning they should be minimized to still make a profit. While energy storage systems compensate for these imbalances, their high costs diminish overall margins, leading to an even greater need for high-accuracy forecasting. In this work, an optimization framework has been recommended to overcome some of these disadvantages by optimizing the system for wind speed forecasting of ML-based random forest (RF) and LSTM models to maximize profitability and reduce imbalance losses. The effectiveness of the system is shown through simulations on the IEEE 14-bus system. The optimization problem is solved by using two metaheuristic algorithms, that is, Whale Optimization Algorithm (WOA) and American Zebra Optimization (AZO), along with Sequential Quadratic Programing (SQP).
Imbalanced prices represent a significant economic challenge associated with the renewable energy sector, which results in the imposition of either financial penalties or economic adjustment when the level of wind generation differs from its predicted quantity. Such imbalances can have severe economic implications for energy producers and complicate system operation for grid operators. To address this issue, accurate wind generation forecasts are necessary. Improved predictions allow better scheduling and dispatching and, thus, lower variance and less exposure to imbalanced prices. Here, ML methodologies look promising due to their ability to learn complex nonlinear patterns from historical data, as well as their ability to adapt to dynamic system conditions. The present research deals with the utilization of two ML-based predictive models, that is, RF and LSTM networks, for improved wind power generation forecasting. To establish a realistic operational model, an in-depth study environment was created, replicating real-time scenarios in this work. Historical wind speed and power generation data, along with load demand profiles, were utilized to train and validate the forecasting models for 24 h. Both load demand and wind power generation were forecasted simultaneously to allow system-wide coordination and optimization. The findings of the simulation show that ML-based forecasting substantially decreases the negative financial effect of imbalanced prices. With more accurate forecasts, the system operator can better control generation resources, schedule reserve margins, and balance supply and demand. Therefore, the profitability of the power system is increased, and grid stability is improved.
Although there were many works in the context of integration, forecasting, and optimization of RES, there have been very few comprehensive research works focused on a comprehensive analysis of the potential effects of wind power forecasting accuracy and imbalance cost mitigation in deregulated electricity markets, especially in the case of Japan. Existing research has concentrated on augmenting the forecasting model or optimizing power flow individually, ignoring the relationship between uncertainty and market profitability. Additionally, there is limited evidence from prior studies considering simultaneous load and generation forecasting with profit optimization. In this study, that gap has been removed by constructing an integrated ML–metaheuristic framework using LSTM-based forecasting alongside different optimization to reduce the imbalance penalties and improve the profitability of the system. To compare the technical, economic, and operational performance of the proposed framework, an IEEE 14-bus system was chosen. Although the Japanese power grid is much larger and more complicated by comparison, the IEEE 14-bus framework detects critical market and operational forces such as locational marginal pricing (LMP), generator dispatch, and imbalance settlement processes. This helps enable the study to remain focused on validating the methodological framework by combining wind forecast, imbalance pricing, and economic optimization, without computational hurdles. This system offers a scalable and directly transferable approach to larger grids such as Japan's deregulated market, as the key optimization and forecasting principles are unchanged from one grid level to the next.
Mathematical modeling
This chapter provides an extensive review of various risk techniques, as well as a mathematical framework applicable to wind power generation. There is also a discussion regarding optimization techniques for improving the efficiency and effectiveness of these systems.
Wind speed data
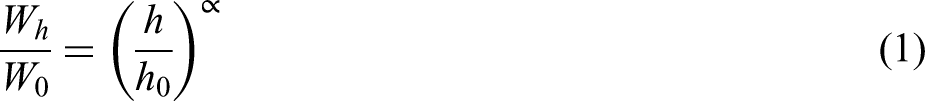
The actual and forecasted wind speed data are collected for Tokyo, Japan, to conduct the analysis. The collected data were for a height of 10 m above sea level. In Japan, the typical hub height of a wind turbine is 100 m. As such, the wind speed at the desired height needs to be determined. The recorded wind speed data for the selected places are shown in Table 1. The wind speed at 100 m is calculated using the following power law equation:
Forecasted and actual wind speed data at 10 m and 100 m height.
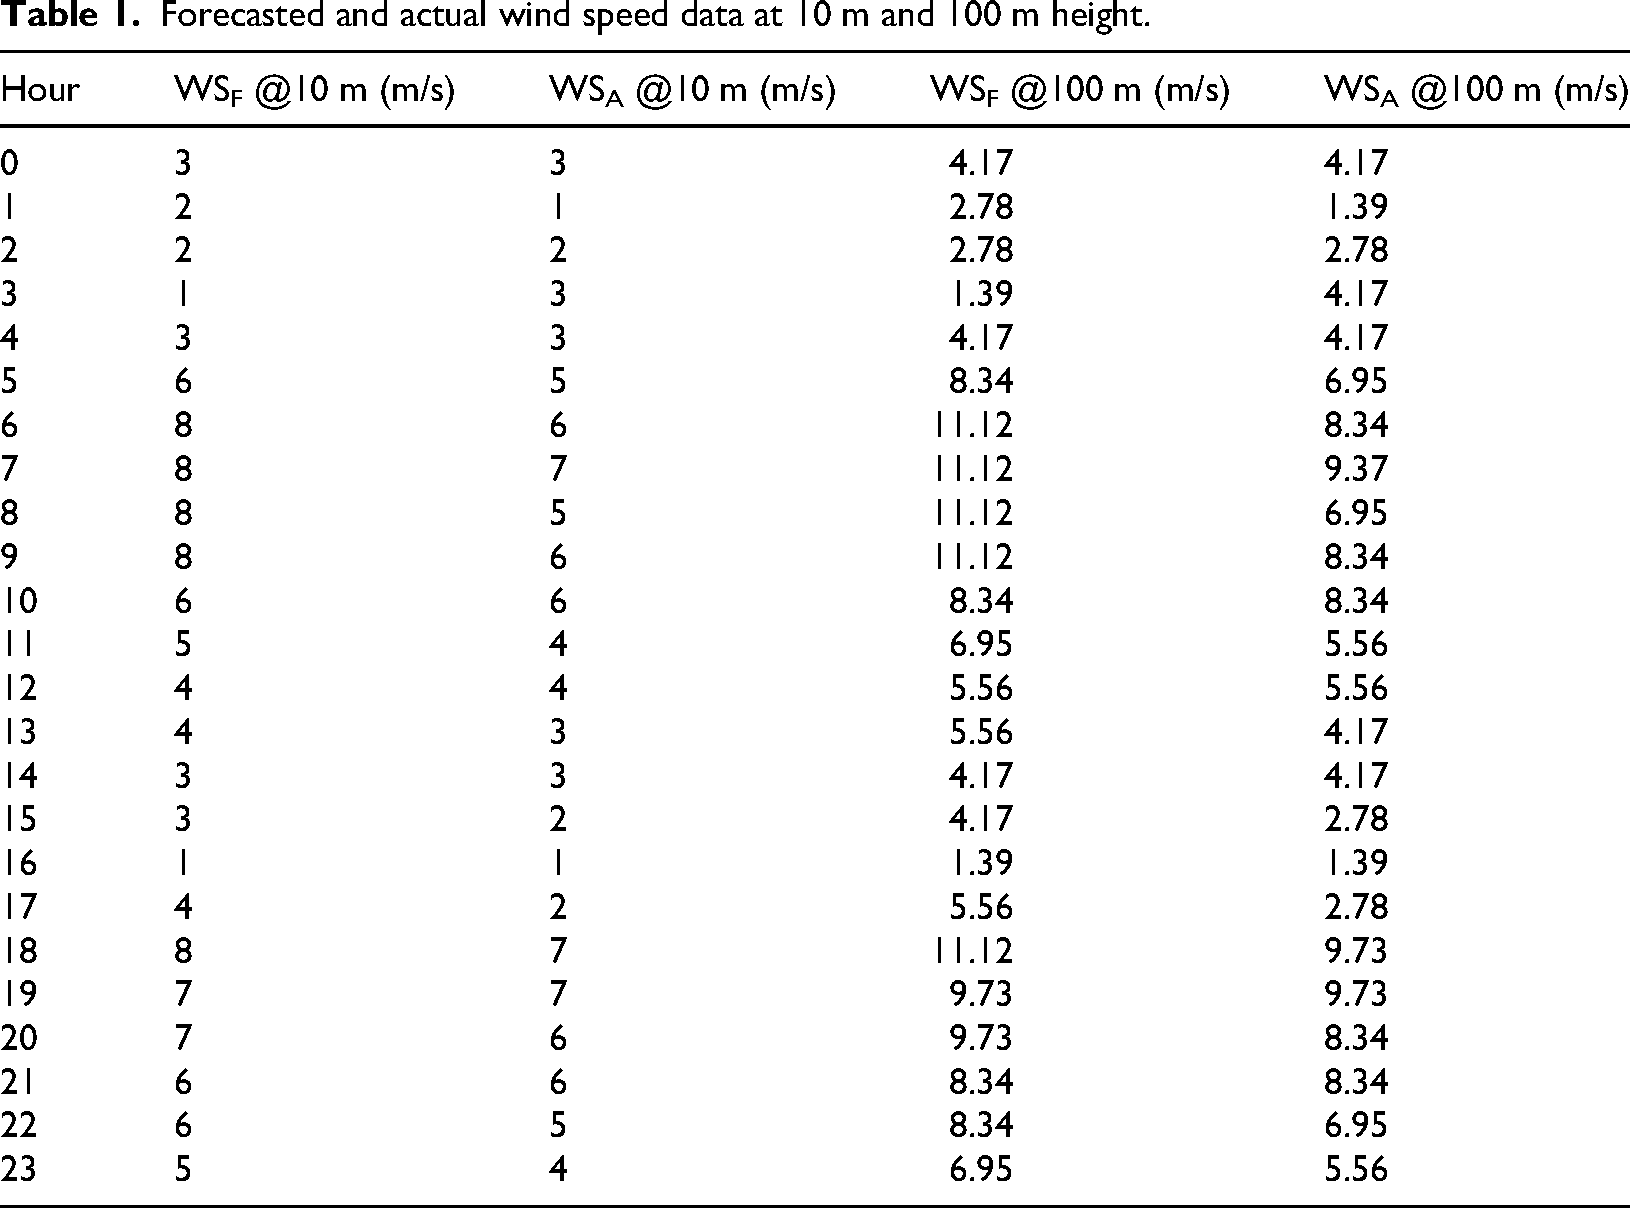
where “Wh” is the wind speed at height “h”; “Wo” is the wind speed at height “ho”; “α” is the Hellman coefficient. The considerations for this work are as follows: h = 100 m and ho = 10 m. Table 1 displays the calculated WSA and WSF at the desired height of 100 m (Hourly forecast for Tokyo, Japan, 2024, 25.10.2024 [22]).
The wind power available in a wind turbine depends on the swept area of the turbine (a) that is perpendicular to a wind stream moving at speed (v) with an air density (ρ) and having a turbine efficiency of η.
For this work, the considered parameters were as follows: ρ = 1.225 kg/m3; a radius of the turbine rotor of 40 m, and η = 0.49. The investment cost for the wind generation was considered to be 3.75 $/MWh, and 30 wind turbines were considered for the parallel operation.
Locational marginal pricing
LMP is formulated by taking into account important factors like transmission constraints, line losses, and load demand. It is different across the power grid due to varying transmission constraints and demand patterns across the whole system. In general, LMP is calculated using Equation (3).
where
Random forest (RF)
Within the realm of statistical learning and predictive modeling, the RF algorithm has been a well-accepted ensemble learning method. As opposed to classical models that are based on one decision tree, which tend to be highly sensitive to noise and subject to overfitting, RF utilizes the strength of a large ensemble of decision trees to provide stable and precise predictions. The essence of RF is in the creation of an ensemble of separate decision trees during training. Each tree is trained on a bootstrap sample, a randomly selected subset of the original set with replacement, thus creating data-level variability. Moreover, when building each decision tree, a random subset of features is chosen at each node to find the best split. Through this method for feature randomness, each tree in the model investigates different features of the feature space, reducing the correlation between trees and generalization capabilities. RF uses majority voting to fuse the output from single trees for classification problems, and average prediction computation for regression problems. This ensemble method has a much better variance reduction than a single decision tree, which minimizes the chance of overfitting, one of the most common problems of a complex model. Not just with respect to predictive performance, the power of the RF model stems from its non-parametric quality. It is free from any assumptions concerning the distribution of the underlying data and so extremely flexible and good for many areas ranging from bioinformatics through remote sensing, finance, healthcare, and natural language processing. It is especially valuable for processing high-dimensional datasets, where the size of features can be much larger than the number of observations, and is known for its robustness to outliers and noise. RF also has its intrinsic feature importance measures, which represent another important benefit. These statistics give good information about how the contribution of input variables to the model's predictions is, which aids in feature selection and explanation.
Long short-term memory
Recurrent Neural Networks (RNNs) have been widely praised for their recursion-based nature that automatically represents temporal dependencies and thus have provided the best sequential behavior for data handling and model building. Traditional RNNs, however, are usually severely hindered by the problem that they cannot learn long-distance dependencies in an efficient manner, mostly due to the vanishing and exploding gradient challenges introduced by training with backpropagation through time. These limitations prevent the network from retaining significant information on long sequences and, therefore, can hardly be used efficiently for the performance of more complex time-sensitive tasks. In order to overcome these constraints, an efficient extension to the standard RNN, that is, LSTM network, has been introduced. LSTMs are designed to model long-term dependencies in sequential data by incorporating a memory component. At the heart of the LSTM, a stable storage device with an ability to hold data for arbitrary periods, is a memory cell. This memory cell is actively operated by 3 gating mechanisms known as the input, forget, and output gates, which gate what information moves into, inside the cell, and out of the cell. The forget gate determines what parts of the prior cell state should be forgotten, allowing the network to discard irrelevant or stale information. The input gate controls the contribution of new information to the memory cell. Then, the output gate allows the refreshed cell state to be visible to the next layer or time step and, thus, determines how much of the internal state is outputted. As a result, such a gate structure can provide selective information storing, updating, and retrieval for LSTMs for storing contextual information over long sequences. Hence, LSTMs have shown superior performance in several applications with depth of understanding, as in the fields of natural language processing, time series forecasting, and automatic speech recognition.
Whale optimization algorithm
The WOA is a nature-based metaheuristic algorithm inspired by the peculiar hunting activity of humpback whales. In particular, it imitates the bubble-net foraging tactic wherein whales circle a target and approach in a narrowing circle. WOA has been popular because of its ease of implementation, rapid convergence, and power in escaping local optima and has been known to be a viable method to handle intricate, nonlinear optimization challenges like the optimal power flow (OPF) solutions in power grids (Kar et al., 2024). WOA is used to address the OPF problem by modeling the search agent (whale) as a candidate solution vector incorporating control variables such as generator output powers, bus voltages, transformer tap settings, reactive power compensation, etc. The variables are updated iteratively in an optimization attempt to maximize the objective function to satisfy all system constraints. The main steps of the WOA in OPF are as follows:
The trade-off in exploration and exploitation between WOA and its escaping capabilities from local optima favors its application most on the non-convex, nonlinear problem that OPF possesses. The WOA convergence parameters for this work are explicitly stipulated here for full reproducibility. The population size was determined to be 30 search agents, and the maximum number of iterations is 150. A convergence tolerance of 10-6 was chosen as the termination condition when there was no further improvement in the objective function. Such settings made the exploration–exploitation trade-off balanced and brought steady convergence to the OPF.
American Zebra optimization algorithm
The AZO is a nature-based optimization method based on the social organization and adaptive strategies of American zebras in their natural environment. Taking a cue from their survival mechanisms in the grasslands, that is, cohesive movement, cooperative foraging, and evading predators, the AZO algorithm provides a novel method for addressing challenging optimization problems (Mohapatra and Mohapatra, 2023). Zebras are both adaptable and collectively intelligent. They travel in tightly coordinated herds wherein individuals balance leader following with independent investigation of new areas in pursuit of better resources. This behavior model is strongly associated with the primary optimization principles: exploration and exploitation. AZO illustrates this balance by allowing the algorithm to dynamically adapt to fluctuating search conditions, similar to zebras moving around in uncertain environments. The main steps of the AZO algorithm are:
The AZO algorithm was set to have a population size of 30 agents and up to 150 iterations in order to remain consistent with WOA for the comparative analysis. A convergence tolerance threshold of 10-6 was imposed; the search terminated when no further improvement between consecutive iterations was found. The use of these parameters led to good convergence behavior, which ensured that the optimization results could be reproducible.
Sequential quadratic programing
SQP is a robust and popular gradient-based optimization method for solving nonlinear constrained optimization problems. For OPF, SQP is utilized to optimize an objective function like generation cost, power losses, or environmental emissions under system constraints concerning power balance, voltage limits, generator capabilities, and transmission limits. The OPF problem is itself nonlinear and non-convex, owing to the intricate relationship between power system variables. It includes both equality constraints and inequality constraints. SQP is suited to solve such problems, particularly when high accuracy of convergence and precision in the solution are desired. The main features of SQP in the OPF solution are as follows:
Objectives of the work
The study in this analysis aims for an in-depth analysis of an electric system that consists of “Nb” buses, “Nd” loads,
The ISO's fines or bonuses have an immediate impact on WFs’ bottom line, resulting in a fall in profitability. Wind power generation issues and the notions of wind must, therefore, be solved. One of the ways to minimize such challenges is to have erudite forecasting mechanisms that eliminate the potential disconnections. Power storage devices are yet another solution to match demand to supply instantaneously by using excess power during high wind generation hours in conjunction with discharging excess in the event of a gap in power availability. This paper seeks to address such challenges and find ways to improve system performance. This work focuses on maximizing profit for the whole system with a focus on an integrated thermal power system with wind energy for efficiency. This includes maximizing the economic returns generated from both wind and thermal power plants, in view of wind power generation asymmetry, revenues/costs. This increases the smoothness of variations of wind power generation, reducing its susceptibility to operating risk from unexpected power cuts or surpluses. The overall profit of the power system is calculated by obtaining a detailed formula that specifies various variables such as revenue from the wind energy, charges paid for imbalances, cost of investment, and rate charges under surplus and deficit wind power conditions. These are the factors that should be addressed to a very good extent for the economic efficiency and feasibility of such a system. Since the study mainly targets balancing the imbalances’ costs, it aims for a substantial reduction in the overall generation costs and also the risks of the system. This way, the study aims at improving both the financial gains realized from the power system operation and the social advantage obtained from incorporating RESs such as wind power. Any thorough analysis of the performance of a power system integrated with renewables needs to factor in the cost of imbalance pricing. Although crucial, this consideration has been analyzed by very few researchers in terms of its implications and effects in renewable-integrated systems. System operators are instrumental in rewarding and punishing generating companies, such that positive imbalance costs (when wind generation is above forecast levels) can add to profits, and negative imbalance costs (when wind generation is below forecasts) can reduce profits. The main objective function, the maximization of system profit, can be mathematically expressed by taking into account the different cost components involved in wind power generation and the balancing mechanisms involved.
where 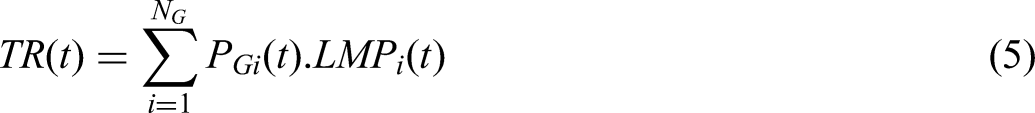


where 


Equation (4) shows the total profit calculated by the system as the difference between total revenue (
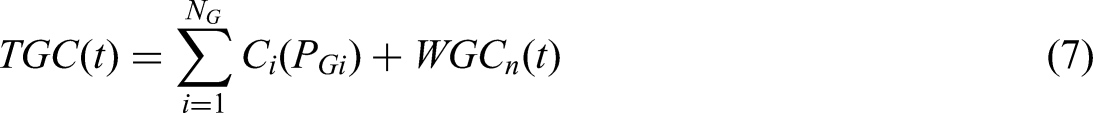
The value of “λ” lies between zero and one. For this work, the value was considered as 0.9 due to the relatively more strict structure of imbalance settlement typically adopted in deregulated electricity markets. Higher λ imposes stronger punishment for variances and rewards more precise forecasting by market participants. Previous works on imbalance cost modeling for IR have also employed values of λ between 0.85 and 1.0, rendering 0.9 a viable and grounded option. This choice is for realistically modeling the economic effects of forecast errors, with model stability considering all 24-h test scenarios. From equations (4–11), it can be observed that the economy of the system is based on an imbalanced price in the case of a wind-related power system. The influence of an imbalanced price on the system can be controlled by proper prediction of wind power generation. In this scenario, ML-based prediction is made available by accessing RF and LSTM techniques to reduce the adverse effect of imbalanced prices so that the system's profit can be improved. For the development of an actual study environment in real-time, load demand and wind power forecasting have been done using an ML-based model for 24 h. OPF is a fundamental optimization problem in power system operation and planning. It determines the optimal values for the generator power outputs, bus voltages, voltage angles, and the power flow in the branches to minimize the objective function, which is the generation cost, while satisfying the power system constraints. Its mathematical formulation is presented as follows. The considered objective function is the minimization problem, which is expressed as:
This minimization problem is subject to the following constraints from (13) to (21). Here (13)–(16) are the equality constraints to ensure power balance, whereas (17)–(21) are the inequality constraints to maintain bus voltages and phase angles, transmission line power capacity, and the generator active and reactive power generation within specified limits.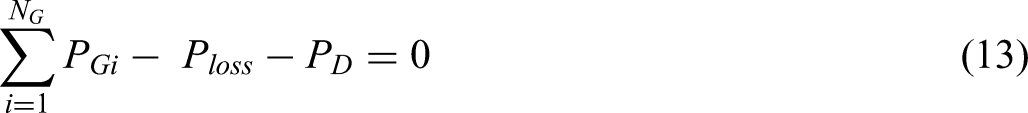
where 
where 

where 


where
Proposed method
The presented methodology is the first to introduce a structured and strategic framework for enforcing the RES aggregator policy with the optimal deployment of DGs and including sustainable incentive systems. The methodology is particularly notable for Japan due to the country's energy diversification and transformation towards renewable sources being imperative because of the limited indigenous fossil fuel resources, the old age of energy infrastructure, and the legacy of decarbonization targets under international frameworks. Within the Japanese power system, the electricity market and higher penetrations of renewable sources require refined coordination methods to control a multitude of distributed generators. These necessities are addressed in the proposed approach via:
The model accounts for economic and technical objectives for the best DG placement. These are reducing system losses, maximizing social welfare, and promoting renewable integration with a key focus on Japan's electricity sector. The aggregator-based policy is integrated into the method, allowing centralized control of dispersed energy producers to facilitate better coordination and market participation efficiency. In a place like Japan, where balancing variable renewable output on isolated regional grids is a longstanding puzzle, this becomes more critical. This approach evaluates incentive policies that have been developed regarding fair compensation to DG owners and investment in clean technologies. The schemes are consistent with the Japanese policy path towards promoting decentralized, low-carbon energy systems and establishing grid stability and cost competitiveness. Various operating conditions are also simulated to evaluate the system performance under different renewable penetration levels and load profiles. It is important to analyse Japan's seismically active and weather-sensitive areas, where energy resilience has become a government priority.
Employing the methodology described above, the research aims to enrich a smarter, cleaner, and more resilient Japanese power grid to fulfill the nation's ambition for carbon neutrality and sustainable energy security. This methodology is applied to the 24-h scenarios to consider the impact of the difference between the anticipated and the actual wind speed. Deficit and SCRs for each case were determined, and the overall imbalance cost was based on these results. Figure 1 displays a flowchart of the proposed approach. With the implementation of generators rescheduled using the constraints (Equations 13–21), the OPF problem has been solved while minimizing the cost of generation for the system. Furthermore, upon installation of the wind generators, the imbalance cost and profit for each wind speed were calculated. On the flowchart, “Hr” is an hour number, whereas “TP” is the total profit, and “P” is the profit for each hour. The flow chart outlines the calculation of the total profit within the energy category, including the costs of imbalances. And it starts from initializing the hour counter (Hr = 1) and total profit (TP = 0). The system read input data for bus, branch, generator parameters, and generator coefficients. This baseline data is used to run power flow calculations, along with an optimization function. After this, both actual wind speed and predicted wind speed are collected, which is very important for estimating renewable energy generation and analyzing the data.
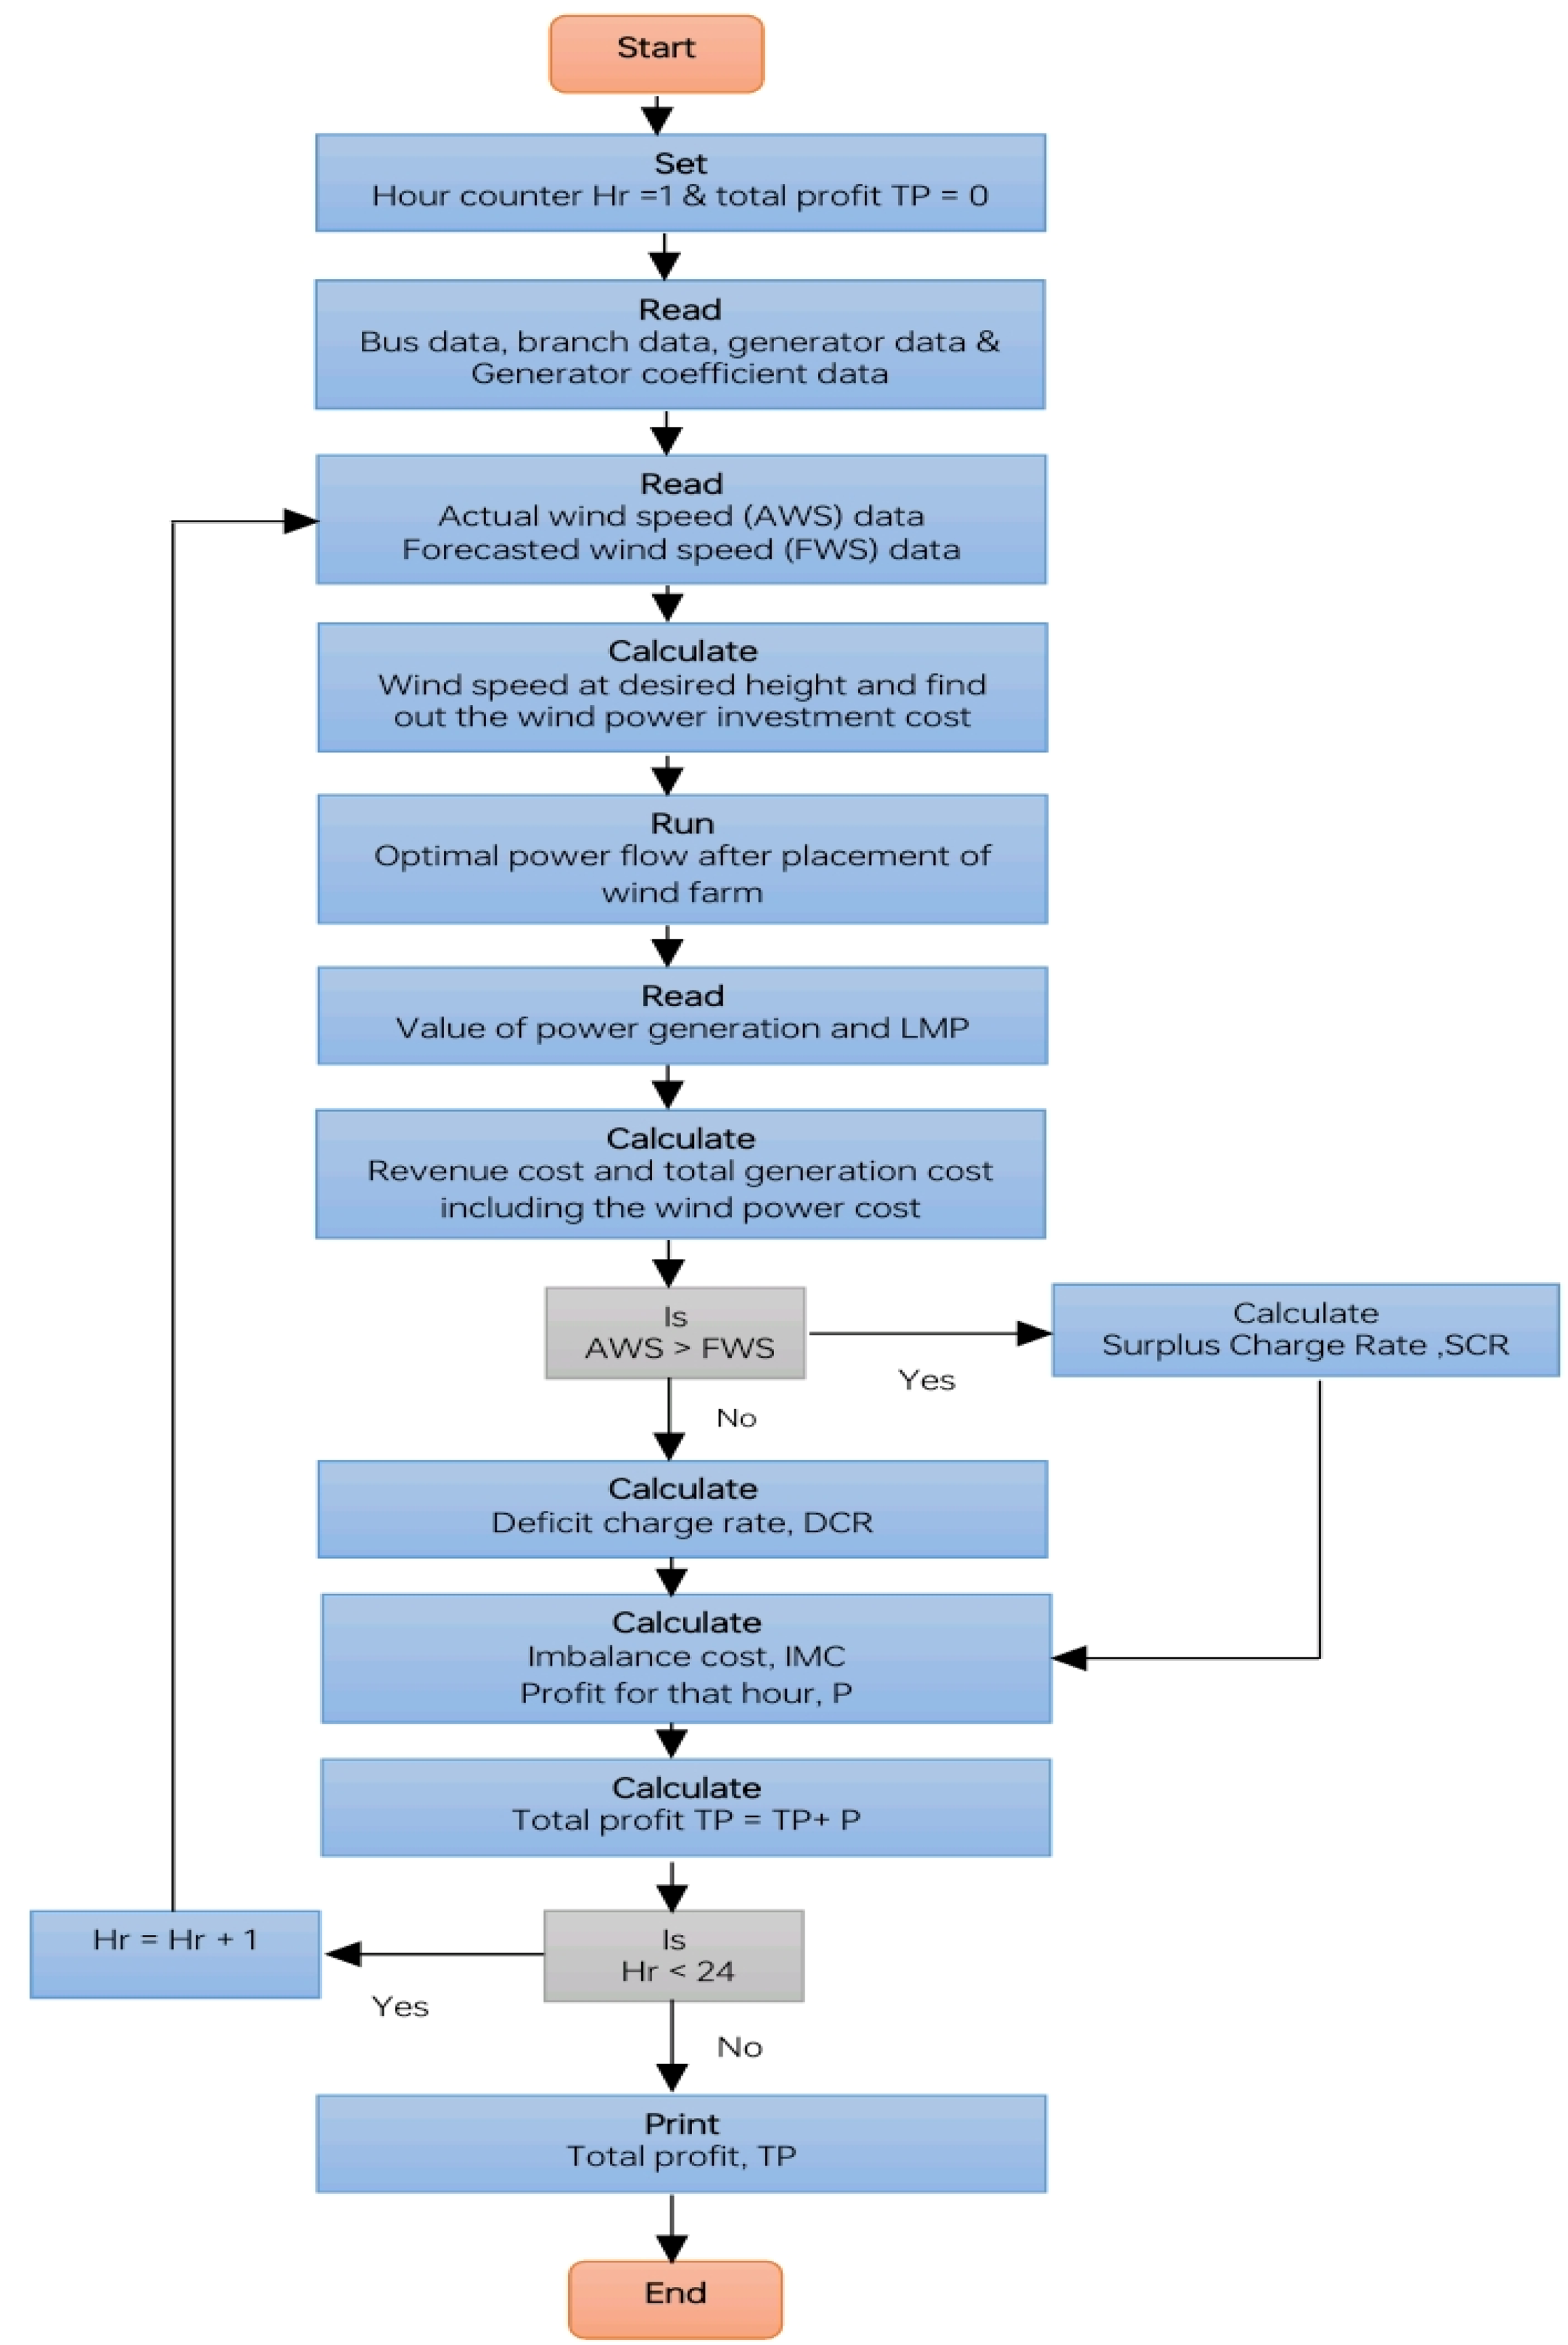
Flow chart representation for the proposed methodology.
Wind speed at the desired height is used to calculate wind power investment costs. This step is essential before determining the economic feasibility of including wind energy in the system. An OPF analysis is subsequently performed, accounting for the placement of WFs. This helps to ensure that energy dispatch meets grid needs and drives energy efficiency and cost reduction. The value of power generation and LMP which indicates the cost of the electricity supply to particular points on the grid. This includes generating electricity for that electricity point in various locations. Revenue and total generation expenses, including the costs of wind power, along with revenues, are found. In addition, the SCR and DCR calculated according to the actual wind speed vs predicted wind speed are calculated. These rates evaluate the financial penalties or adjustments for energy generation that exceeds or falls short of forecasts. These surplus or deficit rates lead to imbalanced costs and the calculation of profit per hour. This hourly profit is then added to the total profit. The overall profit (TP) is then written out at a 24-h time stage, indicating the total financial result after balancing the costs of the unbalance. The total strategy fuses renewable energy with forecasting and cost management; it delivers economic savings and grid stability and sustainability. This flowchart shows a clear path to enhance profits in addition to avoiding unbalanced spending.
System specifications
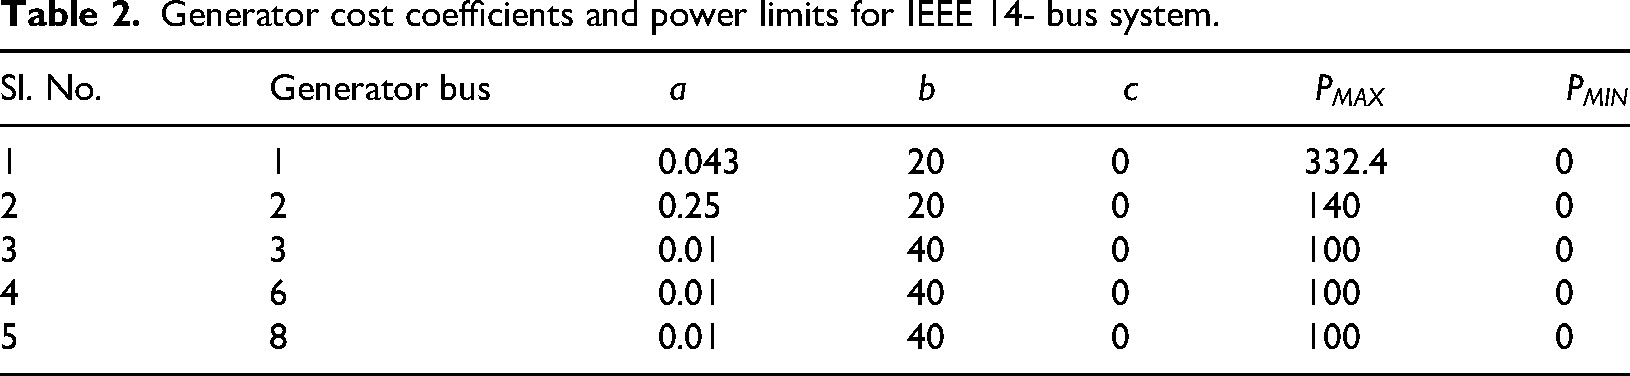
The IEEE 14-bus system has been chosen to examine the effectiveness of the presented hybrid approach. The single-line diagram of the IEEE 14 bus system is depicted in Figure 2. It has 14 buses with 5 generators and 11 loads. The transmission network of this system consists of 20 branches interconnecting the buses. Out of 14 buses, bus 1 is considered a slack bus, and buses 2, 3, 6, and 8 are the PV buses; the remaining are the PQ buses (Basu et al., 2022; Singh et al., 2022). The base MVA considered for the system is 100 MVA, and the maximum & minimum voltage constraints are 1.06 and 0.94 pu, respectively. Table 2 shows generator bus numbers for the 14-bus system used in this work and the cost coefficients of each generator with its maximum and minimum active power generation limits. Figure 3 shows the active power demand distributed across all the buses under peak load conditions on the system. It shows that bus 3 has the highest load, and buses 1, 7, and 8 are not loaded.
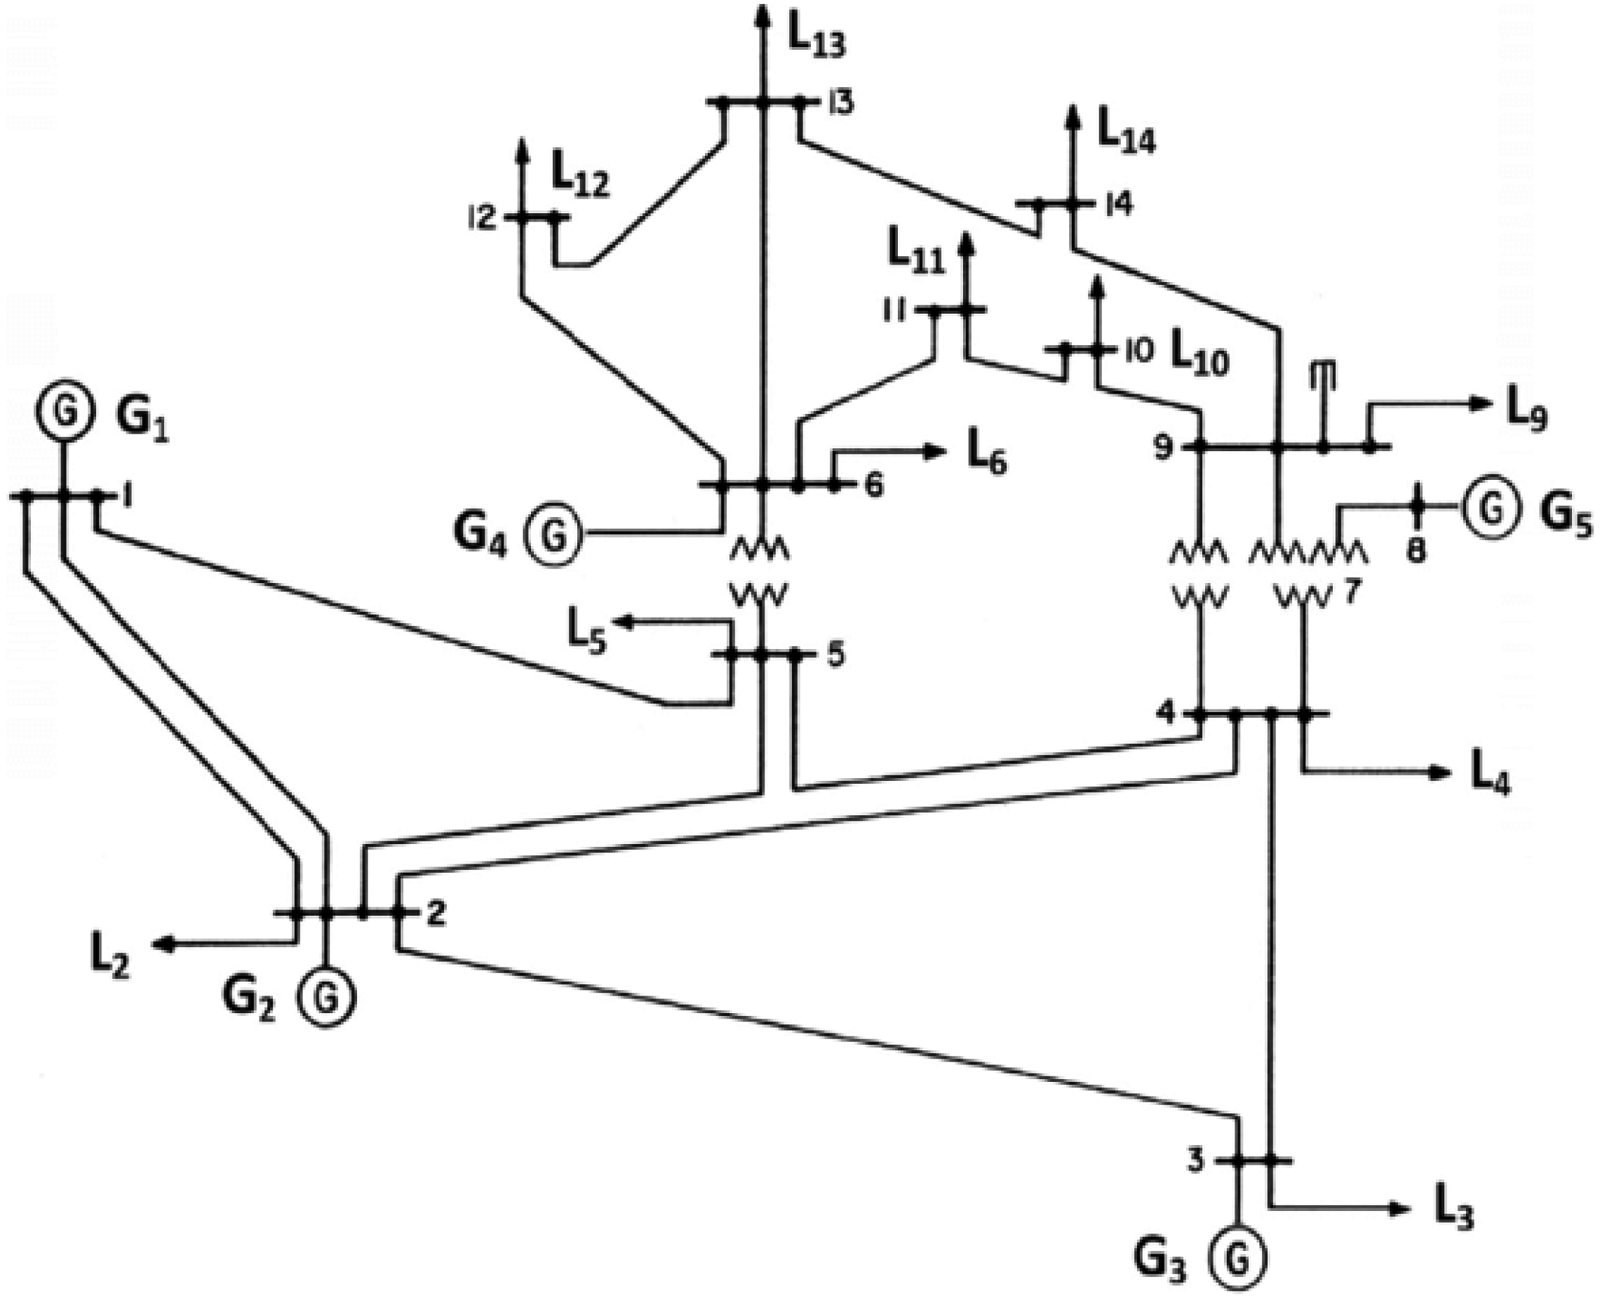
Considered IEEE 14- bus system.
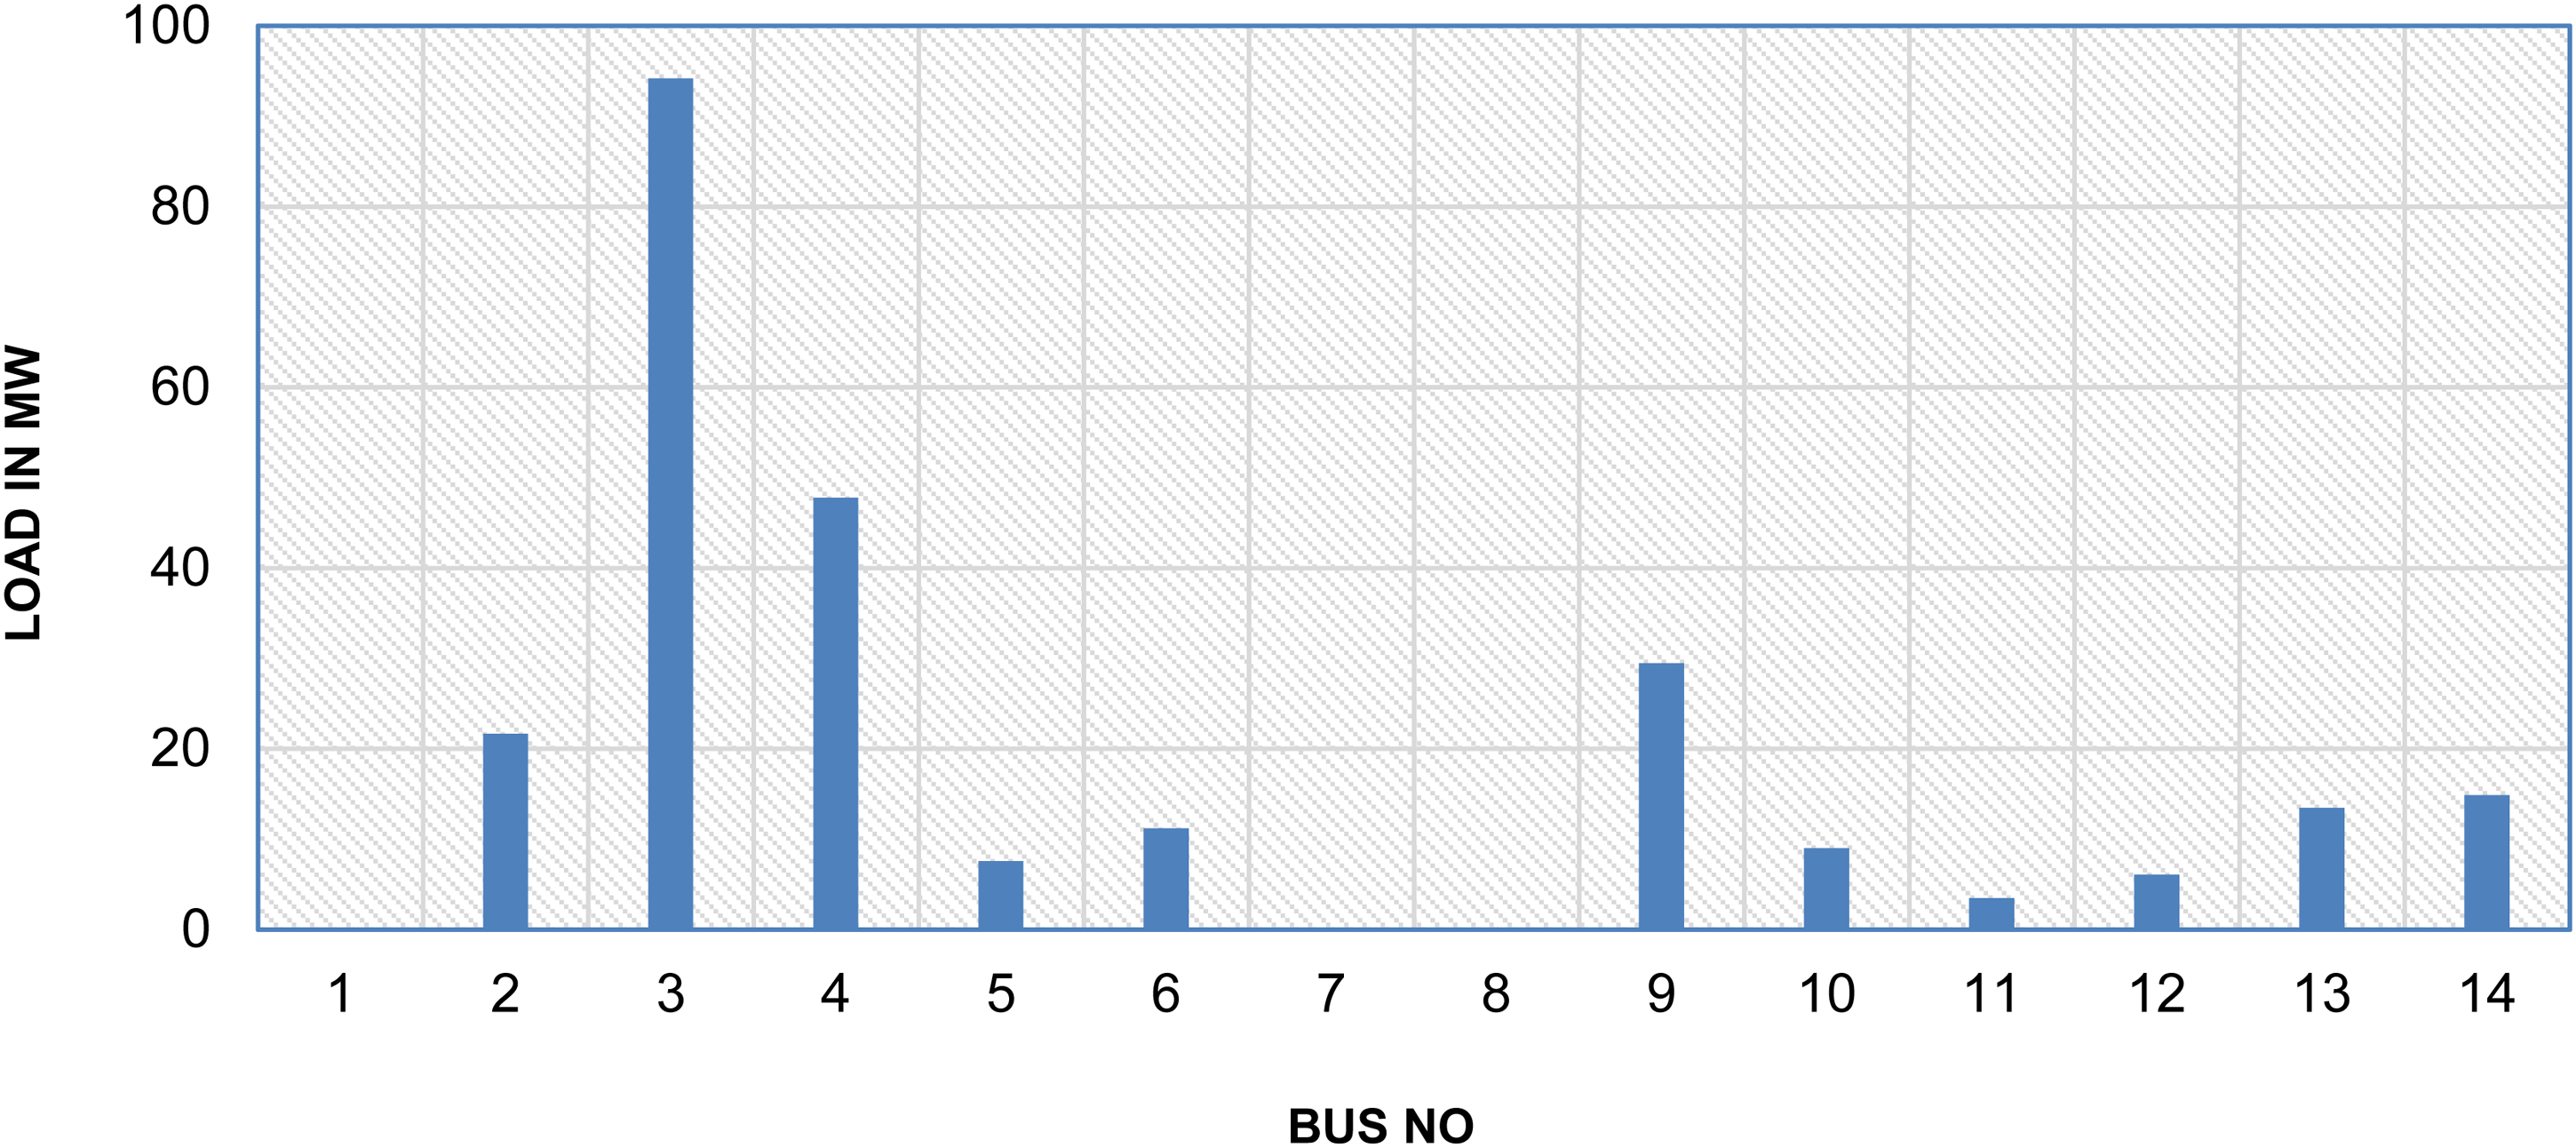
Load demand at all buses in the IEEE 14-bus system during peak load time.
Generator cost coefficients and power limits for IEEE 14- bus system.
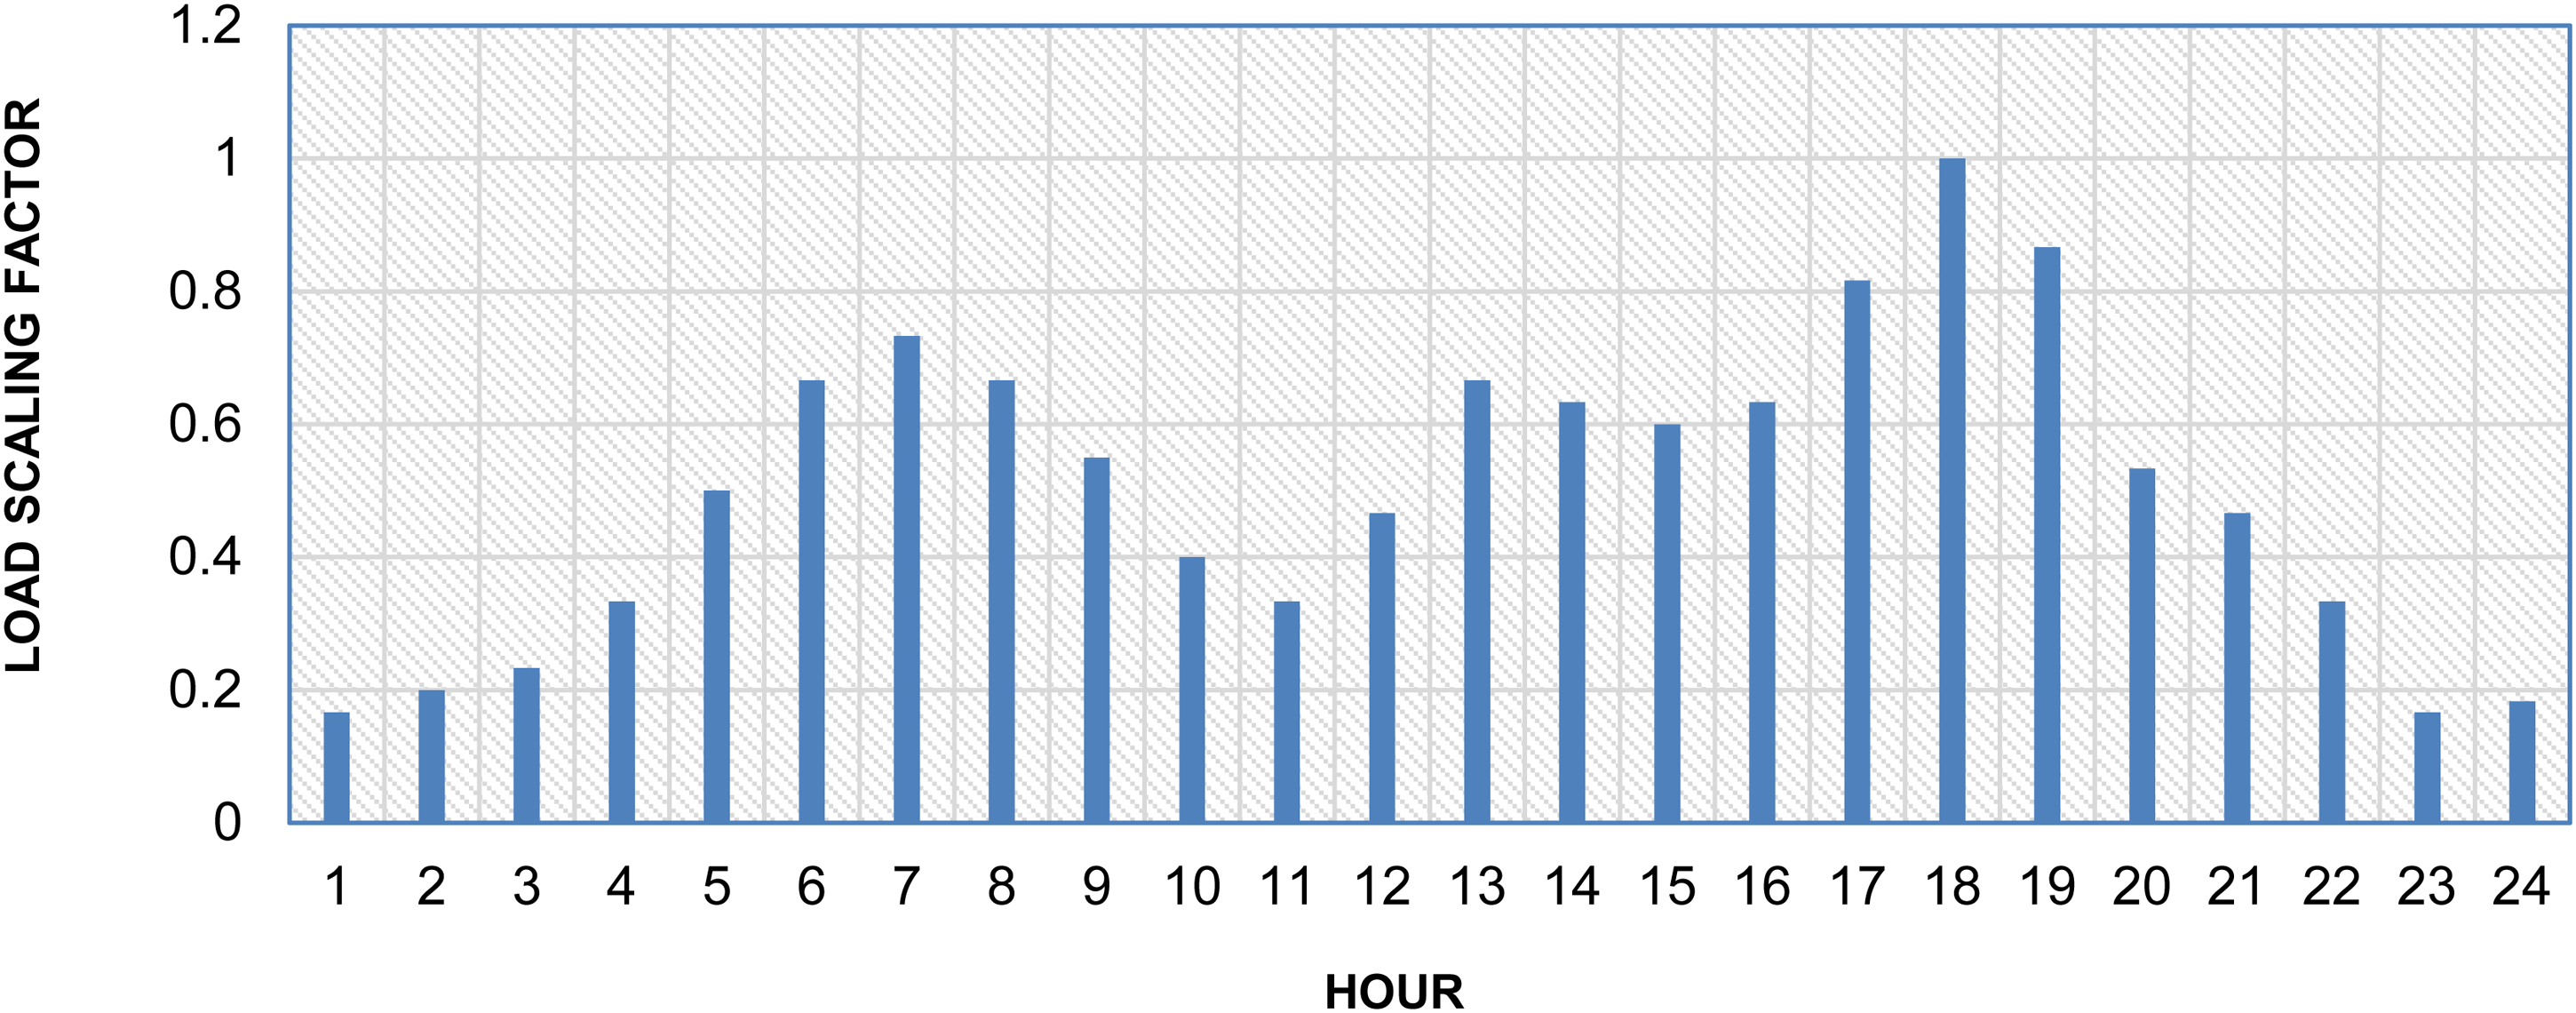
This work is performed by taking into consideration that the load varies every hour, and the corresponding deviation from the peak load is evaluated by taking a percentage of the peak load that is present at a particular hour. To simulate the load variations for an entire day, a general load curve is considered and the load demand at every hour is scaled between 1 and 0 where 1 represents the peak load on the system and 0 represents the no-load condition as shown in Figure 4. Note that the hour of the day is represented from 1 to 24 where 1st hour refers to 1 AM and 24 refers to midnight.
Load scaling factor to simulate load variations for every hour.
The load scaling factors at every hour are used for the 14-bus systems. The base case from the MATPOWER file that is, normal IEEE 14-bus system data is considered as peak load and for other hours, load variations are simulated by multiplying the base case with a suitable multiplication factor as shown in Figure 4. By analyzing the load scaling factors; peak load condition occurred at the 18th hour and the off-peak load occurred at the 1st hour and intermediate loading conditions occurred at the 13, 21 h respectively.
Wind power and load forecasting using a ML model
Wind power forecasting using ML
The dataset used for this analysis is taken from (AccuWeather, 2025). It contains six major features that are essential for understanding and forecasting wind power generation, as shown in Figure 5. The “Time stamp” column provides the date and time for each record, which allows tracking changes over the seasons. “System power generated” is the output of the wind turbine in kilowatts, meaning the amount of power at every interval. “Wind speed” and “Wind direction” contain information about the wind speed and direction. The “Pressure” column provides atmospheric pressure measurements, and “Air temperature” contains temperature measurements, both of which affect air density and, therefore, turbine performance. Figure 6 shows the changes in wind power for one month, depicting the variability of wind power.
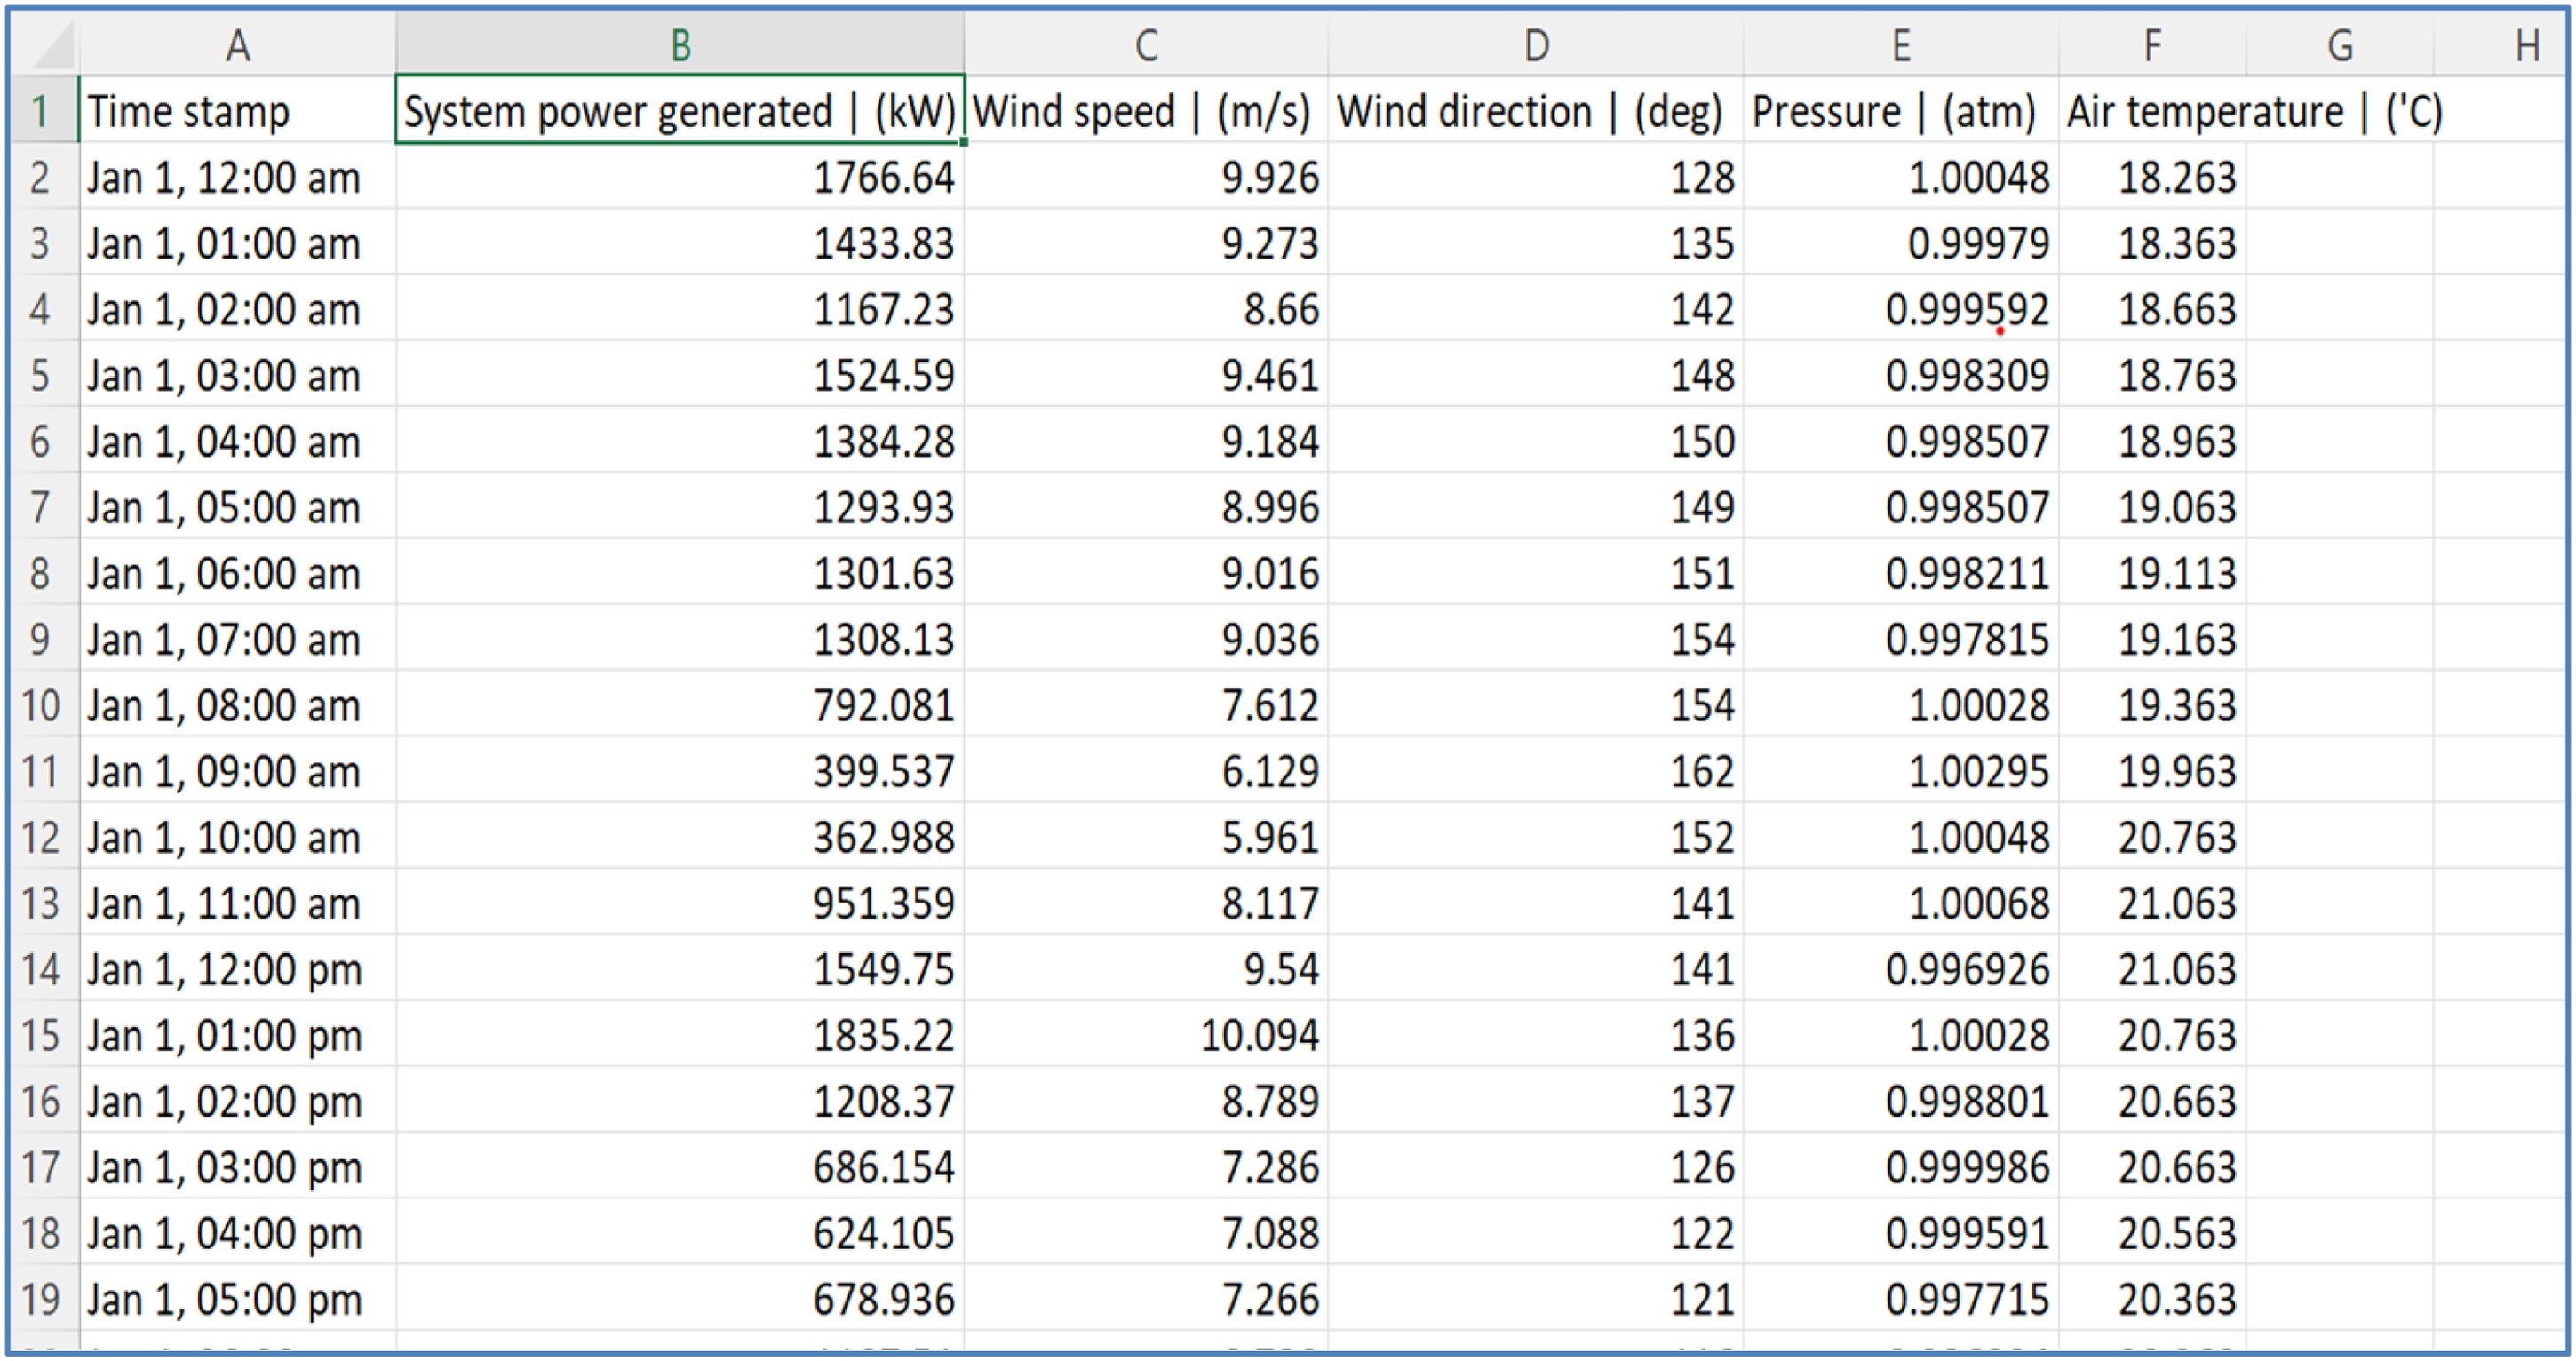
Sample dataset used for wind power predicting.
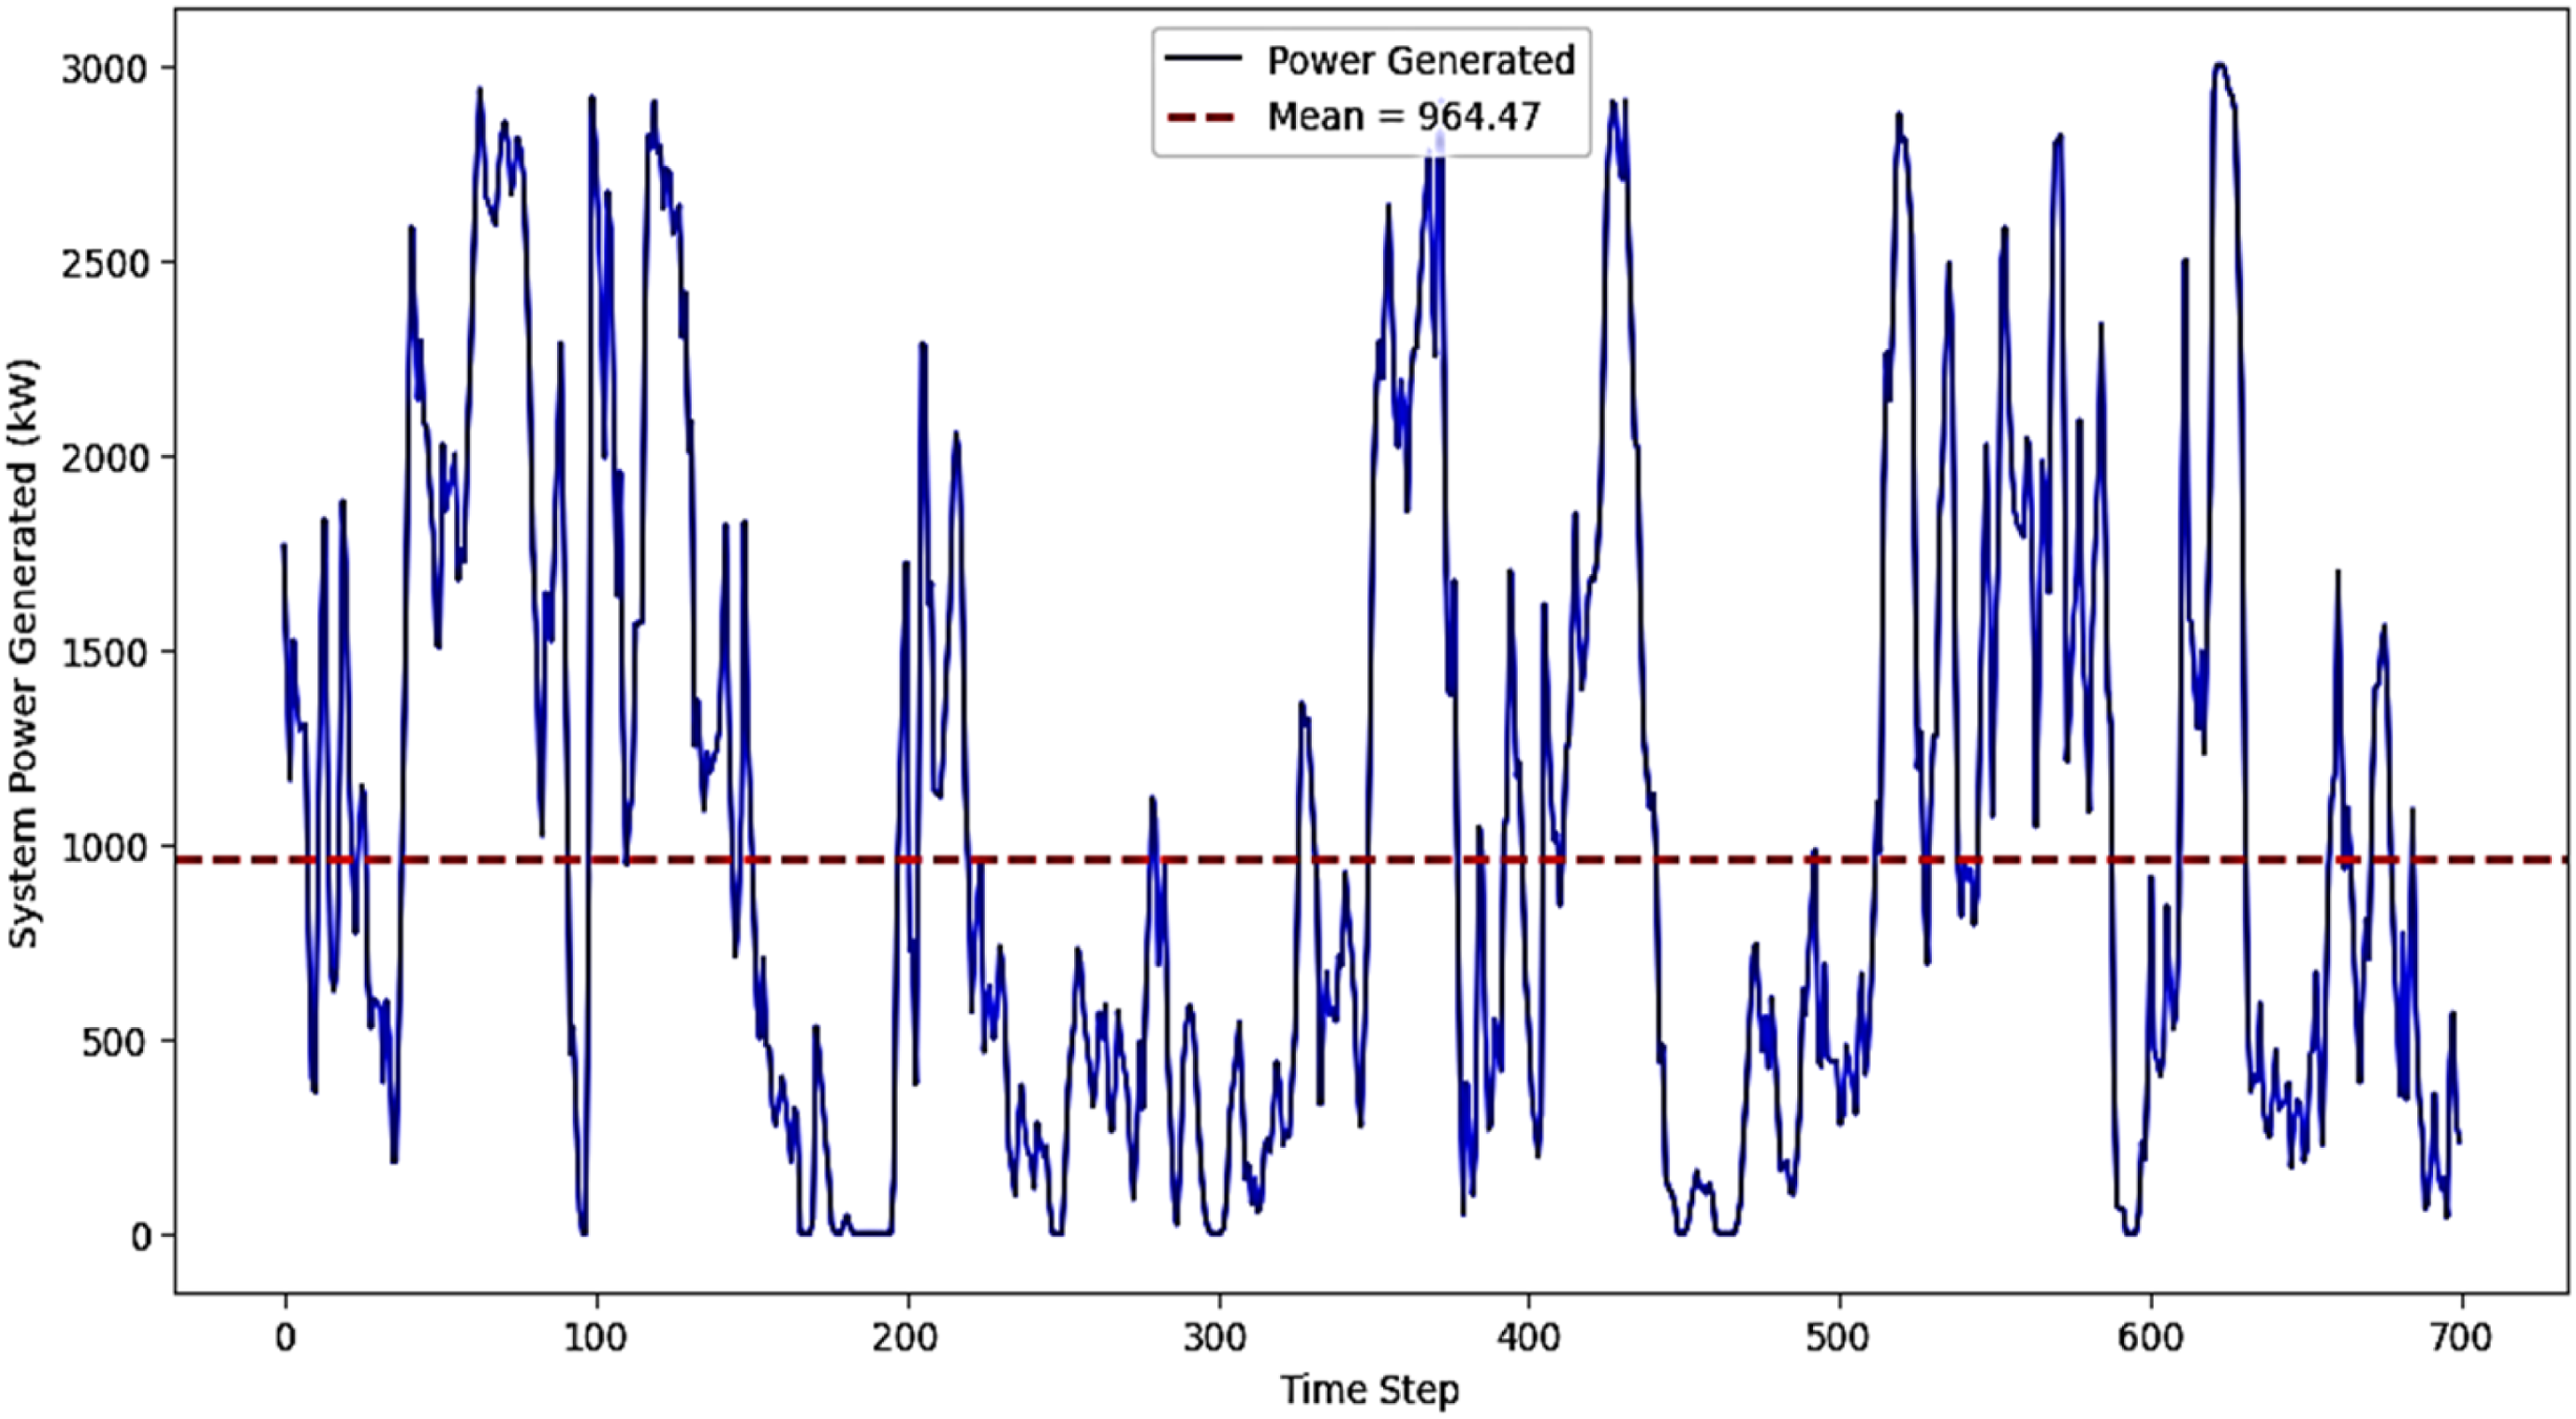
Disparities in generated wind power over one month with the overall mean.
In this work, a dataset of meteorological factors influencing wind power generation, and its performance was evaluated by metrics such as Mean Squared Error (MSE), RMSE, Mean Absolute Error (MAE), and the coefficient of determination (R2). The models achieved very high accuracy, but LSTM surpassed RF in all the metrics, and their results are shown in Table 3.
Mean Squared Error
Results from the implementation of random forest and LSTM for wind power forecasting.
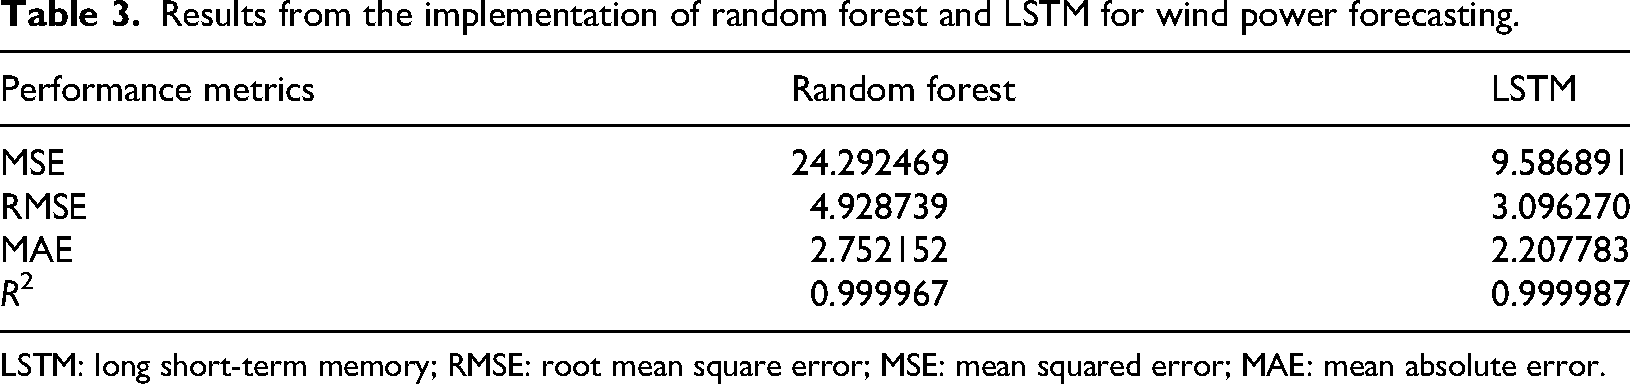
LSTM: long short-term memory; RMSE: root mean square error; MSE: mean squared error; MAE: mean absolute error.
It is defined as the average squared difference between actual and forecasted wind power generation values. A low MSE indicates that the forecasted wind power is closer to the actual wind power.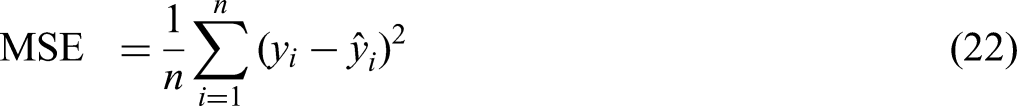
where
Root Mean Square Error
It is obtained by the square root of MSE. This brings the error value back to the original units of the data, which makes it easy to interpret and evaluate. Mean Absolute Error
It measures the average absolute difference between actual and forecasted wind power generation values. It treats all errors equally, as it only considers the actual values. R-squared (R2)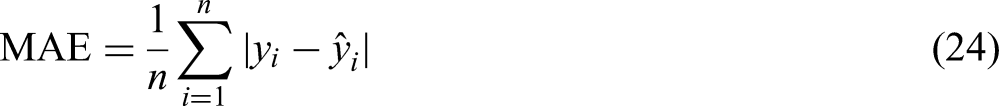
It indicates the degree to which the model clarifies the erraticism in the data. An R2 rate near “1” advises a good fit, while “0” indicates no descriptive power.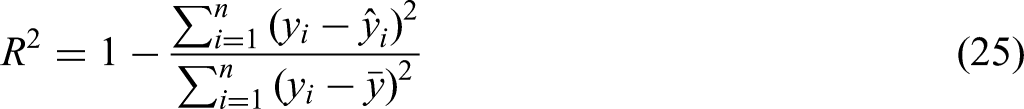
where 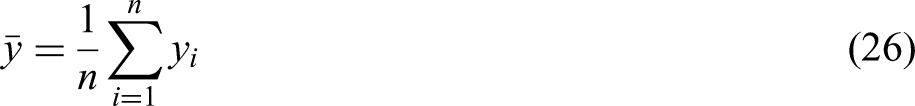
The correlation matrix in Figure 7 presents useful information concerning the correlation among different atmospheric and operational parameters for the performance of a wind turbine. The correlation, which is extremely positive, between power and wind speed serves as a reminder that higher wind speed leads to higher electrical power and therefore wind speed is the most important performance parameter on the turbine. That correlation is poor with wind direction means that while wind direction affects turbine direction, its direct influence on power output is negligible. The negative correlation between atmospheric pressure and power output shows that an increase in pressure, by acting on air density and wind behavior, will reduce the efficiency of a turbine a little. Moreover, the relationship between air temperature and pressure is also representative of normal atmospheric behavior, allowing temperature-related air density and pressure distribution. Overall interpretation of these correlations can benefit the maximization of turbine locations for efficiency and predictive maintenance of wind energy systems.
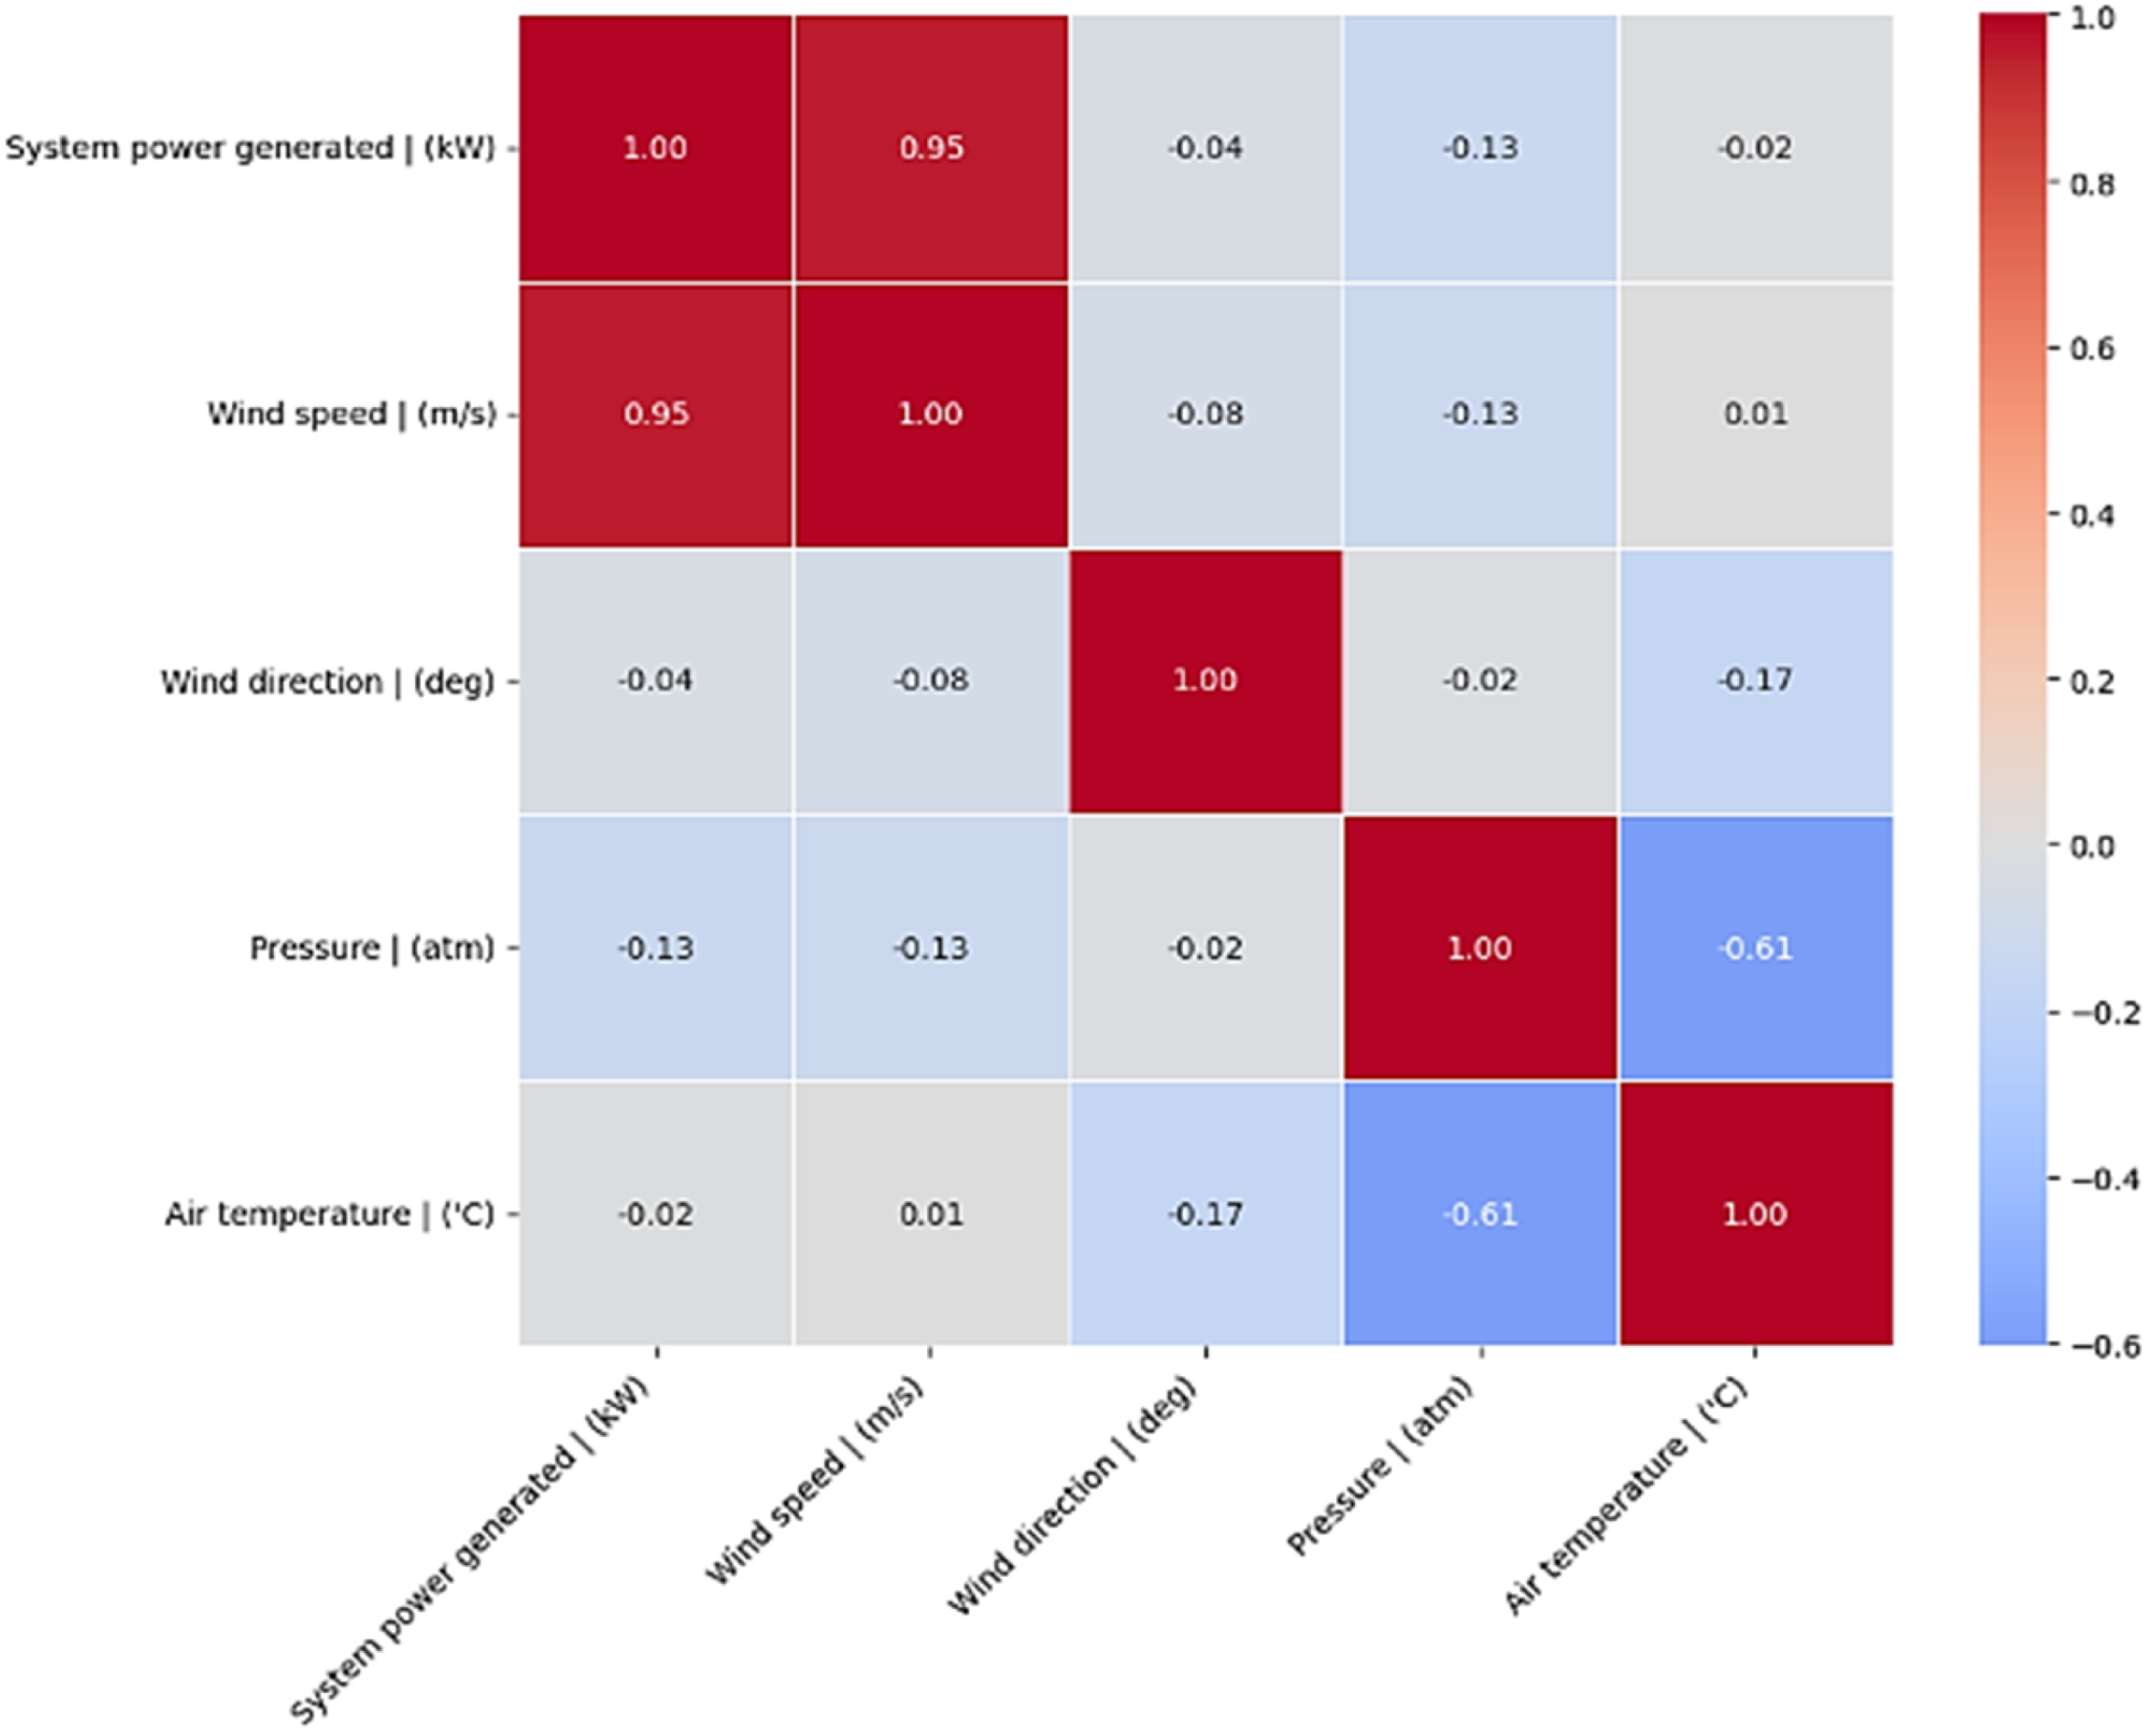
Correlation matrix of the wind power dataset.
Table 3 shows the results of RF and LSTM-based models. The reliability of the LSTM model over RF for all error metrics in this case is observed, revealing its ability to better express the load demand data and the temporal dependencies. Compared to RF, LSTM obtains an MSE (9.59) and RMSE (3.10) of less than 24.29 and 4.93, respectively. Likewise, the MAE for LSTM was 2.21, which is less than RF's 2.75. Both models have similar near-perfect R2 scores, suggesting their very good performance in predicting the target values, but LSTM did edge a little with the score of 0.999987 versus 0.999967 for the RF.
These findings prove that even if the models are very good, LSTM generates better forecasting accuracy, possibly due to the fact that LSTM is built for sequential data processing. This highlights the importance of choosing models aligned with the temporal nature of power system data for optimal forecasting performance. Figure 8 shows a set of data points for comparison of actual wind power from test data and the forecasted wind power from the trained RF model, where blue and red colors were used to indicate the actual and forecasted wind power, and Figure 9 shows the actual and forecasted power on X and Y axes, respectively, and their regression plot for RF model. Similarly, Figures 10 and 11 display the actual and forecasted wind power and the regression plot of them using the LSTM model.
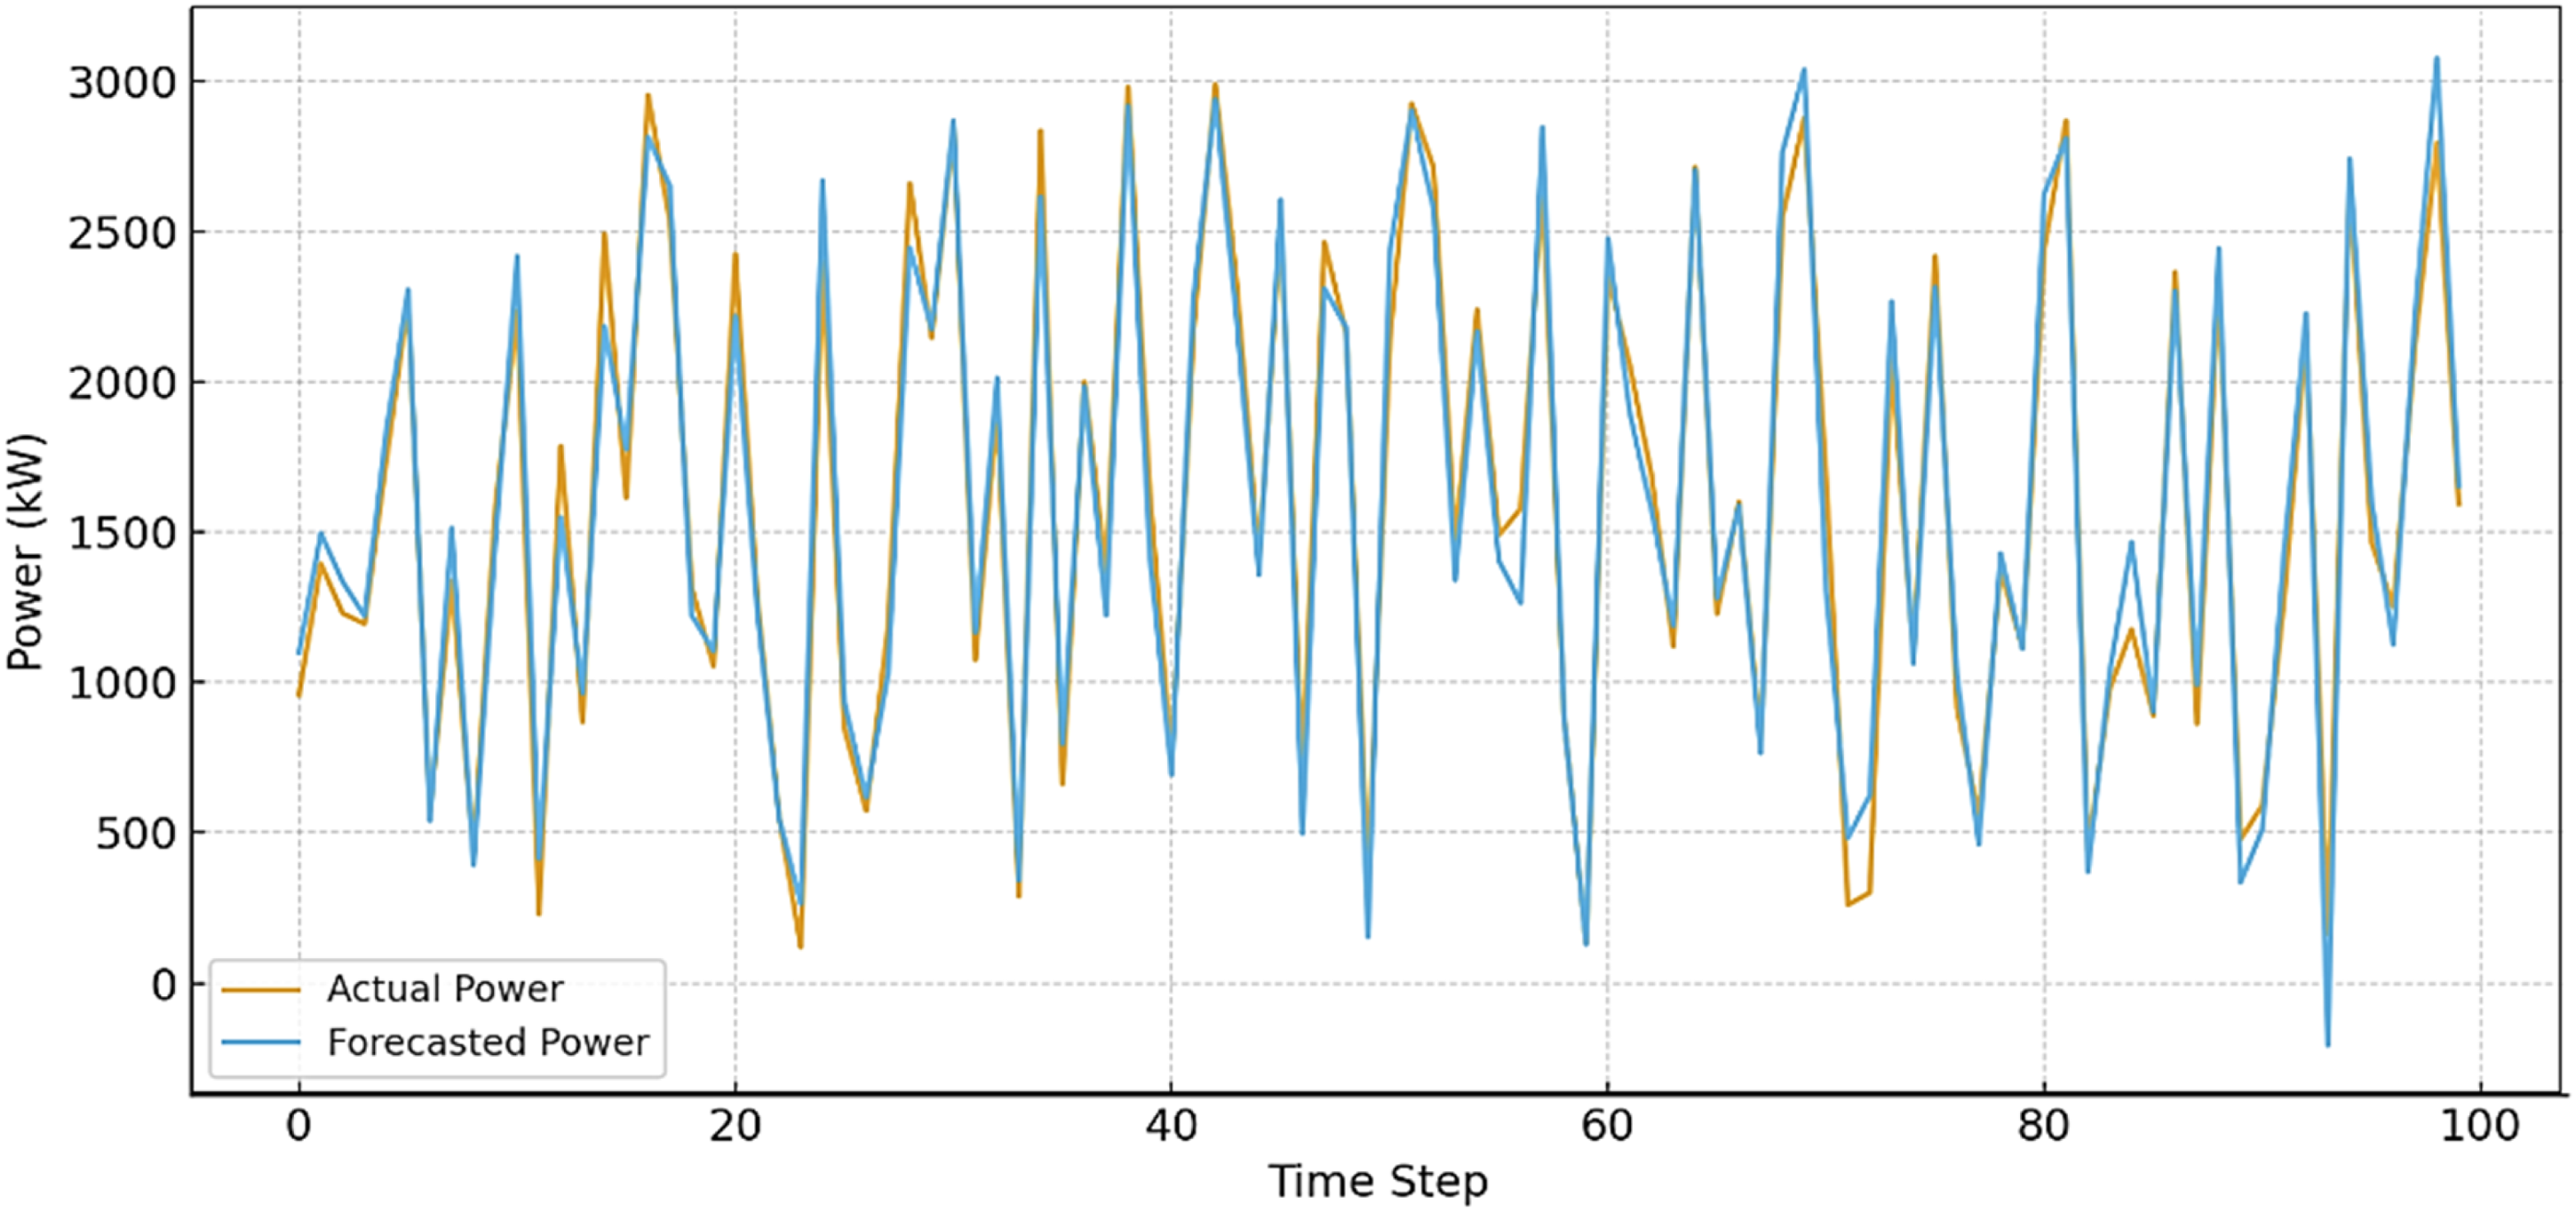
Actual vs forecasted wind power generation using random forest (RF).

Regression plot of actual and forecasted wind power generation using random forest (RF).
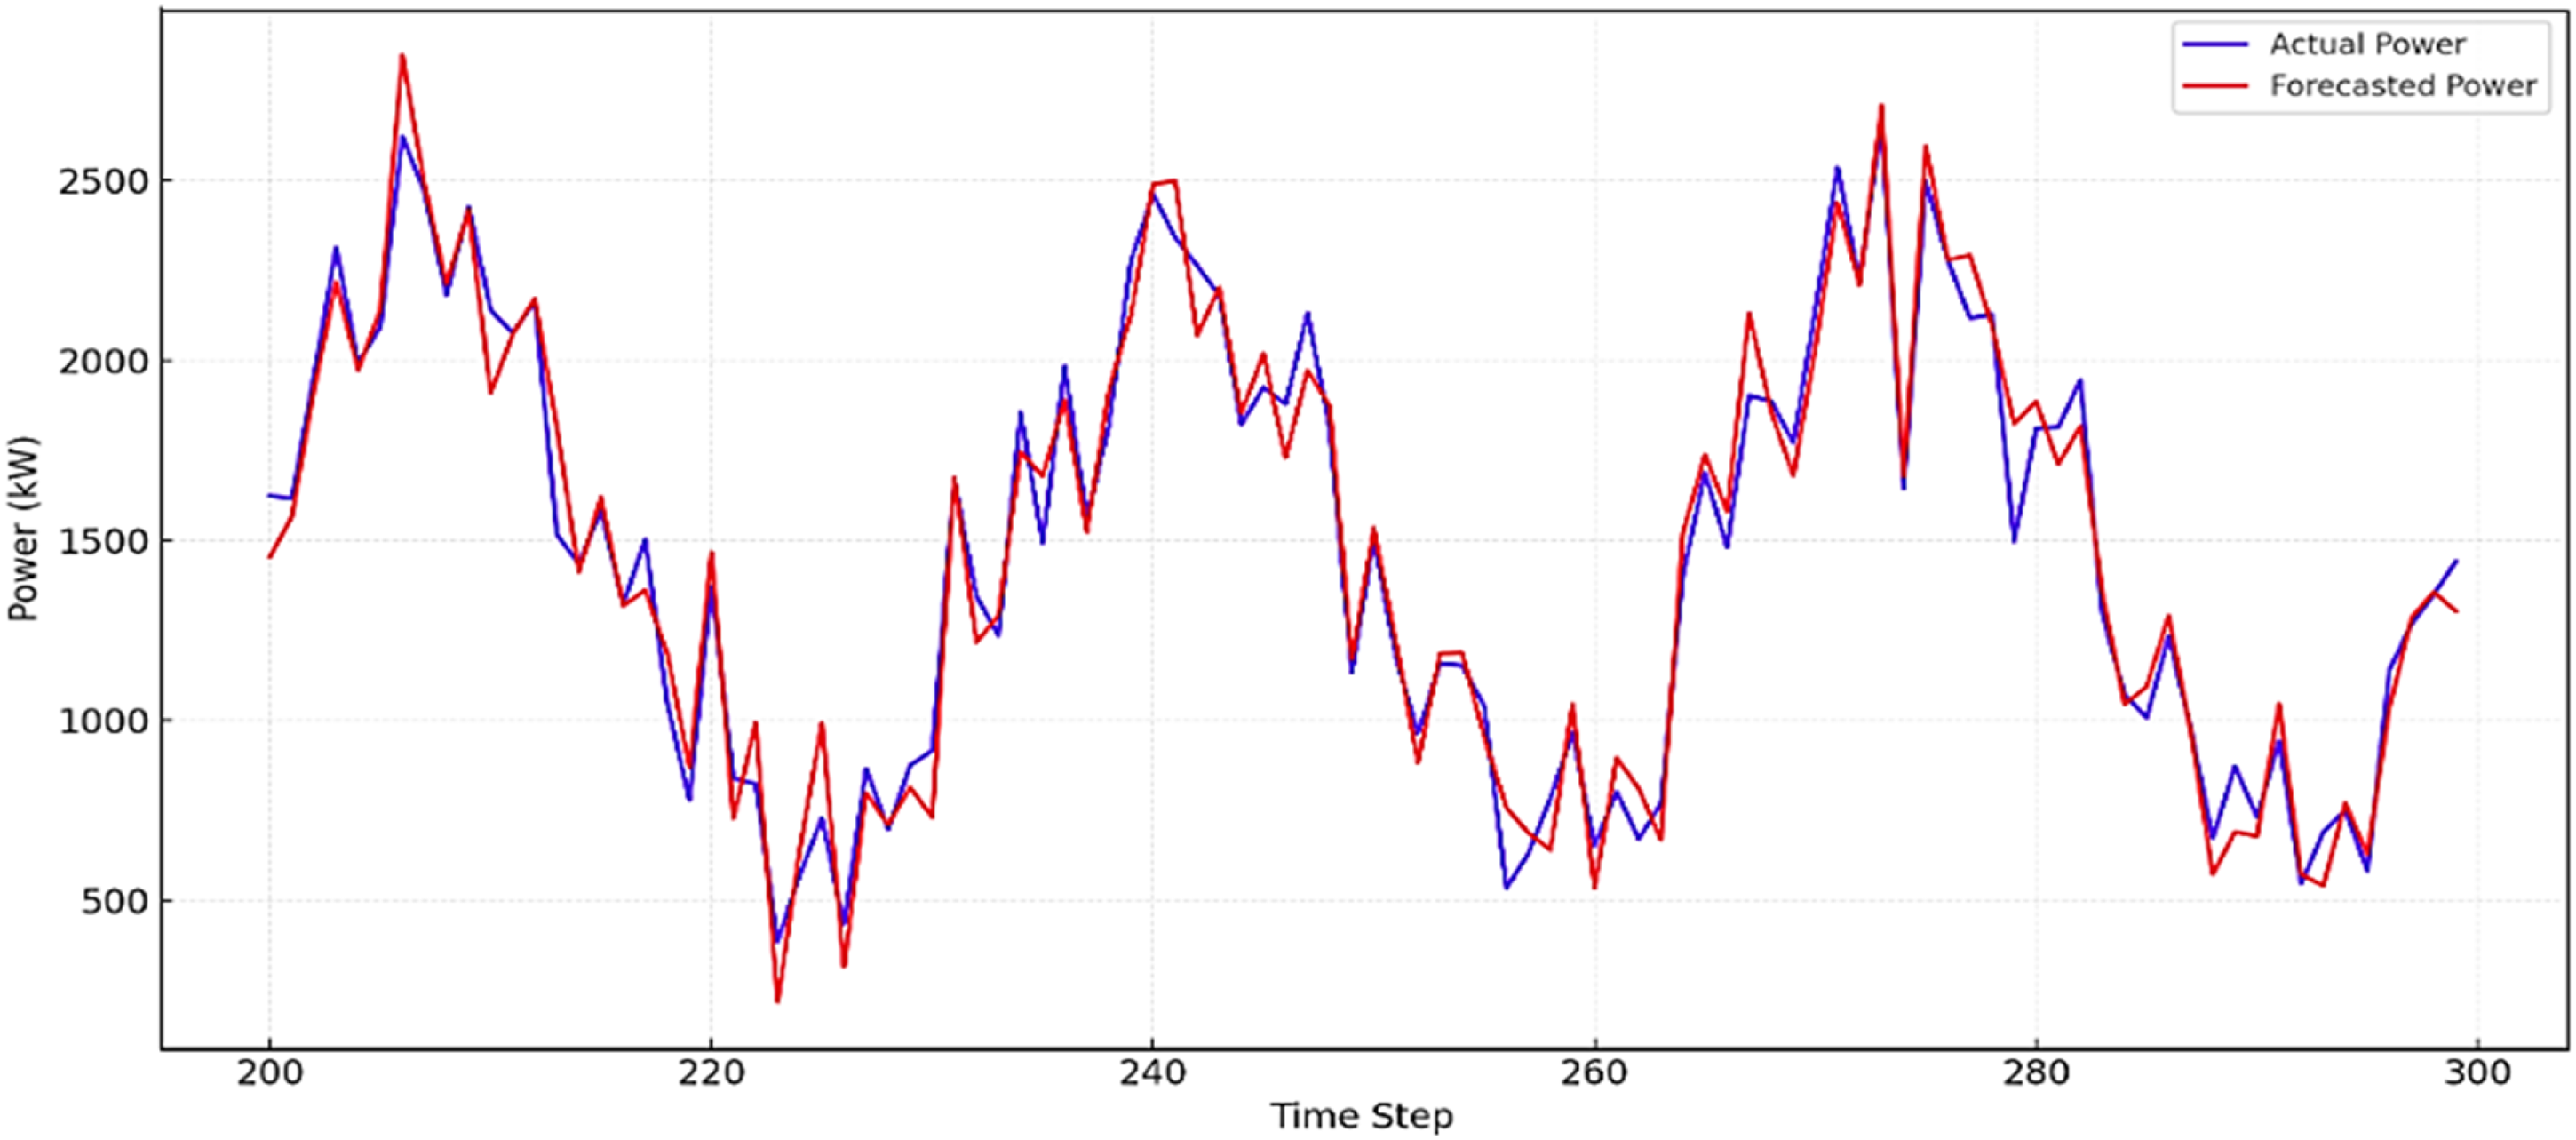
Actual vs forecasted wind power generation using long short-term memory (LSTM).
Regression plot of actual and forecasted power generation using long short-term memory (LSTM).
The strong alignment in Figures 8 to 11 shows that forecasting models, like the LSTM architecture, are effective. The predictions are in good agreement with actual load trends, so the model has learned a lot about the underlying dynamics. This accuracy can be realized in simulation-based configurations, provided that the input data is clean, preprocessed, and free of noise. For model training, the model was assisted by optimizing its hyperparameter tuning and correctly stopping conditions to avoid overfitting the data, while convergence was achieved. This is in line with lower RMSE, MAE, and R2 score closer to unity, indicating the accuracy of the underlying representation. Therefore, while this data might not be a general sense of well-defined reality due to environmental and measurement uncertainties, it is an indication of the model's reliability if precisely targeted data are included.
Load demand forecasting using ML
In a wind-integrated power system with 24-h forecasts on wind, accurate load predictions become very pertinent. Reliable load approximations allow operators to predict fluctuations in demand, which they can then adjust to meet the naturally variable wind output. Due to the dependence of wind generation on weather conditions, by estimating the load, the operators are better able to match the renewable and conventional sources.
Figure 12 indicates the data set adopted to perform load forecasts. It contains more than 2 million measurements of household electric power consumption at one-minute intervals, and spans the period from December 2006 to November 2024. It is a multivariate, time-series data set including six properties including date, time, global active power, global reactive power, voltage, and global intensity. Date and Time illustrate the time of taking, Global Active Power denotes the total active power used by the household every minute, measured as kW, Global Reactive Power denotes the reactive power used in kilowatts, and Voltage and Global Intensity denote the voltage in volts and current in amperes of the household's electricity system. These features together represent detailed electrical conductive information in a household, making the data set amenable to time series analysis as well as predictive analysis in energy consumption. Table 4 shows a comparison of RF models compared to LSTM models on load demand forecasting using standard regression metrics. LSTM outperforms RF on all error metrics (i.e., MSE, RMSE, MAE), so it better predicts the load demand data.
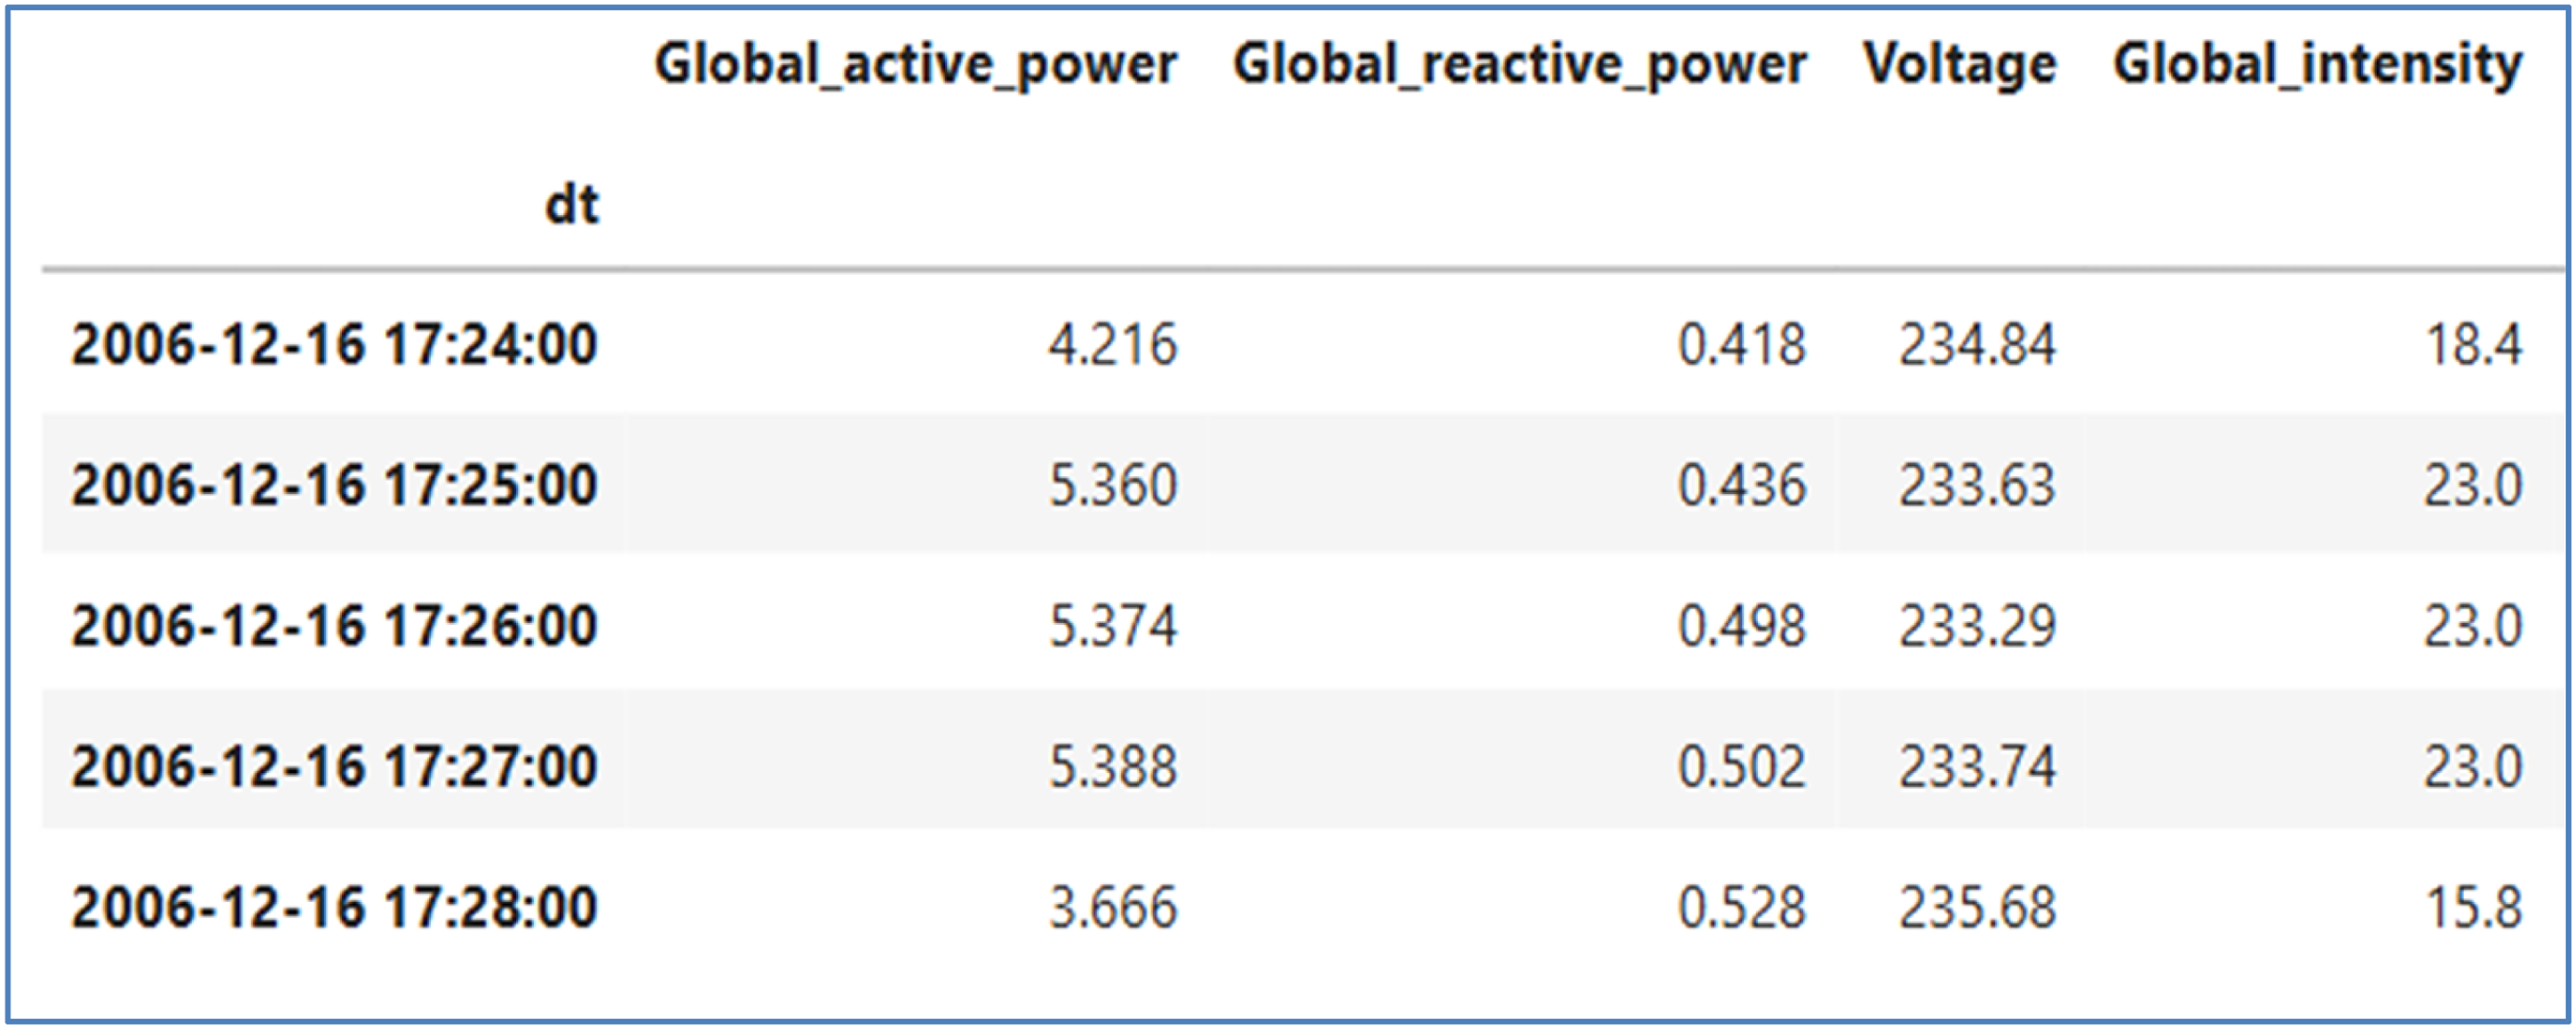
Sample of the dataset used for load forecasting.
Results from implementation of random forest and LSTM for load demand forecasting.
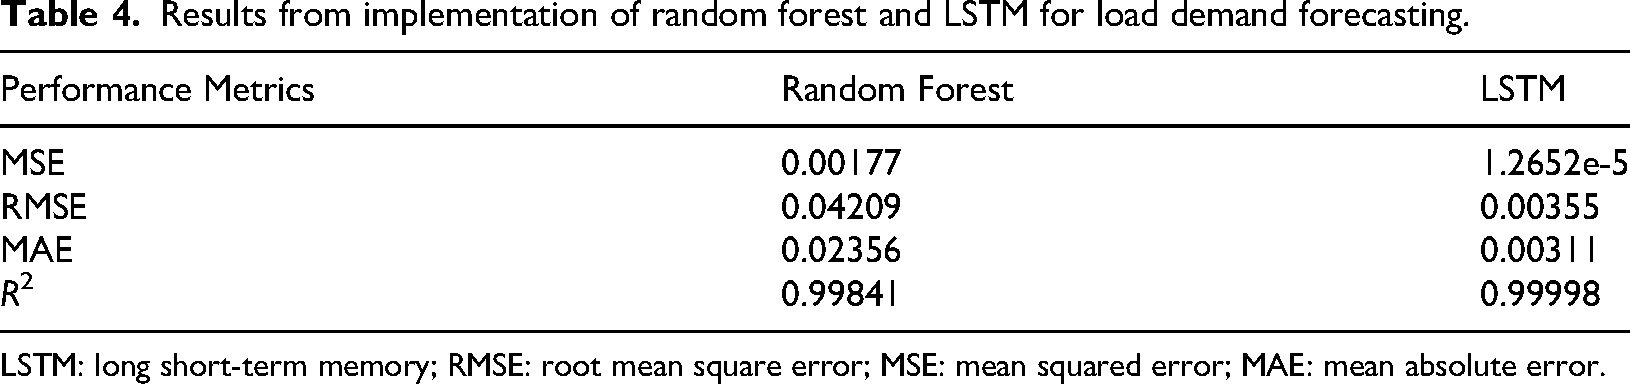
LSTM: long short-term memory; RMSE: root mean square error; MSE: mean squared error; MAE: mean absolute error.
The LSTM's MSE, showing it achieves a much lower average squared error than RF, indicating its finer precision. LSTM also shows the lowest RMSE and MAE, which suggests it continues to be robust in predicting near true targets. Both models have a high R2 score, which indicates a good model fit; LSTM has a marginally better understanding of the data patterns. In general, LSTM is more appropriate for modeling sequential and time-sensitive behaviors for load forecasting, while RF, although powerful, might not be sufficient for these situations.
The correlation pattern in Figure 13 offers useful perspectives on the linear relationships of four prominent wind turbine parameters: Global active power, global reactive power, voltage, and global intensity. The matrix demonstrates that there is an ideal positive relationship between global active power and global intensity, and with changes in the active power, the intensity is proportionate. Similarly, global reactive power is moderately positively related to global active power and global intensity, implying a partial correlation. Voltage is negatively related to the other parameters, more so to global active power and global intensity. This means that more power (or higher intensity) means a small decrease in voltage. These correlations exhibit the interaction and behavior of both system and load demand patterns in a manner; therefore, higher power consumption can bring voltage drops to the system. Indeed, the matrix encapsulates key relationships that are instrumental to understanding turbine operation, ultimately determining the most efficient operational framework within the energy system.
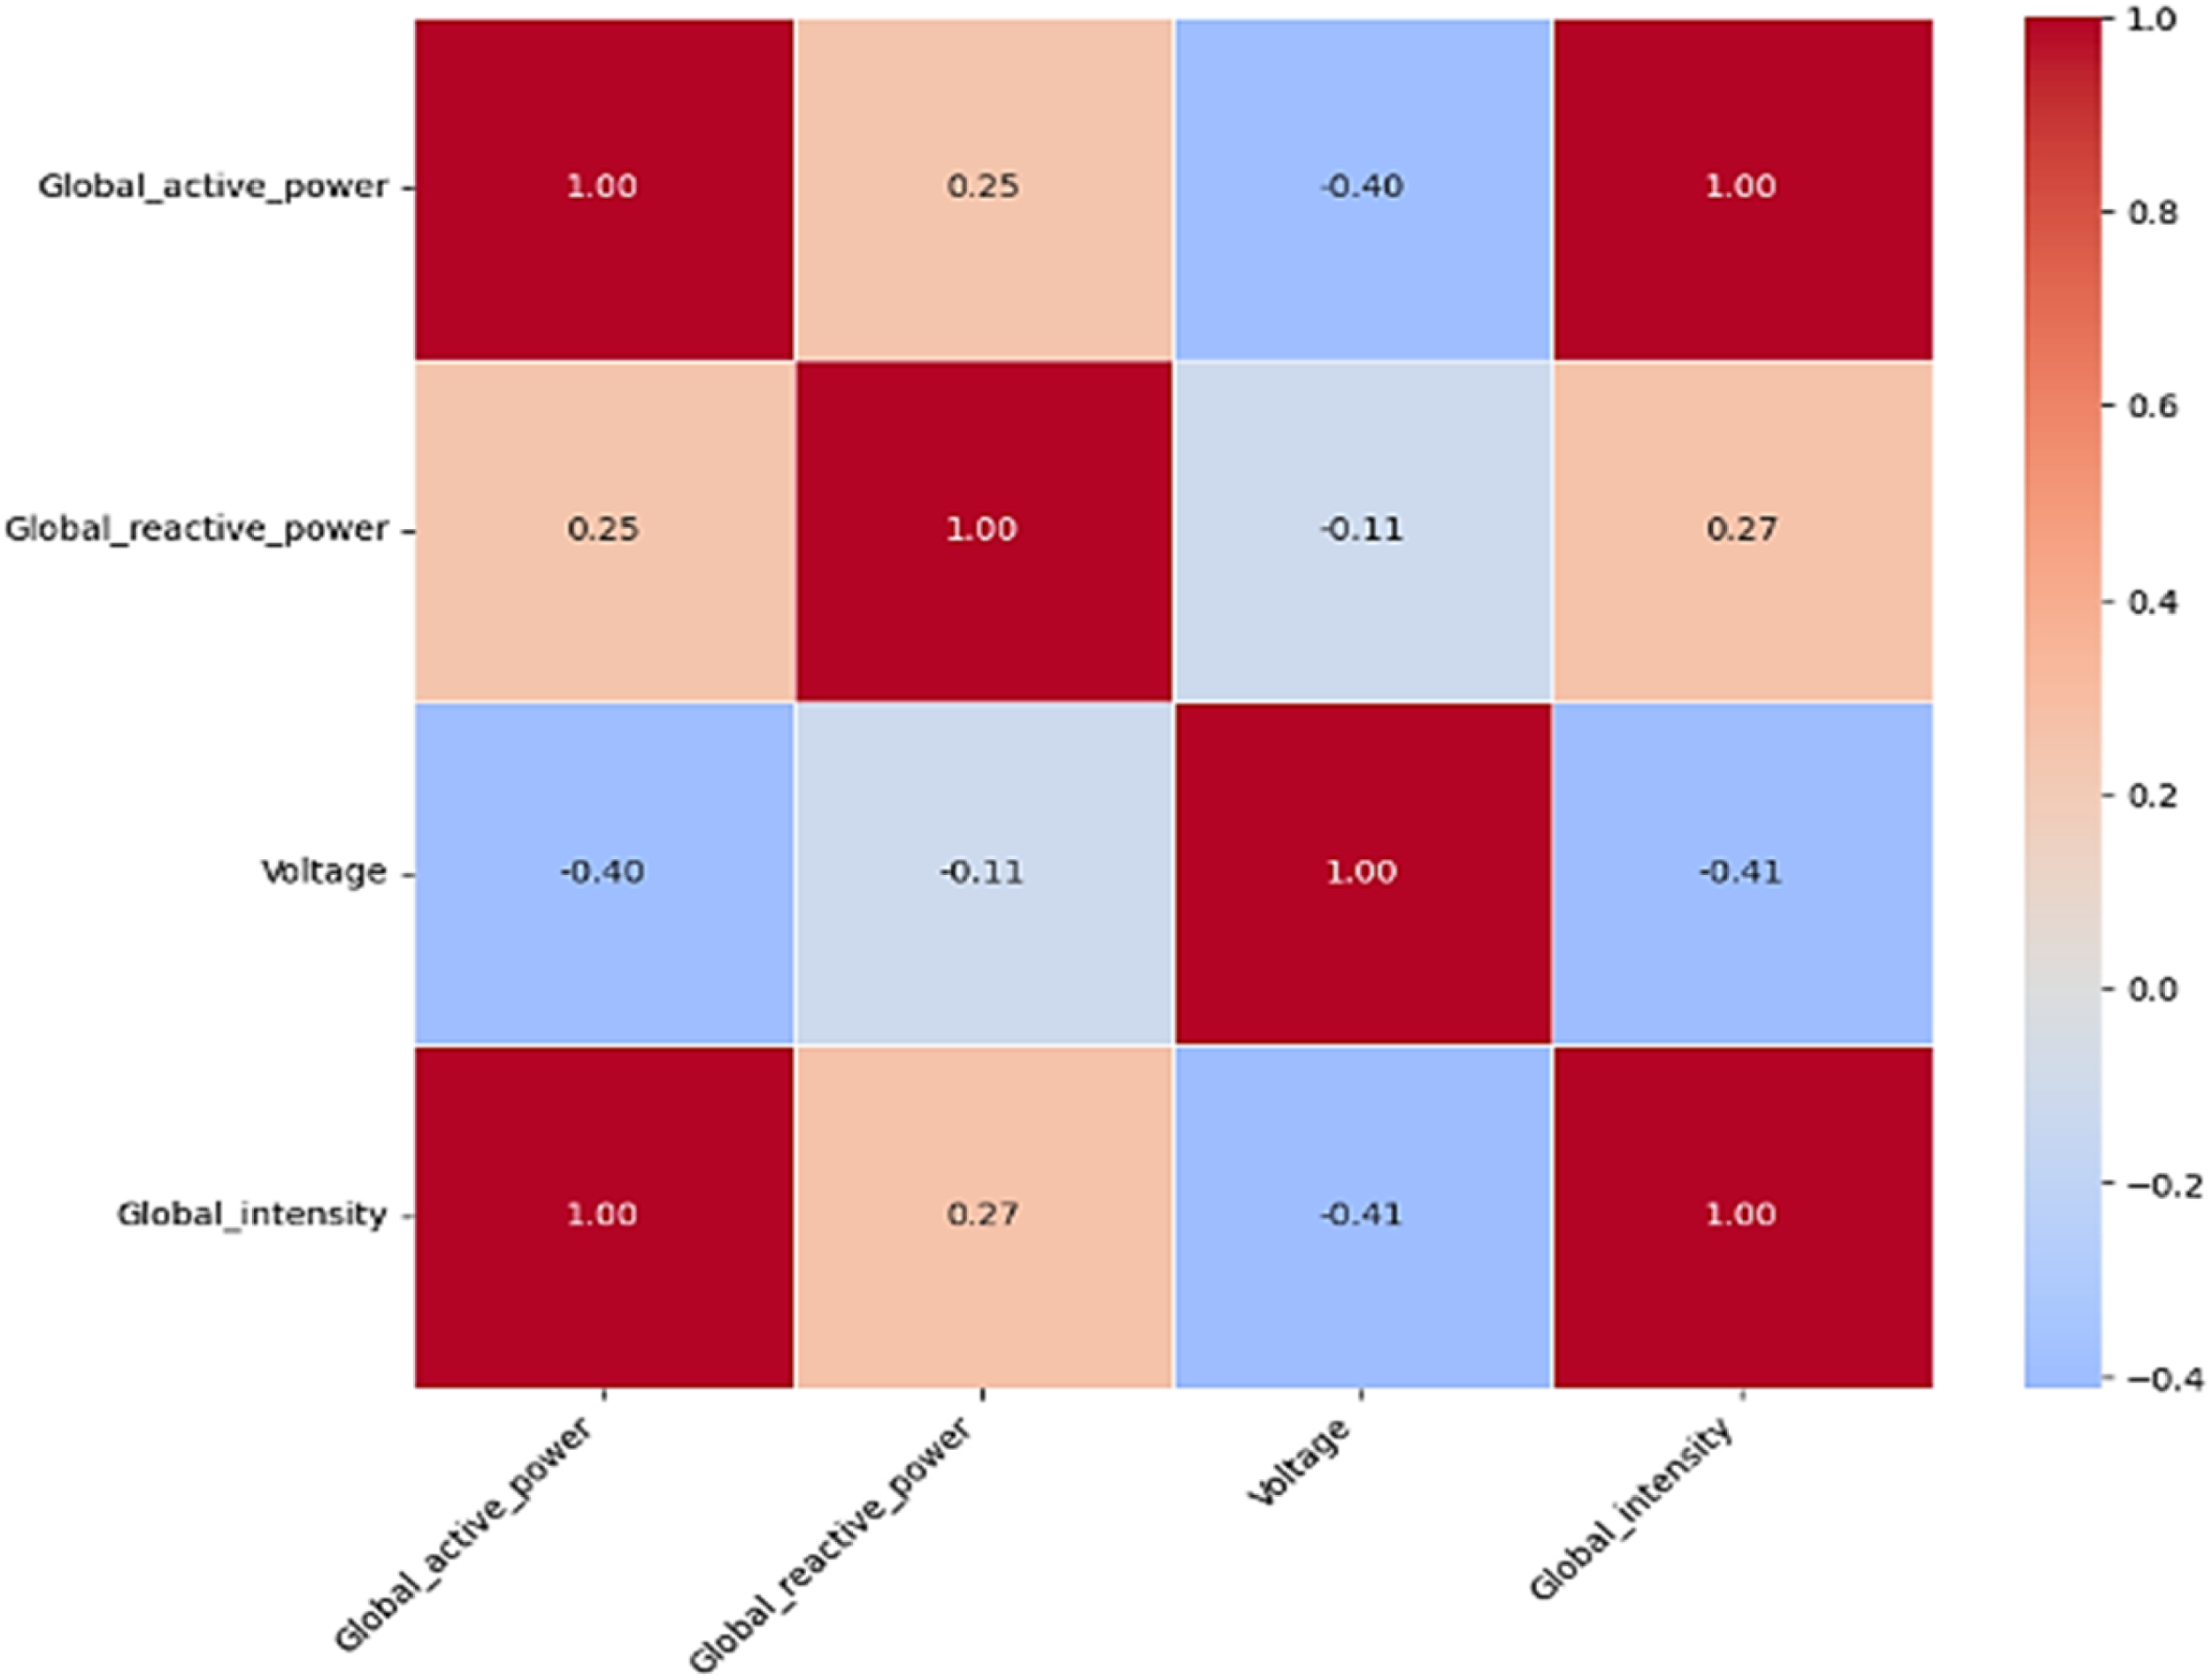
Correlation matrix of the load demand dataset.
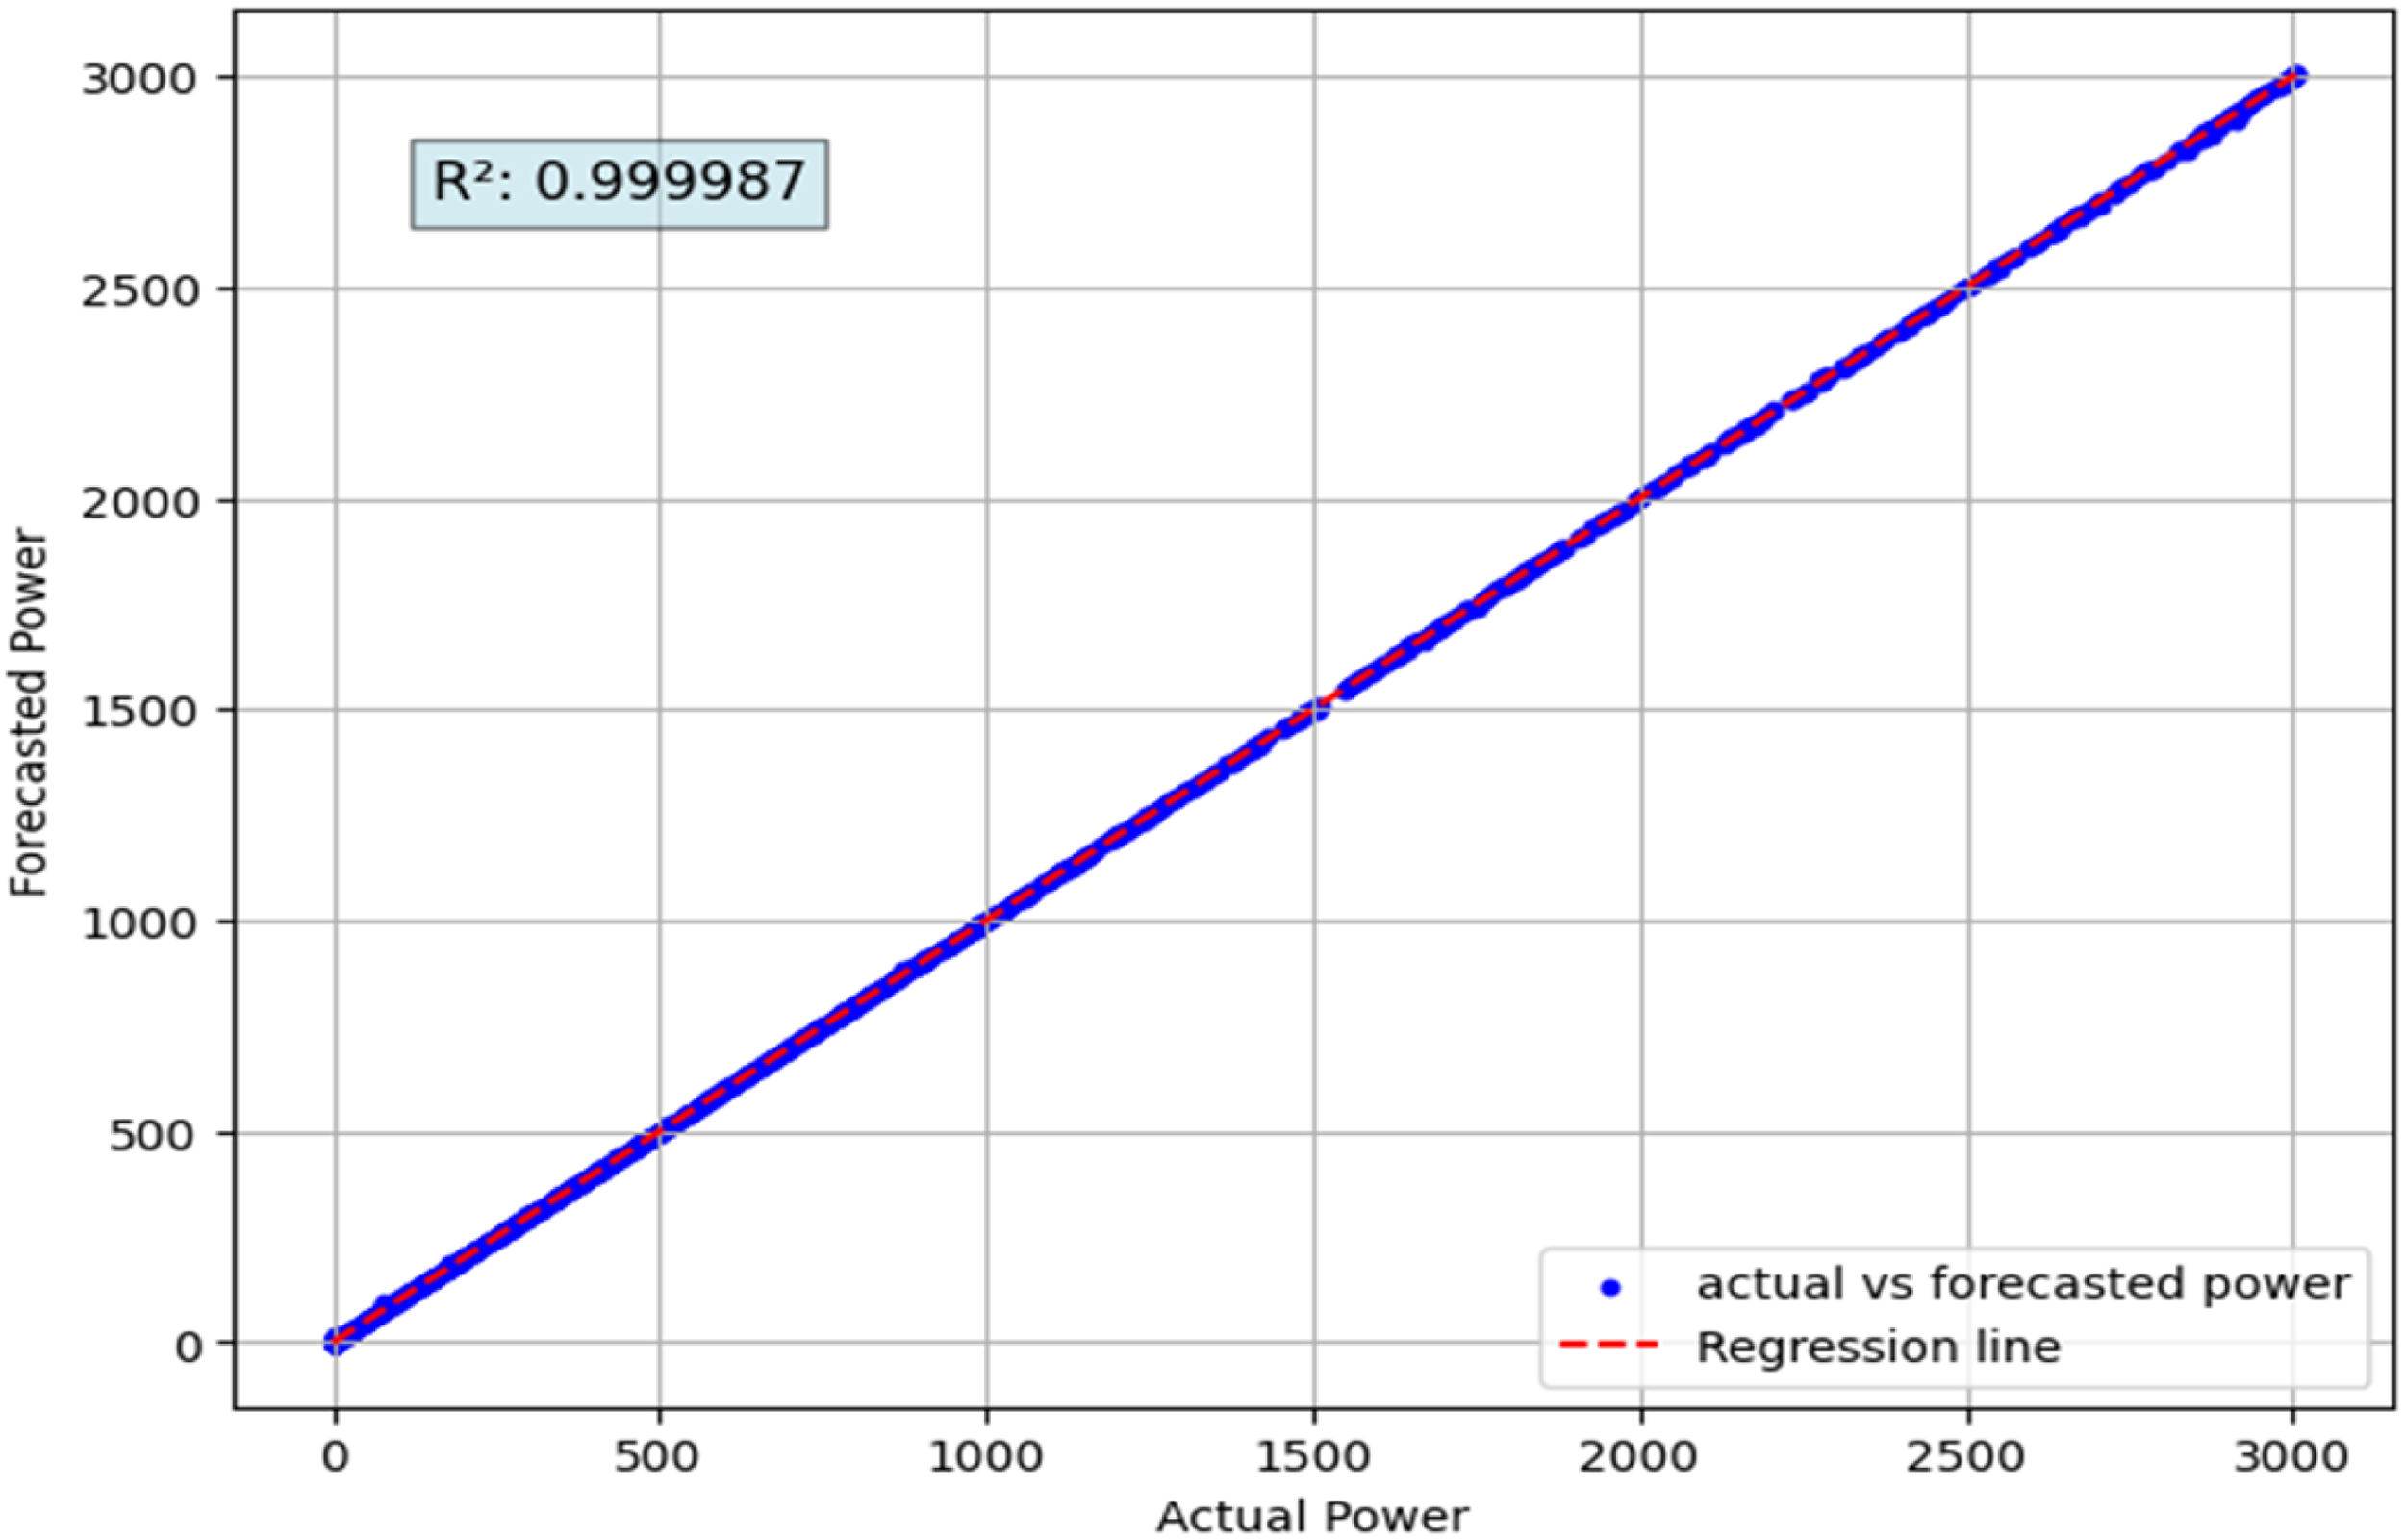
Figure 14 shows a set of data points for comparison of actual wind load demand from test data and the forecasted load demand from the trained RF model, where blue and red colors were used to indicate the actual and forecasted load demand, and Figure 15 shows the actual and forecasted load demand on X and Y axes, respectively, and their regression plot for RF model. Similarly, Figures 16 and 17 display the actual and forecasted load demand and the regression plot of them using the LSTM model.
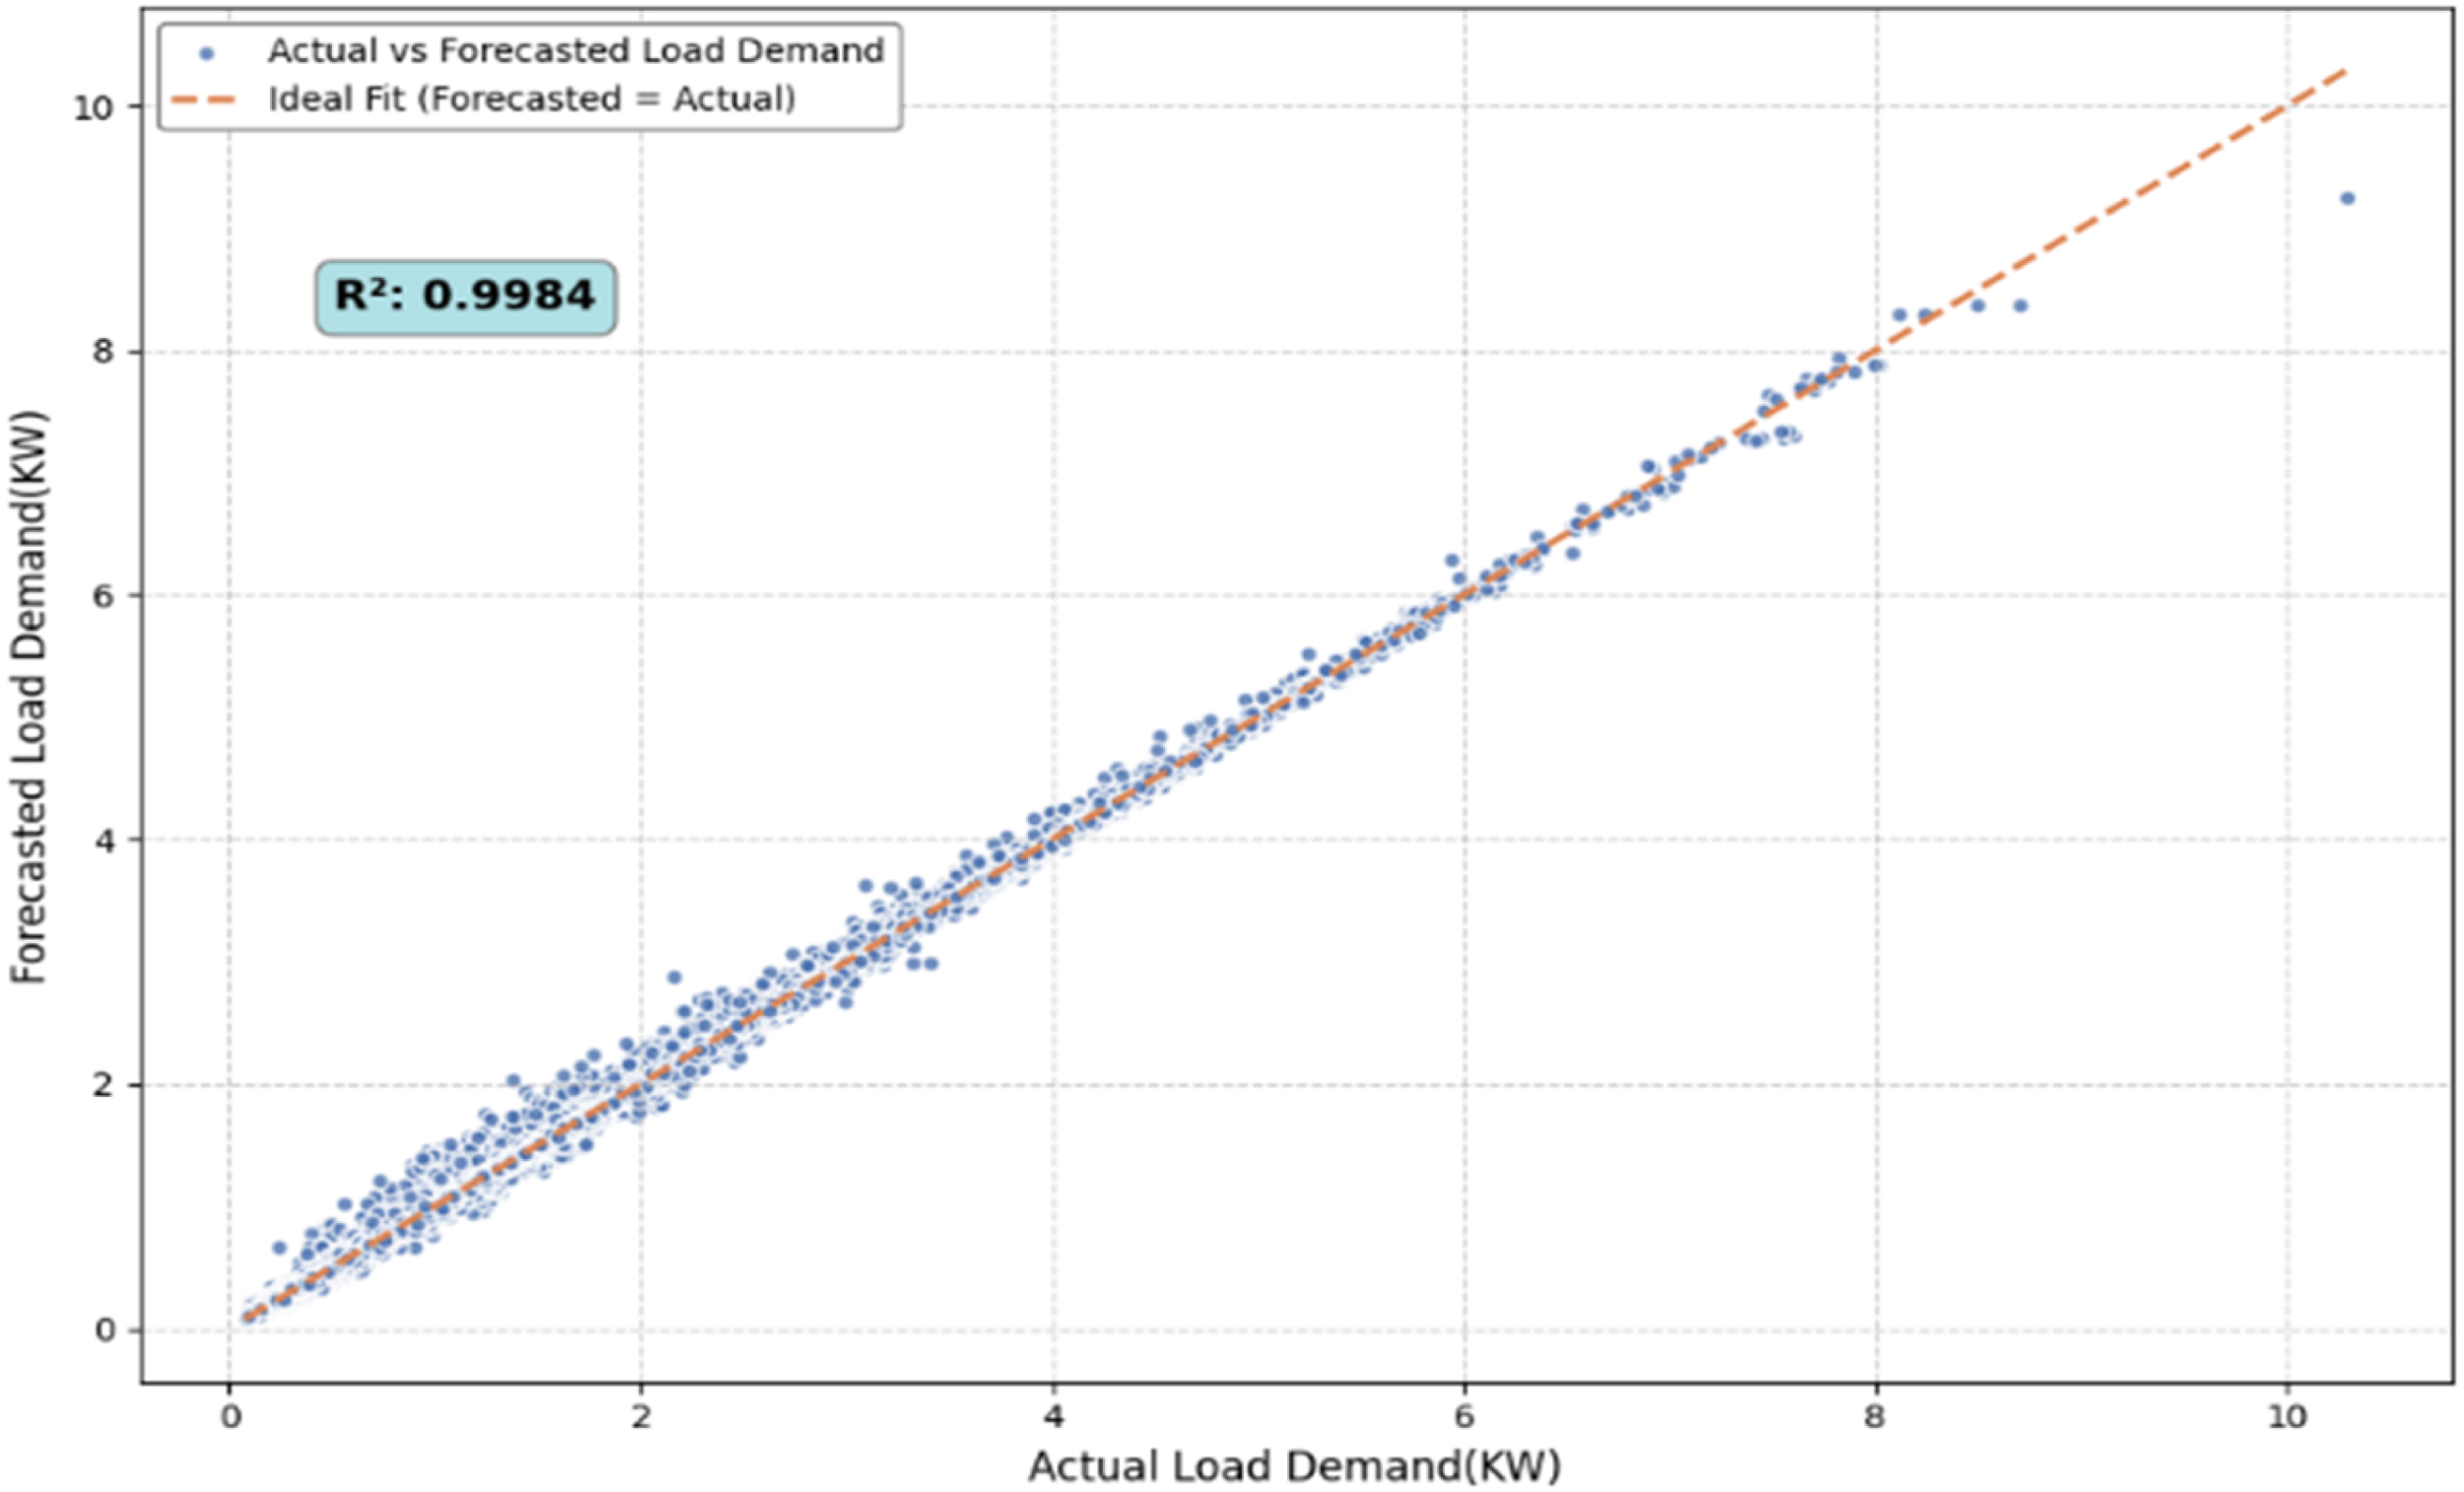
Regression of actual and forecasted load demand by random forest (RF).
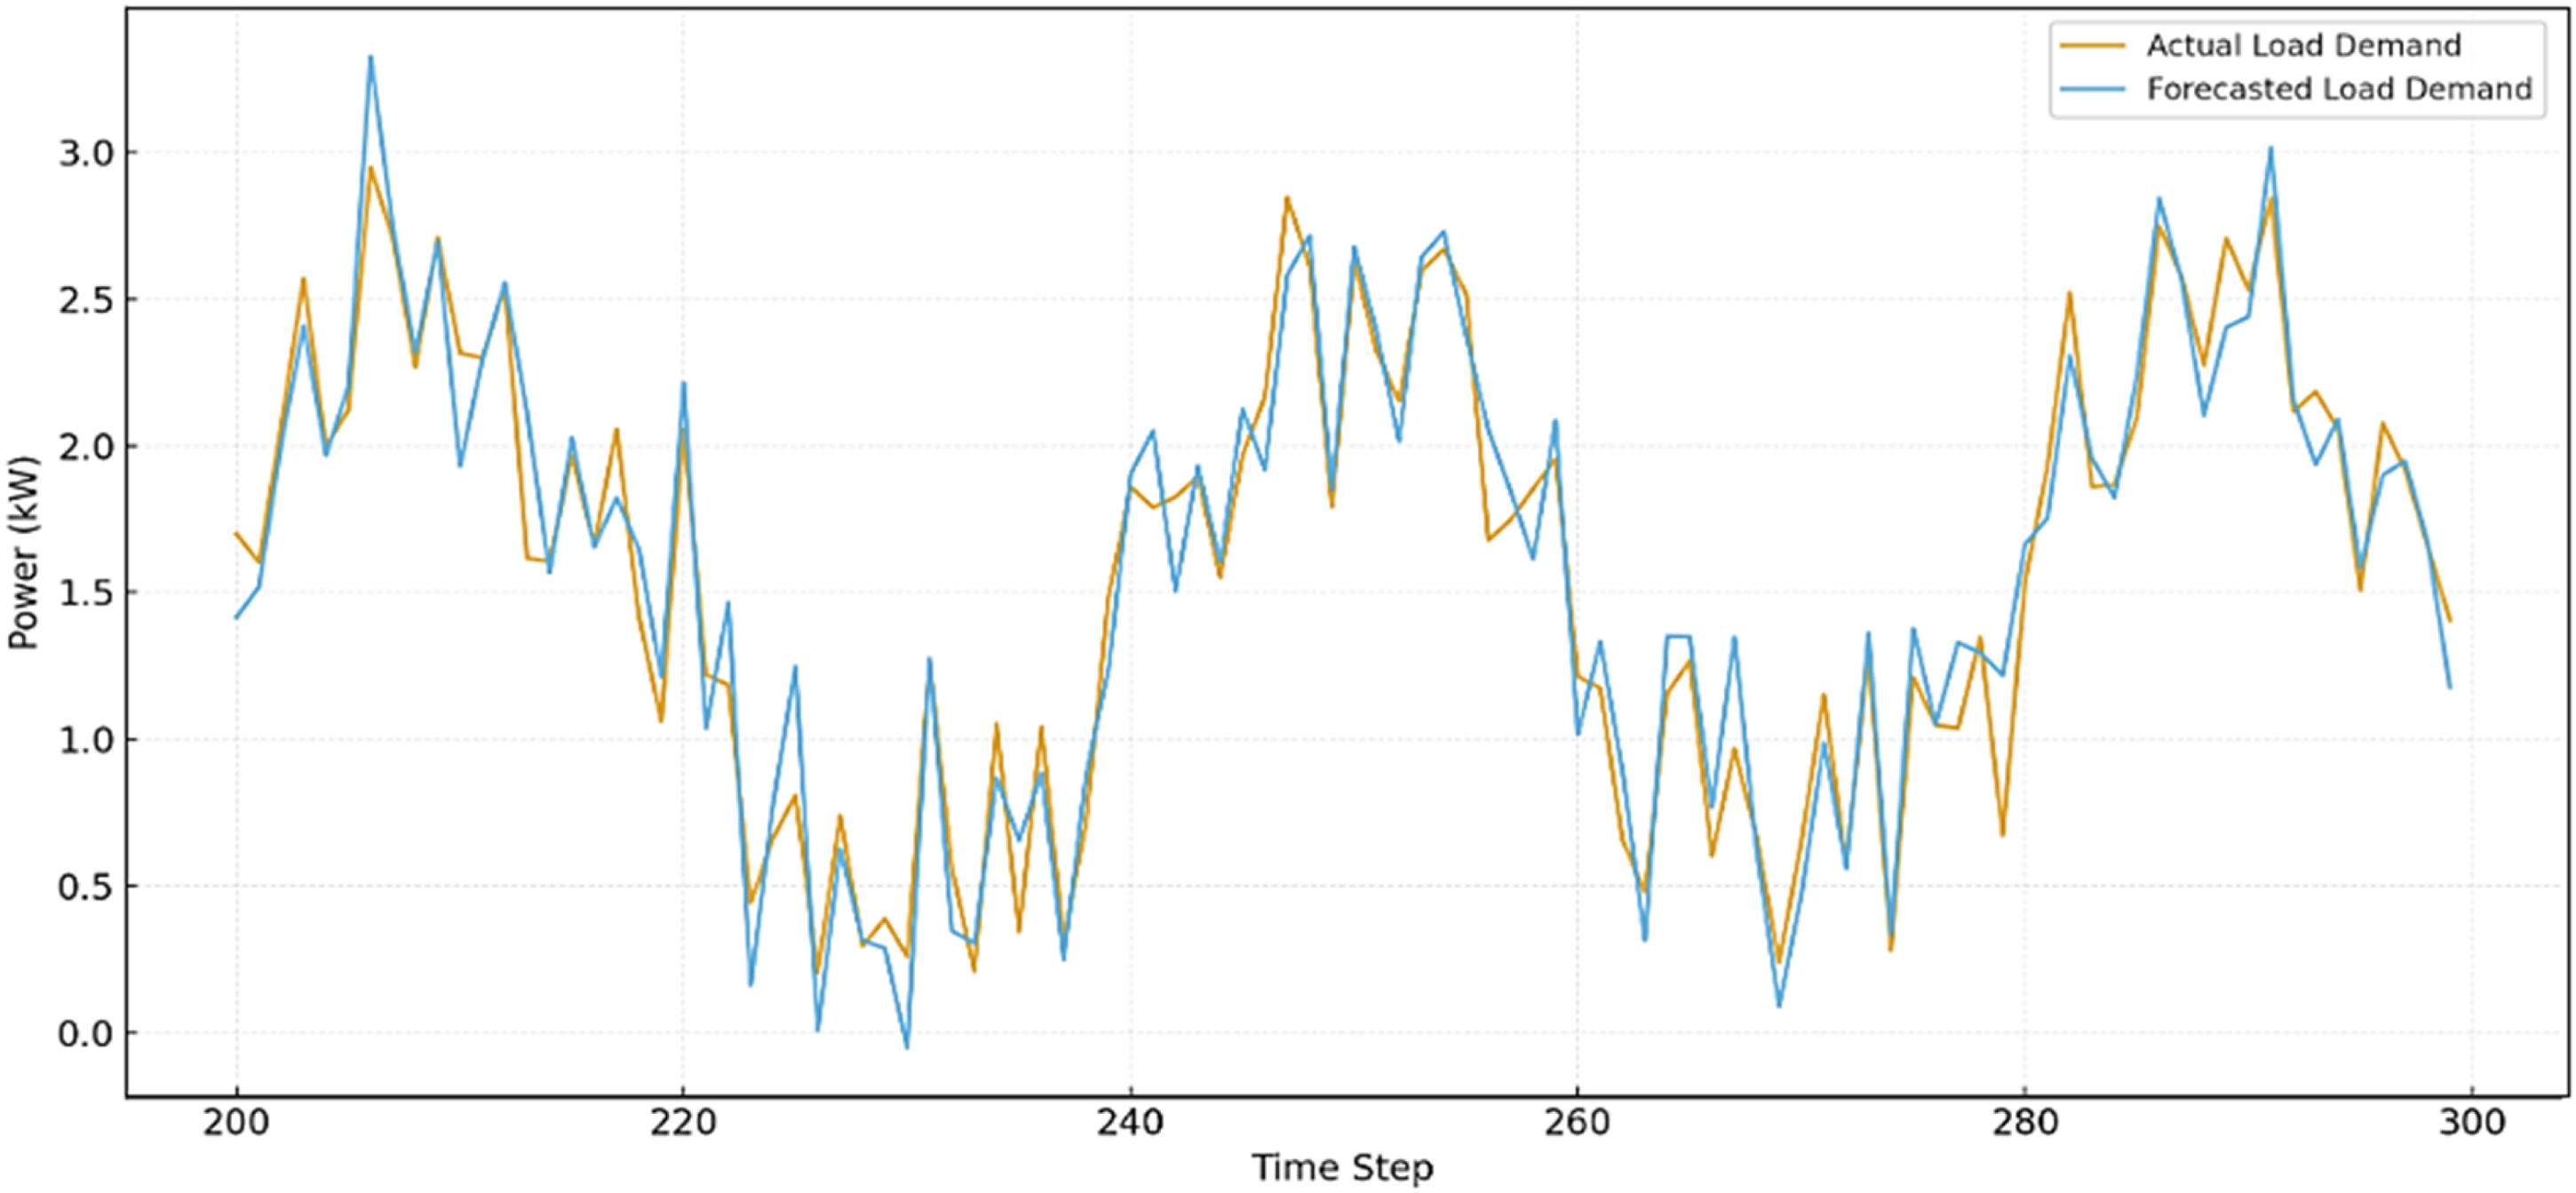
Actual vs forecasted load demand using random forest (RF).
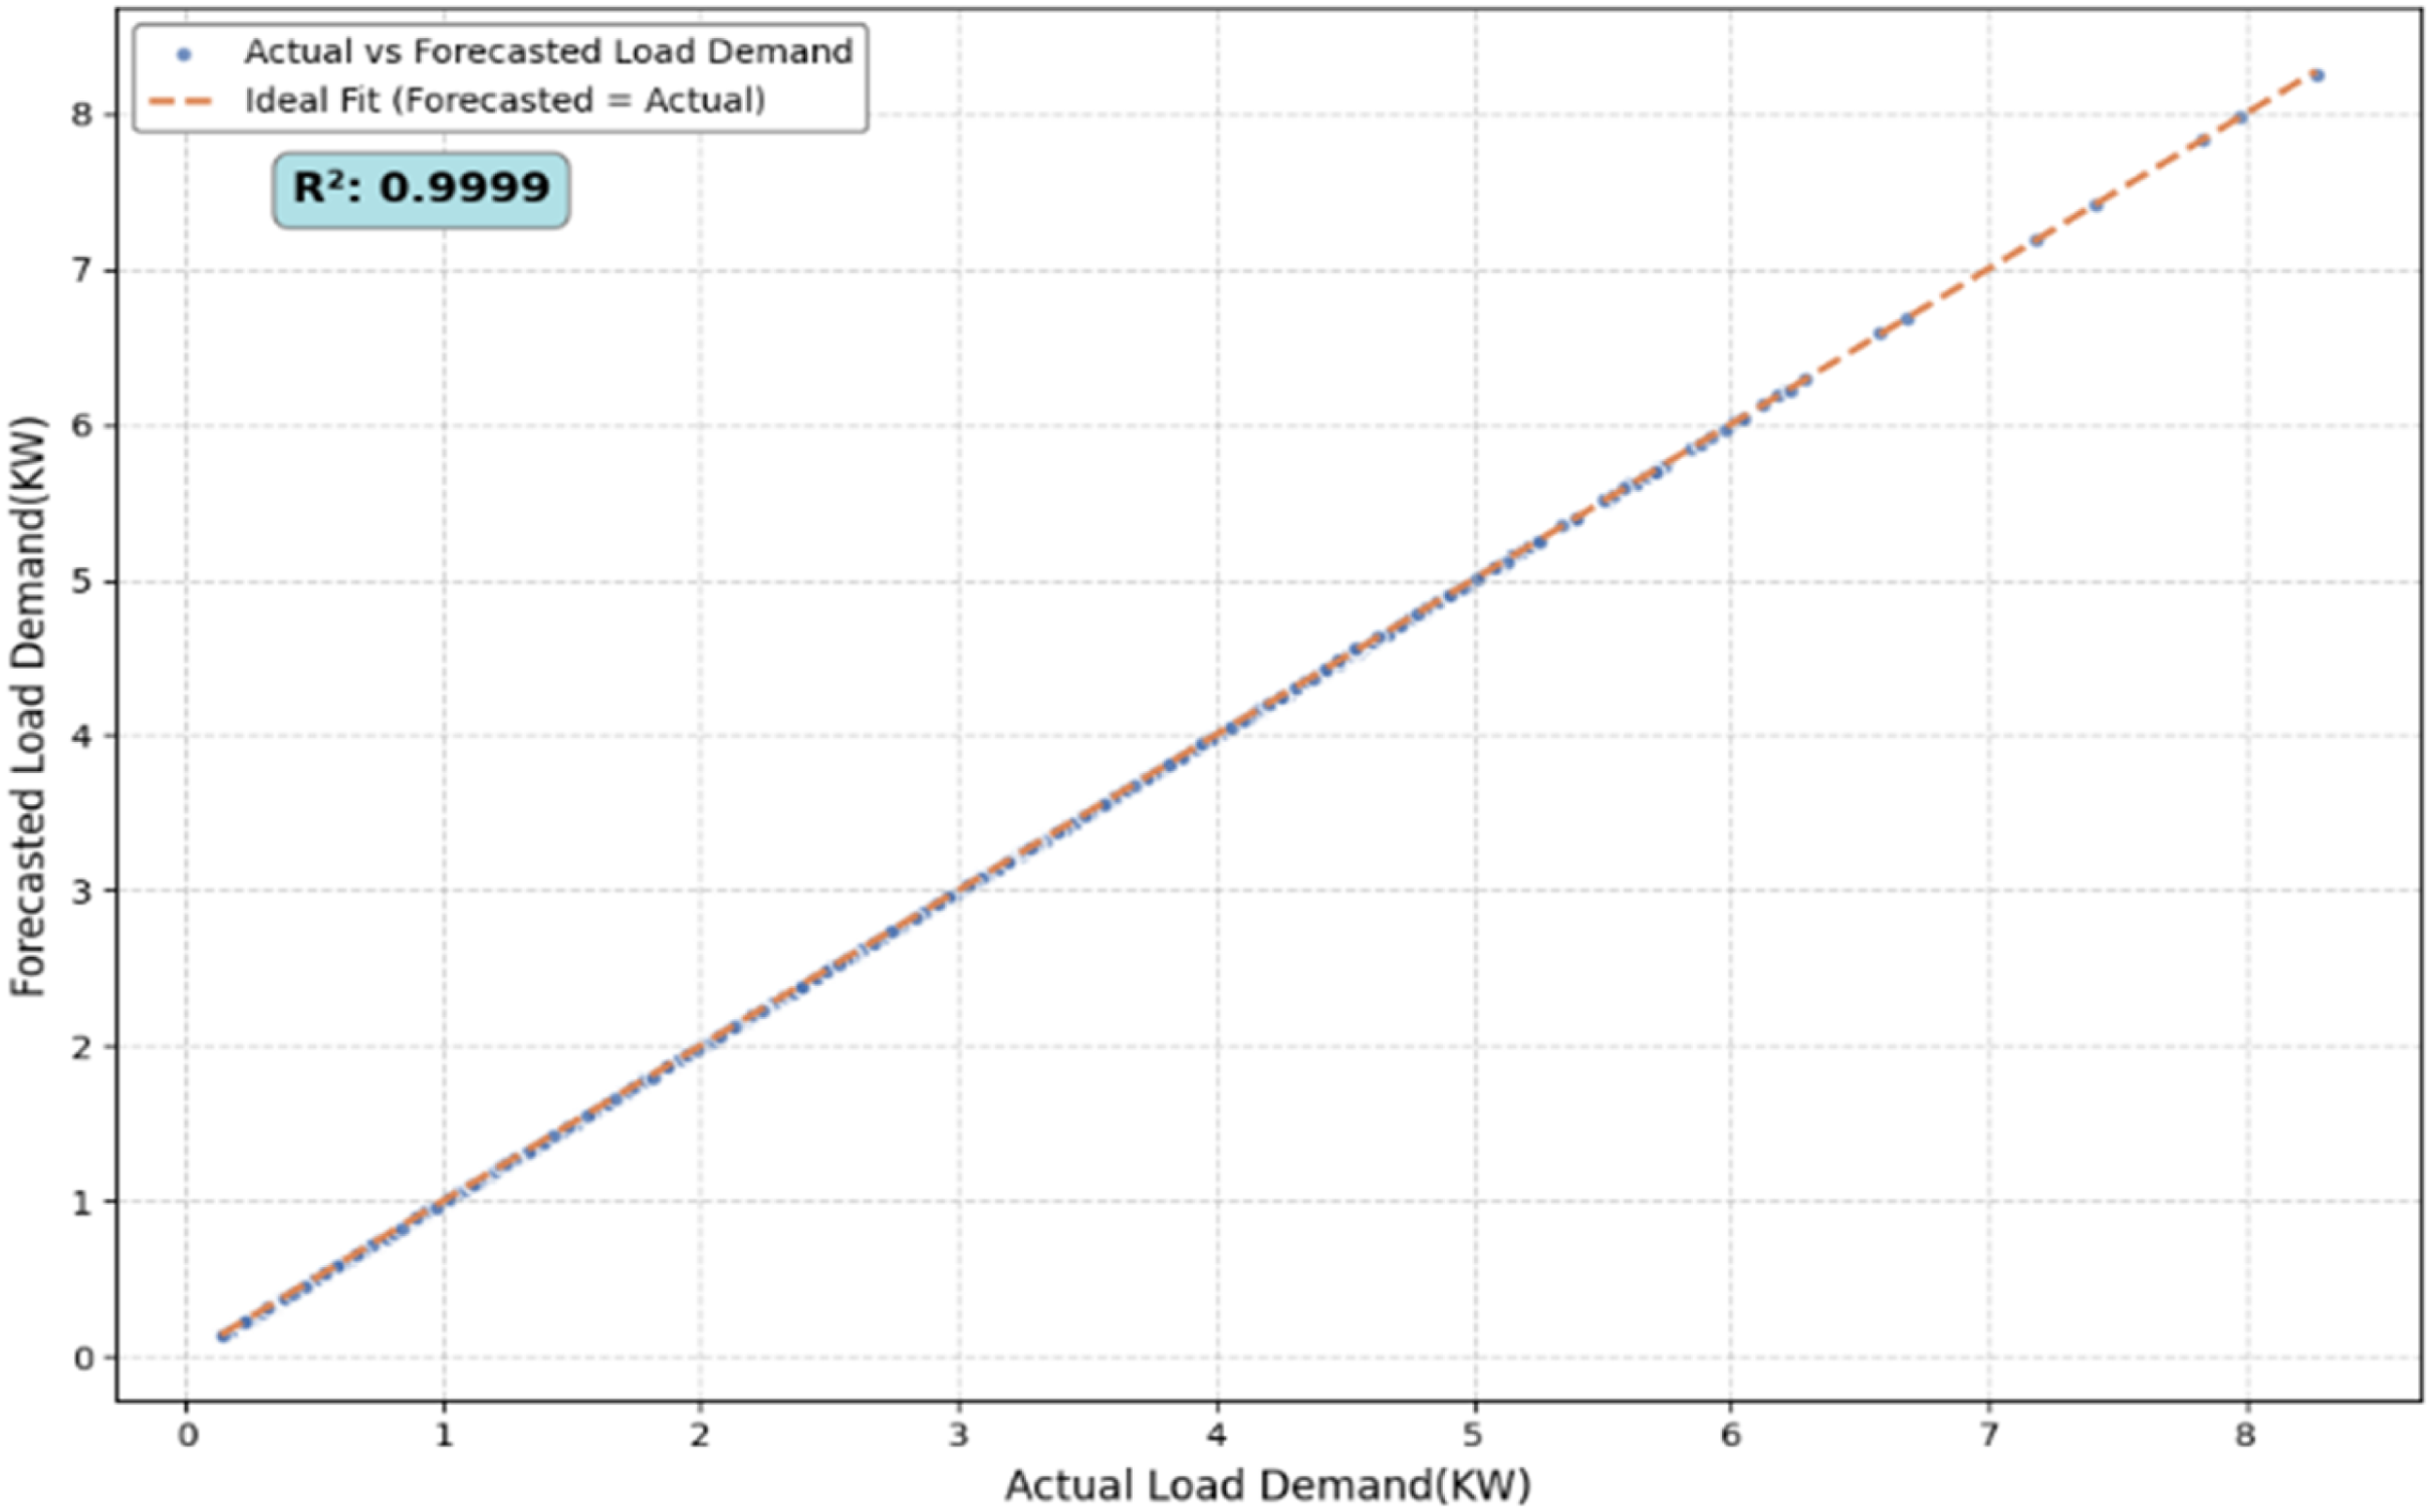
Regression plot of actual and forecasted power demand using long short-term memory (LSTM).
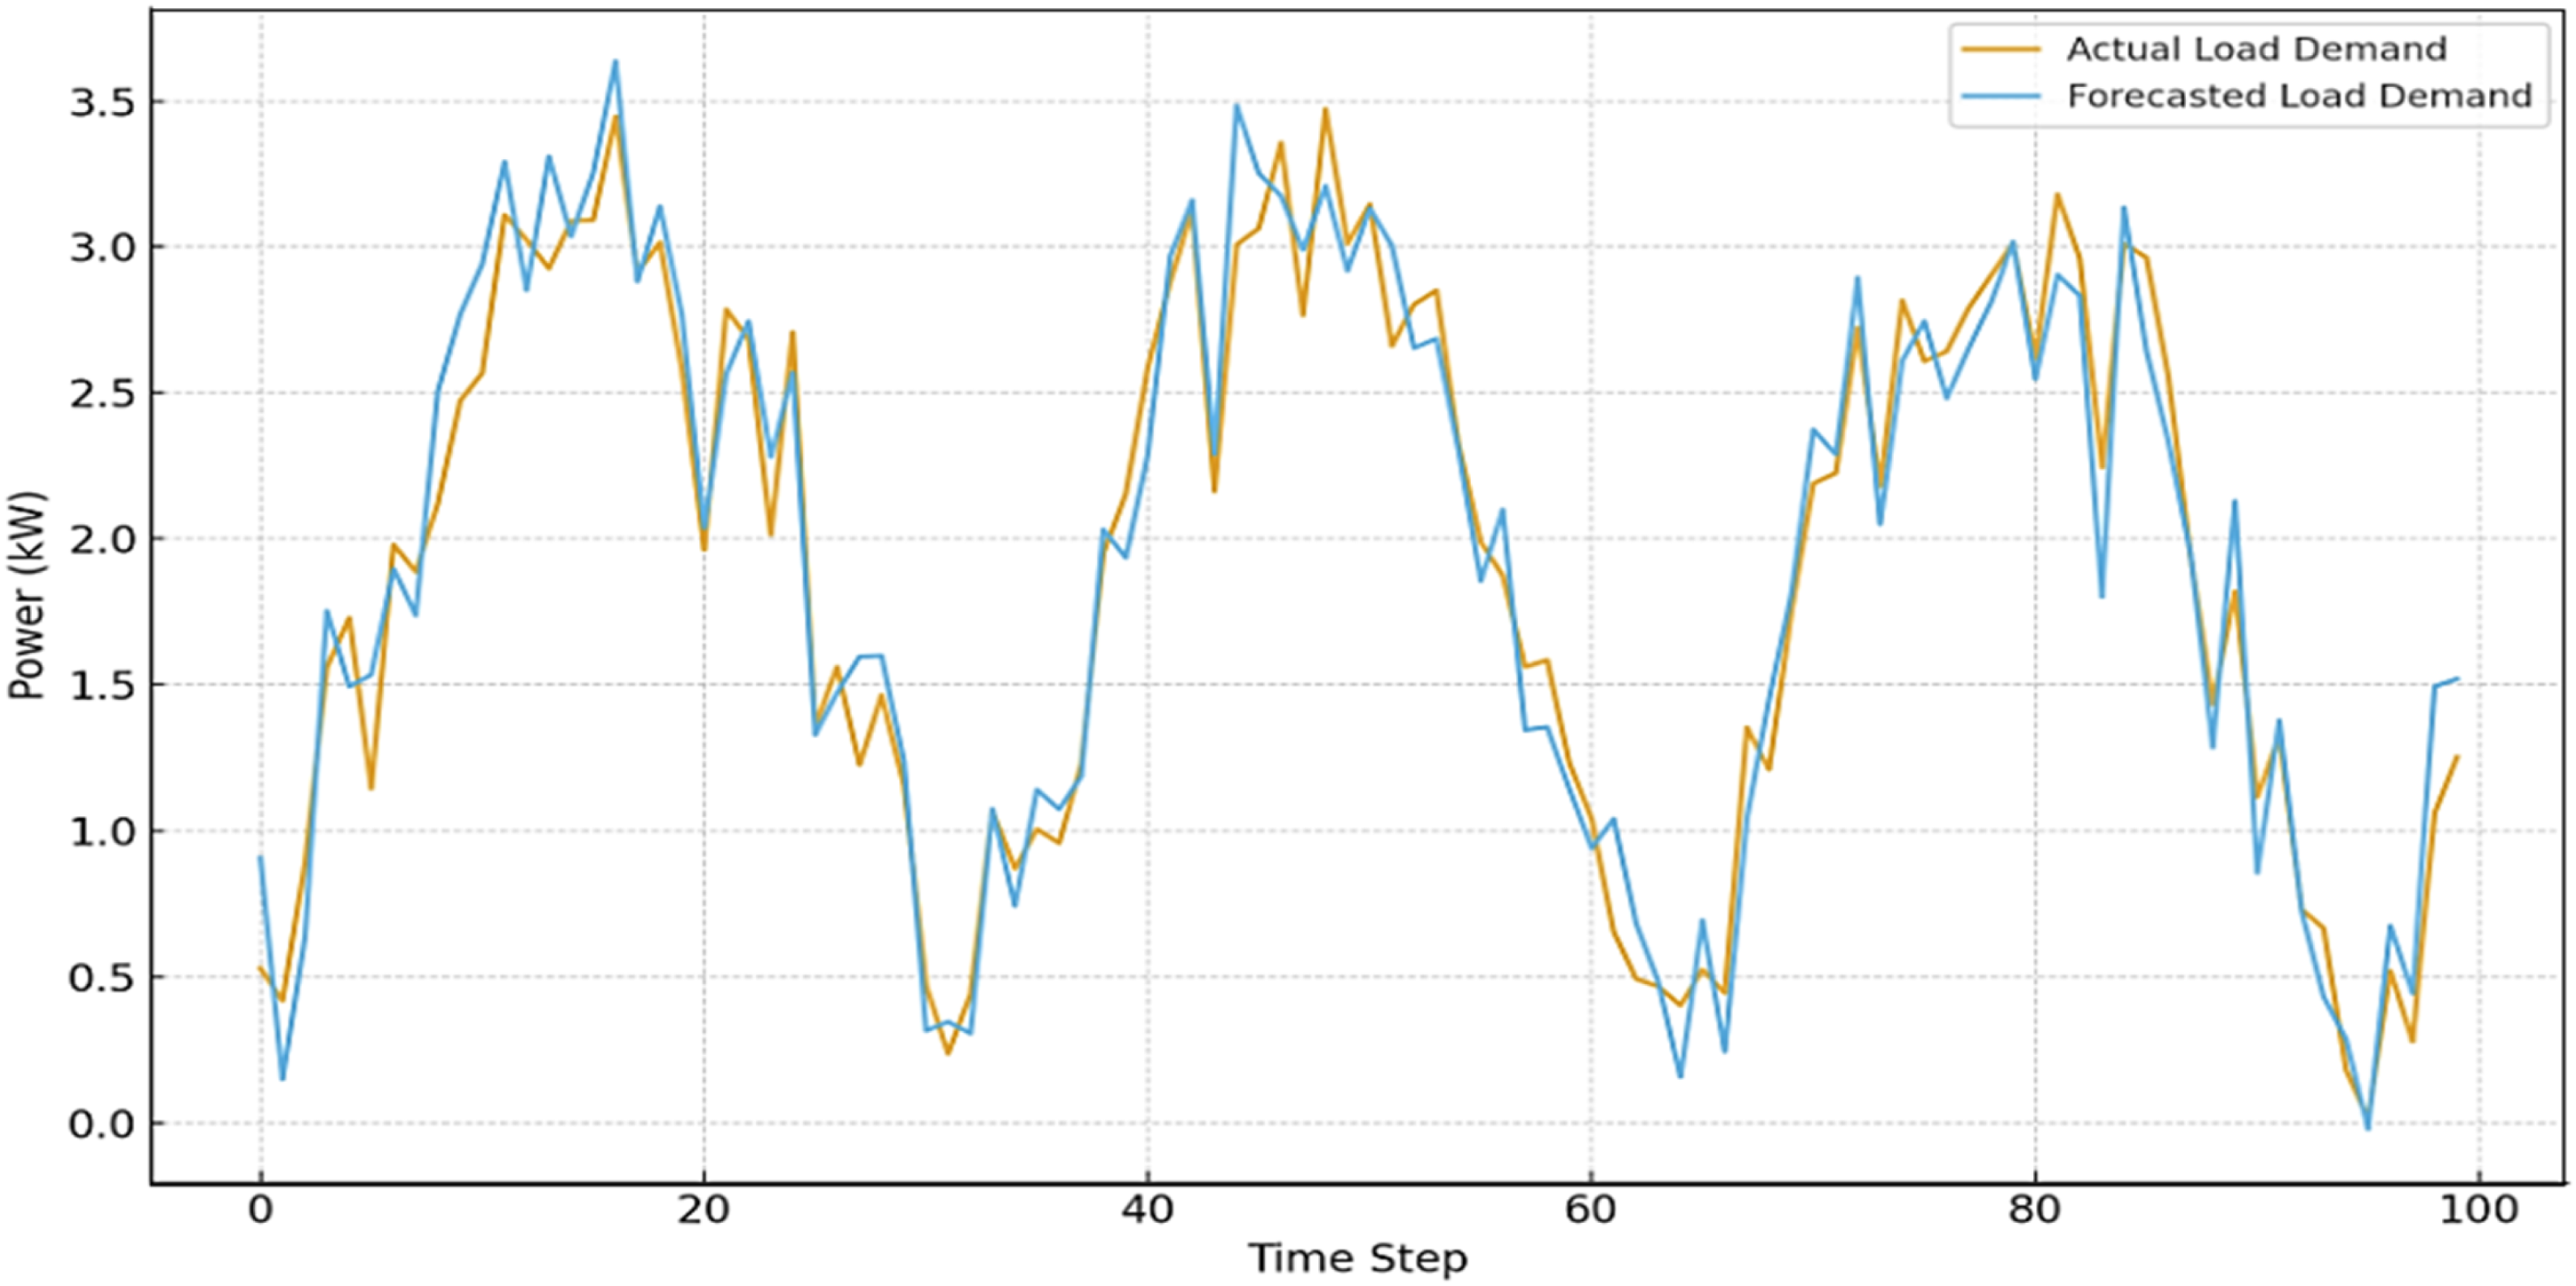
Actual vs forecasted load demand using long short-term memory (LSTM).
Visual similarity of the measured to the forecasted outputs in Figures 14 to 17 illustrates that the LSTM used prediction framework worked very well with excellent precision. And the forecasts are an accurate representation of real variances since the system is trained on well-curated data and multiple training epochs to model interdependencies in time. A feature of early stopping allowed model training to stop only at the most important time while maintaining generalization. The predictive power of this model is also confirmed by performance-based indices such as near-zero error levels and R2 near 1.0. Indeed, while there is a small trade-off with precision on operational field usage, where there is no mitigation for changes in weather and sensor noise, these results illustrate the system's robustness and suggest that model holds promise for accurate and stable meteorological inputs.
The choice of hyperparameters for the LSTM and WOA was made by weighing prediction accuracy, convergence rate, and computational power. The number of layers, number of neurons per layer, learning rate, and batch size were optimized through cyclical experimentation based on validation loss. The selected configuration provides depth in the model to encapsulate long-term temporal dependencies in wind speed profiles, avoiding overfitting. Based upon pre-empirical experiments and previous experiments, the WOA hyperparameters, such as population size, maximum iterations, and convergence coefficients, were included in the exploration-exploitation balance parameters of the analysis WOA. This combination achieves stable convergence towards the global optimum while accounting for the nonlinear, nonconvex nature of the OPF problem with minimal perturbation. We therefore have set up settings to ensure a sound trade-off between computational cost and optimization efficiency.
Results and discussion
The main goal of this research is to optimize the total system profit of Japan's power grid when it is connected to the WF. The inclusion of WFs brings with it operational uncertainty because of the stochastic nature of wind generation, mainly from errors between actual and predicted wind speeds. The work is organized into two broad sections:
For both methods, three different optimization algorithms, that is, WOA, AZO, and SQP, are used to identify the most optimal strategy for reducing imbalance costs and maximizing grid profitability.
Imbalance cost evaluation using historical wind data
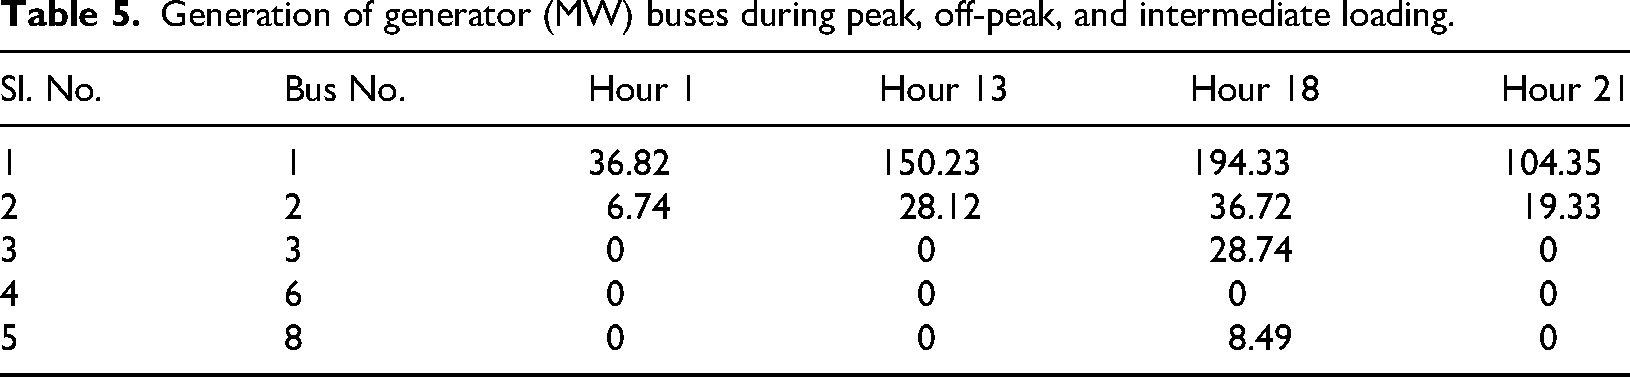
The OPF solution plays an important role in measuring the economic parameters as well as the system stability parameters while maintaining the considered objective functions. Table 5 shows the optimal generation at the generator buses for the peak, off-peak, and intermediate loading conditions. It is noted that the generator at bus 6 is not loaded, and the generators at bus 3 and 8 were loaded only during the peak load to meet the demand. The peak load on the system in this case is 259 MW, the off-peak load of 43.17 MW, and the intermediate loading conditions are 172.66 and 120.86 MW, respectively. This load situation has developed using the Load Scaling Factor, which is mentioned in Figure 4.
Without WF placement
Generation of generator (MW) buses during peak, off-peak, and intermediate loading.
The LMP at all the generator buses for the above-mentioned loading conditions is shown in Figure 18. The LMP increases with increasing load on the system, with the highest LMP of 41.2 $/MWh at bus 14 during peak loading and the lowest of 23.2 $/MWh at bus 1 during off-peak loading. These variations are due to increasing congestion on the transmission line and line losses. The Profits of the system, which is the sum of profits at all the generators for an entire 24-h day, are shown in Figure 19. The hourly distribution of profit showcases significant variations influenced by factors such as energy demand. The data reveals a general trend where profits tend to be lower during the early hours of the day, gradually increasing during the morning, and peaking during the late afternoon and early evening. The graph for profits closely resembles the scaling factor curve considered in Figure 4, due to variations in LMP for varying load conditions. The highest profit in the system is 1970.8 $ at 18 th hour when the peak load occurred, and the lowest is 69.64 $ during off-peak load.
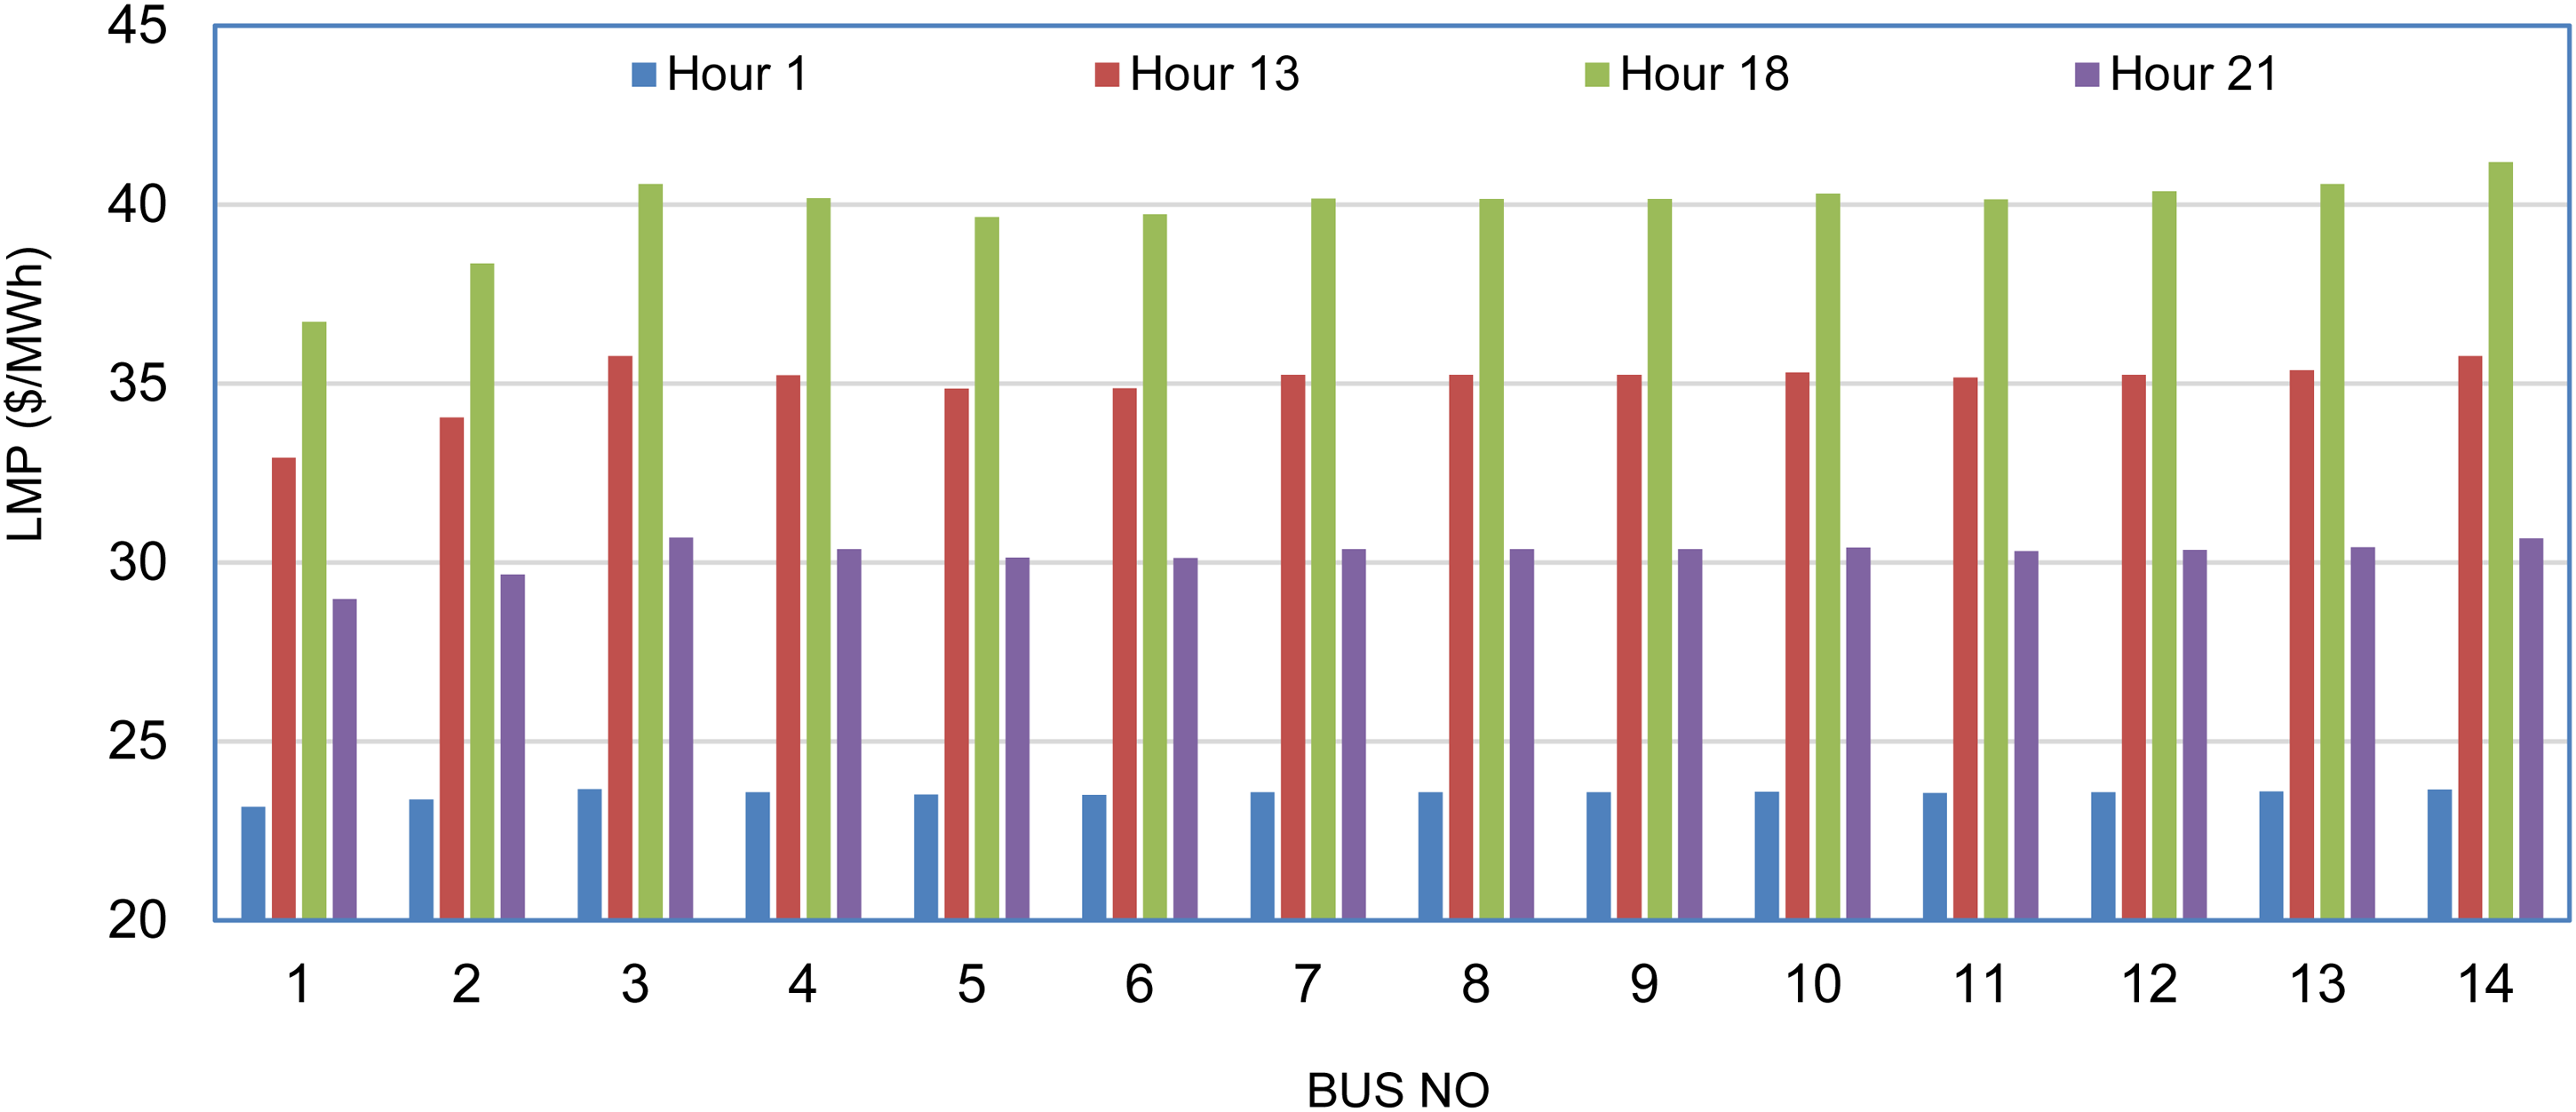
Locational marginal price ($/h) for 14-bus systems using sequential quadratic programing (SQP) without wind power.
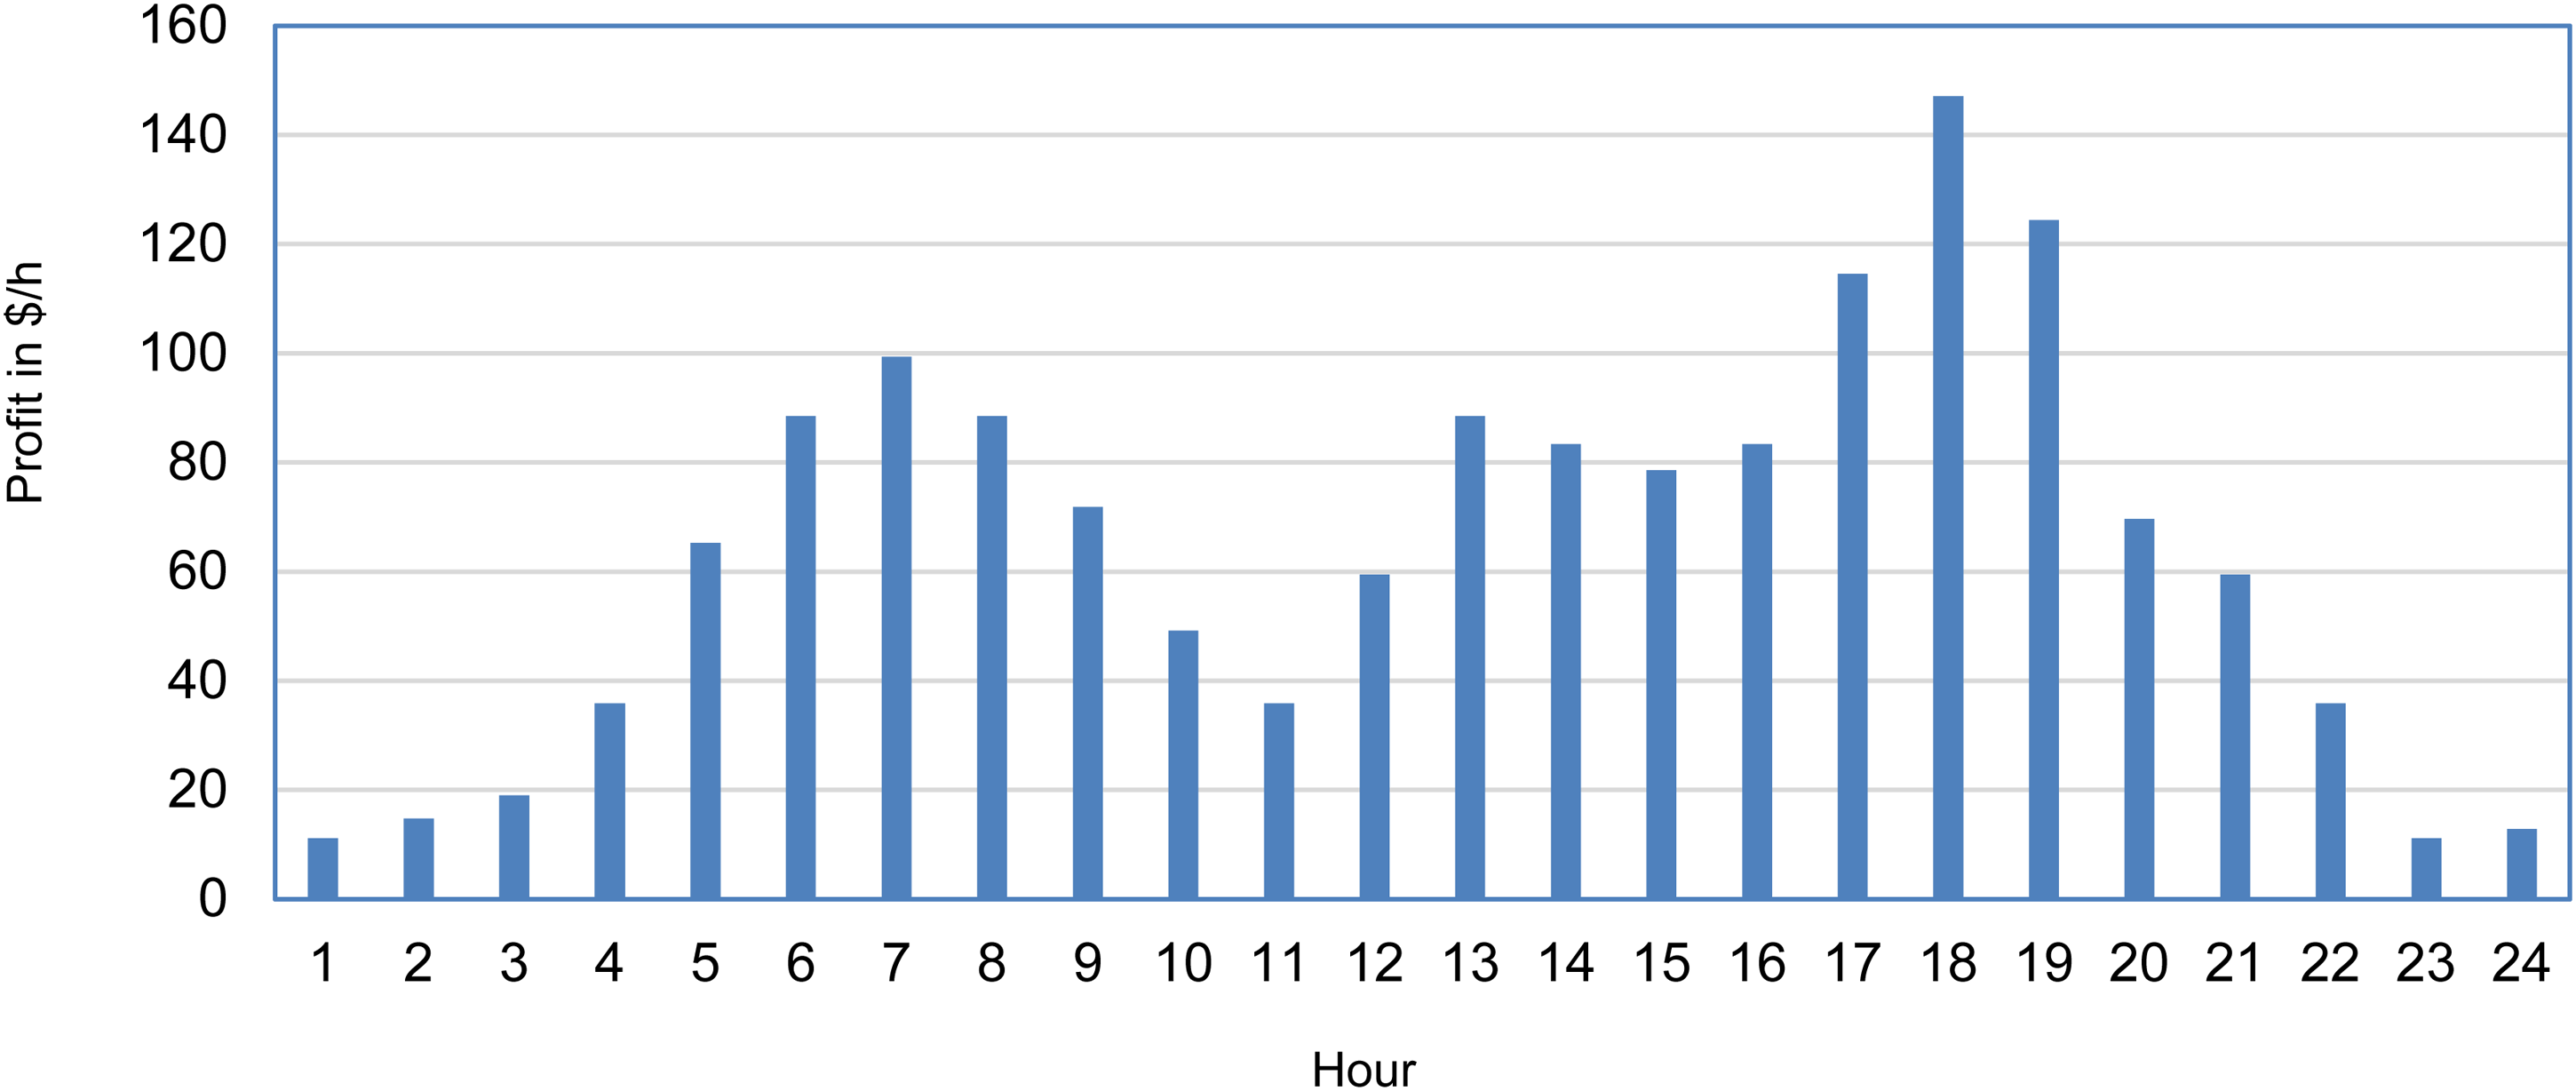
Profit at every hour without wind power integration.
Figure 20 represents the voltage magnitudes at every bus during peak, off-peak, and intermediate loading in the 14-bus system. It can be observed that voltage levels are within the specified constraints and are relatively stable under all loading conditions, where a slight voltage drop is observed during the peak load. Also, generator buses are maintained at voltages close to 1 pu during no load and increased during loaded conditions to adjust for voltage drops and to maintain a stable voltage during loaded conditions.
With WF placement
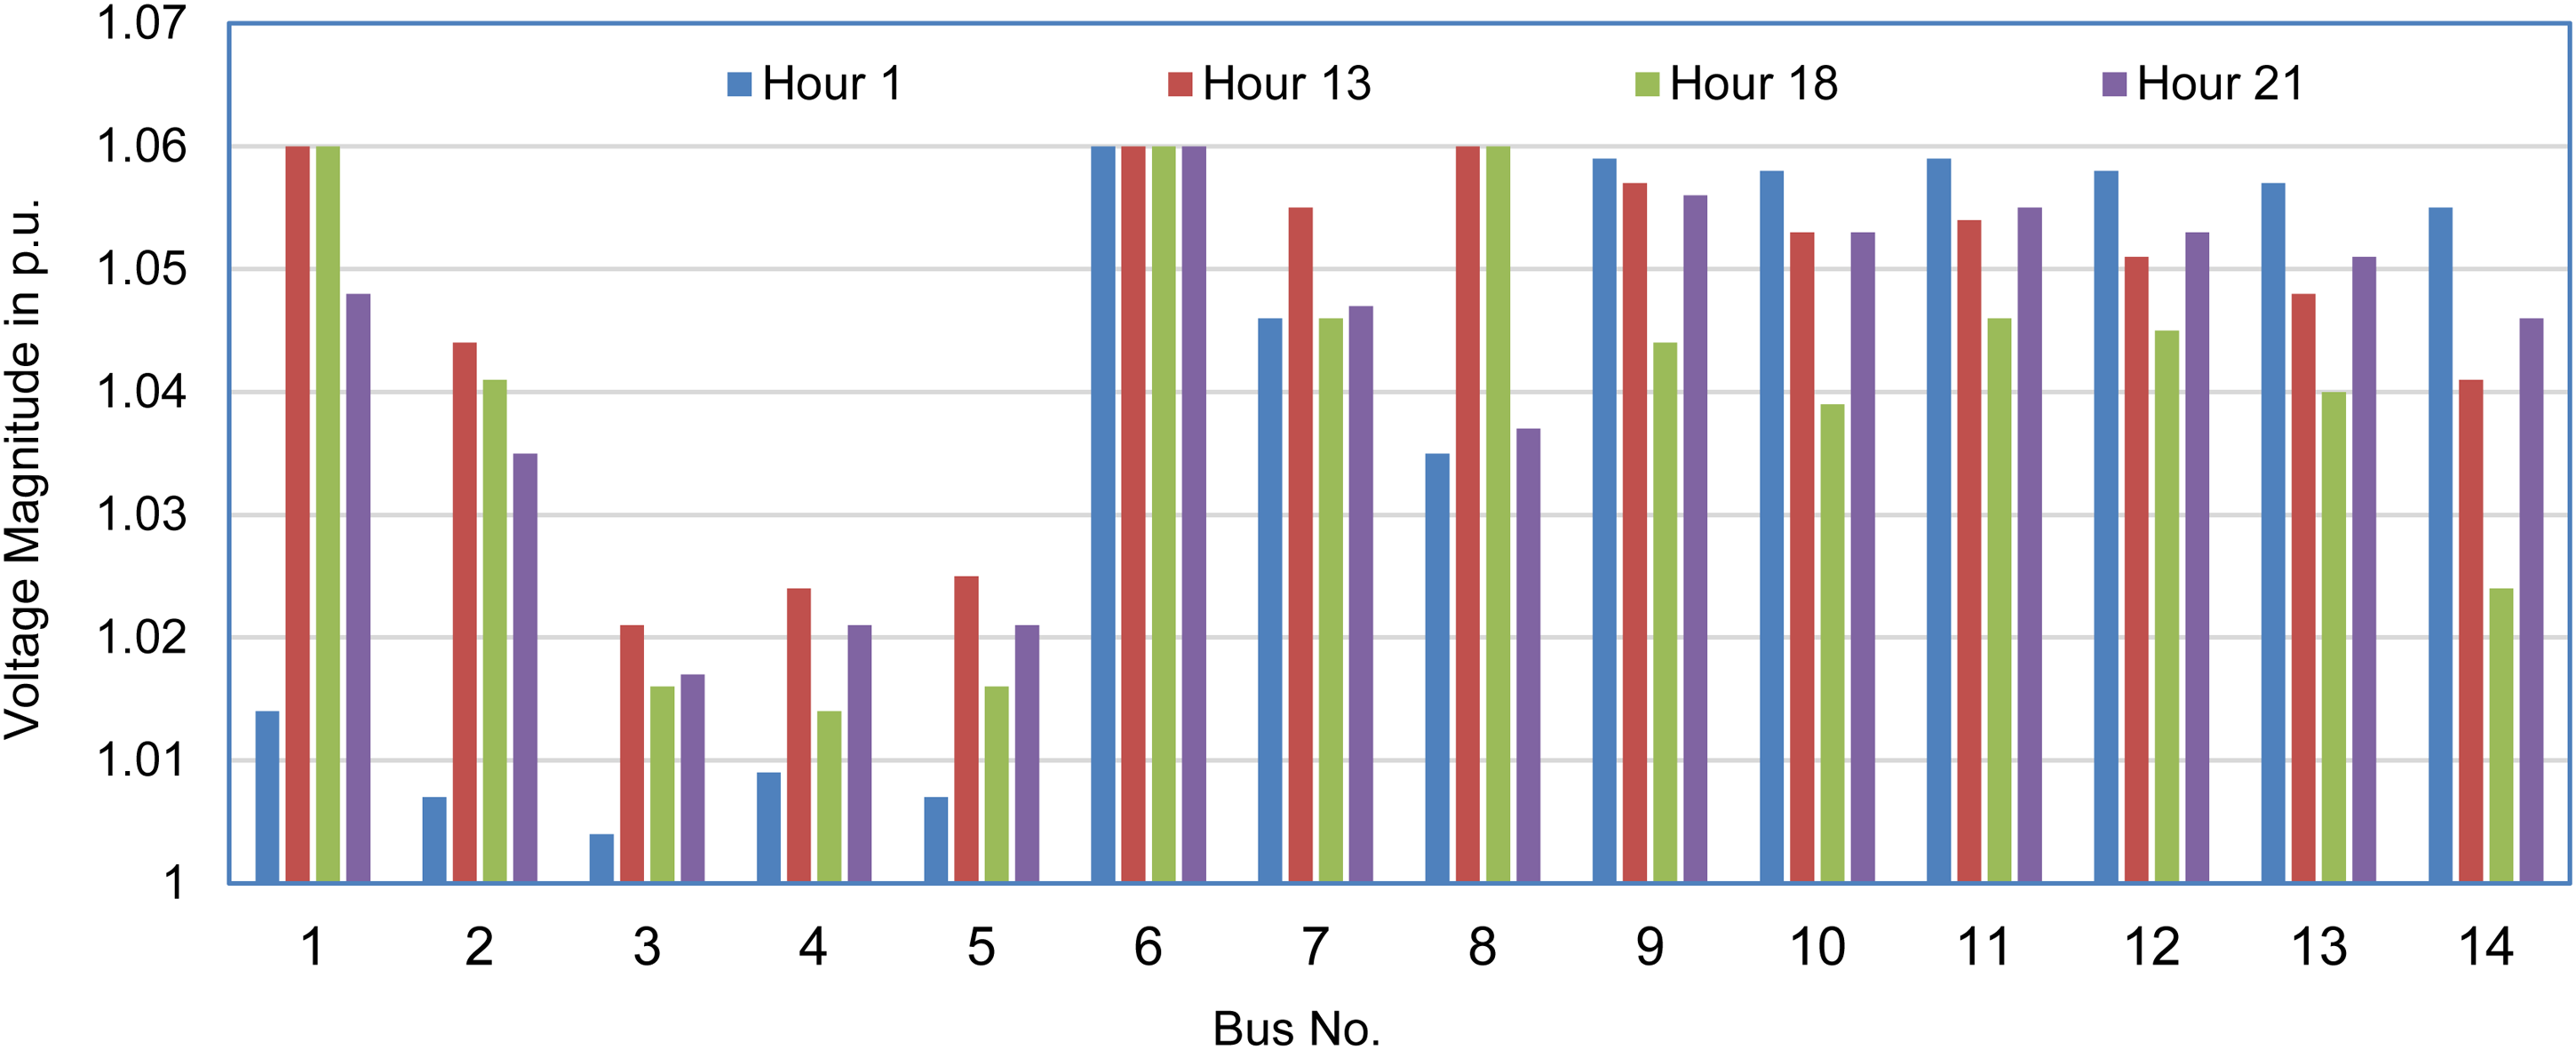
Voltage per unit for 14-bus systems without wind power integration.
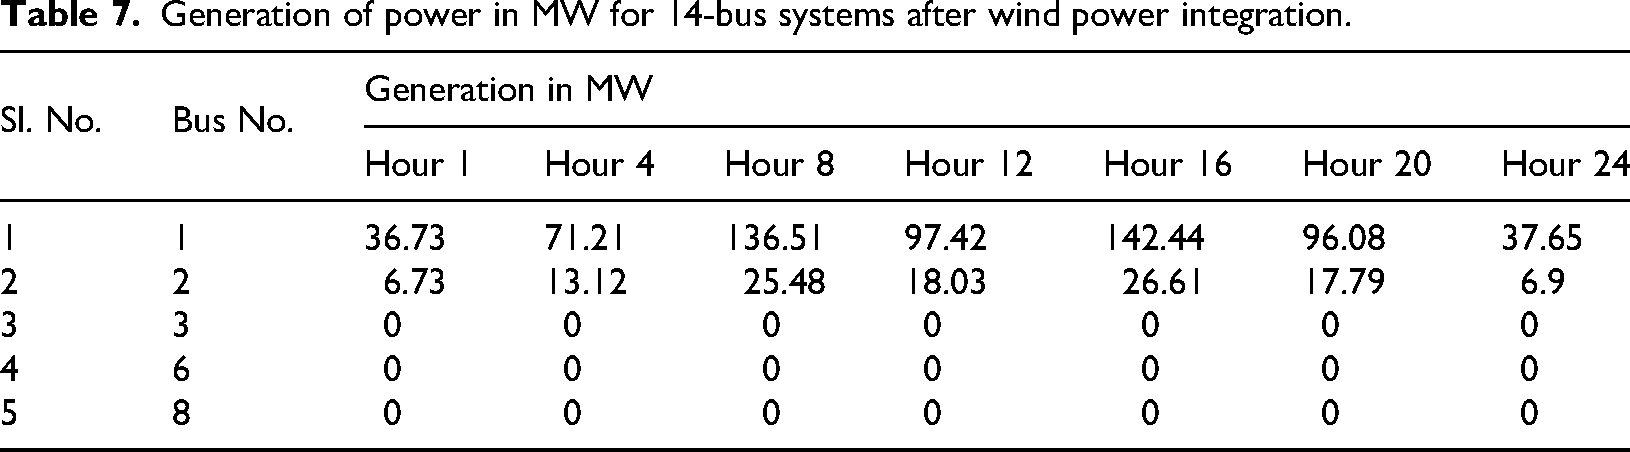
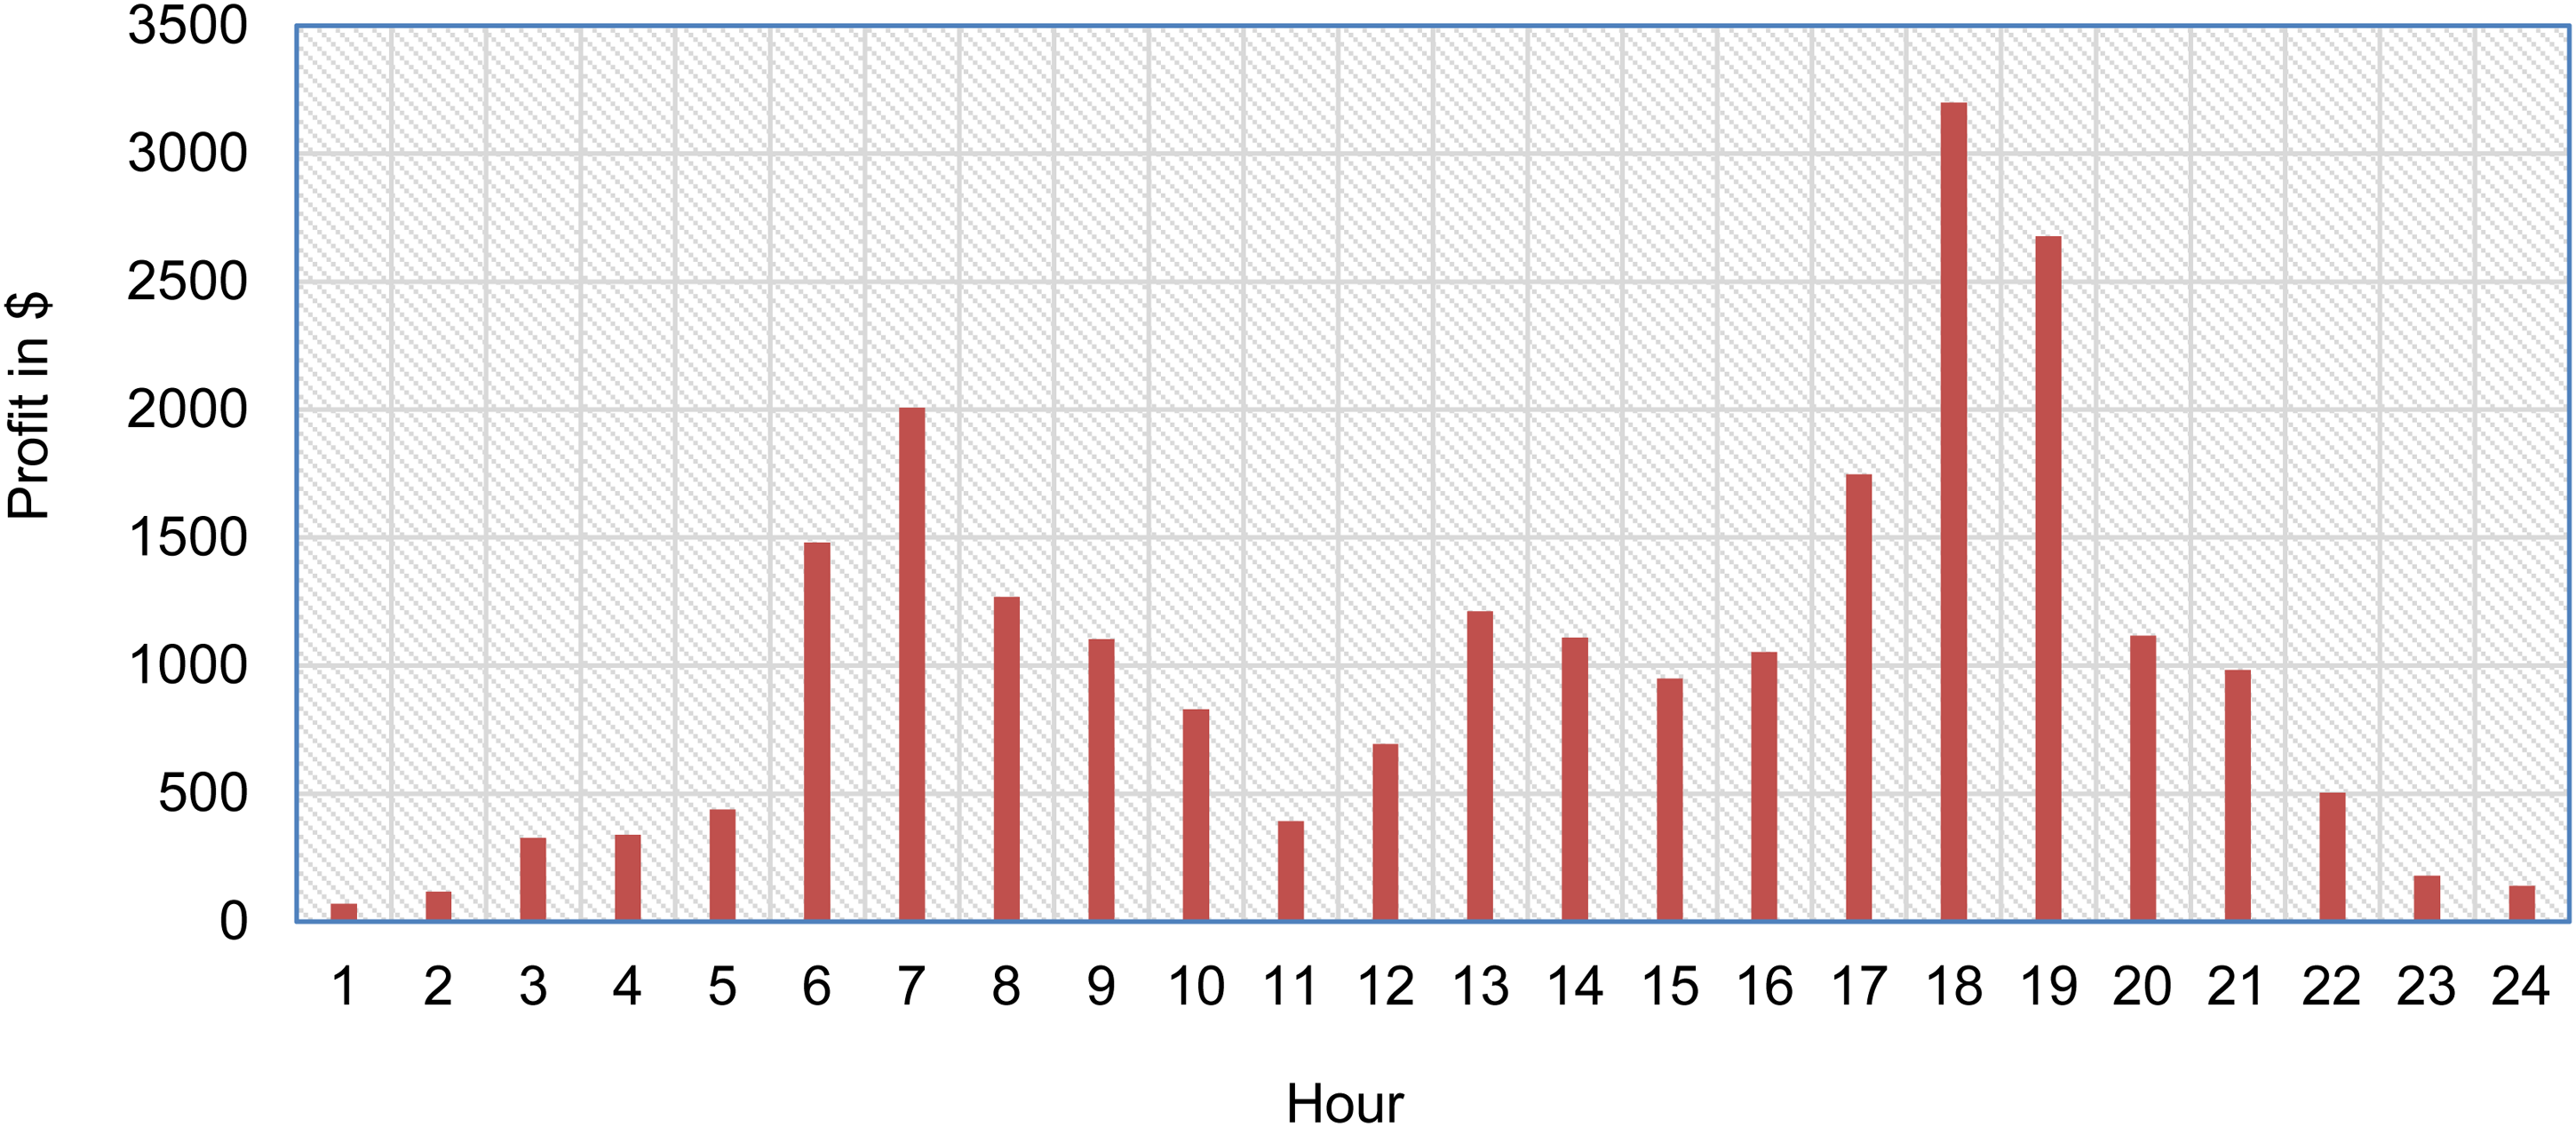
Table 6 shows the forecasted and actual wind power (WPF, WPA) generation for 30 wind turbines (WT), and their generation costs are presented. Generation costs are derived by taking a general price for wind power, which is 3.75 $/MWh. After calculating the wind power generated for every hour, the OPF is calculated by adding the wind power at bus 4, which is a load bus and has higher connectivity with the rest of the system. The generation values for this scenario are shown in Table 7. It is noted that the generators reduced their capacity as compared to the case without wind power, and also, generators at buses 36,8 were not loaded at all. Figure 21 shows the LMP values at all 14 buses with wind power integration. LMP values were reduced notably as the generation cost of wind power is far less compared to that of the thermal system. Figure 22 shows the voltage levels at all buses, and the voltage regulation is also improved compared to the previous case. Table 8 shows the profit values for all 24 h, and Figure 23 is the bar chart representation of it.
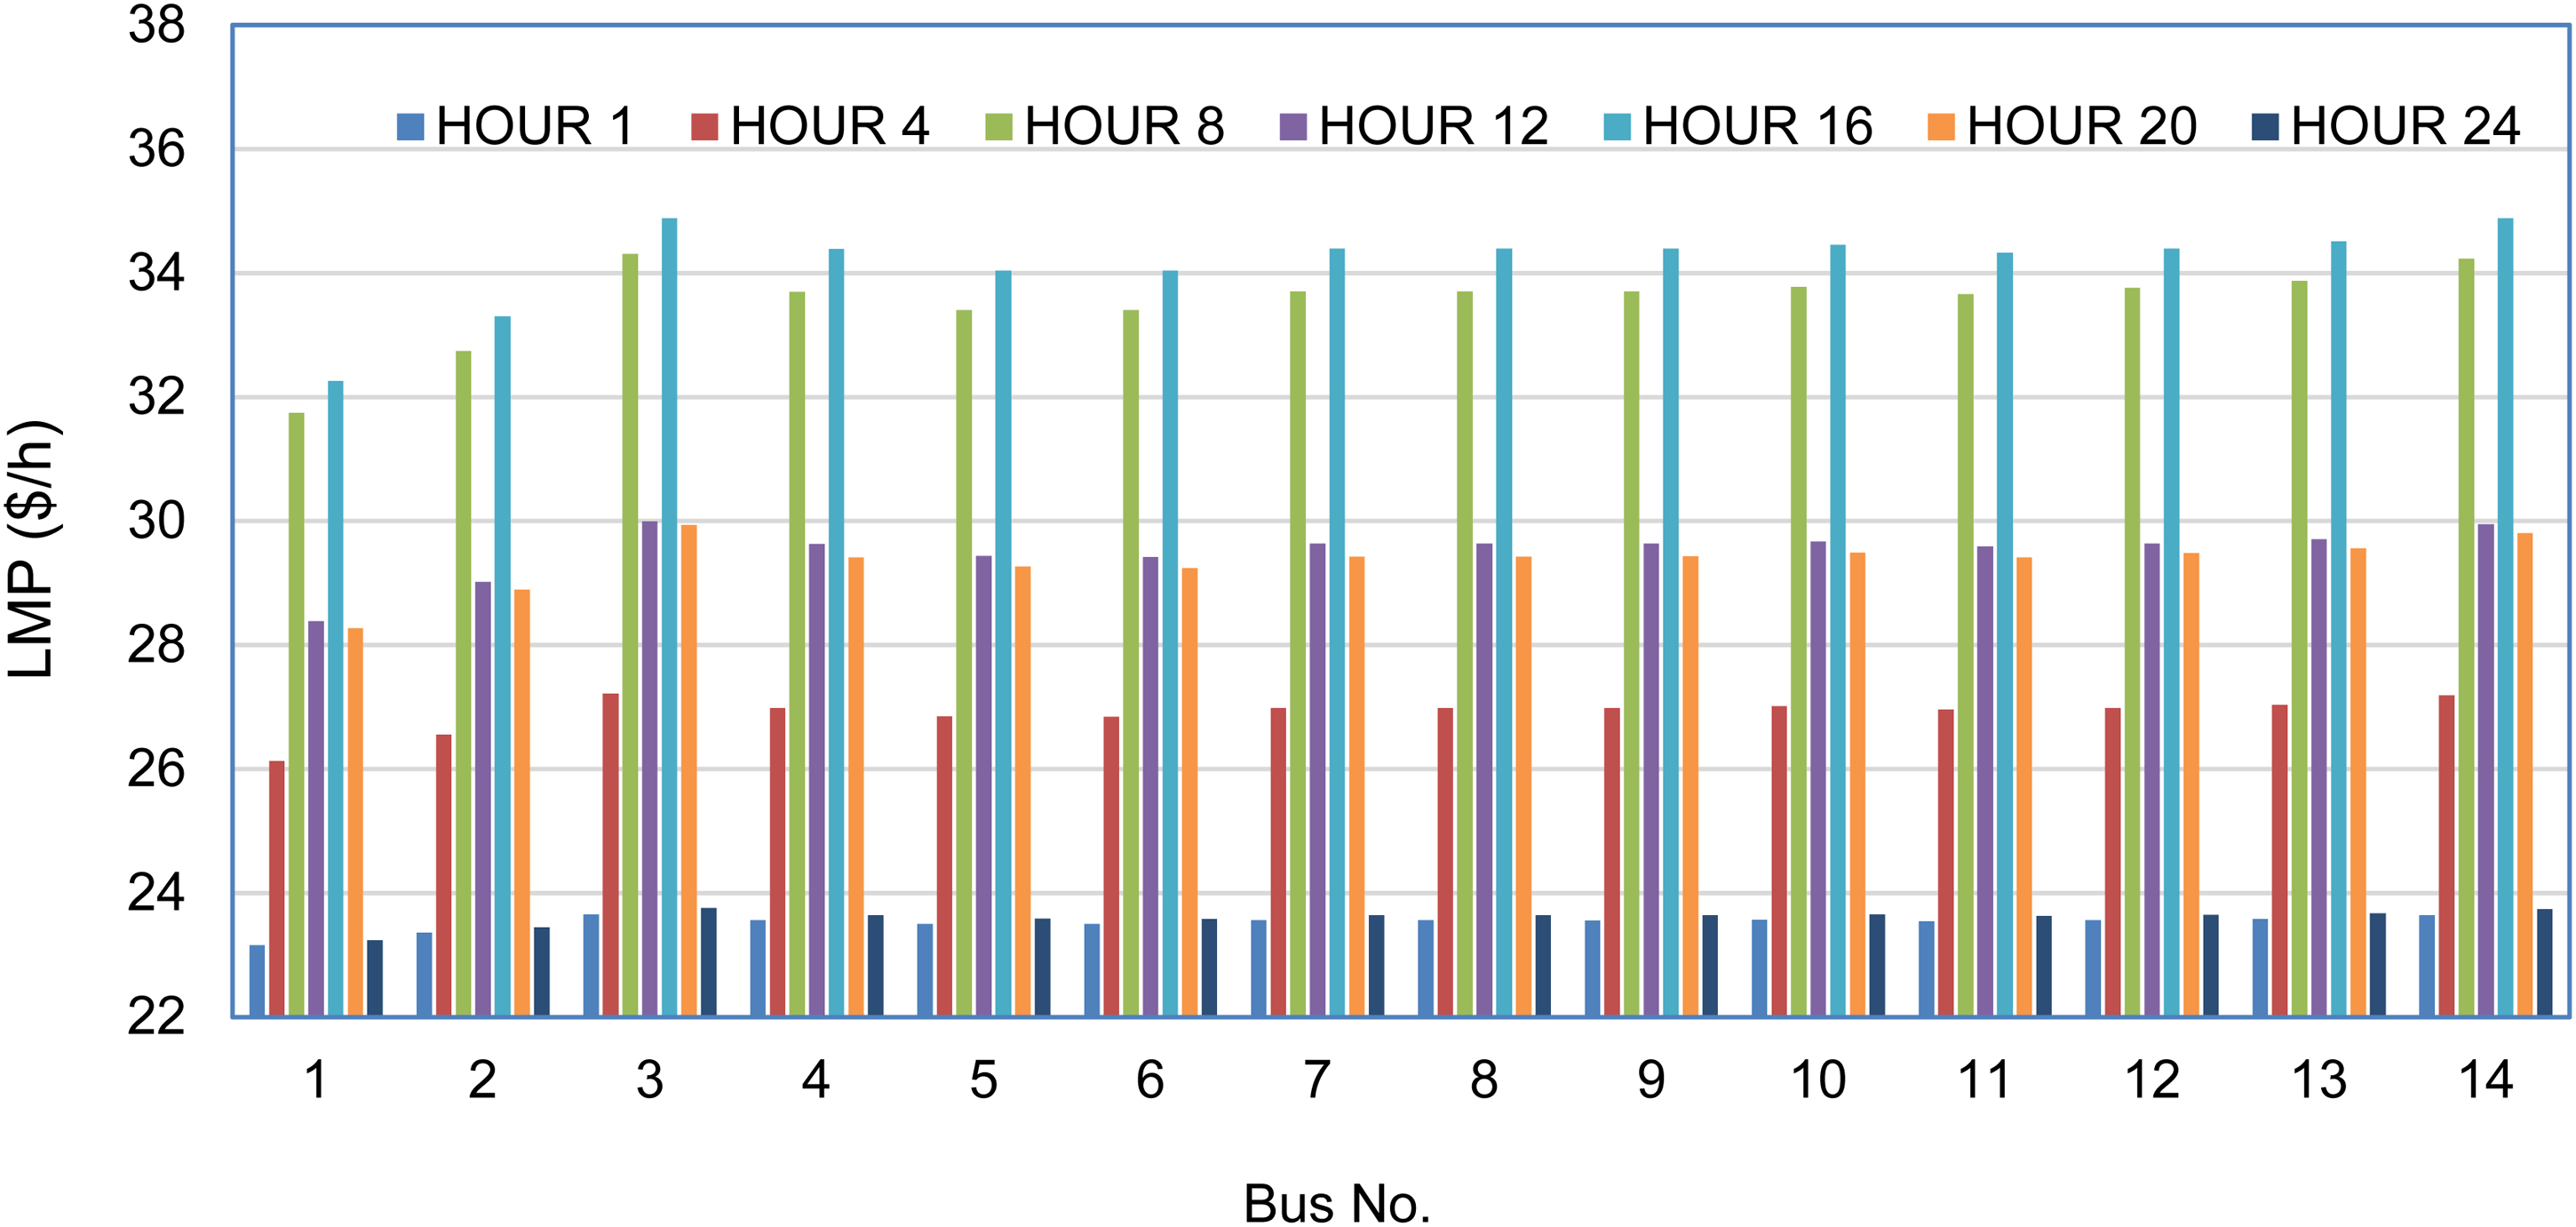
Locational marginal price ($/h) for 14 bus system.
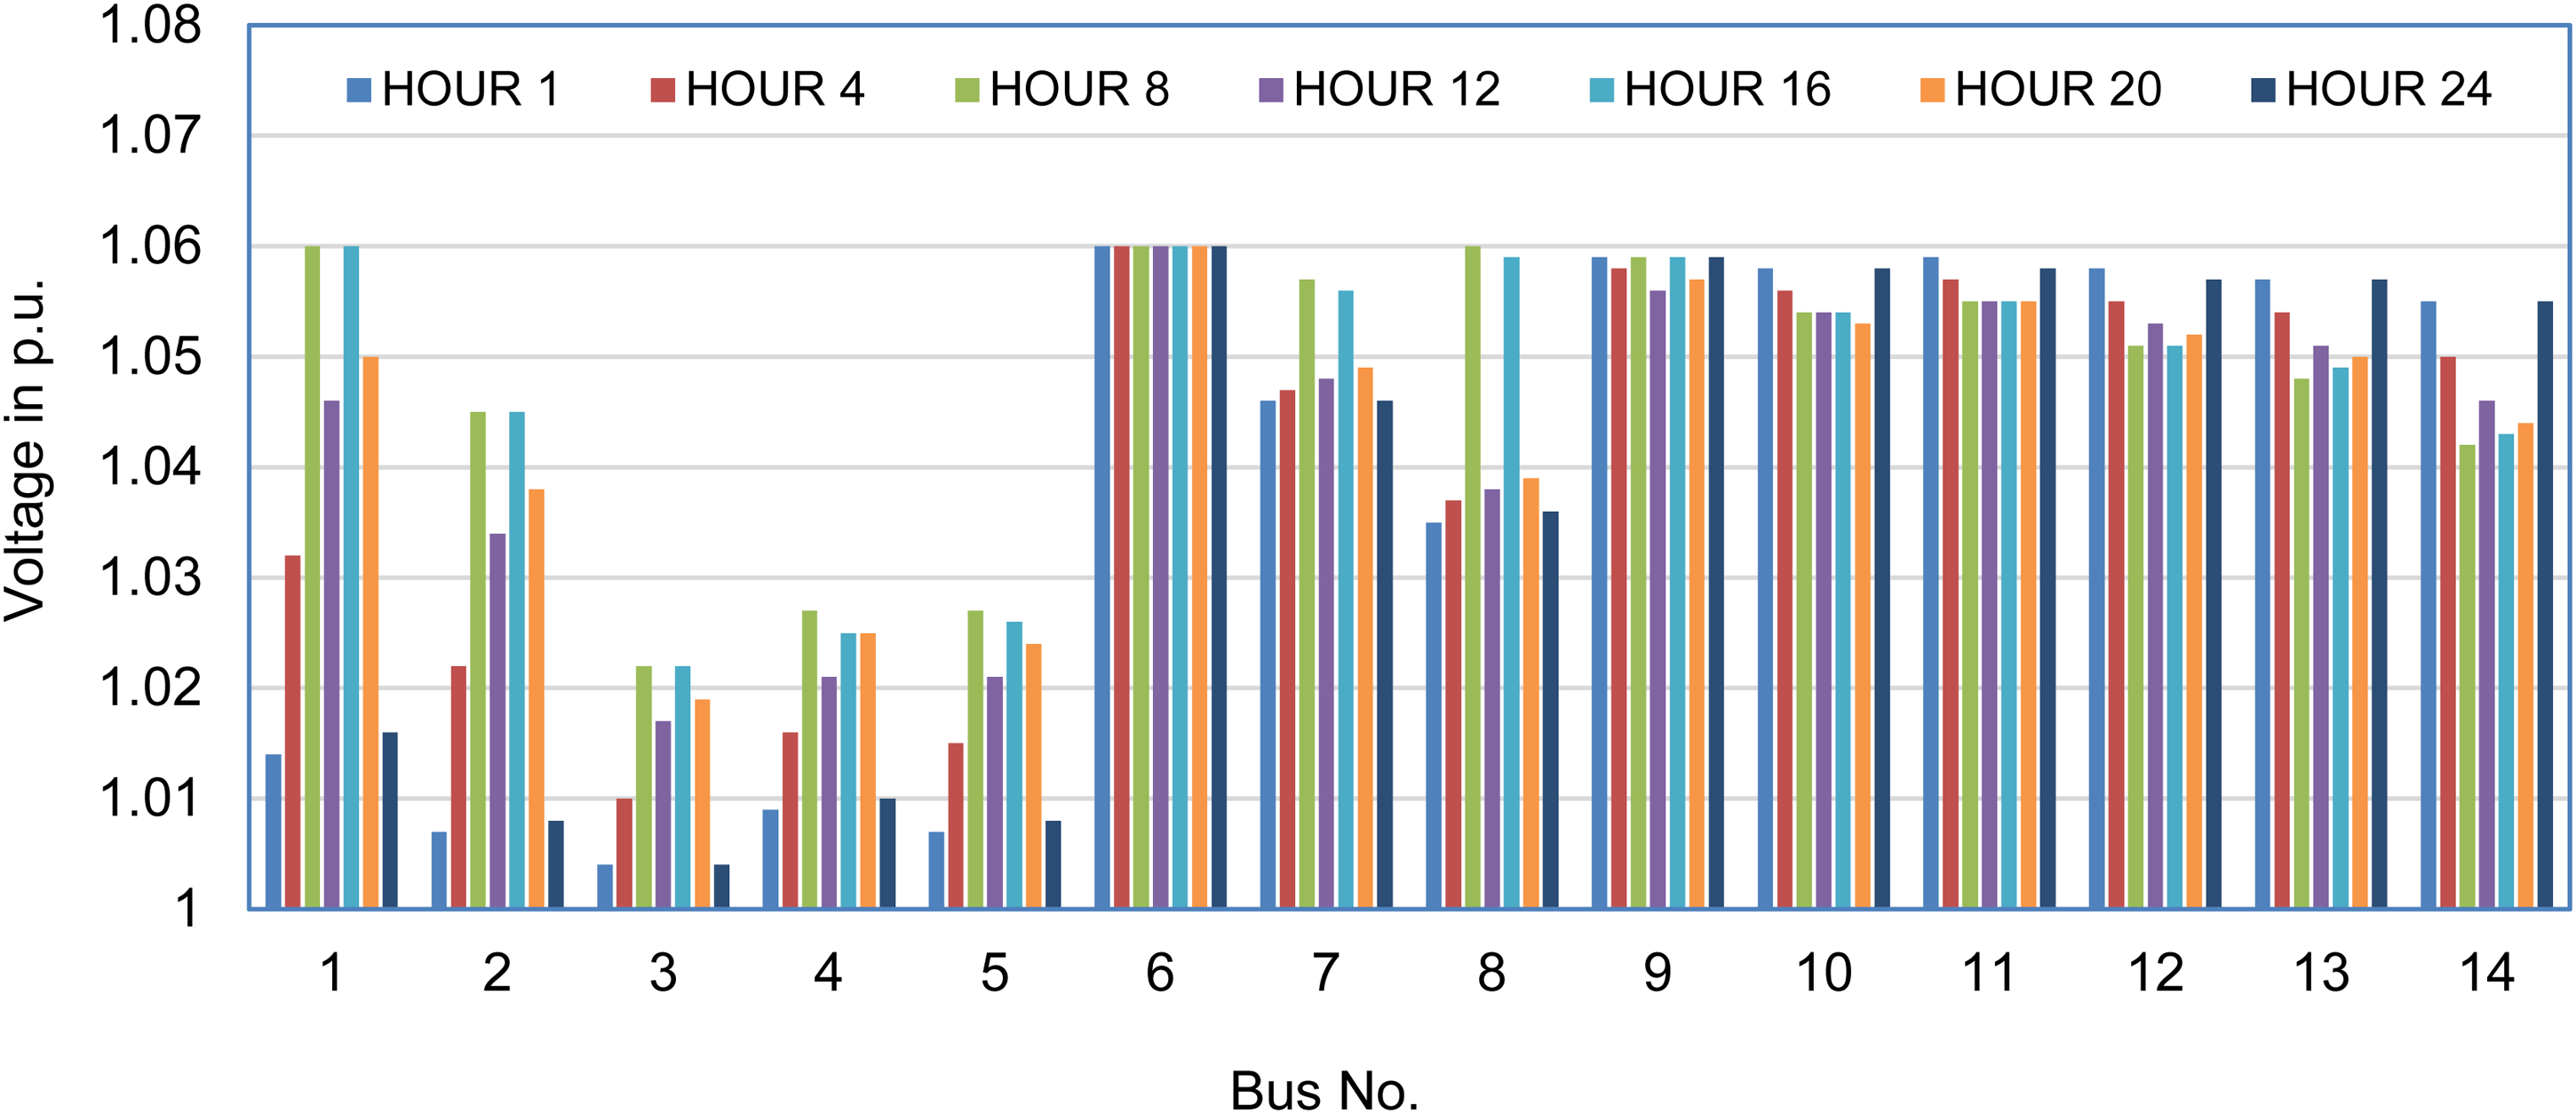
Voltage per unit for the 14 bus system.
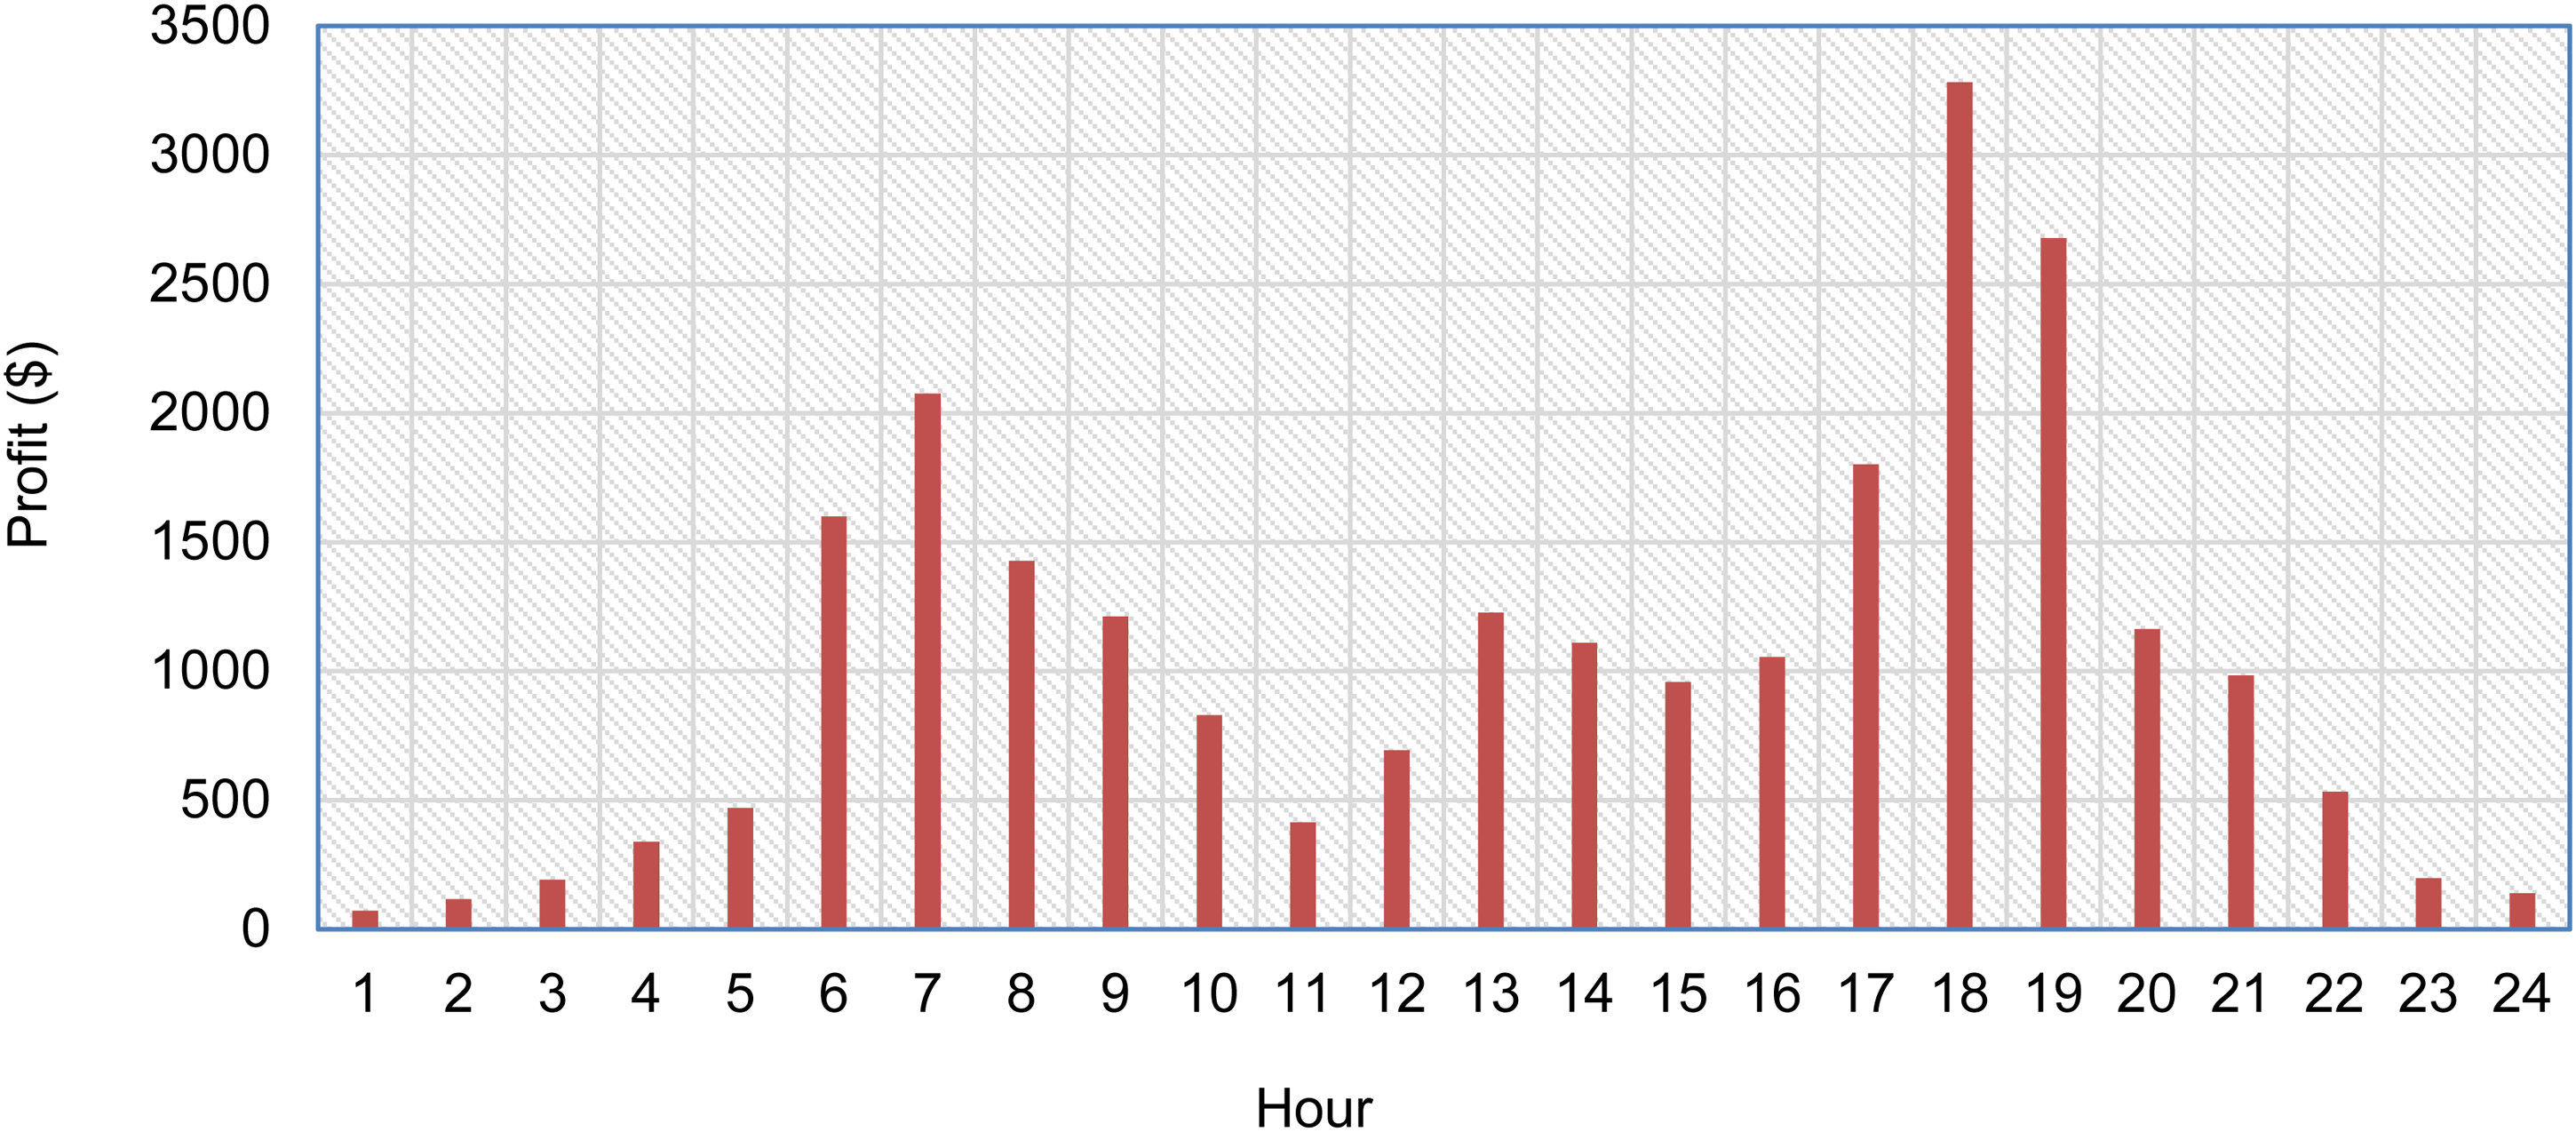
Profit from wind energy integration without imbalance costs at every hour.
Generation cost for forecasted and actual wind power for 30 turbines.
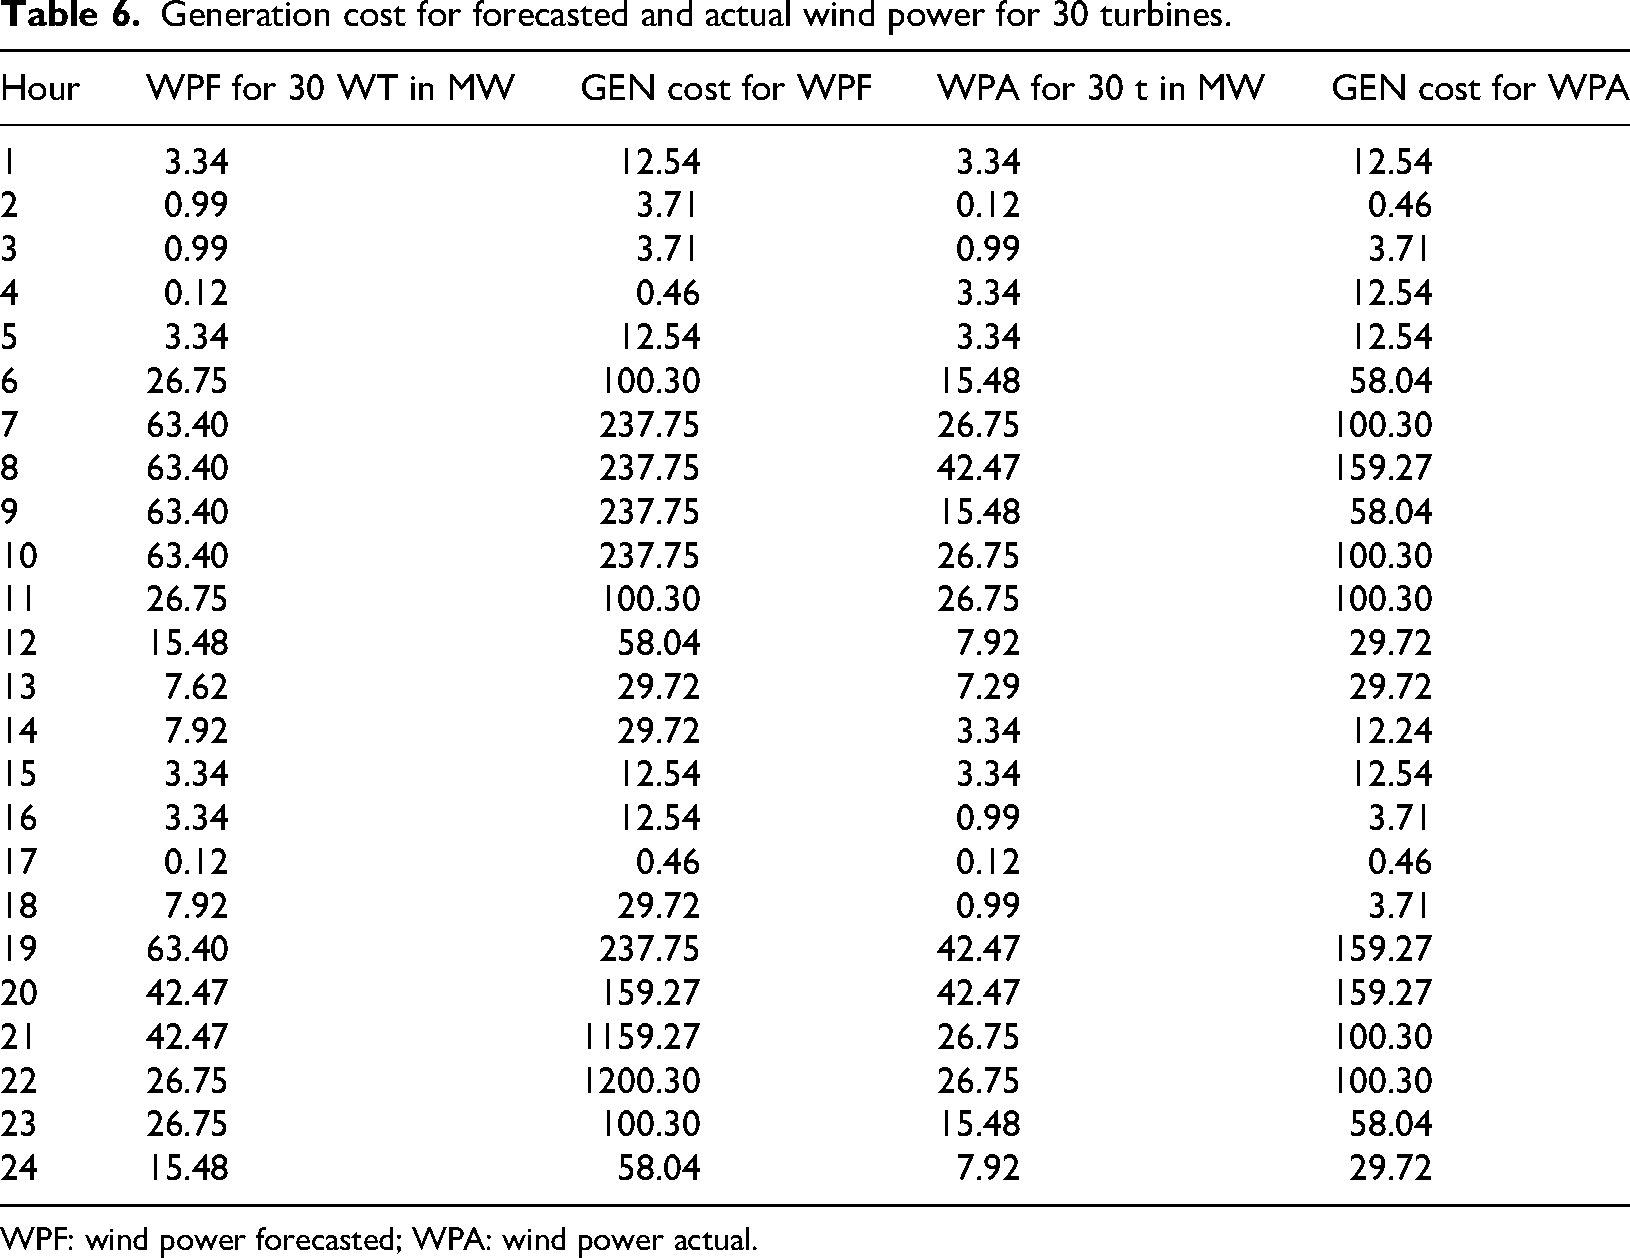
WPF: wind power forecasted; WPA: wind power actual.
Generation of power in MW for 14-bus systems after wind power integration.
Profit without considering imbalance costs after wind power integration using sequential quadratic programing (SQP).
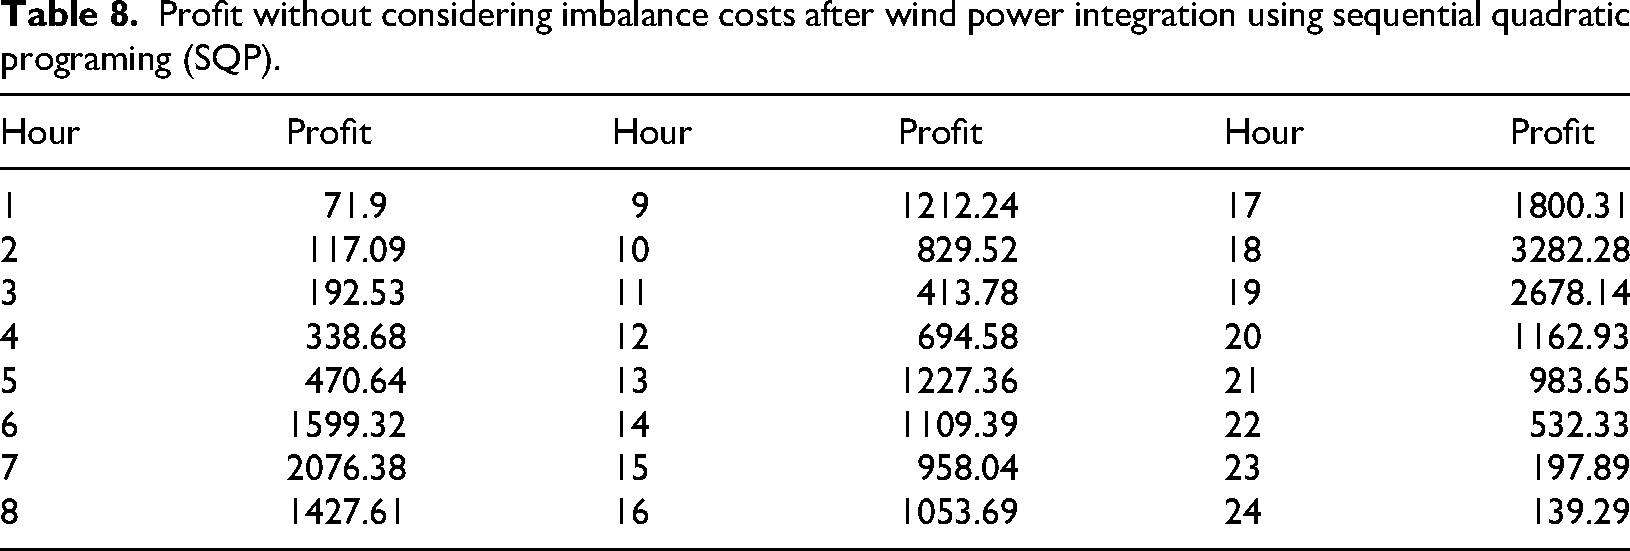
Profits were also increased significantly as wind power generation cost is less, and the generated power is sold at LMP, which results in more benefits and is also beneficiary for the consumers as the LMP is reduced compared to the previous case. All these results have been performed using SQP optimization techniques.
Imbalance cost's impact on the system
Imbalance cost refers to the financial penalties or charges incurred when there is a discrepancy between the forecasted and actual generation or consumption of electricity. This concept is especially relevant in power systems that integrate RES, such as wind power, due to their inherent variability and unpredictability. Imbalance costs arise from the need to maintain a balance between electricity supply and demand in real time to ensure the stability and reliability of the power grid. ISO or grid operator corrective measures must take actions to promote grid stability if the energy producers or consumers diverge from their planned electricity delivery or consumption. This could be done by positioning reserve generation, purchasing electricity from substitute sources, or regulating the load. Those interferences themselves come at a cost, and this is passed along to those responsible in the form of imbalance charges. They are charged according to both the greatness and direction of deviations, whether they are underproduction or overproduction. Imbalance costs are vital for RES producers because wind is intermittent. A WF, for example, might make certain forecasts of how much energy will be generated based on weather forecasts, but actual production could vary due to impulsive changes in wind speed. This not only reflects its own costs to the energy producer, but also the overall economic efficiency of the grid. The economic costs of imbalance can also create incentives for improved forecasting and operating practices.
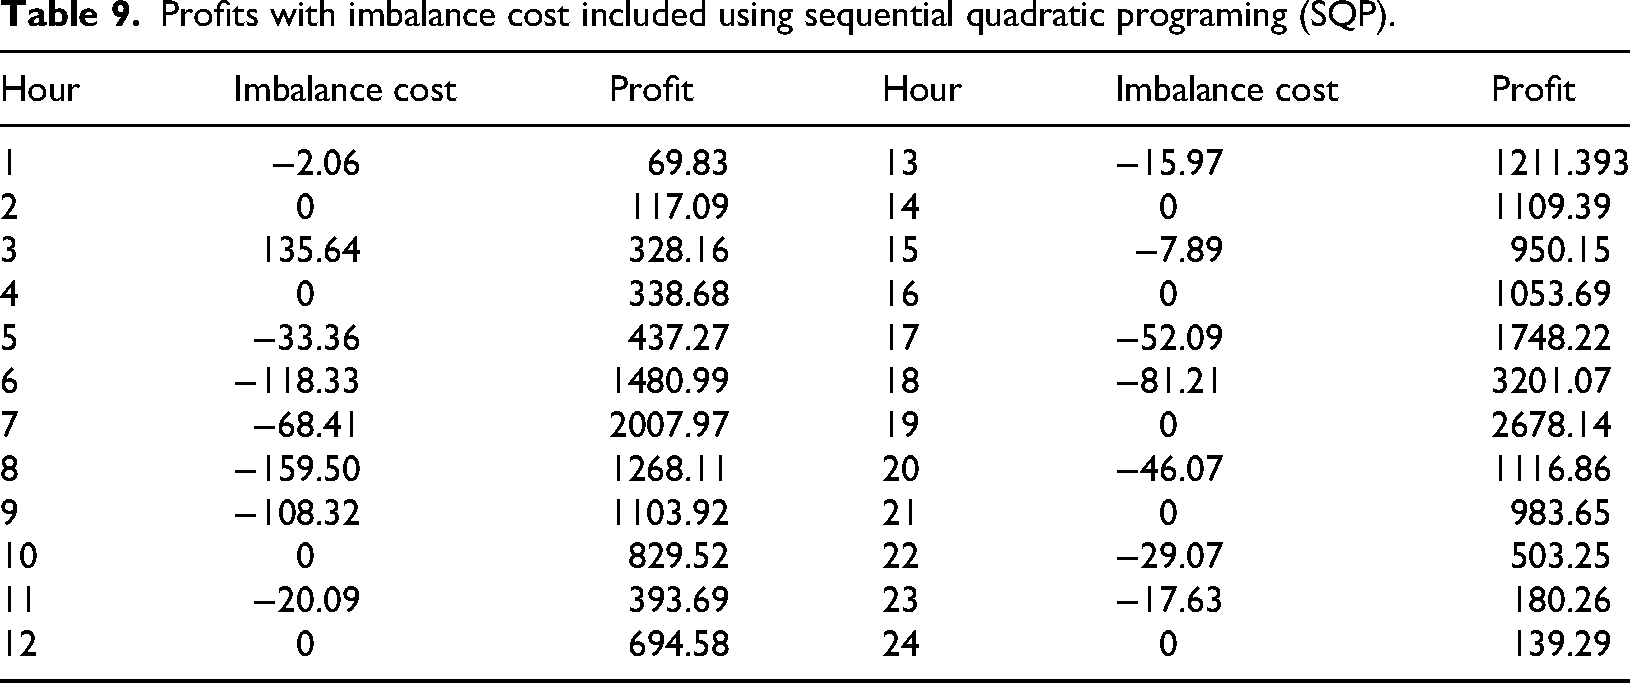
A reliable prediction of energy production or consumption will reduce the deviations in energy consumption and, as a result, the financial penalties. The emergence of advanced forecasting features, including ML models along with real-time data integration, has served as the critical tools utilized in this segment to counteract the costs associated with imbalance. These approaches improve the predictability of renewable generation results and enable utilities to more effectively plan for potential reserve requirements. In addition, imbalance costs influence market strategies. Renewable energy producers must account for potential penalties when formulating bidding strategies in electricity markets. Similarly, grid operators use these costs as a mechanism to encourage participants to adhere to their schedules, thereby promoting grid reliability. Table 9 shows the profit considering the imbalance cost for all 24 h using SQP, and Figure 24 is the bar chart representation of it. By analyzing the results of profits with imbalance cost and comparing with the previous case where the imbalance costs were excluded with wind power integration, in most cases, the profits were less compared to profits without the imbalance cost. This is due to the slight mismatch between the actual and forecasted wind speeds, which is mostly overprediction, resulting in SCRs and causing a decrease in profits. But for hour 3, profit was increased as the actual power was more than the predicted power, and provided benefits to the generation side.
Hourly profit with imbalance cost.
Profits with imbalance cost included using sequential quadratic programing (SQP).
Profits with imbalance cost for the system with different optimization techniques.
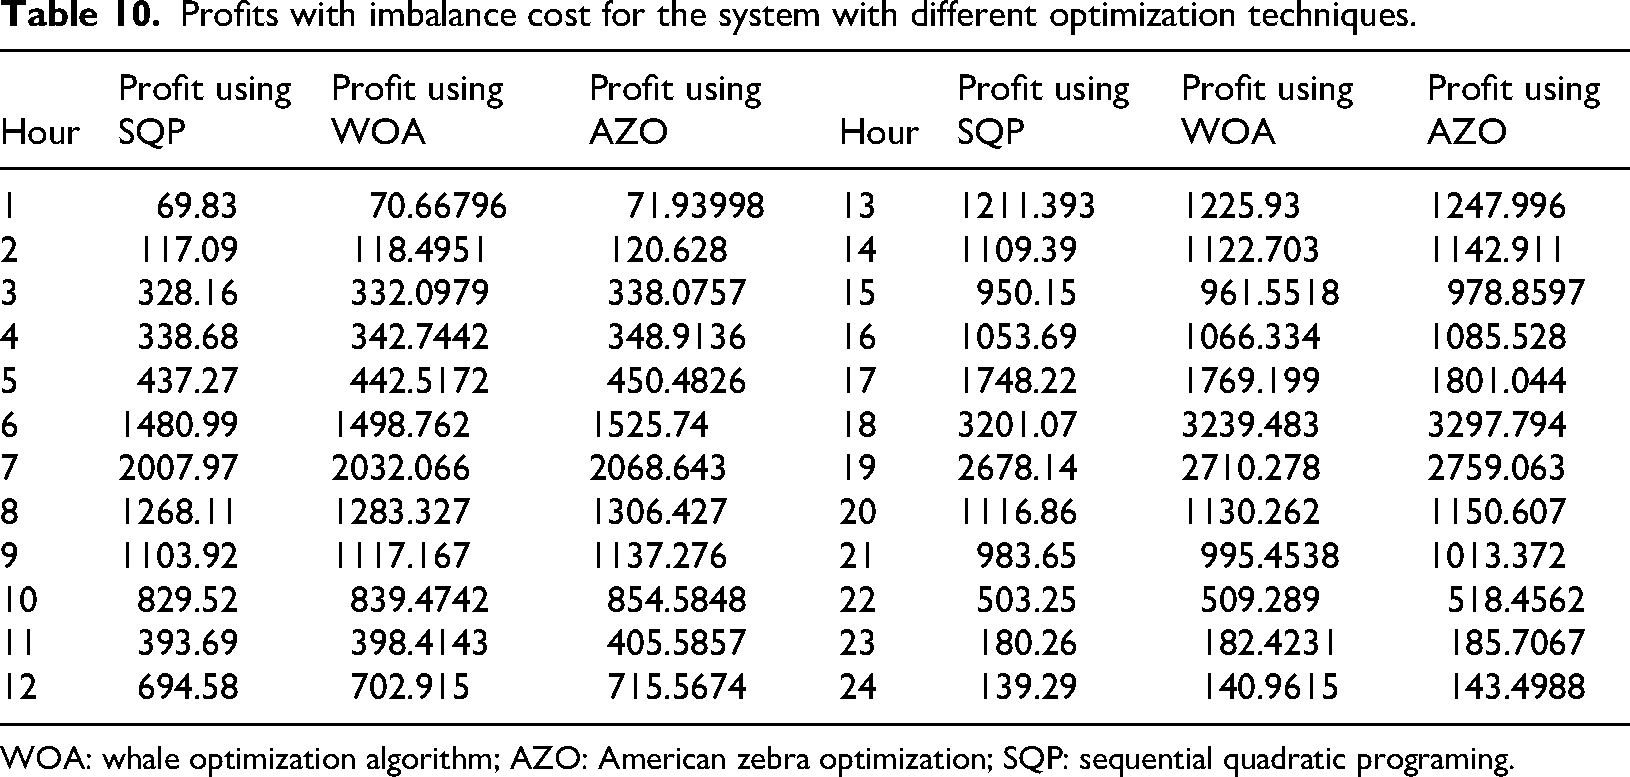
WOA: whale optimization algorithm; AZO: American zebra optimization; SQP: sequential quadratic programing.
WOA and AZO have the following advantages compared to SQP when it comes to optimizing wind-integrated economic power system operations. First, both WOA and AZO are good global optimizers that minimize the potential for being trapped in local optimums, an area of limitation for SQP, which is a local search method that uses initial guesses. This power of searching the whole solution space makes it particularly useful in nonlinear, non-convex problems typical of wind power integrated systems. WOA and AZO are also easily adapted to tackle the uncertainty and stochasticity of wind generation since input data, such as wind power forecasts and speed, may vary. These methods are more suitable for handling uncertainty, in contrast to SQP, whose operation diminishes in the presence of uncertainty. Furthermore, WOA and AZO are more versatile since they neither need smoothness assumptions nor intricately detailed constraint statements and, therefore, are suitable for intricate, real-world systems. In contrast, SQP typically involves linearized approximations that could fail to capture the dynamic nature of wind power systems.
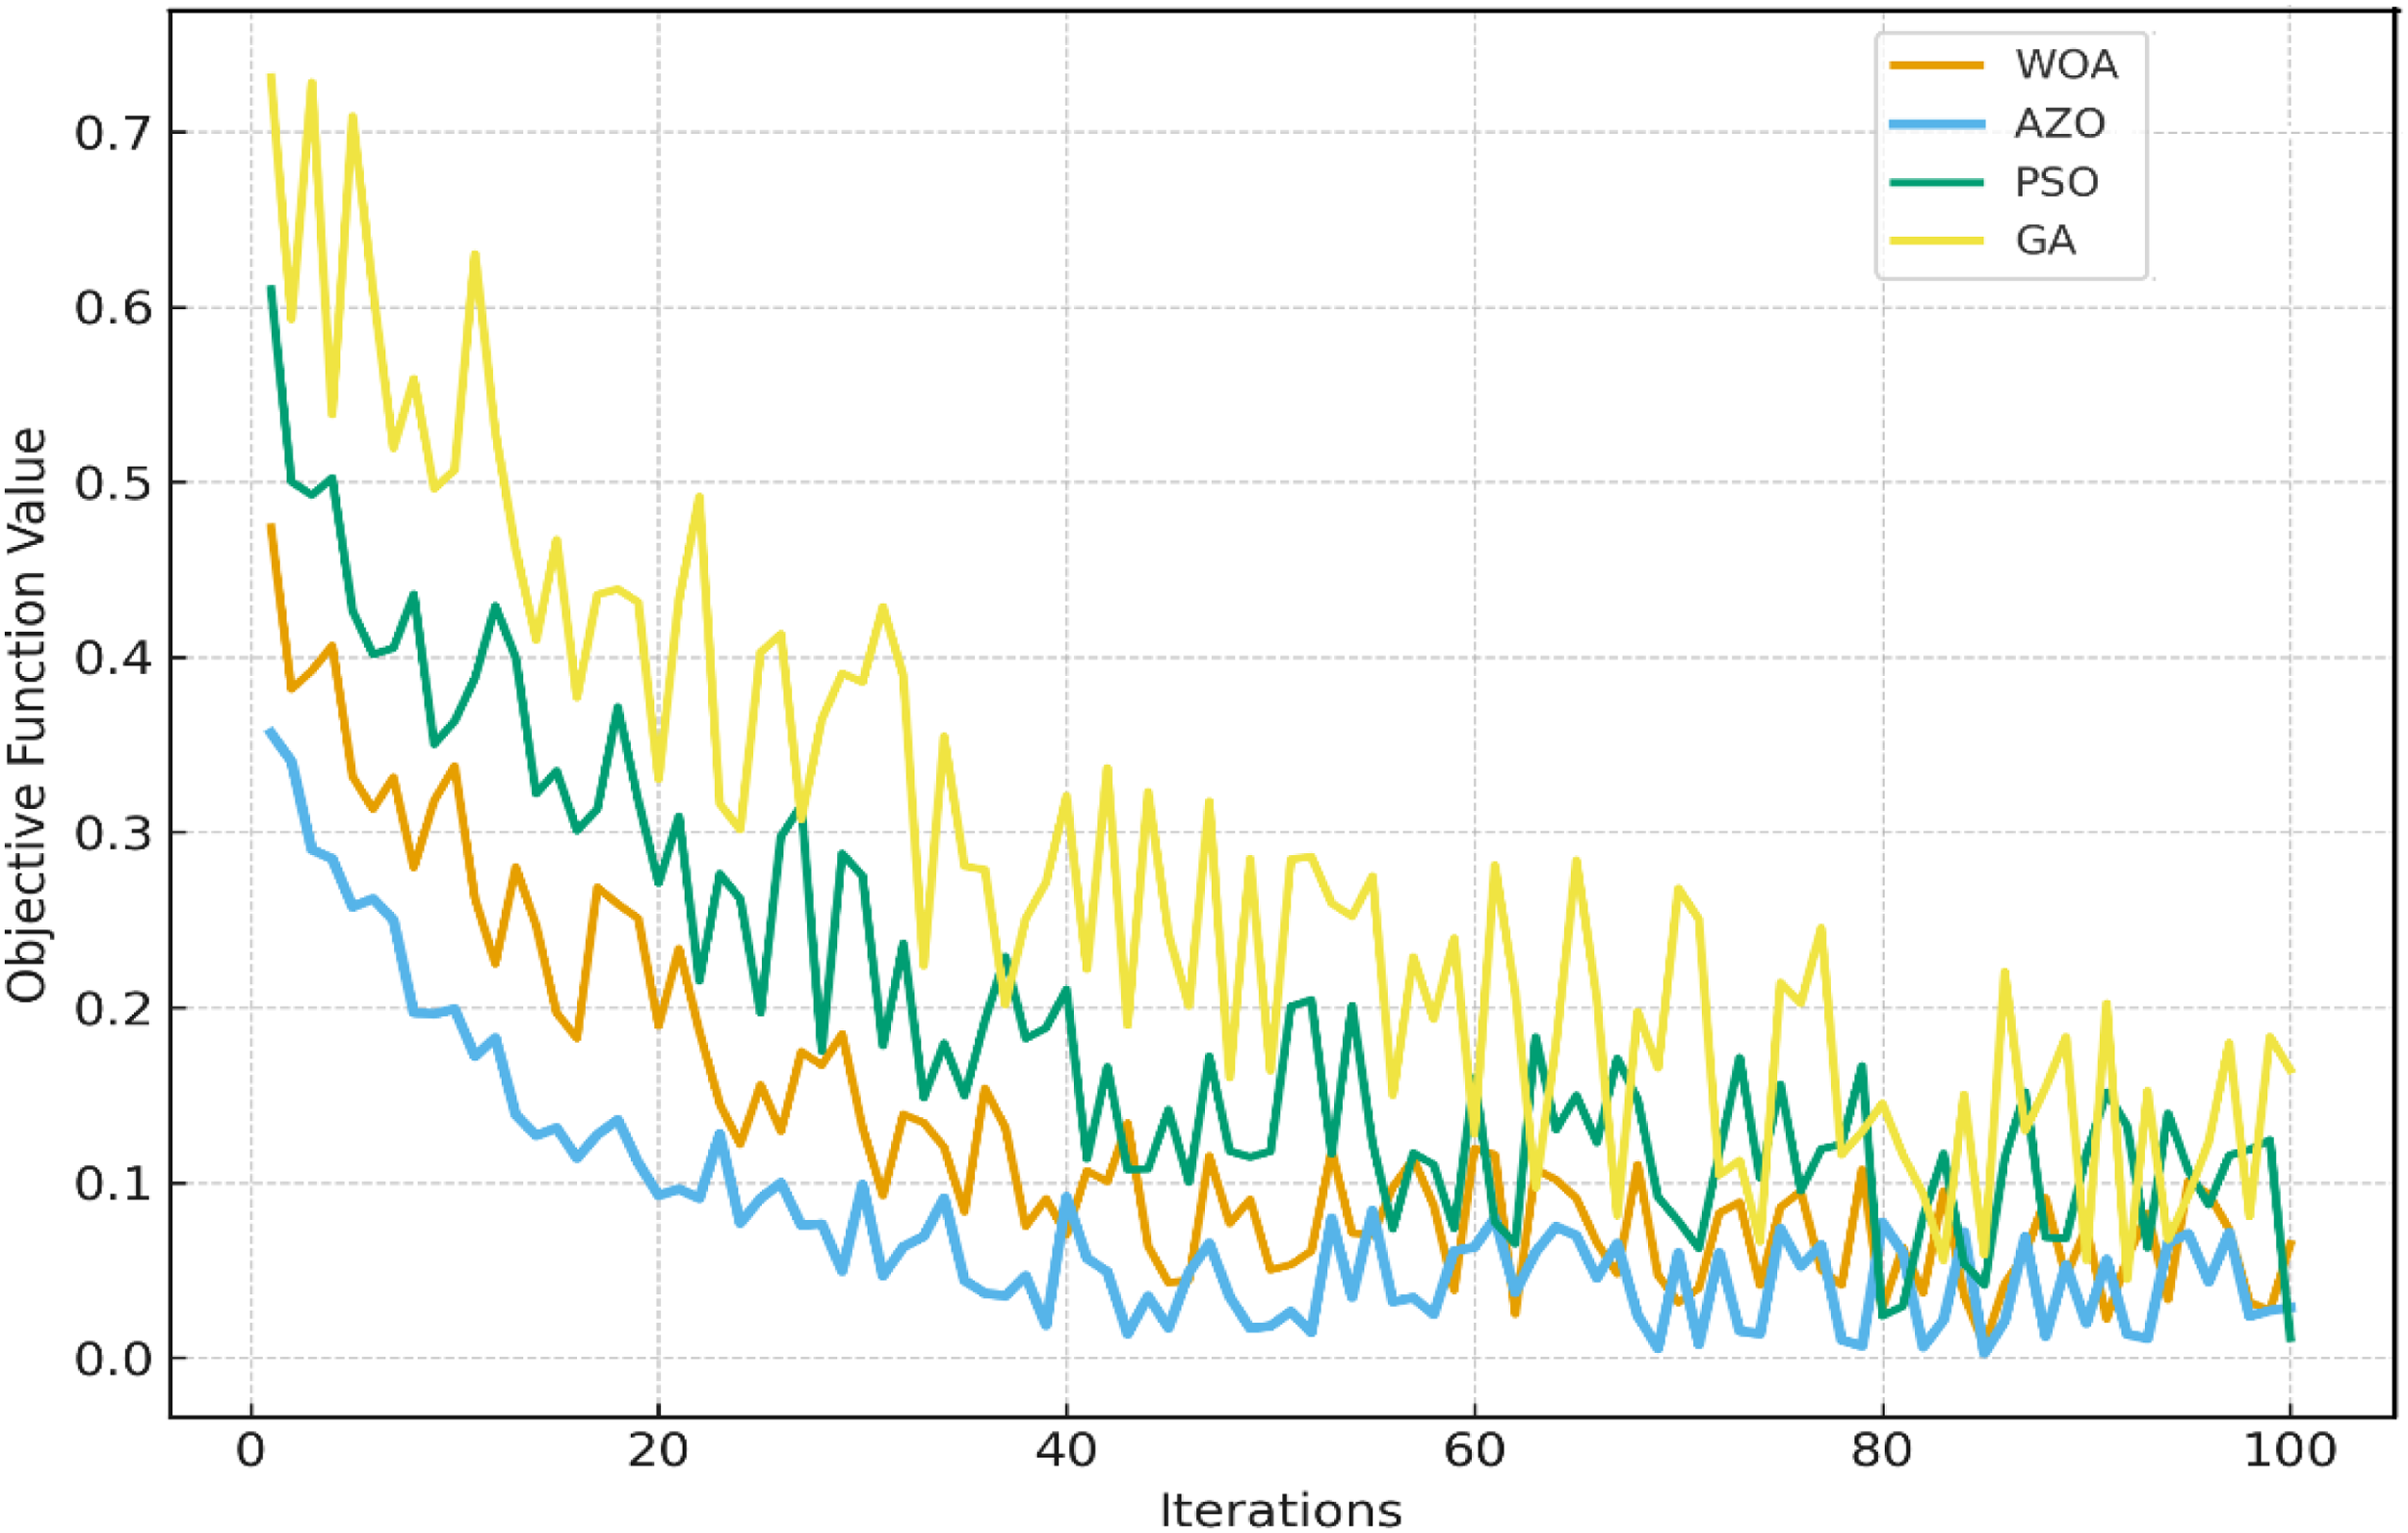
The convergence plot in Figure 25 sets up the performance of 4 metaheuristic algorithms (WOA, AZO, PSO, and GA) with the objective function values during 100 iterations. The results are given in Table 10. The best convergence with better convergence takes fewer iterations to get the best solution with a lesser frequency of iterations than any other algorithmic solution. Its early reduction of the objective function value in the first few iterations proves its good exploration, by its flattening at the end, where its efficient exploitation in the search space is shown without oscillations or an early convergence. In contrast, WOA and PSO converge on moderate levels with more iterations taken to achieve a goal. The small changes in the convergence curves of these algorithms imply the presence of local minima in highly complex search conditions. Because of their lower exploitation efficiency and the random crossover and mutation operators used, gradual convergence and the final objective value explain why GA always has the highest value. Overall, the success in the AZO algorithm also supports the fact that it possesses dynamic adjustment of parameters and the exploration–exploitation relationship with good performance and stability, and resolution accuracy. Therefore, this shows that AZO can be proposed as a great optimization tool in complex multi-objectives like optimal power dispatch or cost-optimization to balance in deregulated power systems.
Imbalance cost evaluation using ML-based forecasting
Convergence characteristics of different optimization algorithms.
Applying LSTM and RF models to predict wind power has substantial benefits in terms of lowering imbalance prices over forecasted wind data that can be accessed from outside websites. LSTM, which is a form of RNN, is very good at extracting temporal dependencies and long-term trends in time-series data. In wind power prediction, LSTM can model sequential relationships in wind generation well and provide very accurate forecasting of power output in the future. By doing so, LSTM can keep deviations between predicted wind power and generated wind power low, directly saving the imbalance cost required to balance the demand and supply of a wind-integrated power grid. The more precise wind power predictions made by LSTM lead to less adjustment required in the system, hence reducing the economic costs of imbalance. RF, although not particularly designed for time-series prediction, nonetheless provides a robust alternative through the use of an ensemble of decision trees that can handle multiple input features, including past wind data, weather, and other pertinent variables. RF models improve prediction accuracy by integrating the prediction values of many decision trees, a capability that minimizes overfitting and facilitates capturing the intricate associations among the data. While RF may not represent temporal dependencies as well as LSTM, it has been shown to significantly improve on typical website forecasts to enable more accurate wind power forecasts that will, in turn, reduce the imbalance prices. The RF model is particularly applicable to many meteorological parameters, and it can be combined with a number of system inputs to produce accurate predictions.
Forecasted wind data available on websites usually depend on less complex statistical models or generic forecasting schemes, which usually do not capture the complex temporal and dynamic behavior of wind power generation. These forecasts are typically less precise and can result in greater forecast errors, making the difference between forecasted and actual wind output greater. Consequently, wind-integrated power systems based on website-based forecasts will have greater imbalances, leading to greater imbalance prices due to the necessity of more frequent balancing of supply and demand. In general, both LSTM and RF-based wind power forecasts are superior to conventional website-based forecasts in minimizing imbalance prices. LSTM provides the greatest improvement because of its sophisticated capacity to comprehend and forecast the time-varying behavior of wind power generation. Through more precise, real-time forecasts, both LSTM and RF enable a more economically efficient and stable operation of wind-integrated power systems, minimizing the monetary penalties of imbalances and improving overall system performance.
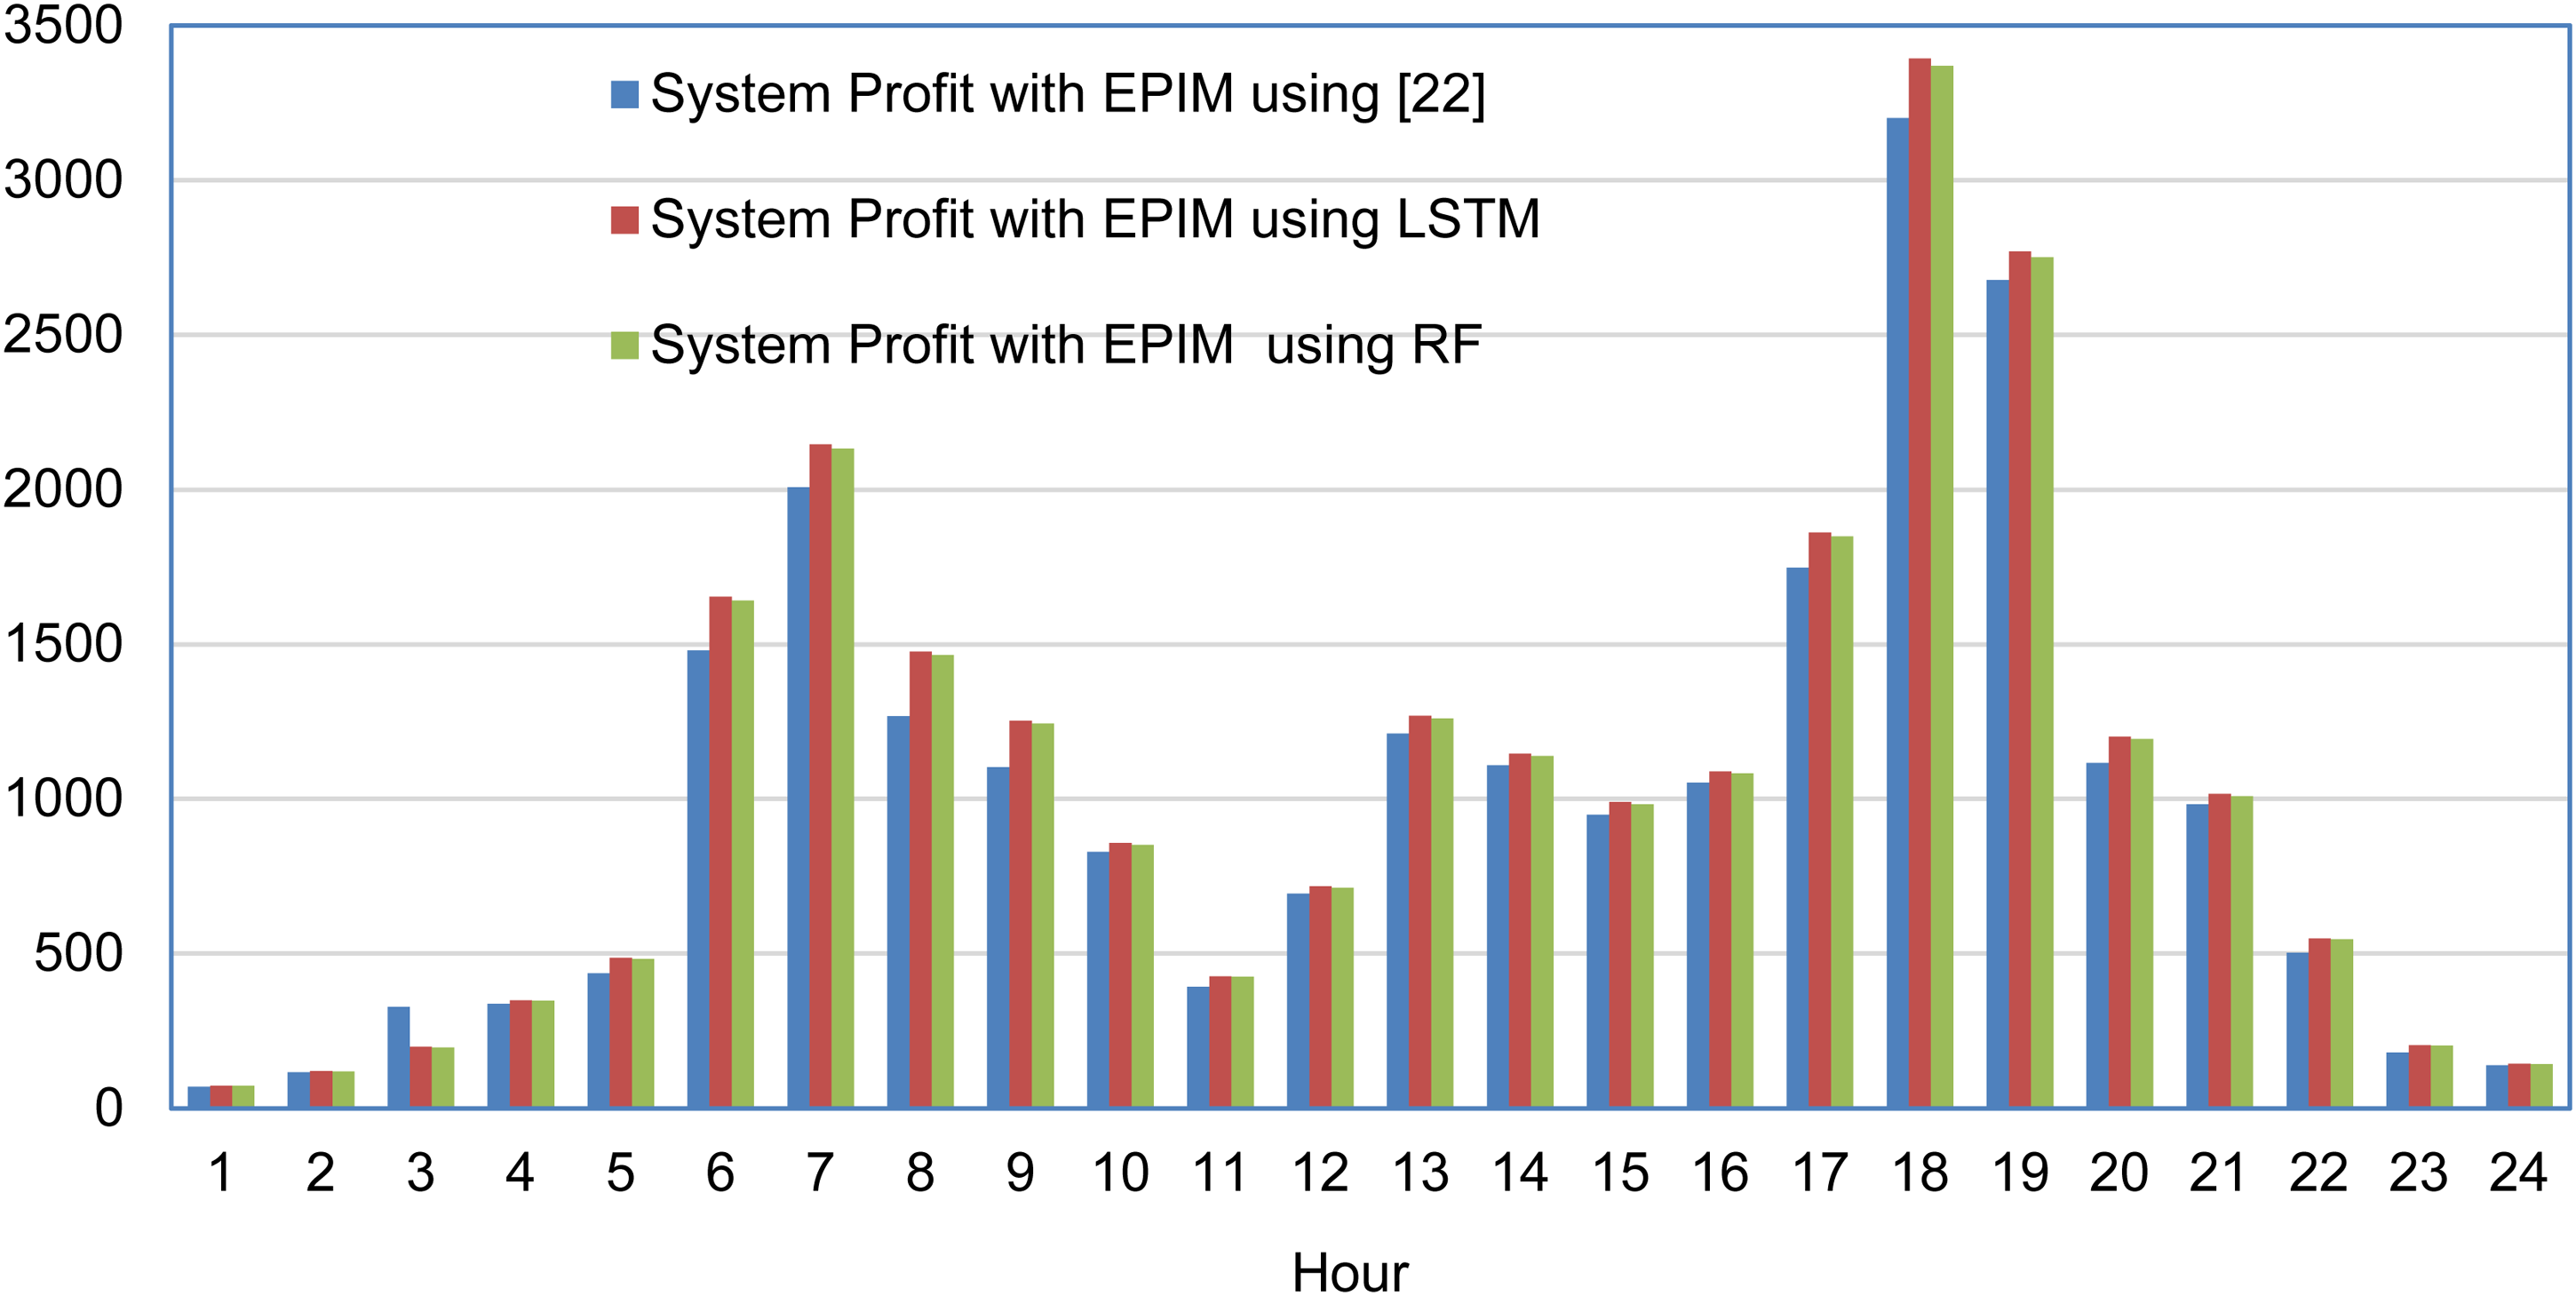
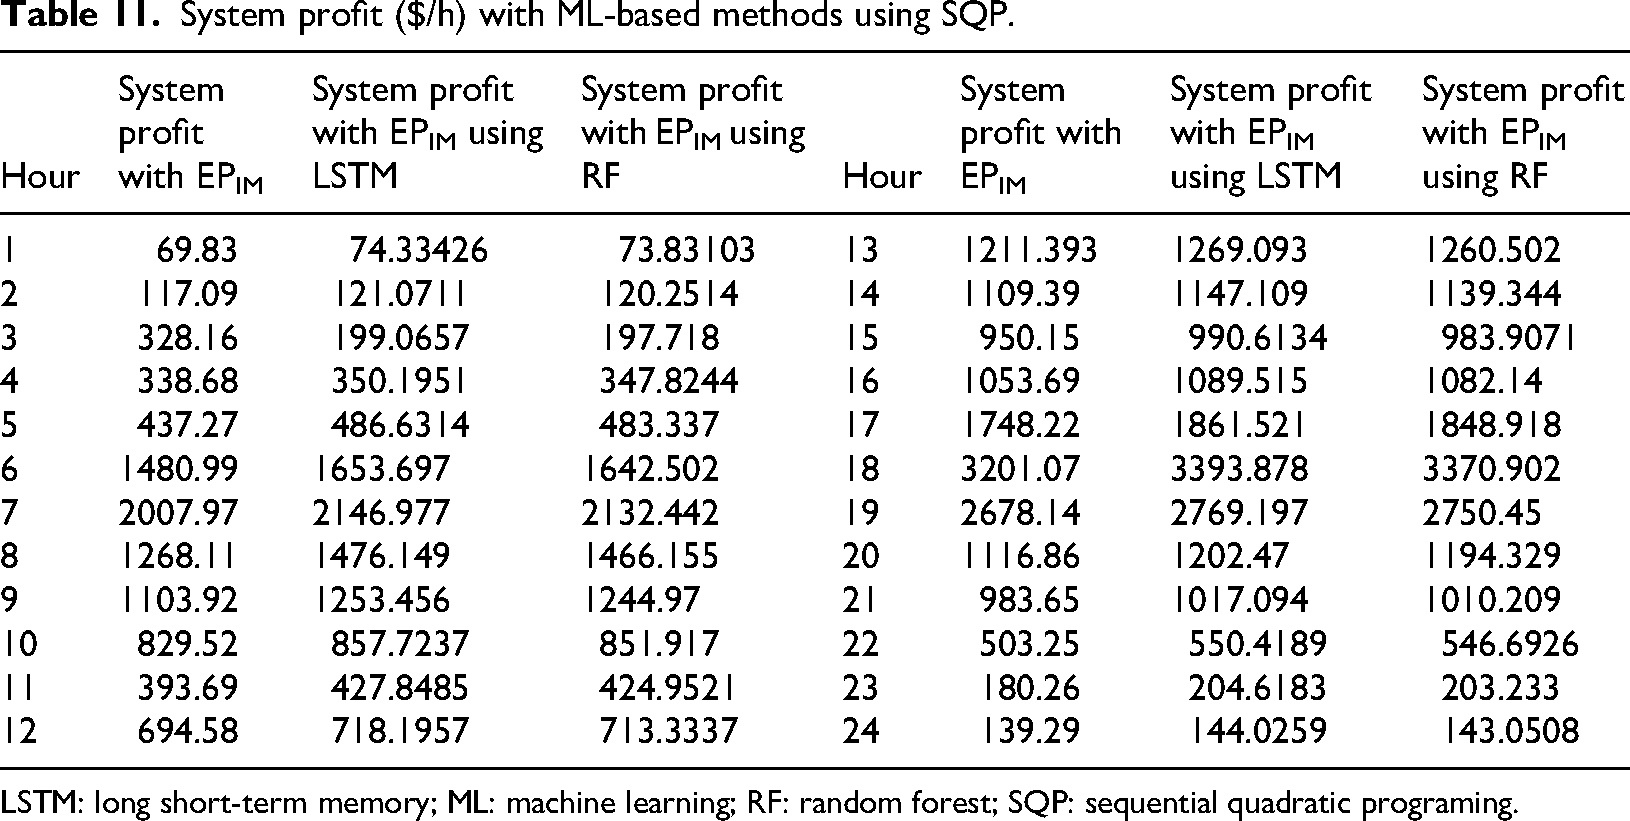
Table 11 and Figure 26 provide a graphical evaluation of system profitability and compare the outcomes after considering the imbalance price factor with multiple ML-based methods. The methods used to identify those results make it a highly accurate and comprehensive result that is both trustworthy and robust. It captures the financial gain reflecting both the positive revenue increases and the penalties suffered. This paper presents a comprehensive analysis of different operational results under various wind speed scenarios. The primary conclusion is that if forecasted wind speeds closely resemble real situations, then the effect of the imbalance pricing mechanism becomes virtually zero.
System economy assessment with optimization techniques
System profit ($/h) with ML-based methods using SQP. ML: machine learning; SQP: sequential quadratic programing
System profit ($/h) with ML-based methods using SQP.
LSTM: long short-term memory; ML: machine learning; RF: random forest; SQP: sequential quadratic programing.
It has been previously demonstrated that, in fact, system imbalance costs have negative impacts on economic performance and operational efficiency of generation units. Positive imbalance costs increase system profits, and negative imbalance costs decrease system profits. This study compares the SQP approach with the AZO method in both LSTM and RF-based forecasting frameworks, including those accounting for the effects imposed by imbalance pricing in the system. The study has proved that imbalance pricing can greatly improve system revenue by reducing financial risk from variations of wind power used as an adjustment to standard LSTM and RF methods. The second part is the AZO approach, which also compares well for all cases and exceeds SQP by optimizing the system as described in previous studies. AZO also achieves superior profit margins irrespective of forecasting method, indicating it is accurate. LSTM forecasts are often more profitable than RF on the whole and in all cases more profitable than RF forecasts, since LSTMs can better predict the sequential patterns in the wind speed dataset. The ultimate result is that together AZO and LSTM forecasting provide the superior competitive benefits in a balanced economy of costs, balance reduction, and profit increase. By providing such solutions, this demonstrates that sophisticated optimization and ML techniques can help to enhance the cost-effectiveness of renewables–integrated power systems.
Table 12 shows the profit outcomes of the system when imbalance costs are considered and assessed under various optimization techniques as well as ML-based forecasting techniques. The profitability is compared across different scenarios that include imbalance pricing, considering the optimization algorithms employed, and the forecasting models (like LSTM and RF). The table intends to indicate the effect of different ML-based methods on system profitability, especially when imbalance costs are included in the analysis.
Profits with imbalance cost for the system with different optimization techniques for different ML-based techniques.
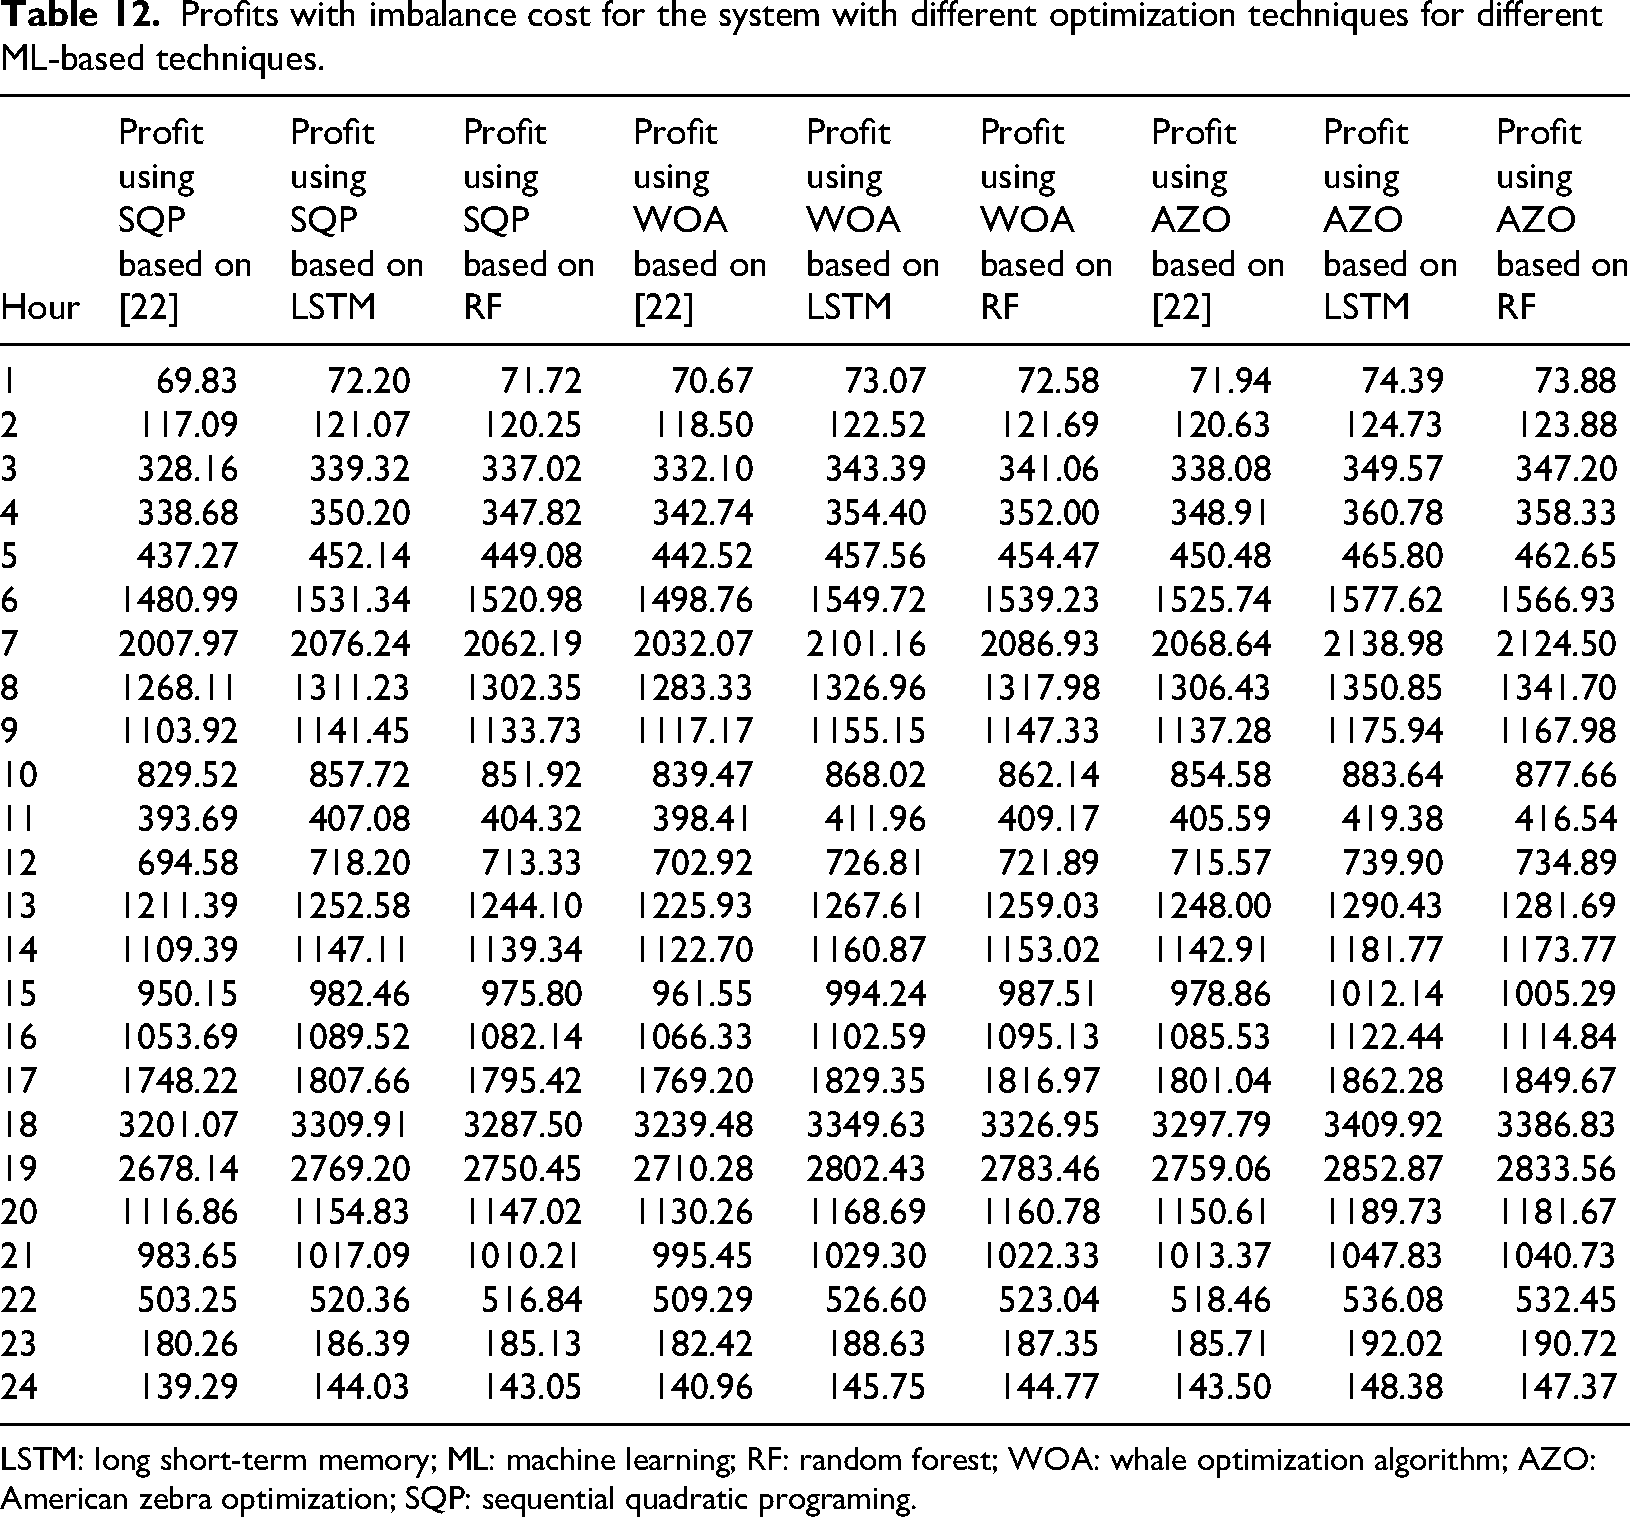
LSTM: long short-term memory; ML: machine learning; RF: random forest; WOA: whale optimization algorithm; AZO: American zebra optimization; SQP: sequential quadratic programing.
Although the proposed ML–metaheuristic optimization framework effectively achieves the performance of balancing the costs and benefits of balancing the imbalance and also maximizing the profits of the system, it has its drawbacks. The forecast performance of LSTM depends on the level, quality, and quantity of meteorological data, and whether the missing or noisy data result in a drop in the forecast performance. The trained and tested model was based on historical datasets under predetermined conditions, and may miss large-scale, unexpected real-world fluctuations, like abrupt environmental shifts or equipment failures. Furthermore, while the WOA and AZO have proven efficient for global search, the parameters of both need to be fine-tuned to avoid premature convergence and obtain computational efficiency in large-scale systems. Finally, the study is based on the IEEE 14-bus system, and therefore, its scalability to larger networks could be further investigated in order to validate robustness under more complex operational scenarios. While LSTM achieved better forecasting performance over the RF model in this study, there is still huge room for methodological scope for extending the forecast framework. More recent architectures, namely Gated Recurrent Units and hybrid CNN–LSTM models, will be used to further address this in the future, which have demonstrated the ability to capture both spatial and temporal dependencies in meteorological time-series data. Further, the current study employs a single location of wind data; hence, validation across geographic sites and other weather datasets will be conducted to gauge the generalization ability of the approach proposed. Such improvements will ultimately contribute to a broader, scalable, and geographically transferable forecasting and optimization framework.
Based on the simulation results, the operational and economic impacts on Japan's deregulated electricity market come out to be a significant concern. The decrease in imbalance costs and improvement of system profitability proved the practicality of using the proposed ML–metaheuristic framework to help Japan's ongoing transformation to a competitive low-carbon energy market. Thus, LSTM could improve wind power forecasting, promoting renewable producers to bid better in the day-ahead market, and thereby avoiding any monetary penalties introduced by the imbalance settlement mechanism. Also, WOA and AZO-powered optimization strategies can help industry members to achieve superior profitability without compromising system performance. These results closely represent the objectives of Japan's national renewable policy outlined under the Strategic Energy Plan to liberalize the market and transition to carbon neutrality by 2050, with more variable renewable energy generation. Thus, the results not only confirm the possible technical capability of our model but also enhance its applicability in policy-making, investment choice, and operational aspects of the sustainable Japanese power market. To evaluate the efficiency and convergence characteristics of the proposed AZO-based optimization framework, these simulations were performed on the IEEE 14-bus system. The IEEE 14-bus system is an established model, providing a benchmark that helps evaluate the algorithm's performance under controlled conditions. Larger systems (for example, IEEE 57-bus and 118-bus networks) have not been addressed in the current work; future work will extend this study to examine the scalability and computational robustness of larger systems. It is anticipated that, given the results presented in the present work and the stability shown by the algorithm, the proposed framework can provide comparable convergence behavior and similar optimization efficiency in larger and more complex systems. Along with the financial advantages derived from the simulation, real-world deployment of the developed ML metaheuristic mechanism under Japan's deregulated electricity market must be taken into account. Japan has a market design with zonal limitations, fragmented regional grids, and strict imbalance settlement rules that have made developing new forecasting methods that can function reliably under strict regulations very difficult. The LSTM-based forecasting and AZO/WOA optimization modules proposed to be implemented can be incorporated in existing operational structures in applications such as aggregators who already manage distributed renewable portfolios and are expected to make balanced day-ahead bids. Since imbalance penalties under Japan's Balancing Market can be partially mitigated by utilizing storage assets, such as BESS, pumped-hydro units, or demand-response resources, this framework can also be extended for co-optimizing the wind forecasts with storage dispatch, reserve procurement, and intra-hour correction strategies. In addition, the model corresponds to the current METI and OCCTO regulatory developments, which put great focus on flexible markets and the role of aggregators in balancing services. By exploiting system constraints, storage ramping restrictions, interconnector capacities between regional grids, and aggregator-level bidding activities, the approach is technically appropriate to Japan's actual market operation. Furthermore, in addition to theory-based performance in the IEEE 14-bus benchmark, our approach could be directly incorporated into Japan's continuously deregulated market system architecture and offer an alternative way for mitigating the exposure to imbalance, increasing participation in renewables, and enabling system long-term decarbonization.
Conclusion
Japan's effort to create a sustainable, low-carbon electricity system must be of high quality by integrating variable renewable energy, primarily wind power, with reliable integration. But it's a country's wildly uneven grid and inflexible price-for-imbalance rules that create major operational hurdles for renewable producers. This work demonstrates that accurate forecasting, along with appropriate optimization, can reduce these challenges to an important extent. With the LSTM forecasting, it can greatly reduce the prediction error, which would help make dispatch scheduling more accurate, reserve planning better, and the importance of traditional thermal units less. When combined with WOA, AZO, and SQP optimization strategies, the overall structure helps in minimizing the imbalance cost and increasing the profitability at the system level, indicating its major interest between the system owner and market players. The results also highlight that the model can support storage integration and flexible demand side resources—increasingly crucial as renewable penetration grows. Even though verified on the IEEE 14-bus system, the approach is generalizable to more extensive, more complex grid setups in Japan due to its modularity and the utilization of common OPF guidelines. The theoretical ML–optimization framework provides effective mitigations not only to reduce financial risk and improve operational stability, but also serves as a positive contribution to Japan's deregulated market environment as well as to Japan's national decarbonization and energy security goals. The article emphasizes the importance of combining advanced forecasting with economic optimization for resilient renewables integration.
Footnotes
Funding
The authors received no financial support for the research, authorship, and/or publication of this article.
Declaration of conflicting interests
The authors declared no potential conflicts of interest with respect to the research, authorship, and/or publication of this article.