
Abstract
Addressing the limitations of the liquid-based Li-ion batteries (LIBs) for the application of electric vehicles (EVs), solid-state batteries (SSBs) are claimed to be a solution, despite their own limitations under study. Though LIB is commercialised, the day-to-day run has many drawbacks, which render low consumer interest towards EVs than conventional vehicles, and SSB emerges as an alternative and efficient source of power, which can only be assured by testing. Hardware analysis of the SSB in the laboratory takes up time, space and expense. Computational modelling and artificial intelligence have reduced the need for those by bridging theoretical and practical establishment, providing insights into the challenges being faced and also directing towards future improvement. This study comprises SSB's compatibility with EV in comparison to LIB. Performance of five solid state electrolytes (SSEs) such as Li7La3Zr2O12 (lithium lanthanum zirconium oxide), Li10GeP2S12 (lithium germanium phosphorus sulphide), Li6PS5Cl – lithium argyrodite (lithium phosphorus sulphide chloride), Li3InCl6 – lithium indium chloride and PEO–LiTFSI – poly(ethylene oxide) – lithium bis(trifluoromethanesulfonyl) imide are analysed at varying temperature, thickness, ionic conductivity, resistance and interaction with cathode particle size using electrochemical computation. A multi-criteria decision-making algorithm is used, and a feedforward neural network is employed. The results are interpreted with a commercial liquid state LIB to estimate its compatibility with EV. The novelty of this study lies in addressing the selection of a suitable SSE by splitting the cell on three computational bases and incorporating one of them, and establishing the pathway from computation to a neural network.
Keywords
Introduction
Solid-state batteries (SSBs) provide extended range, faster recharging and improved safety. They have energy density as they are smaller, lighter batteries that can store more energy, making them ideal for electric vehicles (EVs). By 2025, the global EV battery market is projected to grow from USD 91.93 billion to USD 251.33 billion by 2035, expanding at a Compound Annual Growth Rate (CAGR) of 9.6% (GlobeNewswire, 2025). On the contrary, optimising SSB for EV employment for increased mileage and lifetime reduces the deployment towards the second life, which further reduces wastage. A uniform distribution and close contact between the active materials and solid electrolyte particles are essential for a proper electrochemical behaviour of the electrodes, which determines the efficiency of the battery. Computational models that simulate the electrochemical behaviour provide insights, ultimately enhancing the performance of SSB cells. Analysing SSBs is intensive and time-consuming due to their complex chemical environment (Waseem, 2025). Machine learning (ML) algorithms can be used to mine an extensive material database and integrate suitable and efficient cathode, anode and electrolyte materials for the SSBs. Computational modelling and artificial intelligence (AI) have become central to next-generation battery designs, particularly for solid-state architectures. The AI-driven battery technology segment, meanwhile, is experiencing explosive momentum with major labs (e.g. Microsoft - Pacific Northwest National Laboratory (PNNL)) (Ji et al., 2022). Despite this growth, no existing review integrates multi-scale computational modelling with AI-driven generative design and reinforcement learning (RL) optimisation. This review fills a critical gap that bridges EV battery design, AI-based analysis for SSB employment to uplift a sustainable EV battery economy. Computational modelling and data-efficient AI coalesce to enable rapid material discovery, performance optimisation, laying the foundation for scalable, cost-effective SSB (Wang, 2025a). This hybrid design is now redefining the way SSBs are engineered for EV applications. Figure 1 reveals the strengths and trade-offs between computational modelling and AI-driven approaches; computational excels in physical accuracy, while AI thrives on large datasets offering rapid inference. A lot of practical implications are done via these hybrid approaches and undertaken by companies for commercialisation. From the atomic level to the assembly, physical interpretation is computational, and decision-making is data-driven in real time.

Capability score (1–5).
This fusion of computational physics and AI is poised to deliver lighter, safer, and faster-charging EV batteries, marking a step change in electrification and sustainability. The capability comparison across various dimensions between computational modelling and AI-driven designing is shown in Figure 2.
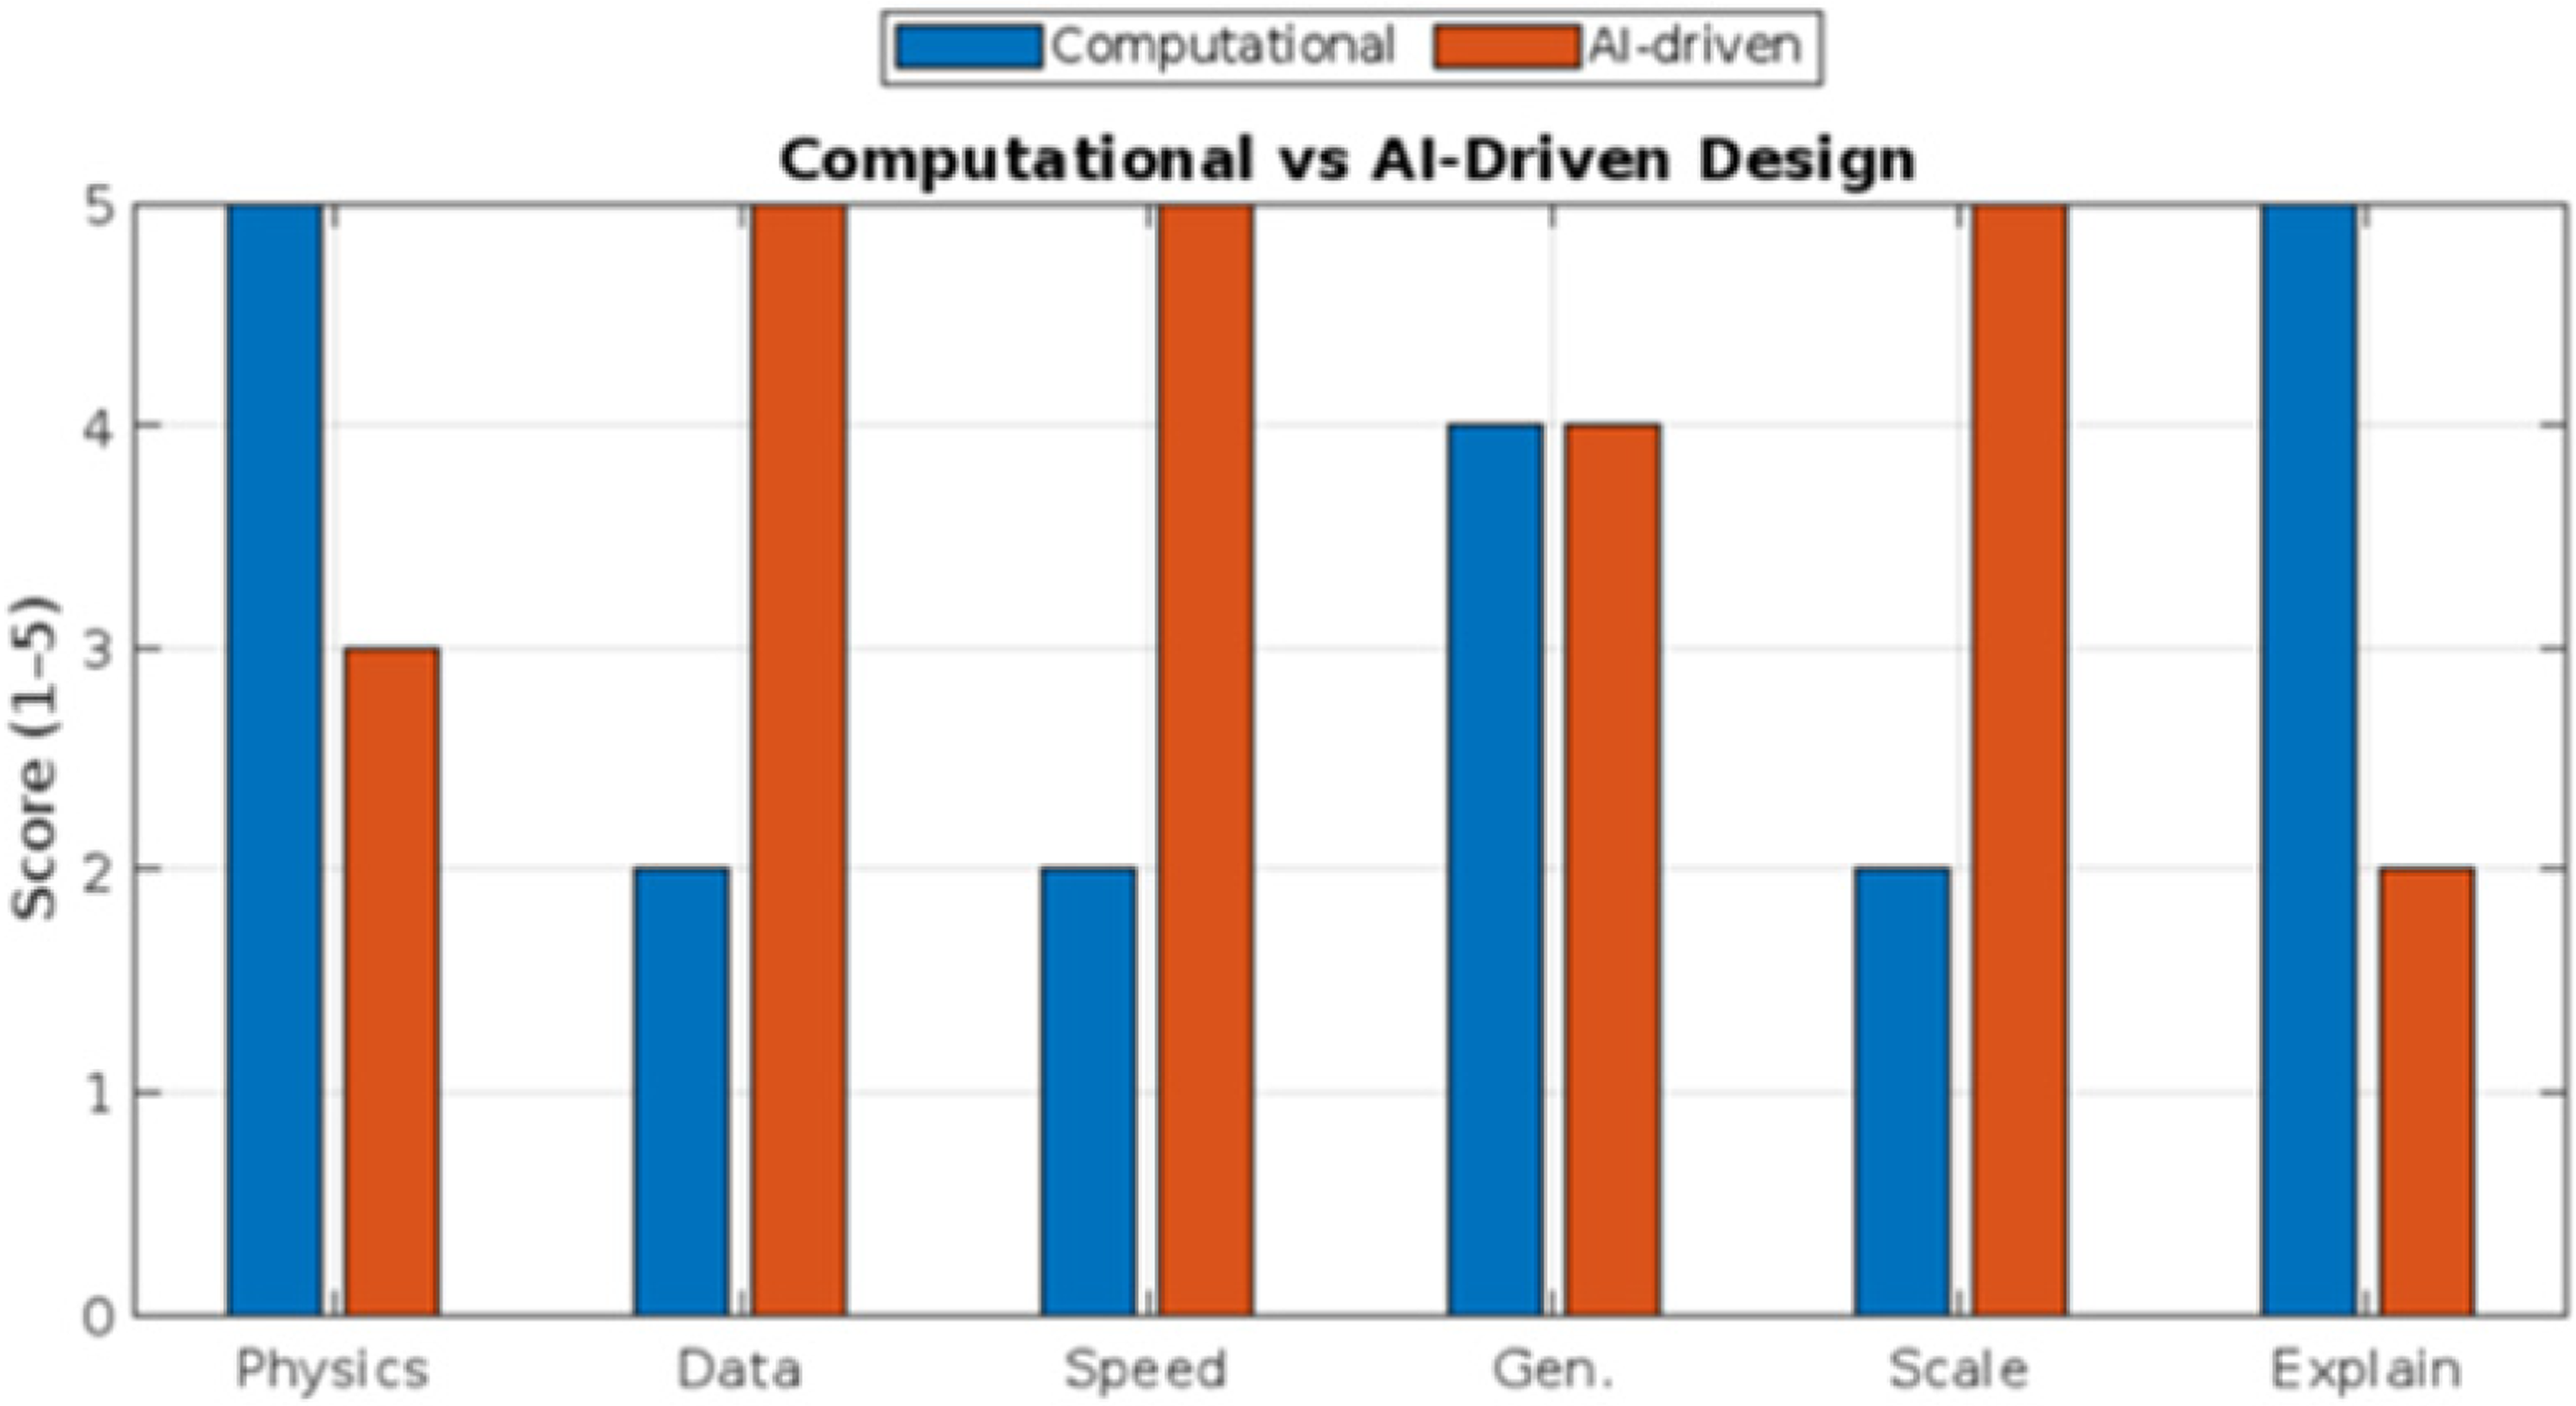
Computational versus artificial intelligence (AI)-driven design.
Unlike prior reviews that separately address computational or AI aspects, this work integrates both into a unified hybrid modelling–AI framework for material-level decision making in SSB design.
Specifically,
A comparative analysis of five solid-state electrolytes (SSEs) is conducted under five coupled physicochemical parameters relevant to EV operation. The computational models are explicitly mapped to each electrolyte's transport or interface-dominant behaviour. A multi-criteria AI decision framework (MCDM) bridges electrochemical trends with EV performance metrics (ionic conductivity, thermal stability, interfacial resistance, and safety factor) (Banerjee et al., 2020). The workflow establishes a repeatable protocol for SSE selection for EV cells.
The novelty of this article lies in the incorporation of fundamental electrochemical principles to generate the data. This approach provides complete control over real-time issues encountered at the cell level, allowing any deviations in performance to be directly observed and analysed at their origin. The electrochemical model employed offers flexibility to enhance cell performance through multi-parameter analysis at the material and chemistry level. By obtaining first-hand data derived directly from electrochemical computations, this framework enables the selection of the most suitable algorithm for training and optimising the neural network (NN) model.
Literature survey
The development of SSB has gained significant attention due to its potential to overcome the safety and energy limitations of conventional lithium-ion systems. Research in this field spans materials discovery, interface engineering, and system-level optimisation, all of which rely heavily on advanced computational and analytical methods. Computational modelling offers a means to understand the underlying electrochemical and physical processes that govern battery behaviour, and AI enables data-driven insights, pattern recognition, and performance prediction. Together, these approaches complement experimental work and contribute to faster, more informed decision-making in SSB design. This section reviews existing literature across three key areas: SSB development, computational modelling and AI applications, to establish the foundation for the integrated framework presented in this study.
Solid-state batteries
SSB represents a next-generation energy storage technology that replaces the flammable liquid electrolyte, conventional Li-ion batteries with SSE. The internal structure is shown in Figure 3. SSBs exhibit ionic conductivities exceeding 10−3 S/cm while maintaining superior thermal and mechanical stability (Furat, 2025). Recent advances in computational modelling and AI have accelerated the optimisation of SSBs by predicting interfacial dynamics, dendrite suppression mechanisms and optimal microstructural architectures for fast-charging EVs (Casas-Cabanas and Palacín, 2025). The performance of the SSB is mainly determined by the SSE composition. Figure 4 scales the different SSEs at various parameters.
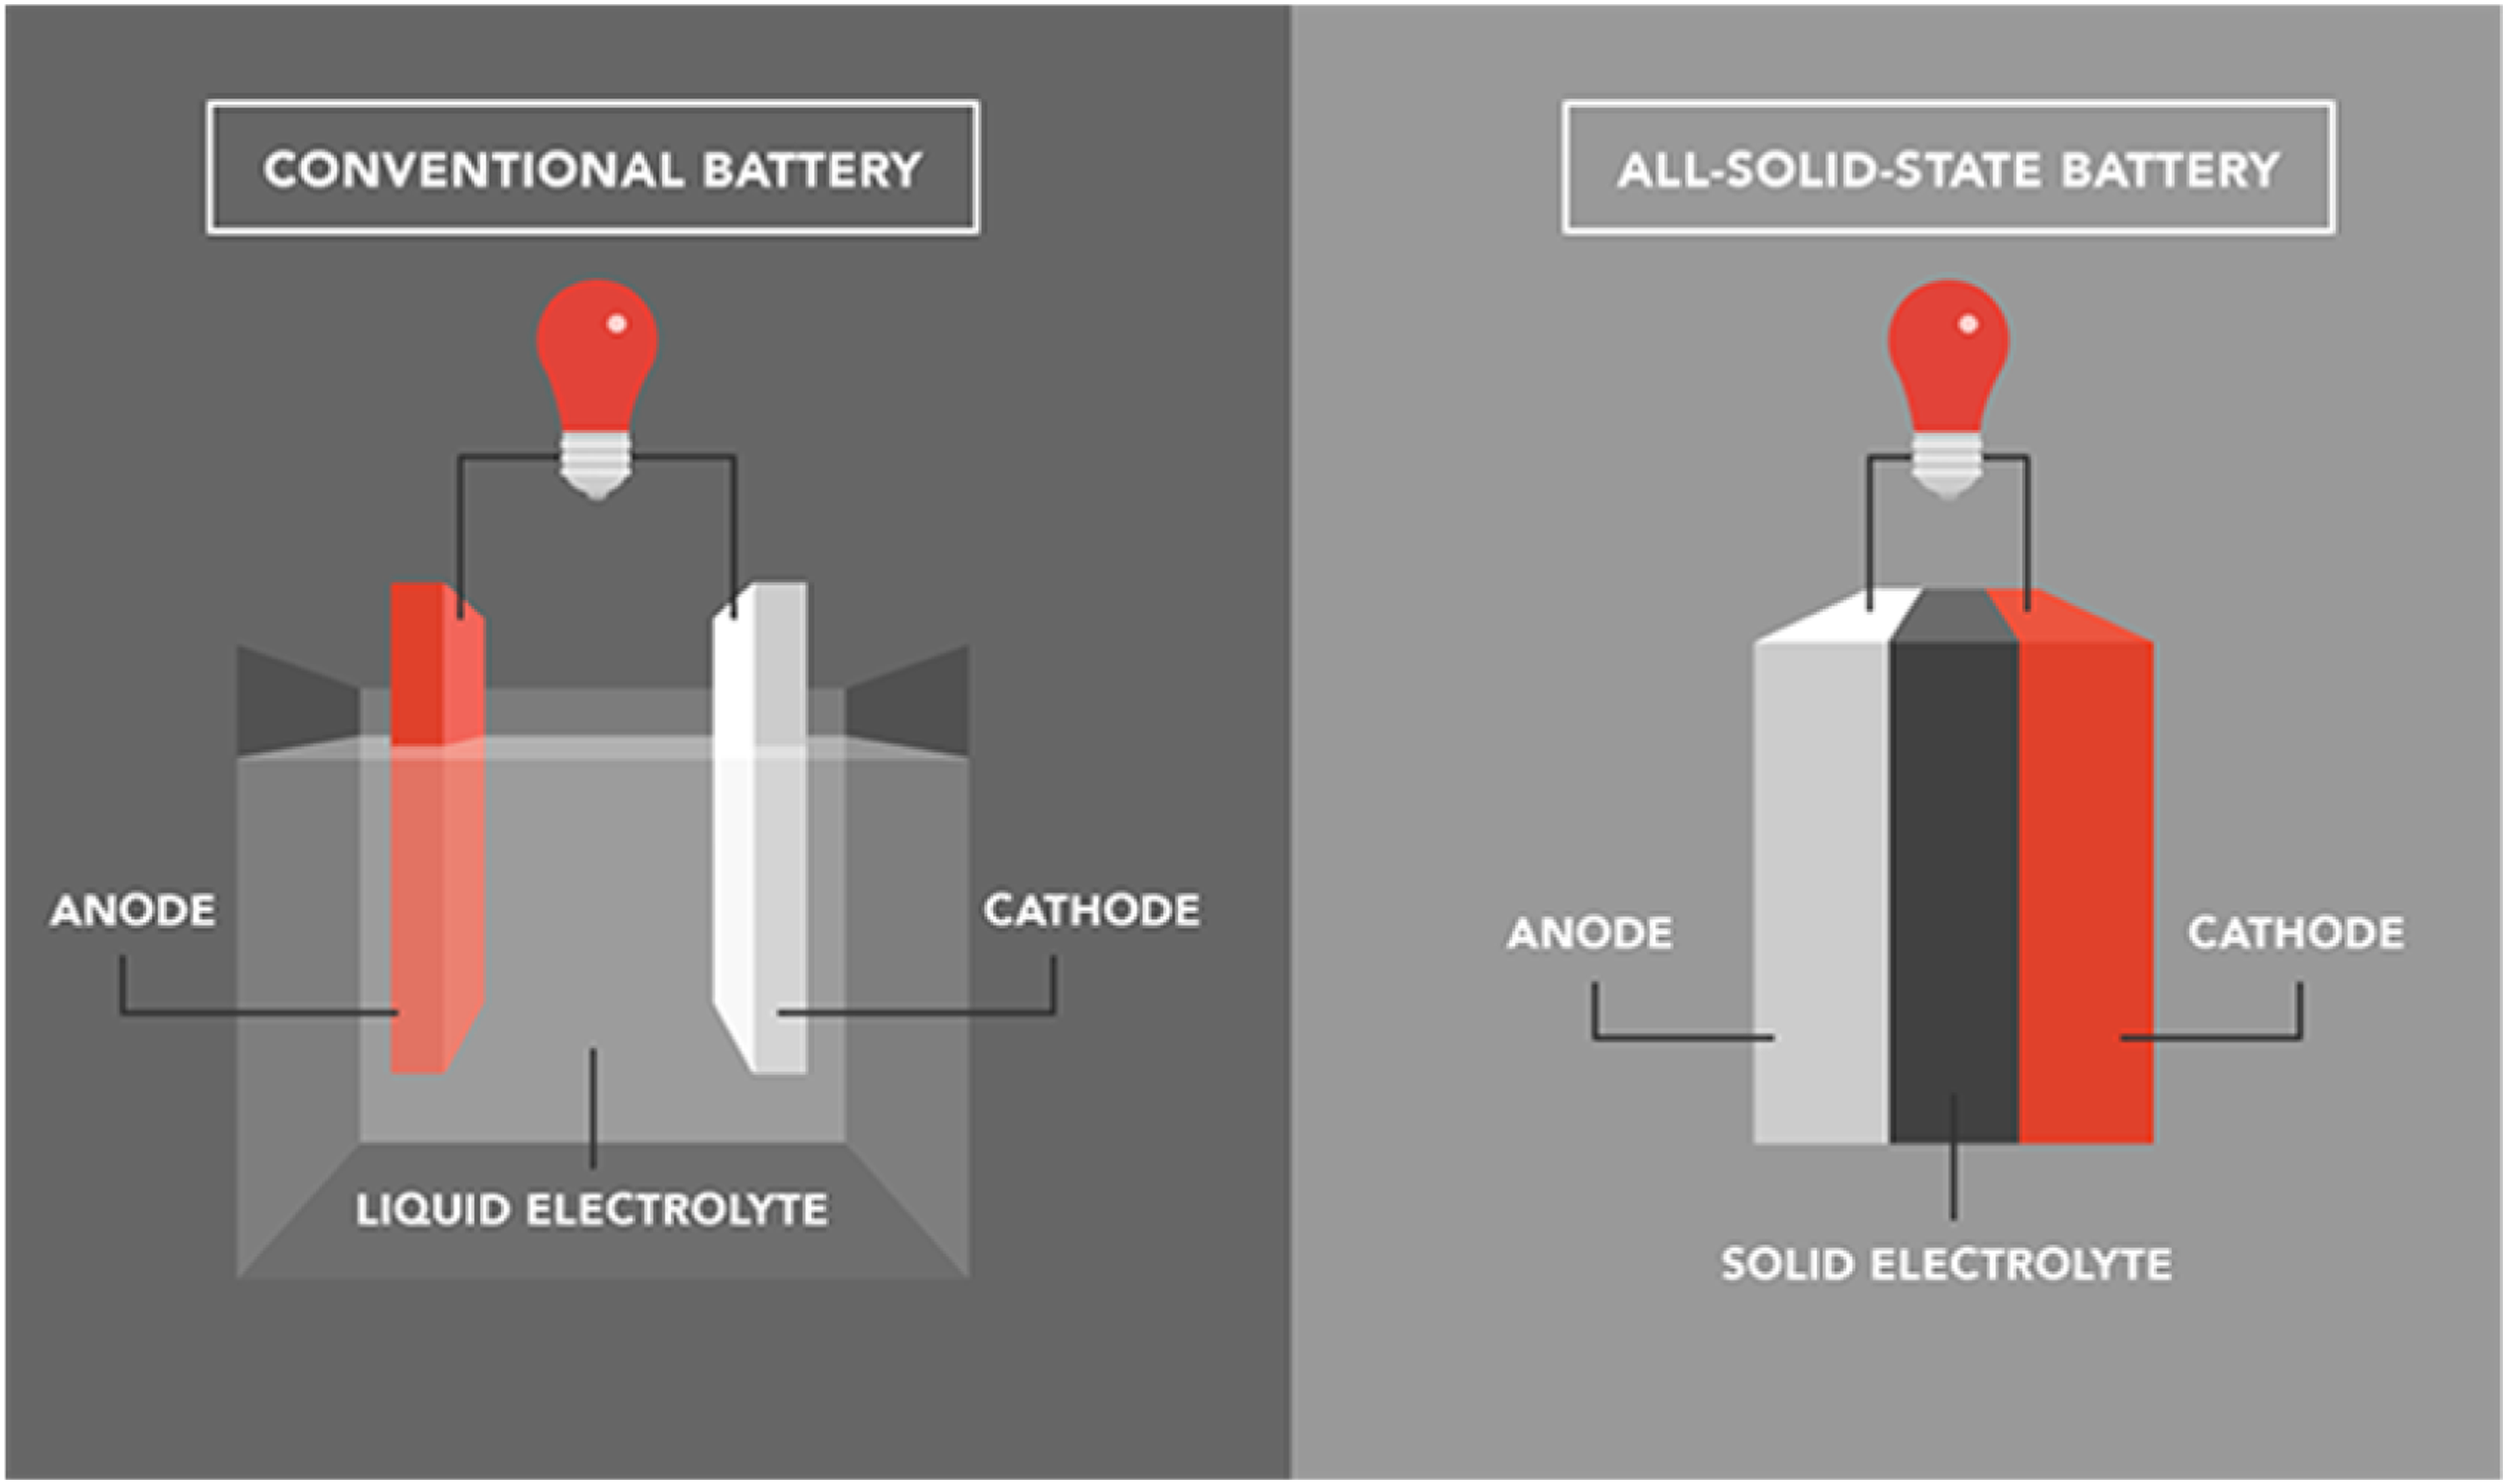
SSB versus LIB architecture (Zhang et al., 2021).
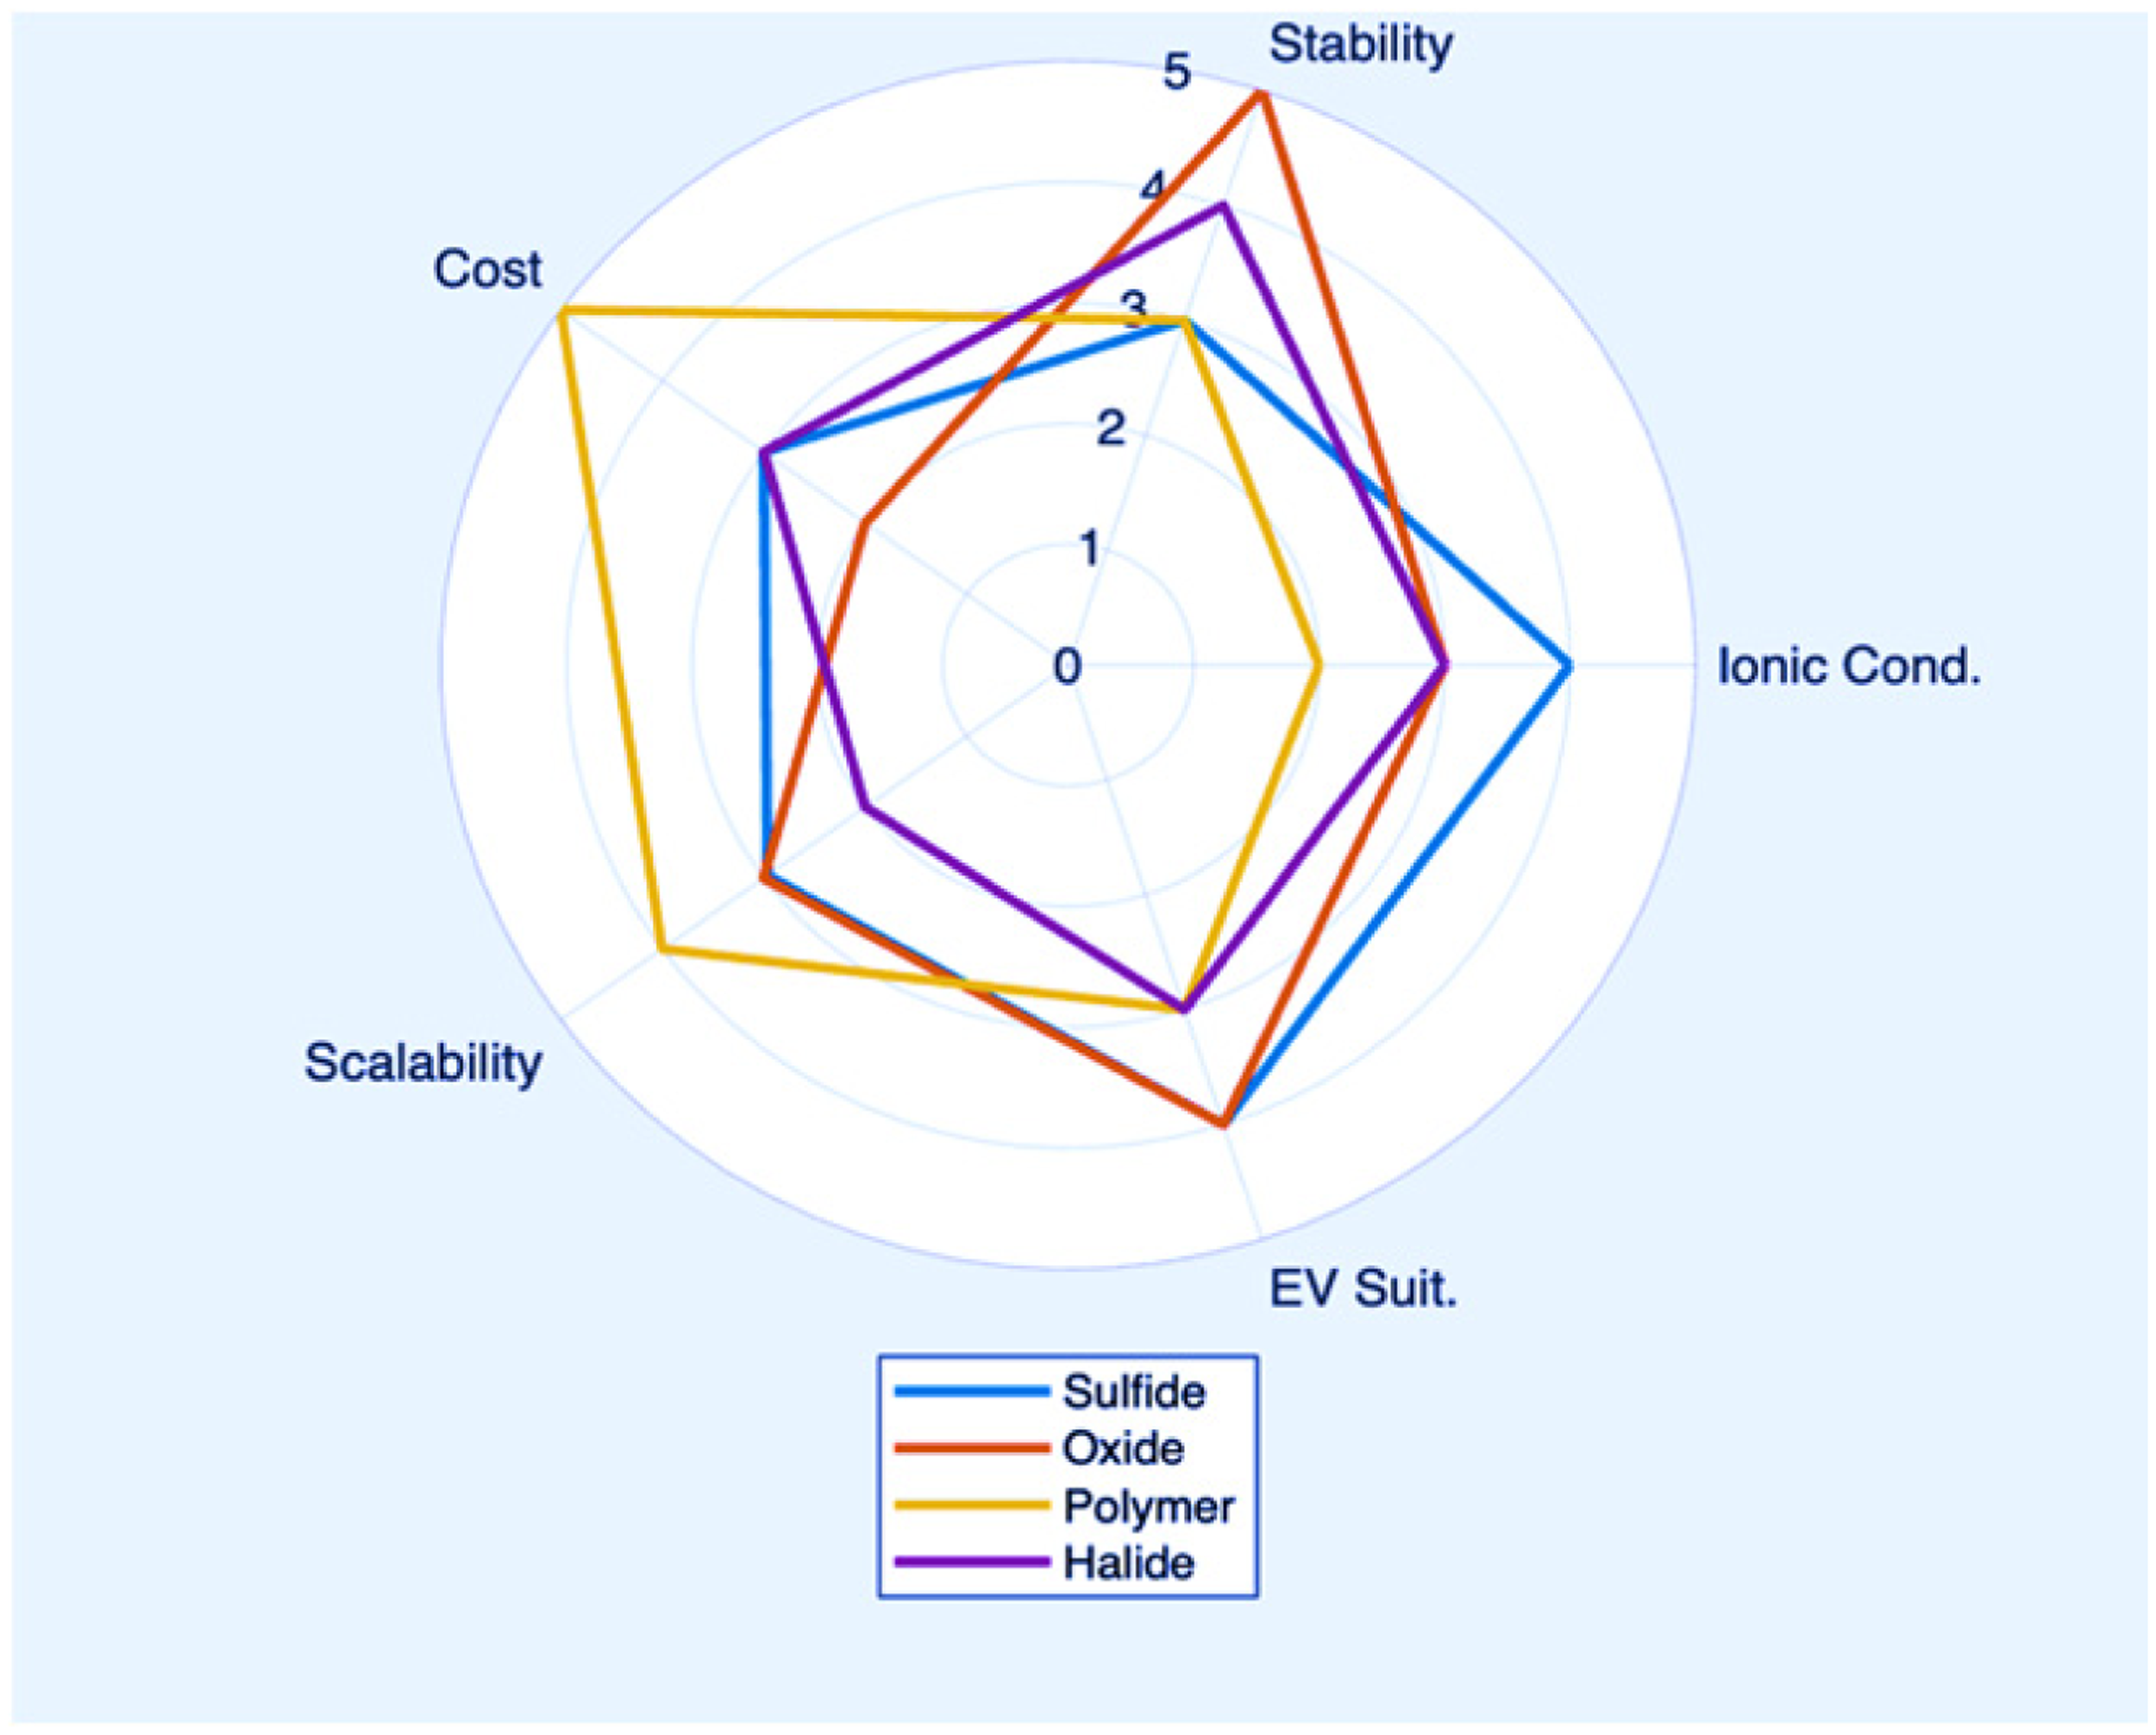
Solid state electrolyte (SSE) analysis.
SSB development focuses on three electrolyte types: sulphides offer high ionic conductivity but face toxicity and manufacturing challenges; polymers are scalable but require higher temperatures and have stability issues; and oxides provide excellent stability for lithium metal anodes but suffer from high interface resistance and costs (Nzereogu et al., 2024). Each technology involves trade-offs in performance, cost, and scalability, with the report detailing their strengths and limitations, which are stated in Table 1 via selective parameters.
Compatibility with electric vehicles (EVs).
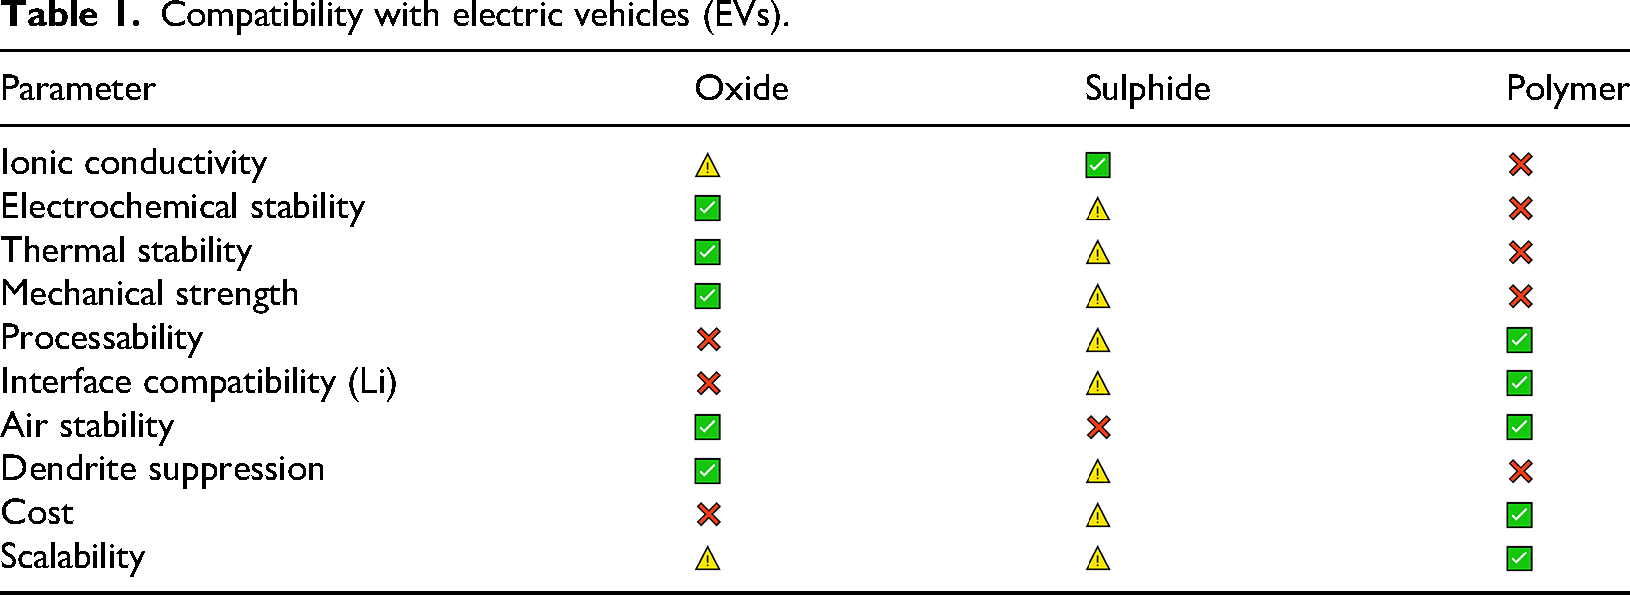
Table 1, a selective design can be structured for specific usage. SSBs’ anode materials mainly include three types: metallic lithium, carbon materials and silicon materials. Lithium ions have high energy density and offer improved safety, and are often used in aerospace and military fields (Liu et al., 2022). Carbon anodes have a high specific surface area and enhanced electrochemical performance, making them suitable for high-performance SSB (Hatz et al., 2021). Silicon integration is an emerging sector with high specific capacity and low cost (Mao et al., 2025). The cathode of the SSB mainly comprises lithium cobalt oxide (LiCoO2), which can provide high energy density and long cycle life, but safety seems to be a threshold (Taminato et al., 2024). Lithium iron phosphate (LiFePO4), compared to lithium cobalt oxide, offers better safety and longer lifespan but lesser energy density (Serbessa et al., 2024). Lithium nickel oxide (LiNiO2) is expensive in spite of the high energy density and long cycle life offered (“Electrolytes in Solid-State Batteries,” 2024). Lithium aluminium oxide (LiAlO2), high energy density, but the cycle life is lower than lithium nickel oxide. In addition to these, lithium manganate (LiMn2O4) and lithium titanate (Li4Ti5O12) can provide better safety and longer lifespan, but the energy density is relatively low (Suci et al., 2023). The positive and negative electrodes are divided by the separator to prevent electronic conduction. The architectural outline of an SSB is illustrated in Figures 5 and 6. The separator material mainly includes a composition of polymer and nanoscale powders. The commonly used materials of anode, cathode and electrolytes are listed in Tables 2 to 4, respectively, along with their key characteristics. The individual components of the SSB are shown in Figure 5, which highlights the order of internal structural arrangements. The SSEs mentioned are further elaborated into sectoral types. Oxide electrolyte – LIPON, NASICON and Garnet type and sulphide electrolytes – LPS and argyrodites (Wang, 2025b). These types are varied based on their atomic structure and state of matter. Each offering unique properties prescribed for the manufacturing of the battery for a specific application (Umair et al., 2024). In addition to oxide, sulphide and polymer electrolytes, halide, composite and hybrid solid–liquid type electrolytes have also been employed (Flash Battery, 2022). Recent studies highlight that interfacial modification and structural tuning in halide and sulphide electrolytes can substantially lower resistance and enhance Li-ion mobility. Techniques such as lattice doping and nano-coating improve interphase stability, enabling higher conductivity and mechanical compatibility under moderate processing conditions (Chen et al., 2023).
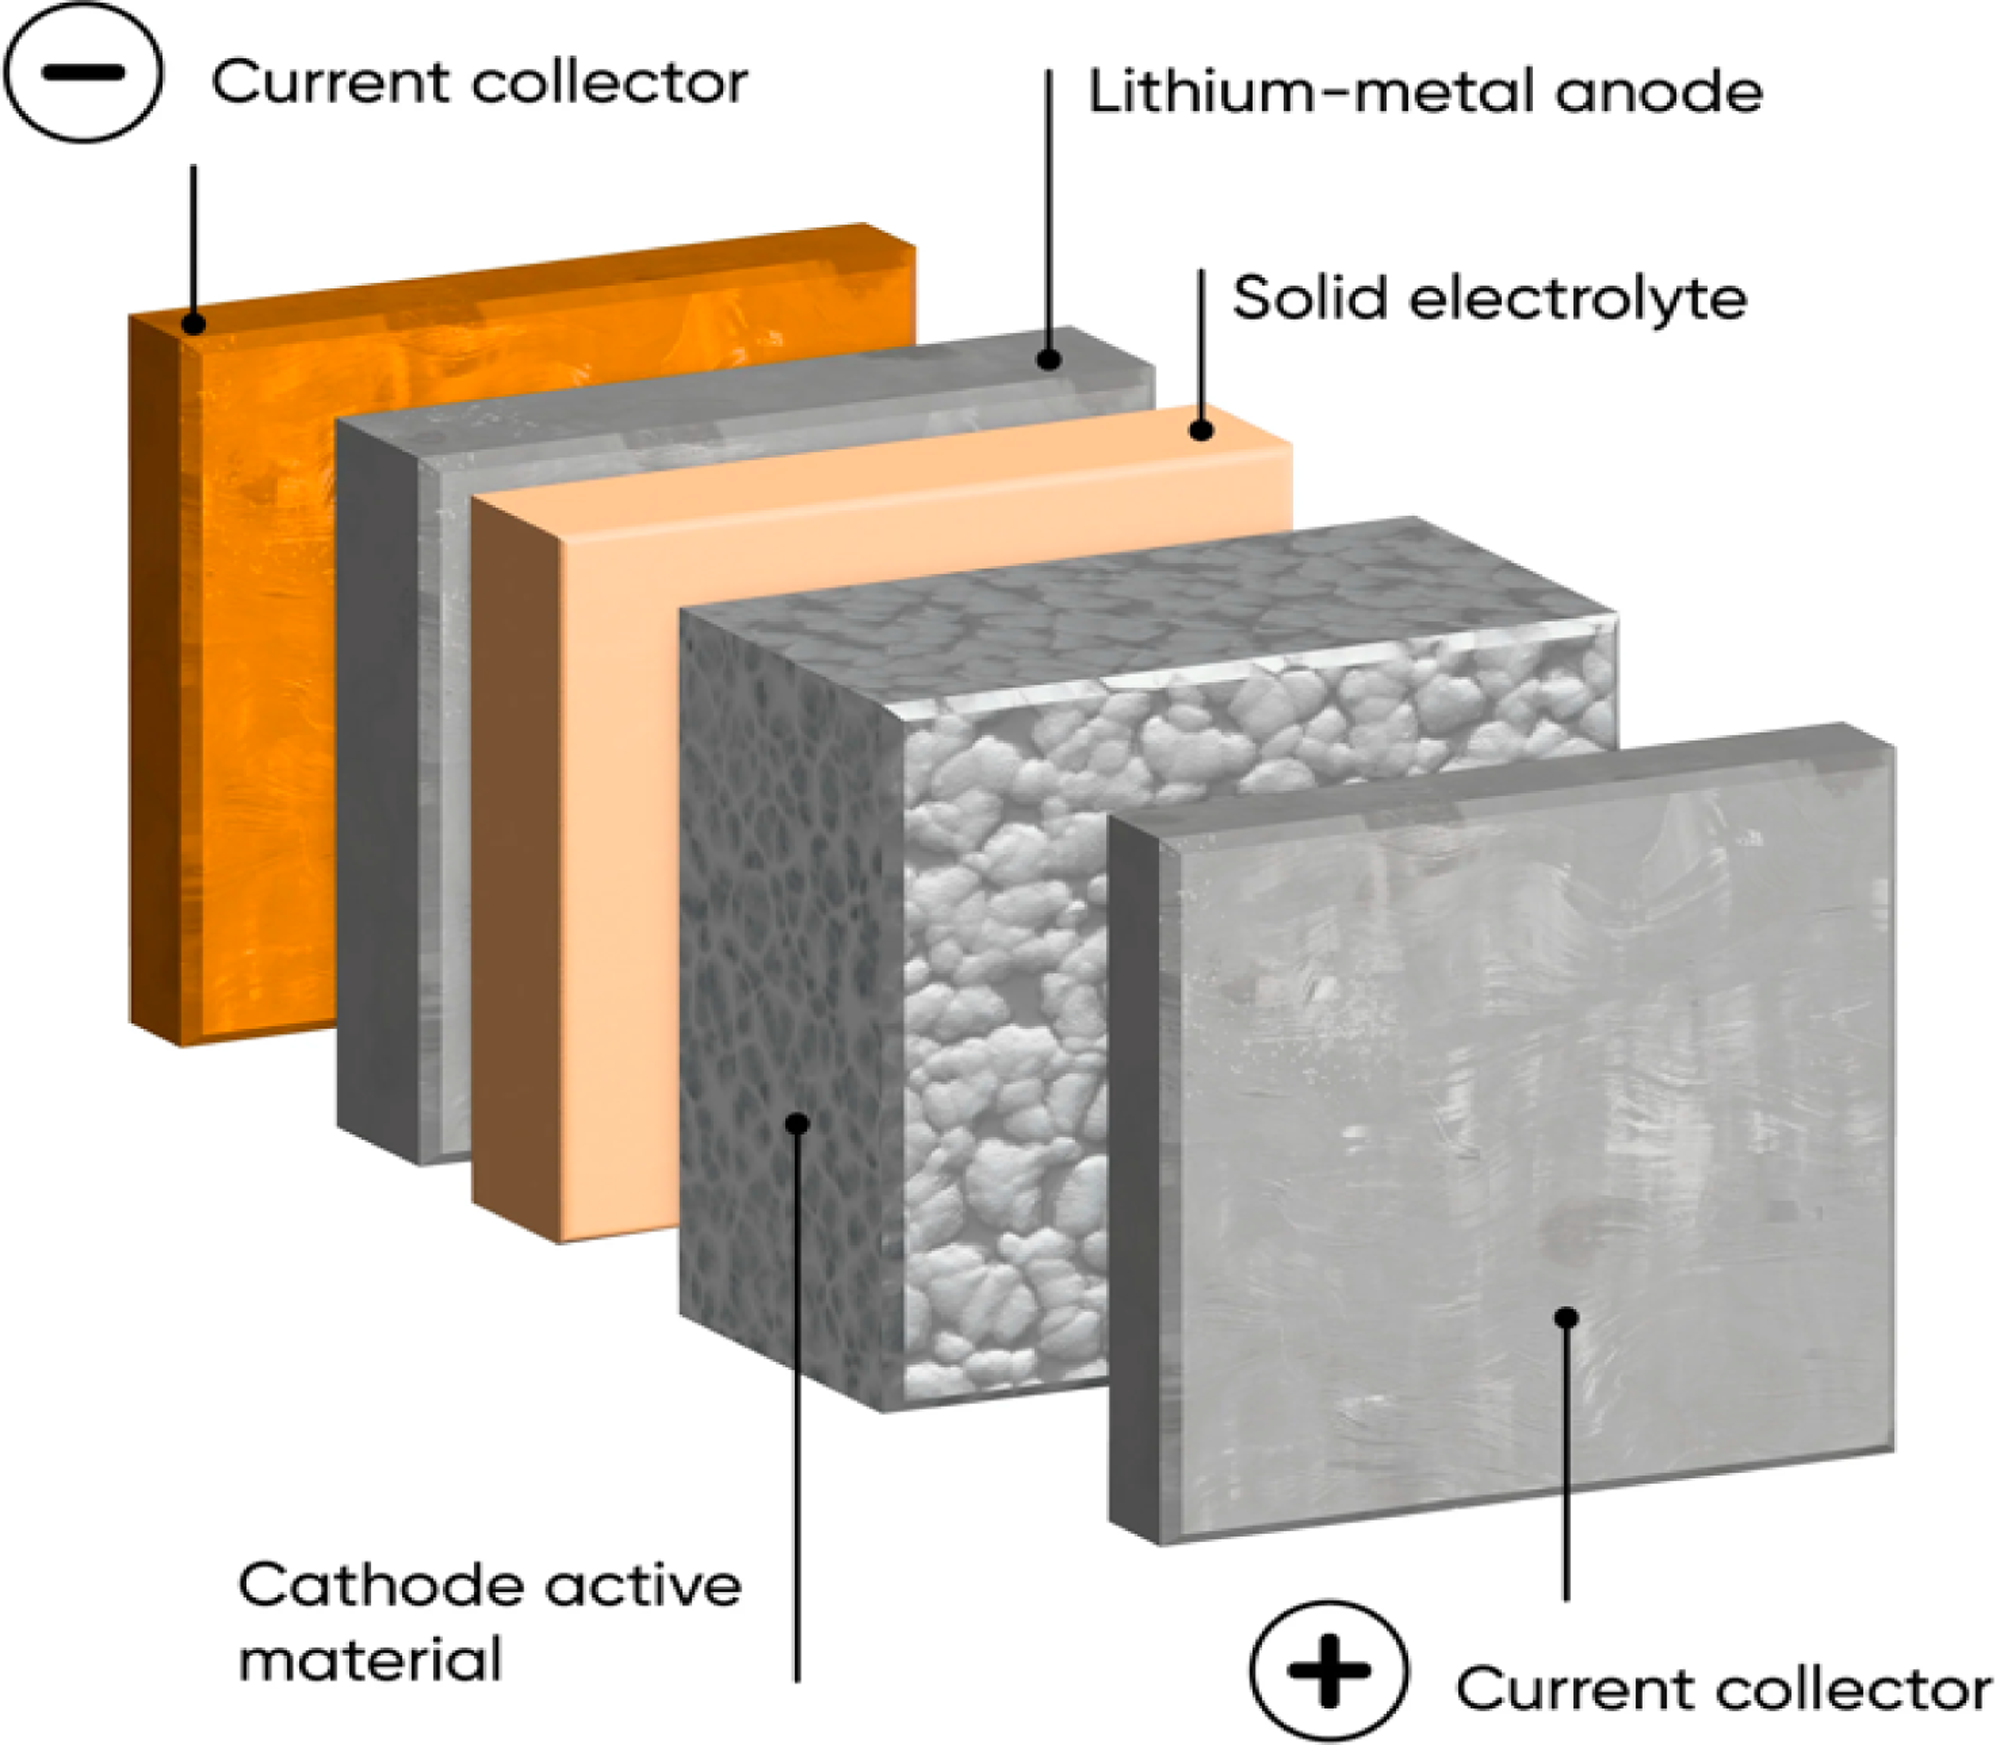
Internal structure of solid-state batteries (SSBs) (Tang et al., 2025).

(a) LIB and (b) SSB (Liu et al., 2022).
Anode materials.

Cathode materials.

LiCoO2: lithium cobalt oxide; LiFePO4: lithium iron phosphate; LiMn2O4: lithium manganate.
SSE materials.

SSE: solid state electrolyte; LLZO: lithium lanthanum zirconate – garnet-type oxide; PEO: poly(ethylene oxide).
Halide electrolytes hold merits like weaker coulombic interaction between monovalent halogen atom and lithium ions, leading to faster Li-ion transport and high ionic conductivity (Tao et al., 2023) the larger radii of its anion enhance mobility and deformability due to their unique chemical attributes of halogen anions (Umair et al., 2024). Higher electrochemical redox potential, especially of the fluoride and chloride anions, contributed to greater oxidative stability (Tao et al., 2023). In spite of its merits, it has low ionic conductivity at room temperature, which tends to be the top priority for the EV application (Umair et al., 2024). Composite electrolytes exhibit high ionic conductivity, exceeding 10−4 S/cm despite the poor chemical and mechanical behaviour. The evolution of hybrid solid–liquid electrolytes is faced with low ionic conductivity, robust interfacial conduct with the electrodes, yet hopes to provide a breakthrough in exceeding the limitations of the other types (Randau et al., 2020). While liquid state lithium-ion batteries have dominated the market since their commercialisation in 1991, their limitations, such as flammability risks, resource constraints, and environmental concerns, have spurred interest in SSB (Chen, 2021). The difference in dimensions of the LIB and SSB is shown in Figure 6(a) and (b).
Despite their high energy density and safety advantages, SSBs face significant barriers to commercialisation compared to conventional Li-ion batteries. Manufacturing complexity and cost remain primary challenges. Current SSB fabrication involves sintering or high-pressure densification of solid electrolytes like LLZO or sulphides, which can cost 2–4 times more than Li-ion cell production due to specialised equipment, stringent dry-room environments, and limited scalable roll-to-roll processes (Furat, 2025). Interfacial resistance between the solid electrolyte and electrodes hampers ionic transport, requiring stack pressures of 0.1–1 MPa to maintain contact, which is incompatible with cost-effective large-scale EV pack design (Sakuda et al., 2023). Dendrite growth in lithium metal anodes, especially at high C-rates, can penetrate solid electrolytes, causing short circuits, despite early assumptions that SSBs are dendrite-proof (Kubicek, 2021). Moisture sensitivity and instability of sulphide-based electrolytes, which degrade upon air exposure to release H2S gas, significantly complicate cell assembly and storage (QuantumScape Corp., 2024). Low room-temperature ionic conductivity of polymer-based electrolytes requires preheating or hybrid designs, limiting energy efficiency in EVs (Zhang et al., 2021). Scalability and yield issues, such as cracking of oxide electrolytes during sintering and low manufacturing, have slowed mass adoption (Tekin and Karamangil, 2024). While pilot lines by Toyota and Quantum Scape have shown progress, these challenges collectively keep SSBs from achieving the cost ($/kWh) and manufacturing maturity of Li-ion technology (Hu et al., 2012).
Computational modelling
Computational modelling involves mathematical and numerical simulation of the internal physiochemical processes in a battery, comprising equations varying in real time like electrochemical reactions, ion transport, heat generation, and degradation patterns (solid electrolyte interface (SEI) formation and lithium plating), which helps in predicting battery performance, studying degradation, designing battery management system (BMS), optimising second life and fast charging scenarios. Battery modelling is classified into three types: electrochemical, mathematical and electrical (Yao et al., 2022). Categories include (1) empirical model (data-driven), which is based on experimental data. Finds patterns between inputs and outputs using mathematical tools like curve fitting and regression. They are fast, easy to implement and good for real-time applications like BMS. The limitation it holds is its validity within the range of data used to build it.
(a) Open-circuit voltage (OCV) – which is used to predict the state-of-charge (SOC) relationship. The relation is typically non-linear and unique for each battery chemistry. The polynomial equation (1) is used to simulate and control systems to estimate SOC just from voltage.
(b) Internal resistance estimation – resistance increases as the battery degrades. Measures the terminal voltage and current during a pulse test. Equation (2) tracks the value over time and fits a regression model to estimate ageing.
(2) Equivalent circuit models (ECMs) – this category simplifies the battery to electrical elements like resistors (R), capacitors (C) and voltage sources. Rint model (simple), Thevenin model, dual polarisation (DP) model are familiar under this category. The mathematical interpretation of this model is given in the following equation:
A general SSB internal analogue is represented using the DP model (Choudhary et al., 2022). The equivalent circuit representation used for cell-level validation in SSB follows the DP model, including an ohmic resistance (Ro), charge transfer resistance (R₁), and double-layer capacitance (C₁). The governing voltage response is expressed in the following equation:
The circuit (Figure 7) represents a physics-based electrical analog of the electrochemical dynamics in an SSB. Uoc is the open-circuit voltage; Ro models the ohmic resistance of the electrolyte; each parallel Rpa–Cpa and Rpc–Cpc branch captures polarisation effects due to charge transfer and diffusion at the anode and cathode interfaces, respectively. The terminal voltage UL under load current IL is expressed in the following equation:
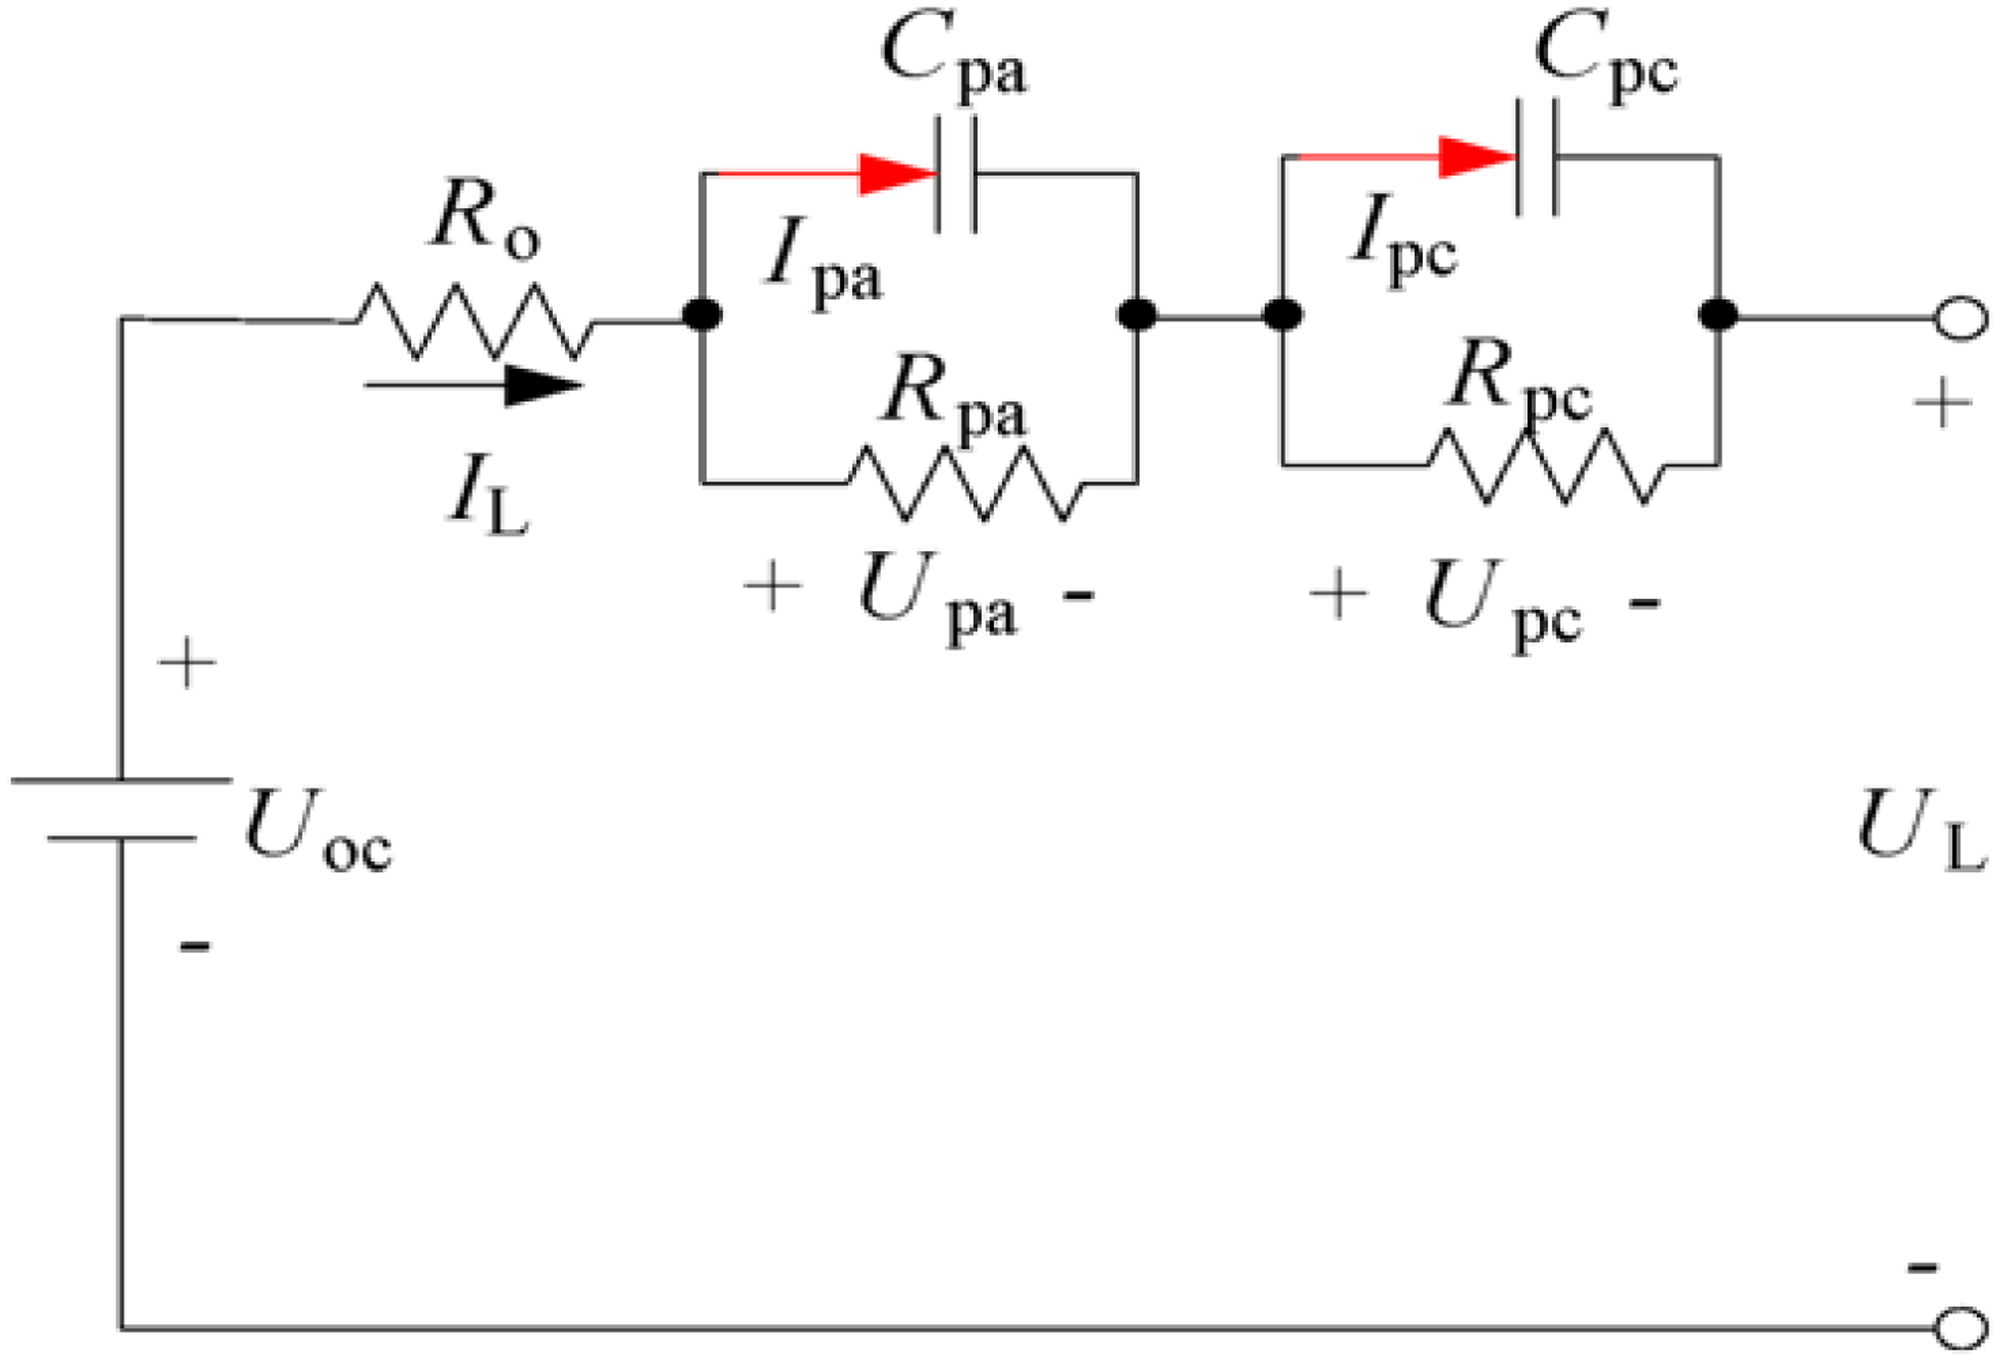
Dual polarisation (DP) model schematic diagram.
With dynamic polarisation voltages governed by the following equations:

This configuration accurately reproduces transient behaviour during charge/discharge, making it suitable for parameter identification and real-time state estimation in EV-specific SSB modelling.
(3) Electrochemical models – these are physics-based models that describe internal reaction and transport using partial differential equations (PDEs). These are slow but accurate. Key models under this category include (a) single particle model (SPM) – in this, each electrode is represented by one average particle. Assumes uniform reaction across the electrode and neglects electrolyte dynamics. The governing equations are given below:


(4) Thermal models – this model accounts for temperature rise due to joule heating, entropy change, and reaction kinetics. The key equation comprises heat as the following equation:
(5) Degradation models – this model simulates SEI layer growth, lithium plating and active material loss. SEI growth is estimated using Tafel kinetics (equation (15)), often added as a module in P2D/SPM.
Model aspects: LIB versus SSB (Menon and Ranganathan, 2022).

LIBs: liquid-based Li-ion batteries; SSBs: solid state batteries; PDE: partial differential equation.
Artificial intelligence
AI refers to computational systems designed to learn patterns from data, make predictions, and optimise outcomes (Tang et al., 2023). While conventional LIB research relies on a combination of empirical testing and physics-based modelling, AI bridges these methods by discovering patterns in large datasets and generating models that can predict material properties, interface behaviour, and degradation mechanisms before physical prototypes are built (Wang et al., 2024). At its core, AI for battery science can be grouped into three main categories: (1) supervised learning, which predicts outcomes (e.g. ionic conductivity) from known input features; (2) unsupervised learning, which groups data without predefined labels (e.g. clustering electrolyte materials by chemistry). (3) RL, which autonomously explores parameter combinations to reach an optimal design (Goodfellow et al., 2016). In SSB, where a solid electrolyte replaces the conventional liquid, the complexity of material interactions and interface stability makes predictive capability critical. In EV batteries, AI models such as long short-term memory (LSTM) networks or gradient boosting trees (XGBoost) are employed to forecast remaining useful life (RUL) based on cycling data, thermal history and load profiles (Darbar and Bhattacharya, 2022). This same methodology can be adapted for SSBs by training models on datasets that capture ionic conductivity, mechanical stability and degradation patterns of solid electrolytes. The physics governing the lithium transport in SSBs can be expressed by a simplified Nernst–Planck equation as follows:
By combining materials databases with machine learning algorithms, researchers can shortlist suitable solid electrolytes, either sulphide-based or oxide-based systems, by cross-analysing their electrochemical stability and ionic mobility, done by AI's NNs (Tang et al., 2023). Neural networks of the AI, streamline our desired value from a multitude of data of various parameters, to provide an optimum electrolyte for better performance (Wang et al., 2024). SSB involves complex nonlinear behaviour. Physics-based models are accurate but computationally heavy (Schmitt et al., 2023). NNs of the AI provide faster prediction once trained, the ability to model nonlinearities without exact governing equations, use of real-time sensor data for SOC/SOH (state-of-health) estimation (Darbar and Bhattacharya, 2022; Tang et al., 2023). A neural network consists of several key components that work together to model complex relationships in data. The input layer receives the data features, such as SOC, current, or temperature, and passes them into the network. Hidden layers act as intermediate processing stages, where the network transforms and combines the inputs to extract meaningful patterns. The output layer produces the final predictions, which could include terminal voltage, SOC, or ionic conductivity. Within the network, weights and biases are the adjustable parameters that the model learns during training to optimise performance. To capture complex, nonlinear relationships, activation functions are applied at each neuron, enabling the network to model patterns that simple linear systems cannot (Goodfellow et al., 2016). Together, these components allow neural networks to learn from data and make accurate predictions in a variety of applications. Different types of NNs are listed in Table 6. AI-integrated computational frameworks now enable multiscale prediction of interfacial degradation and ionic transport in SSBs. By linking quantum-level descriptors with electrochemical data, these models accelerate electrolyte optimisation and stability assessment (Zhao et al., 2025).
NN types and typical use (Darbar and Bhattacharya, 2022).

ECM: equivalent circuit model; NN: neural network; FNN: feedforward network; MLP: multi-layer perceptron; RNN: recurrent neural network; LSTM: long short-term memory; CNN: convolutional neural network; PDE: partial differential equation; SOC: state of charge; SOH: State of health.
Best-suited NN types for each SSB computational model are listed in Table 7 (Choudhary et al., 2022; Darbar and Bhattacharya, 2022; Guo et al., 2024; Menon and Ranganathan, 2022; Schmitt et al., 2023; Tang et al., 2023; Wang et al., 2024; Yao et al., 2022).
Computational/AI suitability.

AI: artificial intelligence; ECM: equivalent circuit model; NN: neural network; FNN: feedforward network; MLP: multi-layer perceptron; RNN: recurrent neural network; LSTM: long short-term memory; PDE: partial differential equation.
Methodology
In computation, at various operating temperatures, the required parameters considered along with the magnitude are listed in Table 8. The temperature (°C) conditions assumed are 20 °C, 40 °C, 60 °C and 80 °C. For the evaluation, the resistance of the components was taken (Table 9). The resistance of the anode and cathode current collectors is taken at a reference temperature of 80 °C (Nileshwar et al., 2017). The performance is estimated based on the ionic conductivity via the Arrhenius equation (equation (17)), for each electrolyte and temperature.
Model constants.

LLZO: lithium lanthanum zirconium oxide; LGPS: lithium germanium phosphorus sulphide; Li6PS5Cl: lithium argyrodite (lithium phosphorus sulphide chloride); Li3InCl6: lithium indium chloride; PEO–LiTFSI: poly(ethylene oxide)-lithium bis(trifluoromethanesulfonyl) imide.
Component's resistance (Ω).
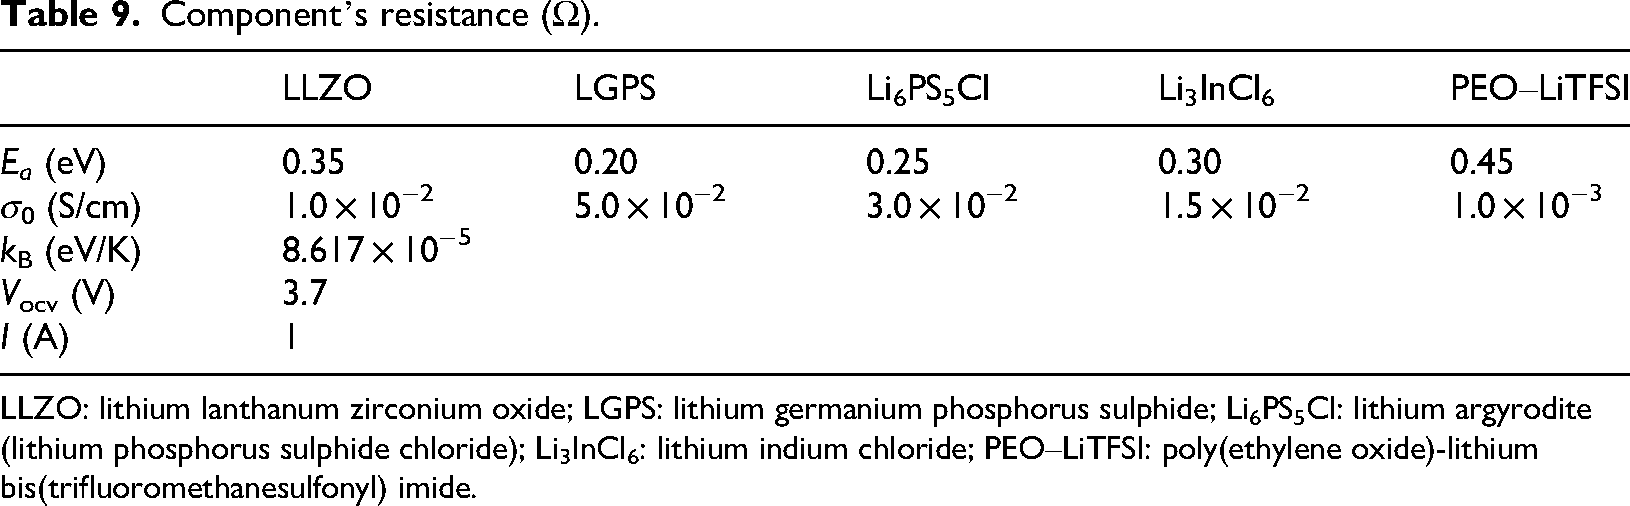
LLZO: lithium lanthanum zirconium oxide; LGPS: lithium germanium phosphorus sulphide; Li6PS5Cl: lithium argyrodite (lithium phosphorus sulphide chloride); Li3InCl6: lithium indium chloride; PEO–LiTFSI: poly(ethylene oxide)-lithium bis(trifluoromethanesulfonyl) imide.
The additional modelling equations employed are electrolyte resistance, which is inversely proportional to 


(a) SSE thickness – the effect of the electrolyte thickness is studied by the change in voltage behaviour of the battery during discharge. Four different thicknesses of 10, 25, 50 and 100 µm are taken and their performance is analysed based on the electrolyte's ionic conductivity. Key inputs are listed in Table 10.
SSE thickness.

SSE: solid state electrolyte; OCV: open-circuit voltage.
The governing equations include electrolyte resistance
Voltage drop during discharge
A small capacity fade term is included, capacity fade = 0.0005t; voltage is clipped at 2.5 V (cutoff limit). Loops over each electrolyte and each thickness are simulated. For every combination, electrolyte resistance is computed. The plot acquired, X-axis: time (minutes), Y-axis: voltage (V) for all electrolytes under each thickness.
(b) Ionic conductivity – V–I characteristics of different SSE are analysed to depict their ionic conductivity. The input parameters are listed in Table 11.
Input parameters for ionic conductivity.

OCV: open-circuit voltage; LLZO: lithium lanthanum zirconium oxide; LGPS: lithium germanium phosphorus sulphide; Li6PS5Cl: lithium argyrodite (lithium phosphorus sulphide chloride); Li3InCl6: lithium indium chloride; PEO–LiTFSI: poly(ethylene oxide)-lithium bis(trifluoromethanesulfonyl) imide.
A physics-based model is employed to calculate the voltage, which represents ohmic and interfacial losses as follows:
The output acquired is the V–I curves for all electrolytes.
(c) Resistance – the five electrolytes’ resistance is evaluated by voltage drop, power delivery and joule heating under different load currents for each electrolyte. The input parameters are listed in Table 12.
Resistance – key inputs.

LLZO: lithium lanthanum zirconium oxide; LGPS: lithium germanium phosphorus sulphide; Li6PS5Cl: lithium argyrodite (lithium phosphorus sulphide chloride); Li3InCl6: lithium indium chloride; PEO–LiTFSI: poly(ethylene oxide)-lithium bis(trifluoromethanesulfonyl) imide.
Modelling equations comprises:


Generated output plots include V versus I (discharge characteristics), P versus I (power delivery capability) and Q versus I (thermal losses). This model compares the electrolytes based on voltage retention under high current, power output capability and heat generation to analyse thermal safety.
(d) Cathode particle size – a parametric model is designed to study how the cathode particle size affects the performance of the electrolyte types. The influence of the cathode particle size is analysed on the effective ionic conductivity
Cathode particle size.
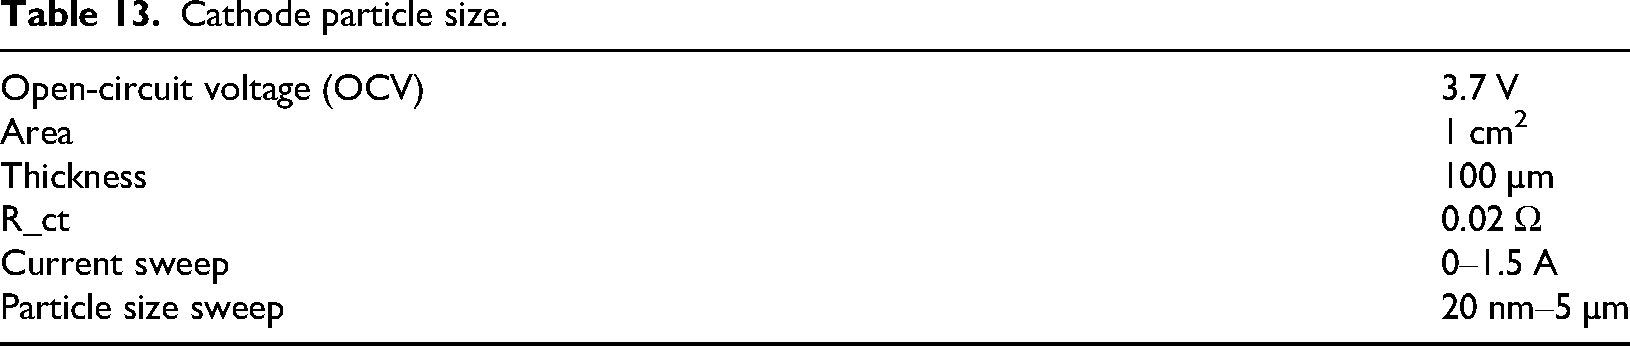
The core models are effective ionic conductivity


where as

The acquired outputs are effective conductivity vs particle size, V–I curves for selected particle sizes (50 nm, 200 nm, 1 µm and 5 µm) across all electrolytes. P versus Q at fixed I = 0.1A.
To reflect realistic EV usage, simulation parameters were extended beyond idealised conditions in Table 14 (Chen et al., 2023; Guo et al., 2024). Five representative driving and environmental scenarios were defined, aligned with common EV duty cycles: urban commute: 0.5 °C average discharge, 25 °C ambient, frequent idle–acceleration transitions. Highway drive: 2 °C continuous discharge at 40 °C ambient, sustained thermal load. Cold start: 0.5 °C discharge at −10 °C, highlighting ionic-conductivity degradation. Fast-charge event: 3 °C charge/discharge pulse at 50 °C, emphasising interfacial stability. Thermal runaway screening: transient 5 °C current spike with heat generation coupling. This enables a more realistic evaluation of SSE performance within EV operating envelopes rather than under static laboratory conditions.
Parametric-based electric vehicle (EV) profile.

Case study
The attribution of the hybrid computational model, together with AI integration, is used to predict a suitable SSE for EV application. The study is conducted employing an electrochemical model for computation and an FNN model for AI interpretation. Five ready-to-commercialise SSE materials are taken from Li7La3Zr2O12 (LLZO) lithium lanthanum zirconate – garnet-type oxide. Li10GeP2S12 (LGPS) lithium germanium phosphorus sulphide, Li6PS5Cl (lithium argyrodites) – argyrodite sulphide, Li3InCl6 (lithium indium chloride) – halide-based electrolyte, PEO–LiTFSI (lithium bis(tri-fluoro-methane-sulfonyl)imide), polymer. From Tables 15 and 16, LLZO (lithium lanthanum zirconium oxide) offers high electrochemical and mechanical stability, making it suitable for high-voltage applications. However, its ionic conductivity is moderate, and it is challenging to process, which can increase manufacturing costs (adapted from Hatz et al., 2021; Mao et al., 2025; Taminato et al., 2024; Zhao et al., 2025). LGPS (lithium-germanium-phosphorus-sulphur): exhibits high ionic conductivity, beneficial for fast-charging applications. Nonetheless, it is highly sensitive to moisture and has low mechanical stability, posing challenges for long-term reliability. Li6PS5Cl (lithium phosphorus sulphide chloride): balances ionic conductivity and electrochemical stability, making it a promising candidate for various applications. Its mechanical properties are moderate, and it is less sensitive to moisture compared to LGPS. Li3InCl6 (lithium indium chloride): provides high electrochemical stability and good mechanical properties, suitable for high-energy applications. However, its ionic conductivity is moderate, and it is less processable than other SSEs. PEO–LiTFSI (polyethylene oxide–lithium bis(trifluoromethanesulfonyl)imide). While offering excellent processability and low cost, its ionic conductivity is low, and it is sensitive to moisture and temperature variations, limiting its use in demanding EV applications. This comparative analysis underscores the trade-offs between ionic conductivity, stability, processability, and cost across different SSEs. Selecting the appropriate SSE for EV applications requires balancing these factors to meet specific performance and manufacturing requirements. All these types are explored for commercial SSB, with LLZO and Li6PS5Cl being used in prototypes by companies like QuantumScape and Solid Power, LGPS employed in high-conductivity designs by Toyota and other Japanese developers, halide electrolytes like Li3InCl6 gaining traction for high-voltage cathode stability, (Wang et al., 2021) and PEO–LiTFSI polymer systems already featured in some hybrid solid-state cells due to their processability. For a dynamic study of these SSEs, a standard SSB design is employed. Anode – graphite, cathode – LiNi₀.₈Mn₀.₁Co₀.₁O2 (NMC 811) (lithium nickel manganese cobalt oxide), separator material – Al2O3-coated ceramic films, anode current collector – copper foil, cathode current collector – aluminium foil.
Selection criteria for SSE.
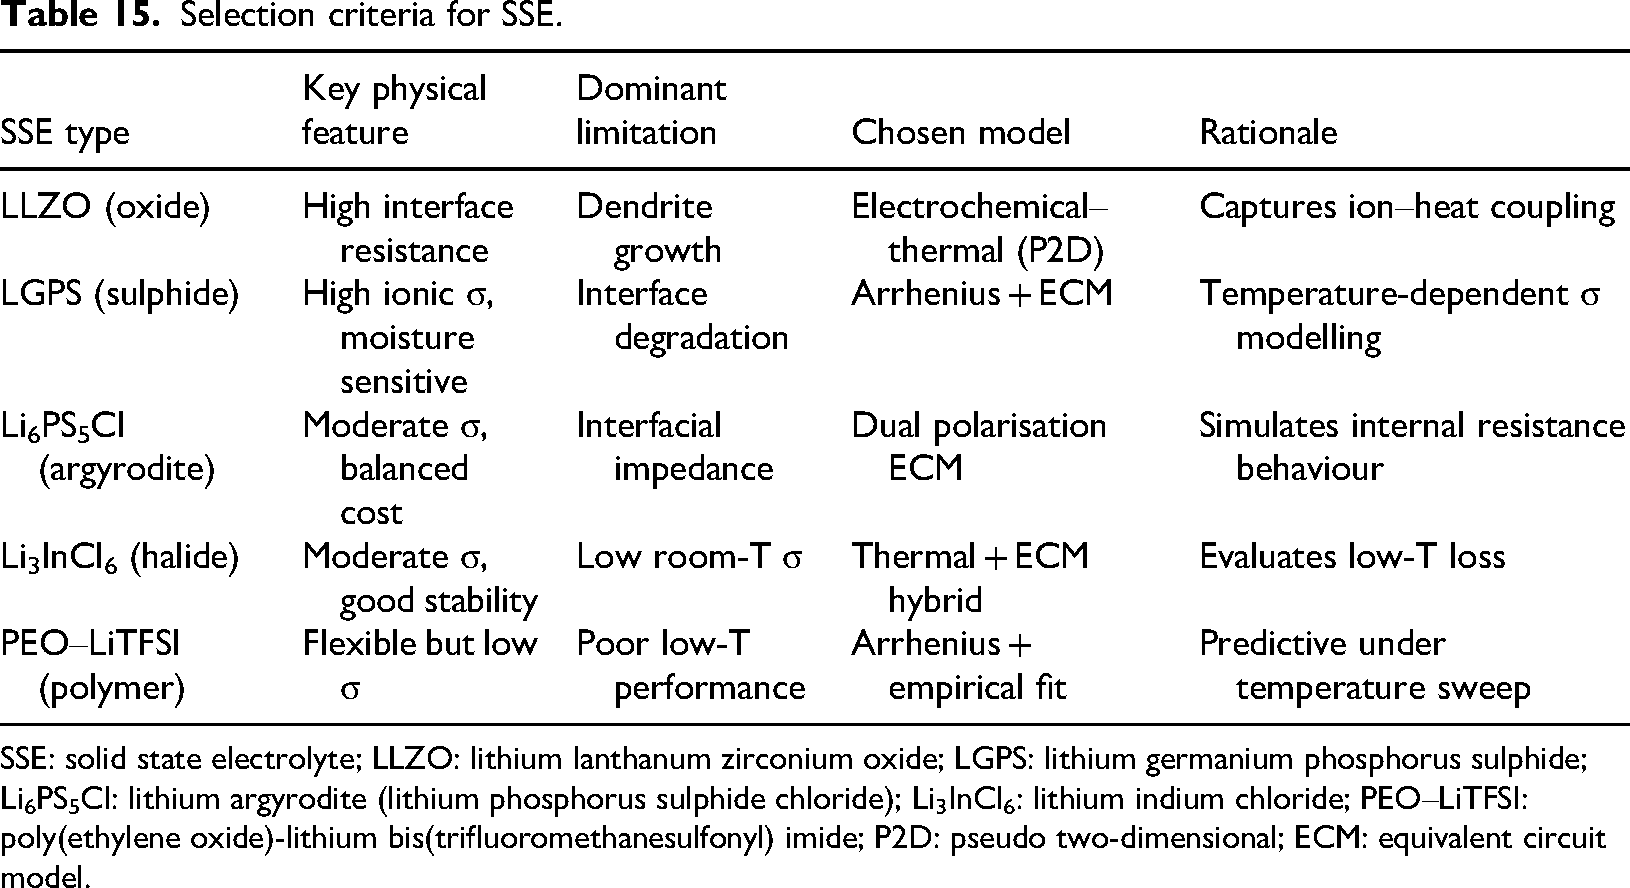
SSE: solid state electrolyte; LLZO: lithium lanthanum zirconium oxide; LGPS: lithium germanium phosphorus sulphide; Li6PS5Cl: lithium argyrodite (lithium phosphorus sulphide chloride); Li3InCl6: lithium indium chloride; PEO–LiTFSI: poly(ethylene oxide)-lithium bis(trifluoromethanesulfonyl) imide; P2D: pseudo two-dimensional; ECM: equivalent circuit model.
EV dynamics of SSE.
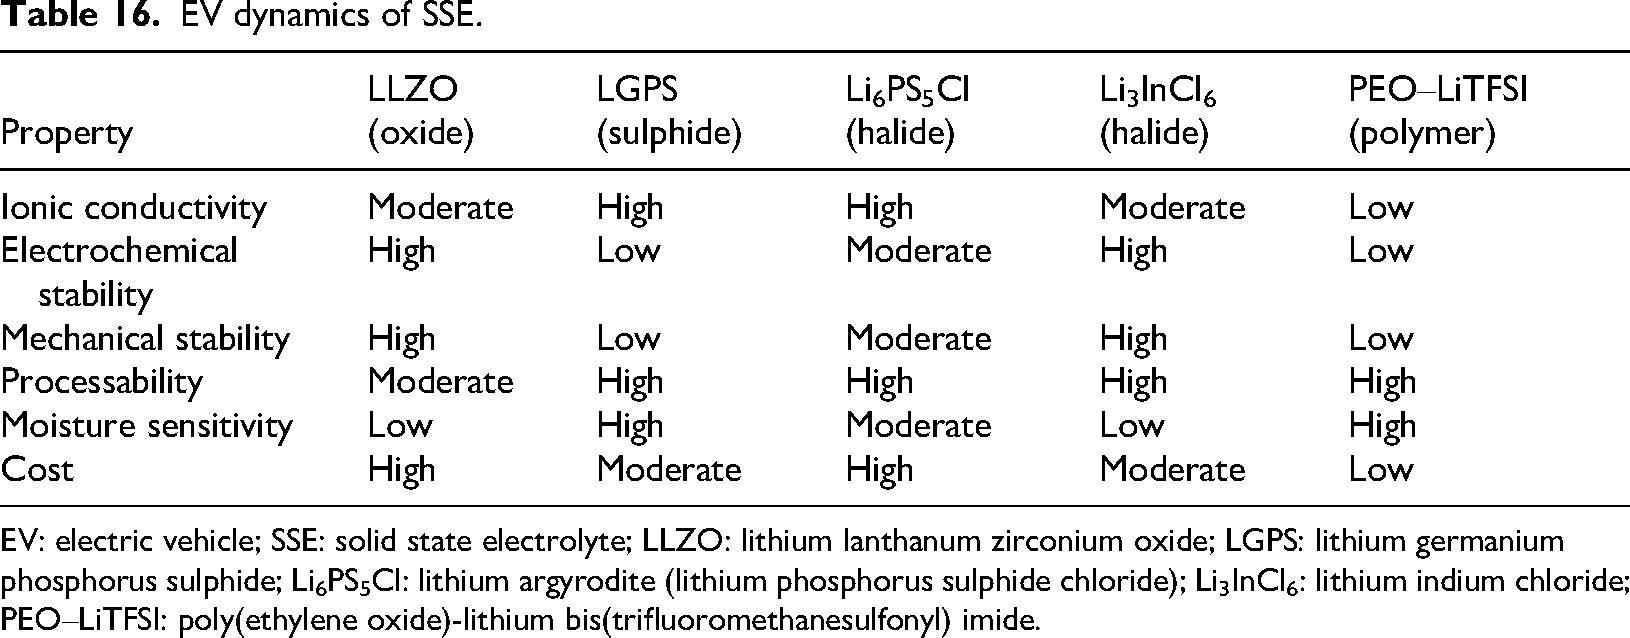
EV: electric vehicle; SSE: solid state electrolyte; LLZO: lithium lanthanum zirconium oxide; LGPS: lithium germanium phosphorus sulphide; Li6PS5Cl: lithium argyrodite (lithium phosphorus sulphide chloride); Li3InCl6: lithium indium chloride; PEO–LiTFSI: poly(ethylene oxide)-lithium bis(trifluoromethanesulfonyl) imide.
The study comprises evaluating SSE under five categories: (a) various operating temperatures, (b) SSE thickness, (c) ionic conductivity, (d) resistance and (e) cathode particle size. Each category consists of its own physics-based computational (electrochemical model), with the necessary parameters. The results from each are integrated via FNN, and the results are observed. Validation metrics to bridge the difference between actual and predicted outcomes are stated. Further, the compatibility with the LIB is shown, phasing out the gap for commercialisation. The workflow is illustrated in Figure 8. The selection criteria and EV dynamics interpretation of the SSE are listed in Table 15 (Guo et al., 2024). The work is carried out in two phases: (1) computational modelling – to generate data, analyse the state of the electrolytes across the five categories. (2) AI interpretation – predict the suitable electrolytes based on the estimation for the EV application by weighing it against the EV dynamics.
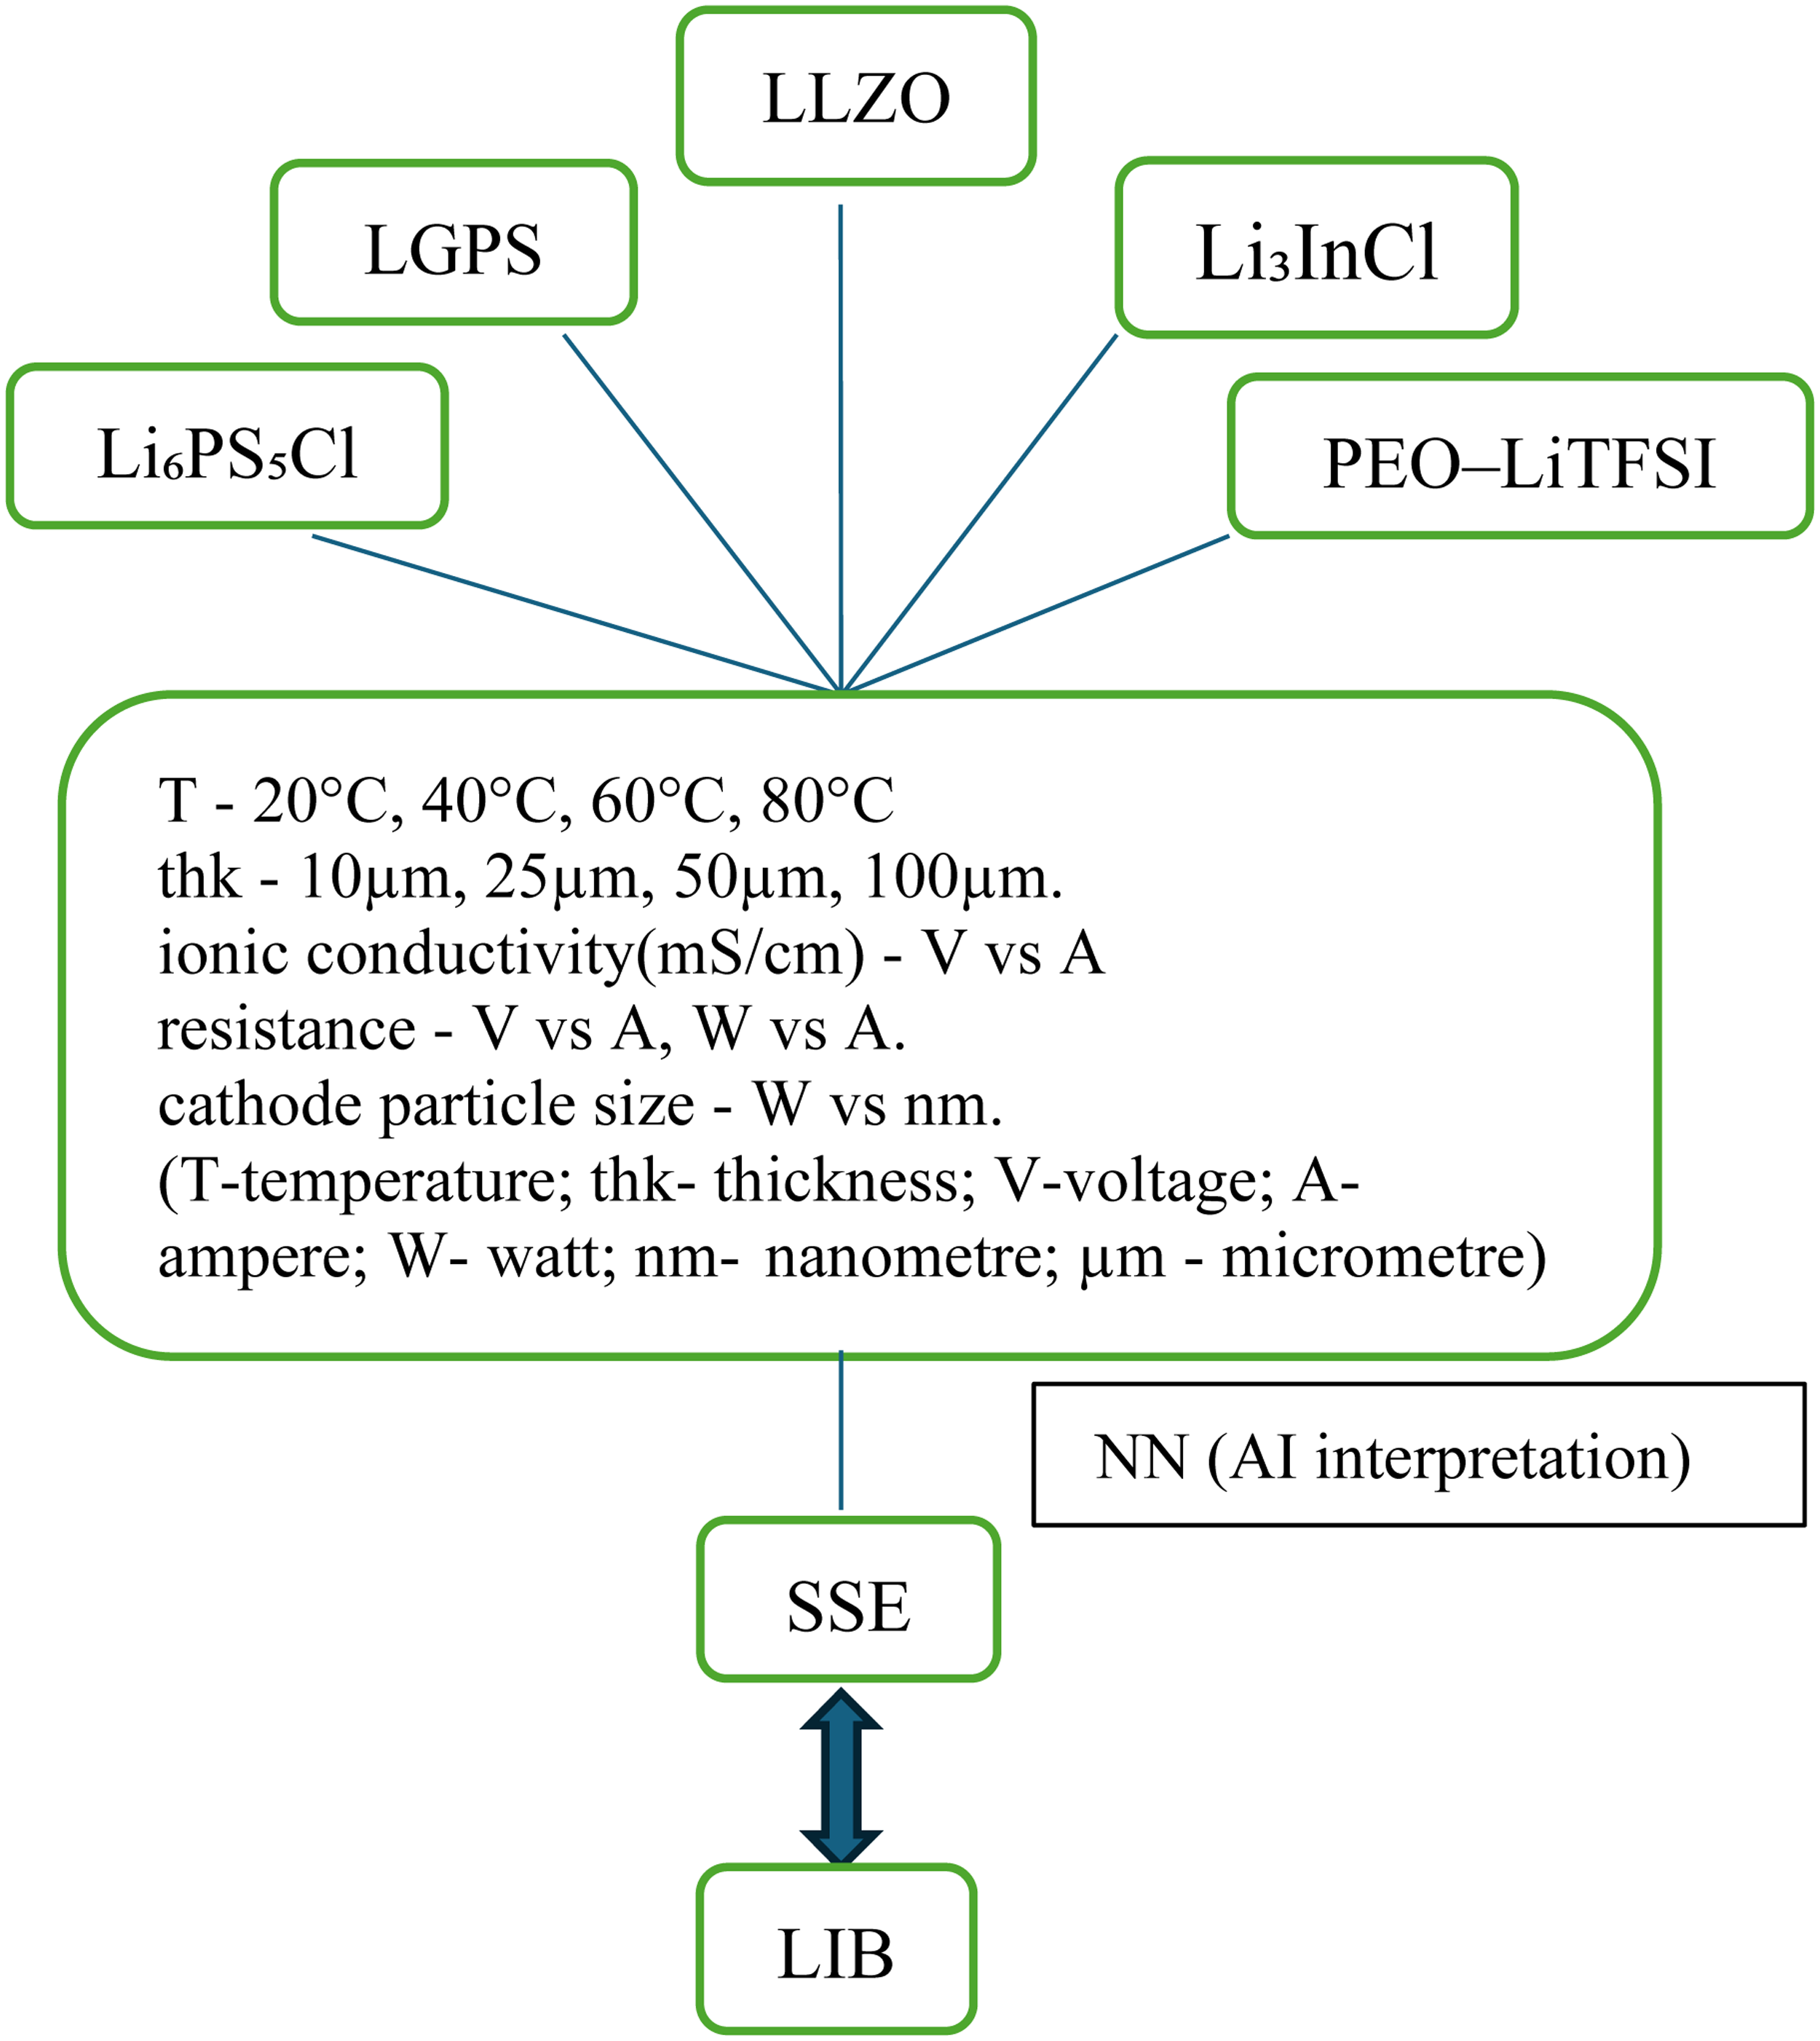
Workflow of solid-state electrolyte (SSE) selection.
The interaction between the electrolyte and electrode plays a major role in SSB. Hence, the kinetics of the designed SSB for the case study of SSE selection is interpreted under V(i).
Simulation results
The models mentioned in the methodology are analysed using MATLAB software. Separate environments are employed for all five different categories stated for the selection of SSE in compatible with EV's LIB.
(a) Various operating temperatures: The Arrhenius analysis depicts the material ordering sulphides > oxides > polymers at room temperature (Figure 9). The interfacial resistance temperature dependence reinforces that interface engineering can be as impactful as selecting a higher

S/cm versus T.
(b) SSE thickness: V – time curves at each thickness are nearly flat, thinner electrolytes gives higher operating voltage is evident from Figure 10. Low σ electrolytes suffer dramatically as L rises. For moderate current, dropping from 100 to 25 µm, yields a much larger voltage recovery for low σ than for high σ.

Battery voltage response for various thicknesses: (a) 10 µm; (b) 25 µm; (c) 50 µm; and (d) 100 µm.
(c) Ionic conductivity: V–I curves from the physics model are linear in I
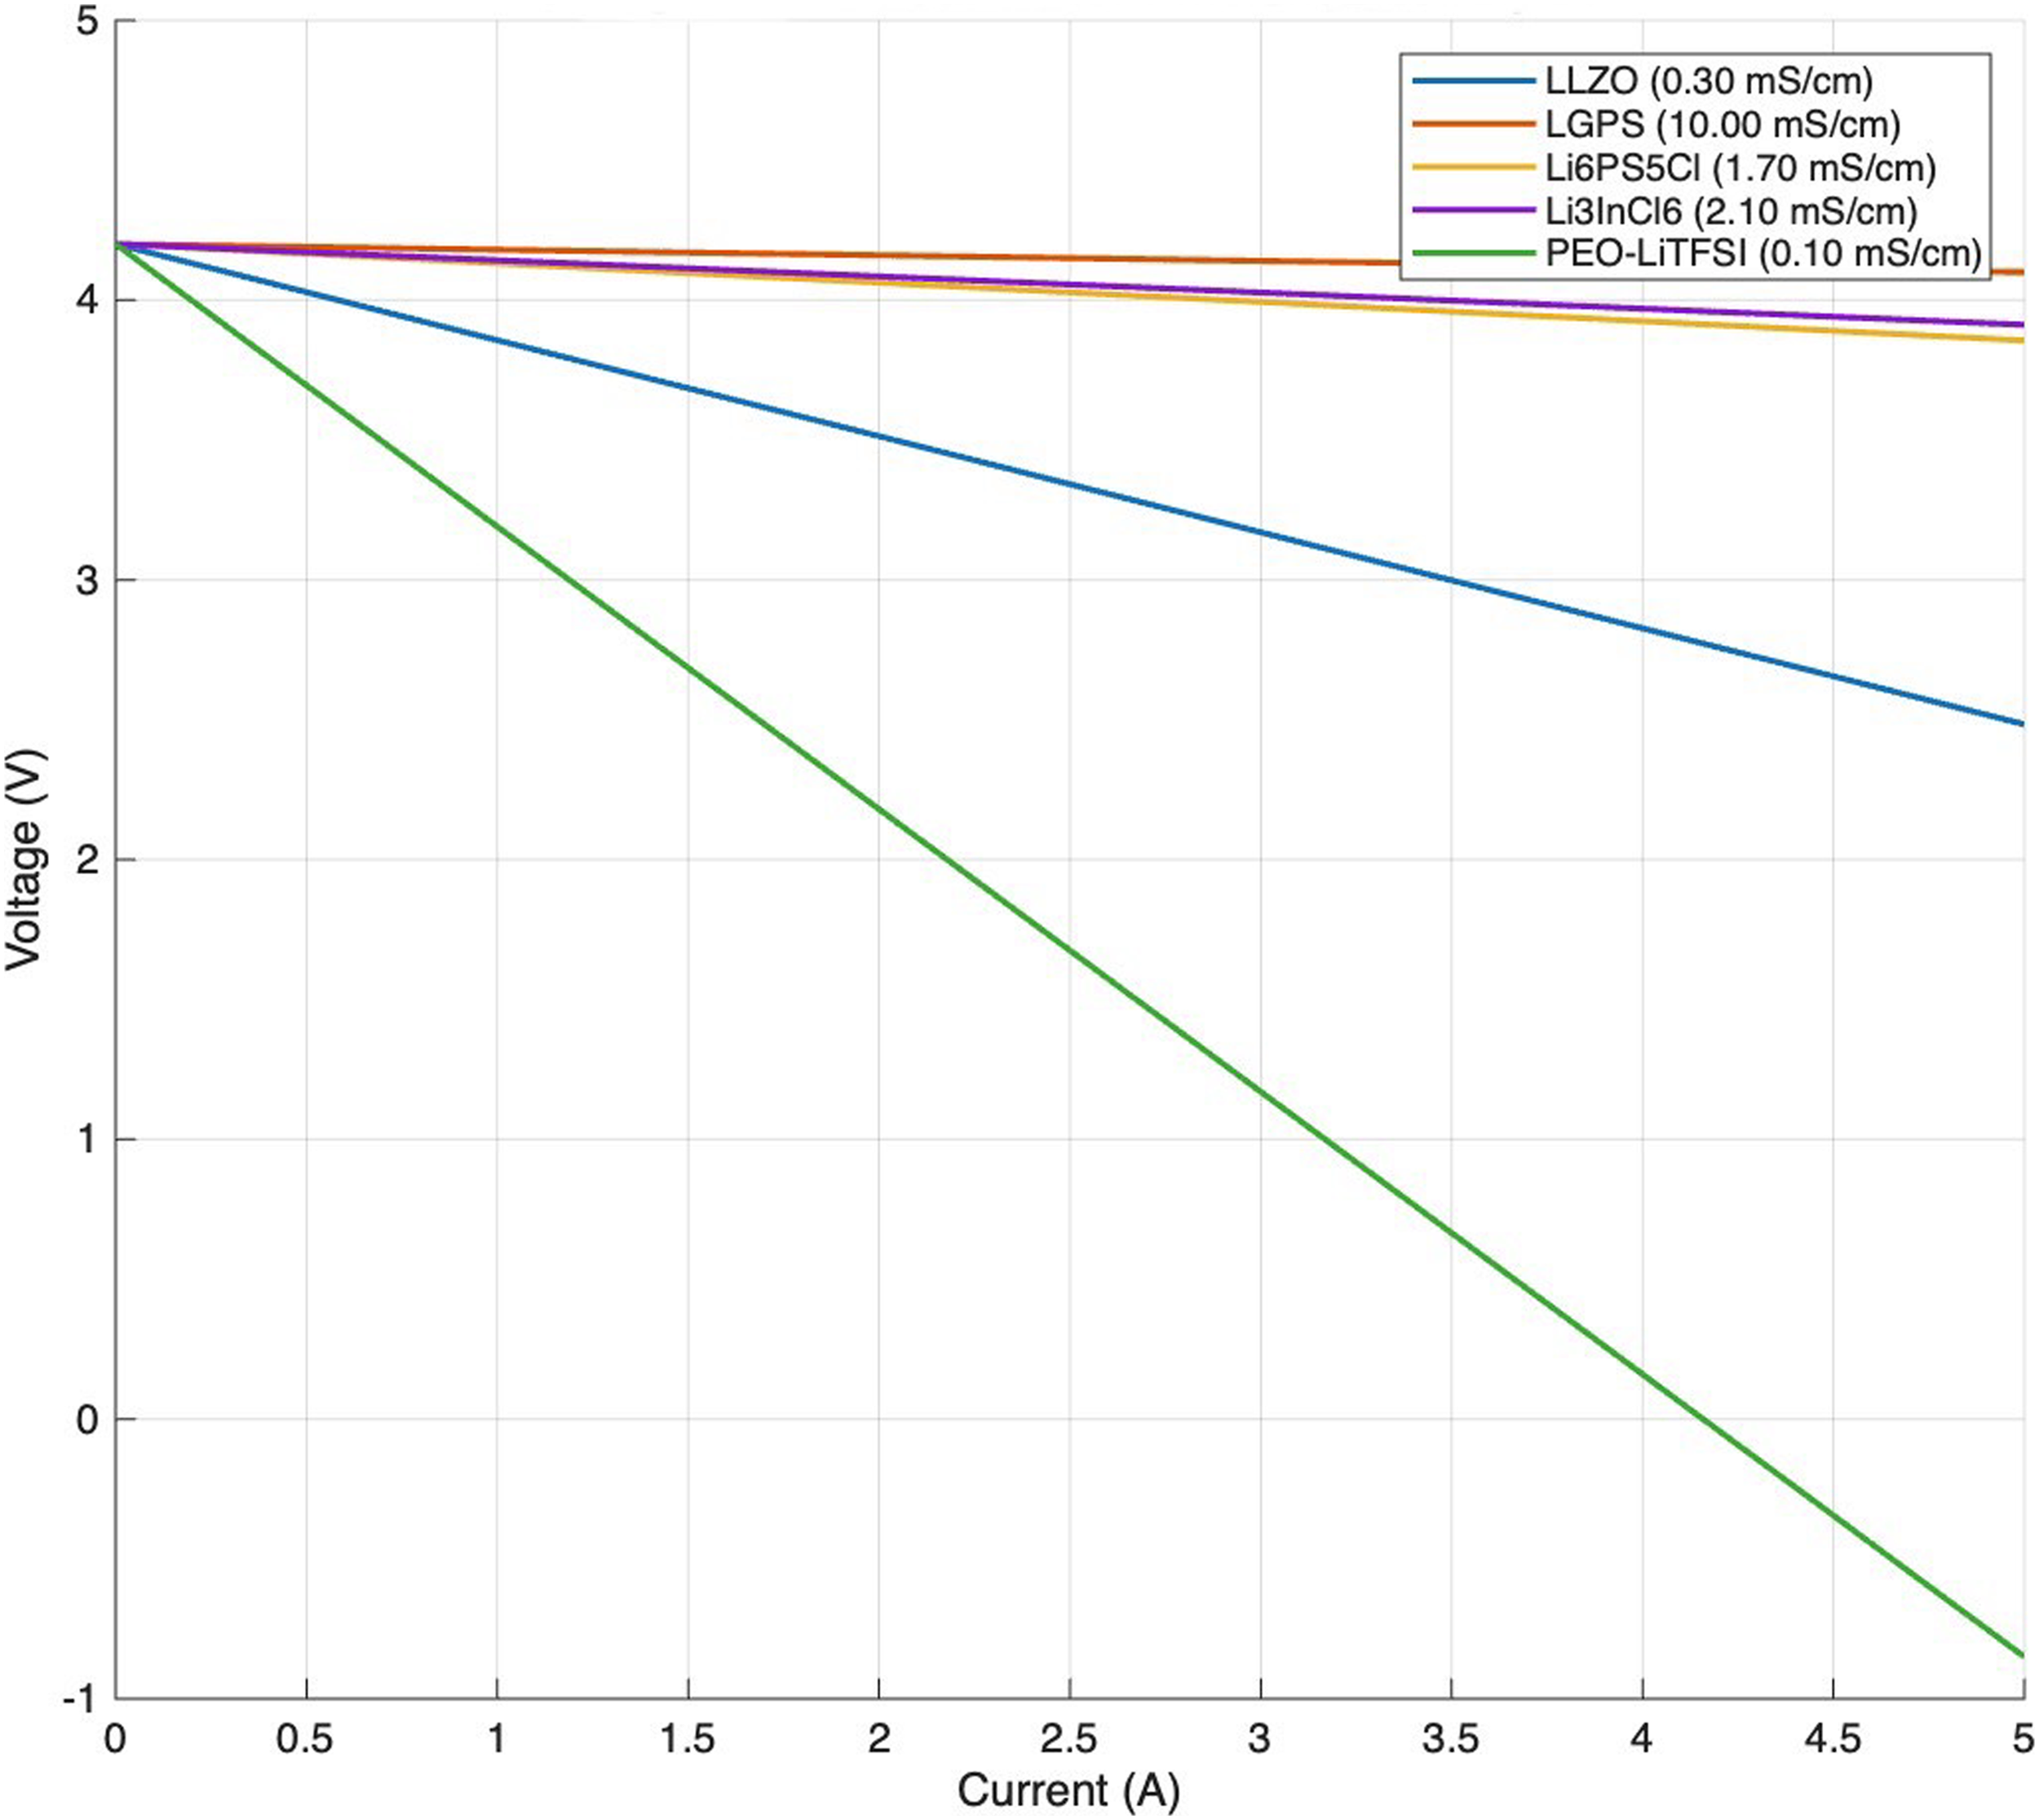
V–I curves for different electrolytes.
(d) Resistance: The total resistance is dominated by the interfacial terms for most electrolytes. V–I curve from Figure 12 depicts that LGPS maintains the highest voltage at a given current, and PEO-LiTFSI collapses fastest. Figure 13 shows a single peak per electrolyte, higher R peaks at lower current and at lower peak power. Joule's heating in Figure 14 increases as I2 Rtotal.. Thus higher R generates more heat at the same current. The decomposition underscores that interface engineering can outweigh incremental gains in bulk σ.
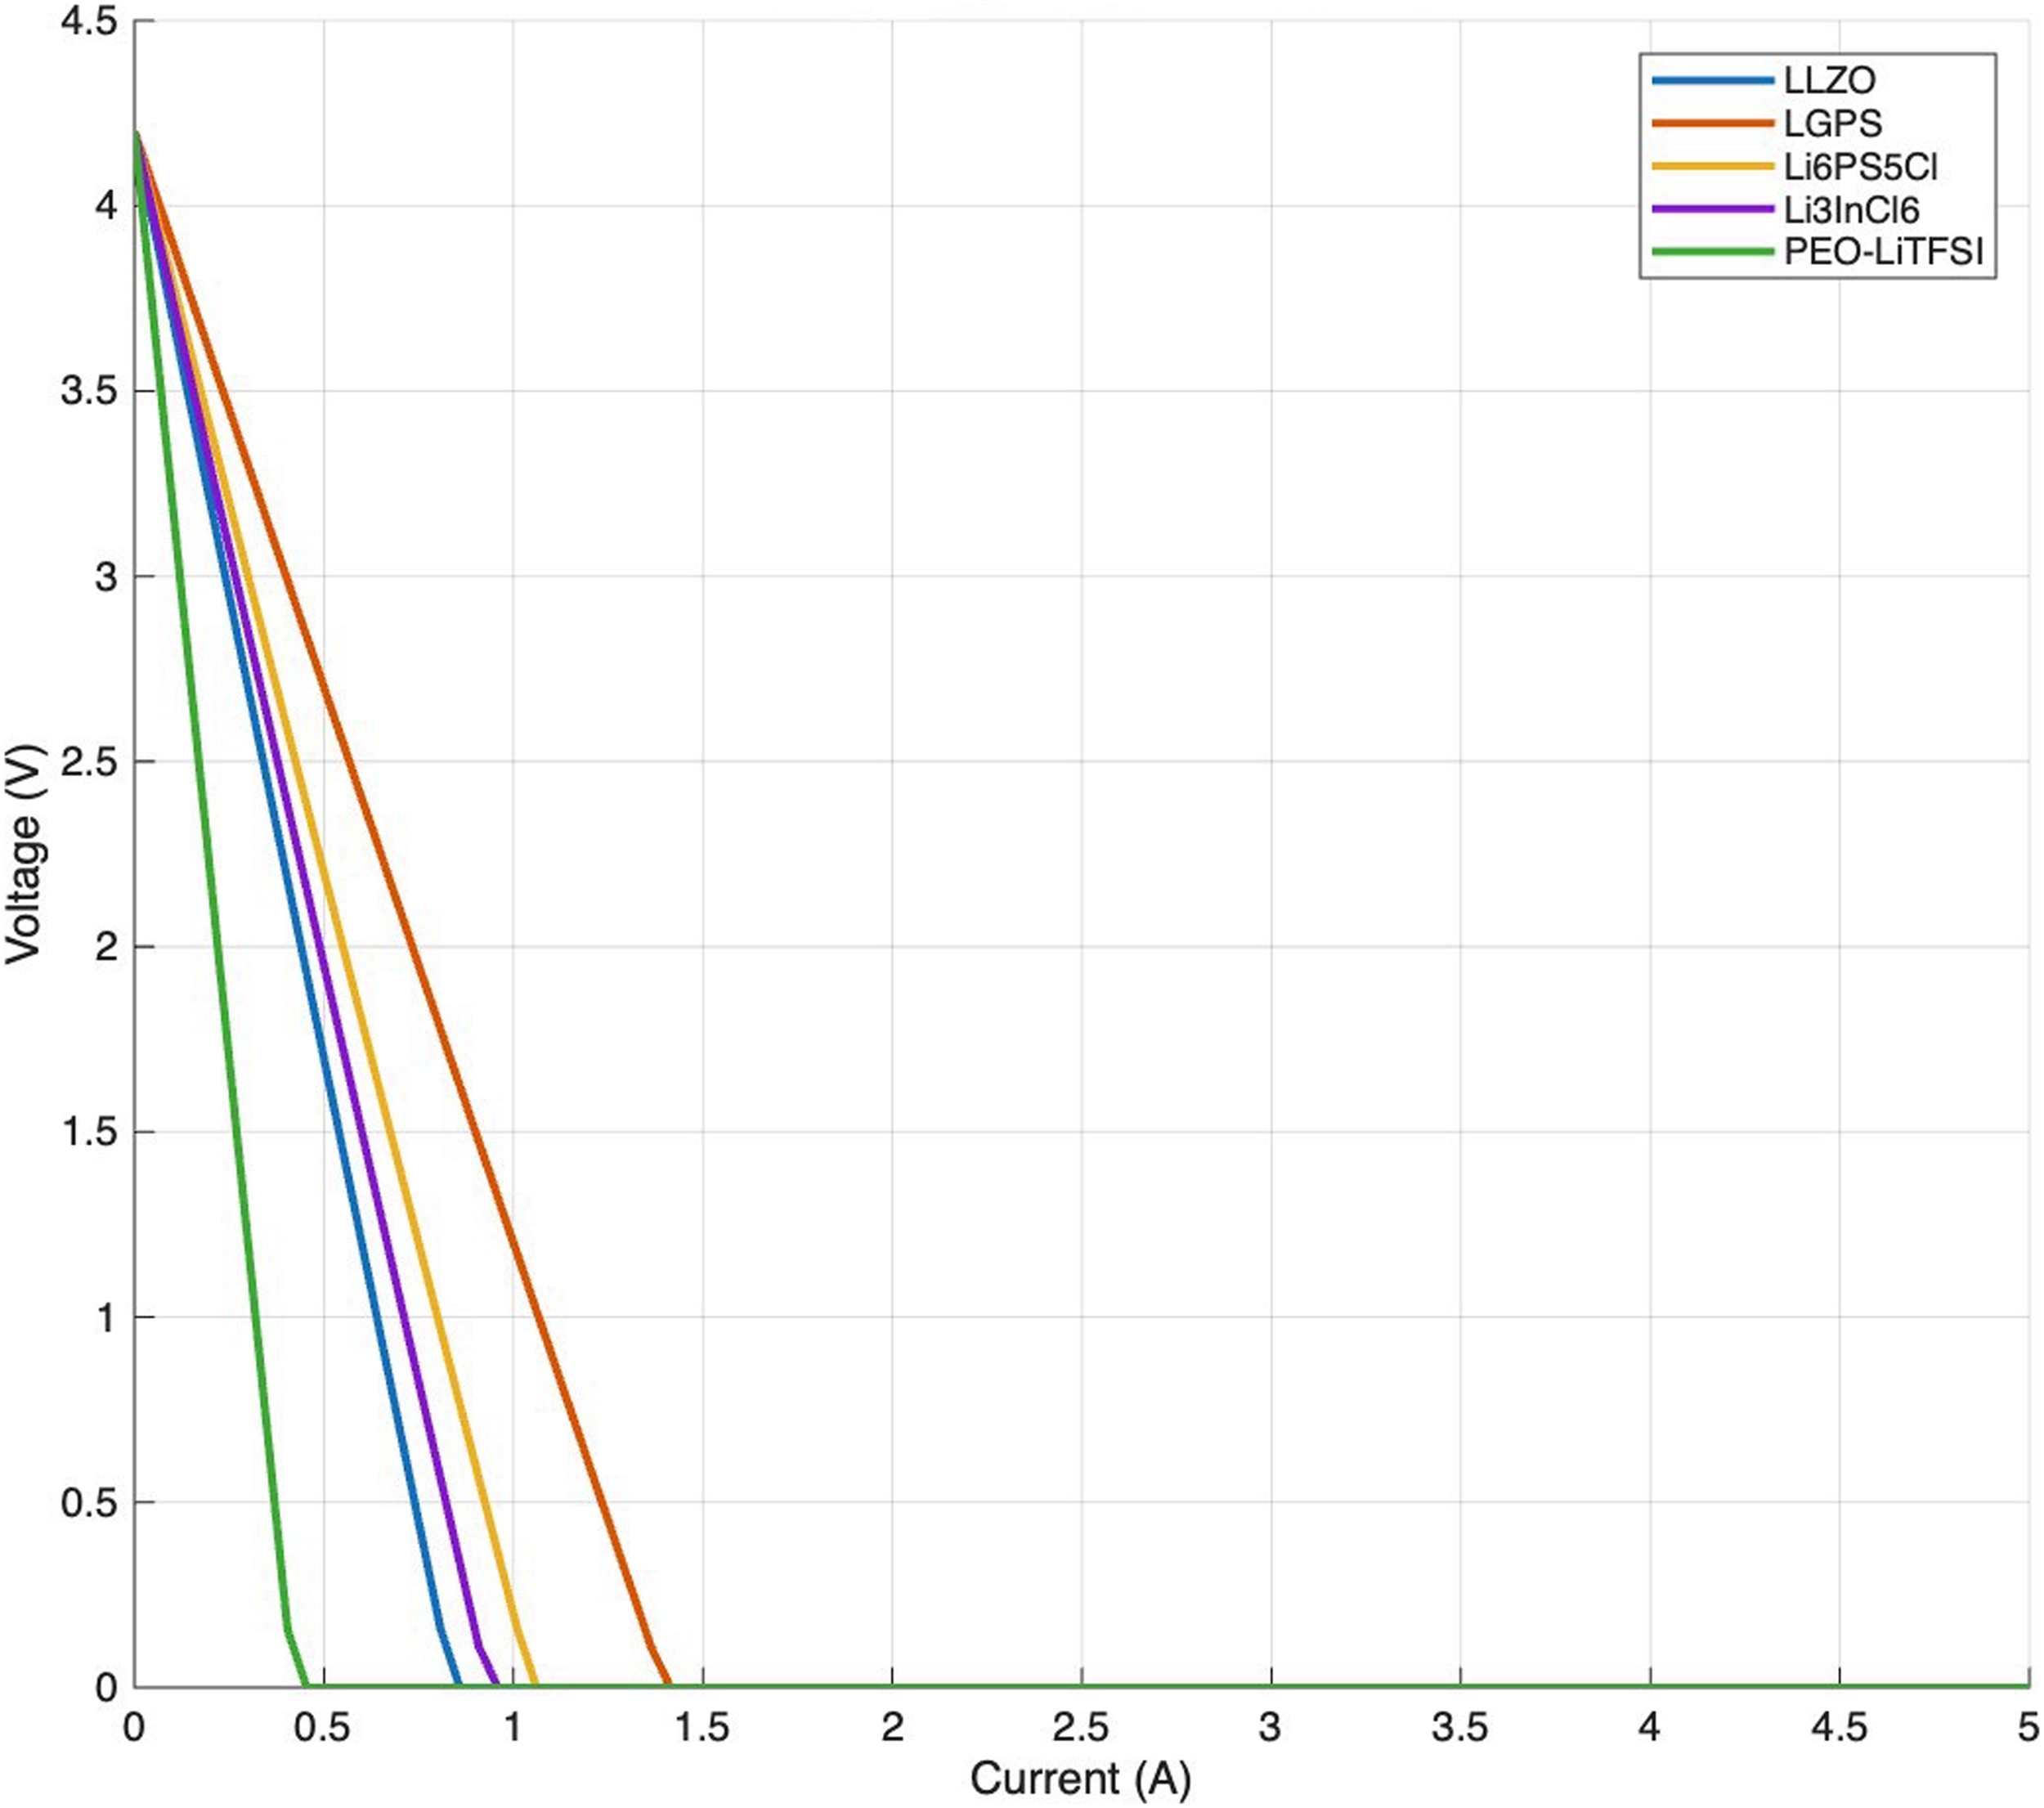
V–I characteristics.
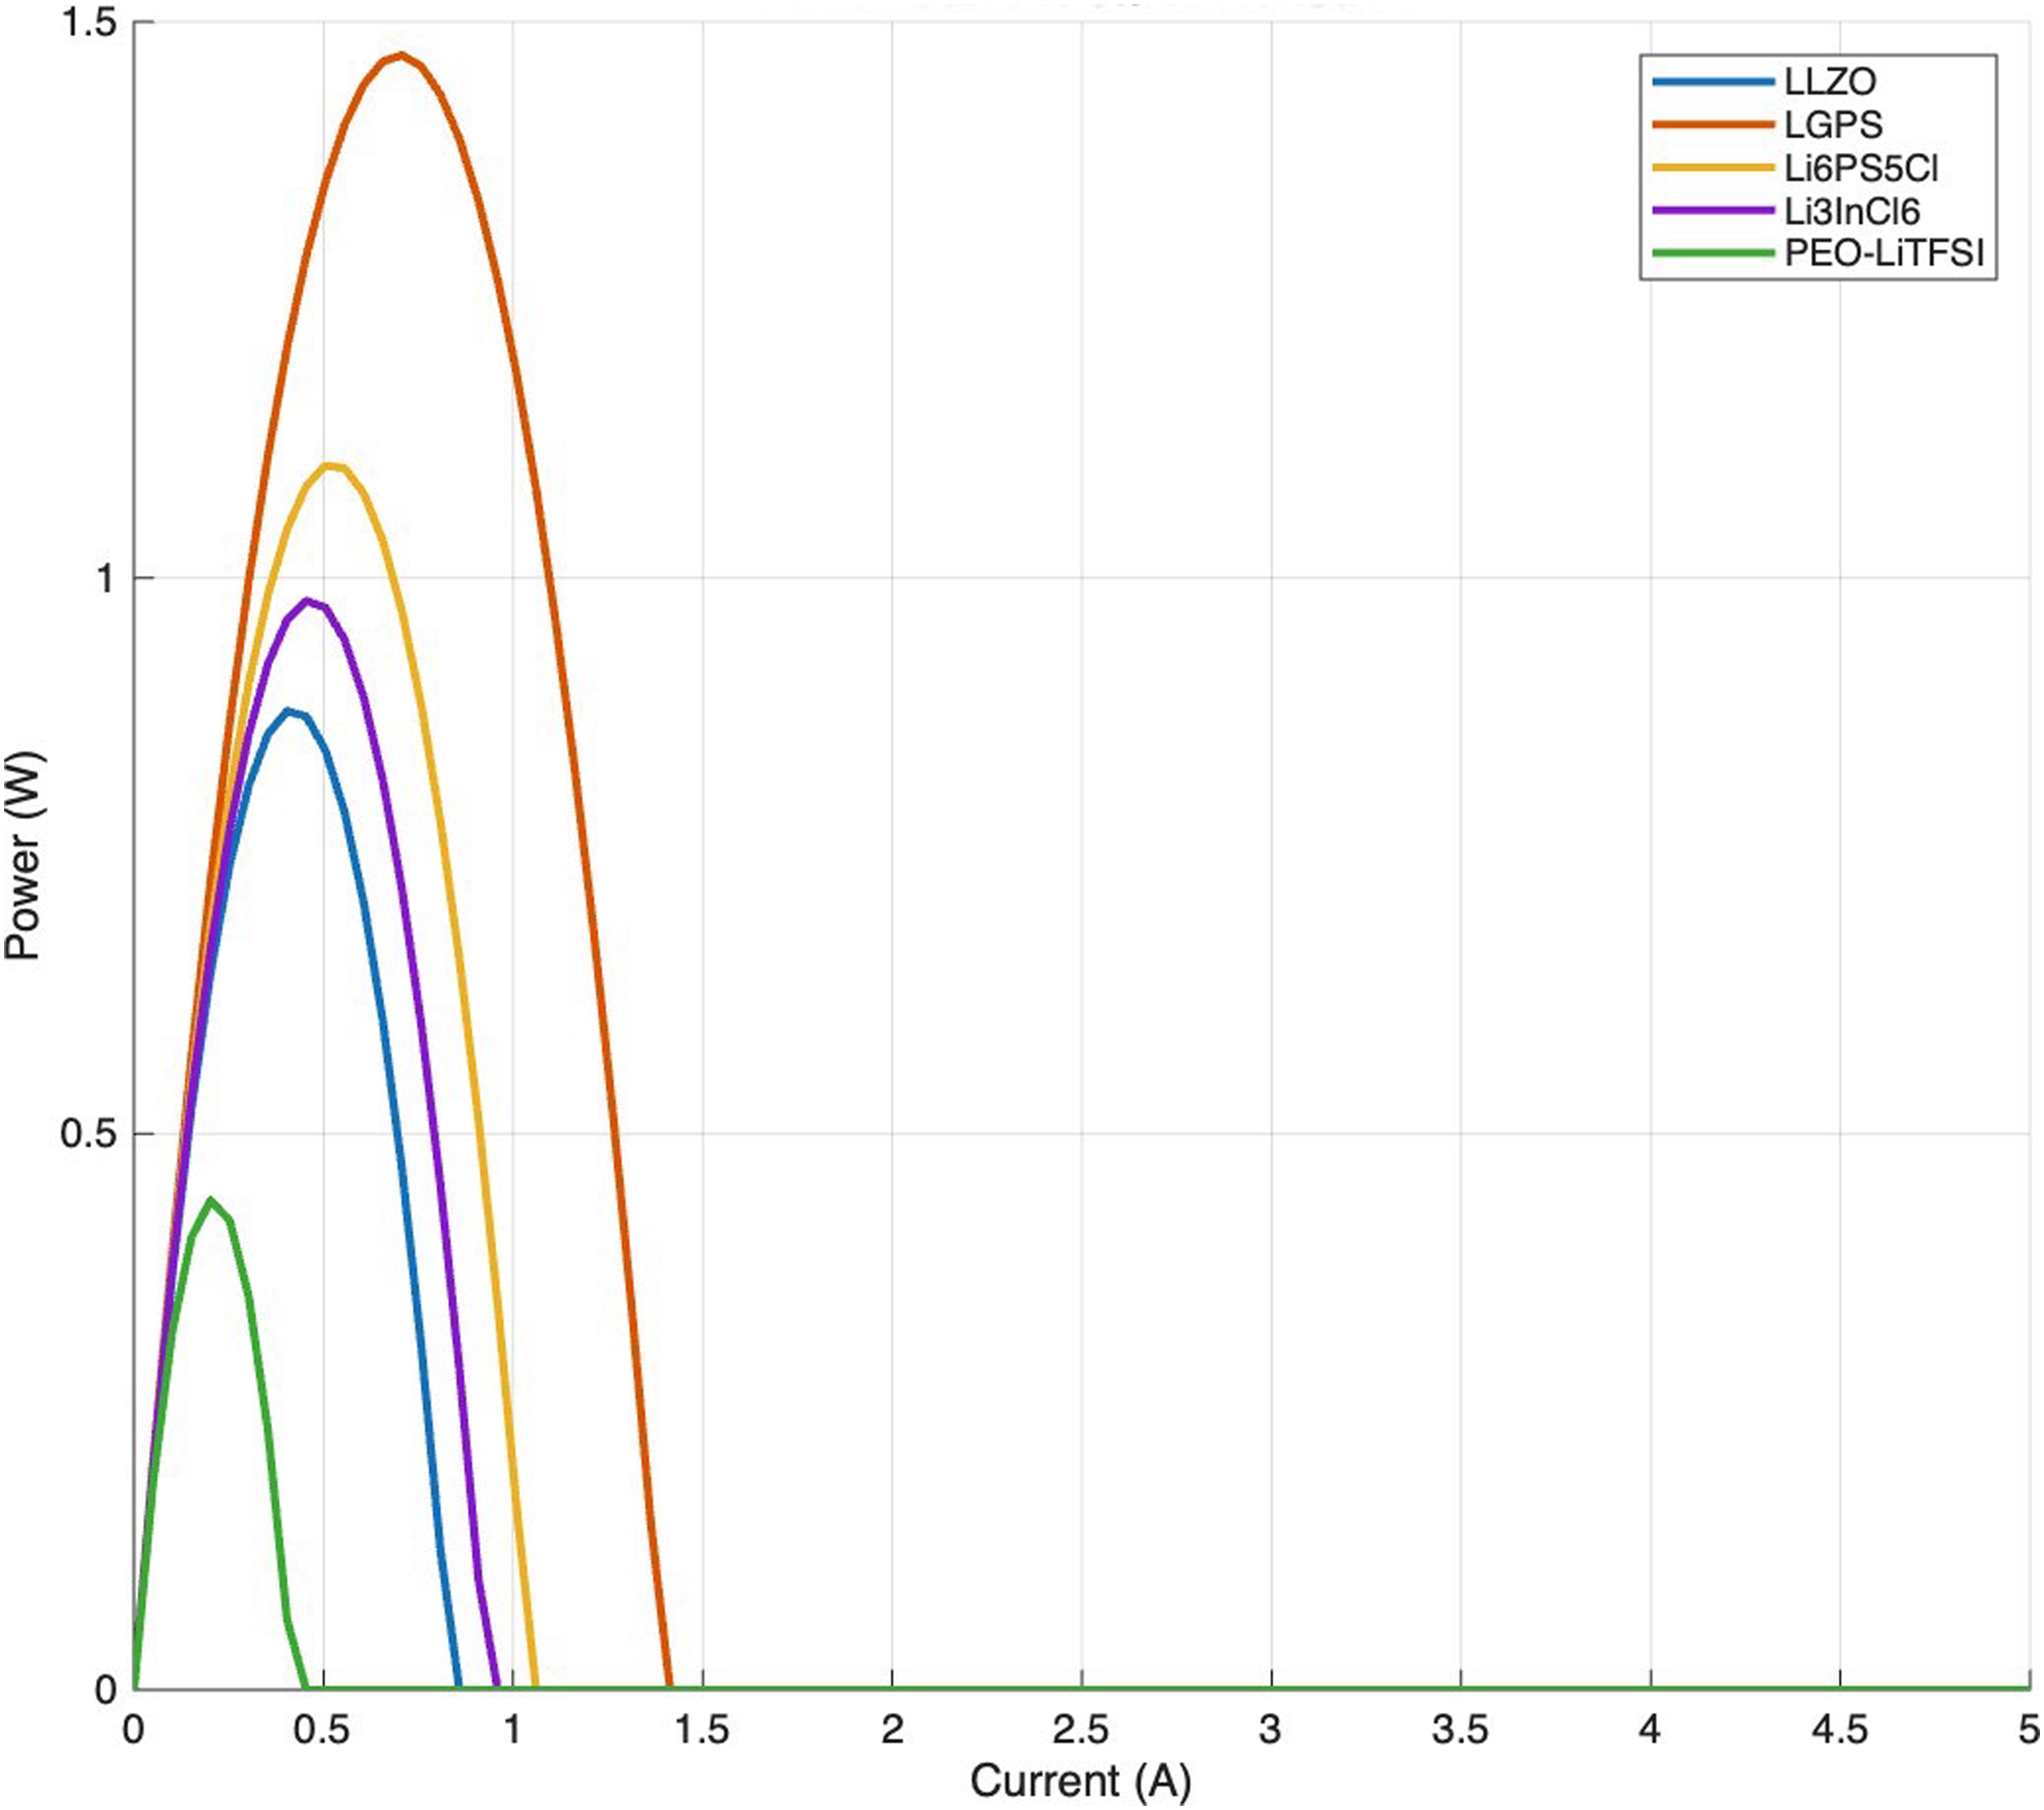
W versus I characteristics.
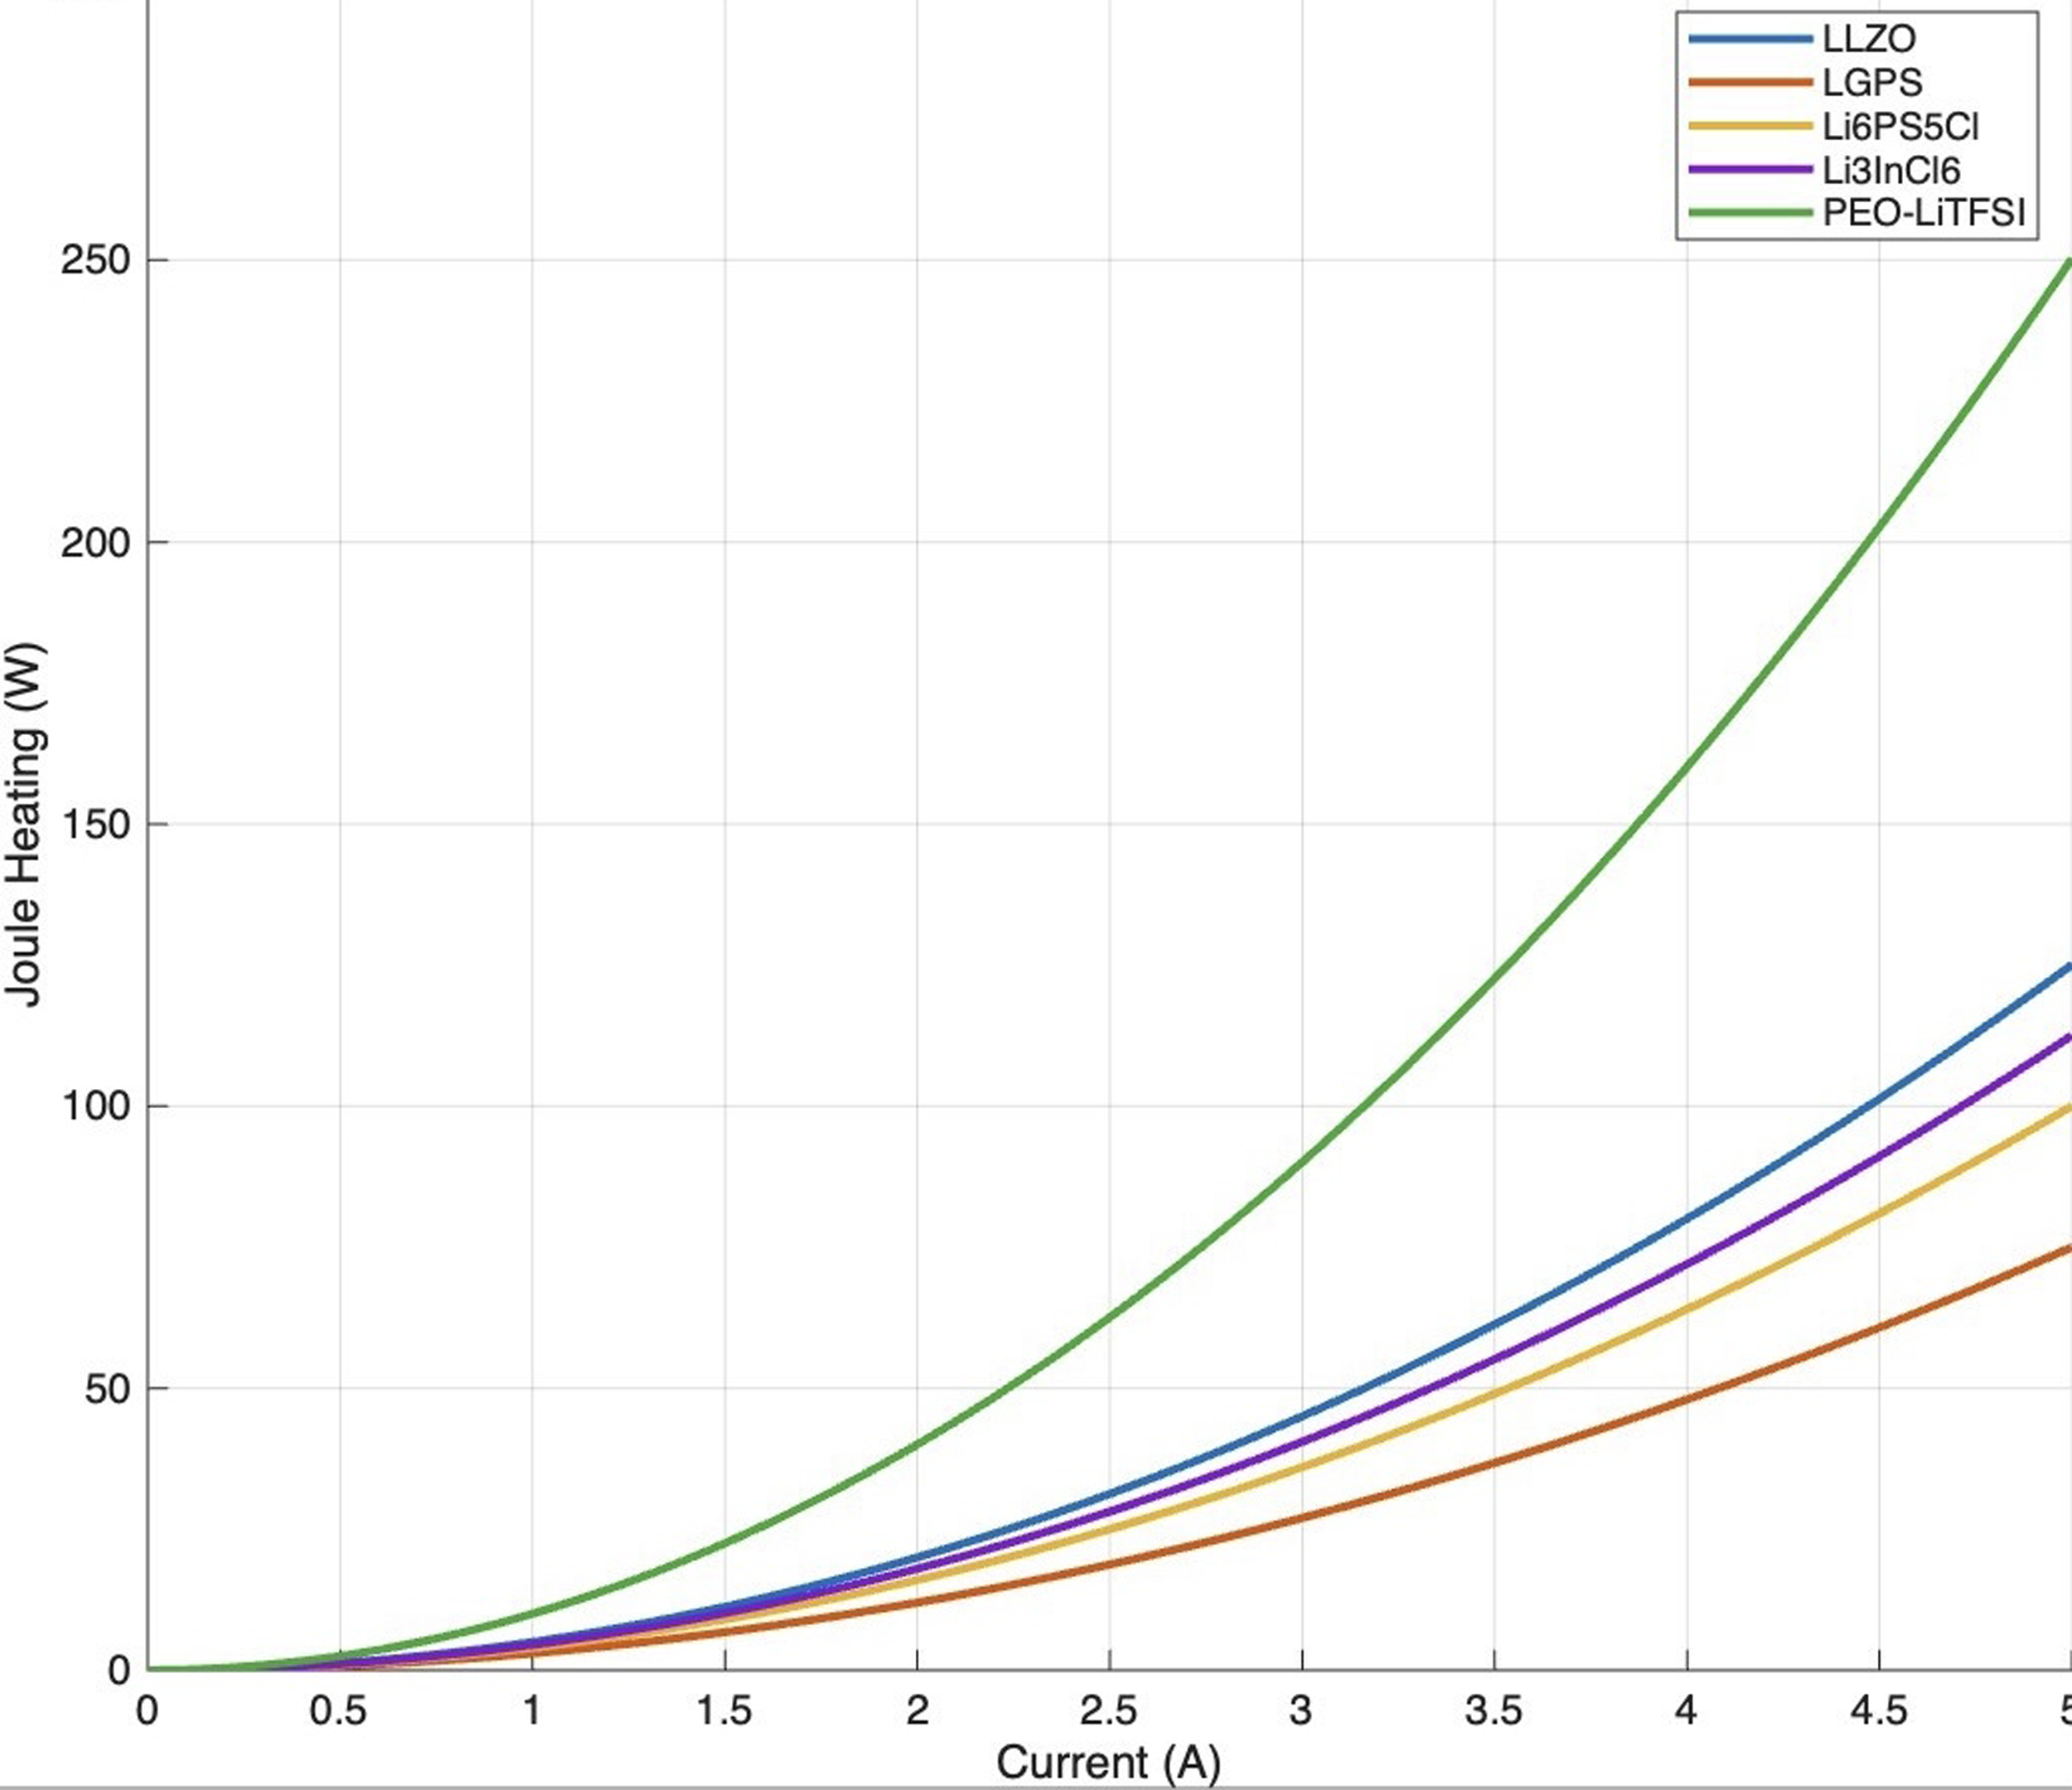
Joule heating versus I.
(e) Cathode particle size: Contact fraction increases as the particle shrinks, while tortuosity increases with size. Combined σeff decreases with increasing particle size. V–I curve shifts upward as particle size shrinks across all electrolytes, as evident in Figures 15 to 17. At I = 0.1A, delivered power increases as particle size decreases; joules' heating declines with smaller particle because Rbulk drops via higher σeff, identified in Figures 15 and 16. Smaller particles improve interfacial contact and ionic pathways, reducing ohmic and diffusion losses.

Joule heating at I = 0.1 A versus particle size.

Effective ionic conductivity in composite versus particle size.

V–I curve for each electrolyte at various particle sizes: (a) LLZO; (b) LGPS; (c) Li6PS5CI; (d) Li3InCl6; and (e) PEO-LiTFSI.
Electrode–electrolyte interface modelling
The interfacial behaviour between the NMC811 cathode, graphite anode, and each SSE was incorporated through a simplified electrochemical coupling model. The charge-transfer kinetics, equation (33). ƒ at the electrode–electrolyte boundary was represented using the Butler–Volmer equation:
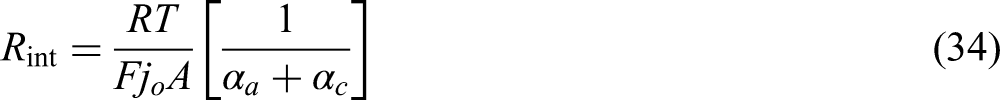
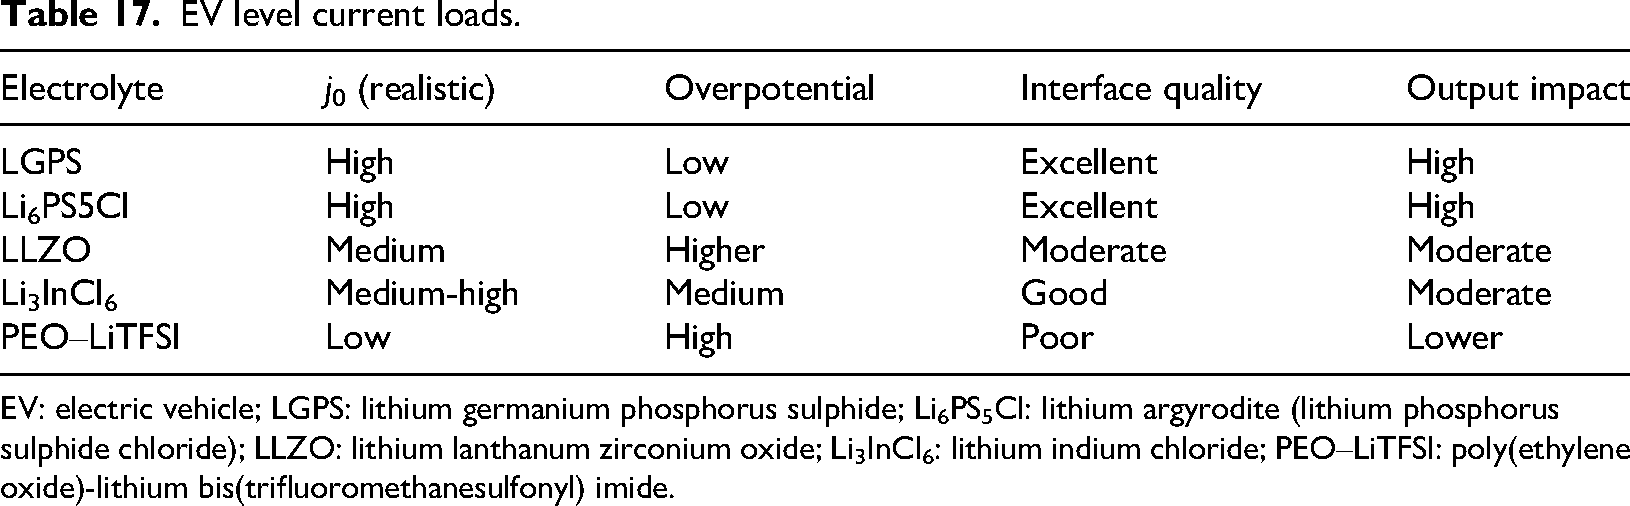
Figure 18 shows the resulting interfacial overpotential for each electrolyte at 1 A discharge current and 25 °C. LGPS and Li6PS5Cl displayed the lowest interfacial losses (≈ 15–20 mV), while LLZO and polymer electrolytes exhibited higher overpotentials (≈ 40–60 mV) due to poorer ionic contact with electrode surfaces. This coupling in Table 17 demonstrates that electrode–electrolyte interfacial properties substantially influence overall cell performance, particularly under EV-level current loads (adapted from Hatz et al., 2021; Mao et al., 2025; Serbessa et al., 2024; Taminato et al., 2024).
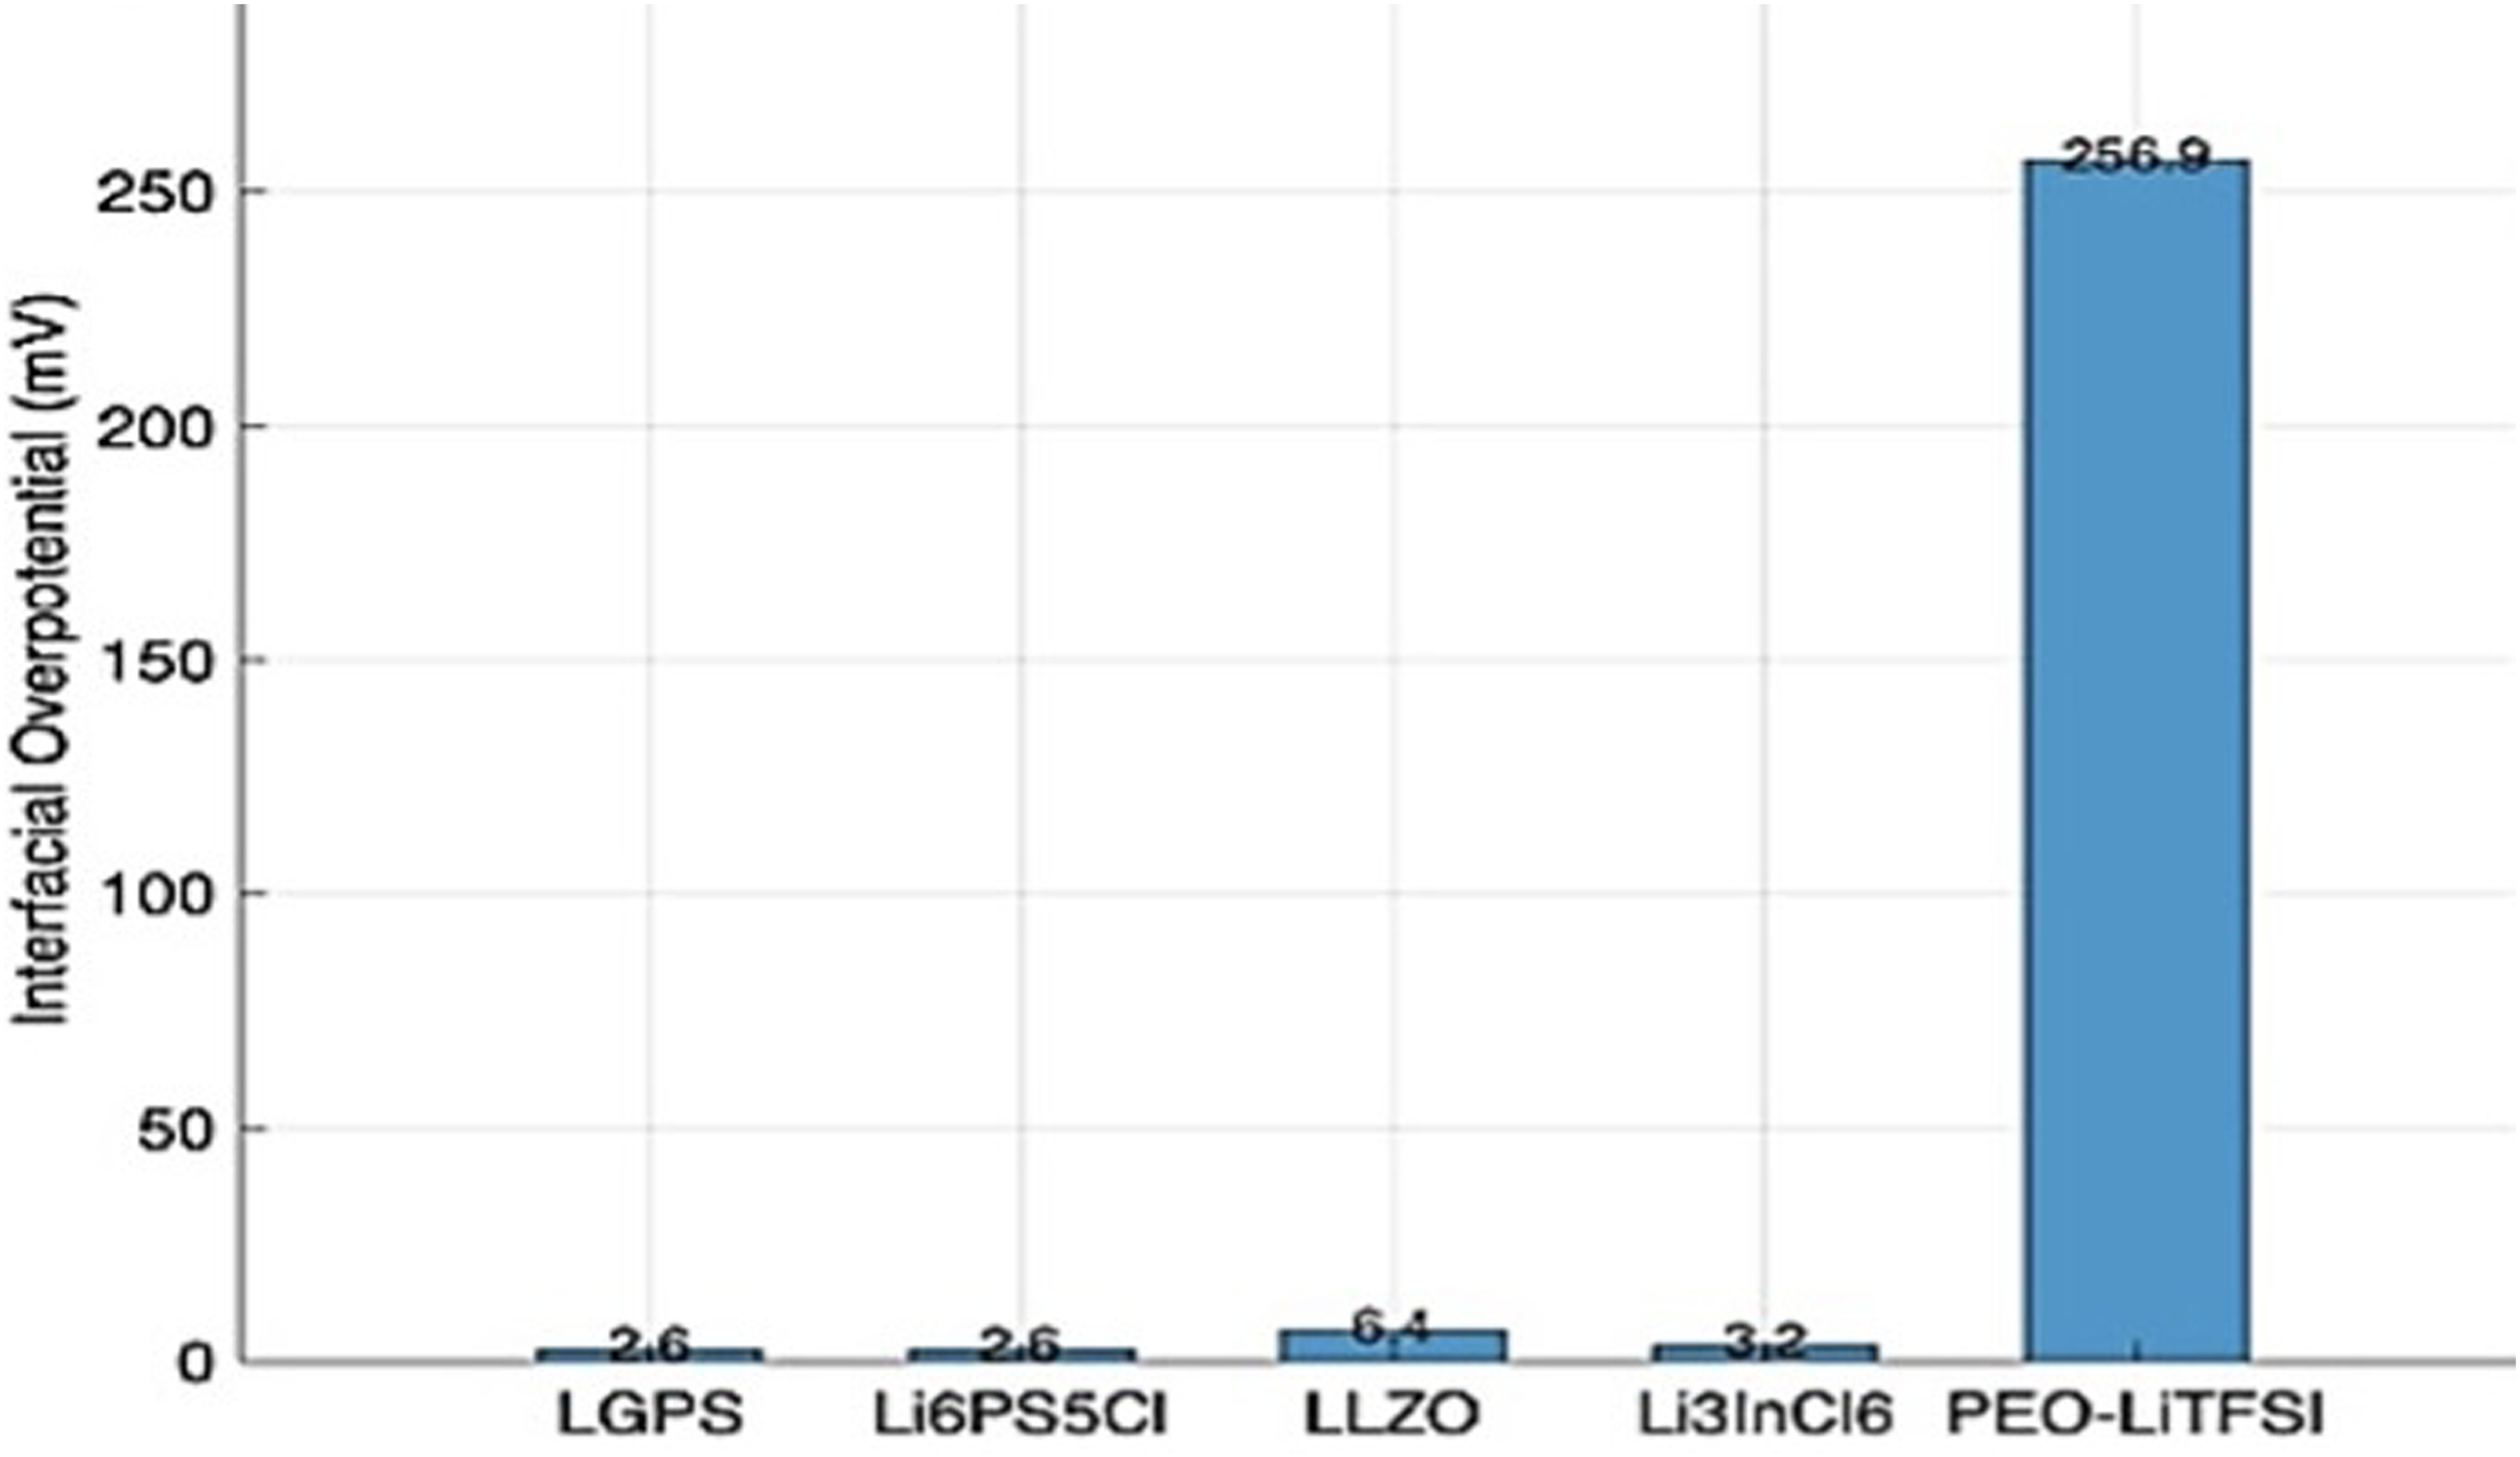
Interfacial overpotential at 1.0 A discharge current.
EV level current loads.
EV: electric vehicle; LGPS: lithium germanium phosphorus sulphide; Li6PS5Cl: lithium argyrodite (lithium phosphorus sulphide chloride); LLZO: lithium lanthanum zirconium oxide; Li3InCl6: lithium indium chloride; PEO–LiTFSI: poly(ethylene oxide)-lithium bis(trifluoromethanesulfonyl) imide.
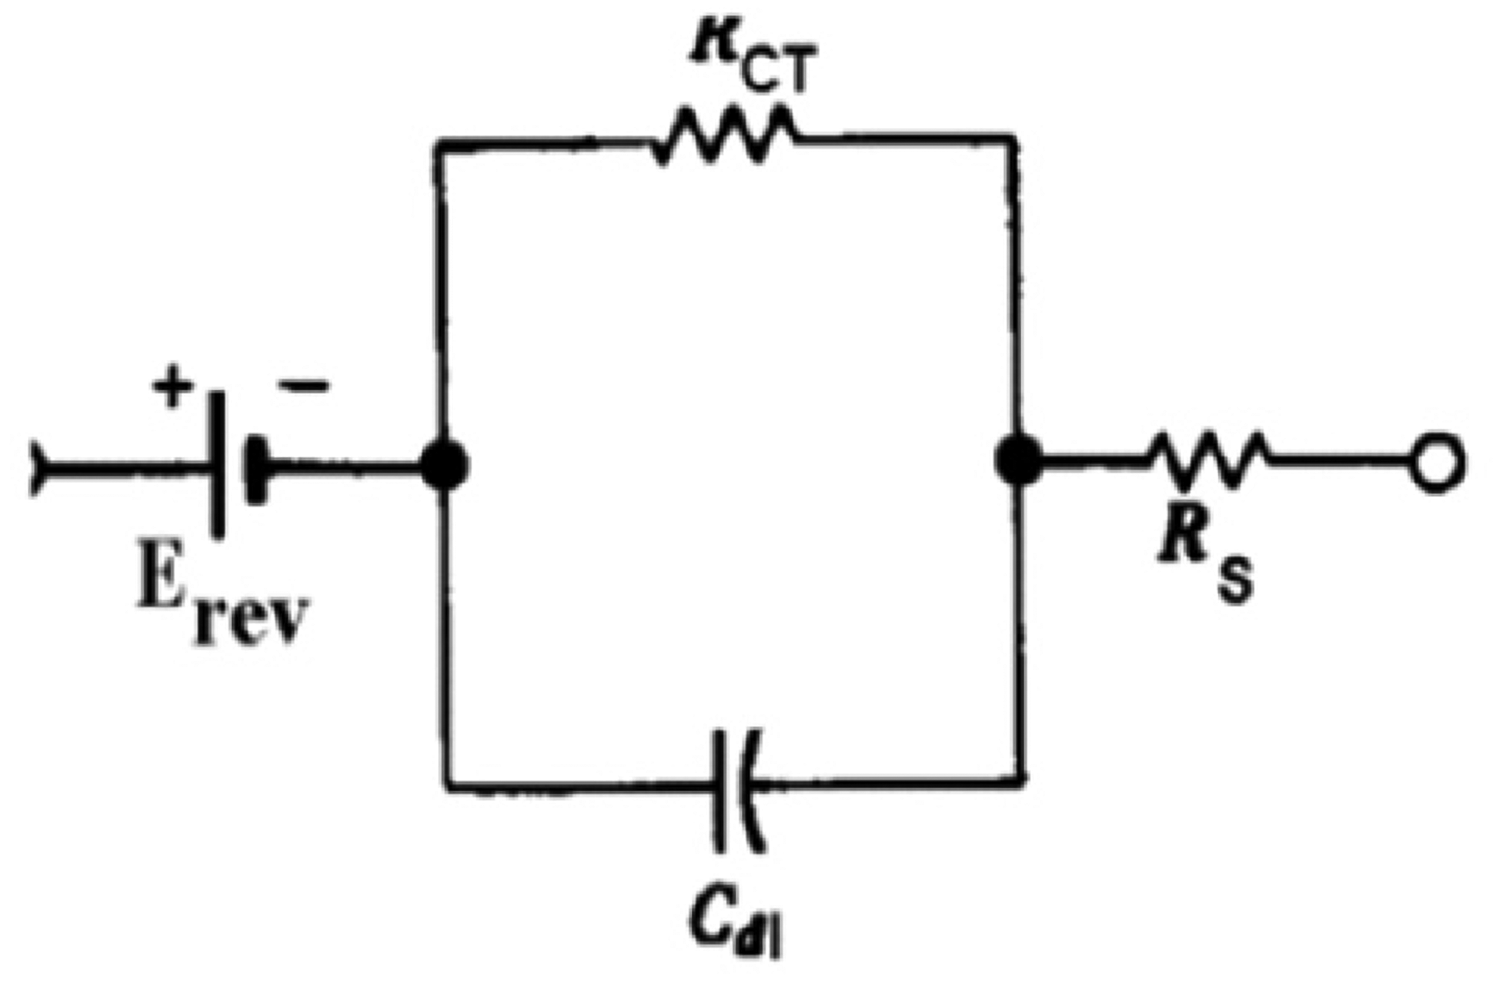
A lower overpotential indicates a smaller deviation from the ideal electrochemical potential, which corresponds to lower internal resistance within the cell. As a result, the cell operates more efficiently, delivering a higher effective output and improved energy conversion. Conversely, a higher overpotential reflects increased resistance and polarisation losses, which reduce the effective cell output and overall performance (Doyle et al., 1993). Incorporating these interface effects strengthens the physical realism of the computational framework and bridges the gap between materials modelling and cell-level performance analysis. The electrical model of the electrode-electrolyte interaction is illustrated in Figure 19.
Equivalent circuit model (ECM) of electrode-electrolyte interaction.
Erev is the reversible electrode potential (OCV contribution of the electrode). Rs is the series/ohmic resistance (contacts, current collector path and thin electrolyte bulk contribution at the immediate interface). kCT (or Rct) is the charge-transfer resistance at the interface (kinetic limitation and maps to Butler–Volmer exchange current). Cdl is the double-layer capacitance representing interfacial charge storage/polarisation. This is the standard randles-like element (Rct ‖ Cdl) in series with R_s and the half-cell OCV.
AI interpretation/commercial LIB comparison
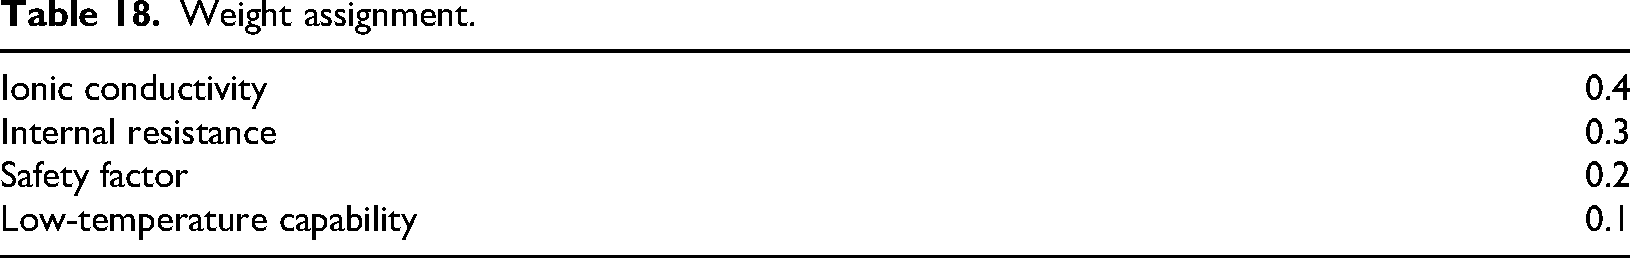
From the simulation, the behaviour of all five types of SSE is analysed at various conditions, and respective results are obtained, and trends are concluded. From the results of the five conditions, a suitable SSE, whose parameter is compatible with a commercial LIB, is determined via an appropriate AI algorithm. The algorithm of choice is MCDM to identify the most suitable SSE for EV. The principle of this algorithm is to follow an expert system approach using weighted scoring that mimics human decision-making by assigning weights to critical attributes based on their importance for EV performance. The core method is the weighted sum model (WSM). The four critical parameters for EV application are ionic conductivity (σ), internal resistance (R_int), safety factor and low-temperature (LT) capability. Higher values of σ reduce ohmic losses and improve power delivery; lower (R_int) resistance ensures better efficiency and heat management. The safety factor ensures stability against dendrite growth, thermal runaway, and chemical degradation. The LT capability assures the ability to retain performance at sub-zero temperatures, critical for EV operation in cold climates. The weights assigned are listed in Table 18.
Weight assignment.
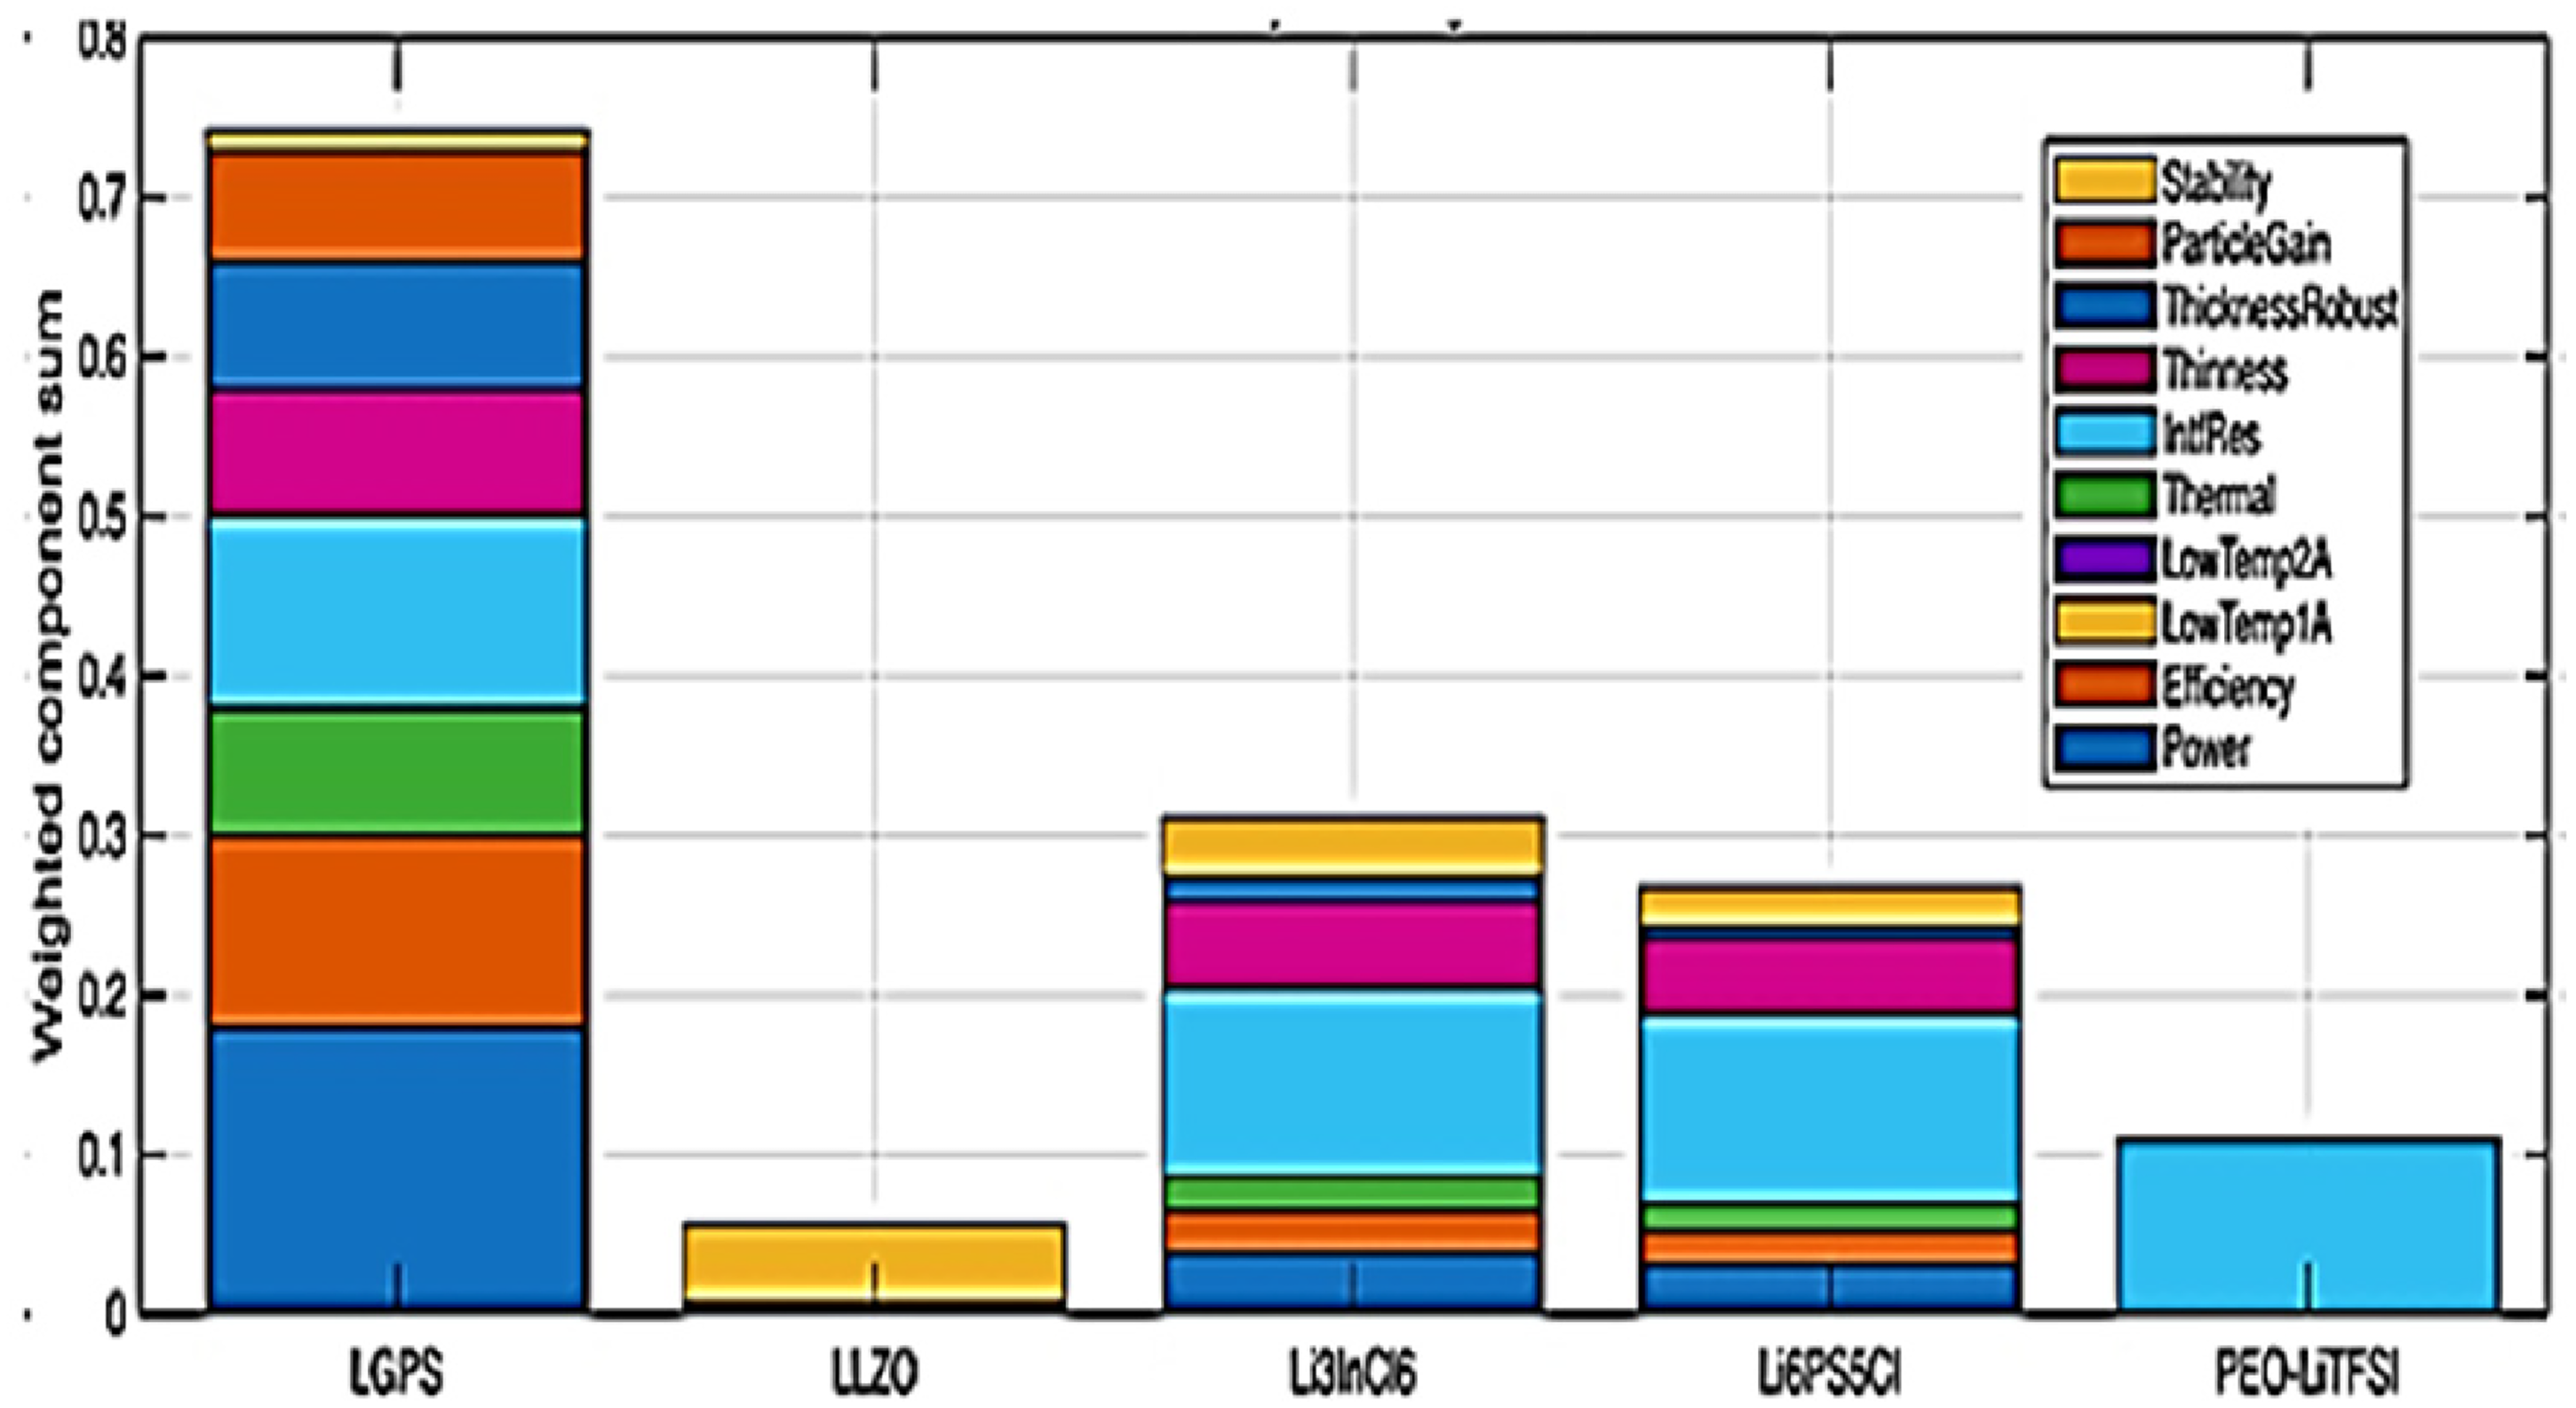
The weights reflect EV's operational priorities like power delivery, safety and temperature adaptability. For comparison, a conventional liquid electrolyte used in an NMC-based EV battery pack is taken. The typical parameter baseline is provided in Table 19 (Doyle et al., 1993). Working of the algorithm: it normalises each metric to a 0-1 scale. Weights are applied according to the importance of the respective parameters. Composite scores are computed for each electrolyte, and electrolytes are ranked based on the composite score. The general MCDM model representation is provided in the following equation: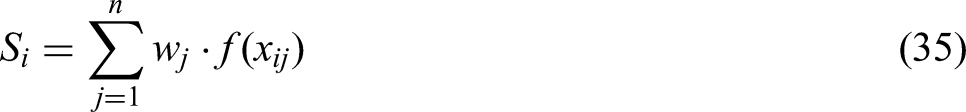
Commercial electric vehicle (EV) baseline.

With the weights being set, the composite MCDM score ranked the SSEs compatible with the commercial EV scale in the following order, illustrated in Figure 20.
Electrolyte suitability for electric vehicle (EV) application.
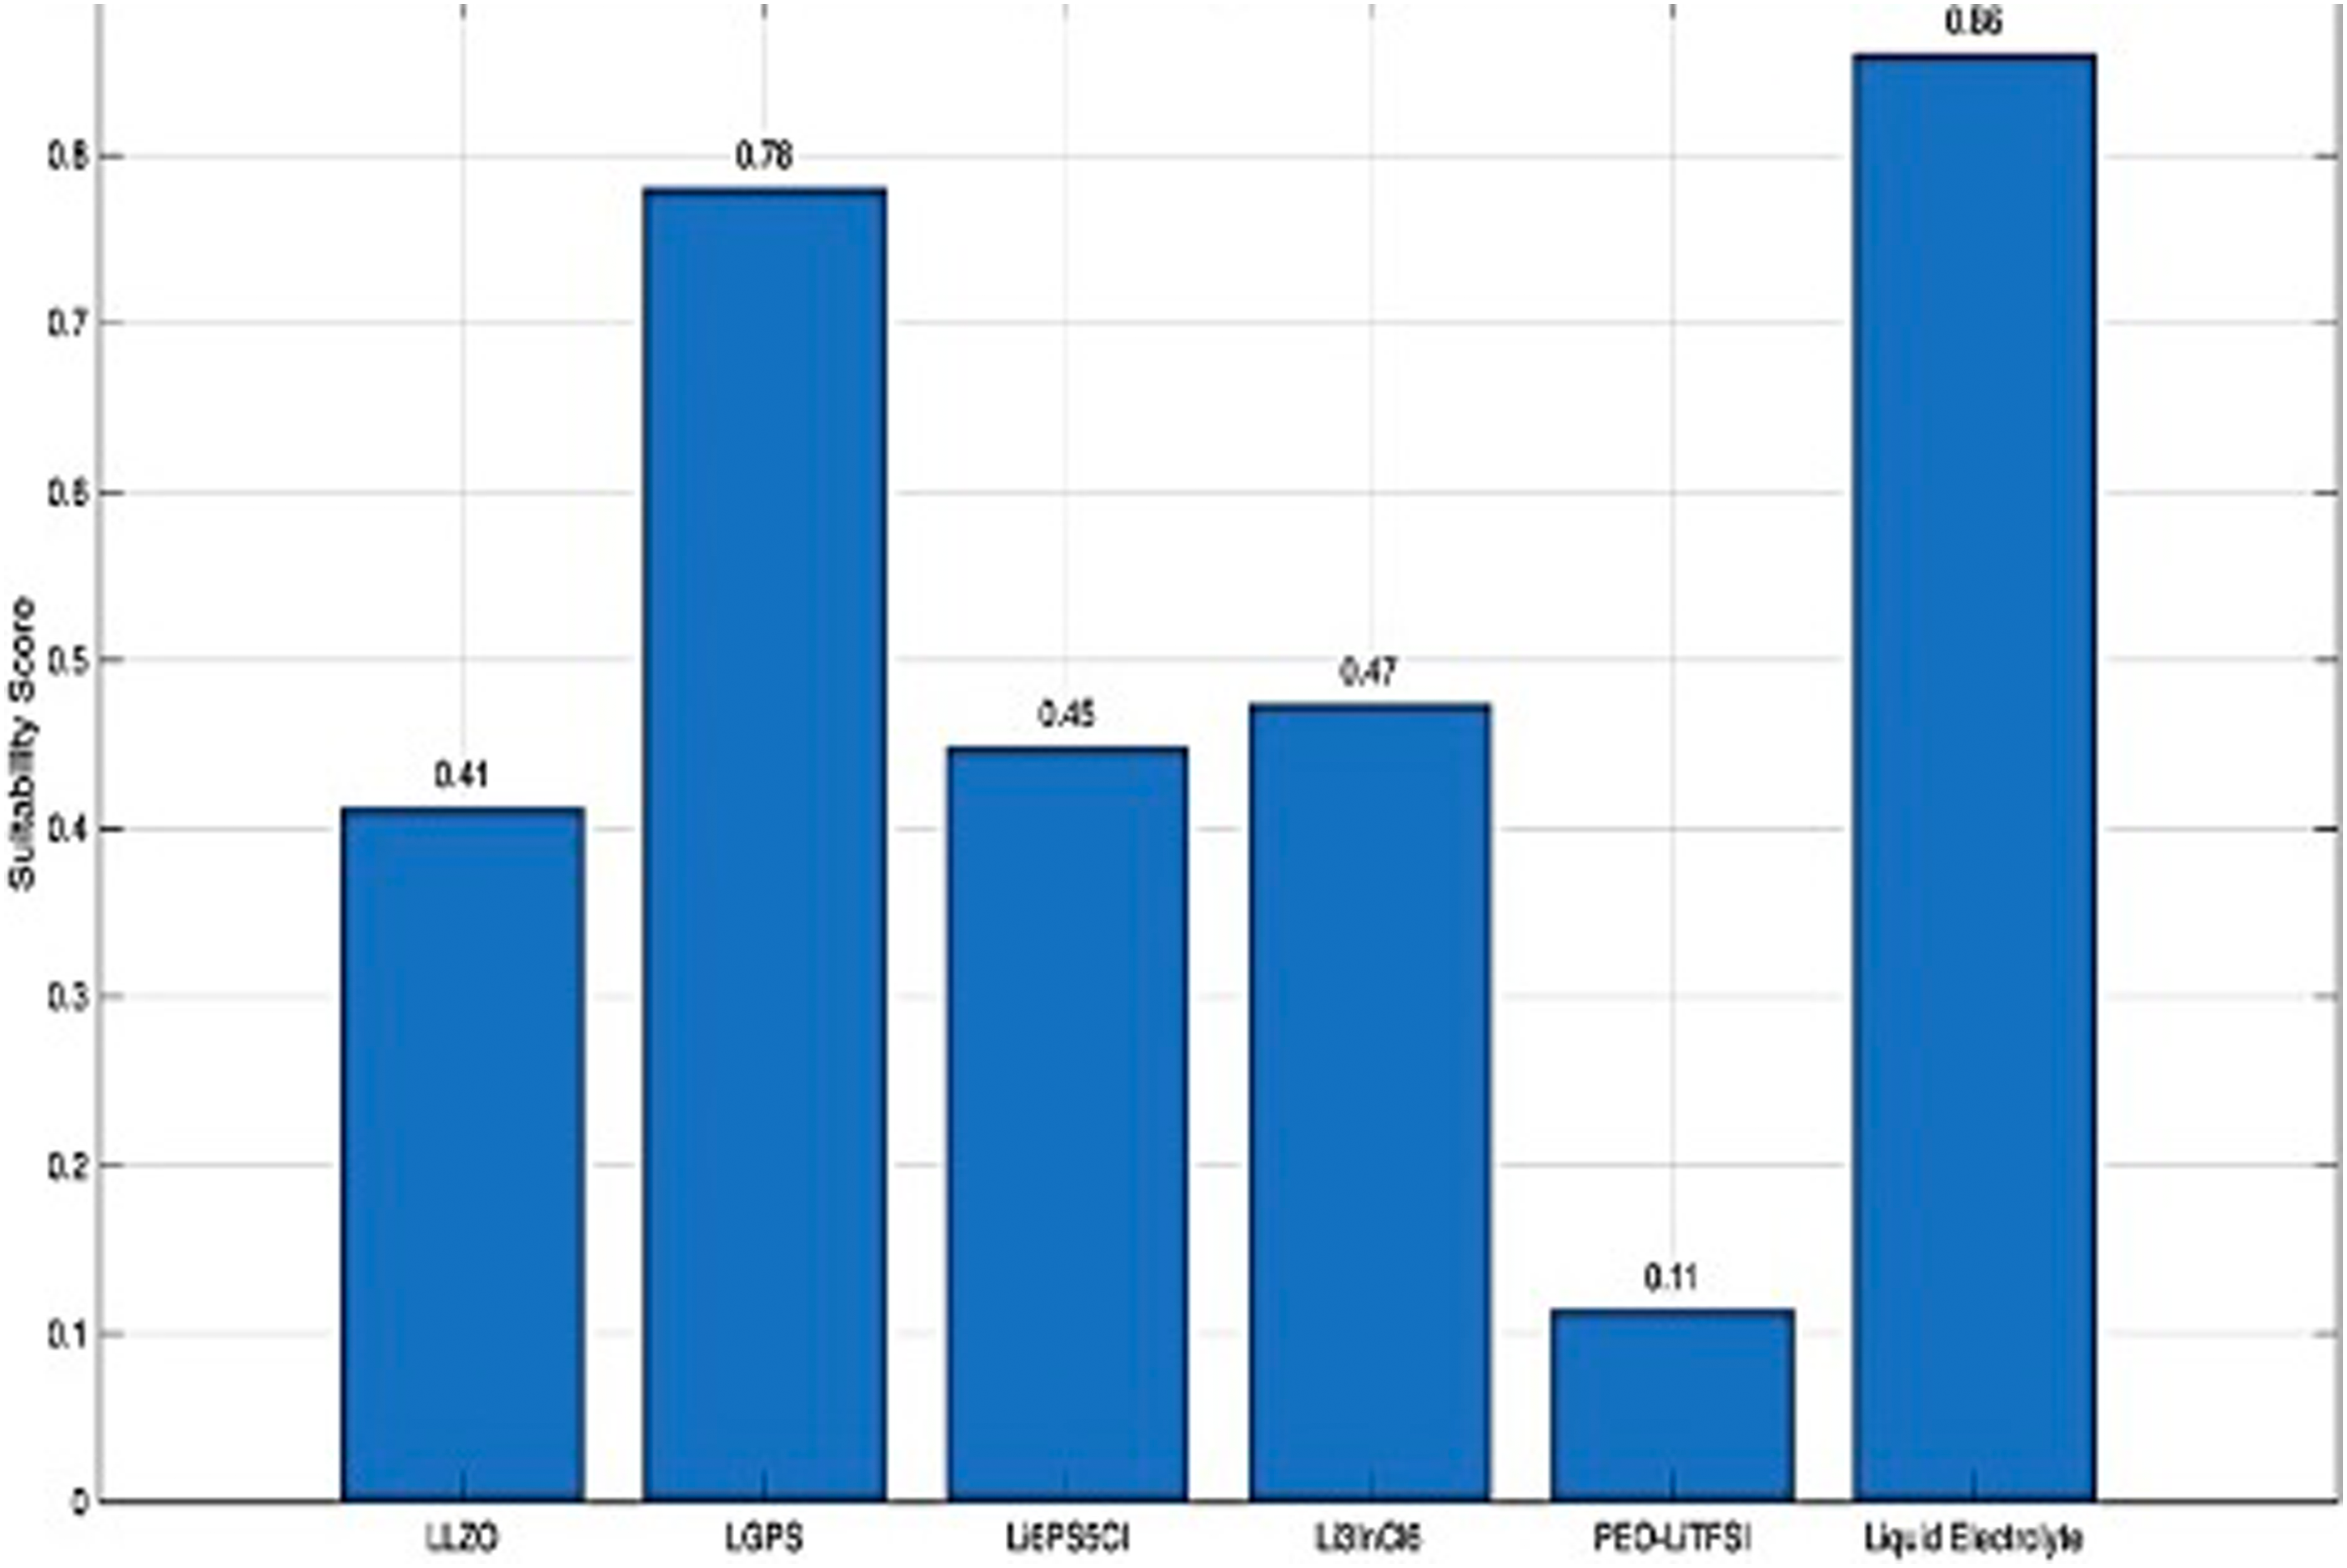
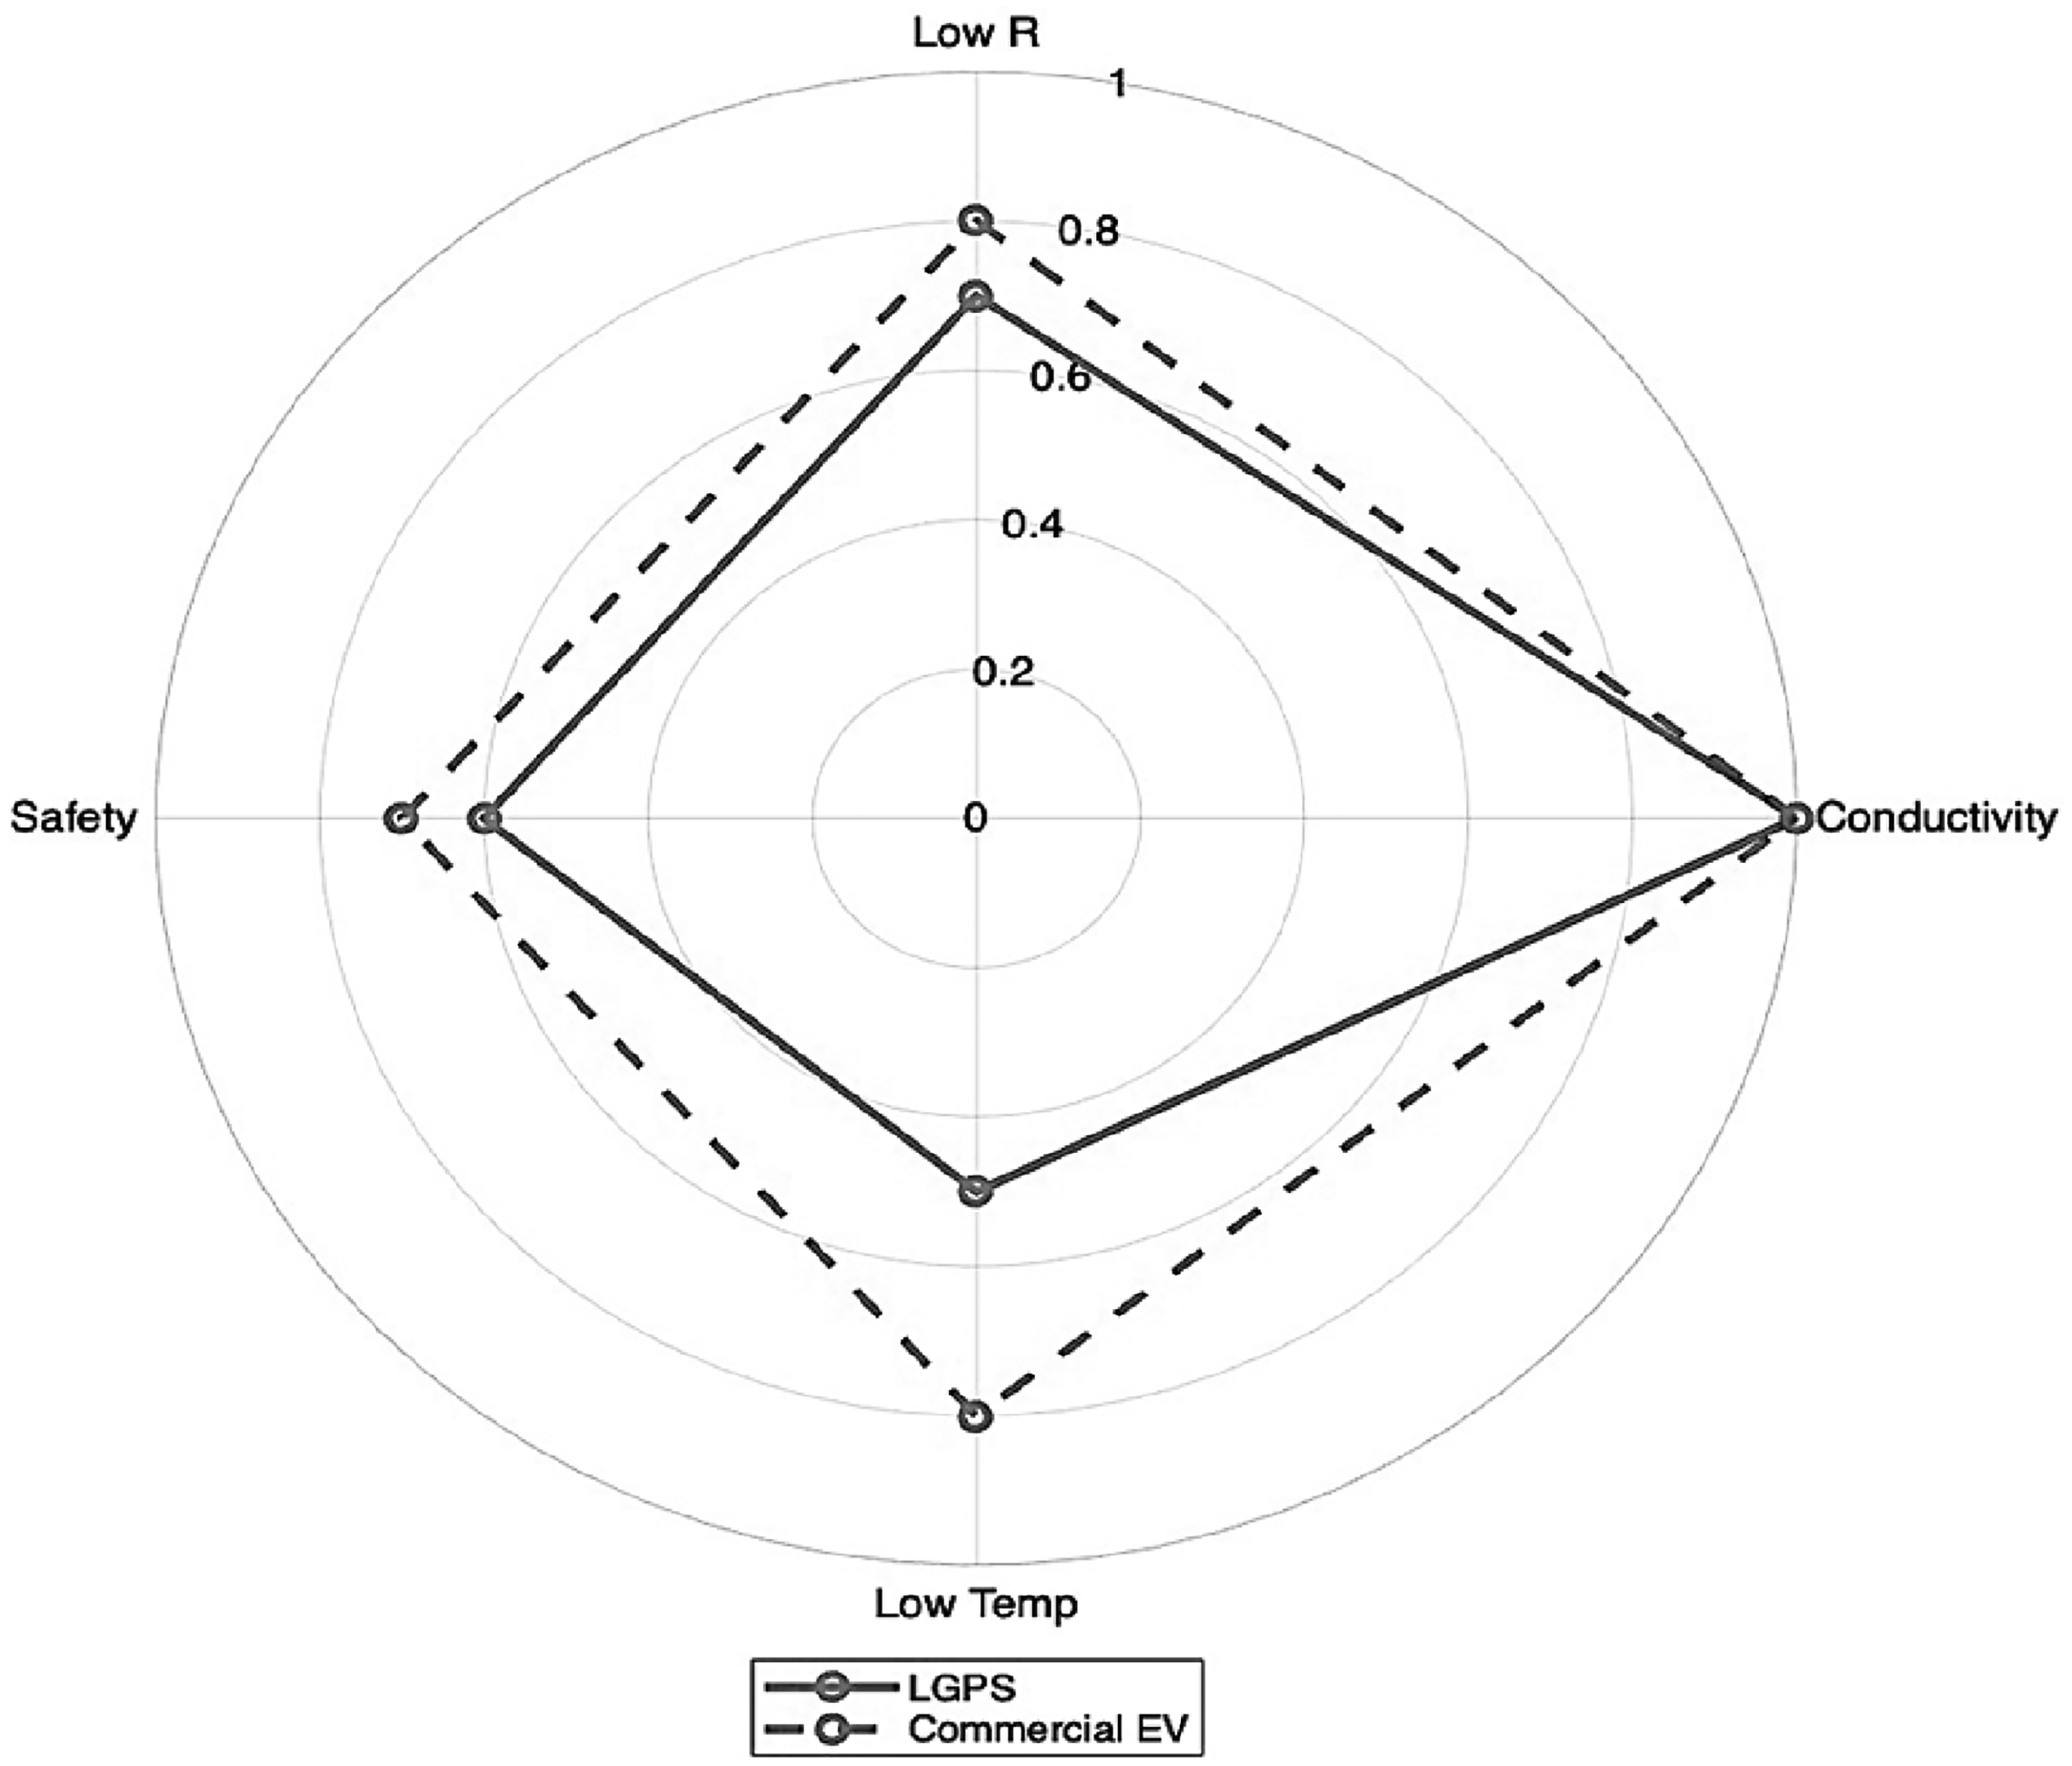
LGPS > Li6PS5Cl ≳ Li3InCl6 > LLZO >> PEO–LiTFSI. LGPS dominates in ionic conductivity and low interfacial resistance; it also has the best (most negative) low-temperature setpoint among the sulphides. Its stability is only moderate, which slightly tempers but does not overturn. Li6PS5Cl is second: good σ and decent interface, a bit behind LGPS on both. Li3InCl6 (halide) is balanced: moderate σ, moderate interface resistance, decent stability – lands close to Li6PS5Cl depending on weights. LLZO has excellent stability and compatibility with Li metal, but lower σ and larger interfacial penalties. PEO–LiTFSI lags because of low room-temperature σ and higher resistance. From Figure 21, the commercial EV comparison, it is evident that liquid is still very competitive on low T and ohmic resistance. Only LGPS is compared with the commercial EV baseline, as its stability score of MCDM is closer to the liquid than the rest. Different parameters across all five SSE are interpreted in Figure 22.
Performance radar: LGPS versus commercial EV.
Score composition by criterion.
AI model implementation and validation
A FNN architecture with three hidden layers (128–64–32 neurons) and ReLU activation functions was employed. The input feature set comprised temperature (°C), ionic conductivity (S/cm), electrolyte thickness (µm) and internal resistance (Ω), whereas the output layer represented the predicted electrolyte suitability score for EV applications. The training dataset (n = 500) was generated from the electrochemical computation described in the Methodology section, spanning the evaluated range of operating temperatures (20 °C–80 °C), thickness (10–100 µm) and current (0–5 A). Data were normalised between 0 and 1 using a Min–Max scaler, and the model was trained using the Adam optimiser (learning rate = 0.001, batch size = 32 and epochs = 1000). The mean squared error (MSE) loss converged below 10−4, and the root mean square error (RMSE) between predicted and simulated conductivity values was 0.012 S/cm on the validation set. To further refine the MCDM weighting system, an RL layer was integrated. The RL agent optimised the relative weights (wσ, wRint, wsafety and wLT) through iterative reward maximisation, minimising the deviation between AI-predicted SSE rankings and the LIB baseline. After 200 training episodes, the optimised weights converged to (0.41, 0.29, 0.19 and 0.11), closely matching the manually assigned values in Table 16, thereby validating the consistency of the AI inference.
Justification for weight assignments
The weighting of criteria in Table 19 was determined through the analytical hierarchy process (AHP), a structured technique for organising and analysing complex decisions. This method involves decomposing a decision problem into a hierarchy of sub-problems, each of which can be analysed independently. The criteria weights were assigned based on a combination of expert judgment and insights from domain literature, ensuring a comprehensive evaluation framework. Weighting rationale: (1) ionic conductivity (0.4): ionic conductivity is paramount as it directly influences the battery's power density and efficiency. Higher ionic conductivity facilitates faster ion transport, leading to improved charge/discharge rates and overall performance. This criterion was assigned the highest weight to reflect its critical importance in EV applications. (2) Internal resistance (0.3): internal resistance affects the battery's voltage stability and thermal behaviour. Lower internal resistance reduces energy losses and heat generation, enhancing safety and longevity. Given its significant impact on operational efficiency, this criterion received a substantial weight. (3) Safety (0.2): safety encompasses factors such as thermal stability and resistance to dendrite formation. Materials with high safety profiles mitigate risks like thermal runaway and short circuits, which are crucial for EV reliability. This criterion was weighted to reflect its importance in consumer safety and regulatory compliance. (4) LT tolerance (0.1): performance at LTs is vital for EVs operating in colder climates. Electrolytes with high LT tolerance maintain ionic conductivity and prevent issues like lithium plating. While important, this criterion was assigned a lower weight due to its situational relevance.
Sensitivity analysis: A sensitivity analysis was conducted to assess the robustness of the weighting scheme. It was found that a ± 10% variation in the assigned weights did not alter the relative ranking of the SSE. This indicates that the chosen weights provide a stable and reliable basis for evaluating SSE performance across various criteria.
Conclusion
The electrochemical computation framework developed in this study provides a physics-based assessment of SSE performance using equivalent-circuit and Arrhenius-type formulations. It enables a clear comparison of ionic conductivity, interfacial behaviour and electrochemical stability across different electrolyte systems and operational conditions. By incorporating temperature-dependent conductivity, resistance modelling, and microstructural parameters, the approach effectively captures key performance trends relevant to EV applications. However, the model relies on several simplifying assumptions – such as constant lumped resistances, linearised capacity fade, and uniform thermal distribution – which limit its ability to capture localised or time-dependent phenomena like SEI growth, microstructural evolution, and thermal gradients. Despite these inherent constraints, the framework remains a robust and efficient tool for evaluating electrolyte performance under parametric variations and controlled environments, offering valuable insights into the interplay between ionic transport, interfacial stability, and overall cell efficiency.
Future improvements
As for now, this study is conducted with one of the three models applicable to a battery-electrochemical system. The rest of the other two, mathematical and electrical, hold a credible influence on a performance basis. Based on the dynamics of the data obtained from either of the computationally suitable NN and an appropriate algorithm can be employed for our best interest. Further electrical models deal with the real-time usage profile.
Footnotes
Acknowledgements
The authors would like to thank Vellore Institute of Technology, Chennai, for providing the infrastructure facilities.
Ethical approval
Not applicable.
Consent to participate
Not applicable.
Consent to publication
Not applicable.
Authors’ contributions
Alen Rufus P – writing, original draft, visualisation, data curation, simulations and results; Kanimozhi Gunasekaran – manuscript supervision, methodology, investigation and validation; Ravi Samikannu – manuscript review and editing; Maruliya Begam Kadarmydeen – manuscript review and editing; Sivaram Murugan – manuscript review and editing.
Funding
The authors received no financial support for the research, authorship, and/or publication of this article.
Declaration of conflicting interests
The authors declared no potential conflicts of interest with respect to the research, authorship, and/or publication of this article.