
Abstract
This study summarizes a microscale wind resource and site suitability assessments of Chatham and Waiheke Islands in New Zealand. It aims to provide information about the quality of the wind resource on these islands and to establish technical reasons for the failure of the wind power project on Chatham Island. The standard wind-industry software, Wind Atlas Analysis and Application Program (WAsP), was used to assess the wind resource, while WAsP Engineering and the WAsP Windfarm Assessment Tool (WAT) are used to assess the site suitability. The results from the observed wind climate showed mean wind speeds of 6.6 m/s and 5.5 m/s with power densities of 295 W/m2 and 204 W/m2 for the respective measuring stations on the islands. Using selected wind turbines on the islands revealed estimated mean wind speeds, power densities, and annual energy production (AEP) of 11.1 m/s, 1449 W/m2, and 11.87 GWh/year and 7.1 m/s, 406 W/m2, and 6.15 GWh/year for Waiheke and Chatham Islands, respectively. The islands possess Wind Power Class 6 and 7 wind resources suitable for utility-scale wind power applications. The total net AEP for the Chatham wind farm is 2.73 GWh/year, and the site suitability assessment (SSA) revealed an ill-suitability of siting wind turbines, given that the mean wind speed and the turbulence experienced exceed the standard IEC 61400 recommendations.
Introduction
The global issue of climate change has strengthened the focus on renewable energy installations worldwide. Among these, one of the fastest-growing energy sources for electrical power generation is wind energy with an installed capacity increase from 24 GW to 1021 GW over more than two decades from 2001 to 2023 (REN21, 2023; GWEC, 2023).
Several factors have made it necessary to further explore and harness wind energy including the historical trend and the future projections of growth; the increasing cost-competitiveness of large-scale wind projects; the implementation of stable policies to attain government-set renewable energy deployment targets; the growing need to address the global challenges of energy security, and environmental sustainability (REN21, 2023; NZ Ministry of Economic Development, 2011). This global growth is underpinned by widespread national exploration and installations.
Countries like New Zealand that are party to the Paris Agreement and the achievement of Article 2:1(a) keep “pursuing efforts to limit the temperature increase to 1.50 °C above pre-industrial levels” (United Nations, 2015). They also recognize the individual role they play in “significantly reducing the risks and the impacts of climate change” (United Nations, 2015). This approach, coupled with achieving Sustainable Development Goal 7, i.e., Affordable and Clean Energy by 2030, makes it imperative to “invest in solar, wind and thermal power” (UNDP, 2020). It is with this view in mind that further exploration of wind energy in New Zealand is scoped.
In 2023, renewable energy resources made up approximately 43% of the total primary energy supplied (TPES) in New Zealand. These energy resources are of essential importance in New Zealand because electricity generation is its largest user. The renewable share of net electricity generation was about 88% in 2023 (MBIE, 2024). Hydro-power generation still dominated (60%) electricity generation, but the trends indicate that this generation technology has matured and its gains will remain marginal (modest scale) (Kelly, 2011). Other sources of electricity generation included 18% from geothermal, 9% from gas, 7% from wind, 2% from Coal, 1% from solar and 2% from other sources (MBIE, 2024). This presents opportunities for growth for other renewable resources as the country works towards a 90% renewable generation mix by 2025 as envisaged by the Ministry for Business, Innovation and Employment (MBIE, 2017), or a 100% renewable future as modeled by (Mason et al., 2010). These opportunities have been aided by the national energy strategy, The New Zealand Energy Strategy, which focuses on the equal prioritization of diverse resource development, environmental responsibility, efficient energy use, energy security, and affordability (NZ Ministry of Economic Development, 2011). Wind energy has been, barring the dip in the generation mix between 2015 and 2017, on a growing trajectory since the first wind turbine installation. It has the potential to generate more than its current 7% capacity from the substantial wind resource that is available (Kelly, 2011). The substantial wind energy potential that New Zealand has was quantified following academic research in the 1970s and early 1980s (Kelly, 2011; Cherry, 1987; Dawber, 1988; Edwards and Dawber, 1980; Edwards et al., 1979; Edwards, 1990; Pyle, 2016; Dawber and Drinkwater, 1996). In the years that have followed, New Zealand has grown to have twenty-one (21) wind farms operational with an installed capacity of 1263 MW (2024) and about 750 MW of consented capacity currently under construction (New Zealand Wind Energy Association, 2025).
As the wind resource investigation and monitoring gained renewed momentum in the early 2000s, financed by private/independent companies in New Zealand, the link with academic research has suffered. There is a shortage of academic references for assessing optimal locations for siting wind turbines because “research on wind energy site location is still scarce” (Wei Zheng et al., 2019). This is referred to as “a lack of sufficient qualitative information on small or micro-scale wind energy projects that exist in New Zealand” (Reuther and Thull, 2011). Pyle's case study suggests that there is currently a poor connection between wind energy research and the industry; that “wind data for sites are commercially sensitive and a private good,” primarily because wind resource assessment is sponsored by and for private organizations (Pyle, 2016). Although industry experts assert that there is little need for academic research, given the depth of the understanding of New Zealand's wind regime, the lack of academic references detailing micro-scale site climatology beg to differ. A study on micro-scale classification of offshore wind energy in New Zealand has tried to address this problem to some extent (Wei Zheng et al., 2019).
Relatively few relevant published studies on wind resource assessment can be found in New Zealand which use the industry standard wind simulation software, WAsP to assess the wind resource on a microscale level. A study on wind power potential assessment for three locations in New Zealand used the RETScreen software for energy yield calculations focused on near coastal offshore wind resources reported Bluff Harbor having better wind energy potential then Wellington and Whangarei, using Global Wind Atlas Data available through the RETScreen software (Nasab et al., 2020). Another study on carbon and energy footprints of developing onshore wind farms in New Zealand reported that despite energy investments and GHG emissions during the production phase, the onshore wind plants offsets its emissions over its lifespan, making them suitable for the energy transition in New Zealand and elsewhere (Pincelli et al., 2025). In another study on an overview of the development and application of wind energy in New Zealand found that small-scale household wind turbines have notable power generation potential and economic potential in the long term (Zhang et al., 2023). A study on permitting the use of small wind turbines in rural New Zealand for best use of the wind resource reported recommendations that municipal councils could reduce barriers to small wind turbine installations by considering taller towers in the range of 15–20 m as acceptable for household based small wind turbine systems (White and Wakes, 2014). Another study on understanding New Zealand's wind resources as a route to 100% renewable electricity reported that with an installation of additional 4380 MW of wind farms together with current hydro productions, New Zealand could easily achieve the 100% target of generating electricity from renewable energy in the near future (Poletti and Staffell, 2021). Looking at the previous studies on wind energy in New Zealand, there is a gap in scientific literature in terms of site-specific and microscale wind resource assessments and site suitability assessment of potential wind farm sites in New Zealand.
This complements an opportunity to provide open, publicly available information about the quality of the wind resource at selected sites. Two locations, Chatham and Waiheke Islands, present unique conditions that warrant wind resource assessment. The locational remoteness of the former island, to New Zealand's North and South islands, makes separate power generation the only viable option on the island. Before 2010, the island's generating station consisted of five (5) diesel generators. However, in 2010, the Chatham wind farm was commissioned. This wind farm was mothballed in 2017, seemingly for financial (Underhill and NBR, 2017) and technical reasons. Reports of the wind farm shut down because of high wind speeds (Maslin and Herald, 2019) also present an opportunity to conduct a site suitability assessment (SSA). This is important because, regardless of how “rich” the wind resource is at a site, if the site conditions are not suitable for a wind power project, the said project will underperform and lead to financial losses.
Waiheke Island has seen an increased clamor for a wind farm, led by the Waiheke Initiative for Sustainable Energy's (WISE's) Waiheke Wind, seeking consideration because of “its location and the unique potential the island has for creating renewable energy” (Waiheke Initiative for Sustainable Energy, 2020). With Vector Limited gearing up to make Waiheke Island the world's first electric vehicle island (Vector, 2019), knowledge of its wind resource will be crucial in modeling interactions between wind energy generation and electric vehicle charging (Hindsberger et al., 2012).
Given the problems and opportunities described, there is a strong need to conduct a micro-scale wind resource assessment to estimate the resources on both the islands and to conduct a site suitability assessment for the sites with excellent wind resource and make open/available the findings. This study is also motivated by wind resource assessments done within the Oceania region using microscale and mesoscale numerical models like WindPRO, WAsP, and WRF (Dayal, 2015; Dayal, 2021; Sharma and Ahmed, 2016; Dayal et al., 2021a; Dayal et al., 2022; Dayal et al. 2021b; Dayal et al., 2024).
The objective of this study is to use ground-based observations from measurement masts in the de facto industry-standard microscale wind resource modeling tool, Wind Atlas Analysis and Application Program (WAsP), to predict and classify the available wind resources on Waiheke and Chatham Islands. And to use WAsP Engineering and WAsP Windfarm Assessment Tool (WAT) to carry out site suitability assessment of both the island locations. This study also aims to establish technical reasons for the failure of the wind power project on Chatham Island.
Section “Theoretical background” of this work provides the theoretical background, section “Methodology” describes the methodology, and the results are presented and discussed in section “Results and discussion,” while the conclusions are presented in section “Conclusions.”
Theoretical background
This section presents the underlying theory of the model implementation in WAsP, WAsP Engineering, and WAT used to compute the wind parameters relevant to the wind resource and site suitability assessments.
The WAsP model
To correct the impact of topography on measured wind data, WAsP implements these sub-models: stability, roughness change, shelter, and orographic models. The logarithmic law is used to model the wind profile over flat terrains at high wind speeds.
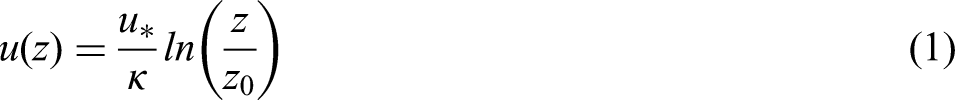

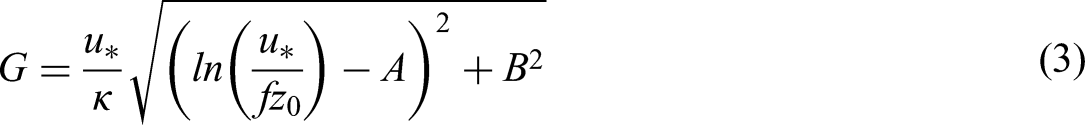
The geostrophic drag law is used to model the geostrophic wind under neutrally stable conditions. It is thus expressed as:
Stability model
To model the stability fluctuations, WAsP treats the neutral state as a basic (average) state, while the non-neutral stability conditions are treated as perturbations about the mean. The effects of varying surface heat flux are captured by using models of the climatological average and root-mean-square of surface heat flux and are derived from the geostrophic drag law and the wind speed profile.
The procedure involves the first-order expansion of the previously listed equations, including the geostrophic drag law to derive an expression to evaluate the offset from the neutral state of surface heat flux. The collection of expressions thus generated is used to estimate the “contamination” degree in an input data set that is caused by the stability effects, as well as to reintroduce proper contamination values for varying heights and conditions. Details are contained in the European Wind Atlas project papers (Landberg et al., 1996; Troen and Lundtang Petersen, 1989).
Roughness change model
To model the effect of roughness, the roughness length (

Further details are contained in the European Wind Atlas project papers (Landberg et al., 1996; Troen and Lundtang Petersen, 1989).
Shelter model
The drag in the wind caused by obstacles, especially those close to the meteorological station, is modeled and corrected for by the following equations:

Orographic model
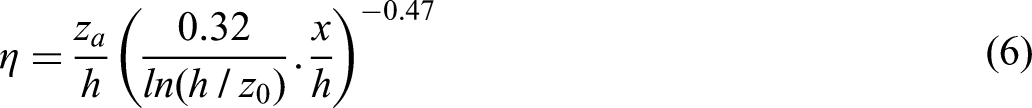
The differences in terrain height around a meteorological station affect measured wind data at the said station. To correct the measured wind data, the orographic model is used. This is done in two steps. In the first step, the potential flow perturbations over the local terrain are modeled with:


Here,
Statistics
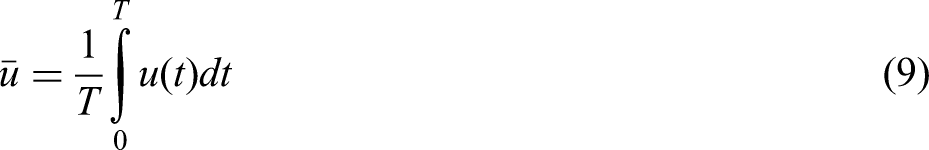
The observed wind climate varies rapidly with time. This variation in measured wind speed data is captured meaningfully by averaging over a period T. The equations below capture the modeling of mean wind speed and power density by WAsP:

The two-parameter Weibull distribution is used to collect, in a compact form, the wind data collected as shown in equation 11. It calculates the variation, skewness, and the frequency of the measured winds from which the available wind power density and wind speeds at which it is highest are computed (Chandel et al., 2014).

These sub-models and the statistical basis make up the analysis and application models of WAsP. The former is used for regional assessment and calculates the generalized wind climate (GWC). The latter is used for siting, where the actual yearly power production from specific wind turbines is calculated. To estimate the power generated at turbine site(s) and by wind farms, WAsP takes the power curve

For wind farms, like the one on Chatham Island, wake losses must be considered. With wind turbine hub height, rotor diameter, power curve, and the thrust coefficient curve, WAsP wind farm model computes the effective wind speed deficit

WAsP engineering model
The LINCOM (LINearized COMputation) flow model (Astrup and Larsen, 1989) is implemented in WAsP Engineering and solves a set of linearized flow equations using a spectral solution method, i.e., in terms of Fourier transforms, in every mesh point of a rectangular grid. WAsP Engineering extends the capabilities of WAsP by focusing on determining/modeling load-generating parameters of the wind such as extreme winds, wind shears and profiles, and turbulence (DTU Wind Energy, 2016). Topographic data and the observed, generalized, or extreme wind climate are data inputs provided by WAsP for the computation.
The LINCOM flow, turbulence, and extreme wind models permit the generation of reports including the following: extreme wind report, detailed site report, turbulence for winds report, and extreme and mean climate site assessment report. These reports are used in WAT for detailed wind farm/site assessment.
Windfarm Assessment Tool (WAT)
The WAsP Windfarm Assessment Tool (WAT) functions to ease windfarm assessment based on IEC 61400-1 standard specification. With input data from WAsP and WAsP Engineering, a turbine classification system, site assessment protocol, and terrain complexity evaluation, the suitability for any site is determined (DTU Wind Energy, 2019).
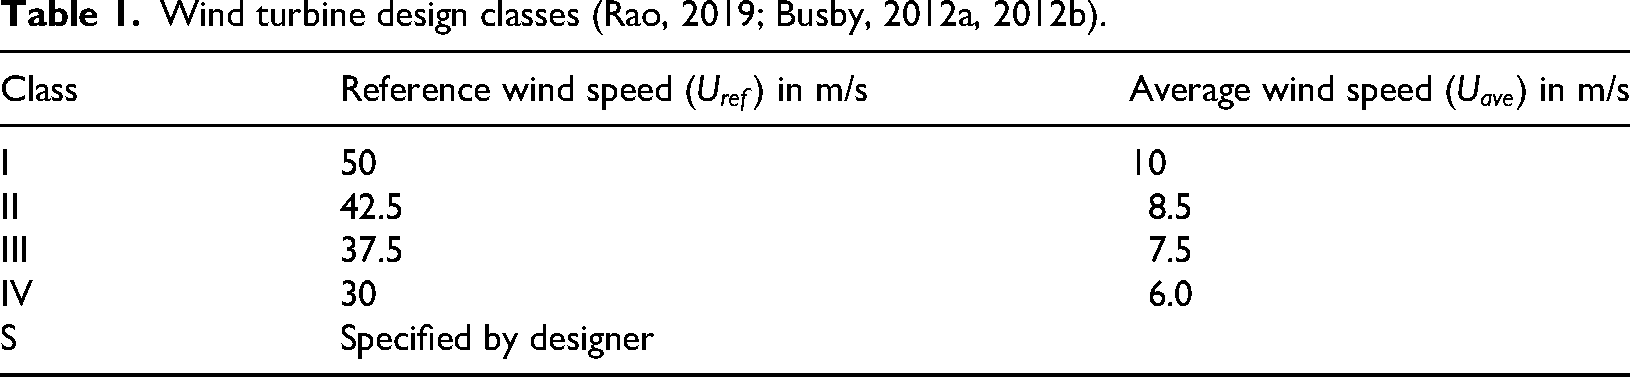
Turbine classification
Classified according to wind speeds and turbulence that wind turbines are designed for, there are generally four wind speed classes, i.e., classes I–IV, and two turbulence classes, i.e., A (18%) and B (16%) (Rao, 2019) for each class. The turbine classification system considers the following wind speed (in m/s) parameters for each class: reference wind speed (
Wind turbine design classes (Rao, 2019; Busby, 2012a, 2012b).
Turbulence is modeled with the IEC 61400-1 normal turbulence model (NTM) and based on editions (WAT has three—editions 2, 3, and 4). Characteristic/representative turbulence intensities are defined as functions of the mean and standard deviation of random ten-minute samples/measurements (DTU Wind Energy, 2019). Depending on the edition, the turbulence classification extends beyond the two classes stated by (Rao, 2019), to as many as five (A+, A, B, C, S), as contained in IEC 61400-1 edition 4.
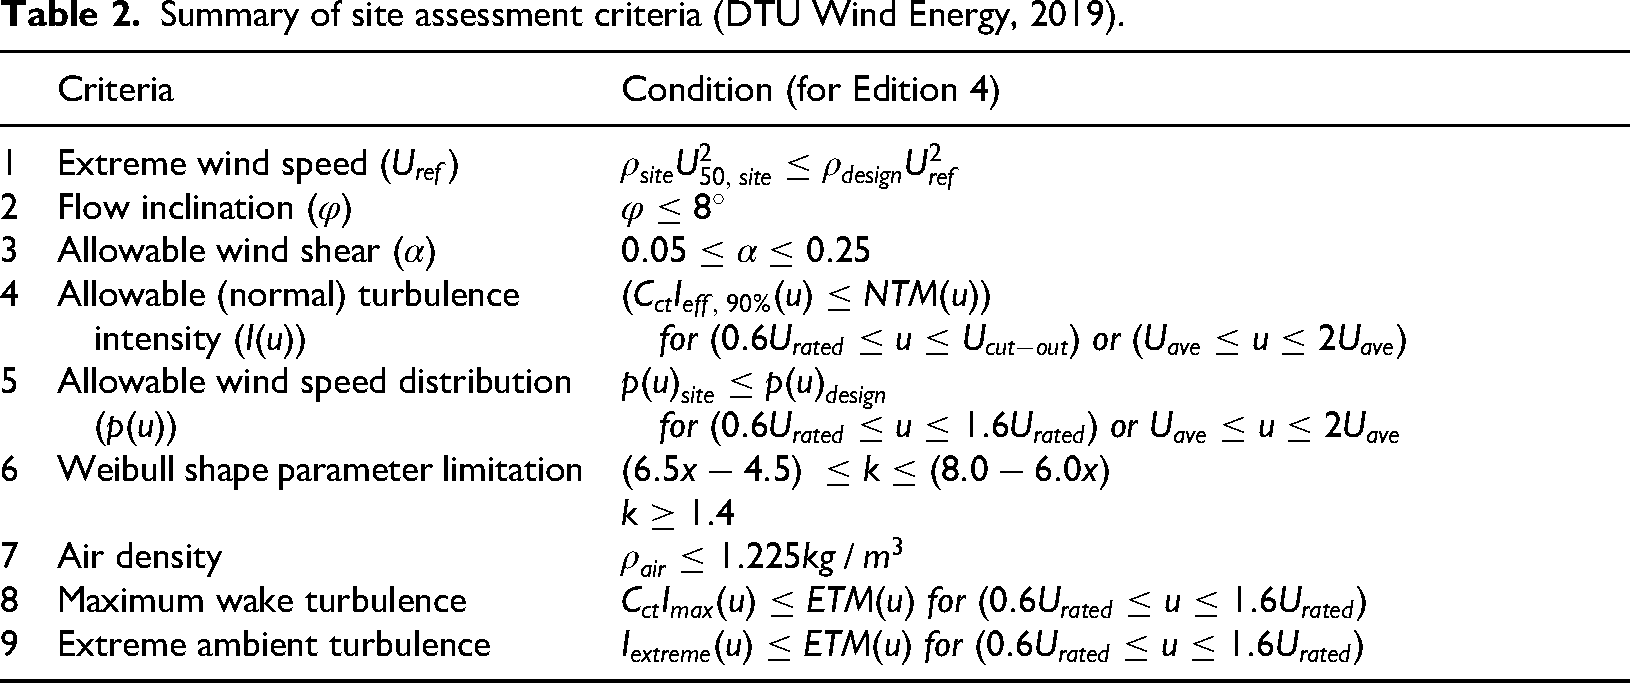
IEC 61400 site assessment criteria
To ensure the safe deployment of wind turbines, a list of criteria is defined, that should be met, in the IEC 61400-1 standard Wind turbines, Part 1: Design requirements. WAT's turbine classification system compares the extreme and average wind speeds, and the mean, effective, and extreme turbulence intensities to recommend an IEC turbine class most suitable for use at turbine sites. The flow conditions present a summary of the major criteria, and conditions, to be met including the 50-year extreme wind speed (
Summary of site assessment criteria (DTU Wind Energy, 2019).
where
Methodology
In this section, the study locations, meteorological data used and the modeling approach with WAsP, WAsP Engineering and the Windfarm Assessment Tool (WAT) are described.
Study locations and meteorological data
Figure 1 shows the study locations of Chatham and Waiheke Islands in New Zealand with earmarks on the location of the meteorological stations on both islands. The meteorological data for Chatham Island consists of nineteen (19) years of hourly averaged wind speed and direction measured at an elevation of 12 m above ground level (a.g.l), collected over the period spanning from October 1999 to November 2018. This data was supplied by the National Institute of Water and Atmospheric Research (NIWA) for Tuuta meteorological station whose coordinates are (−43.81687, −176.475). Information about the station listing is shown in Table 3.
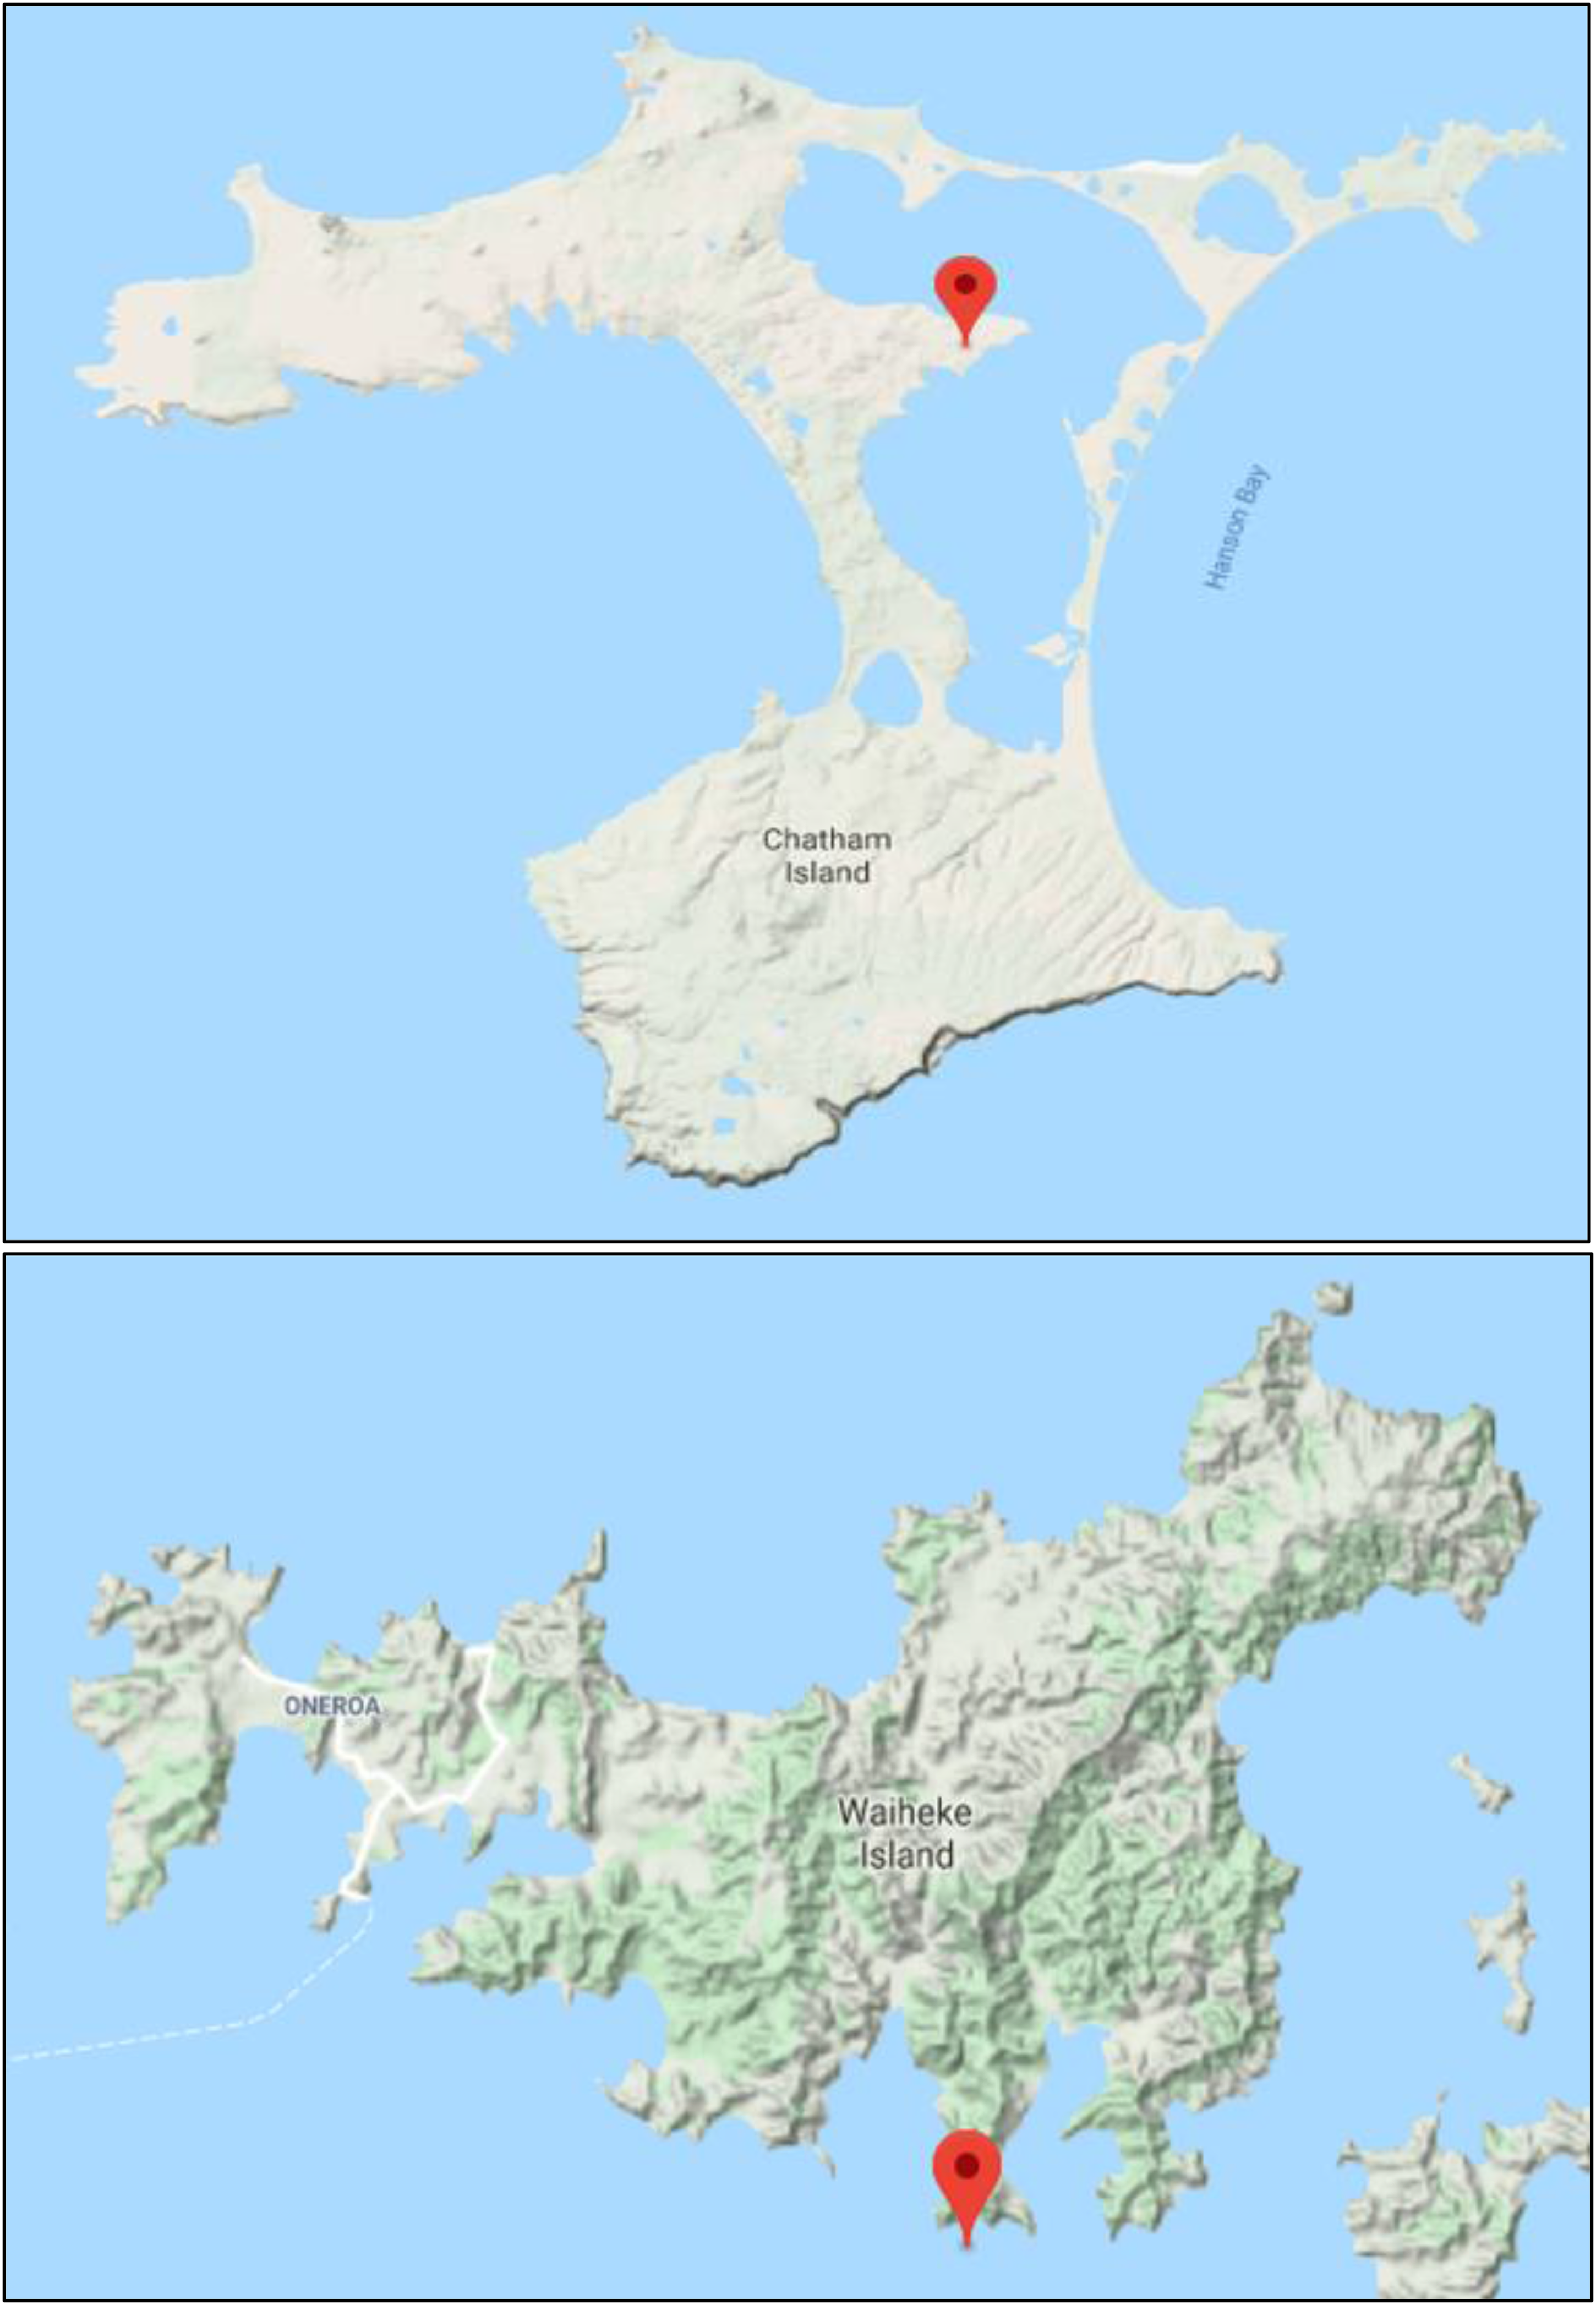
Chatham (up) and Waiheke (down) Islands (Source: Google Maps).
Station listing for Chatham Island.
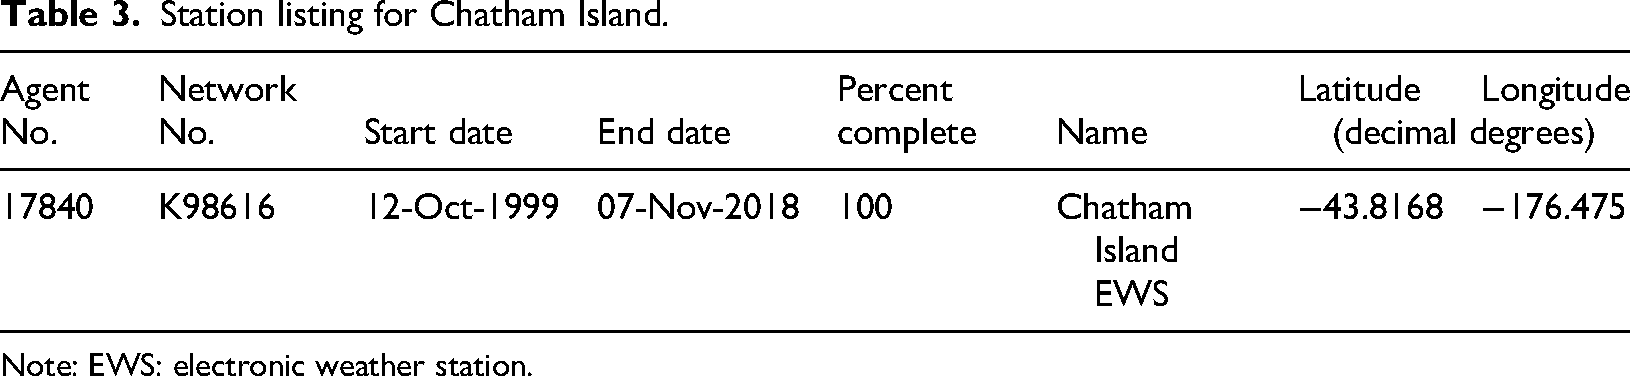
Note: EWS: electronic weather station.
For Waiheke Island, MetraWeather (MetraWeather, 2025) provided eleven (11) years of hourly averaged measured wind data collected over the period spanning from December 2008 to December 2019. The meteorological station (−36.85, 175.117) at Passage Rock measured wind data at a height of 8 m above sea level (a.s.l).
Software setup and modeling
WAsP
Modeling with WAsP typically involves wind data analysis, defining topographical concepts for the roughness, shelter, and orography models, the estimation of power produced at a turbine site, as well as the power production from a wind farm. Prior to setting up a WAsP project, the application provides some utility tools to prepare meteorological and topographic input data into the right formats. Wind data analysis was done by the WAsP Climate Analyst (WACA 3.1). It performed analyses on the time series of meteorological wind data and produced a summary of extreme and mean wind climates. A WACA project was set up for the met stations on Chatham and Waiheke Islands from where data was collected. Sites and instruments were set up, and data were imported, selected, and mapped onto instrument heights, for the calculation of an observed mean wind climate (OMWC) which describes the overall mean level of wind resource available at a site with temporal variation, that was exported to WAsP. An observed extreme wind climate (OEWC) describing the magnitude of the strongest winds was also exported for use in WAsP Engineering later.
The WAsP Map Editor 12.3 was used which allows the creation, editing, and inspection of topographical maps in WAsP. These maps contain terrain information like elevation and roughness, and this tool allows the terrain roughness and elevation data to be imported from web databases. For this article, the database used was the Global Wind Atlas (GWA) Map Warehouse. After separate importation of roughness and terrain data, they are added together to form a single digitized map containing elevation and roughness for both islands as shown in Figure 2.
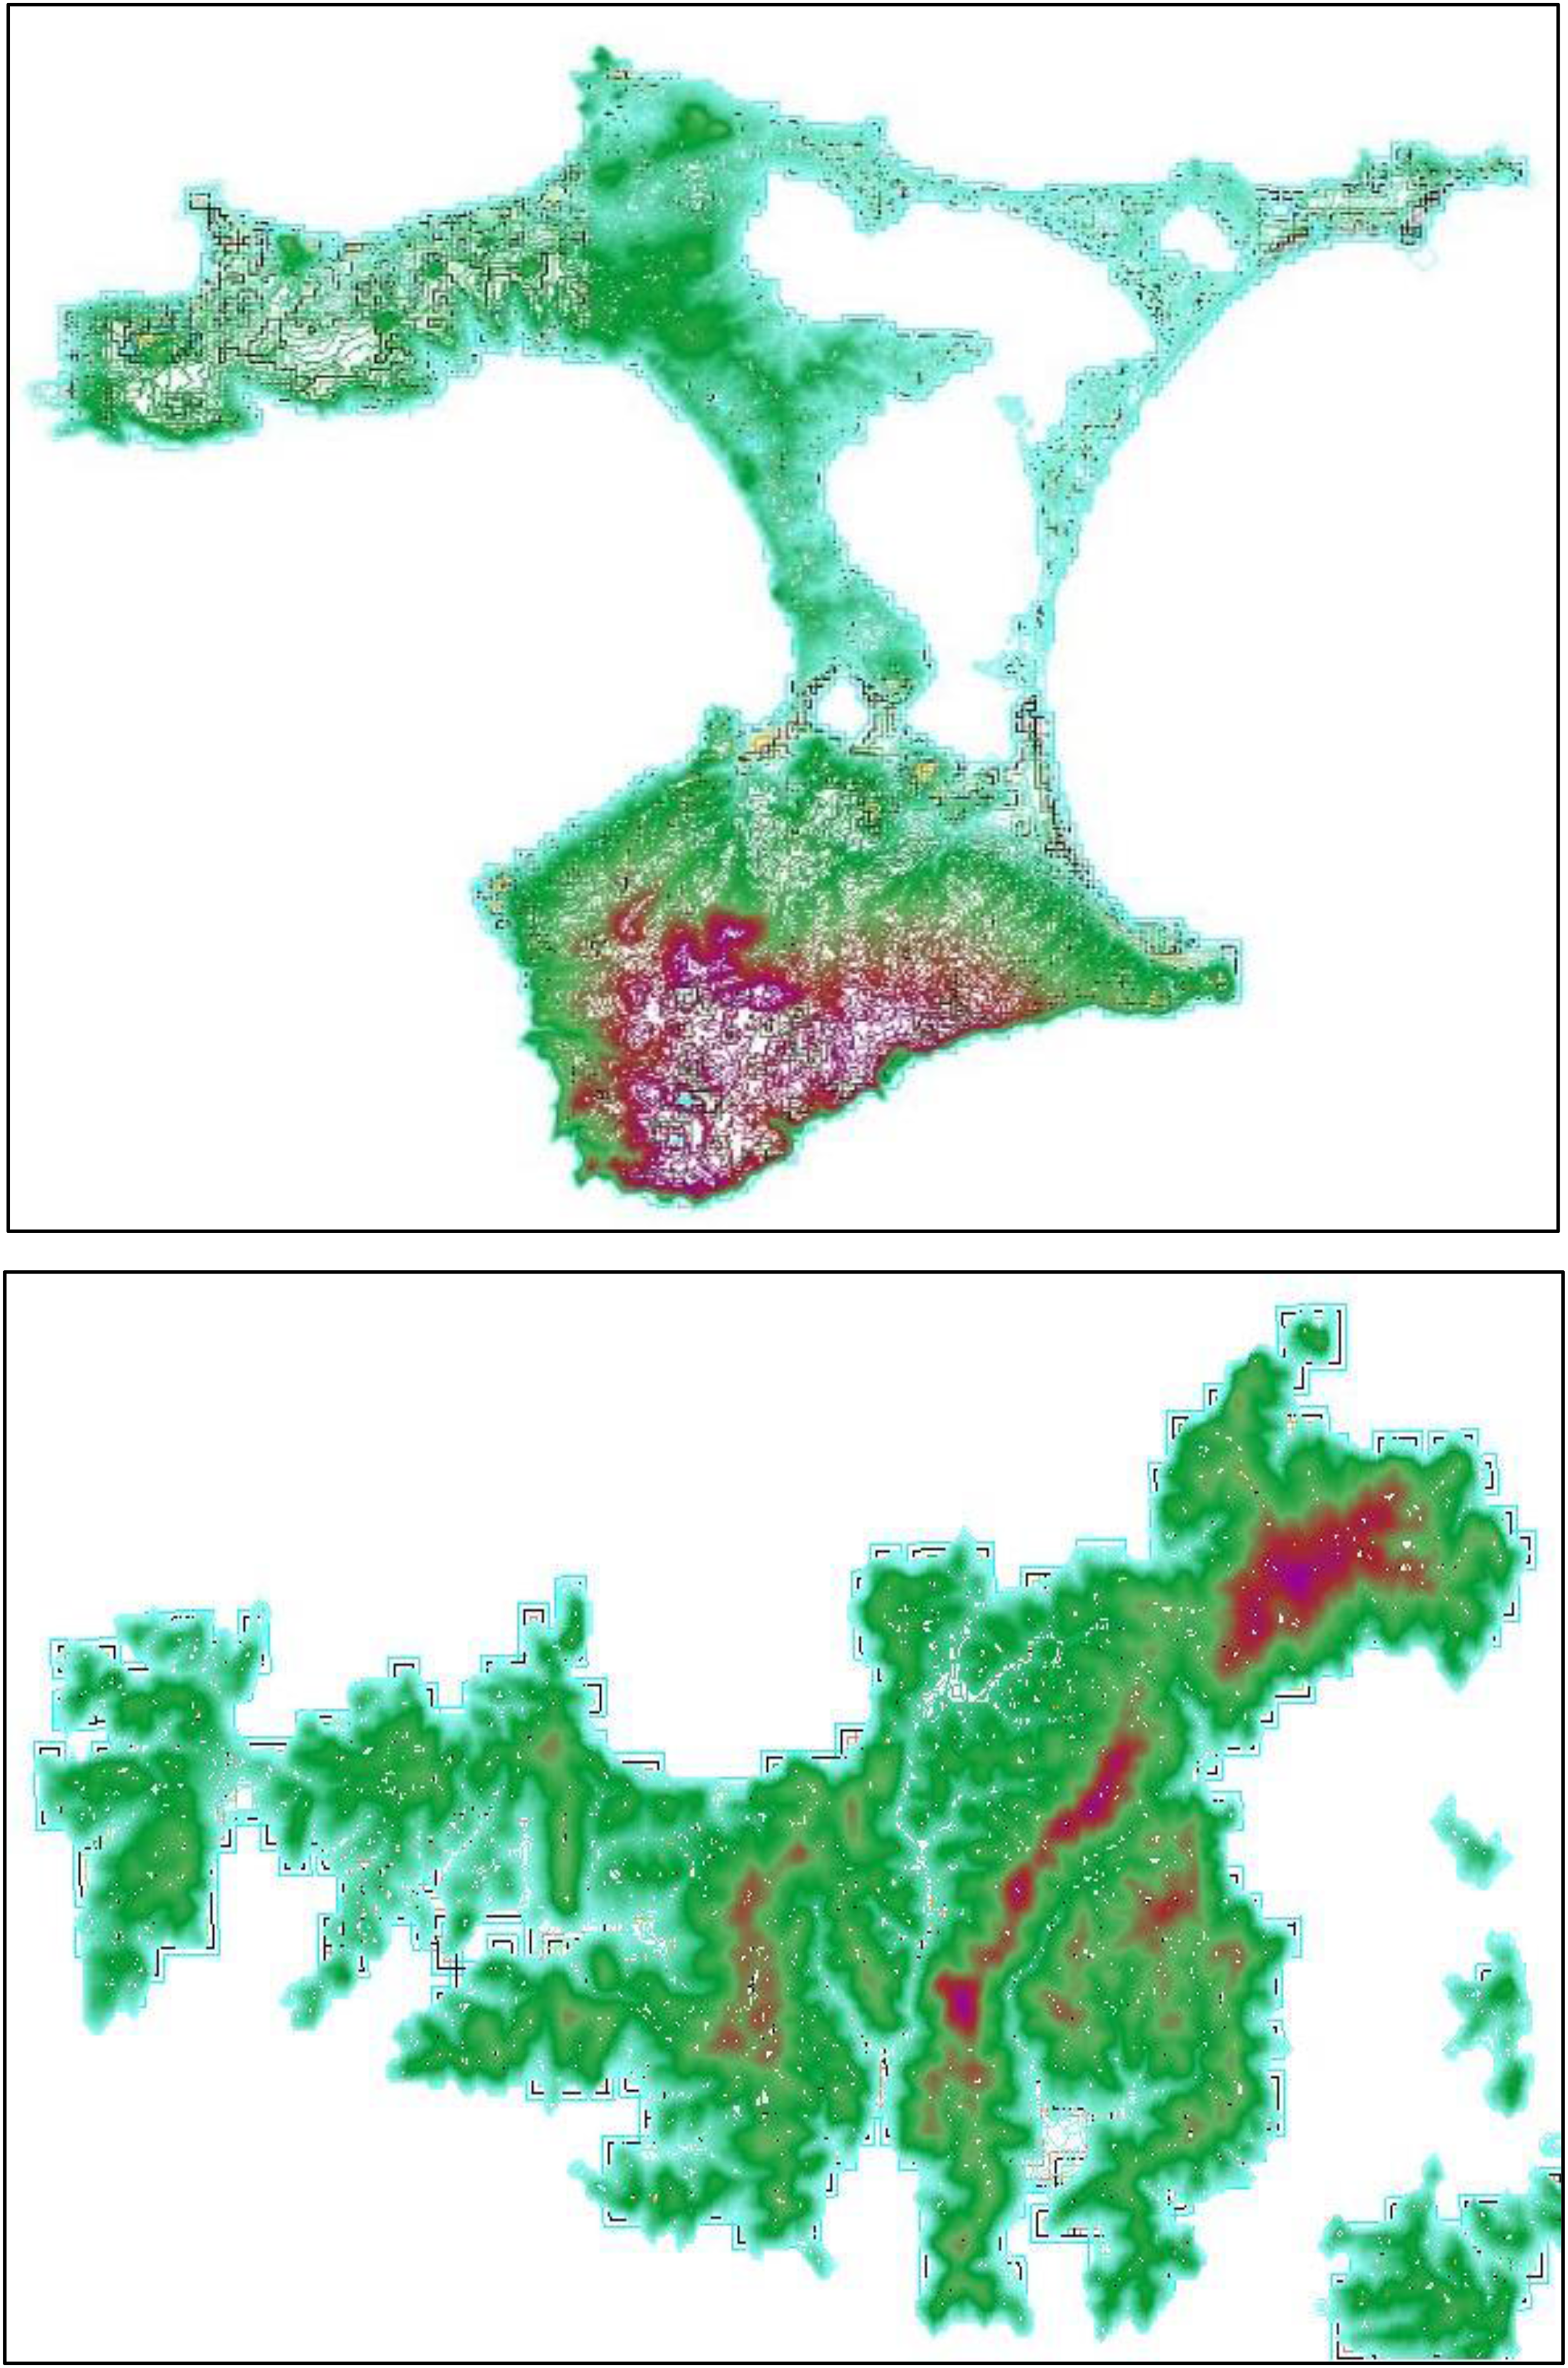
Digitized maps of Chatham (up) and Waiheke (down) Islands showing combined elevation and roughness maps.
With the OMWC and the digitized maps, a WAsP project was set up for both islands. Inside these projects, the obstacles were defined close to meteorological stations at Passage Rock (Waiheke Island) and Tuuta Airport (Chatham Island), and a generalized wind climate (GWC) was calculated.
The WAsP model uses the Wind Atlas Methodology, which uses the measured wind data to generate a site-independent generalized wind climate (wind atlas). The generated wind atlas represents the wind climate over ideal, featureless terrain and is then used with combined roughness and topographic maps of a specific site to calculate the actual, site-specific wind climate. This is done by analyzing the measured wind data, then transforming them into a generalized wind atlas and then applying inverse calculations with local terrain and roughness data to predict wind conditions at any location under study.
To calculate the annual energy production over the entire islands (as in a resource grid), or at given site locations, appropriate wind turbines must be selected. For Chatham Island, initial turbine selection was guided by the existing 225 kW Vergnet GEV MP-C 30 turbines (McWhirter, 2010) mothballed on the island. Given the information provided by Vergnet, the GEV MP-C 30 m twin-rotor turbines were installed (Vergnet Wind Turbines, 2020). These WTGs generally have power ratings ranging from 200 kW to 275 kW (Vergnet Wind Turbines, 2014). These sources form the bases from which the power and thrust coefficient data used in modeling were created. Figure 3 (left) shows the plot of these curves.
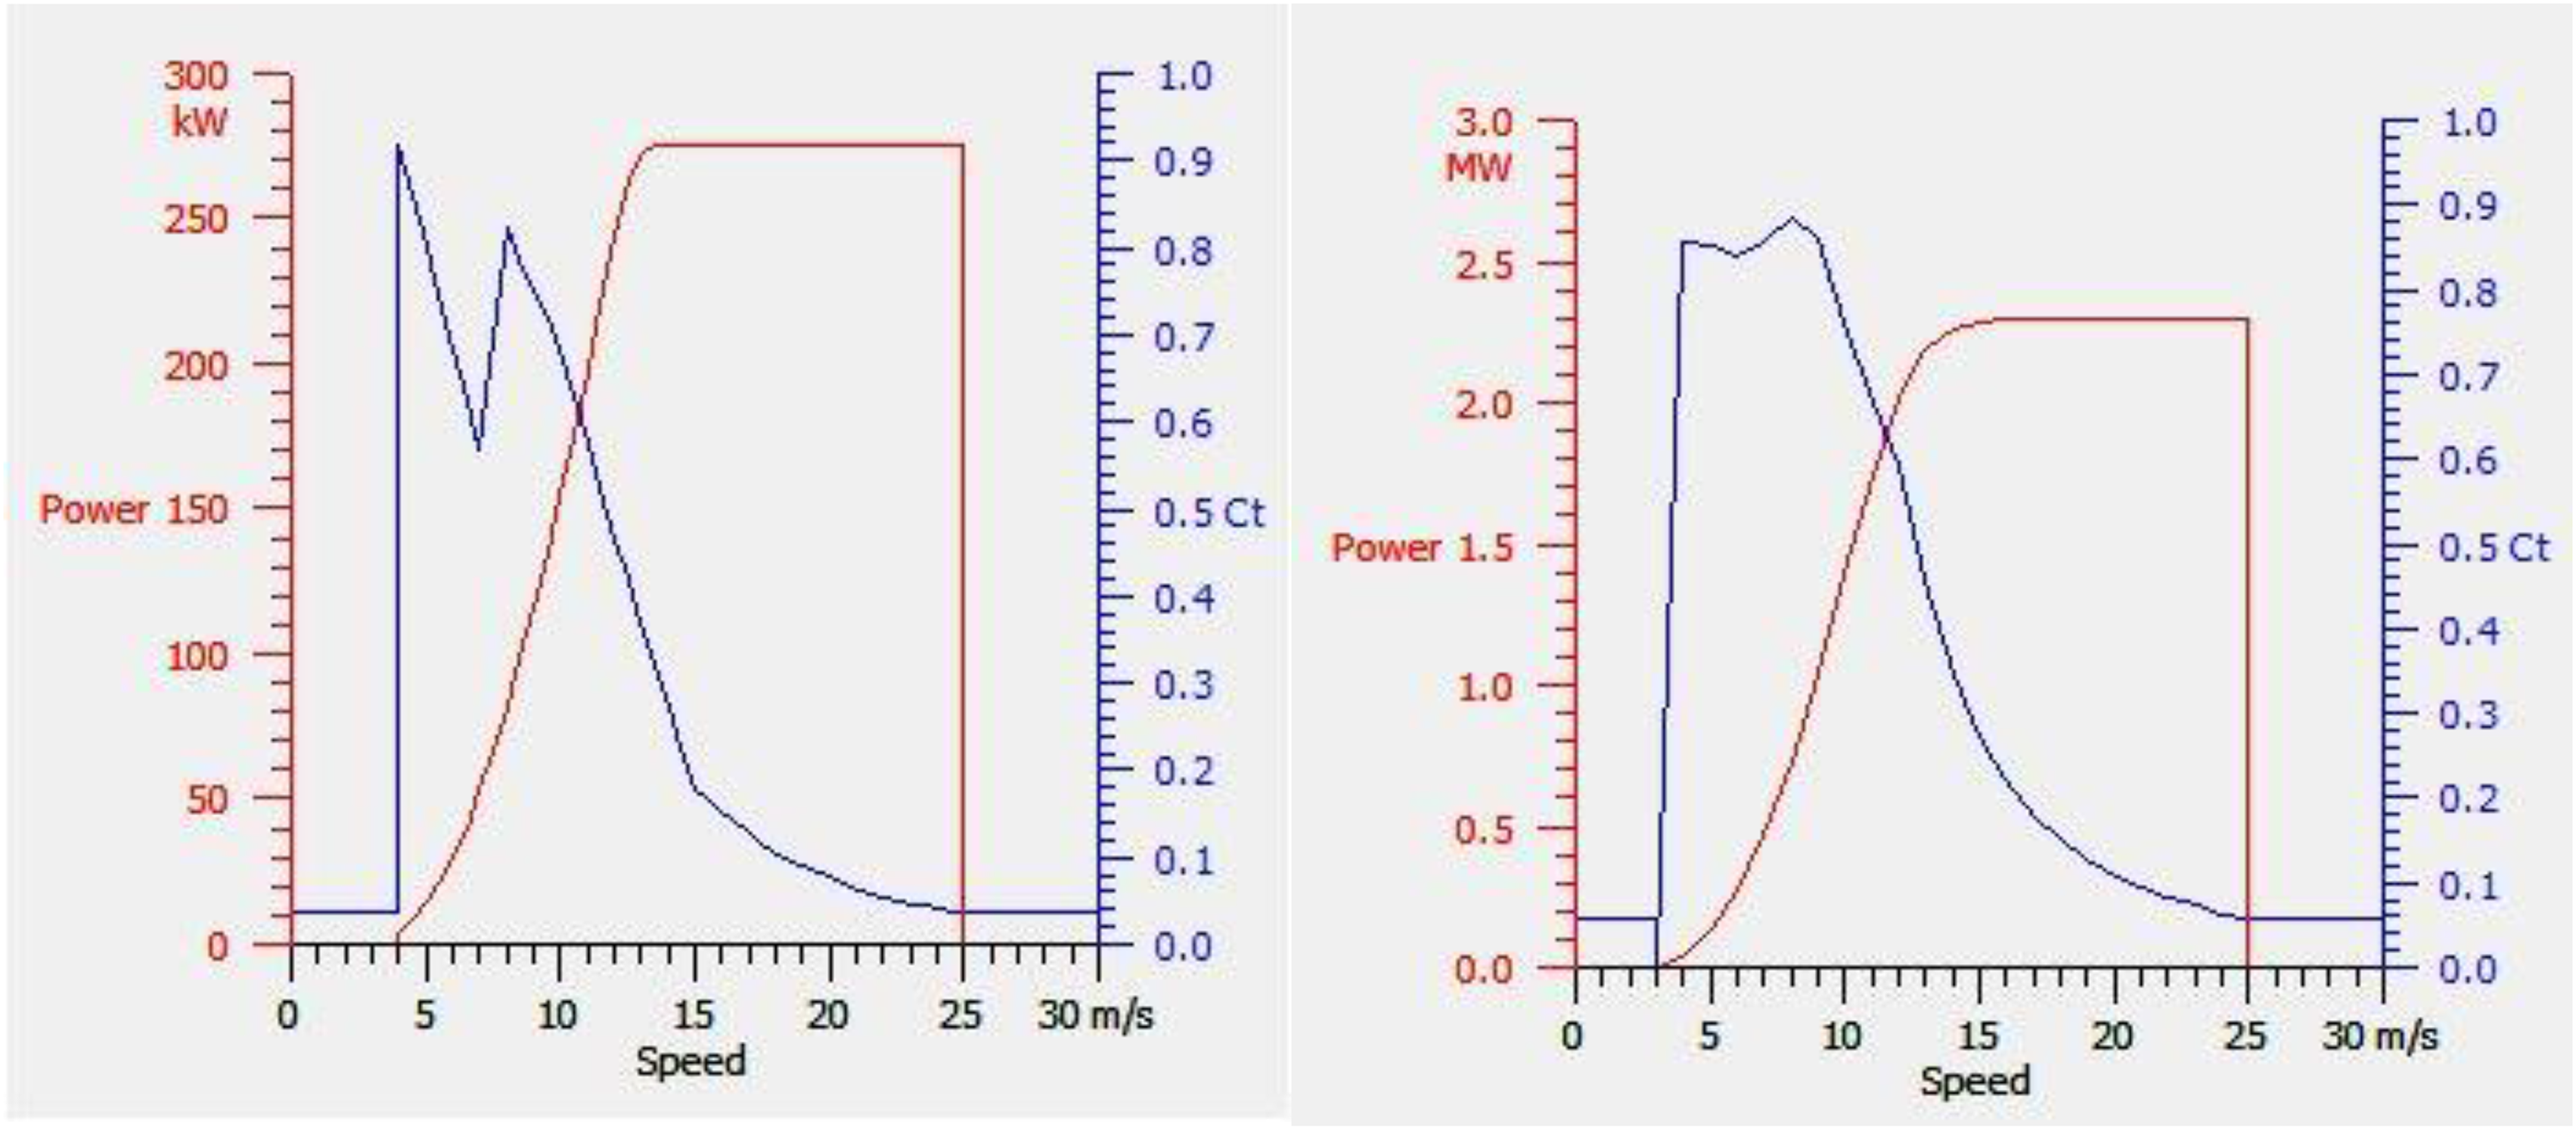
Thrust coefficient and power curves for Vergnet GEV MP 30 (left)a turbine used on Chatham Island and Siemens SWT-2.3-82 (right)b turbines selected for Waiheke Island.
For Waiheke Island, there has been no wind farm or turbine(s) sited, hence initial selection will be guided by the trend in existing wind farms in New Zealand. Of the six hundred and sixty-four (664) turbines installed in New Zealand, the 2.3 MW Siemens SWT-2.3-82 accounts for majority of the wind turbines. This type was selected for the resource assessment on Waiheke Island. Figure 3 (right) shows the WTG curves selected for Waiheke Island.
Note that site suitability assessment will provide better insights into the wind loading factors that affect the wind turbines selected. From the assessment, final turbine selections/recommendations are (can be) made. With the turbine selected and added to a turbine site or windfarm, mean speed at hub height, the total gross and net annual energy production (AEP), power density, and others are calculated for the resource grid using WAsP 12.1. The resource grid presents a spatial variation of the wind resource, as well as the ruggedness index (RIX), which indicates the degree to which terrain complexity (orography), outside WAsP operational envelope, impacts the accurate prediction of the wind resource (Mortensen et al., 2019).
WAsP Engineering
A WAsP Engineering project was set up for Chatham and Waiheke Islands, each by first inputting the project domain of elevation and roughness maps. This map was obtained from WAsP Map Editor. Then, the observed extreme wind climate (OEWC) and/or observed, generalized, or geostrophic winds are input into WAsP Engineering. Windfarms are then inserted from the site locations with class 6 or 7 wind resource. For Chatham Island, the windfarm layout remains as it is, while for Waiheke Island, as much as is possible within areas with excellent wind resource, the rectangular array recommendation by Busby (2012a, 2012b) is adopted. Modifications are made, as deemed appropriate, to create a best-fit layout. For all winds (observed, generalized, and geostrophic), WAsP Engineering solves and reports for a list of parameters including wind speeds, roughness, friction velocities, “u,” “v,” and “w” component velocities and turbulent intensities, roughness, and flow inclination, amongst others. For every turbine site in each windfarm, at every defined height (usually the mid-lower, exact, and mid-upper hub heights), and given the GWC of both islands and selected wind turbines, a site assessment report is generated.
Windfarm Assessment Tool (WAT)
The site assessment report generated for Chatham and Waiheke Islands is imported into WAT, and a new project was set up for both islands, separately. In this WAT projects, the flow conditions at each turbine site are presented with green-filled circles indicating that a flow condition at a site is “OK” and a red-filled circle indicating a “problem”. Because the majority of the calculations for site suitability are done in WAsP and WAsP Engineering, WAT presents an easier-to-manage overview with the option to modify certain parameters, like sector management, as well as modeling of the mean and the standard deviation of the turbulence intensities (DTU Wind Energy, 2019).
For Chatham Island, the site suitability report for selected excellent sites, including the Chatham windfarm, is presented. For Waiheke Island, the report covered sites with excellent wind resources.
Figure 4 shows the pictorial representation of the processes this paper takes to estimate the wind resource on Chatham and Waiheke Islands and to conduct the site suitability analysis (SSA) on sites with excellent utility-scale wind resource.
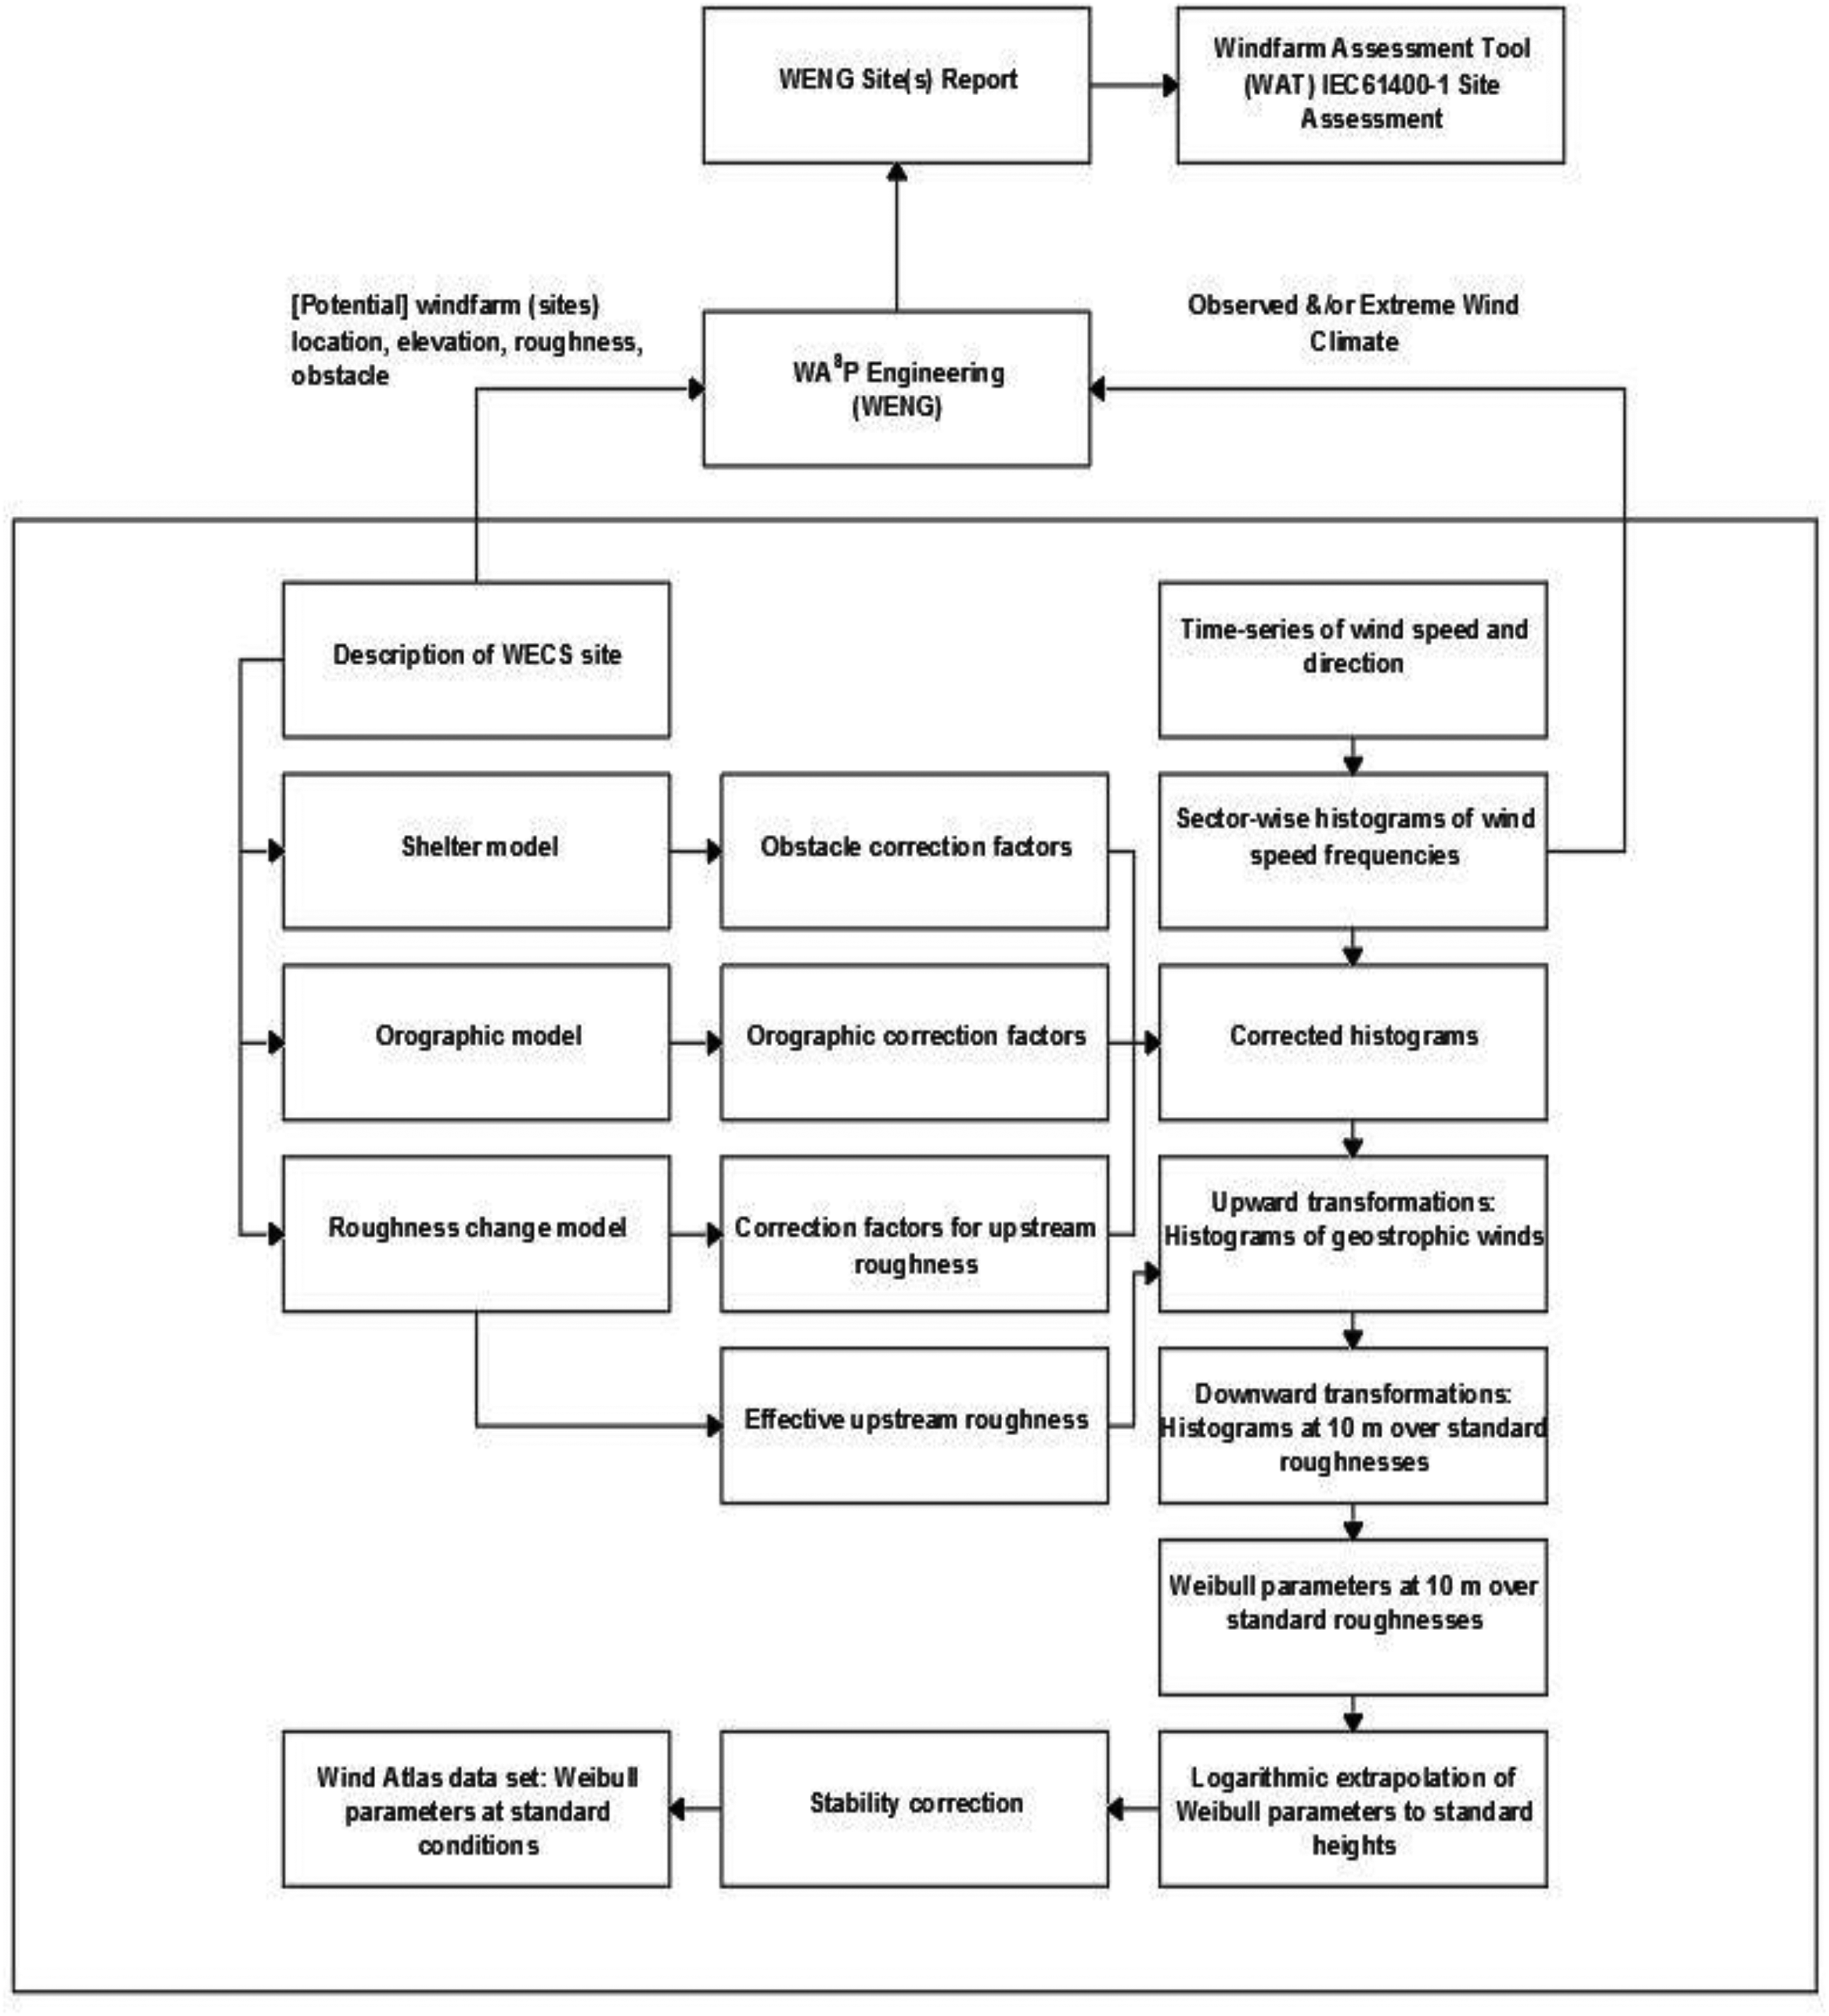
A pictorial representation of WAsP analysis (in bounded box) (Troen and Lundtang Petersen, 1989) and the modification to include WAsP engineering and WAT modeling.
Results and discussion
In this section, the simulation results from WAsP, WAsP Engineering, and WAT are presented. For WAsP, the temporal variation of the observed mean wind climate (OMWC) for both islands are presented. The spatial variation of the wind resource, as contained in the resource grids of the mean wind speed, annual energy production (AEP), and power density, are presented for both the islands. For Chatham Island, which has an existing but mothballed wind farm, the AEP for the said wind farm is also highlighted and discussed.
Finally, the results of the site suitability assessment (SSA) for regions/sites on both these islands with excellent wind resources (isolated and fitted with wind farms) are presented and discussed. These results are obtained from a simulation with WAsP Engineering and WAT.
Temporal variation
In this subsection, a summary of the time-independent observed mean wind climates (OMWC), diurnal and annual variation of measured wind for Chatham and Waiheke Islands is presented.
Observed mean wind climate
The OMWC for Chatham Island is shown in Figure 5 and summarizes the sector-wise and overall observations for Chatham Island. The most frequent mean wind speeds are experienced in sectors 1 (11.1%), 8 (13.6%), 9 (15.1%), and 12 (12.6%). The corresponding sector angles and wind speeds are 6.81 m/s at 0°, 7.36 m/s at 210°, 7.21 m/s at 240°, and 6.66 m/s at 330°. The prevailing winds are south-westerly and north-westerly. The all-sector omni-directional mean wind speed is 6.59 m/s and the power density for this speed at 1.225 kg/m3 density is 295 W/m2. The fitted all-sector Weibull-A parameter is 7.5 m/s, while the Weibull-k parameter is 2.32. The wind resource parameters at the Chatham Island measurement station are in the Wind Power Class 3 and above category, suitable for utility-scale wind power projects.
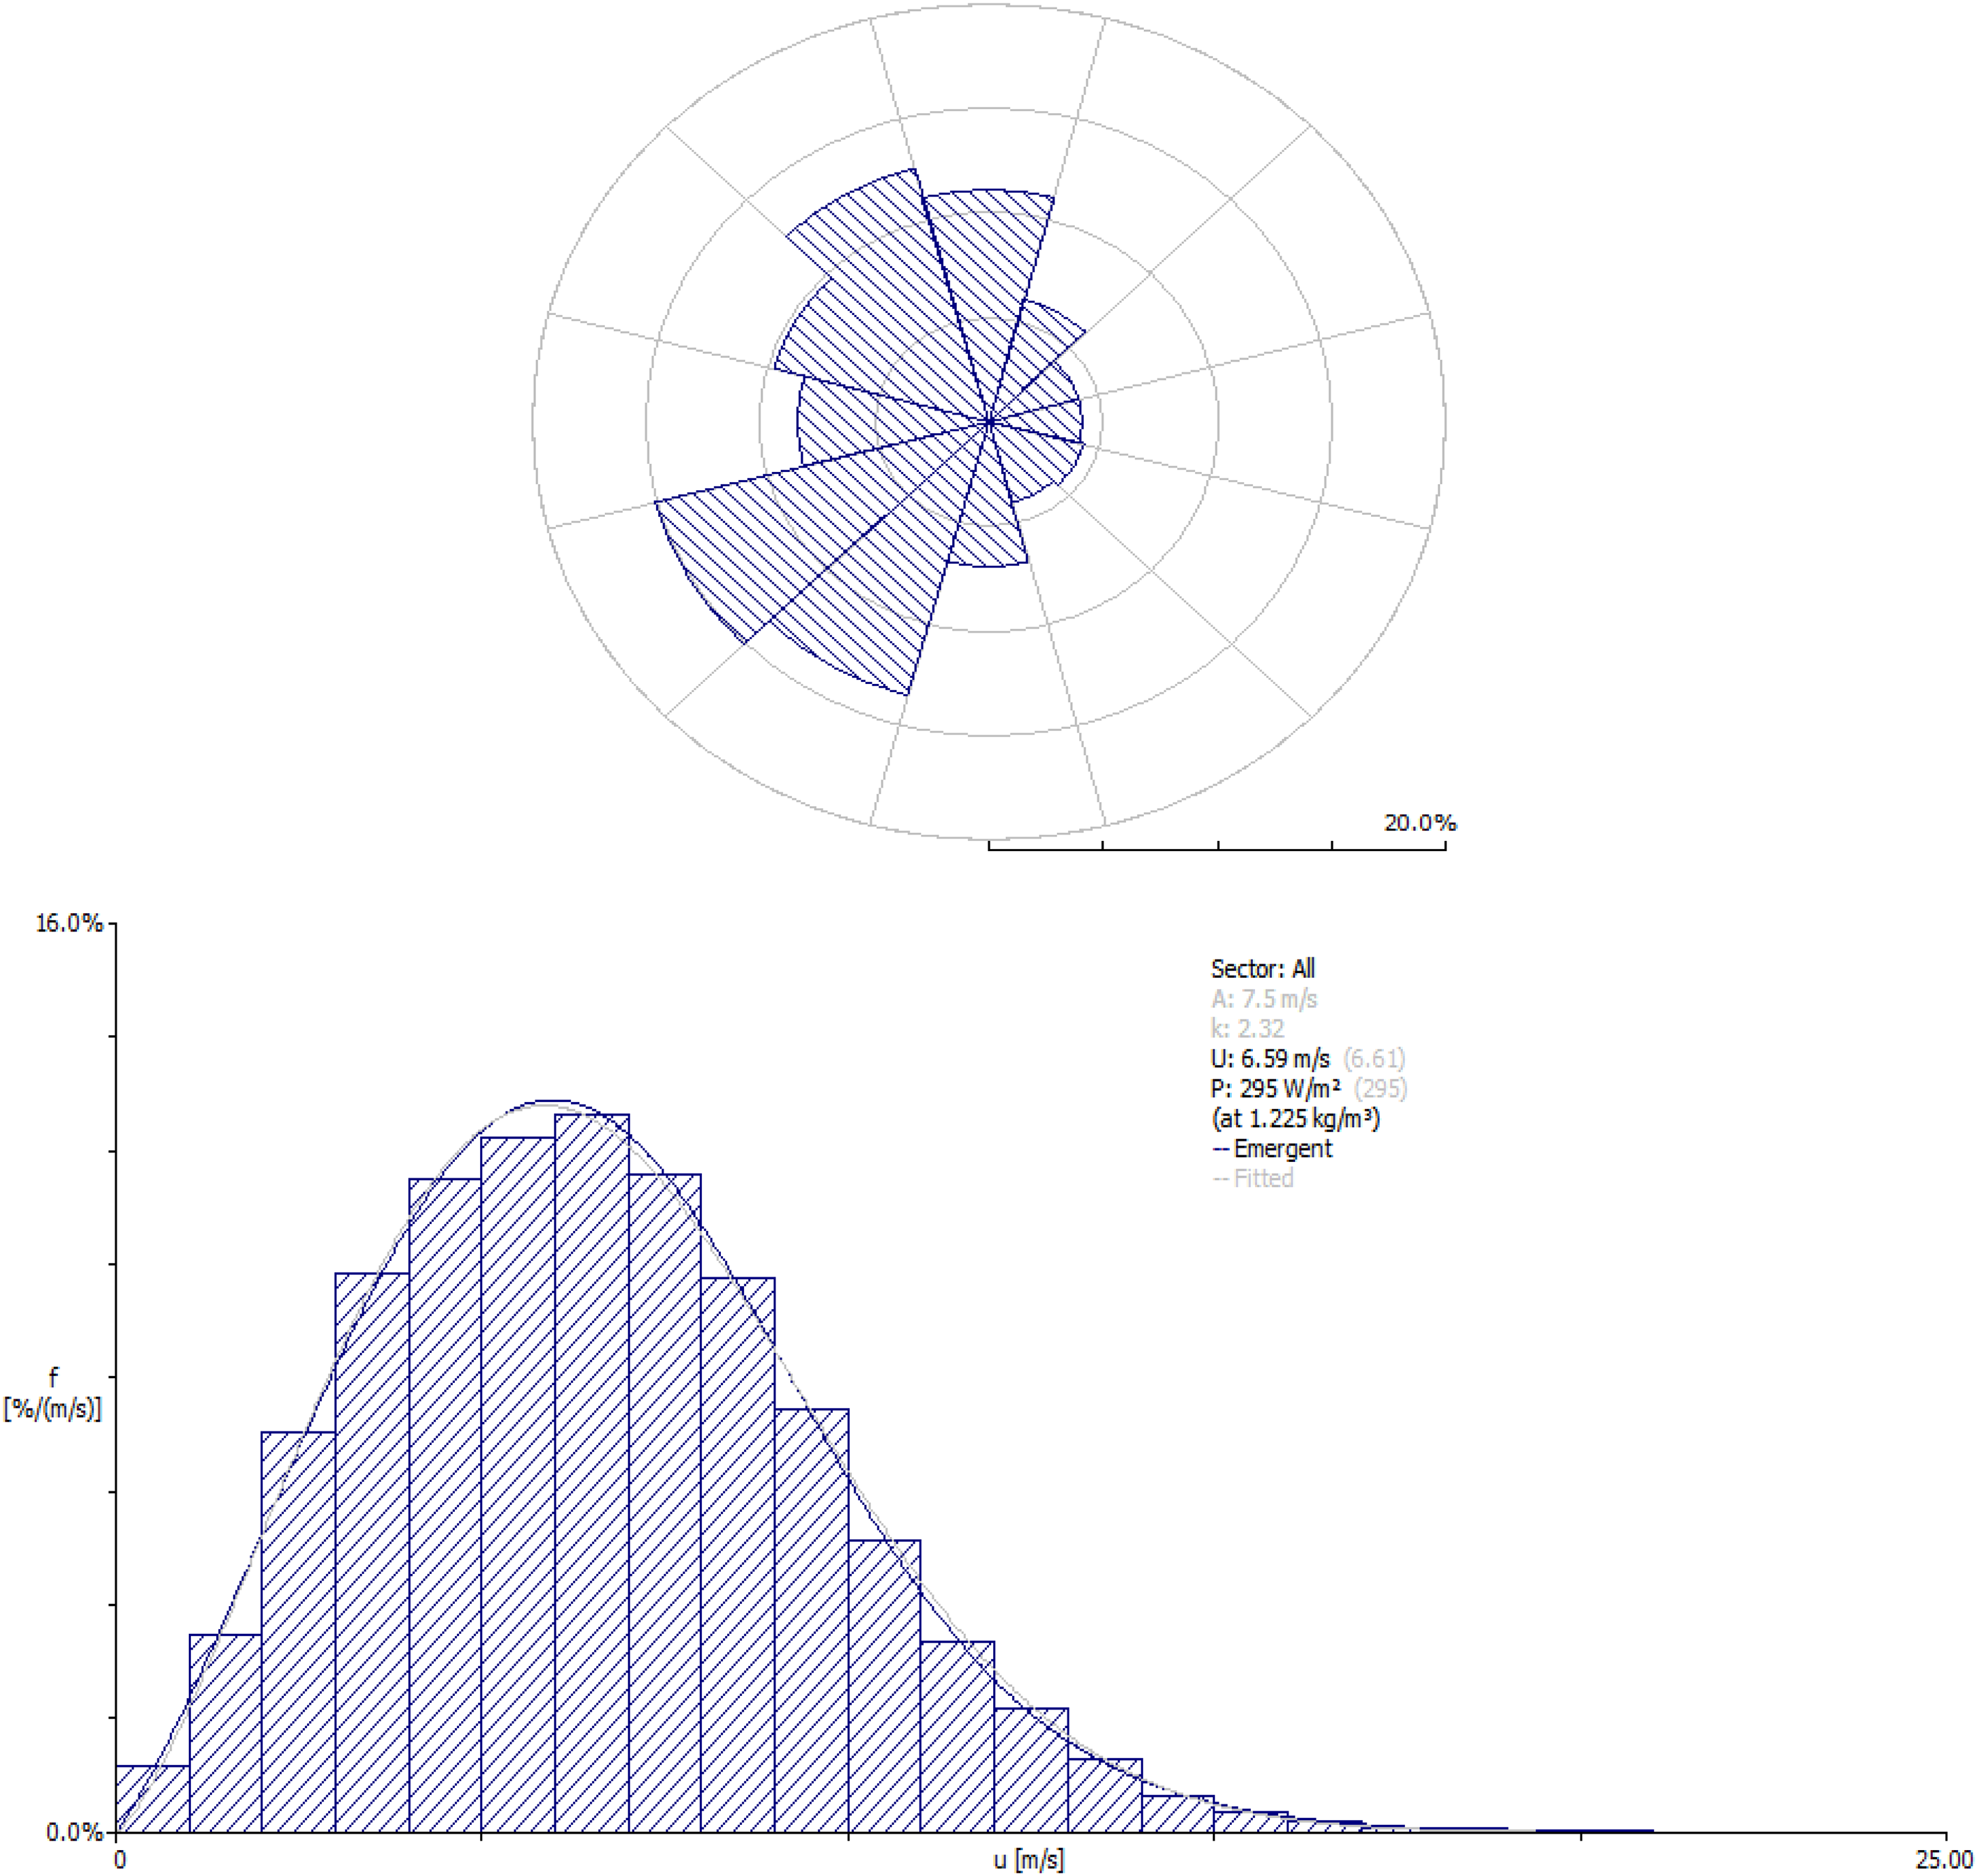
Wind rose (up) and histogram (down) of observed wind data measured on Chatham Island.
Similarly, for Waiheke Island, the OMWC is shown in Figure 6. It summarizes the sector-wise and overall observations for Waiheke Island. The most frequent mean wind speeds are experienced in sectors 8 (14.6%), 9 (16.9%), and 4 (10.1%). The corresponding sector angles and wind speeds are 5.66 m/s at 210°, 6.80 m/s at 240°, and 5.75 m/s at 90°. The prevailing winds are south-westerly. The all-sector omni-directional mean wind speed is 5.48 m/s and the power density, for this speed at 1.225 kg/m3 density is 204 W/m2. The fitted all-sector Weibull-A parameter is 6.2 m/s, while the Weibull-k parameter is 1.94. The wind resource parameters at Waiheke Island measurement station are in Wind Power Class 3 and above category suitable for utility-scale wind power projects.
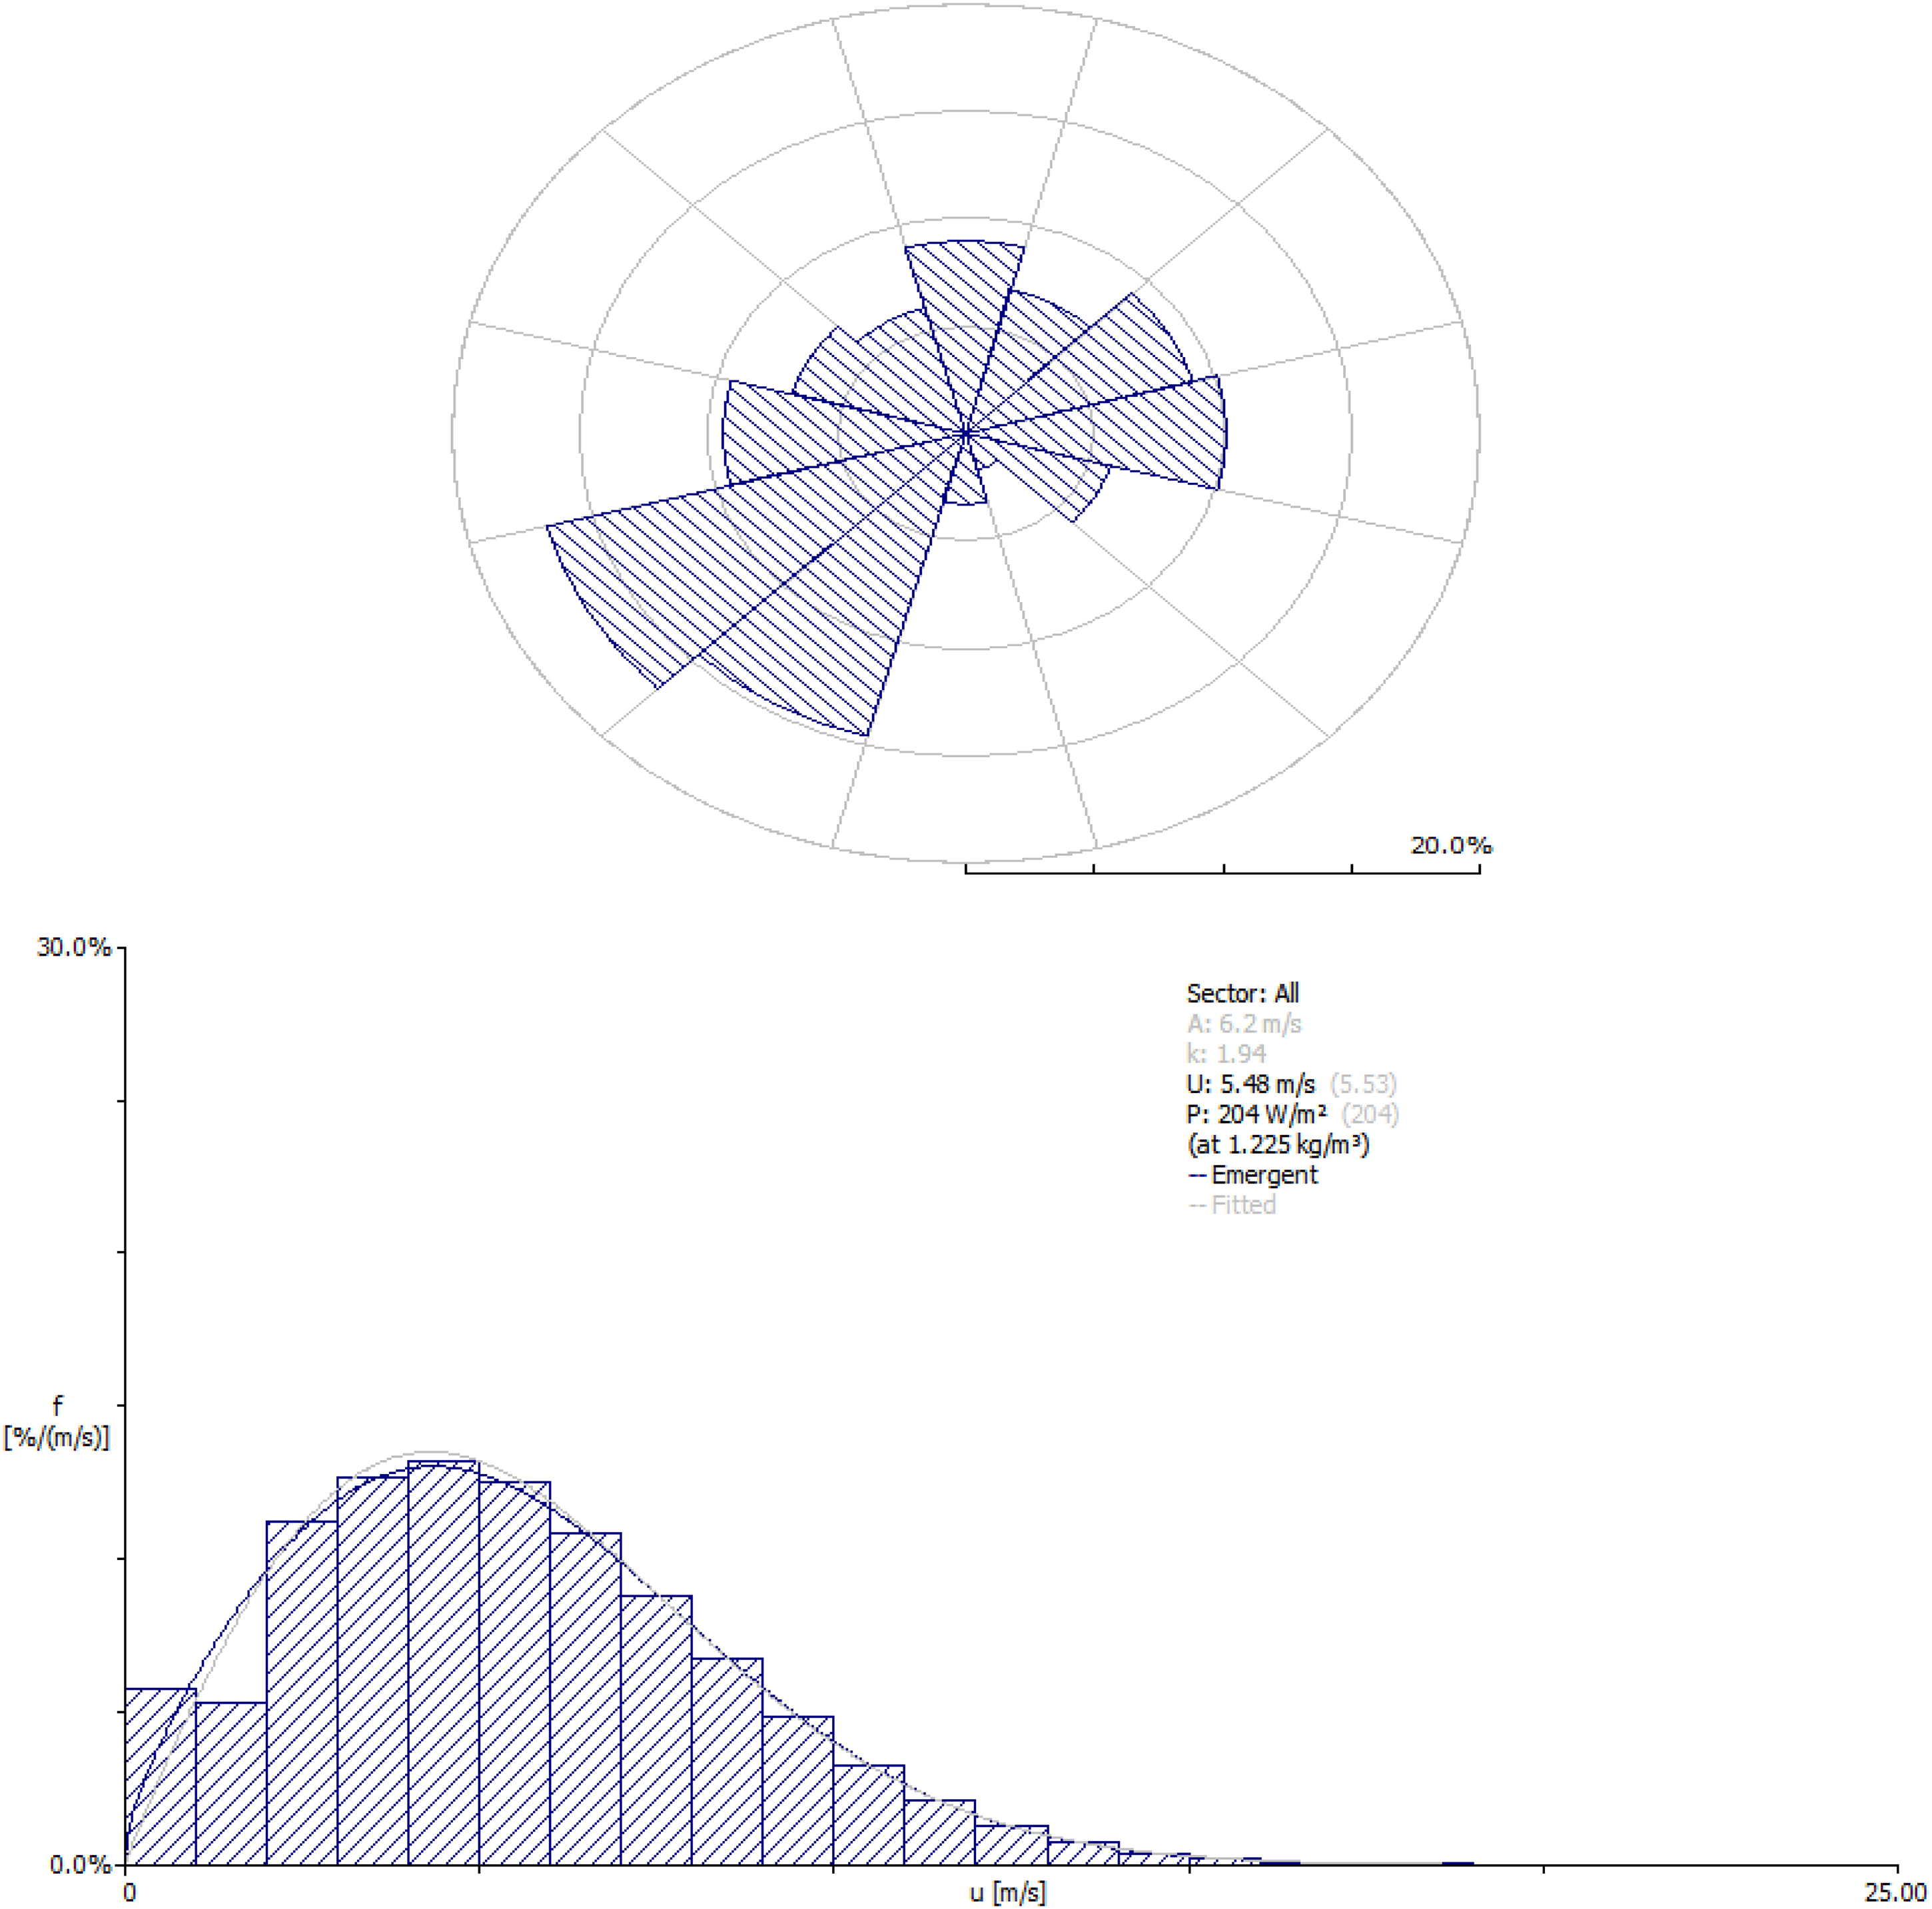
Wind rose (up) and histogram (down) of observed wind data measured on Waiheke Island.
Diurnal variation
From the omni-directional wind statistics, the hourly variation of observations for each month is analyzed. Figure 7 shows a graphical representation of the diurnal variation of measured wind speed on Chatham Island at 12 m a.g.l., which ranges between 5.9 m/s and 7.7 m/s. The pattern, for each month, is a distinct “Gaussian” with peaks between 12:00 and 14:00 h. The diurnal variation of wind speed at Chatham Island measurement station is greater than the cut-in wind speed of 3.5 m/s of the Vergnet GEV MP 30 wind turbine and thus turbines sited will always be in production throughout the day of every month and year. The pattern of the diurnal variation of wind speed is similar to potential wind farm locations within the Oceania region (Dayal et al., 2021a; Dayal et al., 2021b).
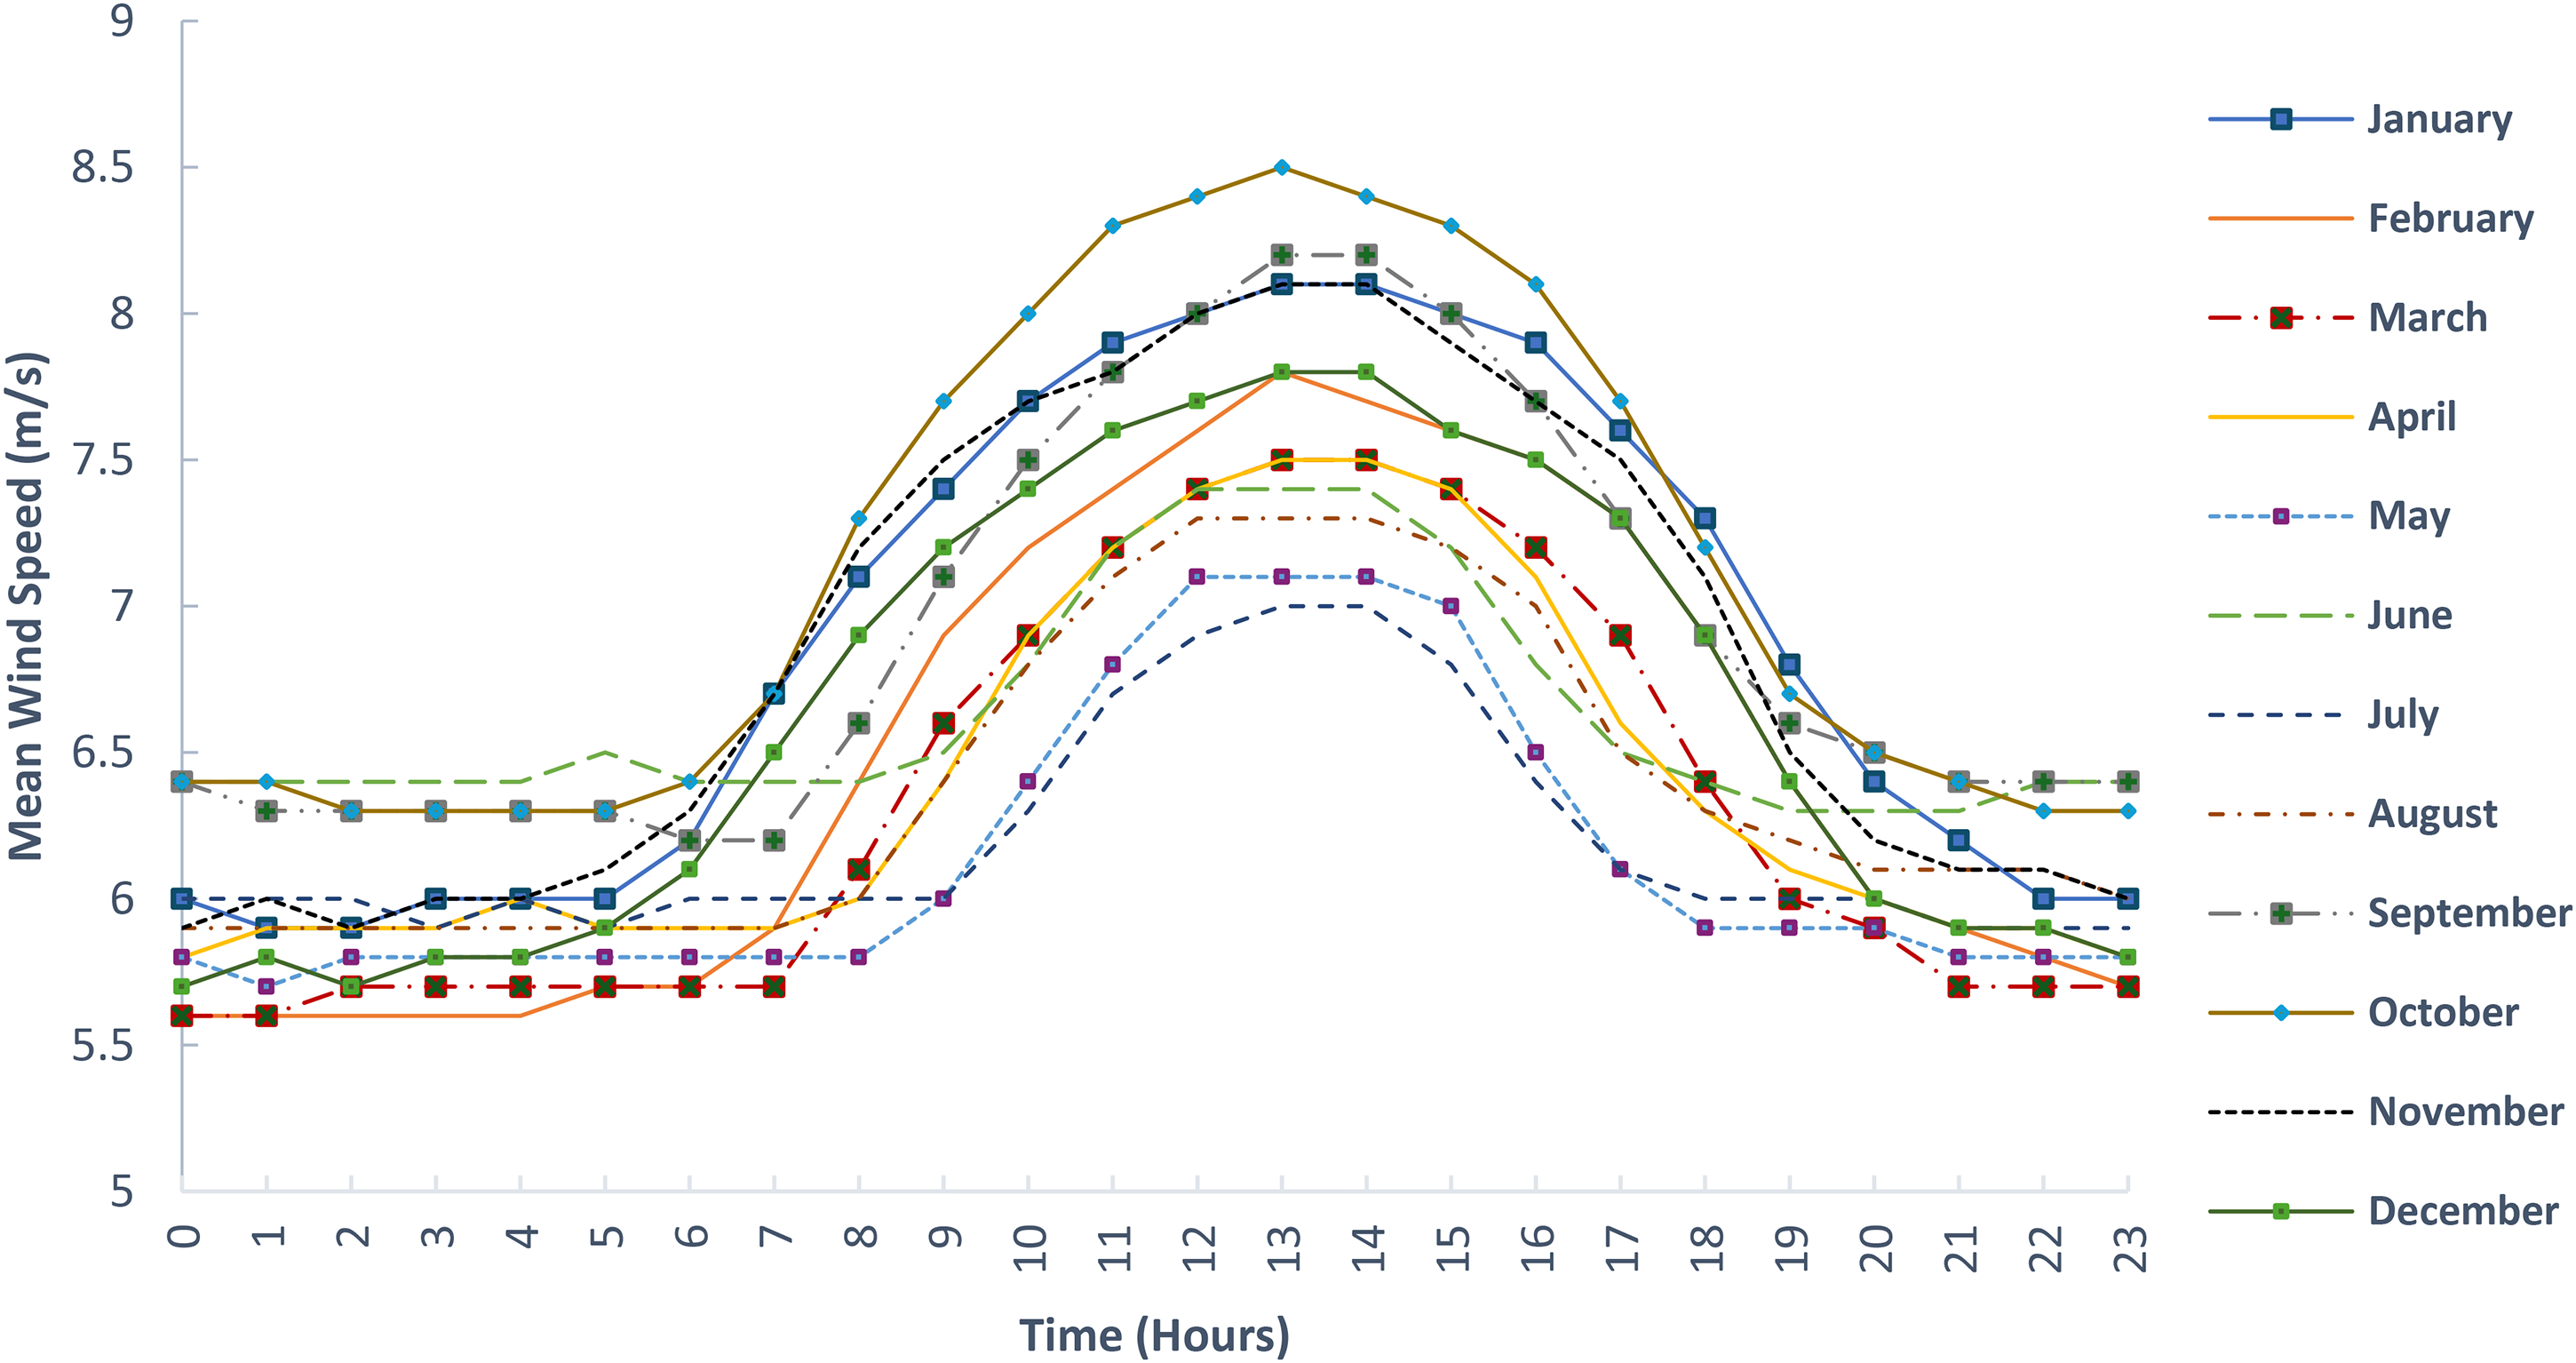
Diurnal variation of observations on Chatham Island.
The hourly variation of observations for each month on Waiheke Islands at a height of 8 m a.s.l. is shown in Figure 8. The mean wind speed ranges between 4.7 m/s and 6.6 m/s. The pattern, for each month, is distinctly “sinusoidal” with peaks between 02:00 and 06:00 h.
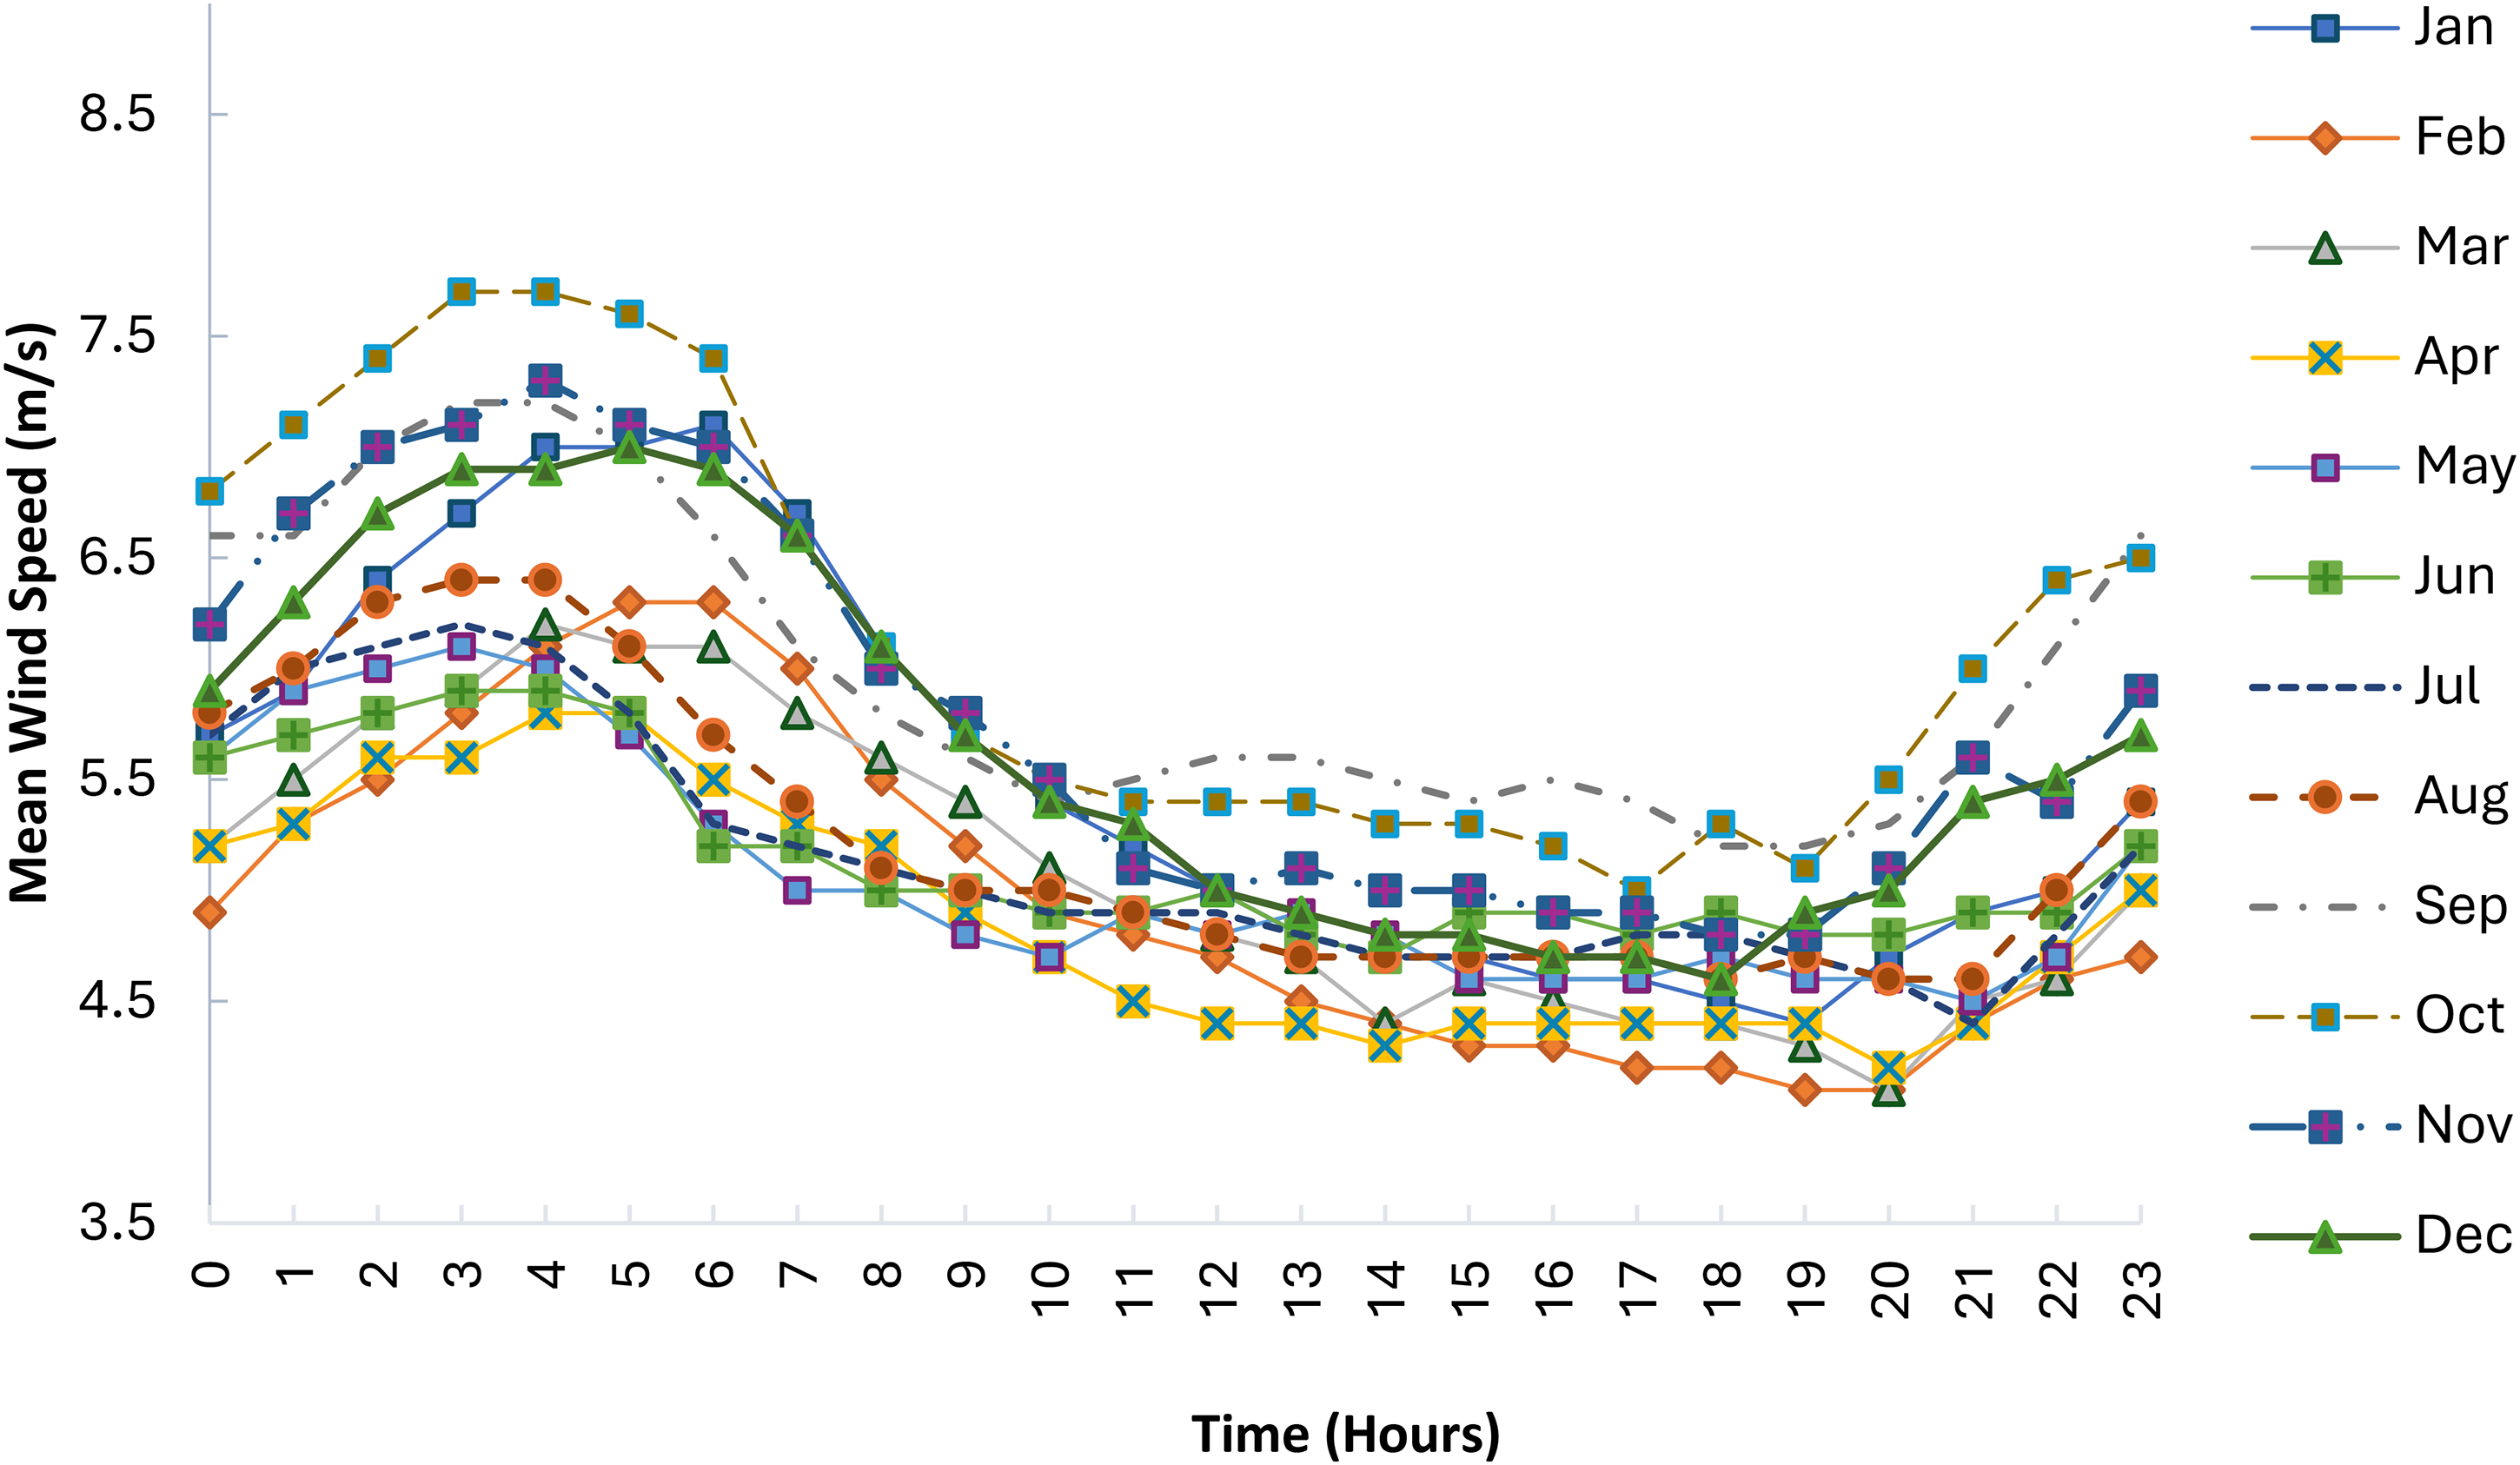
Diurnal variation of observations on Waiheke Island.
The diurnal variation of wind speed at the Waiheke Island measurement station is also greater than the cut-in wind speed of 3.5 m/s of the Siemens SWT-2.3-82 wind turbine, and thus turbines sited will always be in production throughout the day of every month and year. The pattern of the peak diurnal variation of wind speed is different from Chatham Island due to the location of the measurement station, which is very close to the sea.
Annual variation
The annual variation on Chatham Island is jagged with mean wind speed hovering (generally) around a mean of 6.6 m/s, as shown in Figure 9. The annual mean wind speed ranges from 5.7 m/s to 7.4 m/s. The annual variation of wind speed at the Chatham Island measurement station is greater than the cut-in wind speed of 3.5 m/s of the Vergnet GEV MP 30 wind turbine, and thus turbines sited will always be in production throughout every month of every year except in 2016 for two months.
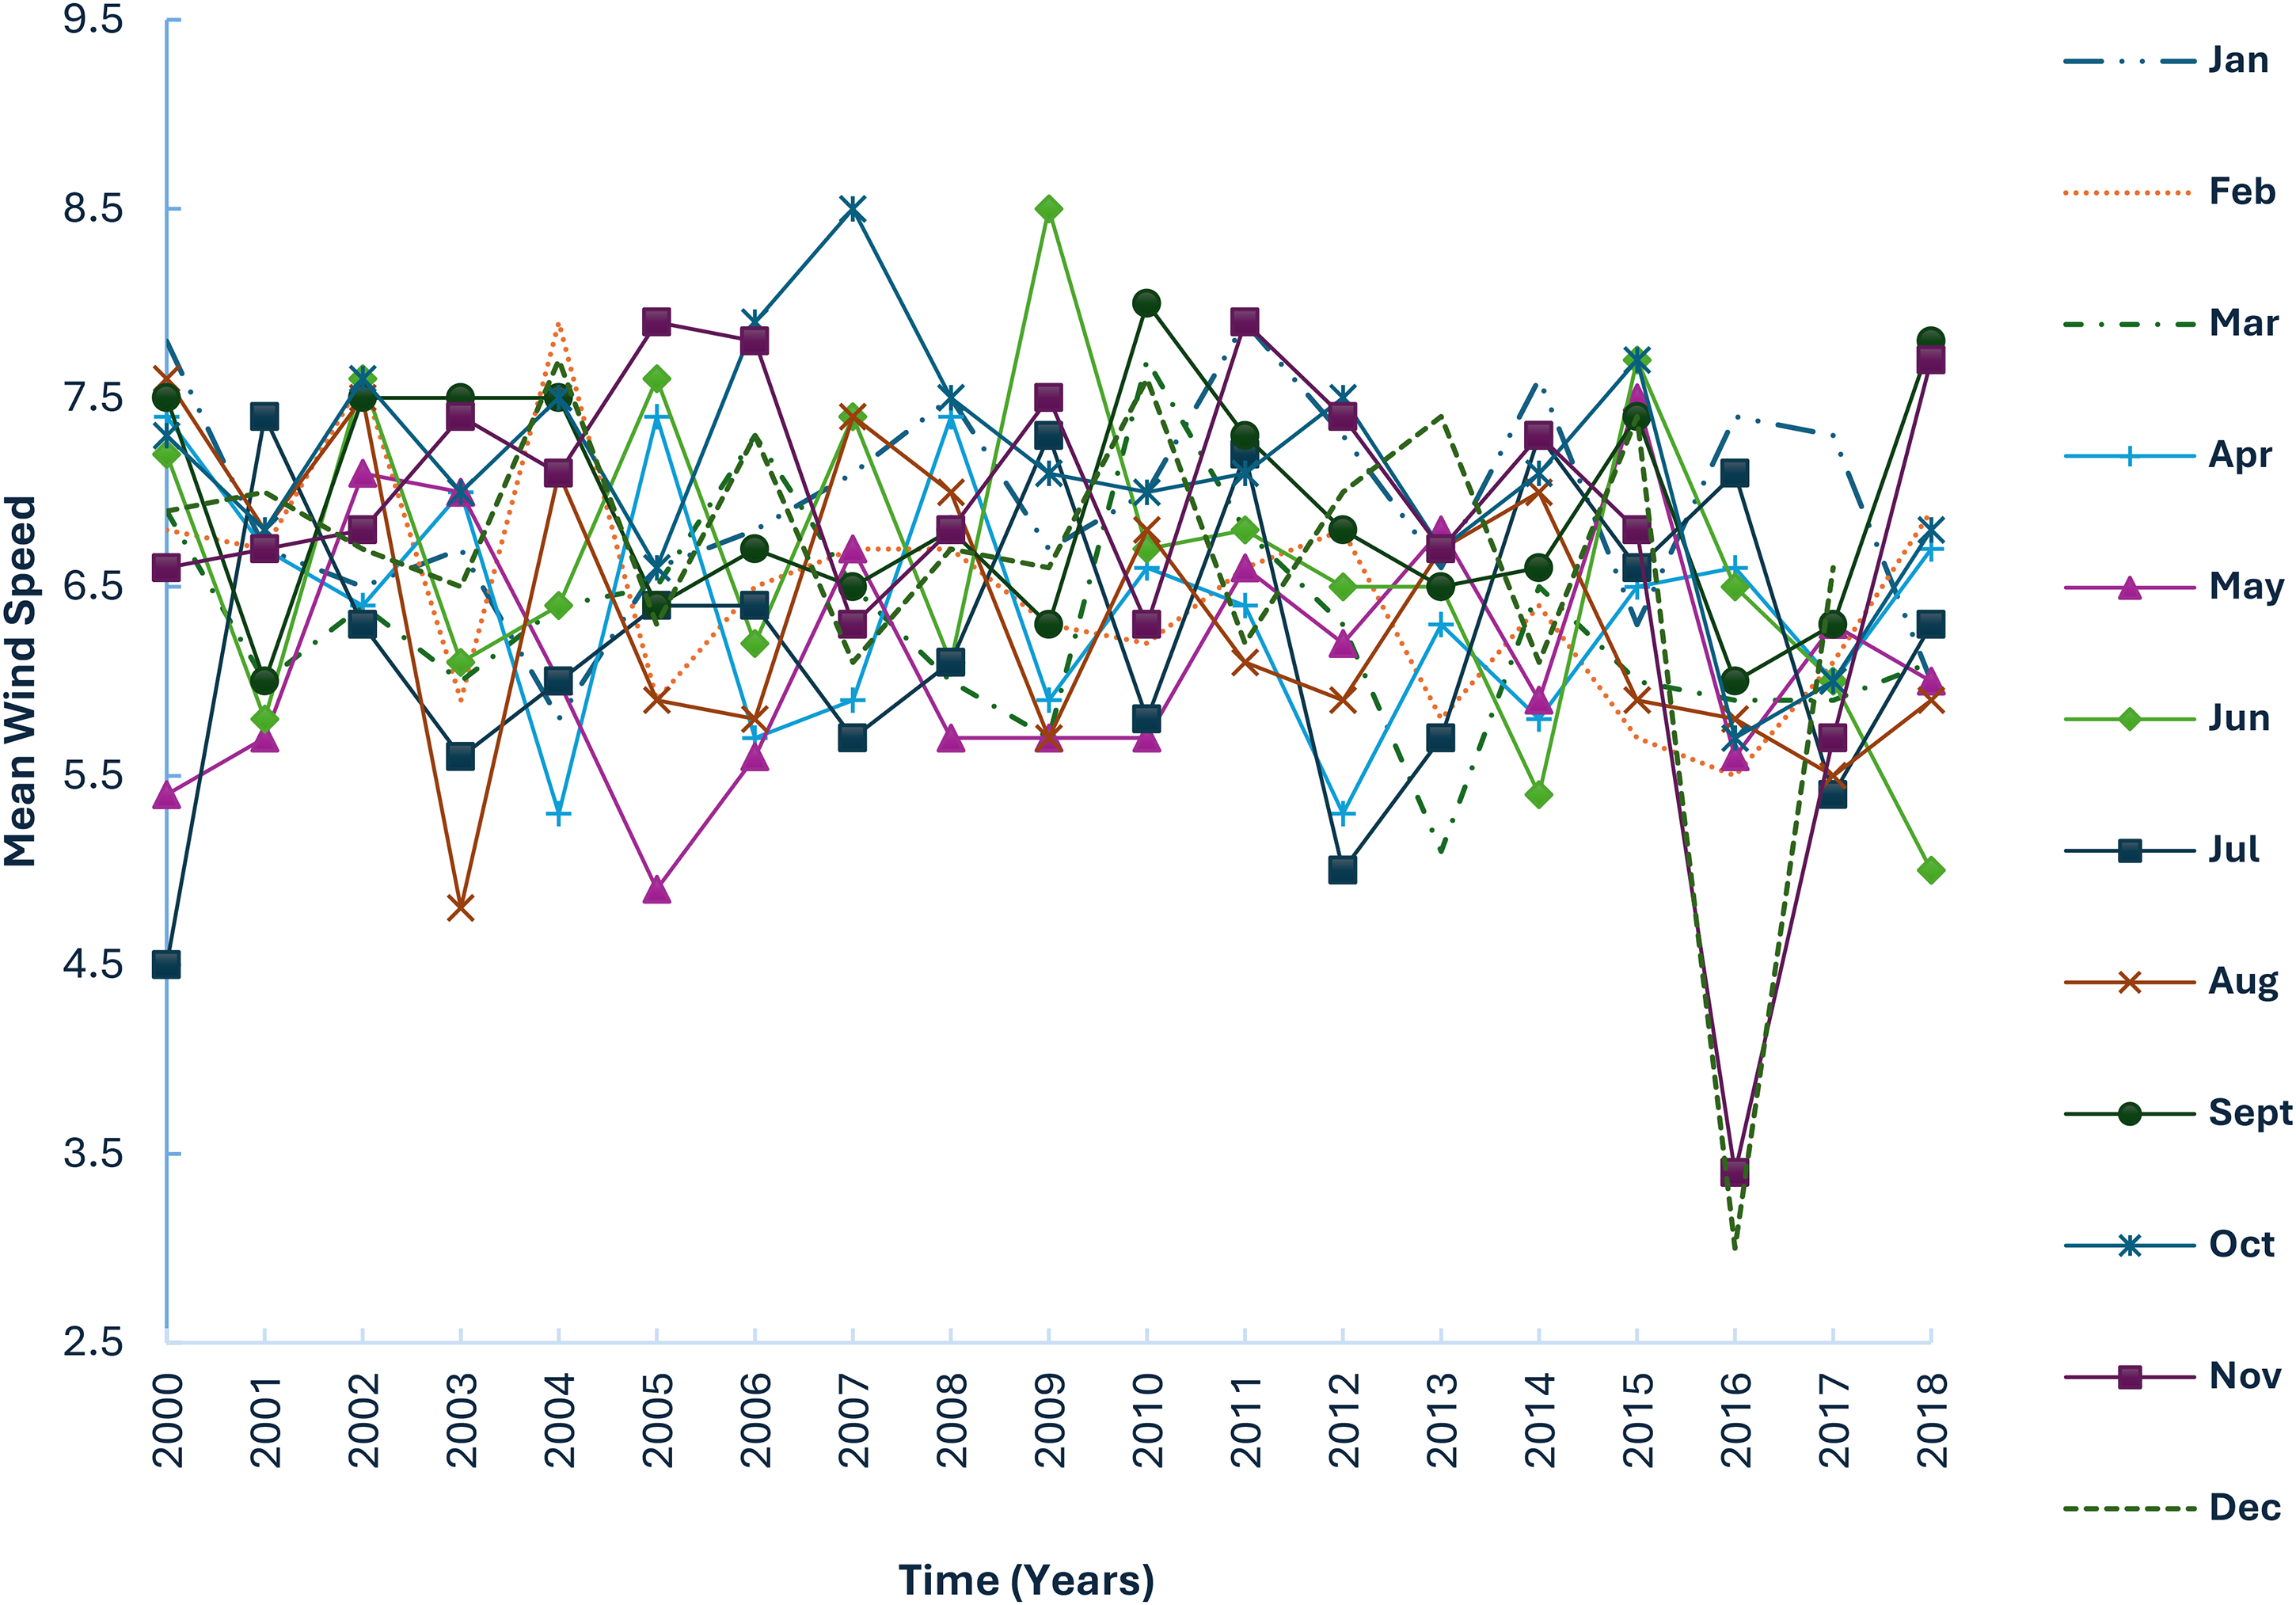
Annual variation of observations on Chatham Island.
Waiheke Island's variation is similarly jagged with mean wind speed hovering around a mean of 5.3 m/s as shown in Figure 10. The mean wind speeds range from 4.9 m/s to 6.8 m/s. Seasonal variation over each year shows that spring and summer experience higher mean wind speeds. The annual variation of wind speed at the Waiheke Island measurement station is greater than the cut-in wind speed of 3.5 m/s of the Siemens SWT-2.3-82 wind turbine, and thus turbines sited will always be in production throughout every month of every year.
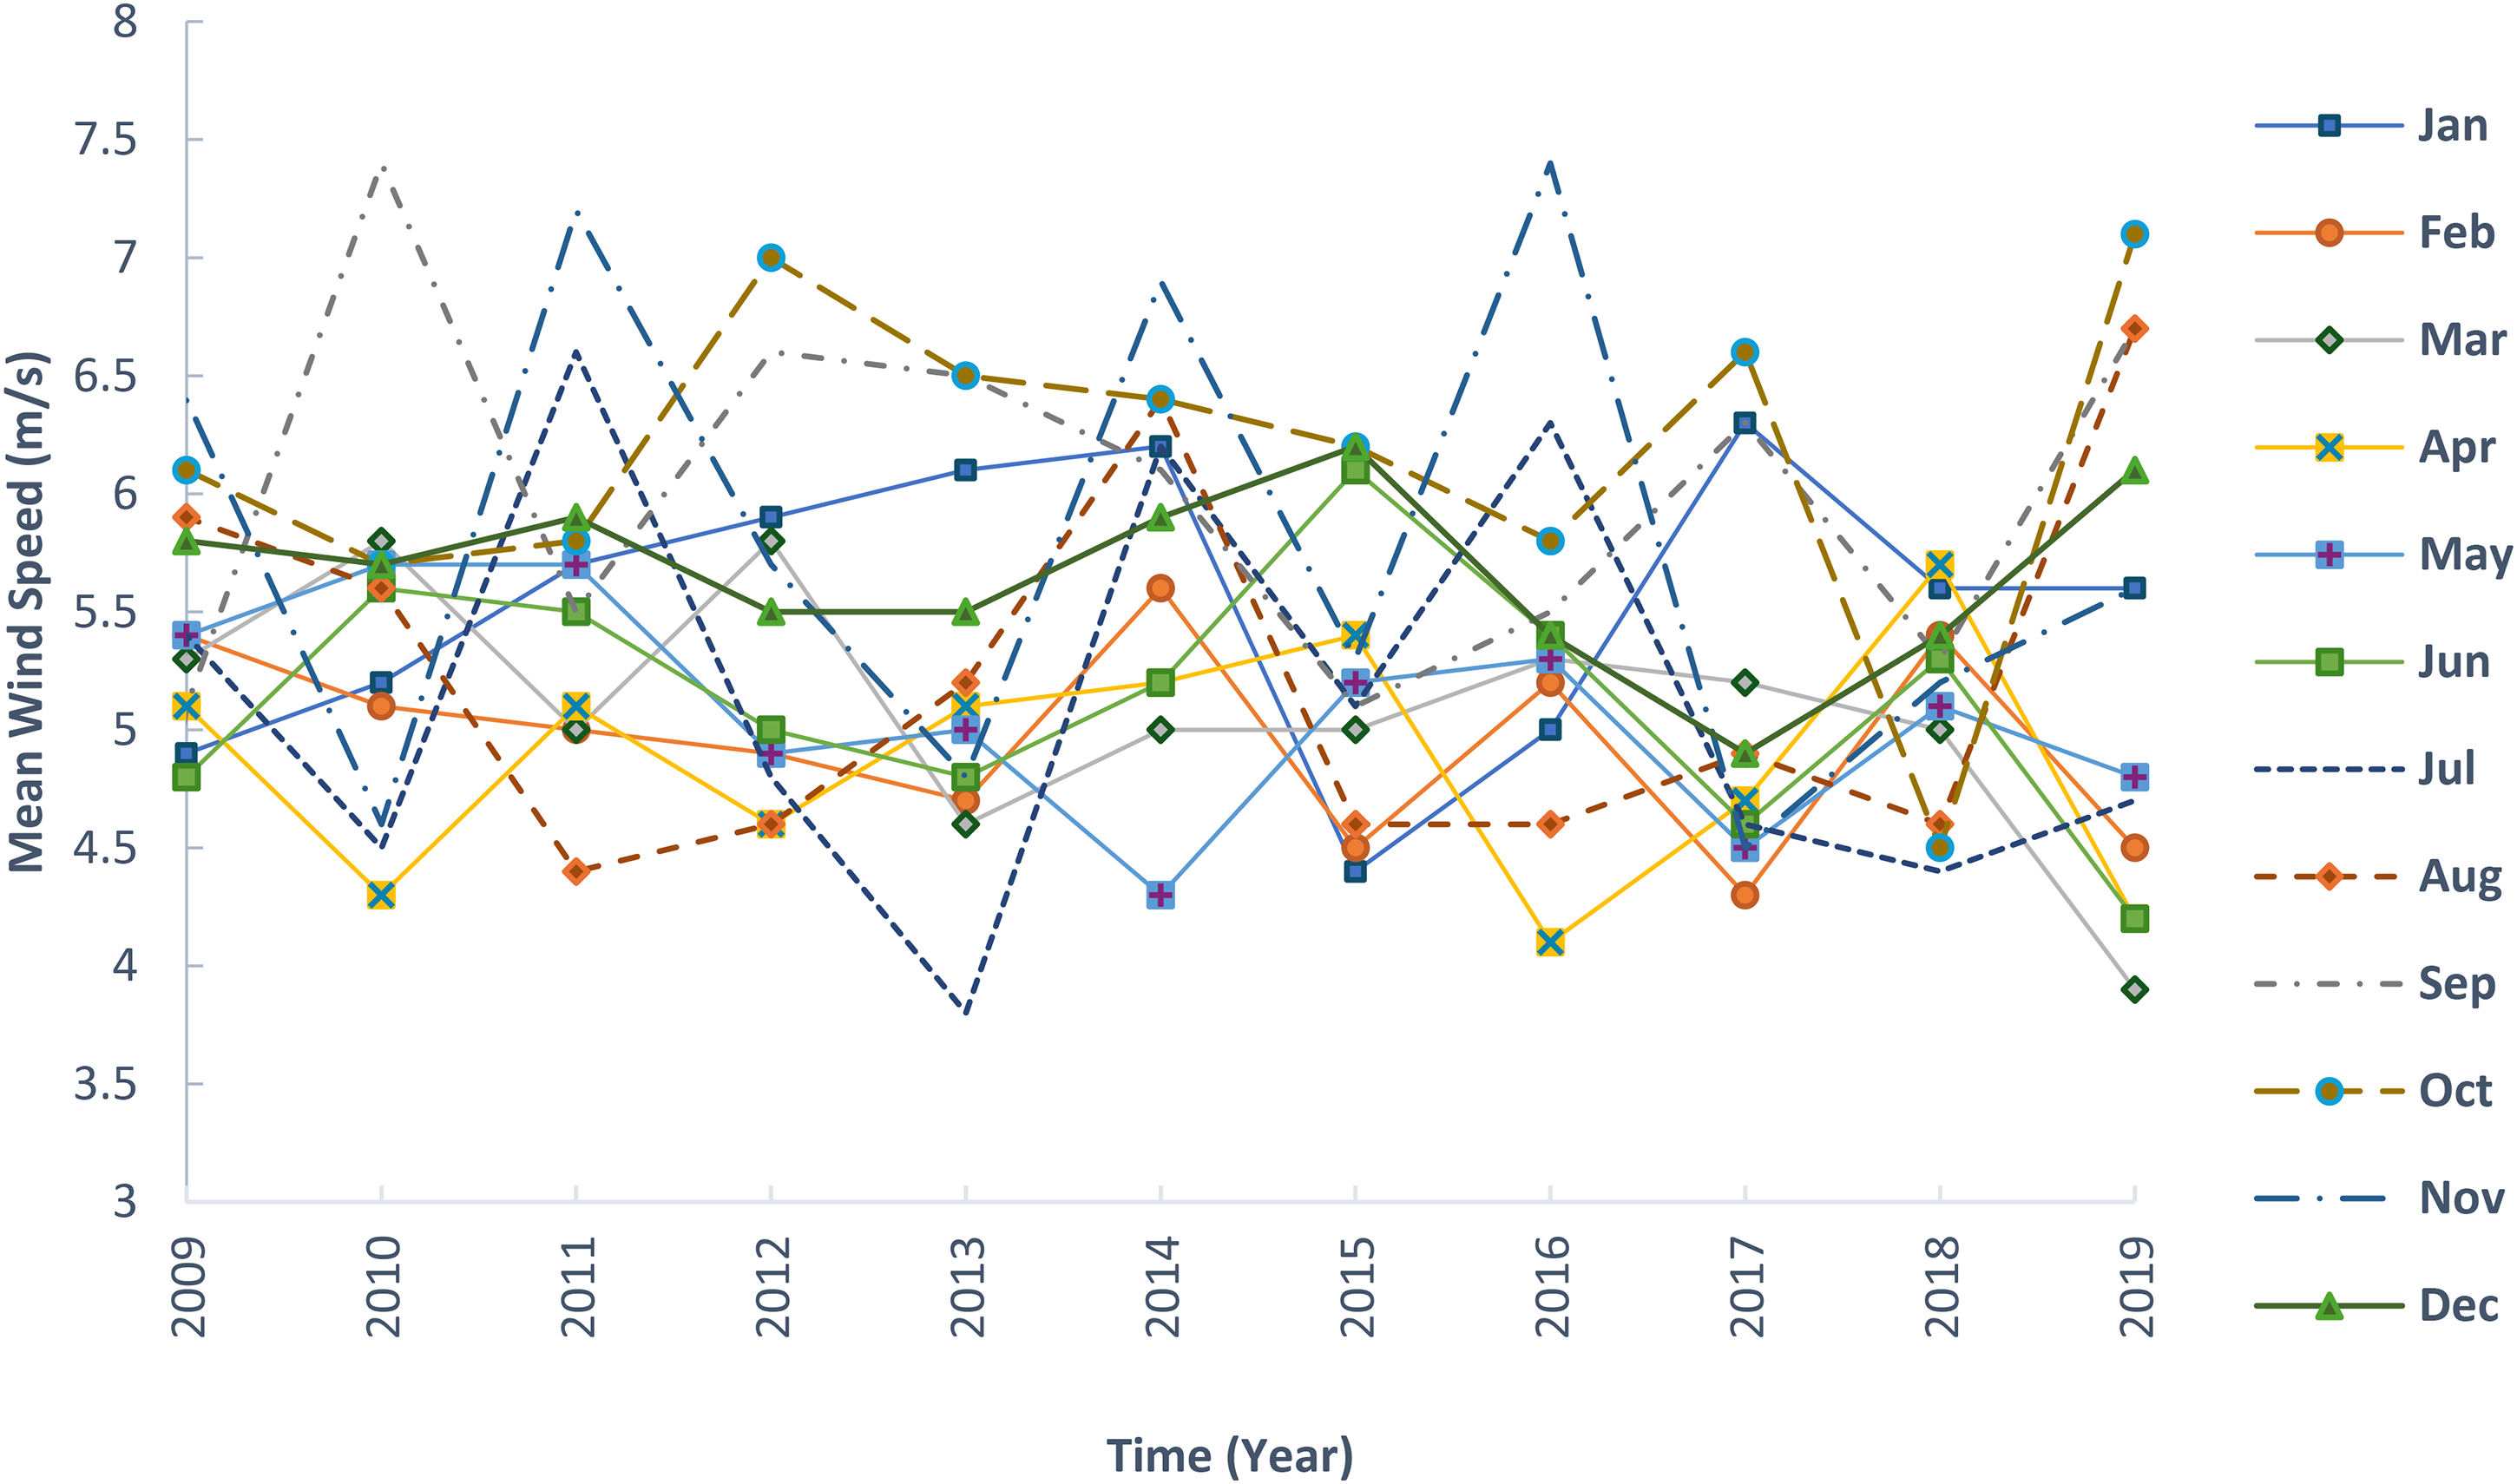
Annual variation of observations on Waiheke Island.
Spatial variation
The spatial variation of the wind resource on Chatham and Waiheke Islands is presented in 2-D contour maps at horizontal resolutions of 125 m × 125 m and 60 m × 60 m, respectively. The maps depict changes in mean wind speed, annual energy production (AEP), and the power density as calculated in the resource grids at selected wind turbine hub heights of 55 m and 80 m, respectively.
Mean wind speed
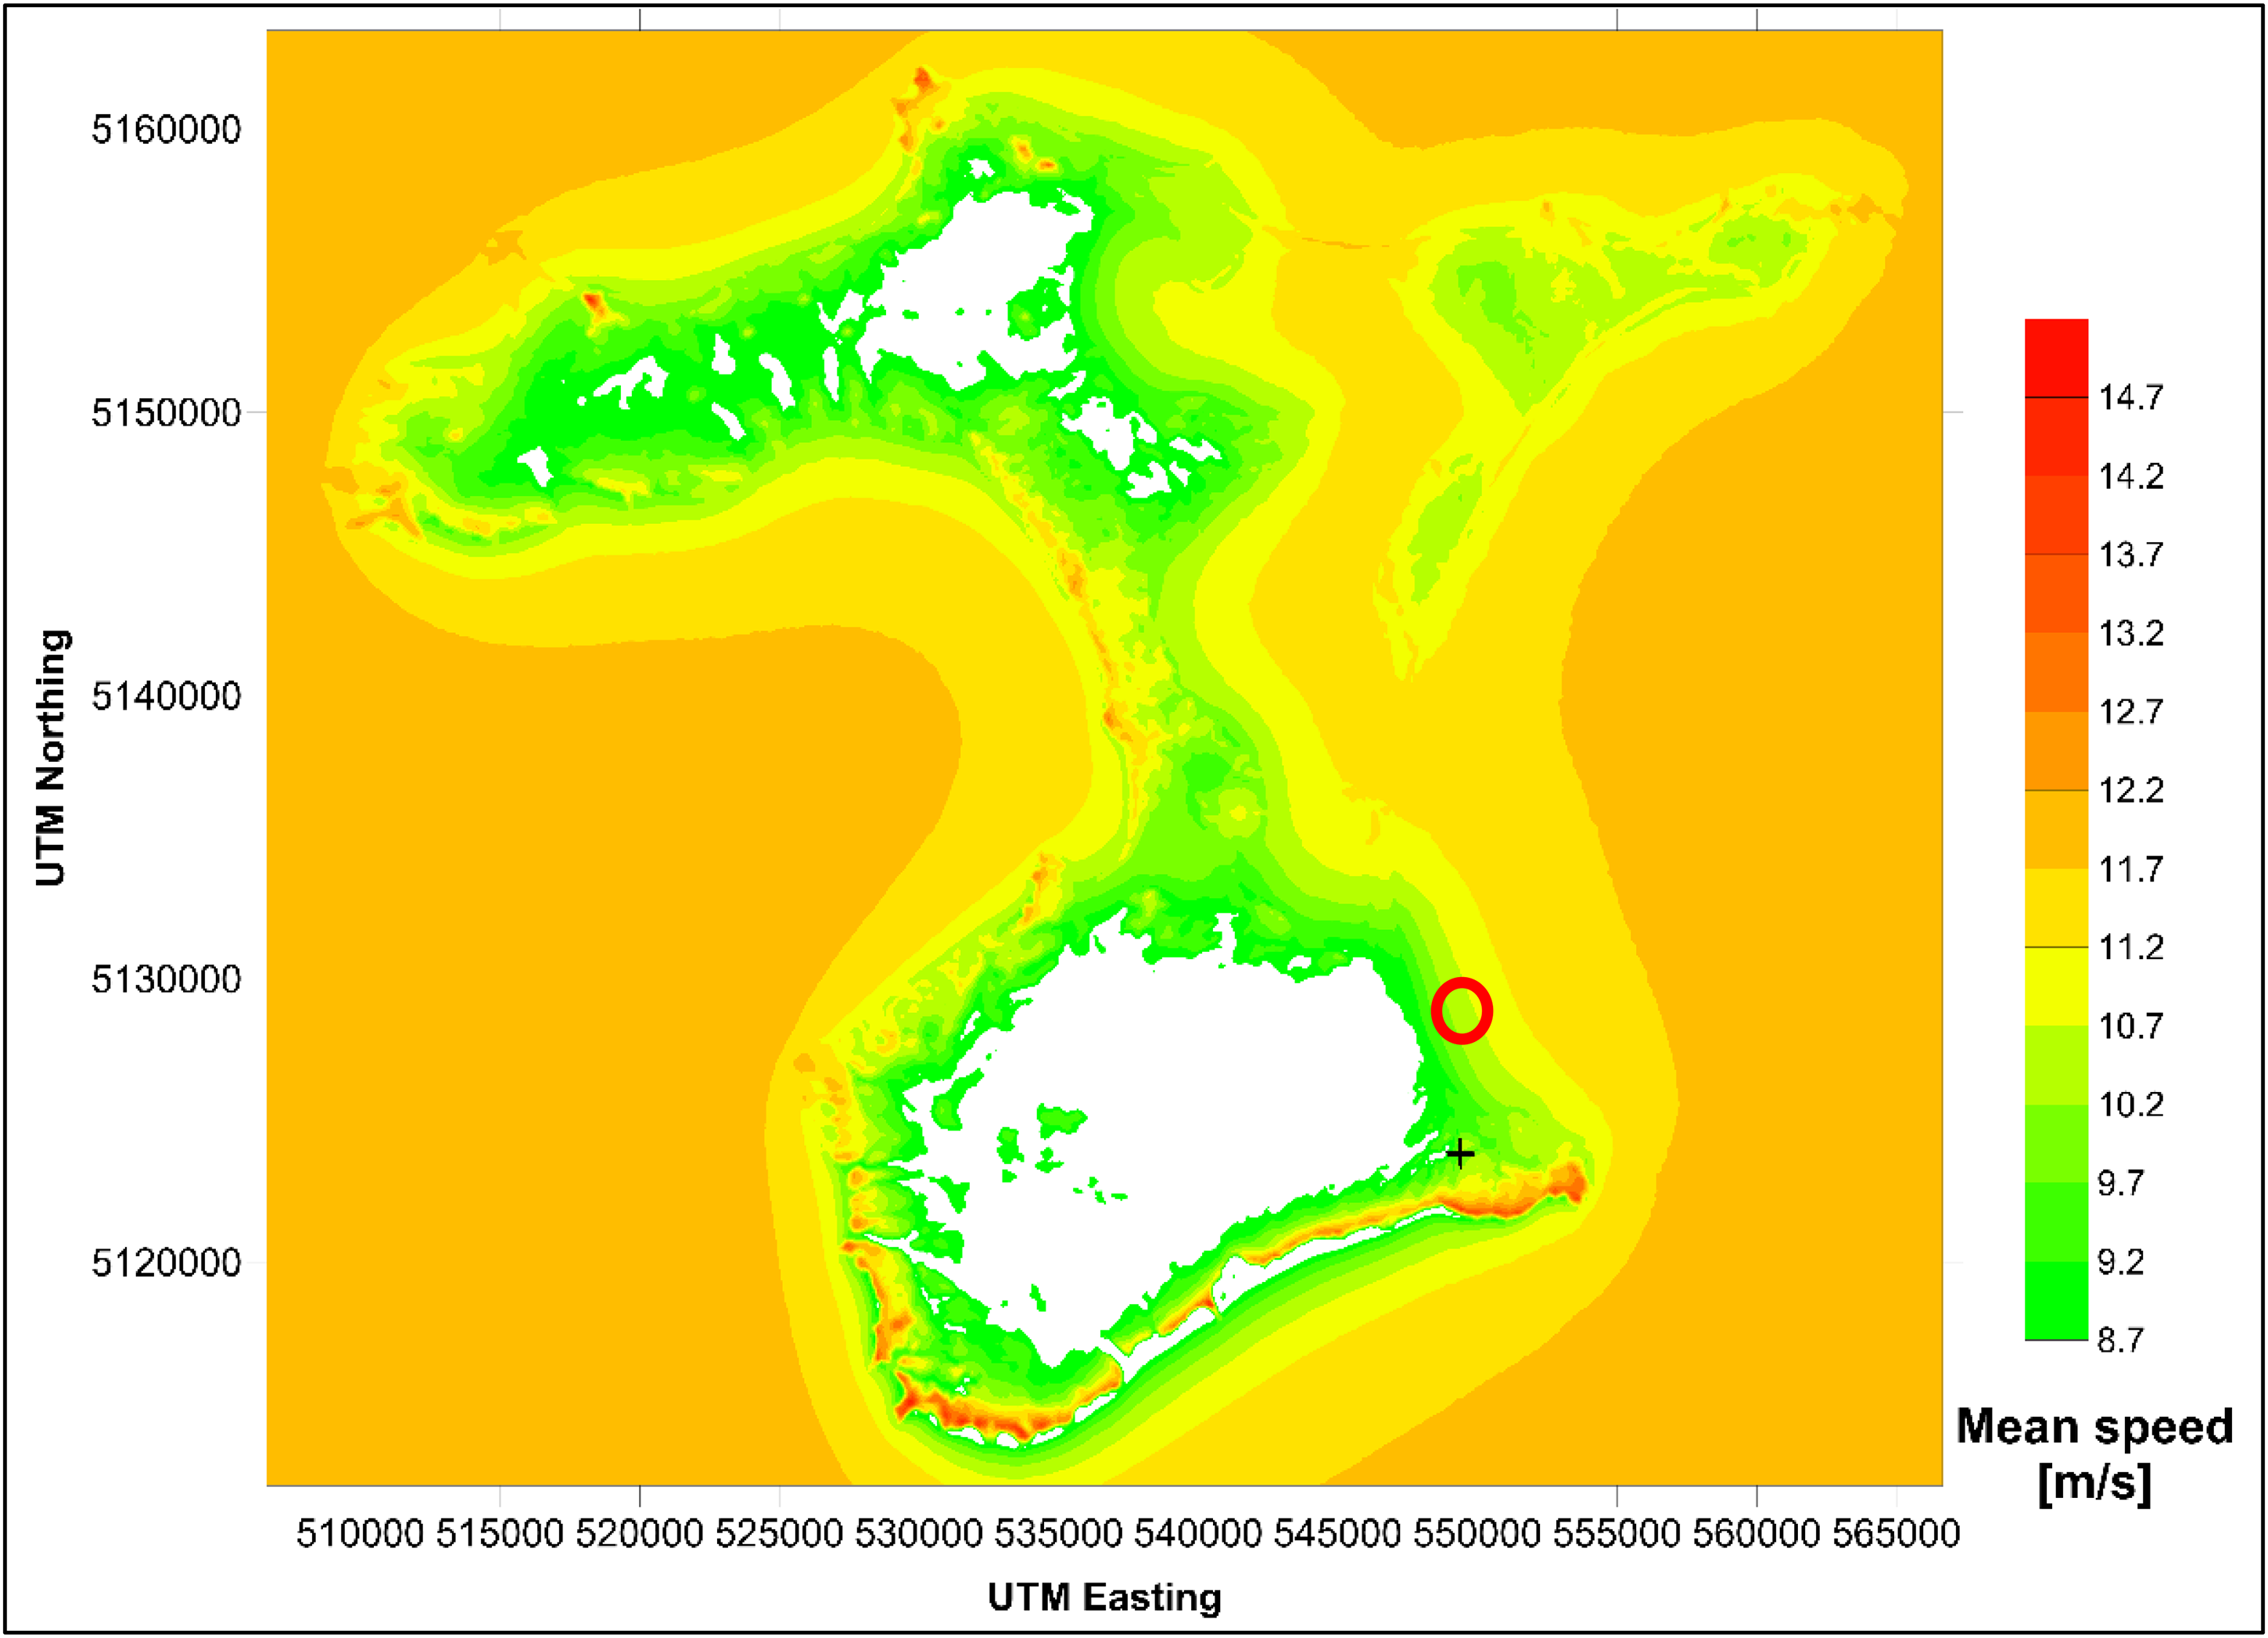
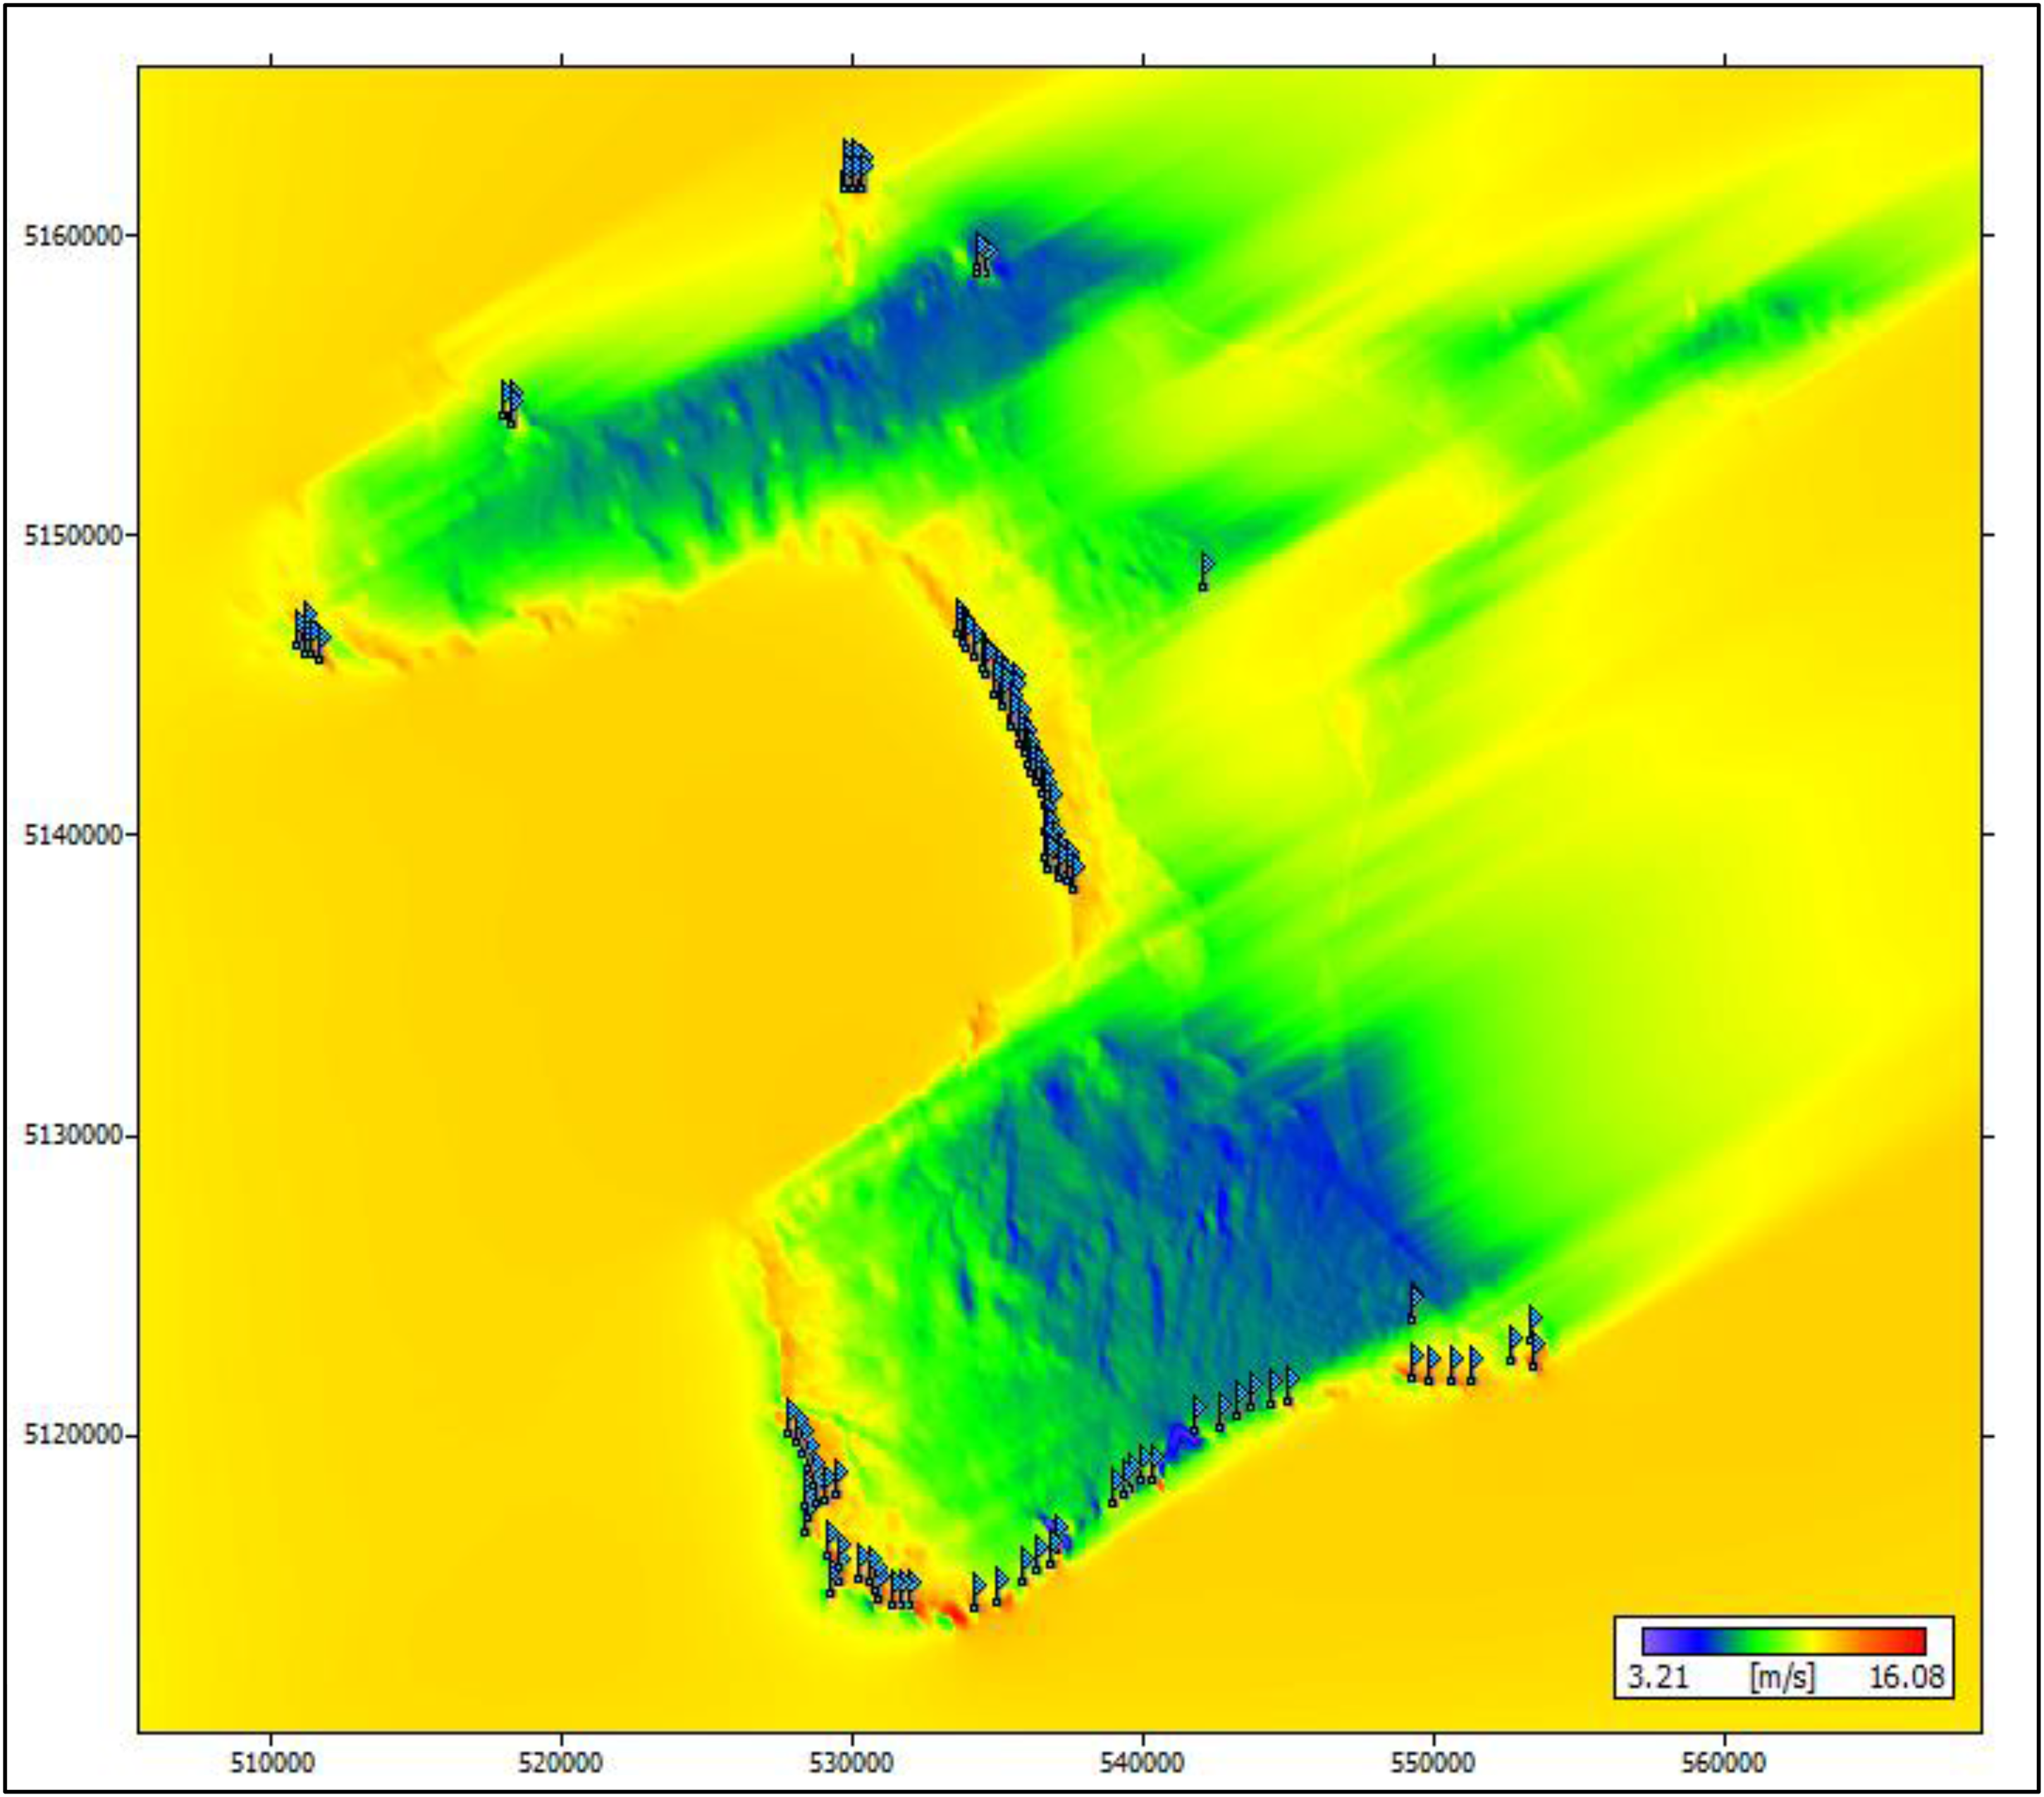
The mean wind speed on Chatham Island ranges from 4.8 m/s to 14.80 m/s, as shown in Figure 11. A significant fraction of the landmass has wind speeds above 8 m/s. Over the entire island, the mean wind speed is 11.08 m/s. The minimum mean wind speed is 4.88 m/s and occurs at (536771, 5116985). The maximum mean wind speed is 14.80 m/s and occurs at (529646, 5115110). The spatial variation of minimum, maximum, and mean wind speeds across Chatham Island is greater than the cut-in wind speed of 3.5 m/s of the Vergnet GEV MP 30 and other wind turbines, and thus turbines sited anywhere across Chatham Island will always be in production.
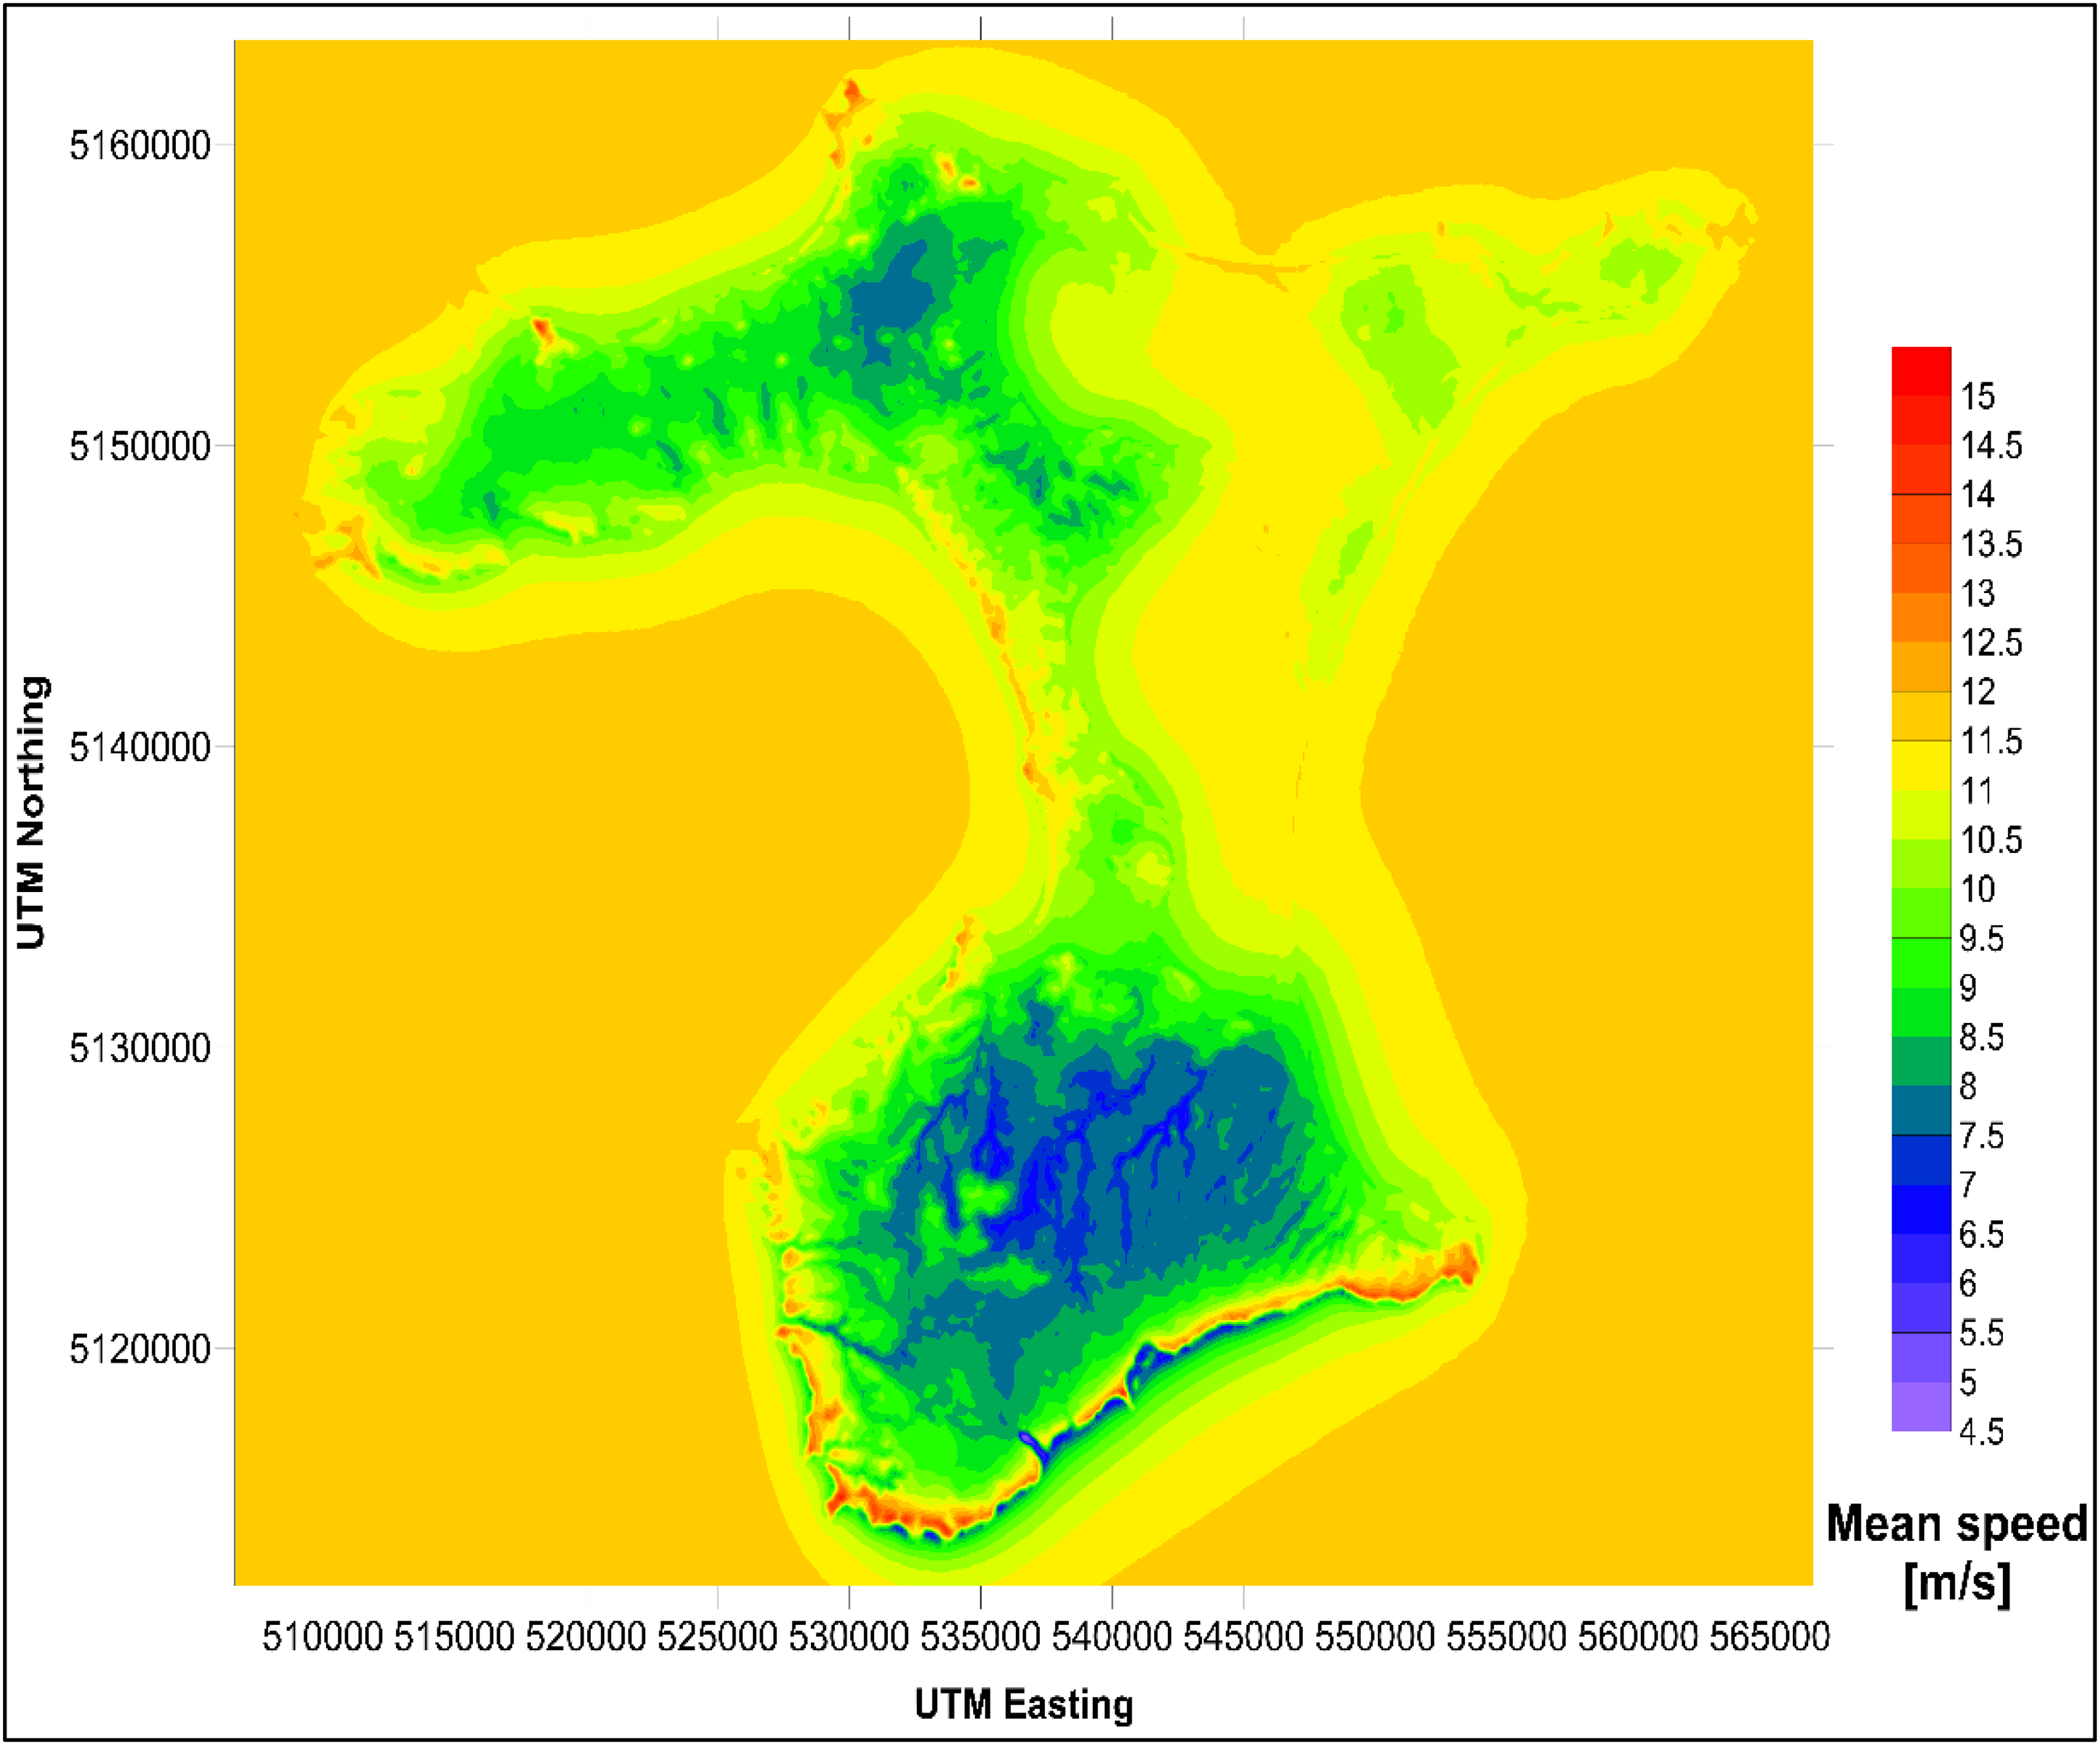
Contour map of mean wind speed variation over Chatham Island.
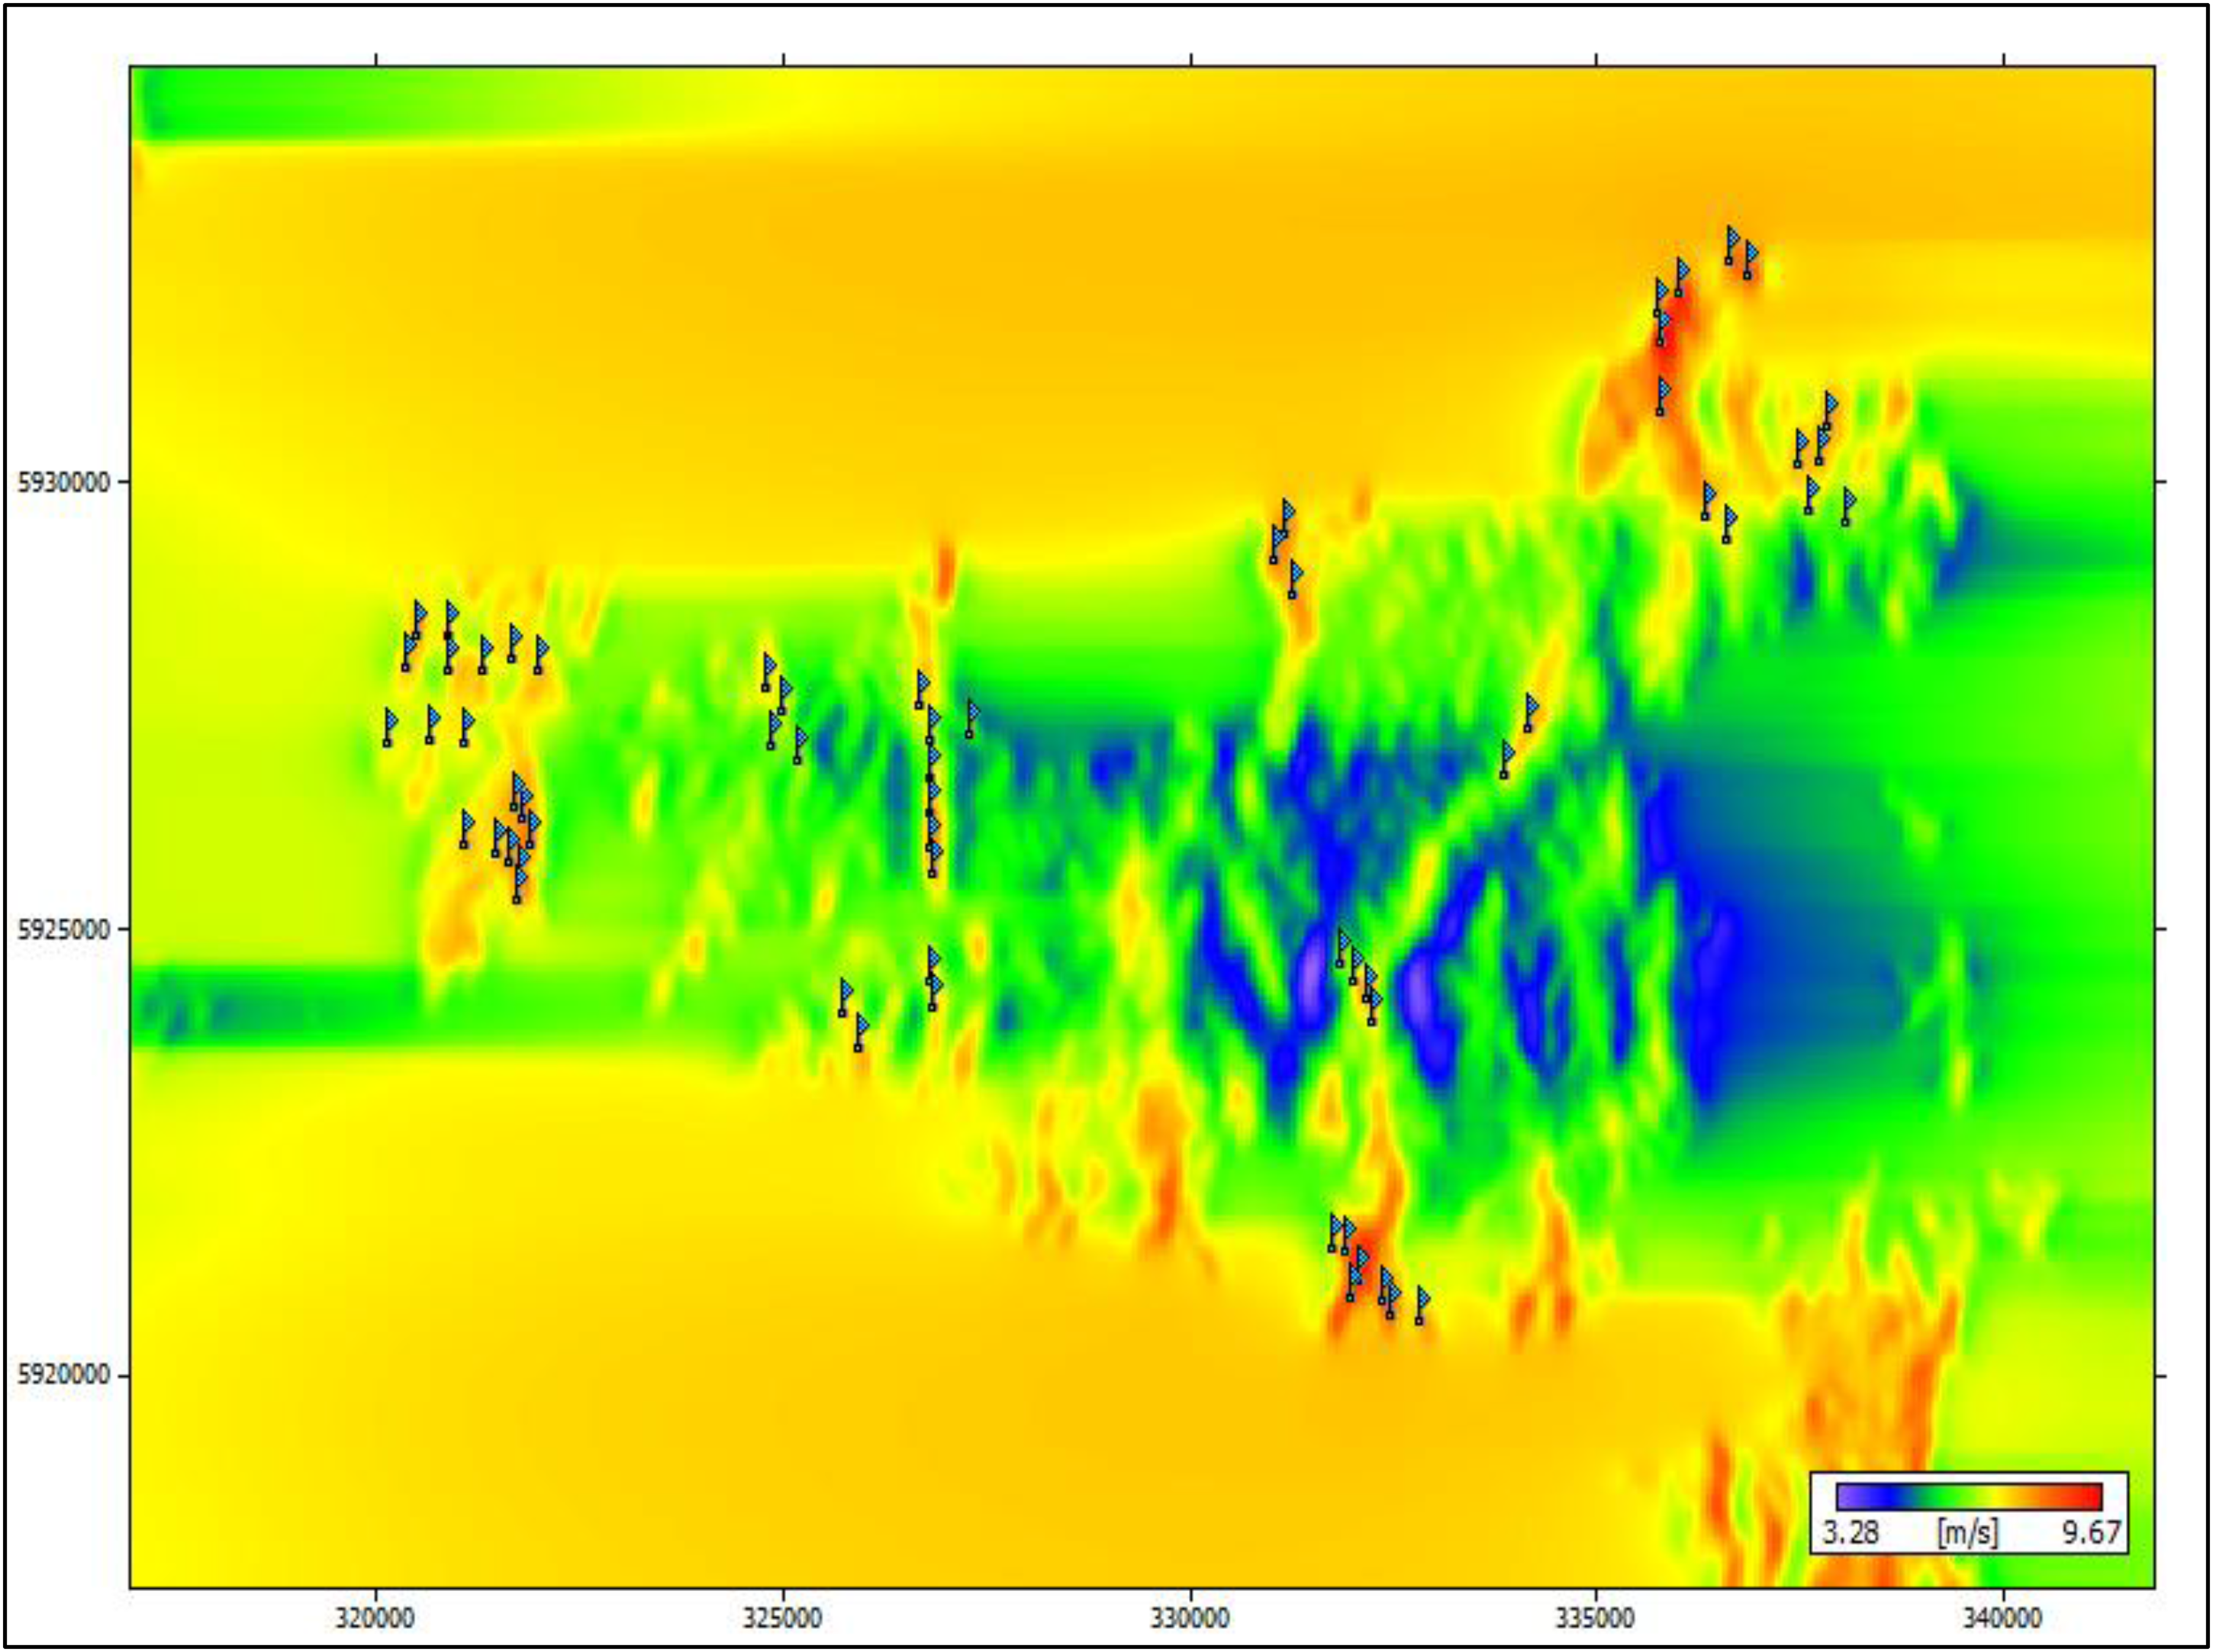
The mean wind speed on Waiheke Island ranges from 5.3 m/s to 8.99 m/s, as shown in Figure 12. Wind speed over 8 m/s is sparsely distributed across the island. Over the entire island, the mean wind speed is 7.14 m/s. The minimum mean wind speed is 5.30 m/s and occurs at (332867, 5923972). The maximum mean wind speed is 8.99 m/s and occurs at (332167, 5924322). The spatial variation of minimum, maximum, and mean wind speed across Waiheke Island is greater than the cut-in wind speed of 3.5 m/s of the Siemens SWT-2.3-82 and other wind turbines, and thus turbines sited anywhere across Waiheke Island will always be in production.
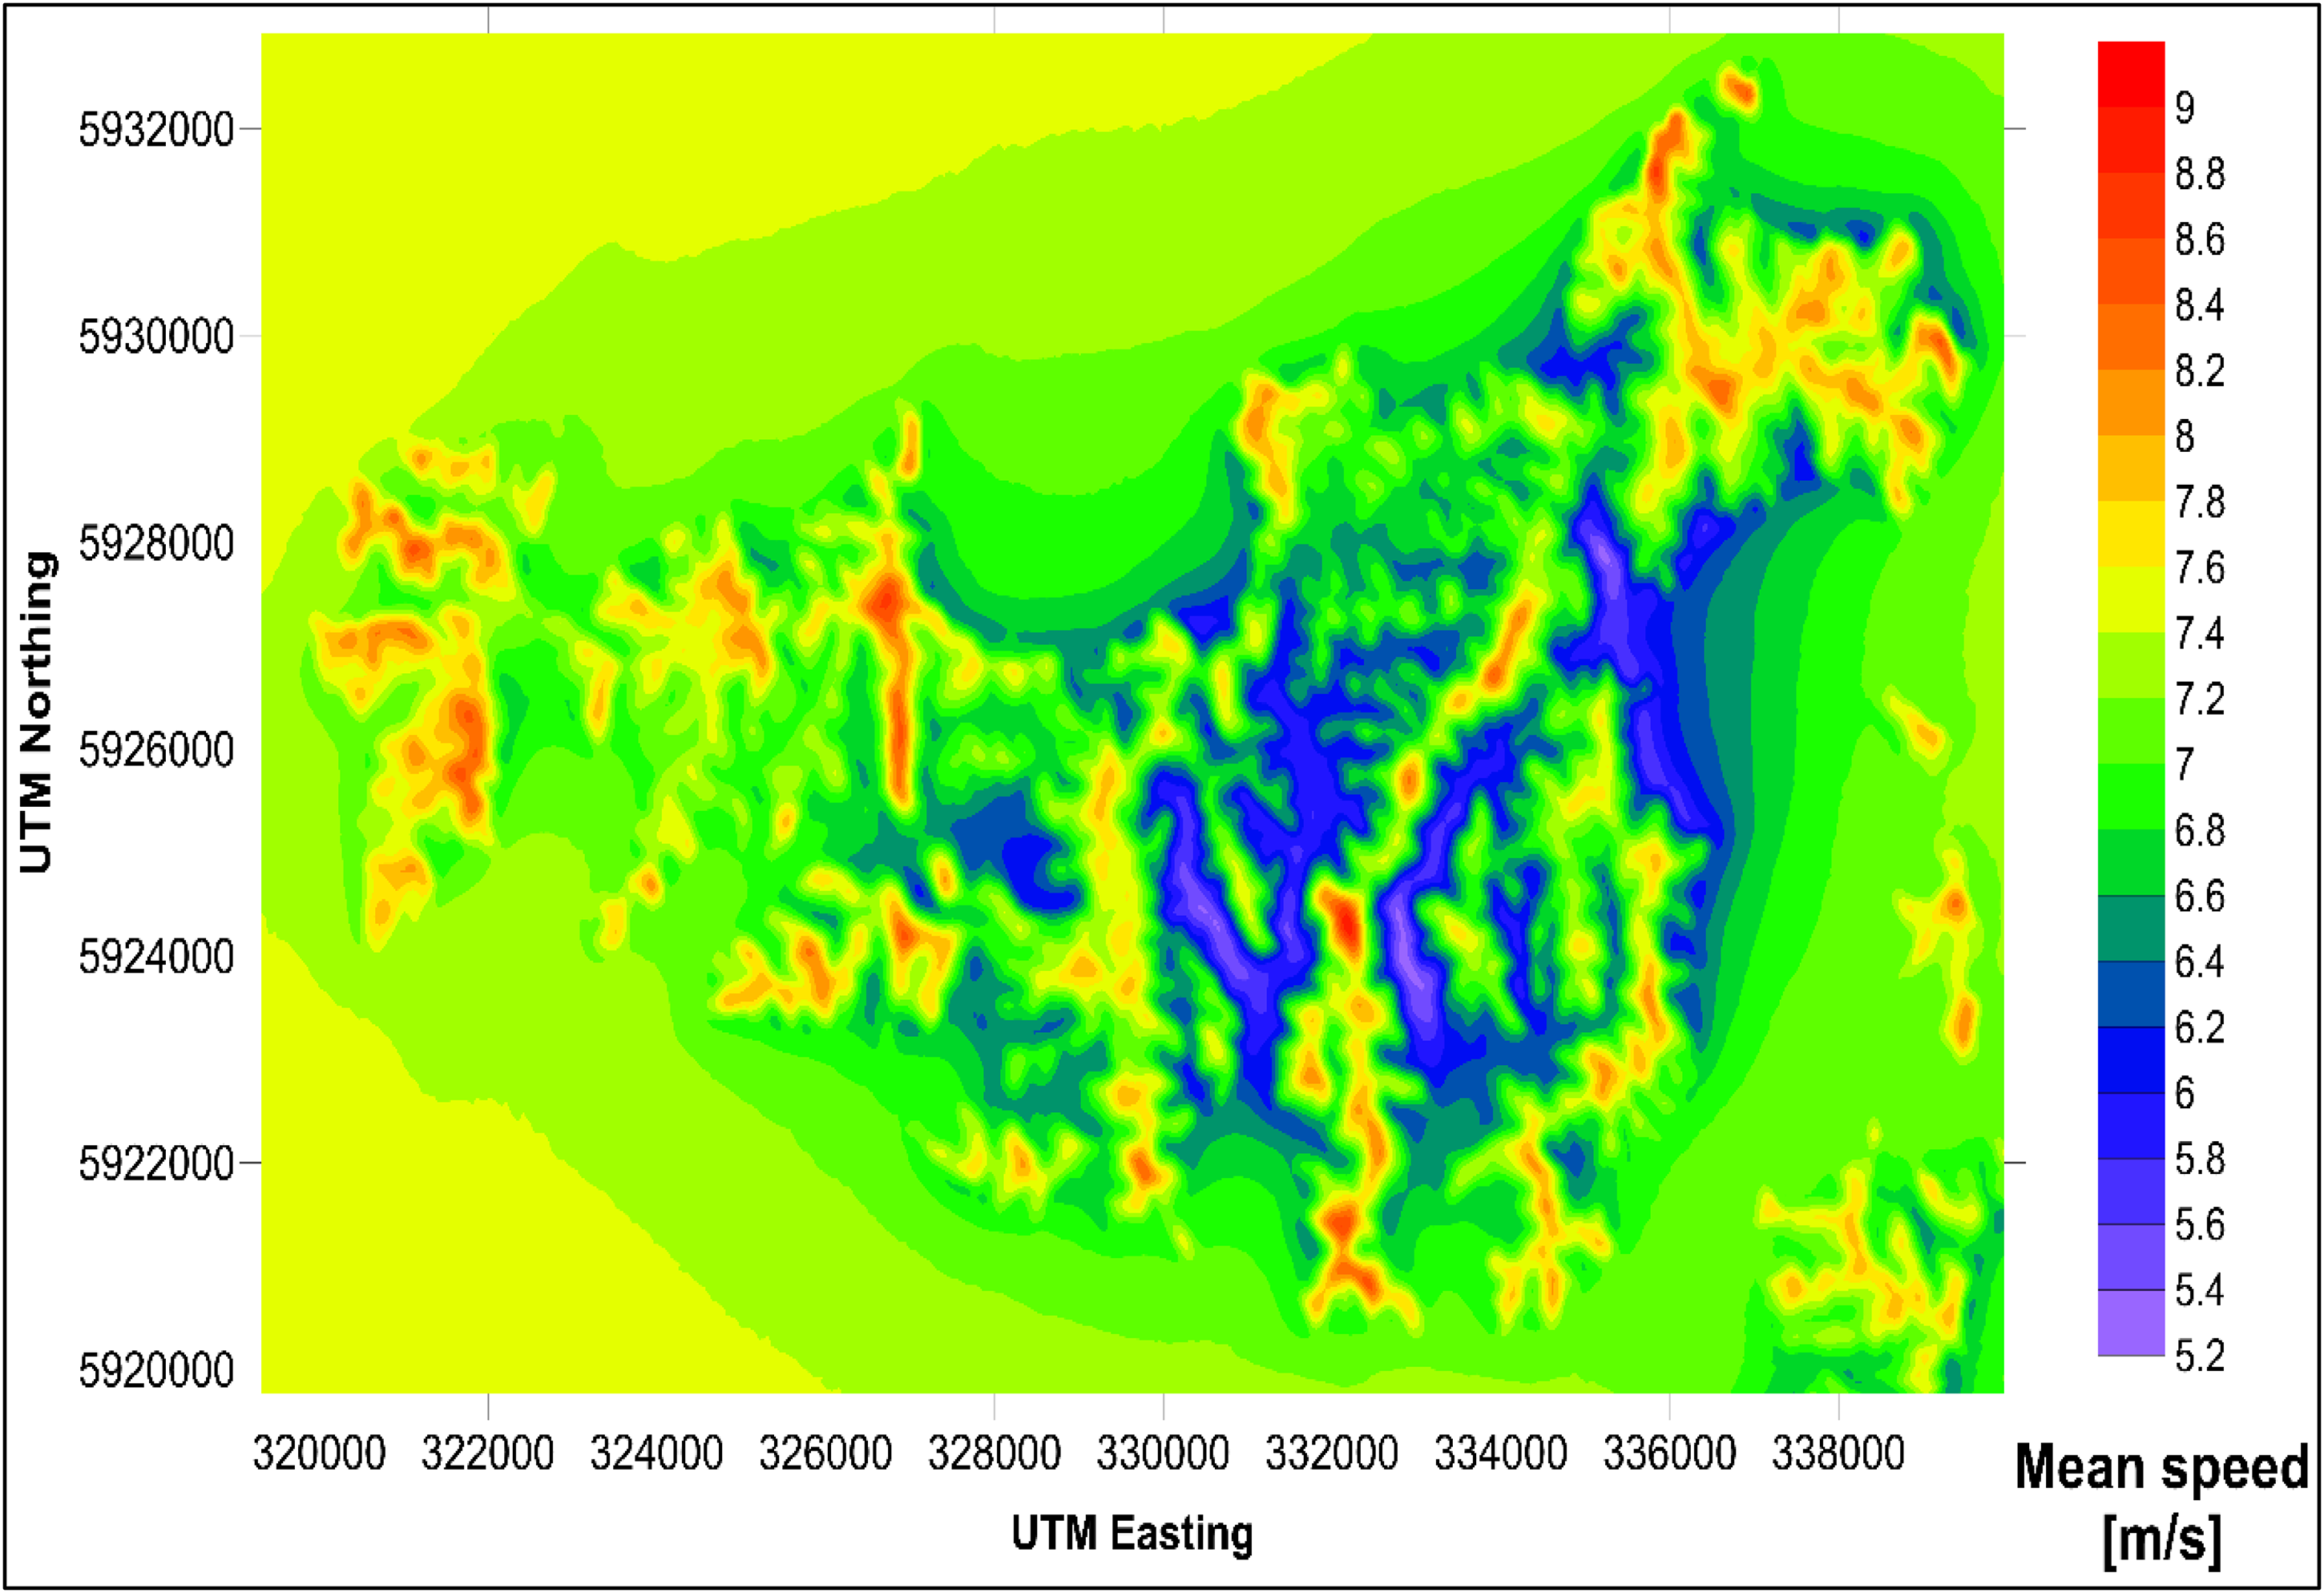
Contour map of mean wind speed variation over Waiheke Island.
Power density
Figure 13 shows the spatial variation of the wind power density on Chatham Island. The power density ranges from a minimum of 189 W/m2 at (536646, 5116985) to 3760 W/m2 at (540396, 5118485). The mean power density is 1449 W/m2. The spatial variation of minimum, maximum, and mean power density across Chatham Island is favorable for the Vergnet GEV MP 30 wind turbine, and the mean power density is greater than 300 W/m2, which indicates that the wind resource can be classified as Wind Power Class 3 and above across Chatham Island.
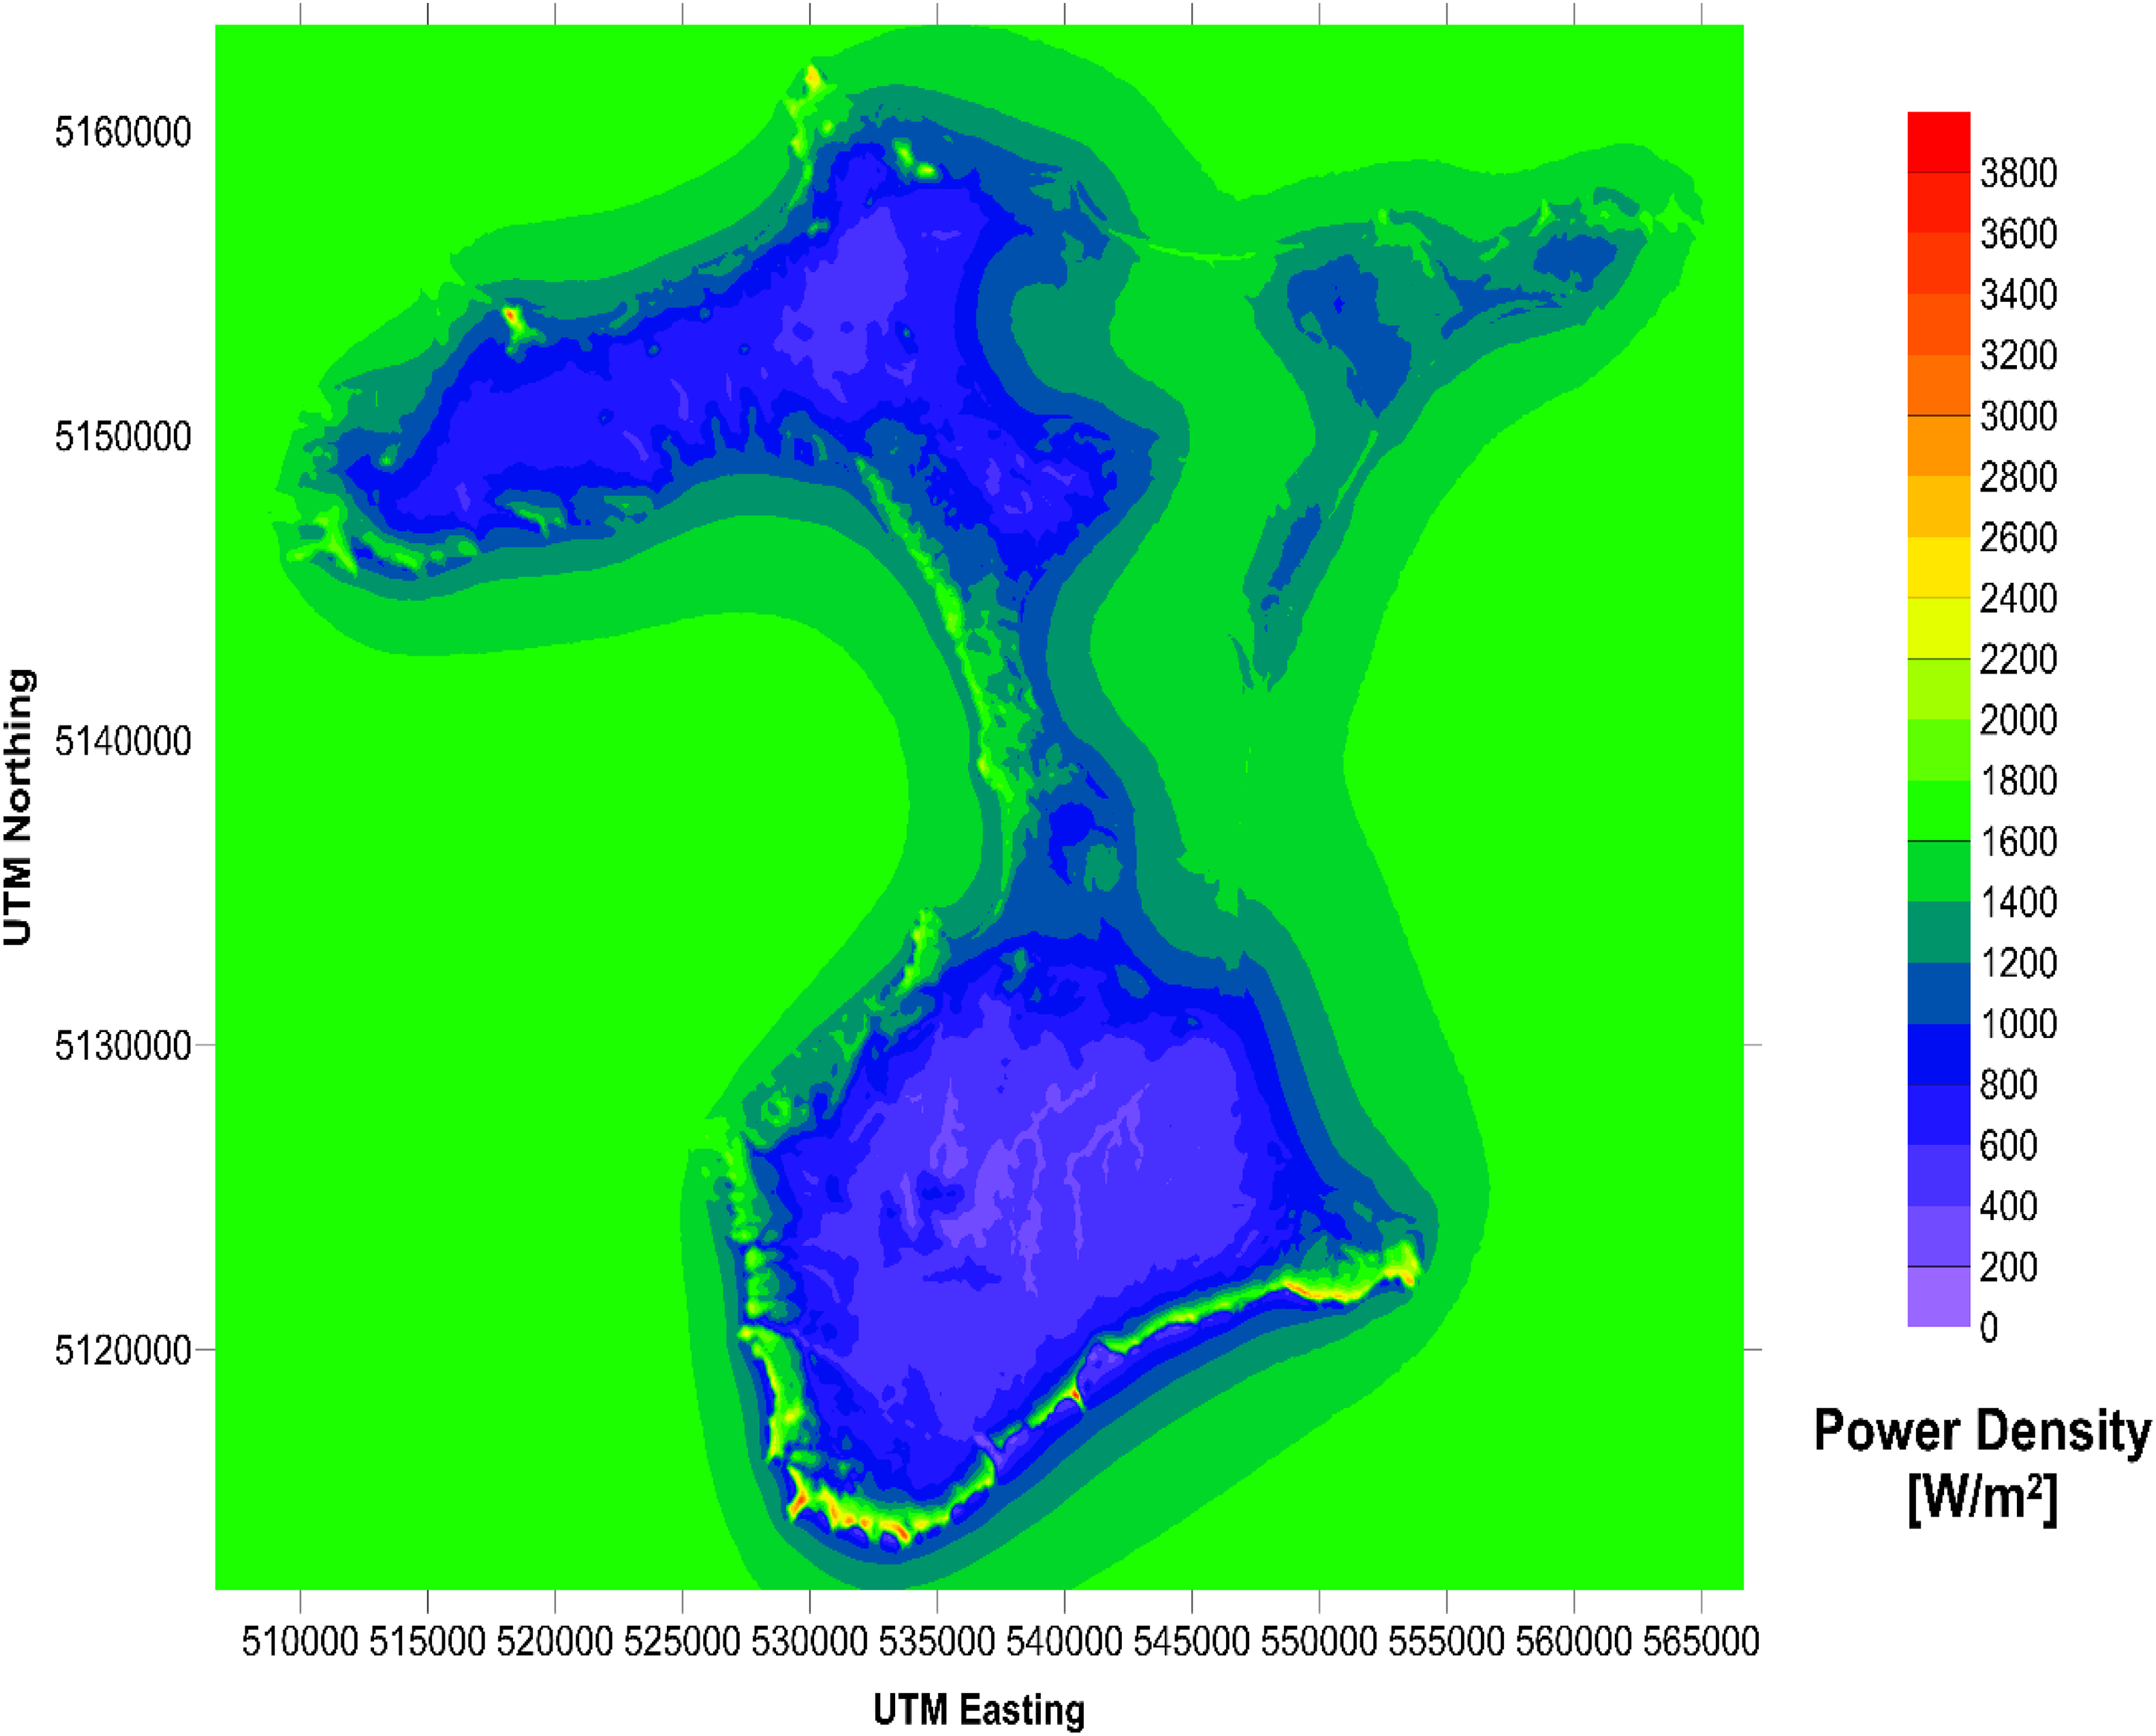
Contour map showing the power density variation over Chatham Island.
Similarly, the power density on Waiheke Island ranges from a minimum of 167 W/m2 at (332867, 5923922) to 766 W/m2 at (332167, 5924322). The mean power density is 406 W/m2. Figure 14 shows the spatial variation of power density on Waiheke Island.
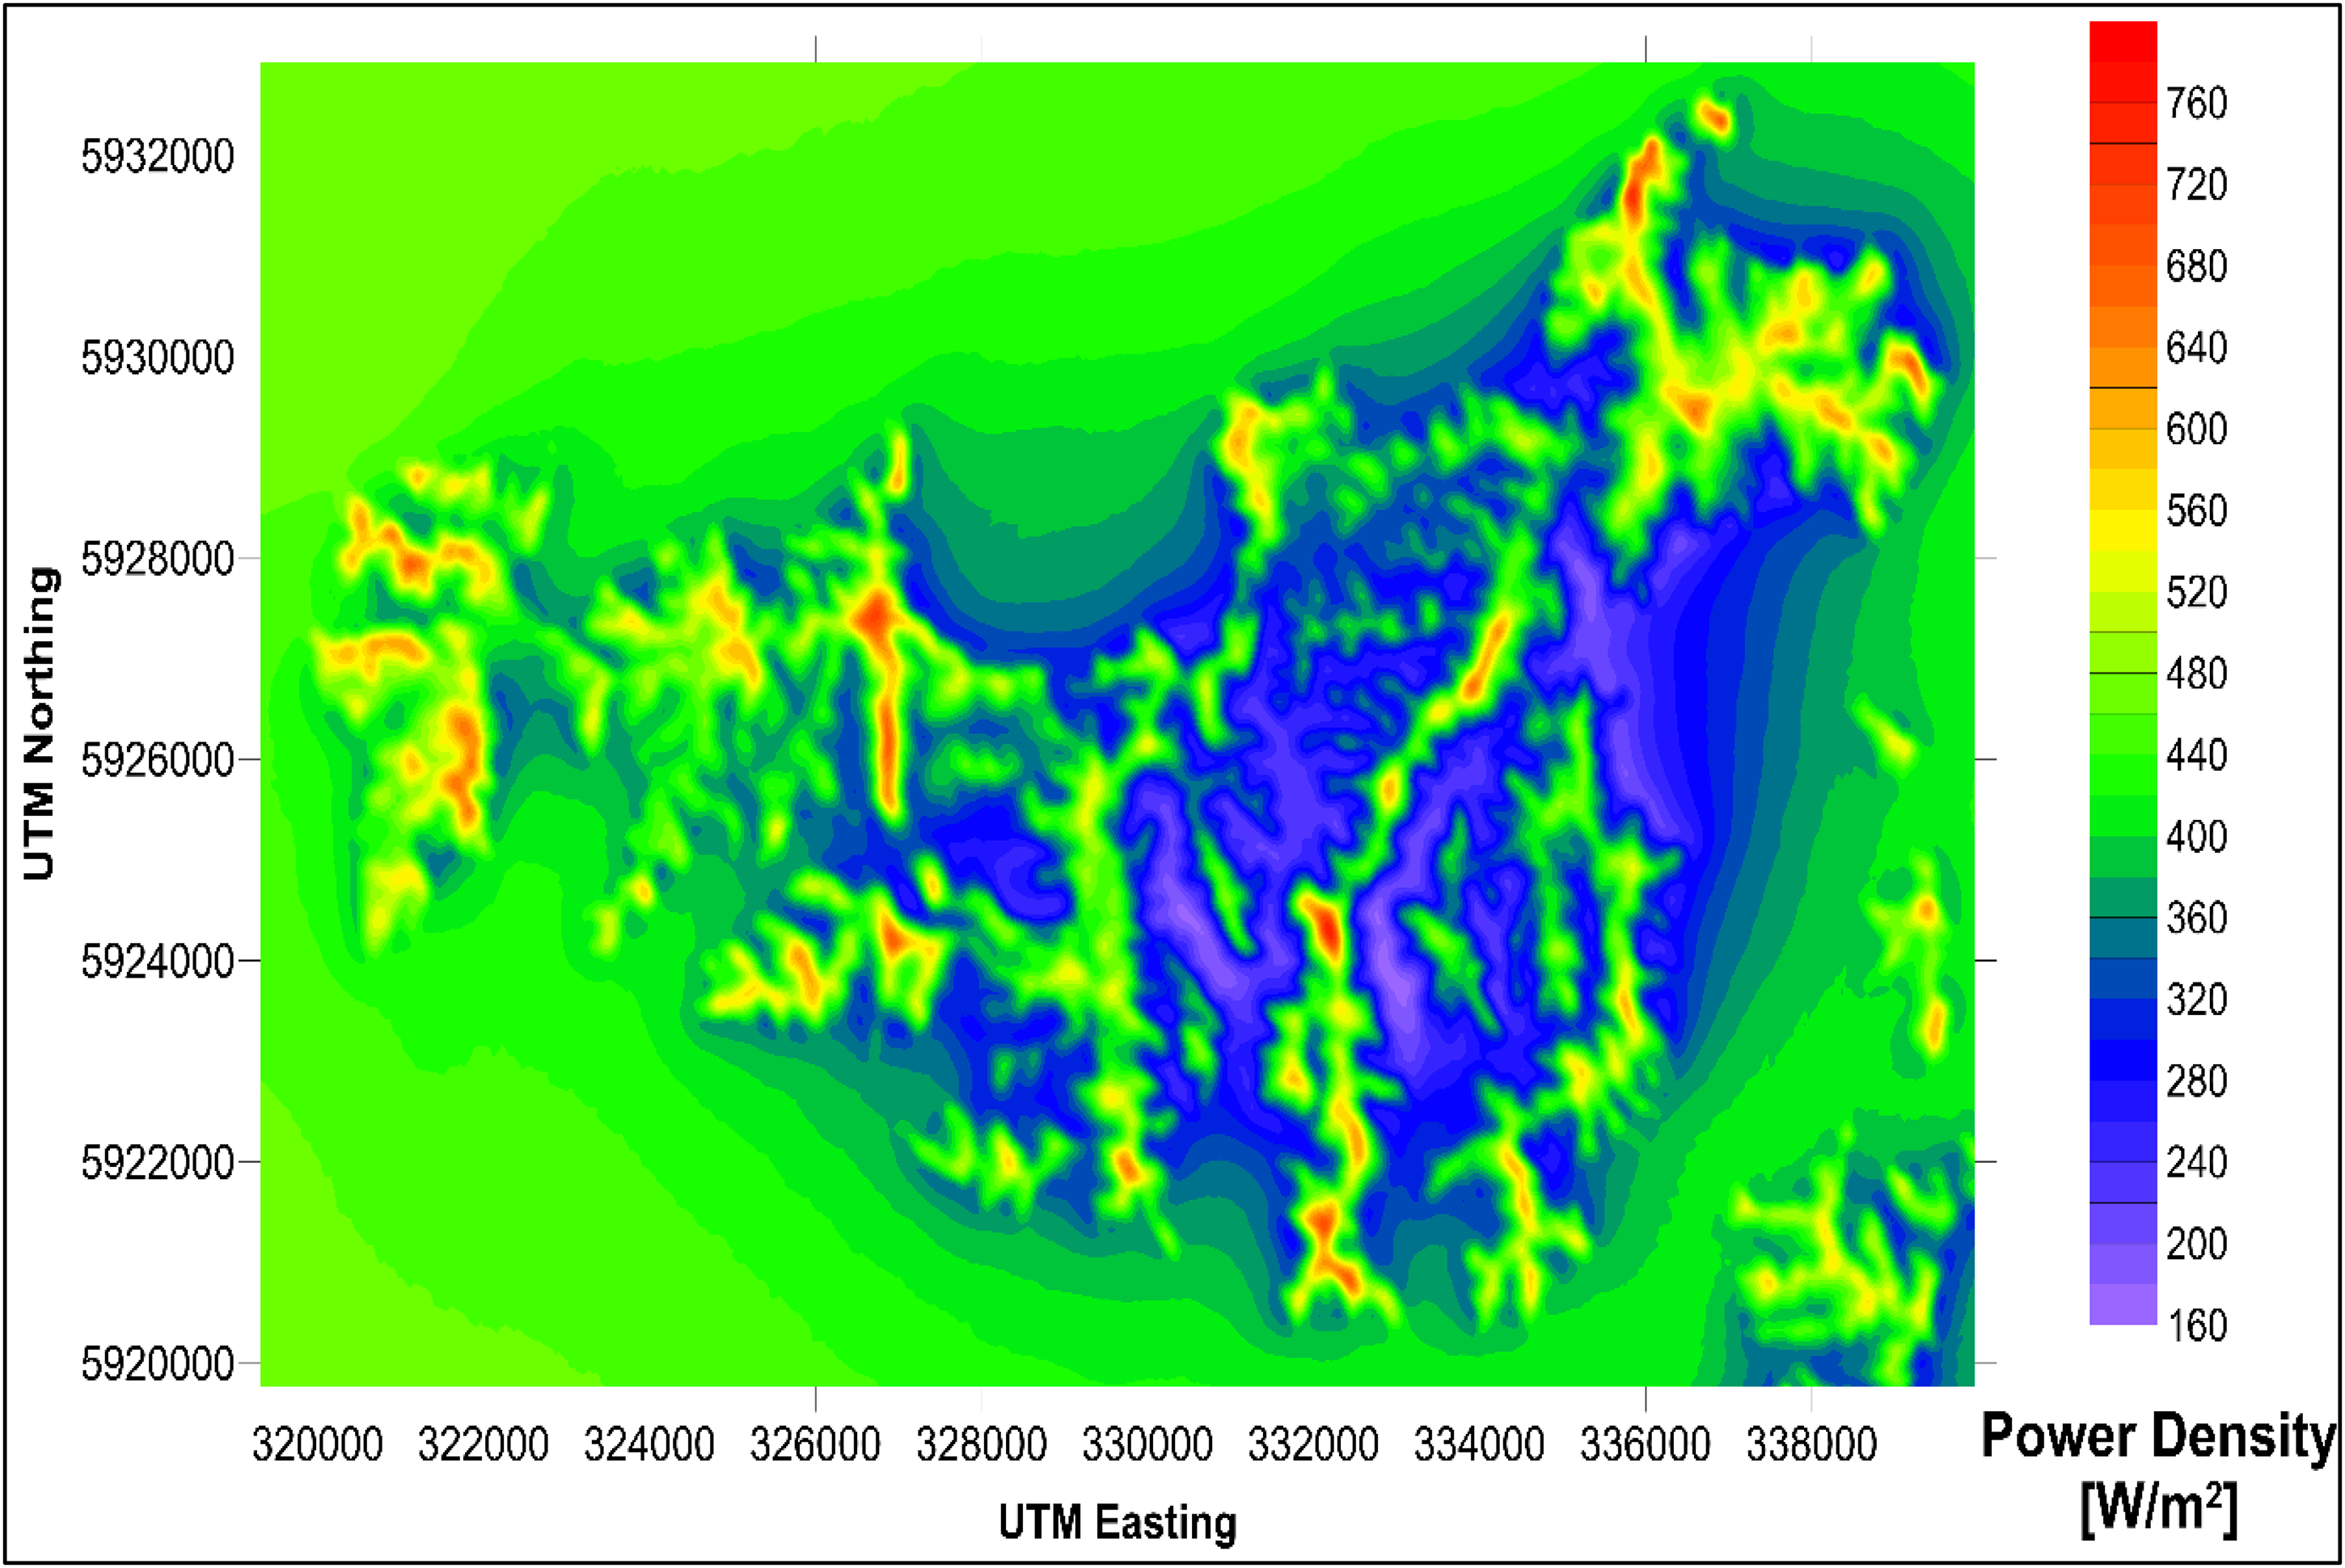
Contour map showing the power density variation over Waiheke Island.
The spatial variation of minimum, maximum, and mean power density across Waiheke Island is favorable for the Siemens SWT-2.3-82 wind turbine, and the mean power density is greater than 300 W/m2, which indicates that the wind resource can be classified as Wind Power Class 3 and above across Waiheke Island.
Annual energy production
Figure 15 presents the spatial variation of the AEP over Chatham Island. The minimum AEP computed at 55 m hub height with Vergnet GEV MP-C 30 m rotor WTG is 3.010 GWh/year, occurring at (536646, 5116985), while the maximum is 13.873 GWh/year at (531521, 5114360). The mean AEP over the entire resource grid is 11.873 GWh/year. The spatial variation of minimum, maximum, and AEP across Chatham Island is favorable for the Vergnet GEV MP-C 30 wind turbine, and the AEP is greater than 0.500 GWh/year, which indicates that the wind resource can be classified as Wind Power Class 3 and above across Chatham Island.
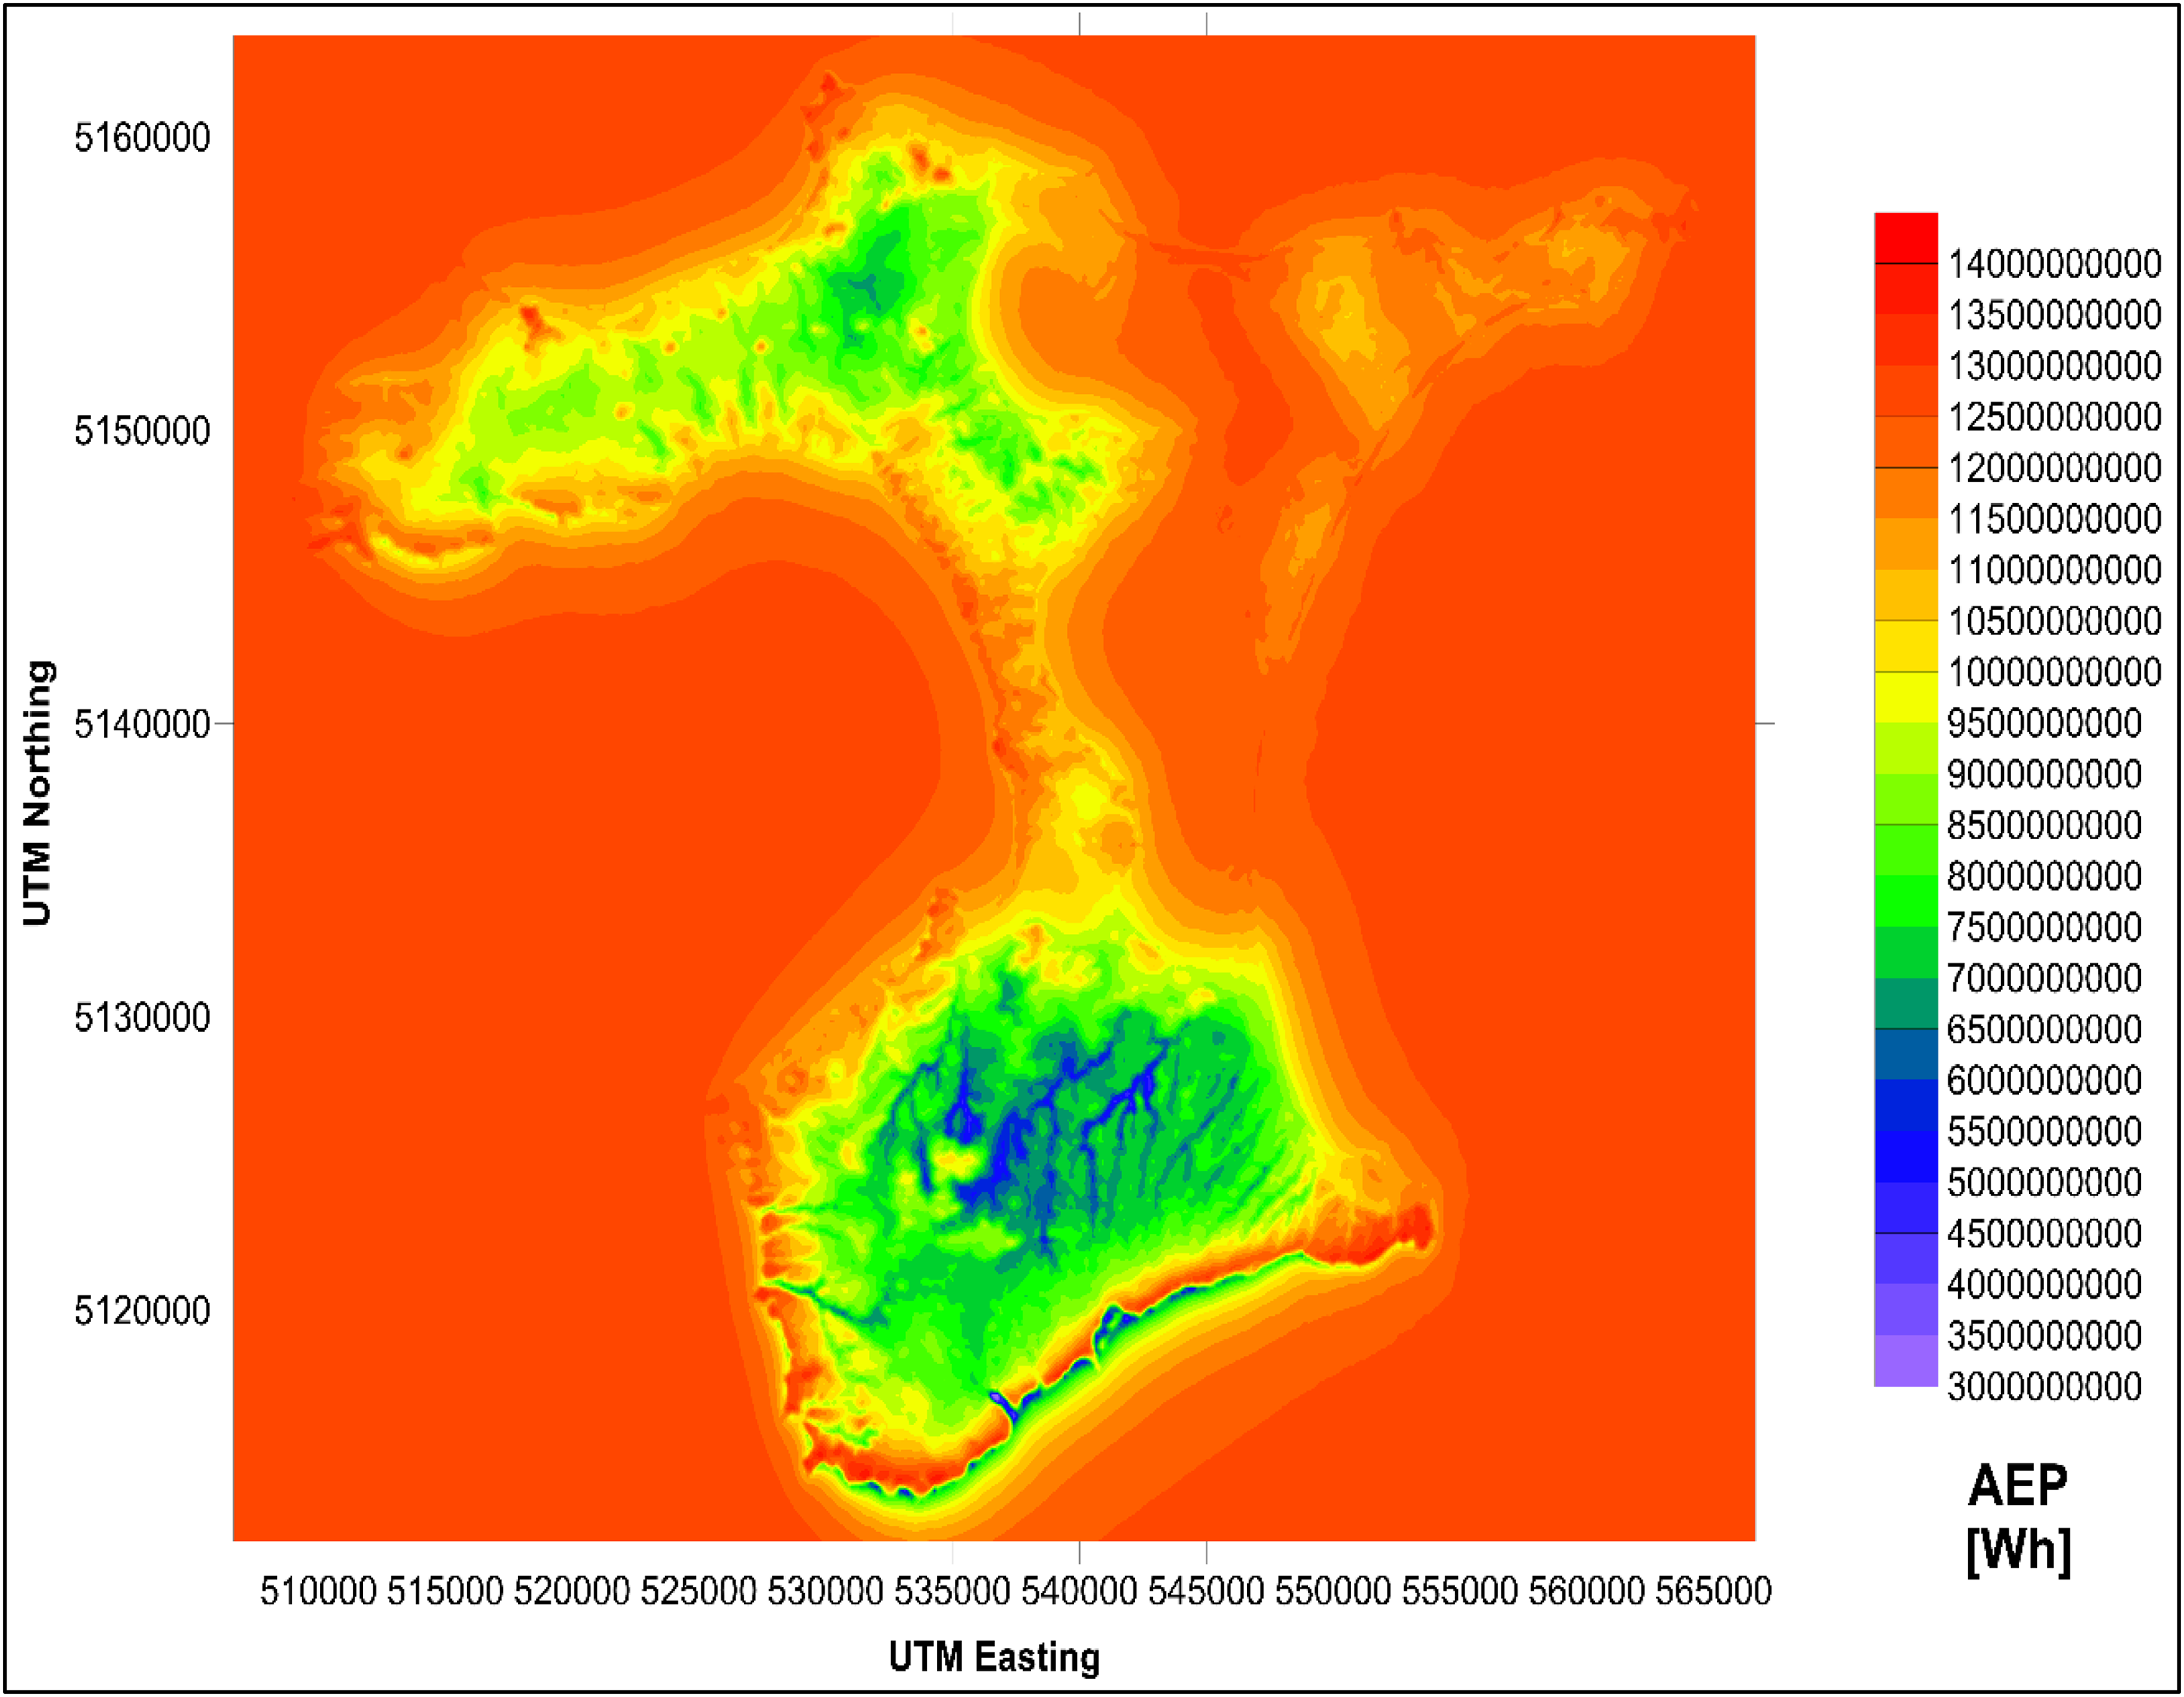
Contour map showing the AEP variation over Chatham Island.
Figure 16 shows the spatial variation of the AEP at Waiheke Island. The mean AEP is 6.149 GWh/year calculated with 80 m hub height Siemens SWT-2.3-82 WTG. The minimum AEP is 2.931 GWh/year occurring at (332867, 5923972), while the maximum is 9.219 GWh/year at (332167, 5924322). The spatial variation of minimum, maximum, and mean AEP across Waiheke Island is favorable for the Siemens SWT-2.3-82 wind turbine, and the mean AEP is greater than 0.500 GWh/year, which indicates that the wind resource can be classified as Wind Power Class 3 and above across Waiheke Island.
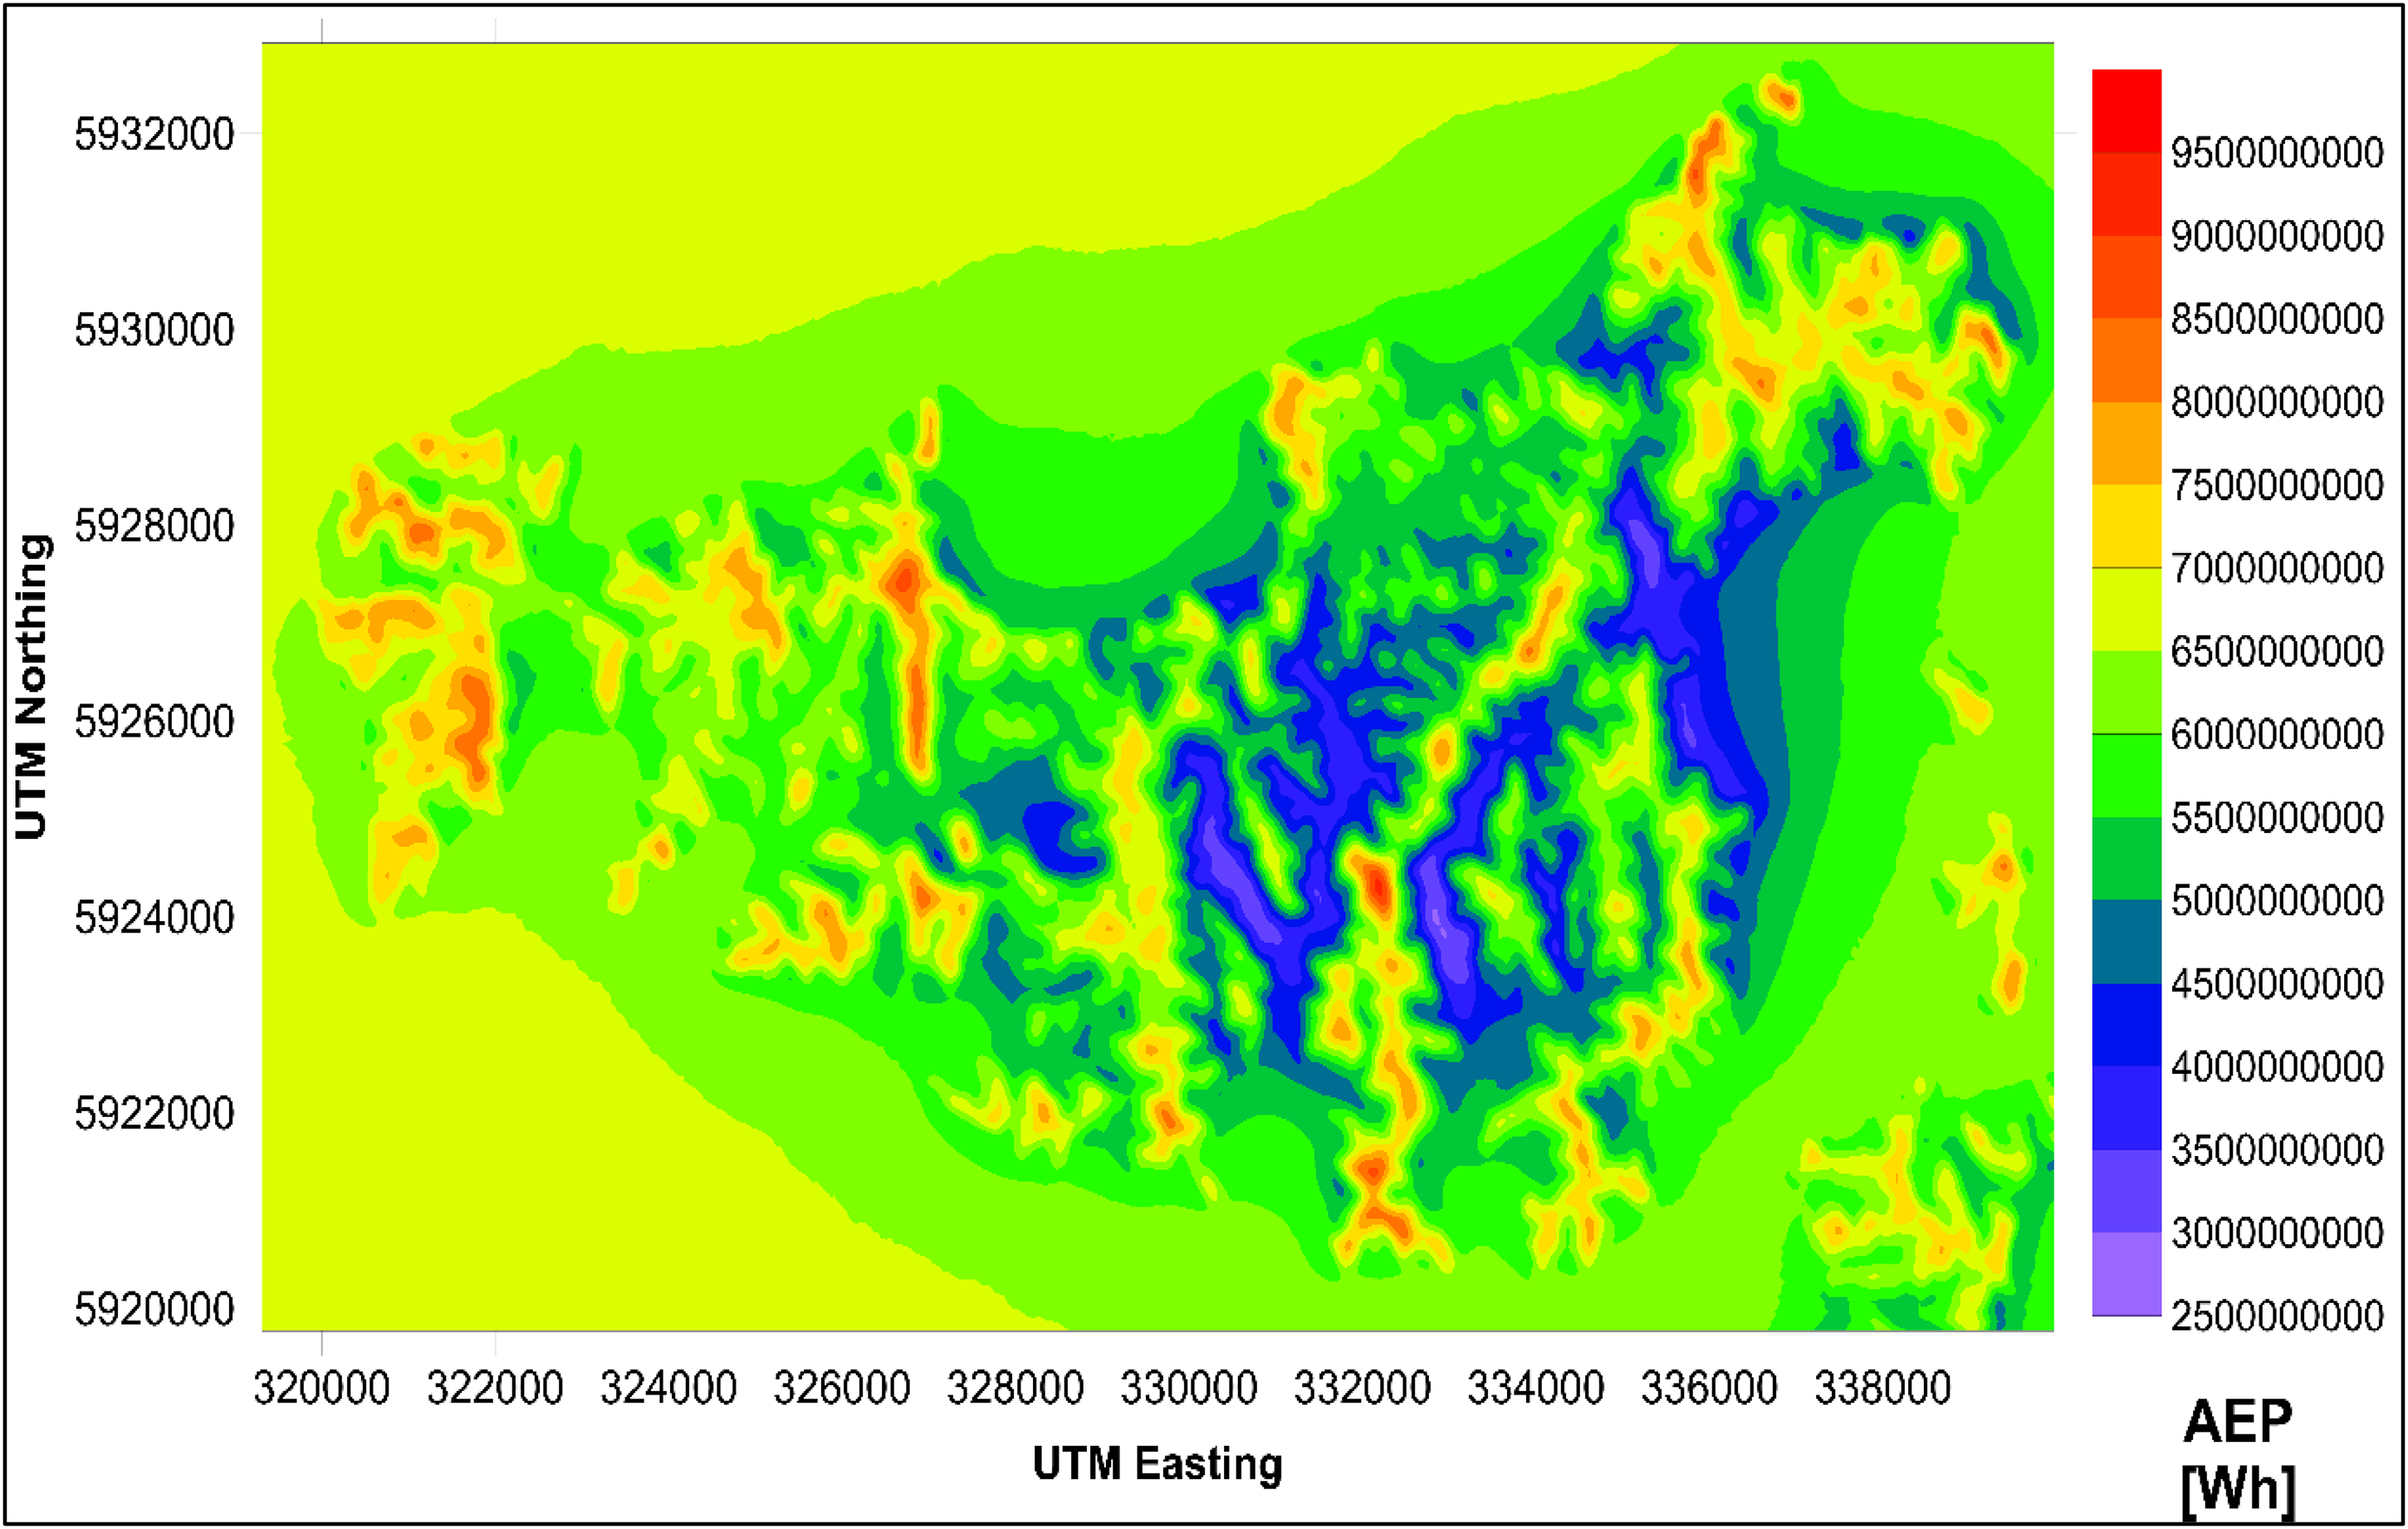
Contour map showing the AEP variation over Waiheke Island.
Wind farm production
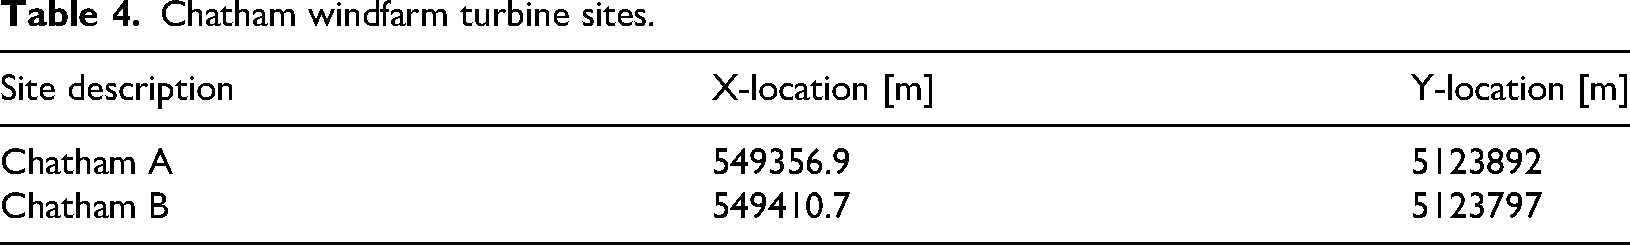
Chatham wind farm has two turbine sites located at positions shown in Table 4. Both these turbines combine to produce 2.779 GWh/year of total gross AEP and 2.727 GWh/year of total net AEP with a proportional wake loss of 1.85% as shown in Table 5. The mean wind speed at Chatham A turbine site is 10.26 m/s, with a power density of 1147 W/m2 and a net AEP of 1.382 GWh/year. The wake loss at this site is 0.92%. Similarly, for the Chatham B turbine site, the mean wind speed at this turbine site is 10.17 m/s, with a power density of 1113 W/m2, net AEP 1.346 GWh/year, and wake loss of 2.8%.
Chatham windfarm turbine sites.
Chatham wind farm production.
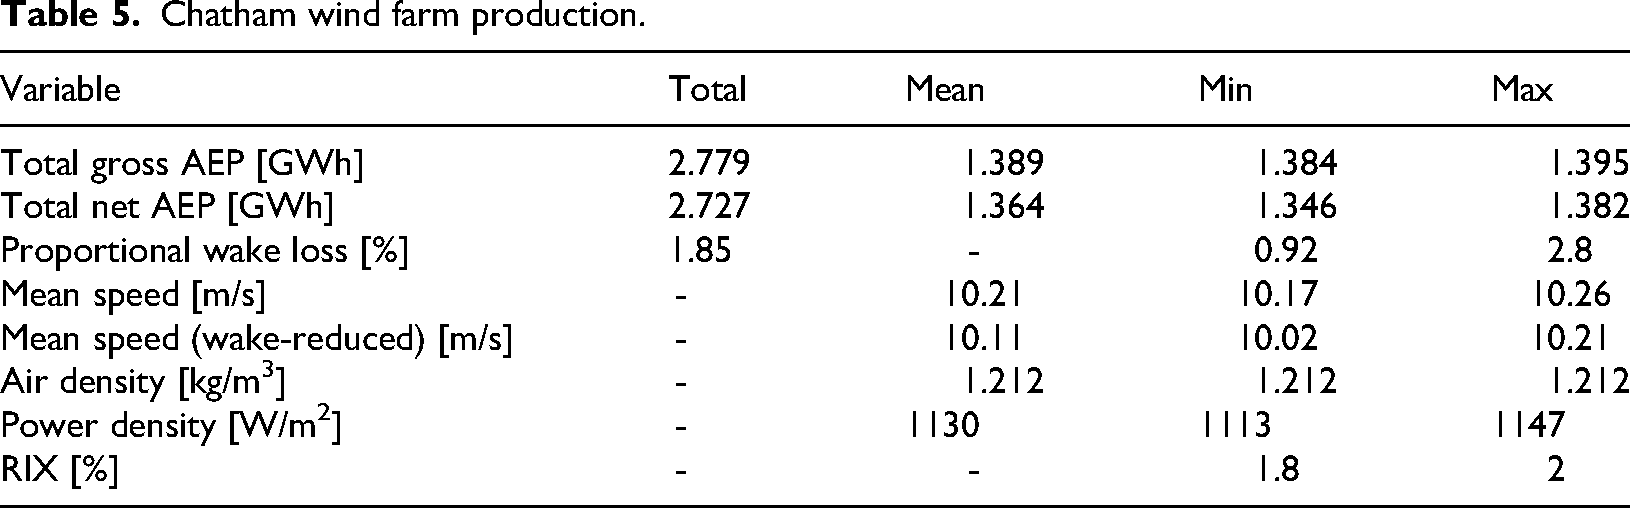
Following the mini-report (McWhirter, 2010), the annual power required in Chatham's power generation system is 2.2 GWh/year. Based purely on resource potential, the 2.727 GWh/year net AEP of the Chatham wind farm can match the power requirements on the island. However, a study on modeling of the wind flow over Chatham Island reported estimation of power output from a single turbine was 125 kW, 55% of the maximum power rating of 225 kW. This study also highlights that the actual power output is much lower than the statistical estimation. Operational reasons were attributed to the low turbine performance (Tonkin et al., 2017). However, with average wind speeds of 10.26 m/s and 10.17 m/s, which are higher than the highest IEC wind turbine class, i.e., class I, as well as reports of turbine shutdown when speeds exceed 20 knots, i.e., 10.28 m/s, as reported by (Maslin and Herald, 2019), the suitability of the site must also be considered. This justifies the need for the site suitability assessment (SSA) (Figure 17).
Close-up view of Chatham windfarm location with two turbine sites (+).
Resource classification
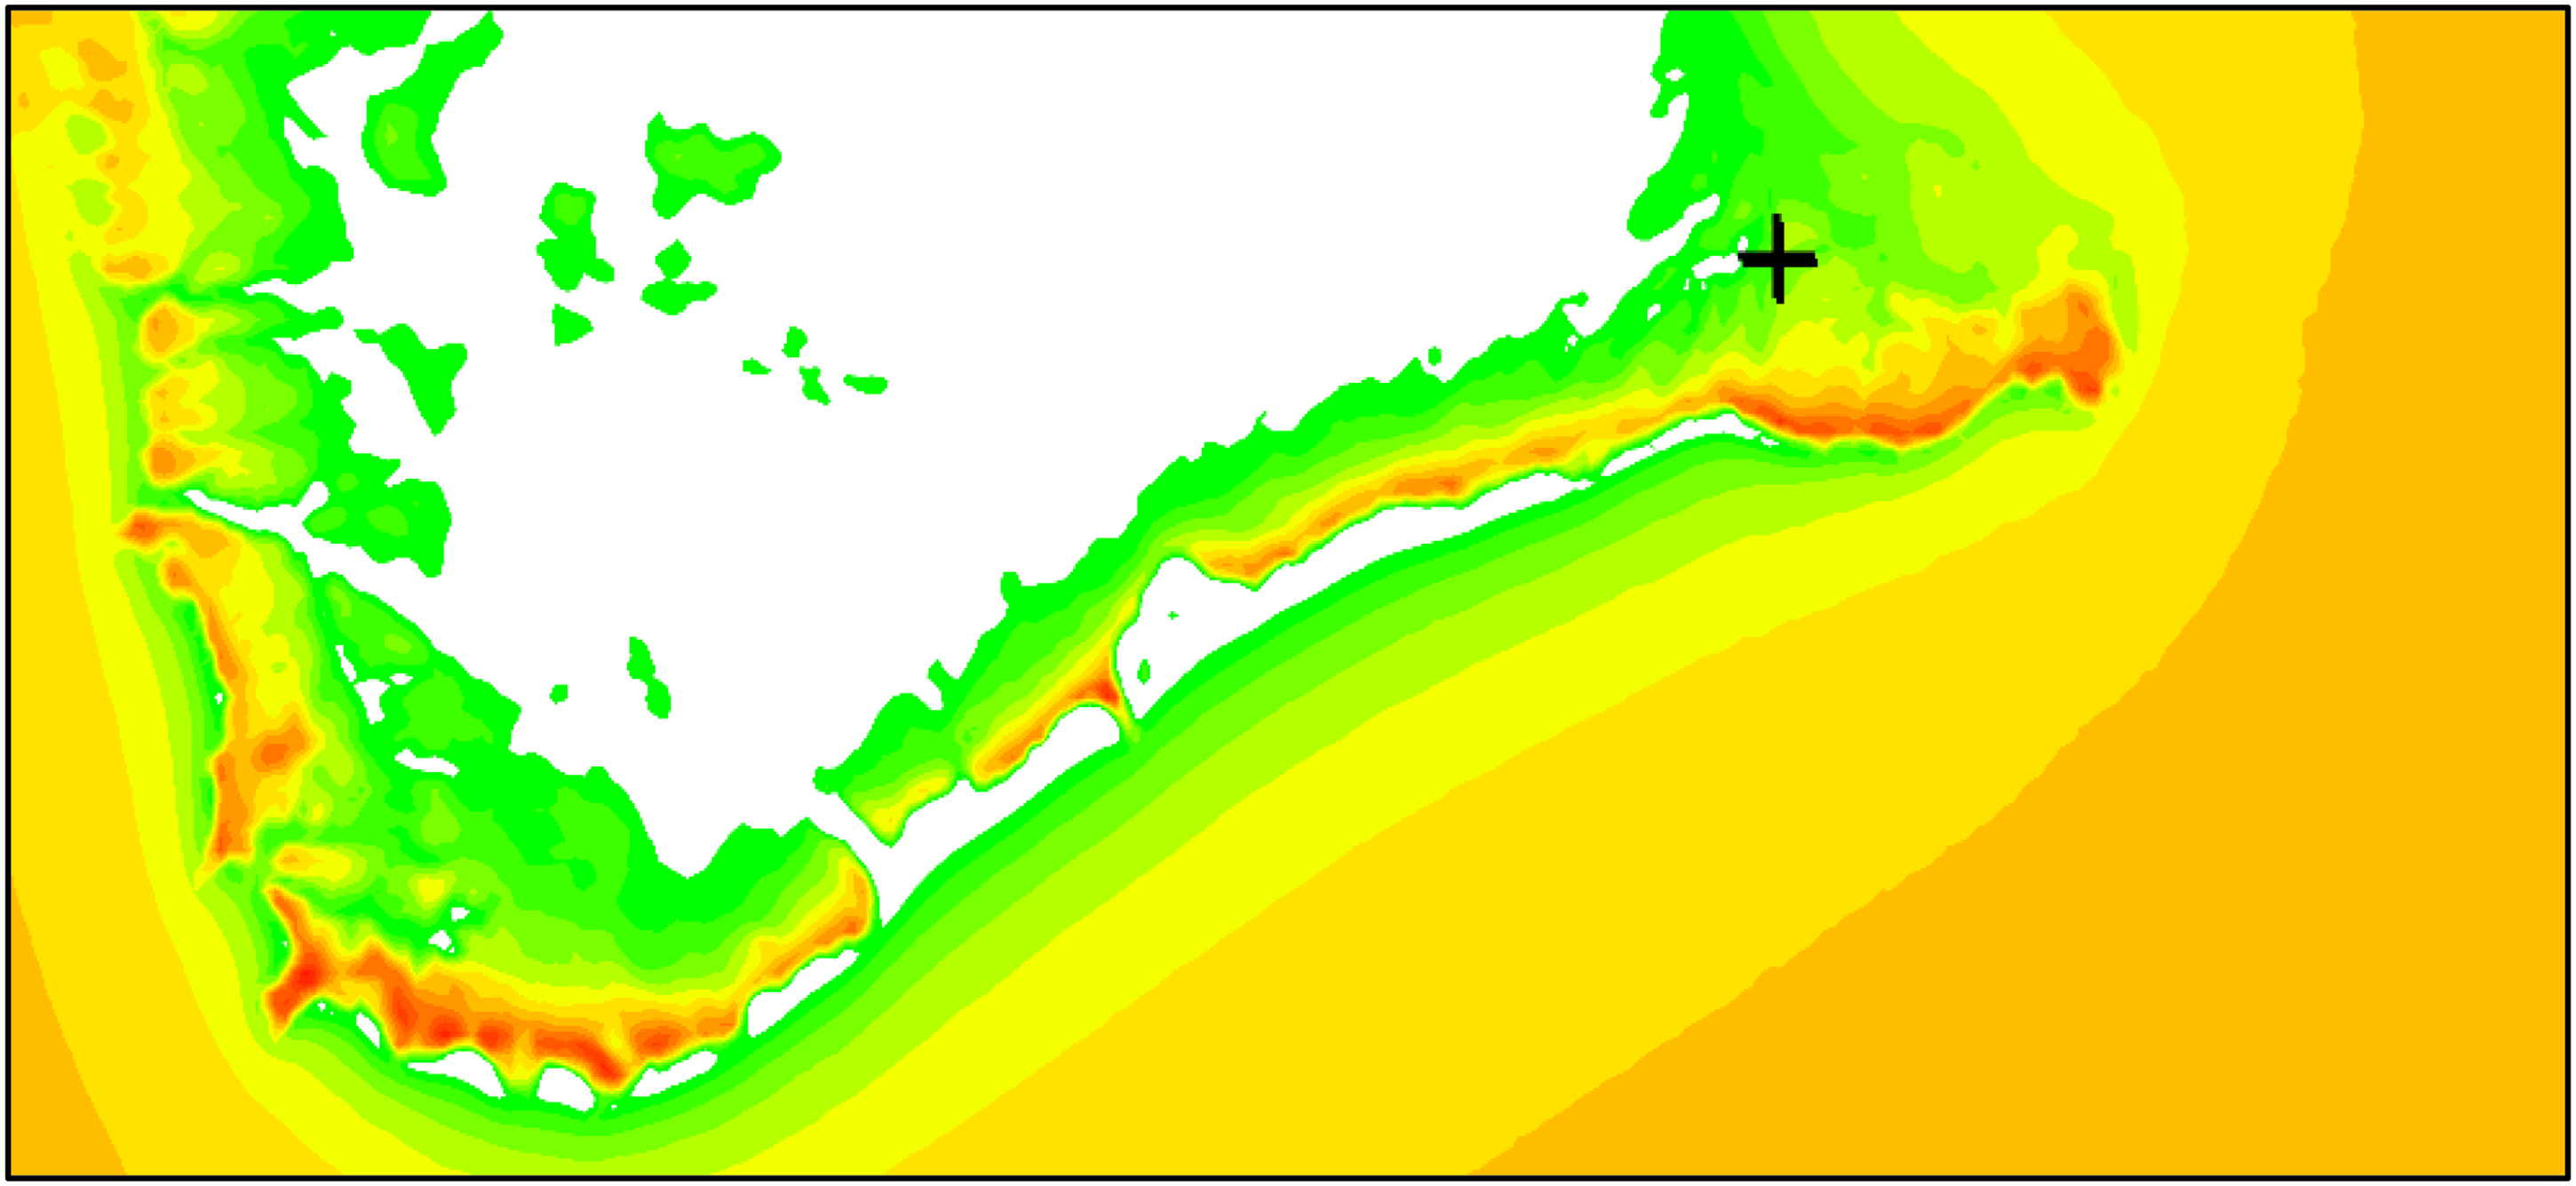
Different wind classification systems, based on wind speed and power density, exist. The wind potentials on Chatham and Waiheke Islands are classified based on the seven-class system detailed in (Busby, 2012a, 2012b). Figure 18 and Figure 19 show the mean wind speed and power density across Chatham Island equal to and greater than 8.7 m/s and 800 W/m2, respectively, at 55 m turbine hub height. Following resource classification detailed in (Busby, 2012a, 2012b), a large portion of the island has a Wind Power Class 7 wind resource. This is considered as excellent utility-scale potential.
Class 7 mean wind speed distribution across Chatham Island. The red circle highlights the Chatham windfarm. White space shows sites with wind speeds lower than 8.7 m/s.
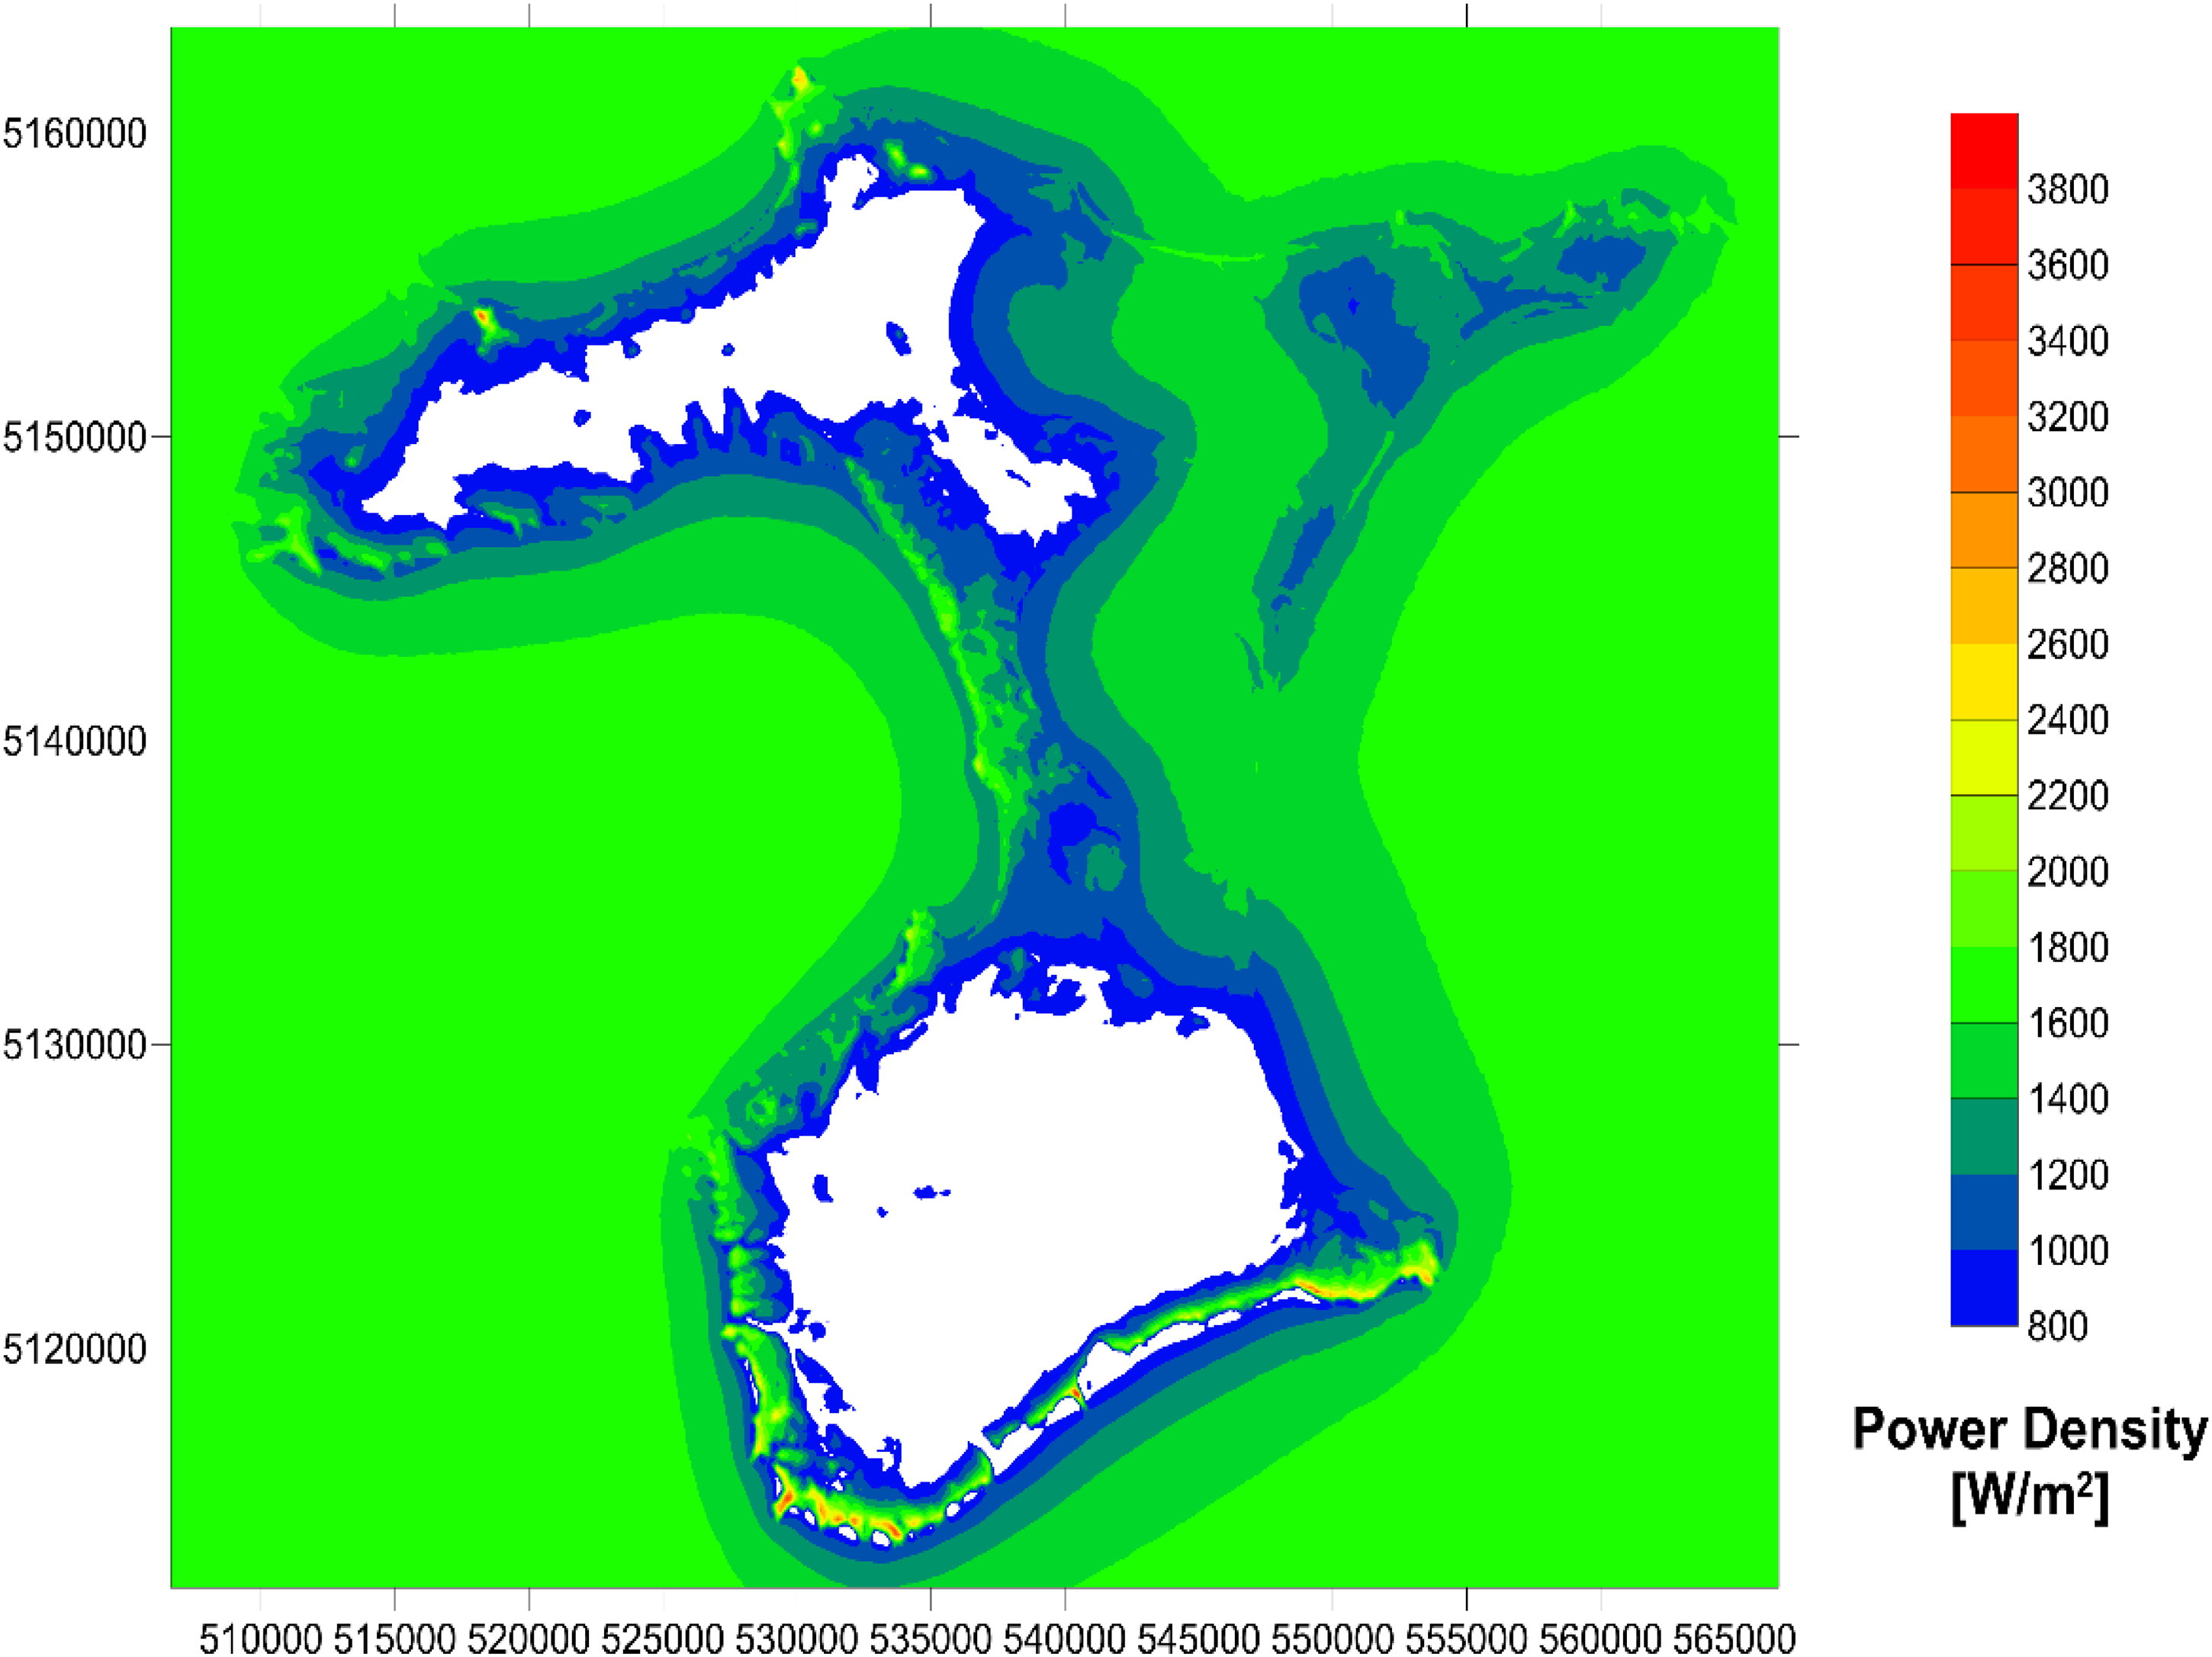
Class 7 power density distribution across Chatham Island. White space shows sites with wind power density lower than 800 W/m2.
The Chatham wind farm with turbine sites located as shown in Figure 17 was sited where the mean speed for a 55 m hub-height WTG was 10.21 m/s. With the same 55 m Vergnet GEV MP WTG, the power density (see Figure 19) across the island ranges from 800 W/m2 to 3800 W/m2.
Similarly, the Waiheke Island spatial charts (Figure 20 and Figure 21) below show a sparser distribution of sites with excellent potential, i.e., Class 4 (power density ranging between 400 and 500 W/m2 and wind speed between 7.0 and 7.5 m/s) and higher. The distribution shows where the Class 6 (power density ranging between 600 and 800 W/m2 and wind speed between 8.0 and 8.8 m/s) wind resource lies.
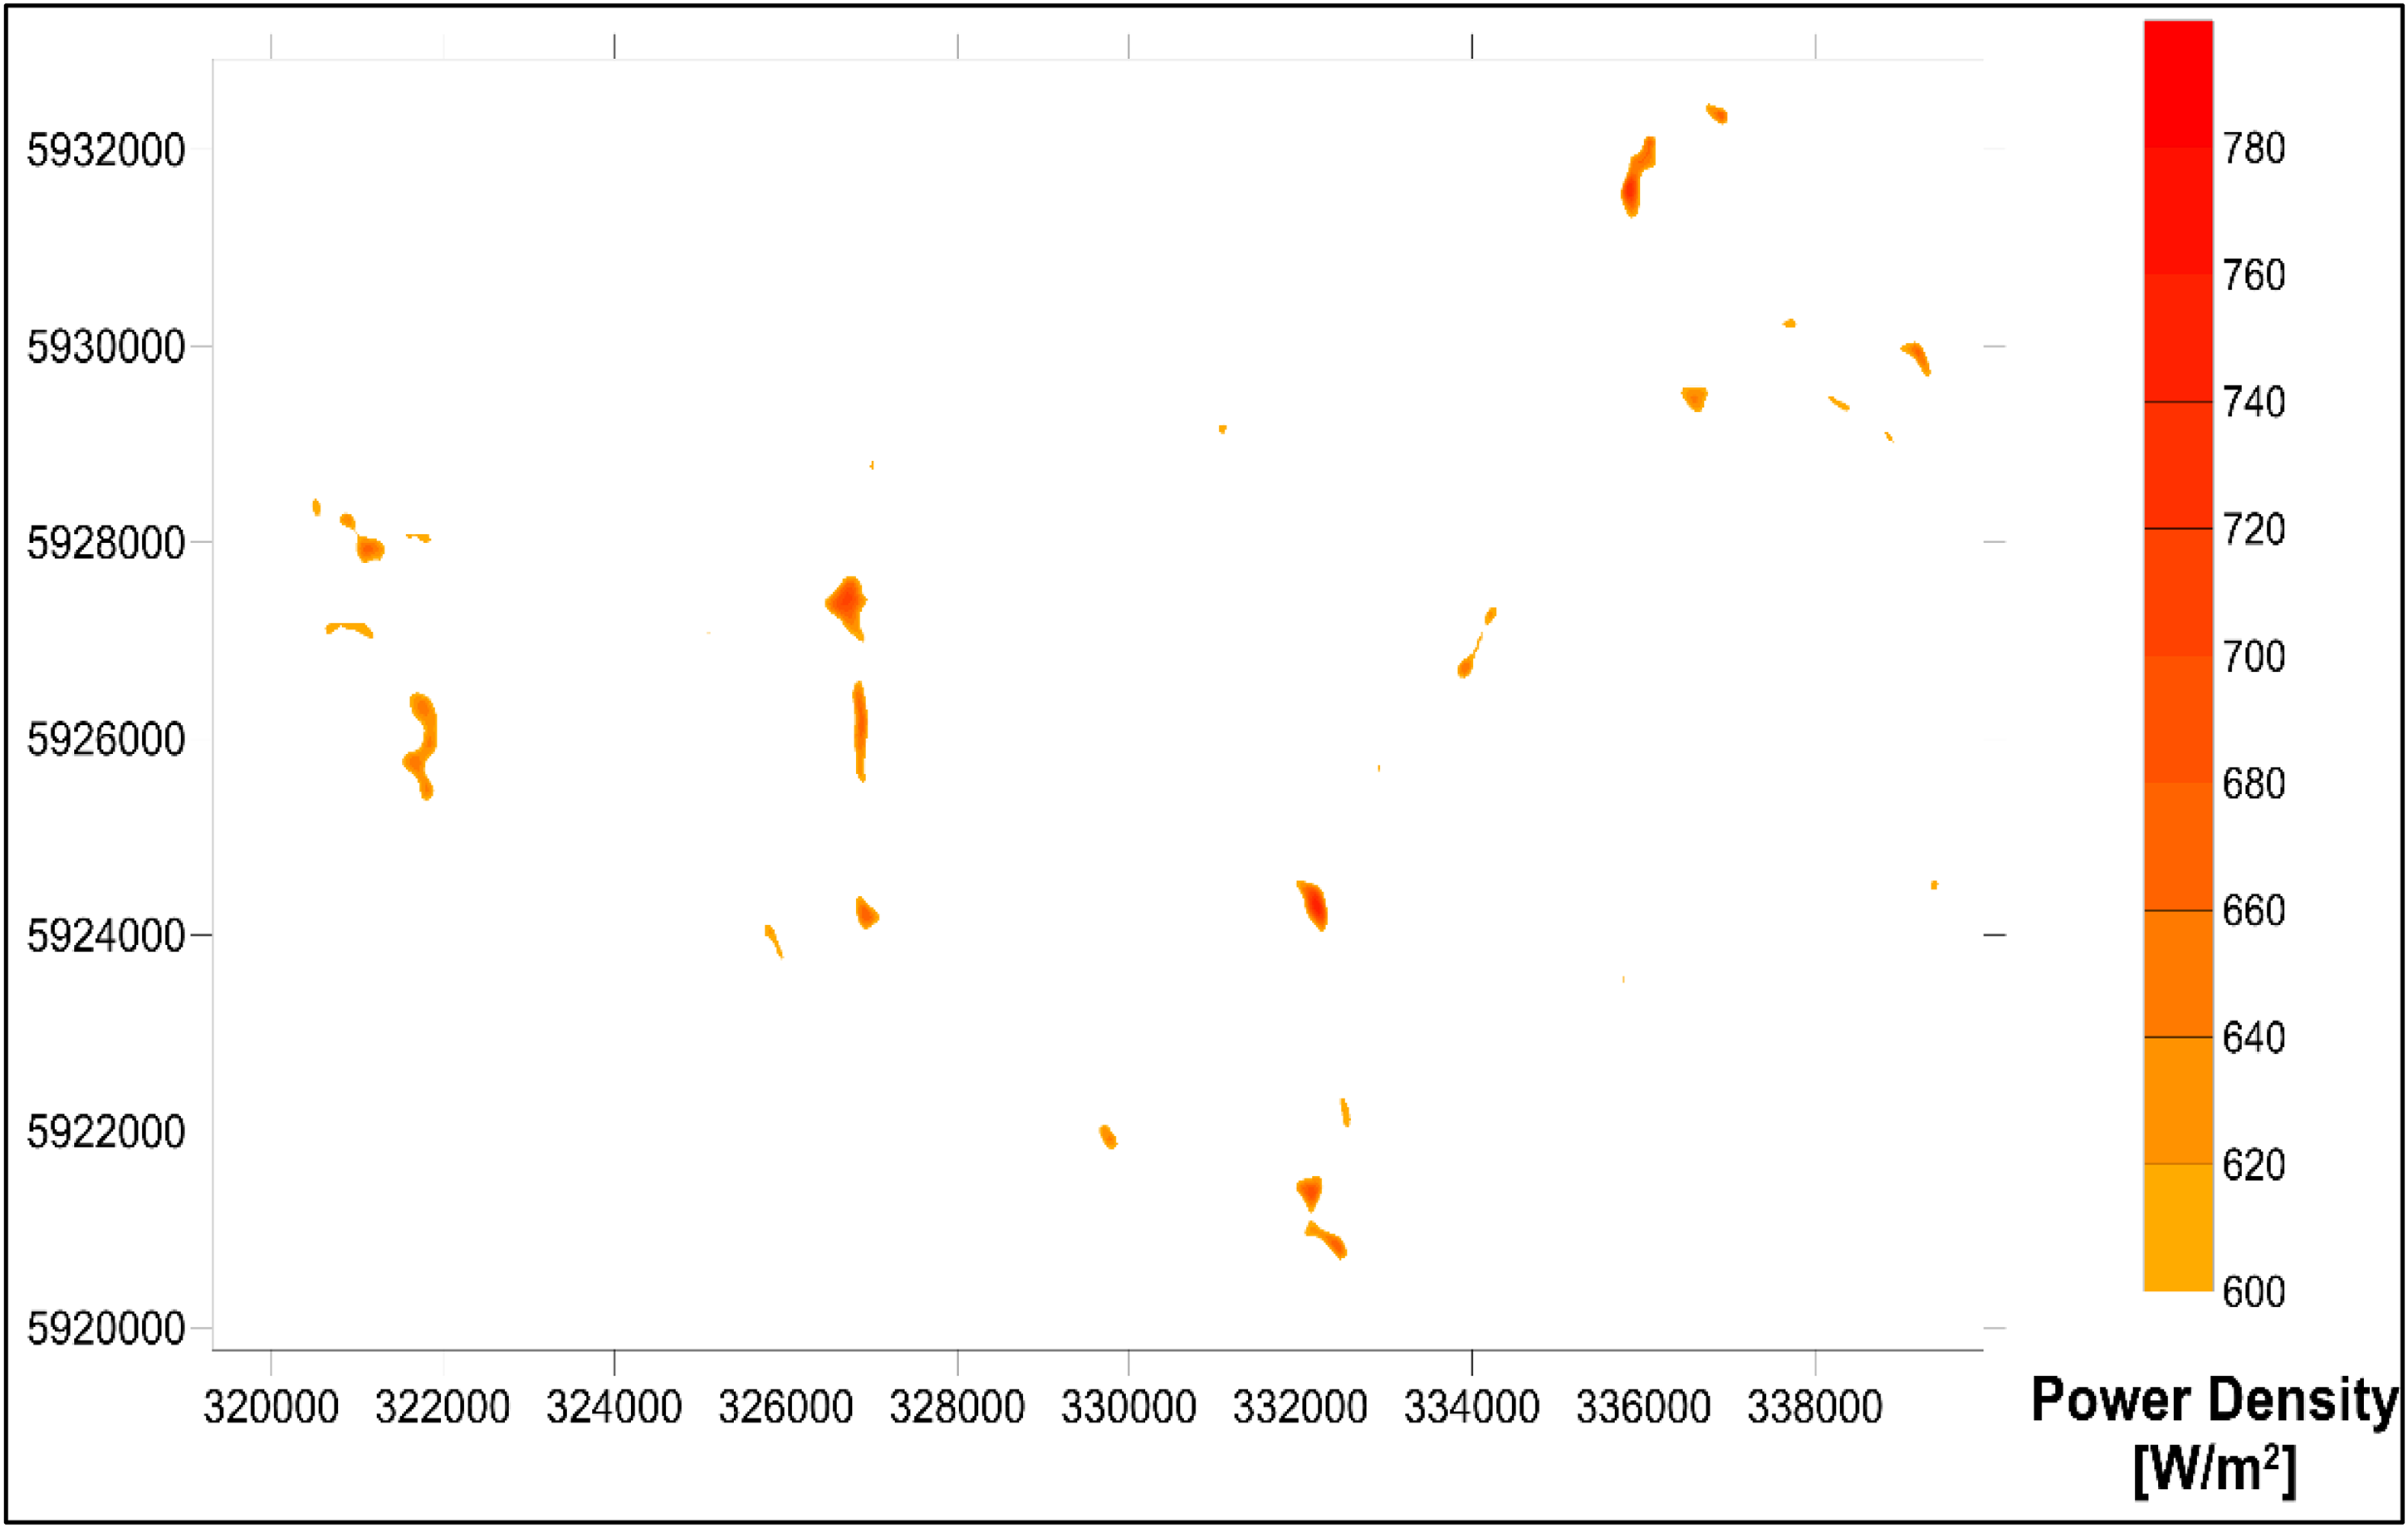
Sites with Wind Power Class 6 power density on Waiheke Island.
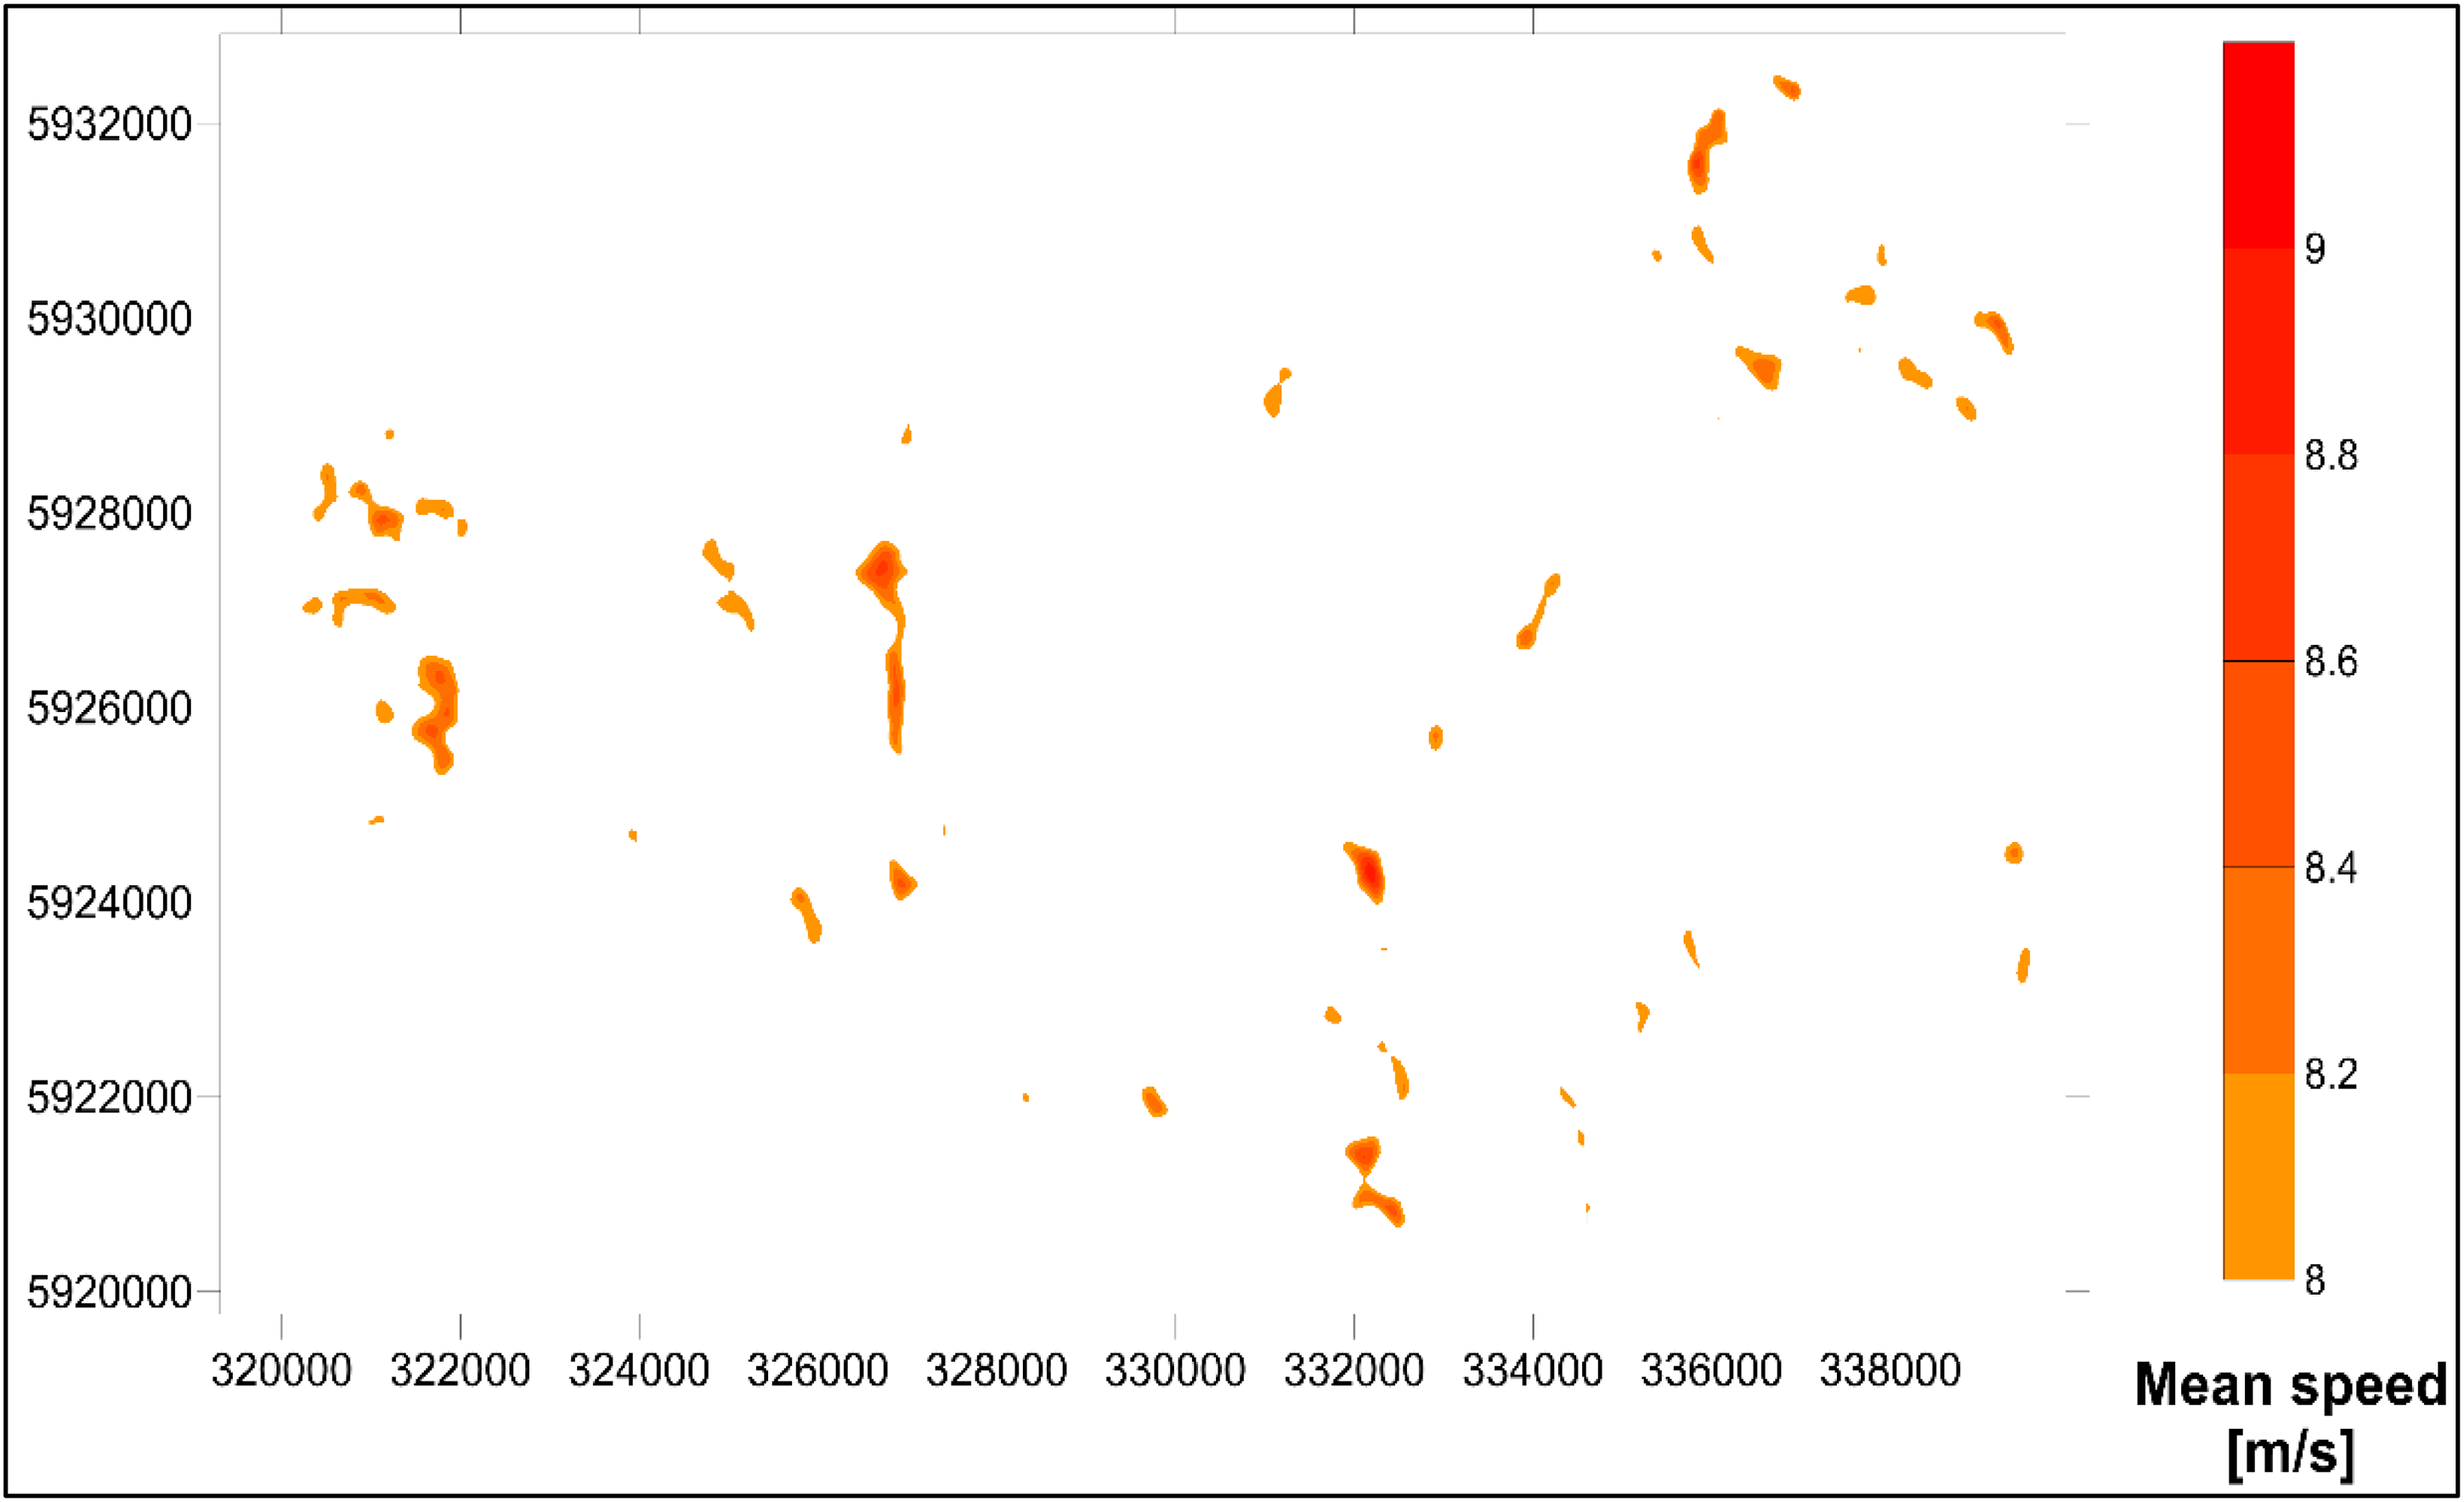
Sites with Wind Power Class 6 mean wind speeds on Waiheke Island.
Turbine sites within these distributions were selected, at the modeler's discretion, for site suitability assessment (SSA). This discretion is guided mostly by the recommended minimum side-by-side spacing of five rotor diameters between turbine sites in a wind farm (Busby, 2012a, 2012b). The turbine arrangements are mostly in irregular arrays or follow a terrain feature with positions hand-drafted, as was done in (Mortensen et al., 2012).
Site suitability assessment
The site suitability assessment (SSA) results for both islands are presented below. For Chatham Island, SSA focused on the Chatham wind farm as well as potential sites identified with excellent wind resources across the island, as shown in Figure 22. For Waiheke Island, in the absence of any existing wind project, the SSA focused on sites with excellent potential.
Potential wind farms with turbine sites distributed over different sites with class 7 wind resources on Chatham Island. The Vergnet GEV MP-C 30 WTG with a hub height of 55 m was used.
For the Chatham windfarm, in particular, Table 6 outlines the flow conditions calculated in WAsP Engineering and assessed with WAT. The 50-year extreme wind (
Site suitability assessment results of Chatham windfarm.
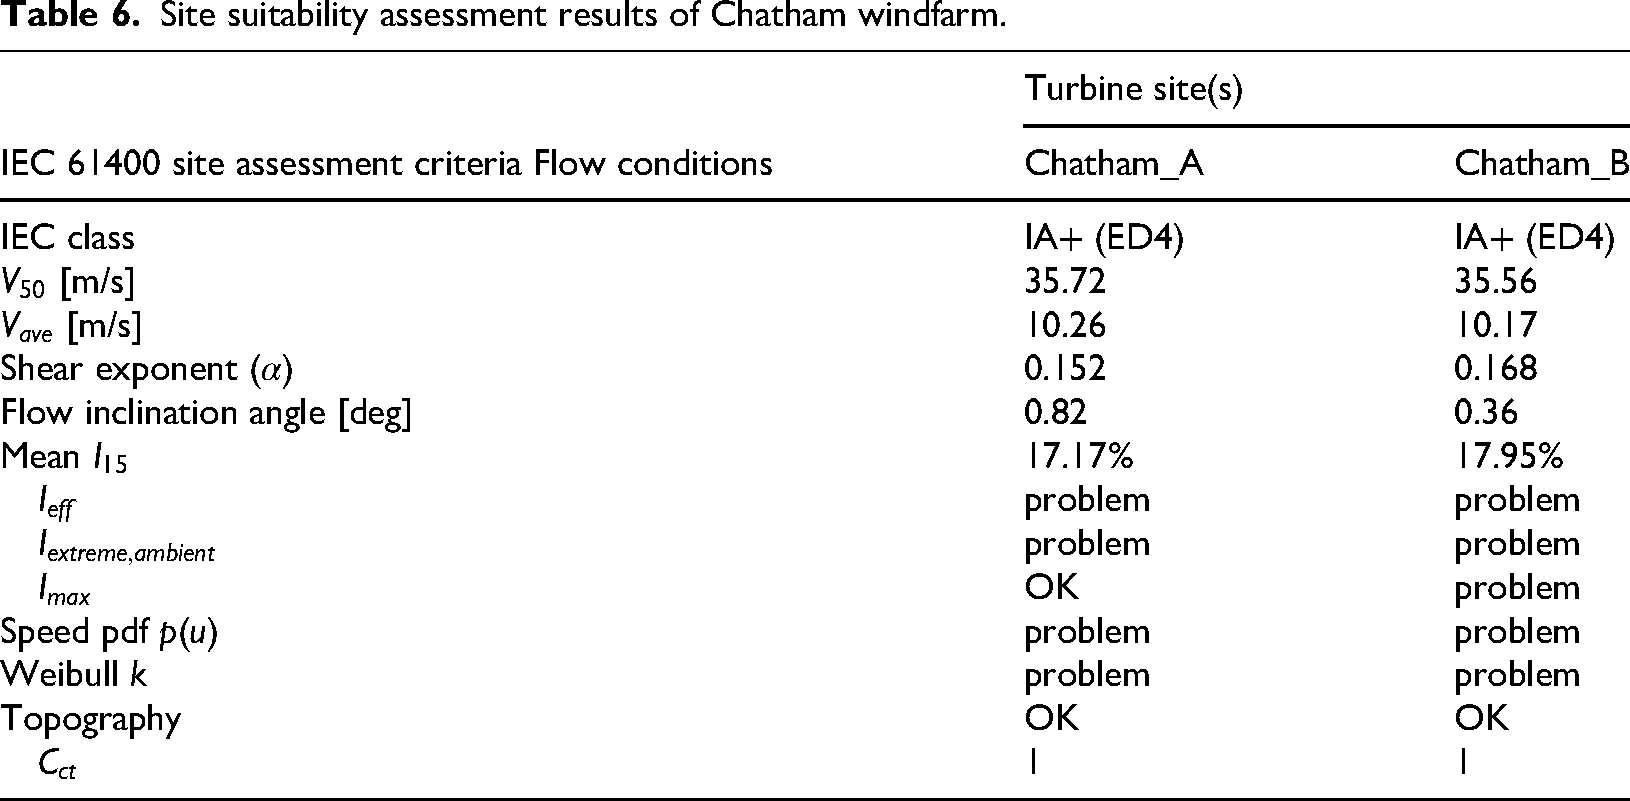
The wind shear exponents of 0.152 and 0.168 and flow inclination angles of 0.82° and 0.36° are both within the stipulated ranges. Assessment of the complexity of the surrounding terrain found topography to be “OK,” explaining why the turbulence structure correction factor (
Apart from the average wind speed (
Figure 23 shows the turbulence intensity (top) and wind speed probability distribution (bottom) curves for the Chatham A turbine site. As can be seen in the top figure, the all-sector effective turbulence intensity curve lies above the NTM A+ turbulence category. The A+ category is the highest (18%) measure that Class I WTG is expected to experience. This alludes to the WTGs at the Chatham wind farm experiencing turbulence higher than they are designed for.
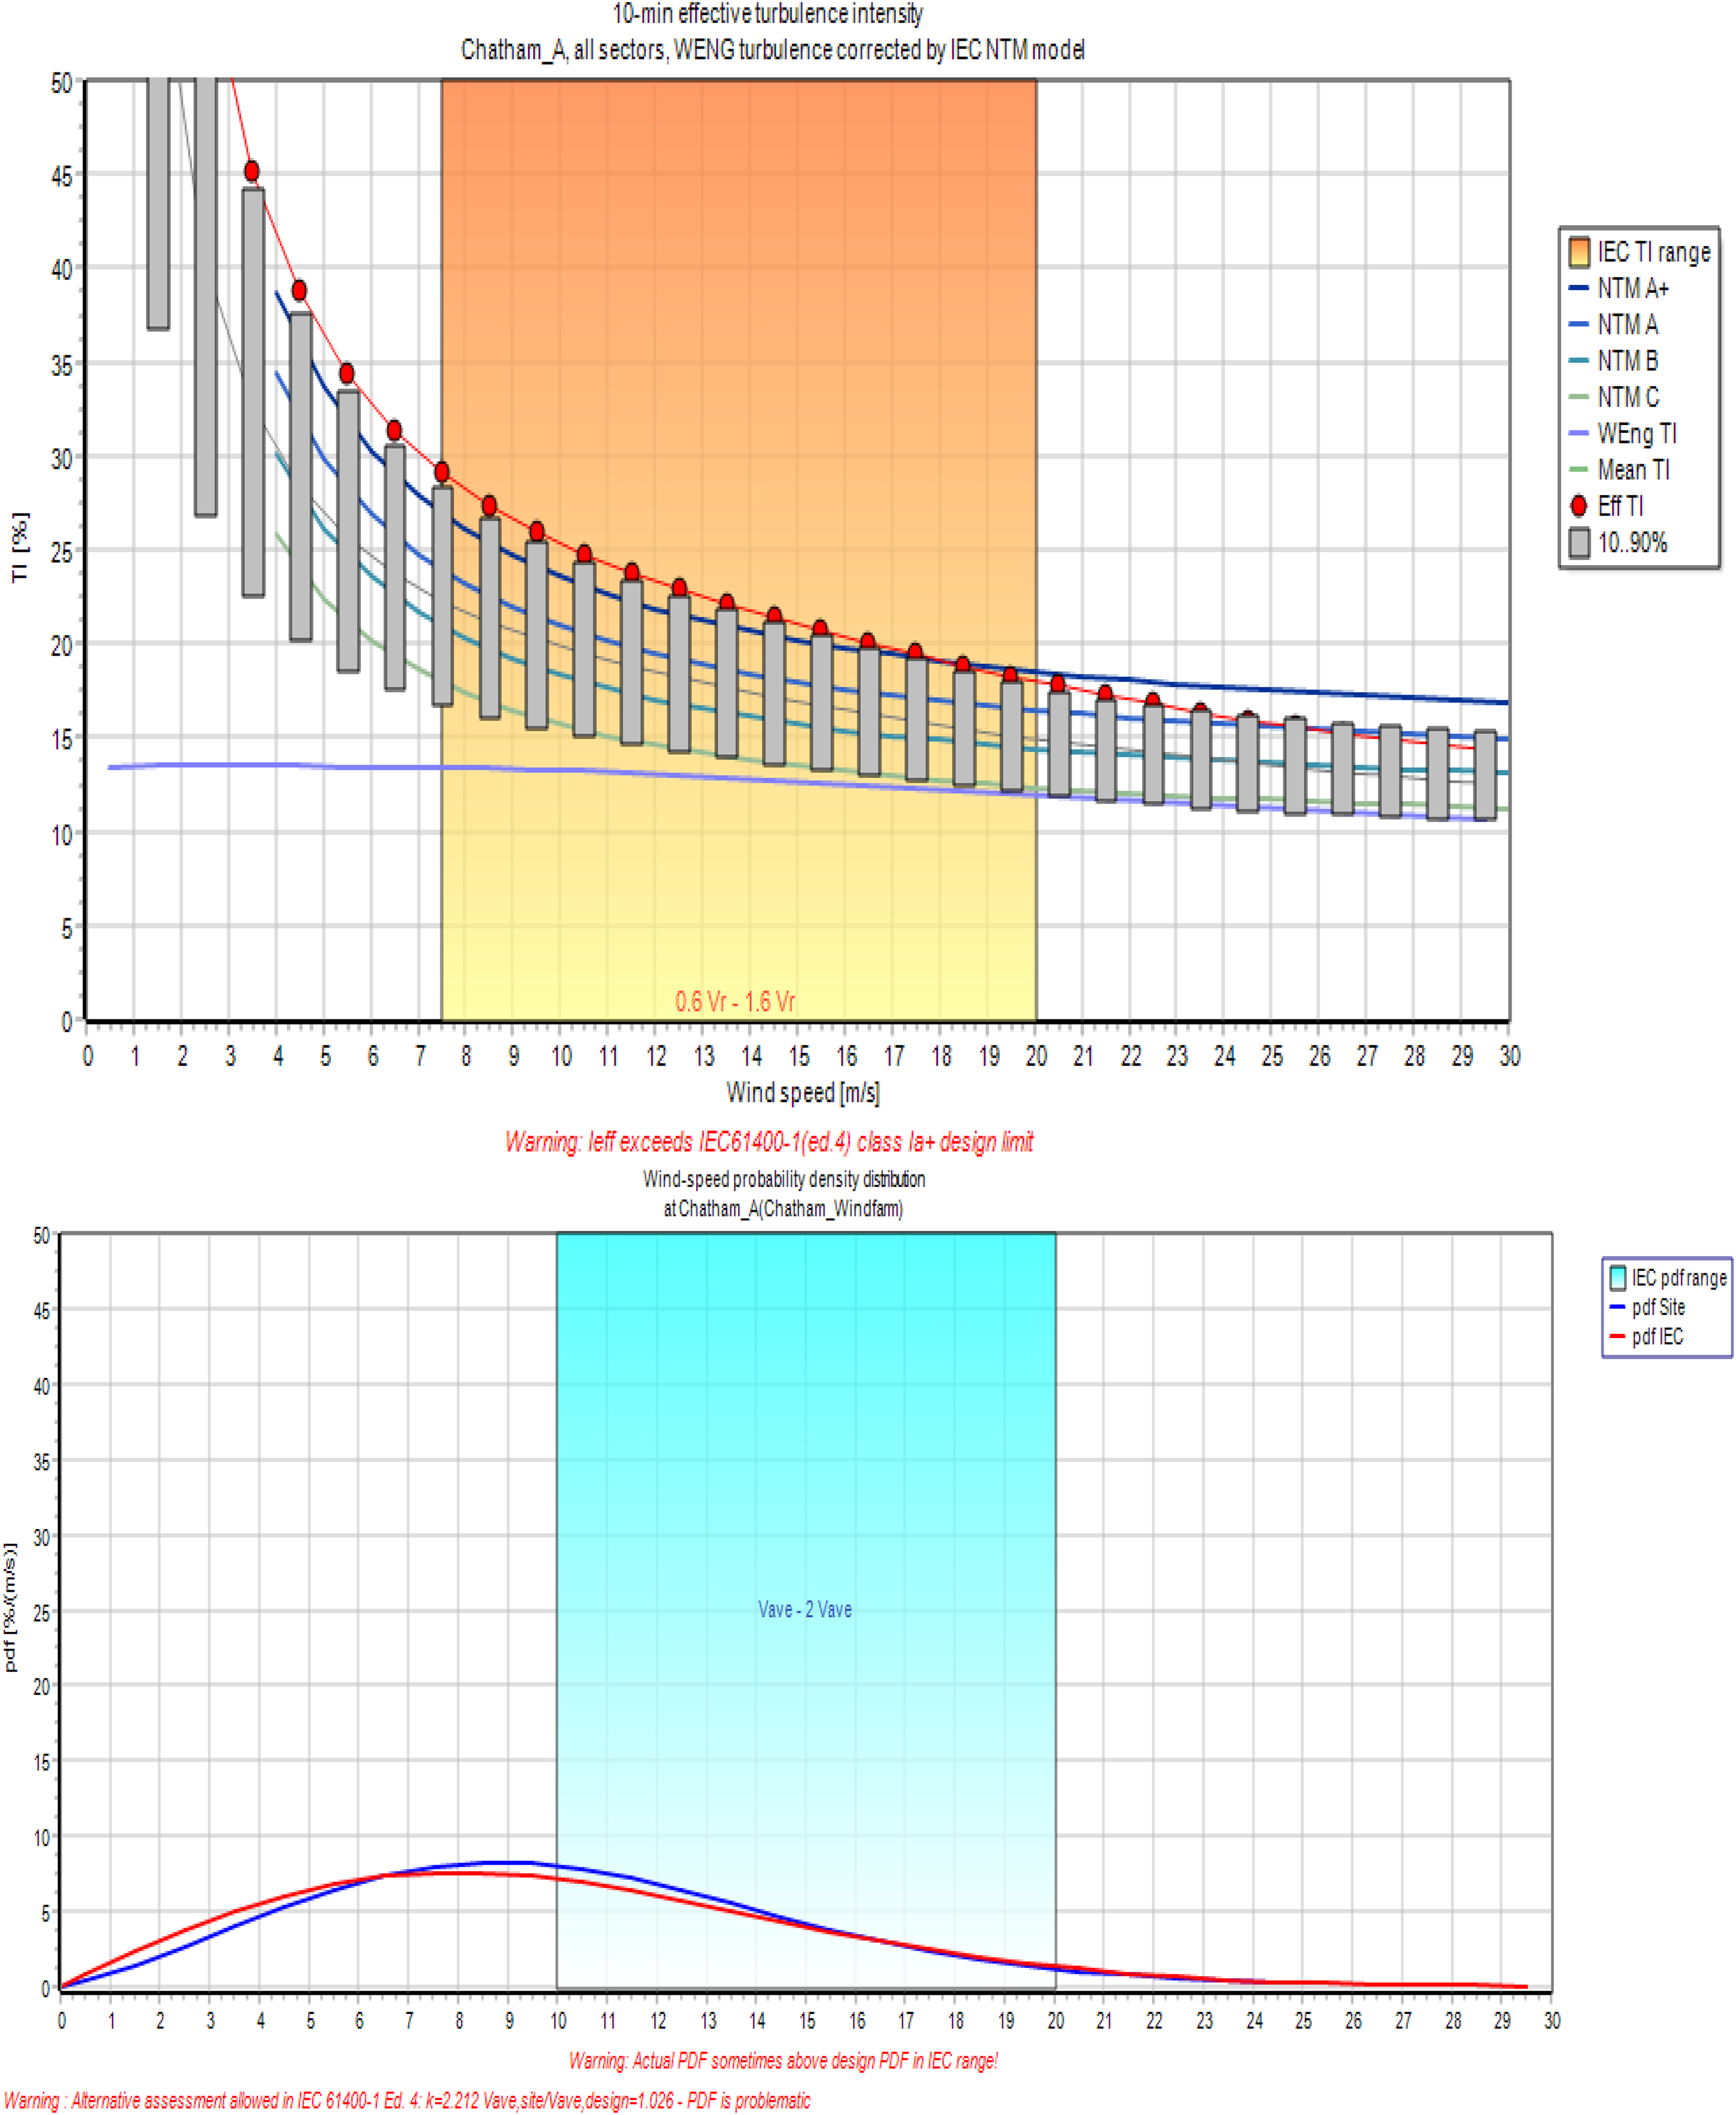
Top: Site and IEC turbulence intensity curves for Chatham A. Bottom: Site and IEC wind speed probability distribution curves.
Figure 23 (bottom) shows the comparison between the IEC and site probability distribution (
Similar information exists for Chatham B. From the assessment, no one site was found to meet all the SSA criteria for the Vergnet WTG used in the modeling. Considering the excellent nature of the wind resource on Chatham Island, a special class of WTG with a lower hub height than Vergnet WTG, designed to address the challenges with turbulence and speed distribution is recommended as a replacement. Another option is to relocate the wind farm to a lower mean wind speed area further inland.
On the other hand, in the absence of an existing wind project on Waiheke Island, wind farms have been sited as shown in Figure 24. The flow conditions show 14 windfarms with differing numbers of turbines being sited in regions with Wind Power Class 6 wind resource. Of these sites, only three show the most potential. These wind farm sites meet all SSA criteria except the probability distribution function
Potential wind farms with turbine sites distributed over different sites with class 6 wind resource on Waiheke Island. The Siemens SWT-2.3-82 WTG with a hub height of 80 m is used.
For most of the turbine sites, a class IIC turbine classification is sufficient because extreme wind speeds hover at or below 42.5 m/s, average wind speeds at or below 8.5 m/s, and turbulence intensities below 14% which are well within the IEC criteria.
Limitations
The resolution of the resource grids for Chatham and Waiheke Islands was limited to 125 m and 60 m. At resolutions lower than these, WAsP failed to solve, even with an increase in PC processing power. This limitation is probably a result of some built-in calculation constraints on student licenses or the computation power of the computer used. This same limitation was experienced with WAsP Engineering's domain structure resolution. A finer resolution size of 10 m, the initial project selection, would have been preferred.
These islands had only one meteorological station observing the wind. This made cross-prediction and cross-correlation analysis for the verification of the resource prediction accuracy impossible.
With the Chatham wind farm mothballed, there was no access to actual production data, or information on operational configurations, as was the case with the study on modeling wind flow over Chatham Island (Tonkin et al., 2017). Therefore, comparison of actual production data with simulation results could not be performed.
The simulation results may improve if wind data measurements at higher heights and closer to the hub-height of 55 m and 80 m would be used. Wind measurements at higher heights will reduce the effect of ground friction on the wind speed in comparison with wind speeds at lower heights of 10 m. Higher resolution elevation and roughness data than those used in this study via vector maps may also improve the simulation results.
Conclusions
A micro-scale wind resource and site suitability assessment (SSA) was conducted on Chatham and Waiheke Islands using three modeling tools: WAsP, WAsP Engineering, and Windfarm Assessment Tool (WAT). Observed wind data collected at Tuuta Airport (Chatham) and Passage Rock (Waiheke) over a nineteen (19) and eleven (11) year period, respectively, were used for the analysis.
The observed mean wind climate (OMWC) on Chatham Island depicts an all-sector omni-directional mean wind speed of 6.59 m/s and power density of 295 W/m2, with dominant south-easterly and north-easterly winds. The diurnal variation ranges between 5.9 m/s and 7.7 m/s. Seasonal variations depict spring and summer as the best performing seasons with peaks above 7.5 m/s at midday. The mean wind speed for Waiheke Island is 5.48 m/s with a power density of 204 W/m2. The diurnal variation ranges between 4.7 m/s and 6.6 m/s, with spring being the best performing season.
Resource grids were used via micro-siting to calculate the mean speed, power density, and AEP for both islands. Using the 55 m hub-height Vergnet GEV MP-C WTG, with rotor diameter spanning 32 m, the spatial variation of mean wind speed on Chatham Island ranged from 4.8 m/s to 14.80 m/s, AEP from 3.01 GWh/year to 13.87 GWh/year, and power density from 189 W/m2 to 3760 W/m2. The wind resource classification for a good portion of the island is Wind Power Class 7, with wind speed and power density greater than 8.7 m/s and 800 W/m2, respectively, at 55 m height. For Waiheke Island, the 80 m hub-height Siemens SWT-2.3-82 WTG was used. Mean wind speeds ranged from 5.3 m/s to 8.99 m/s, AEP from 2.93 GWh/year to 9.22 GWh/year, and power density from 167 W/m2 to 766 W/m2. A sparse portion of the island has a Wind Power Class 6 wind resource. The mean wind speed, the mean annual energy production (AEP), and the mean power density for Chatham and Waiheke Islands are 11.08 m/s, 7.14 m/s, and 11.873 GWh/year, 6.149 GWh/year, 1449 W/m2, and 406 W/m2, respectively.
Chatham wind farm can produce a total gross AEP of 2.78 GWh/year, total net AEP of 2.73 GWh/year, with a proportional wake loss of 1.85%. SSA shows that the wind farm site is not suitable given that the turbine sites experience mean wind speeds and turbulence higher than the IEC 61400 standard recommendation. The SSA conducted at other potential wind farms on Chatham Island, especially in locations with class 7 wind resource, show that WTGs of 55 m hub height will experience mean wind speeds and turbulence higher than IEC Class IA (the highest WTG classification). WTGs with lower hub heights and specially designed to address challenges with turbulence, even in “complex” terrain, are solutions to explore.
Waiheke Island has a sparse distribution of sites with Class 6 wind resource. The SSA conducted on potential wind farms sited shows that, of the fourteen (14) sites considered, three (3) have very good site feasibility for siting class IIC WTGs.
For a successful wind farm, special consideration needs to be given due to the complexity of the terrain in these sites. Solutions to explore include wind turbine generators with lower hub-heights designed to address the challenges with turbulence intensity.
Footnotes
Acknowledgments
The lead author was the recipient of scholarship funding from the New Zealand Ministry of Foreign Affairs and Trade (NZMFAT). The authors gratefully acknowledge the NIWA and MetraWeather for providing the ground-based wind data measurements from AWSs on Chatham and Waiheke Islands, the Department of Wind Energy of the Denmark Technical University for providing a student license for the wind simulation software package WAsP, WAsP Engineering, and WAT.
Contribution list
Enigbe S. Ocheklie—conceptualization, methodology, software, formal analysis, visualization, investigation, and writing—original draft. Kunal K. Dayal: conceptualization, methodology, software, investigation, writing—original draft, writing—review and editing, supervision. Rajnish N. Sharma: writing—review and editing, supervision.
Funding
The authors received no financial support for the research, authorship, and/or publication of this article.
Declaration of conflicting interests
The authors declared no potential conflicts of interest with respect to the research, authorship, and/or publication of this article.
Data availability
With a valid login, users can access Chatham Island's data from the URL (https://cliflo.niwa.co.nz/) provided. Waiheke Island's data can be purchased from MetraWeather (MetraWeather, 2025).