
Abstract
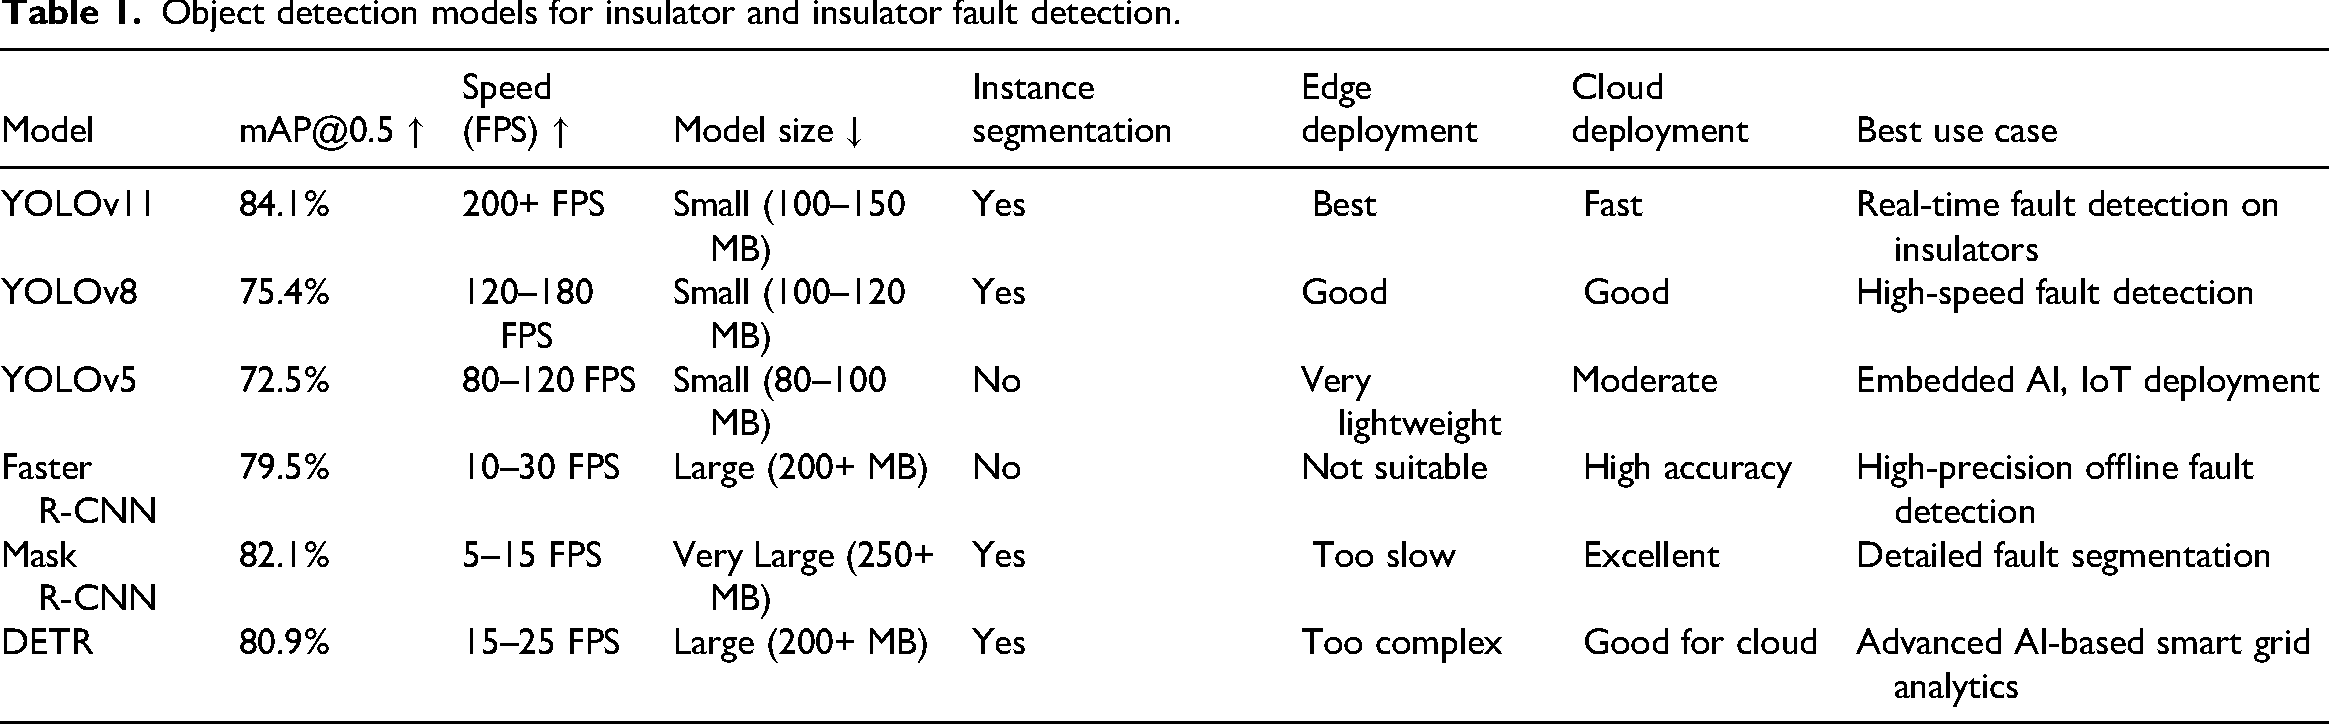
Ensuring the reliability and stability of smart grids heavily depends on the condition of insulators and their structural bindings. Faults such as cracks, contamination, and binding failures can lead to severe consequences, including power outages, equipment degradation, and increased maintenance costs. Traditional fault detection methods, which rely on manual inspection and basic image-processing techniques, are often inefficient, labor-intensive, and prone to errors. To address these challenges, this study presents an advanced deep-learning-based fault diagnosis system utilizing YOLOv11 with instance segmentation for precise and real-time detection of insulators and binding defects in smart grids. A comprehensive dataset of 1320 high-resolution images of insulators and bindings was created, encompassing diverse environmental conditions and labeled with pixel-wise segmentation masks for precise fault localization. The YOLOv11 model was trained and validated on this dataset using advanced data augmentation techniques such as rotation, flipping, and brightness variations to enhance robustness. The proposed YOLOv11-based system achieved a mean average precision (mAP) of 84.1% at an IoU threshold of 0.5, outperforming YOLOv8 (75.4%), YOLOv5 (72.5%), faster R-CNN (79.5%), and mask R-CNN (82.1%). Additionally, the model operates at an inference speed exceeding 200 frames per second (FPS), making it highly suitable for real-time deployment on edge computing devices, unmanned aerial vehicles, supervisory control and data acquisition systems, and smart grid monitoring stations. Unlike previous deep-learning approaches that primarily rely on bounding box detection, the proposed system integrates instance segmentation, allowing for pixel-level identification of defect regions. This enables more accurate fault assessment, reduces false positives, and enhances predictive maintenance strategies. The high detection speed and accuracy make this model a viable solution for automated smart grid fault diagnostics, reducing reliance on manual inspections and mitigating potential failures before they occur. Future research will focus on optimizing the model for low-power edge computing devices, incorporating multi-sensor fusion techniques (thermal, LiDAR, infrared), and extending its capabilities to detect a broader range of smart grid faults. By bridging the gap between high accuracy, real-time performance, and deployability, this work establishes a new benchmark for AI-driven fault detection in smart grids.
Keywords
Introduction
In modern energy systems, the smart grid infrastructure must be reliable for an uninterrupted power supply. Insulator faults such as cracks, dirt accumulation, and breakage, pose serious threats to grid stability that may cause outages and expensive maintenance. Manual inspection and other traditional fault diagnosis methods like rule-based image processing are exploited in labor, and they are insufficient for real-time applications. The evolution of deep learning algorithms, especially in the field of instance segmentation, can potentially offer solutions to automated and extremely precise fault detection. In this article, we introduced an advanced state-of-the-art methodology using YOLOv11-Seg for real-time fault diagnosis of smart grid insulators and bindings.
Object detection models for insulator and insulator fault detection.
Research contributions related to the model
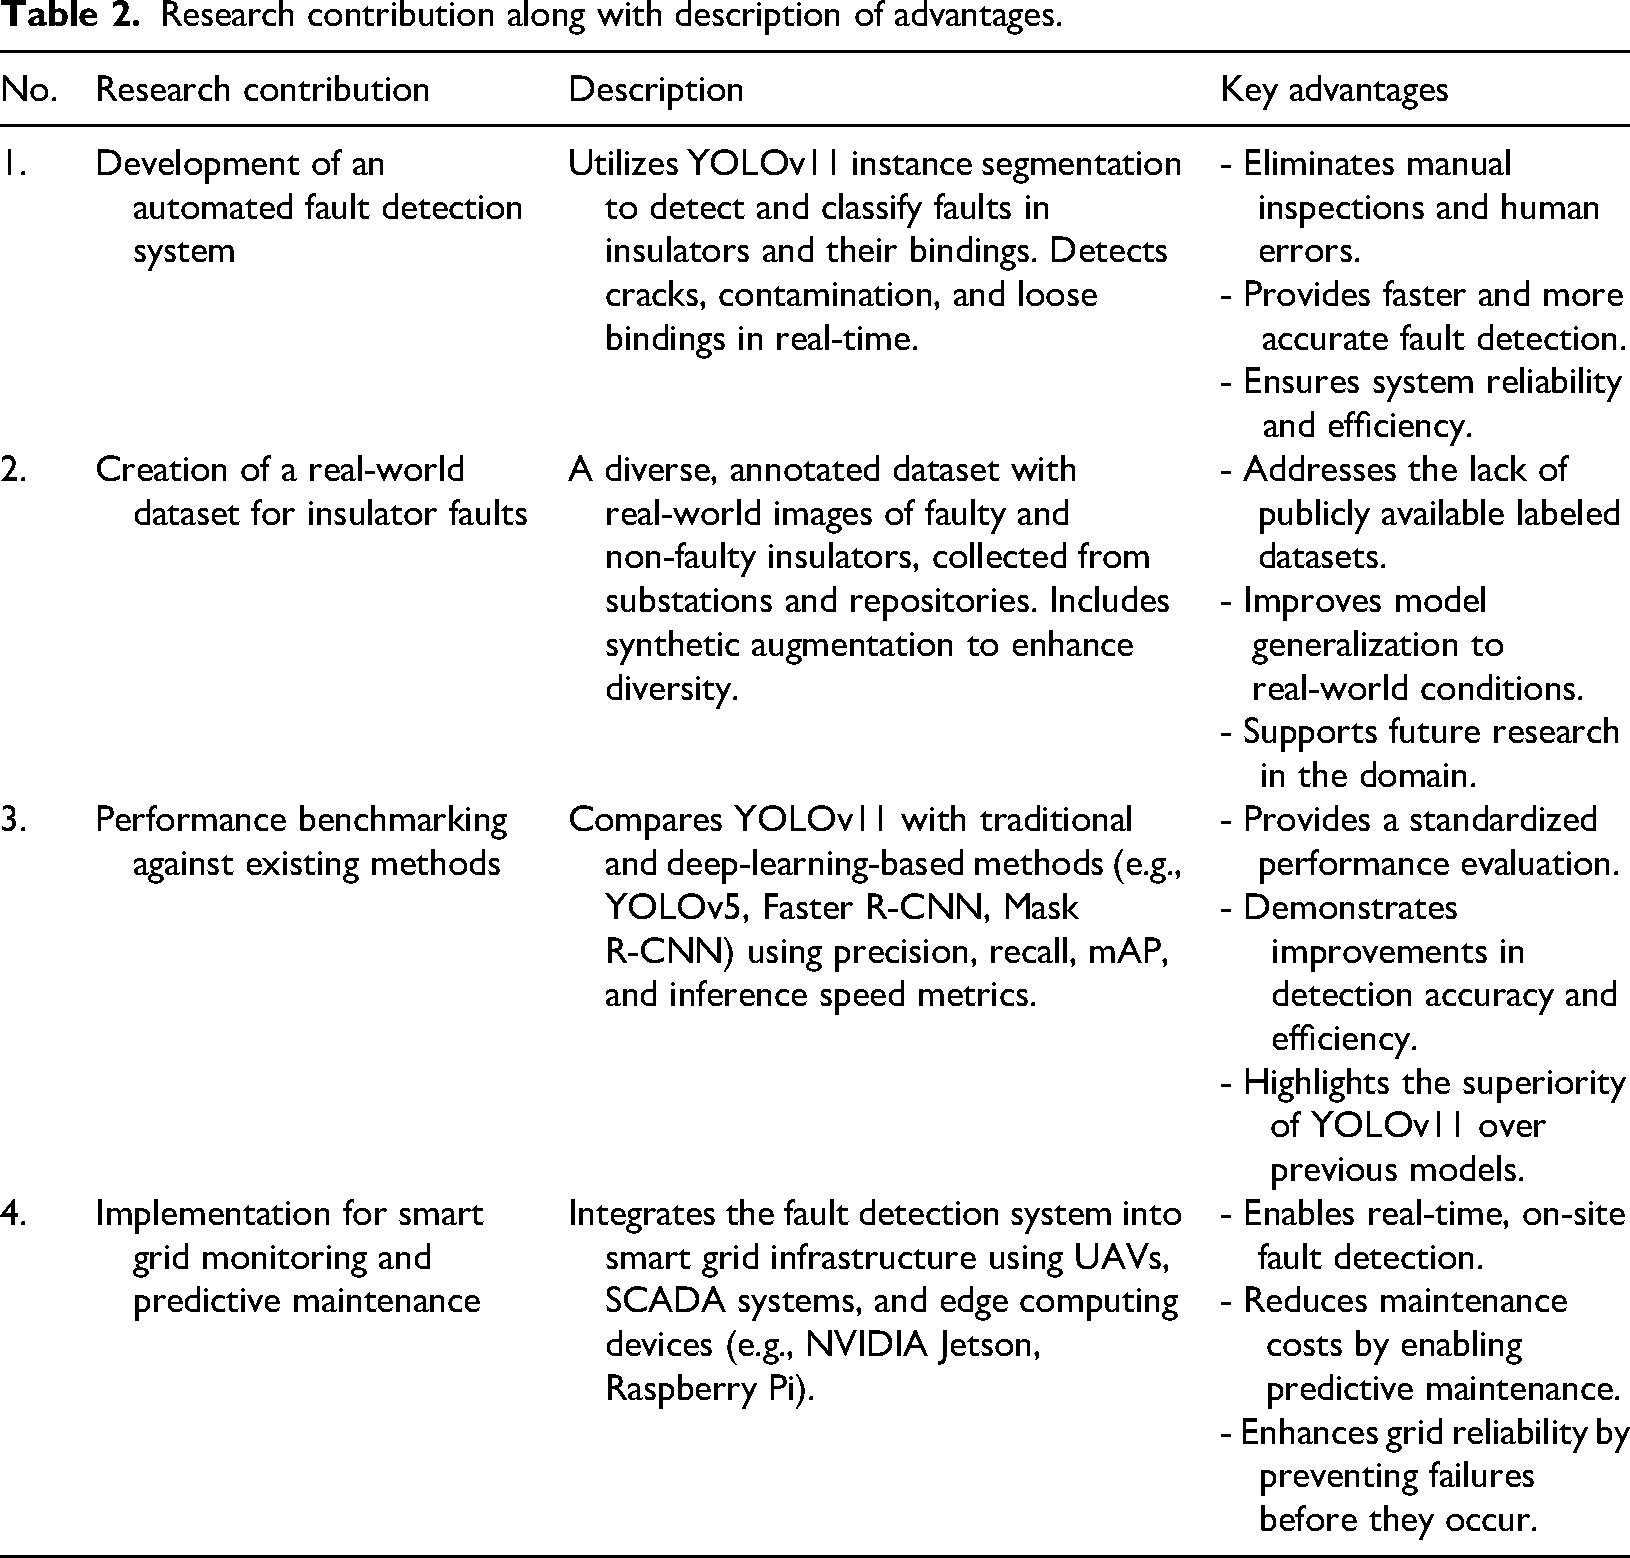
The significance of this study lies in its contributions to the development of AI-based automated power grid inspection systems that would enhance the efficiency, reliability, and accuracy of their operation as tabulated in Table 2.
Research contribution along with description of advantages.
Literature review
The inspection and maintenance of high-voltage transmission line insulators are critical for ensuring the reliability and safety of power systems. Current advancements in deep learning, mostly in object detection and diagnosis of fault have significantly improved the automation of insulator defect detection. This literature review synthesizes key studies that leverage deep learning techniques, focusing on YOLO-based models, convolutional neural networks (CNNs), and other advanced approaches to address challenges in insulator fault detection, including complex backgrounds, limited datasets, and real-time processing requirements.
YOLO-based approaches for insulator detectio
Due to several advancements to identify faults in insulators with the help of the YOLO (You Only Look Once) object detection system operating on UAVs, with insurmountable difficulties to face varying scales and complex backgrounds. Liu et al. (2021a, 2021b, 2021c) proposed a modified YOLOv3 model enhanced with Dense Blocks allows better feature propagation and reuse which results in a mean average precision (mAP) of 94.47%, overcomes the standard YOLOv3 (90.31%) and YOLOv2 (83.43%). In another study, Liu et al. (2021a, 2021b, 2021c) Spatial Pyramid Pooling (SPP) into YOLOv3 which supports multiscale prediction which obtains high accuracy by minimizes the memory usage to 225 MB. Wang et al. (2024) proposed an ML-YOLOv5 model approach which integrates a Multi-Scale Feature Pyramid Network (MFPN) and in depth separable convolutions which help to minimize the model parameters by 46.9% computational cost (FLOPs) by 43.0%. Fahim and Hasan (2024) highlighted the detecting insulator faults such as breakage and flashovers by YOLOv8's effectiveness in attaining an mAP of 99.10% observed on a defect dataset. Additionally, Chang et al. (2023) designed a innovative approach YOLOv7-C3C2-GAM, which merges a global module with UAV operations leads to a accuracy gain 0.5% over the baseline of YOLOv7. Another lightweight model, YOLO-S, introduced by Wang et al. (2023) and Zheng et al. (2025a), utilized GSConv and MaECA modules to improve mAP by 4.2% compared to YOLOv5 s. CSPD-YOLO, also by Liu et al. (2021a, 2021b, 2021c), using a Cross Stage Partial Network attains an enhancement in mAP 4.9%, with a slight latency of 0.011 s. Further improvements which includes a version of YOLOv5 optimized with MobileNet-V3 and a Bidirectional Feature Pyramid Network (BiFPN) which helps to achieve a recall of 84.10% and accuracy of 92.89% (Huang and Wan, 2024). Wang et al. (2023) and Zheng et al. (2025a) further optimized YOLOv4 by using data augmentation and K-means for anchor box tuning, attain a accuracy gain of 37.2% and a mAP of 99.08% at 56 FPS. Zan et al. (2023) improved on YOLOv4-tiny with MobileViT and coordinated attention in their ILYTN model, achieving a mAP 1.64% boost. Dai (2022) proposed an YOLOD approach, based on YOLOX, with random estimation in bounding box predictions due to deficient in capabilities of instance segmentation.
Convolutional neural networks and other deep learning approaches
Past YOLO-based models, CNNs and other architectures have been explored for insulator fault detection. To enhance fuzzy UAV images, Chen et al. (2019) employed YOLOv3 with Super-Resolution CNN (SRCNN) attained high accuracy and real-time performance (Chen et al., 2019). Sampedro et al. (2019) proposed an up-net fully CNN model with skip connections and GAN-based training which enables accurate insulator string segmentation and diagnosis the defects via Siamese CNN. Jiang et al. (2019) presented an innovative learning approach with multi-level perception using Single Shot Multi-Box Detector (SSD), attaining a precision of 91.23% and recall of 93.69% (Jiang et al., 2019). Yang et al. (2019) employed a deep CNN model for insulator self-shattering detection which attains identification rate 98.53% on real-world UAV images (Yang et al., 2019). Zhao et al. (2019) A improved Faster R-CNN with anchor generation and non-maximum suppression model obtains an average precision of 0.818. Shanmugapriya and Baskaran (2023) proposed ResNet-50 with Phasor Measurement Units (PMUs) for fault detection which achieved 98.5% classification precision and 99.1% accuracy. Zhang et al. (2019) proposed an adaptive threshold segmentation and square wave transformation for UAV-based conductor fault detection which achieved accuracy 92.05% for surface defects. Devaraj et al. (2024) merge the deep forests, SVM, and neural networks for detection of faults, to achieve a 98.57% accuracy rate.
Handling limited data and imbalanced samples
In insulator fault detection major addressing challenges are limited datasets and imbalanced samples. Pang et al. (2024) proposed a framework called Pi-index with positive-unlabeled (PU) learning and focal loss to reduce incomplete annotations and sample imbalances which are the outcoming baseline methods (Pang et al., 2024). Das et al. (n.d.) conducted a comparative study of object detection models for incipient fault detection, emphasizing the importance of transfer learning with limited data (Das et al., n.d.). Liu et al. (2023) studies on insulator defect detection which highlights the preprocessing algorithms and multi-task approaches to improve model effectiveness and data availability (Liu et al., 2023).
Emerging trends and broader applications
In the Recent studies integration of lightweight models and multi-sensor integration have a wider application. Liu et al. (2024) discussed on EMB-YOLO for electric meter box defect detection to reduce model size by 20.3% and achieved a mAP of 82.8% at 343 FPS (Liu et al., 2024). Rezapour et al. (2023) discussed identifying the faults in power grids by using AI, Zheng et al. (2023, 2024) explored lightweight models by merging MobileViT and MobileRaT for drone communication systems, indicating possible cross-domain applications (Zheng et al., 2023, 2024). Zheng et al. (2025b) proposed about automatic modulation classification which highlights the deep learning's role in signal processing (Zheng et al., 2025b). Liu et al. (2025) proposed multi-scale feature hierarchies in detection transformer (DETR), which helps to suggest an improvement in object detection tasks (Liu et al., 2025). Wang et al. (2023) and Zheng et al. (2025a) proposed an advanced error-based regularization method for lung cancer diagnosis, demonstrating deep learning's versatility in feature extraction (Wang et al., 2023; Zheng et al., 2025a). These reviewed studies demonstrate substantial advancements in deep learning-based insulator fault detection, with YOLO-based models which are prioritized due to their balance of speed and accuracy. Instance segmentation, multi-scale feature fusion, and attention mechanisms are the innovations which help to enhance the detection and precision, while lightweight models and multi-UAV systems improve deployability. Major Challenges such as limited number of datasets and imbalanced samples need to be addressed through novel frameworks and data augmentation. Future research should be focused on edge computing optimization and multi-sensor integration to enhance real-time fault detection in smart grids.
Methodology
The methodology behind this study is concerned with developing a more sophisticated system for detection and fault identification for insulators and insulator bindings in smart grids via instance segmentation using YOLOv11. Basically, the work involves several steps: data acquisition, pre-processing, training of the model, testing, and eventually deployment for online monitoring. The overall methodology has been subdivided as follows:
Data acquisition for fault detection on insulators and insulator bindings
Data acquisition and assembling a good diverse dataset are the primary requirements for successful training and validation of deep learning models, particularly in fault detection applications. The remaining sections will provide an overview of the specific data acquisition, annotation, and preprocessing procedures used in the present research.
Data collection
Data collection for fault detection may be varied, while at the same time ensuring that the manifold dataset captures many real-world scenarios-from live power grid substations where UAVs (or drones) were deployed for aerial inspections that allow for robust model training-to that of capturing high-definition images of insulator components using RGB cameras and thermal cameras in the visible and infrared spectra. This data is collected based on weather conditions, fault types, multiple angles, and healthy insulators to train the model to see what a fault-free image looks like.
Publicly available datasets such as IEEE Data port, NREL, Roboflow, and Kaggle were also used to augment the data captured by UAVs. These datasets contained 1320 high resolution images of insulators of different voltage levels in varying environmental conditions and with differing fault types.
Fault types and labels
The collected images represent various fault types characteristic of power grid insulators. These, having been classified and labeled, formed training and testing sets used for a particular deep learning model. The major fault categories are:
Cracks: Fractures or splitting across the surface of an insulator. Contaminants: Any substances like dirt, dust, and anything else that would impact the service condition of the insulator. Loose fits: Mechanical spaces that hold the insulator and have some grooves/slides. Signs of electrical discharge: Clearly observable traces of electrical surge discharge or sparking on the insulating surface, generally indicated by burn or scorch marks. Corrosion and wear: Gradual deterioration by the environment.
The images were collected with bounding box annotations indicating the region of interest (ROI) for these faults. A cracked insulator, for instance, would have a bounding box around the crack marked with the type of fault (“break”). Along with the bounding box annotations, instance segmentation masks were also done, marking all the pixels in the fault area considered in the annotation process to allow detailed annotations for the training of the model as shown in Figure 1.

Data set for insulator binding and on insulators for various faults and healthy conditions.
Data annotation
Data annotation for supervised learning is key to any project. Since YOLOv11 is an instance segmentation model, it requires pixel-level annotation so that the model can precisely identify and segment faults. The data annotation procedure is as follows.
Bounding box annotation
The general location of faults was first annotated with bounding boxes; these boxes are a first-level detection feature assisting the model in localizing potential faults in the image. Each bounding box was labeled with one of the fault categories (e.g., “break,” “good,” “bind with no standard,” “binding,” etc.) as shown in Figure 2. Each bounding box has its class name and top-left and bottom-right corner coordinates recorded.

Annotations for different faulty and healthy conditions.
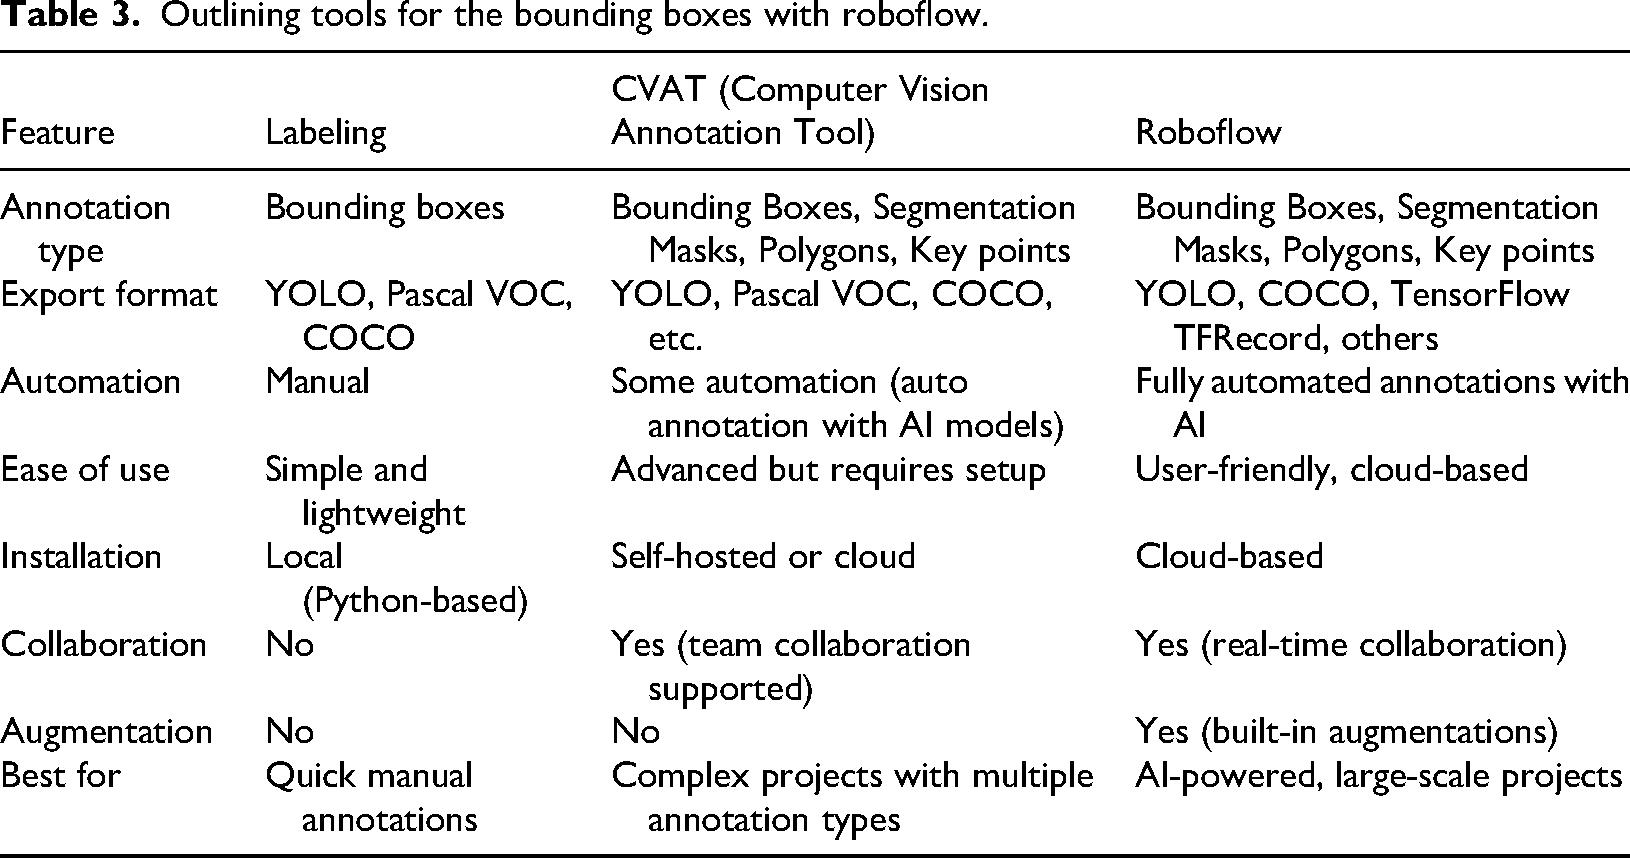
Different outlining tools for bounding boxes for exporting the annotations in YOLOV11 are shown in Table 3.
Outlining tools for the bounding boxes with roboflow.
Instance segmentation masks
In instance segmentation, the process of annotating pixel-level masks adds a level of detail that systematically describes the exact area of the fault. Just as an example, a crack in the insulator need not be rectangular, and it may require a polygonal mask that truly conforms to the shape of the fault. This kind of fine segmentation detail becomes more important in fault severity assessment. Without this detail, it may become extremely difficult to detect fine cracks, minor contaminations, or light electrical discharge marks that might lead to greater failures. Segmentation Mask format will be in a binary mask which is created with pixels corresponding to the object having a value of 1 and everything else having a value of 0. For YOLOv11, the segmentation mask will be saved along with the bounding box annotations using tools LabelMe and CVAT.
Ground truth annotation
A ground truth annotation is a bounding box for object detection (e.g., insulator faults like cracks or breakages) is typically characterized as a rectangle around an object in an image. The standard formula for a bounding box in a 2D image is defined by four coordinates: [xtl,ytl,xbr,ybr] or [xmin,ymin,xmax,ymax]. xtl, ytl determine top-left corner coordinates (pixel position in the image), and xbr, ybr determine bottom-right corner coordinates. Alternatively, some formats use xmin,ymin which minimum x and y coordinates (top-left), xmax, ymax which maximum x and y coordinates (bottom-right).Annotations for 1642 instances across 1320 images were created using LabelMe and CVAT, comprising bounding boxes [xmin,ymin,xmax,ymax] for localization and binary segmentation masks (fault pixels = 1, background = 0) for pixel-level delineation. This supports YOLOv11-Seg's instance segmentation, enabling fault detection and severity assessment (Figure 3).
Segmentation masks for fault severity assessment.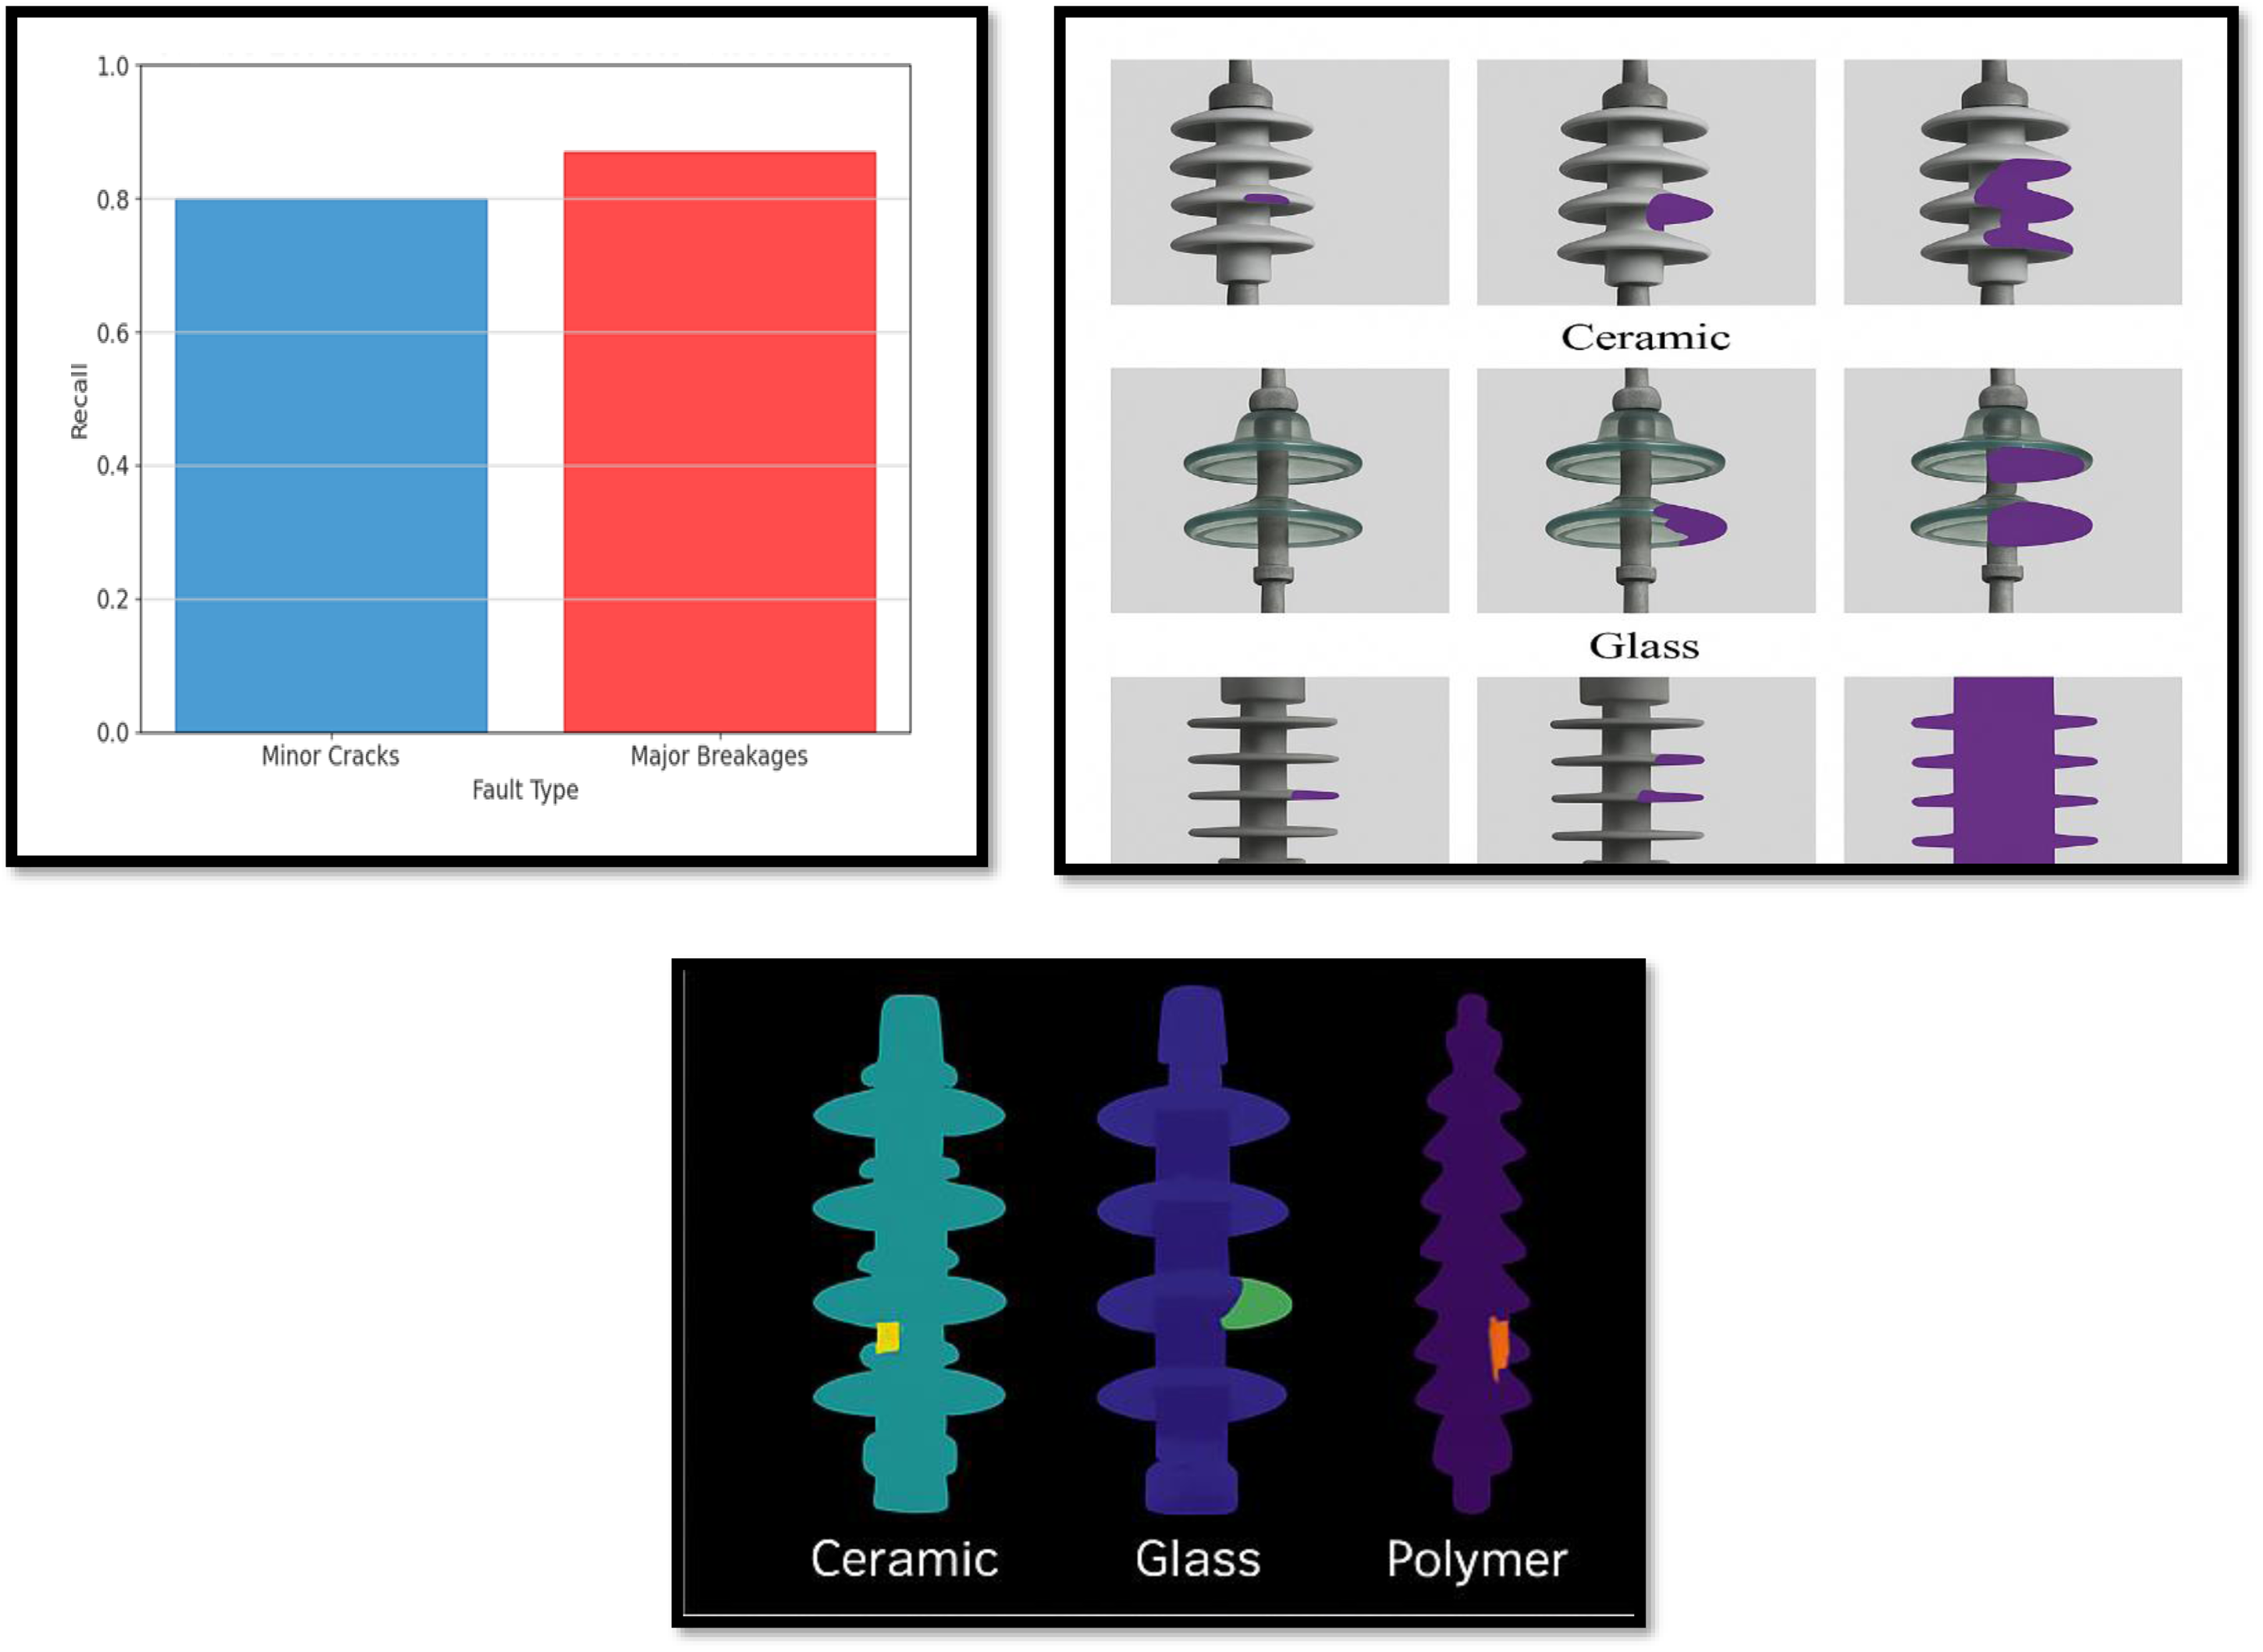
Bounding box-derived properties: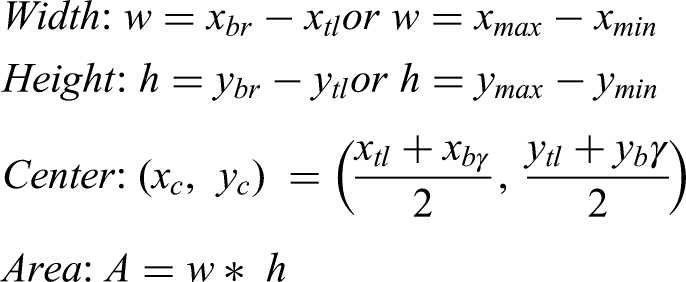
Intersection over union (IoU) for evaluation: Intersection is the Overlapping region between ground truth box A and predicted box B. Union is the total area of A and B, minus intersection. IoU ranges from 0 (no overlap) to 1 (perfect overlap). mAP@0.5 (e.g., 84.1% in Figure 4) uses IoU ≥ 0.5 as a threshold. It is used to compare predicted bounding boxes with ground truth (e.g., for YOLOv11-Seg, Section “Experimental validation”). Multi-sensor fault detection.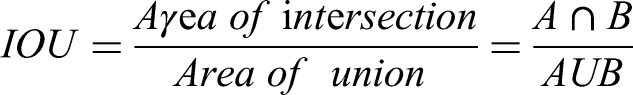
LabelMe bounding box annotation: LabelMe is developed by MIT CSAIL, stores annotations in JSON format, including bounding boxes for object detection tasks like insulator fault detection.
A bounding box is stored as a rectangle with two points: [x1,y1] (top-left) and [x2,y2] (bottom-right).
Data preprocessing
Deep-learning-based insulator fault detection dataset preparation phase lies in the preprocessing envisioned for normalization, enhancement, and augmentation of the datasets to ensure robust model behavior, accuracy, and generalization. After the annotation of the dataset, it underwent various preprocessing stages to make it suitable for the training pipeline of YOLOv11.
Image resizing and normalization
All images are of different resolutions, aspect ratios, and color spaces because they are collected from different sources including UAVs, surveillance cameras, and public datasets. To achieve uniformity for effective model training, an automated rescaling and normalization process was done to all images. All images were rescaled to the standard input size of YOLO, 640 pixels × 640 pixels. This size represents a compromise between performance and computational resource-saving capabilities. The pixel value normalization was done to reach the range of [0, 1] to ensure a stable and faster convergence during the training process. Further conversion of images to RGB format was made so that all images share a common color representation.
Data augmentation
To avoid overfitting and guarantee that the model is able to generalize to new, previously unknown data, several augmentation techniques were applied like rotating at random in the range of −30° to +30° to mimic different angles of stare, flipping for the purpose of different view spots, varying brightness and contrast for simulated lighting conditions to account for real-life environmental considerations like cloudy days or night inspection, cropping to simulate occlusions, and padding to preserve the original aspect ratio of the images. Based on prior literature (e.g., Liu et al., 2021a, 2021b) and domain expertise, these techniques were selected to simulate real-world inspection scenarios, such as UAV camera angle variations and environmental challenges like low visibility. Excision studies confirmed that these augmentations improved the mean average precision (mAP) by 5.2% compared to non-augmented datasets. This includes adding random Gaussian blur and noise to the images, simulating situations of low visibility, e.g., during rainfall or smoke ambience. Techniques like rain, fog, and snow were introduced in some images to mimic extreme weather conditions, thus adding more variability to the dataset. Augmentation includes rotation (θ∈[−30β,30β]), flipping, brightness/contrast adjustments, and weather simulations (e.g., fog), improving mAP by 5.2% (Section “Experimental validation”).
Mathematical formulation for image preprocessing and augmentation
Normalization: In normalization pixel intensities I (e.g., RGB values of insulator images) normalized to the range [0, 1]. For a 640 × 640 image (Section “Data collection”), each pixel's intensity is scaled, enhancing YOLOv11-Seg's consistency across visual, thermal, and UV modalities (Figure 4).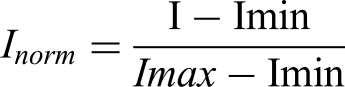
Resizing: In resizing an image I resizes to new coordinates (x′,y′) using interpolation weights Wi,j (e.g., bilinear interpolation). To normalize input for YOLOv11-Seg, ensures uniform bounding box annotations (e.g., Figures 5, 6) dataset, images are resized to 640 × 640 pixels (Section “Image resizing and normalization”). Predicted faulty and healthy images with bounding boxes and labeling the classes. Comparison of YOLOv11 with other object detection models.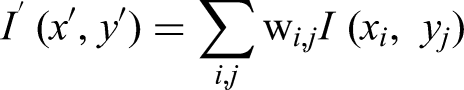

Rotation: In rotation an image rotates around a center point (xc,yc) by angle θ which applied as data augmentation to simulate varying insulator orientations under adverse conditions (Figure 7), improving YOLOv11-Seg's robustness (mAP 79.9%–82.3%, Section “Robustness under adverse conditions”). Robustness under adverse conditions (rain, fog, low light, occlusion).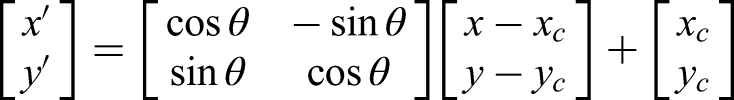
Brightness adjustment:
Gaussian Blur: In Gaussian Blur, Scales pixel intensities I by factor α, simulating lighting variations (e.g., low light in Figure 7). For insulator images, this enhances model generalization across diverse conditions, maintaining fault detection accuracy (e.g., recall 0.80–0.87, Figure 3)
Convolves image I with a Gaussian kernel G(σ), where σ is the standard deviation. Simulates foggy conditions (Figure 7) or sensor noise in thermal/UV images (Figure 4), testing YOLOv11-Seg's robustness (mAP 81.8% for fog).
Dataset organization and splitting
Ensure the dataset is organized in a format compatible with YOLOv11. A typical directory structure would look like the one shown in Figure 8(a).
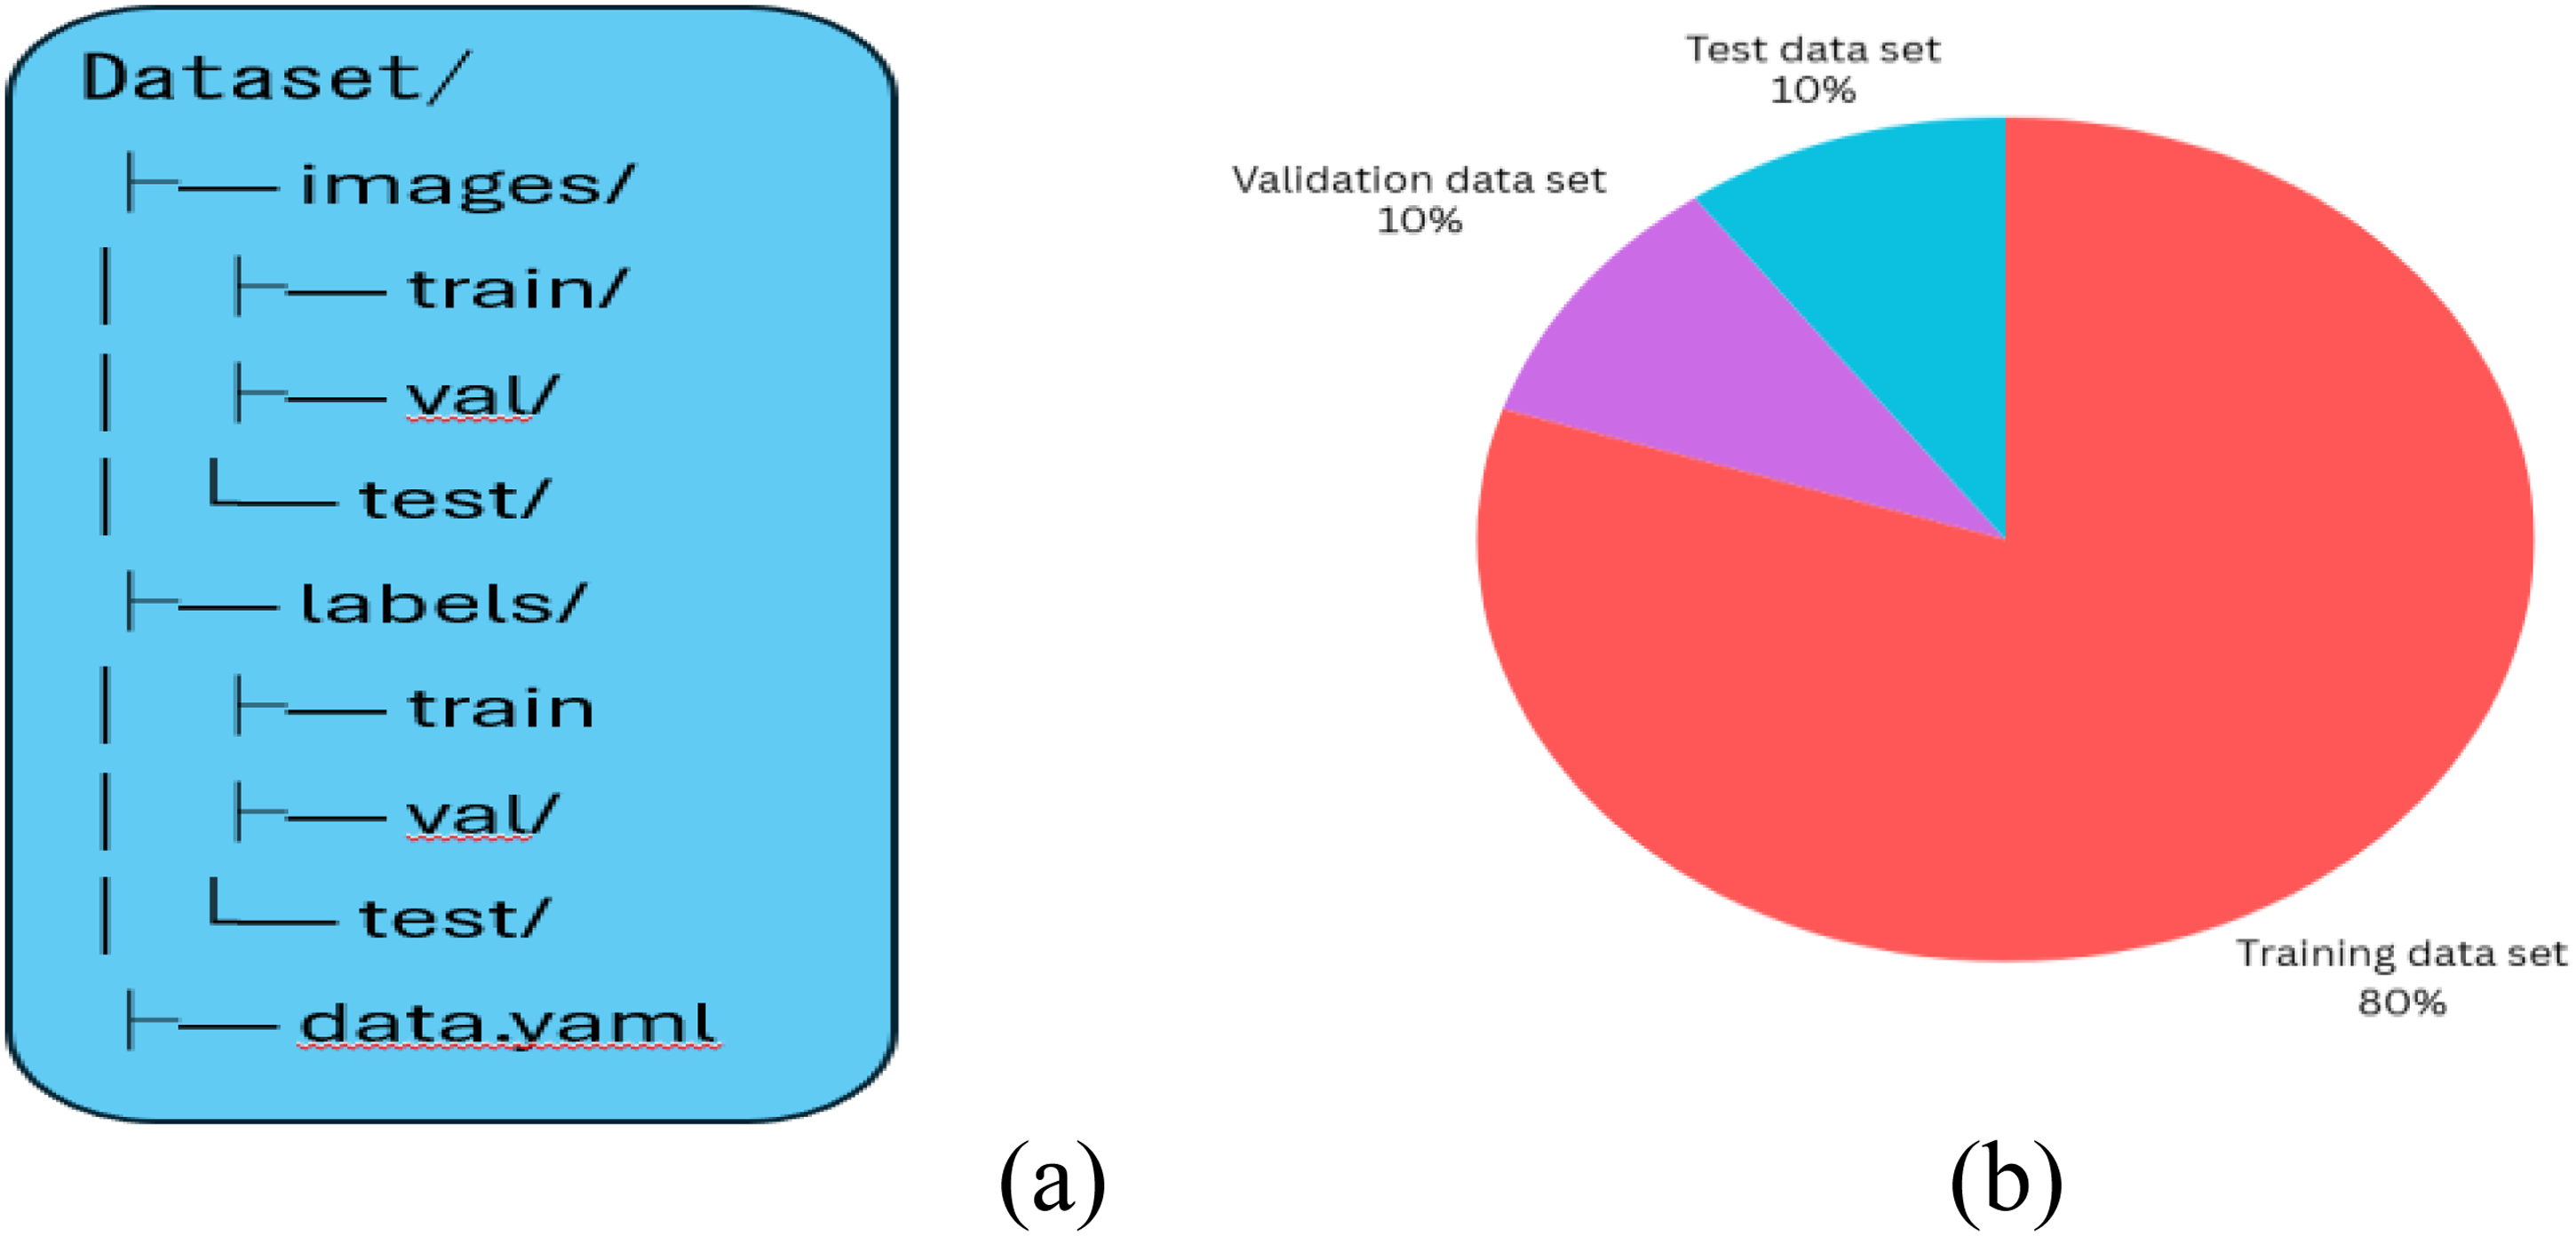
(A) Data structure format for data set with YOLOv11; (b) data splitting to train and predict.
The dataset is then split into a training set after annotations and construction. This set contains (80%, 1056 images) of the data needed to train the model (Figure 8(b)). By utilizing a validation set (10%, 132 images), one may evaluate the model's performance during training and make hyperparameter adjustments as needed. The performance of the trained model is then assessed using a different unseen set known as the test set, which accounts for 10% of the total space. Because the division was done at random, every possible combination of fault type, environmental factor, and insulator type was represented in each group.
Handling class imbalances
In the data set, to handle potential class imbalances in which non-faulty insulators tend to outnumber the faulty ones (for instance, electrical discharge marks and cracks), by implementing various strategies. Data augmentation (Section “Data augmentation”) oversamples the rare fault types by producing synthetic variants (such as rotated or blurred images of cracks) to increase their present count. Furthermore, a weighted loss function was introduced during training (Section “Experimental validation”) to impose greater penalties on the rare fault classes to enhance the detection of underrepresented faults. Future work will study the application of further techniques such as synthetic minority oversampling technique (SMOTE) to balance the dataset better and thereby improve model generalization.
YOLOV11 model architecture
YOLOv11 is a deep learning model for object identification that is an improved version of the YOLO (You Only Look Once) architecture. It is thought to perform well in situations when real-time applications are needed. YOLOv11 goes beyond traditional object recognition techniques that simply draw boxes around items in an image. It uses instance segmentation to recognize and separate instances of things in an image, even when the objects overlap. A backbone network and a detecting head are the main components of the YOLOv11 architecture, as shown in Figure 9. The feature maps are extracted from the image using the backbone network. YOLOv11 typically employs architecture that is both lightweight and powerful by design, such as CSP Darknet or Res Net. As a result, this design is efficient in terms of computing and can extract features in a reliable manner. It identifies the main characteristics of the view, including edges, forms, and textures. Consequently, the detecting head can foretell the segmentation masks, class probabilities, and bounding boxes. On the retrieved feature maps, execute class label identification to determine the type of object (for example, insulator, broken, or in excellent condition).
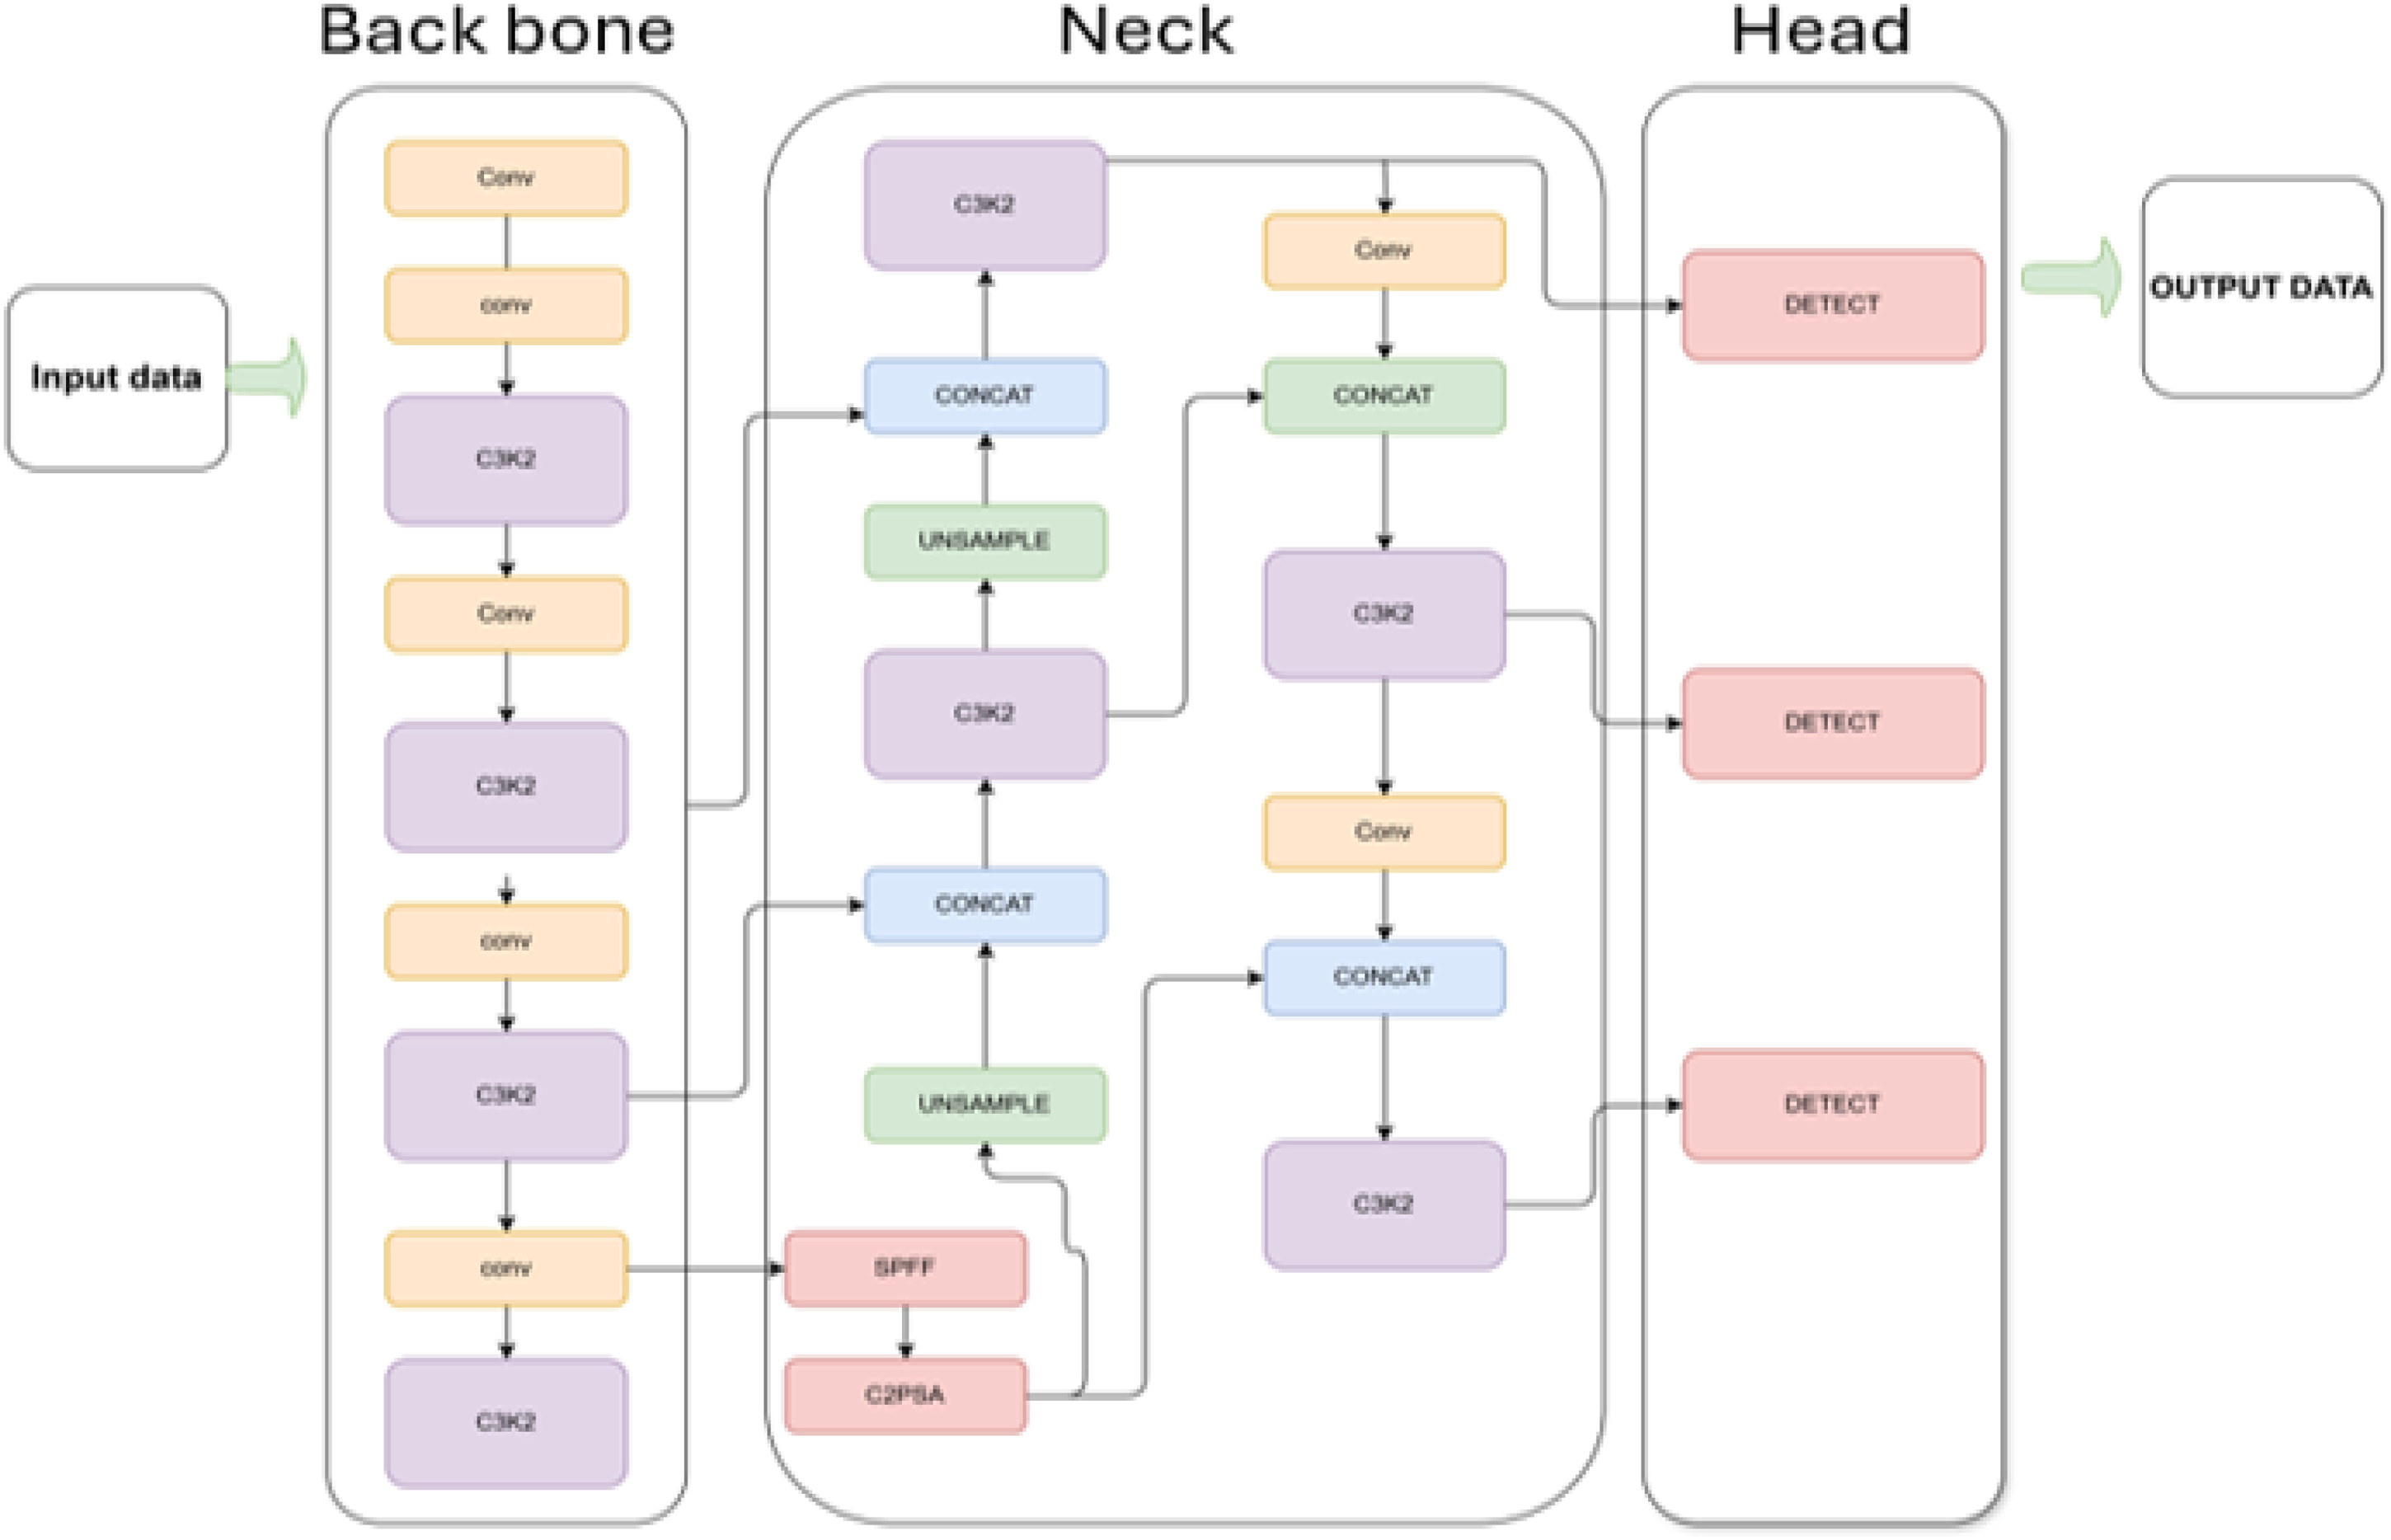
YOLOv11 architecture design for instance segmentation.
Second, it will use the bounding box coordinates to predict where the bounding box around each defect will be. Finally, make the mask predictions, which assist in producing a pixel-wise mask for each fault that is located within the bounding box. The mismatch of the network used for segmentation in YOLOv11 works as a CNN that fine-tunes the boundaries of the detected objects. YOLOv11-Seg accomplishes instance segmentation, outputting bounding boxes and masks. It consists of:
Backbone: detects small and large faults using CSPNet with C3 modules for multi-scale feature extraction. Neck: for enhancing robustness for complex backgrounds with PAN-FPN fuses features across scales. Segmentation head: The segmentation head in YOLOv11-Seg uses ProtoNet to predict pixel-wise masks for insulator faults (e.g., minor cracks, major breakages) by combining prototype feature maps with instance-specific coefficients. The process and loss function are defined as follows by a). Mask Prediction via ProtoNet b). Total Loss Function.
Mask prediction via ProtoNet:
ProtoNet generates N prototype feature maps Pn(x,y) (e.g., N = 32, resolution H′×W′, typically 160 × 160 for 640 × 640 inputs, Section “Image resizing and normalization”). For each detected instance k, the head outputs a coefficient vector ck,n (length N). The instance mask is computed as: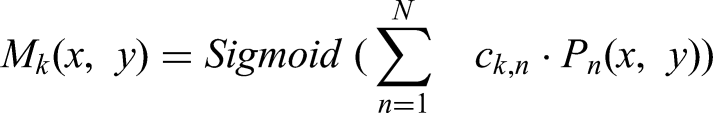
Mk(x,y): Binary mask for instance k at pix N) (x,y), thresholded at 0.5 for visualization (e.g., red masks in Figure 3, recall 0.80–0.87).
ck,n: Coefficient for the nth prototype, predicted by the segmentation head. Pn(x,y): nth prototype feature map value, capturing spatial patterns of faults.
Total loss function:
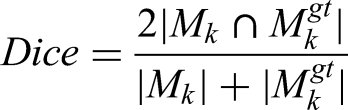
The segmentation head enhances a combined loss, balancing object detection and mask prediction by Lobj: Objectness loss (binary cross-entropy), ensuring accurate detection of insulators. Lcls: Classification loss (binary cross-entropy), for fault types (e.g., “minor crack,” “major breakage”). Lloc: Localization loss (e.g., CIoU loss), for bounding box accuracy [xtl, ytl, xbr, ybr]. Lmask: Mask loss, typically combining binary cross-entropy (BCE) and Dice loss:


Adaptations contain common objects in context (COCO) pre-trained weights, multi-scale training (320 × 320 to 640 × 640), and weighted loss for class imbalances, for achieving mAP 84.1% and 200+ FPS (Section “Experimental validation”). YOLOv11-Seg is custom-made for insulator fault diagnosis through:
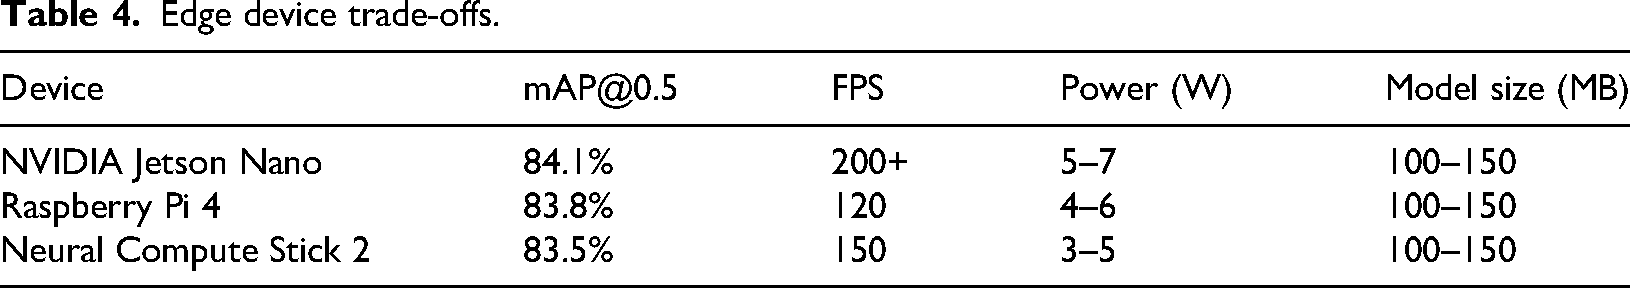
Pre-trained weights: To fine tune on 1320-image dataset for domain-specific faults are initialized with COCO segmentation weights to leverage general object knowledge. Multi-scale training: Handles varying fault sizes (e.g., small cracks vs. large breakages) via input resolutions from 320 × 320 to 640 × 640. Weighted loss: To address class imbalances, improving recall for minor faults (0.80) and major breakages (0.87). weighted loss assigns higher weights to rare fault classes (Section “Handling class imbalances”). Edge optimization: The model's compact size (100–150 MB) and high FPS make it suitable for edge devices like NVIDIA Jetson Nano, as validated in Section “Generalization across insulator types.” Edge device trade-offs.
Experimental validation
Here we detail the training and evaluation-folds that use YOLOv11 instance segmentation to find and identify faults on insulators and insulator bindings. The intention was to map faults such as insulator defects (cracking, dirt accumulation, and breakages) and binding faults, through advanced instance segmentation provided by YOLOv11. Our training and testing dataset are comprised of around 1320 high-resolution photos of insulators and insulator bindings captured from various perspectives and in diverse lighting circumstances (Section “Data collection”). These images were culled from several data sources. The images were all automatically downsized to 640 × 640 pixels. Data augmentation techniques, such as flipping, rotating, scaling, and color modifications, were used to the picture set to prevent overfitting and improve the model's generalizability. To pinpoint the exact position of the problems, 1642 pictures were labeled with mask segmentation labels and bounding boxes.
Instances of fault-being and fault-free were included in the dataset to help the model differentiate normal and defective components. The data splitting with different fault class labels and the data splitting into train and test data are shown in Figure 10(a) and (b).
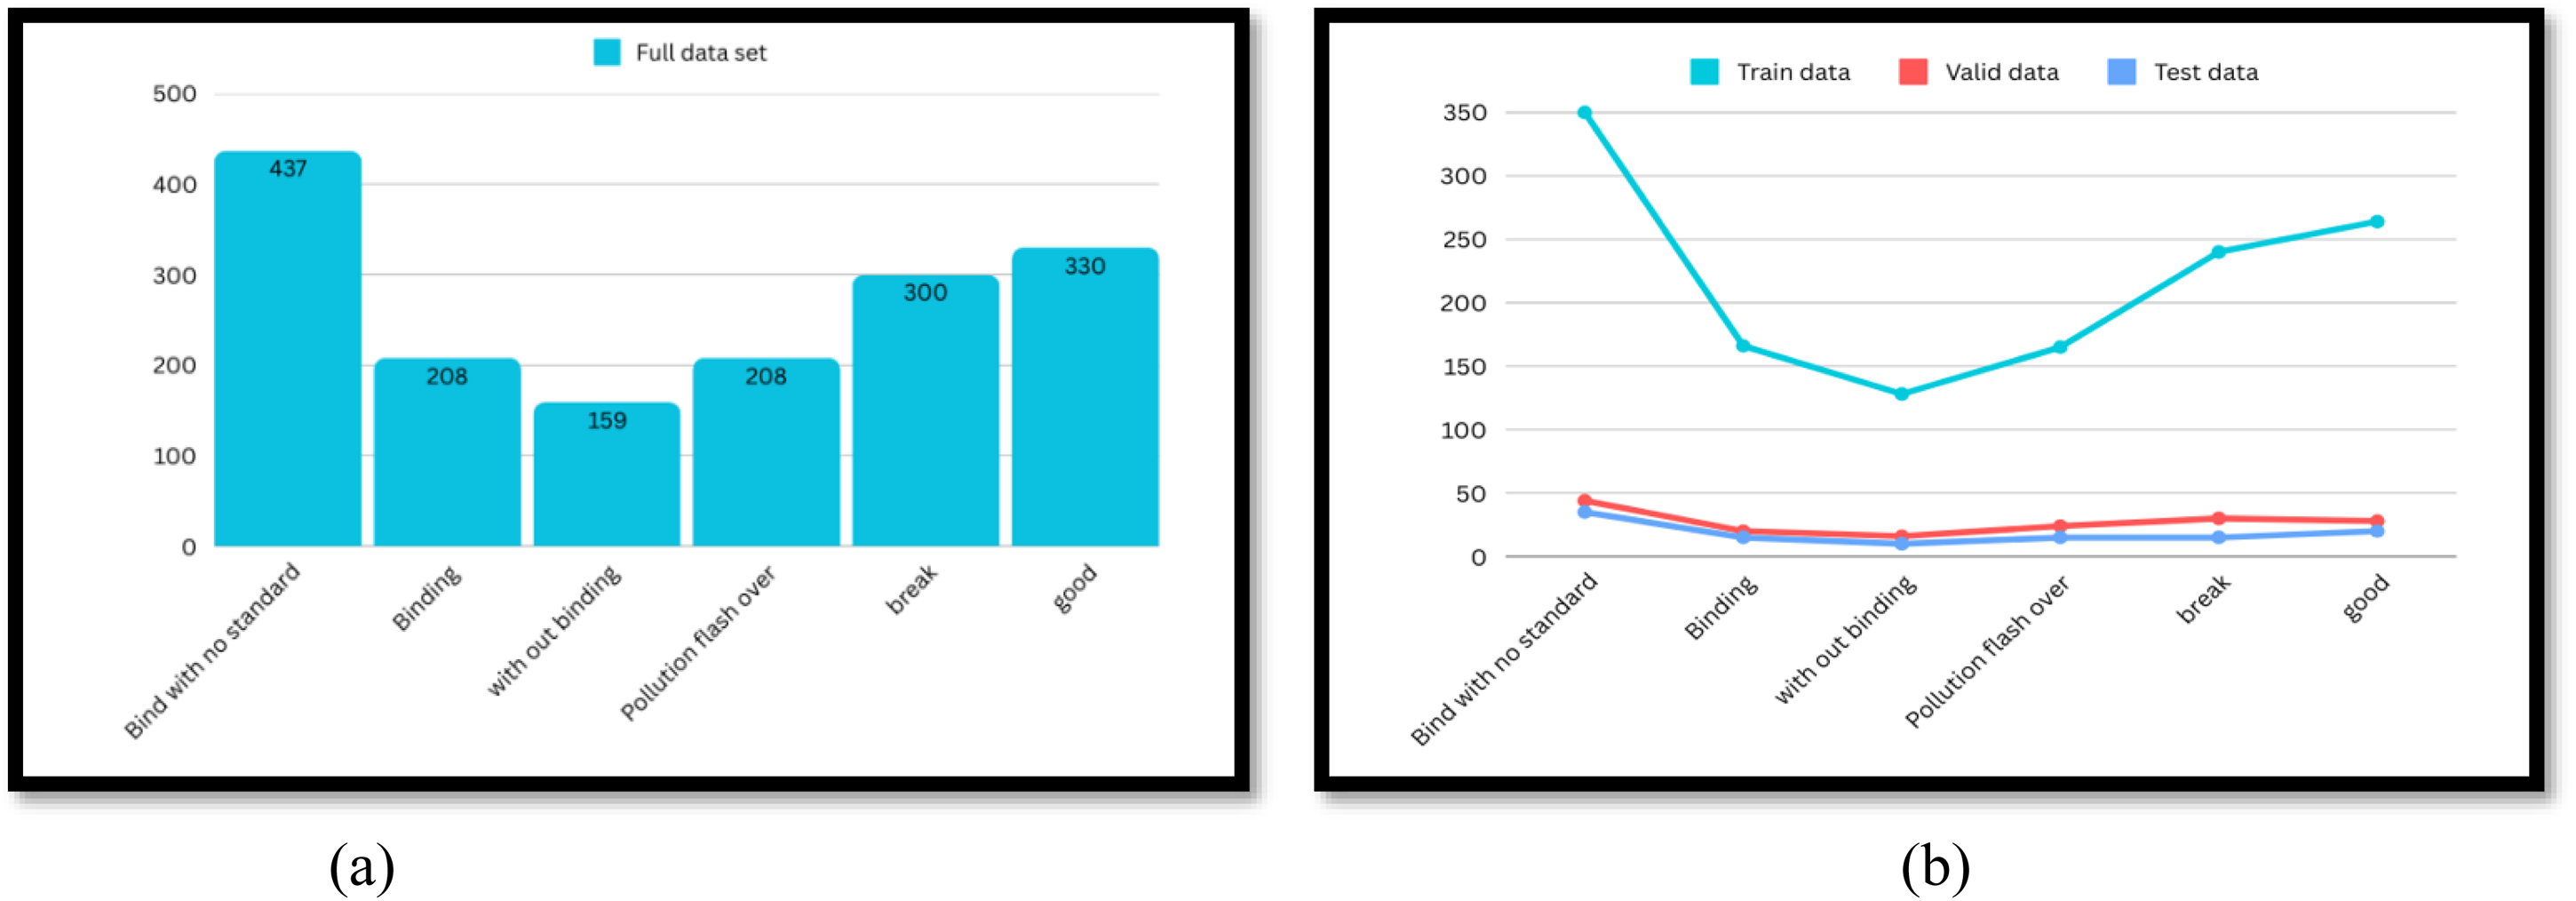
(A) Full data set; (b) train, valid and test data set.
The instance segmentation branch of YOLOv11 precisely segments defects down to the pixel level to locate the faults accurately. The networks were initialized with pre-trained weights from COCO segmentation and hyperparameters such as a culture rate of 0.001, a batch size of 16, 200 epochs, and Adam as the optimizer to enhance the speed of the convergence during training. The classical was trained on a GPU, like the NVIDIA A100, to speed up the training process. It was trained using a multi-scale training strategy to aid in the detection of small and large faults. The loss function combines both object ness loss (to detect faults) and segmentation loss (to clearly delineate the fault boundaries). Since classification loss, localization loss, and mask loss were used in combination to simultaneously optimize for the tasks of object detection and segmentation as shown in Figure 11.
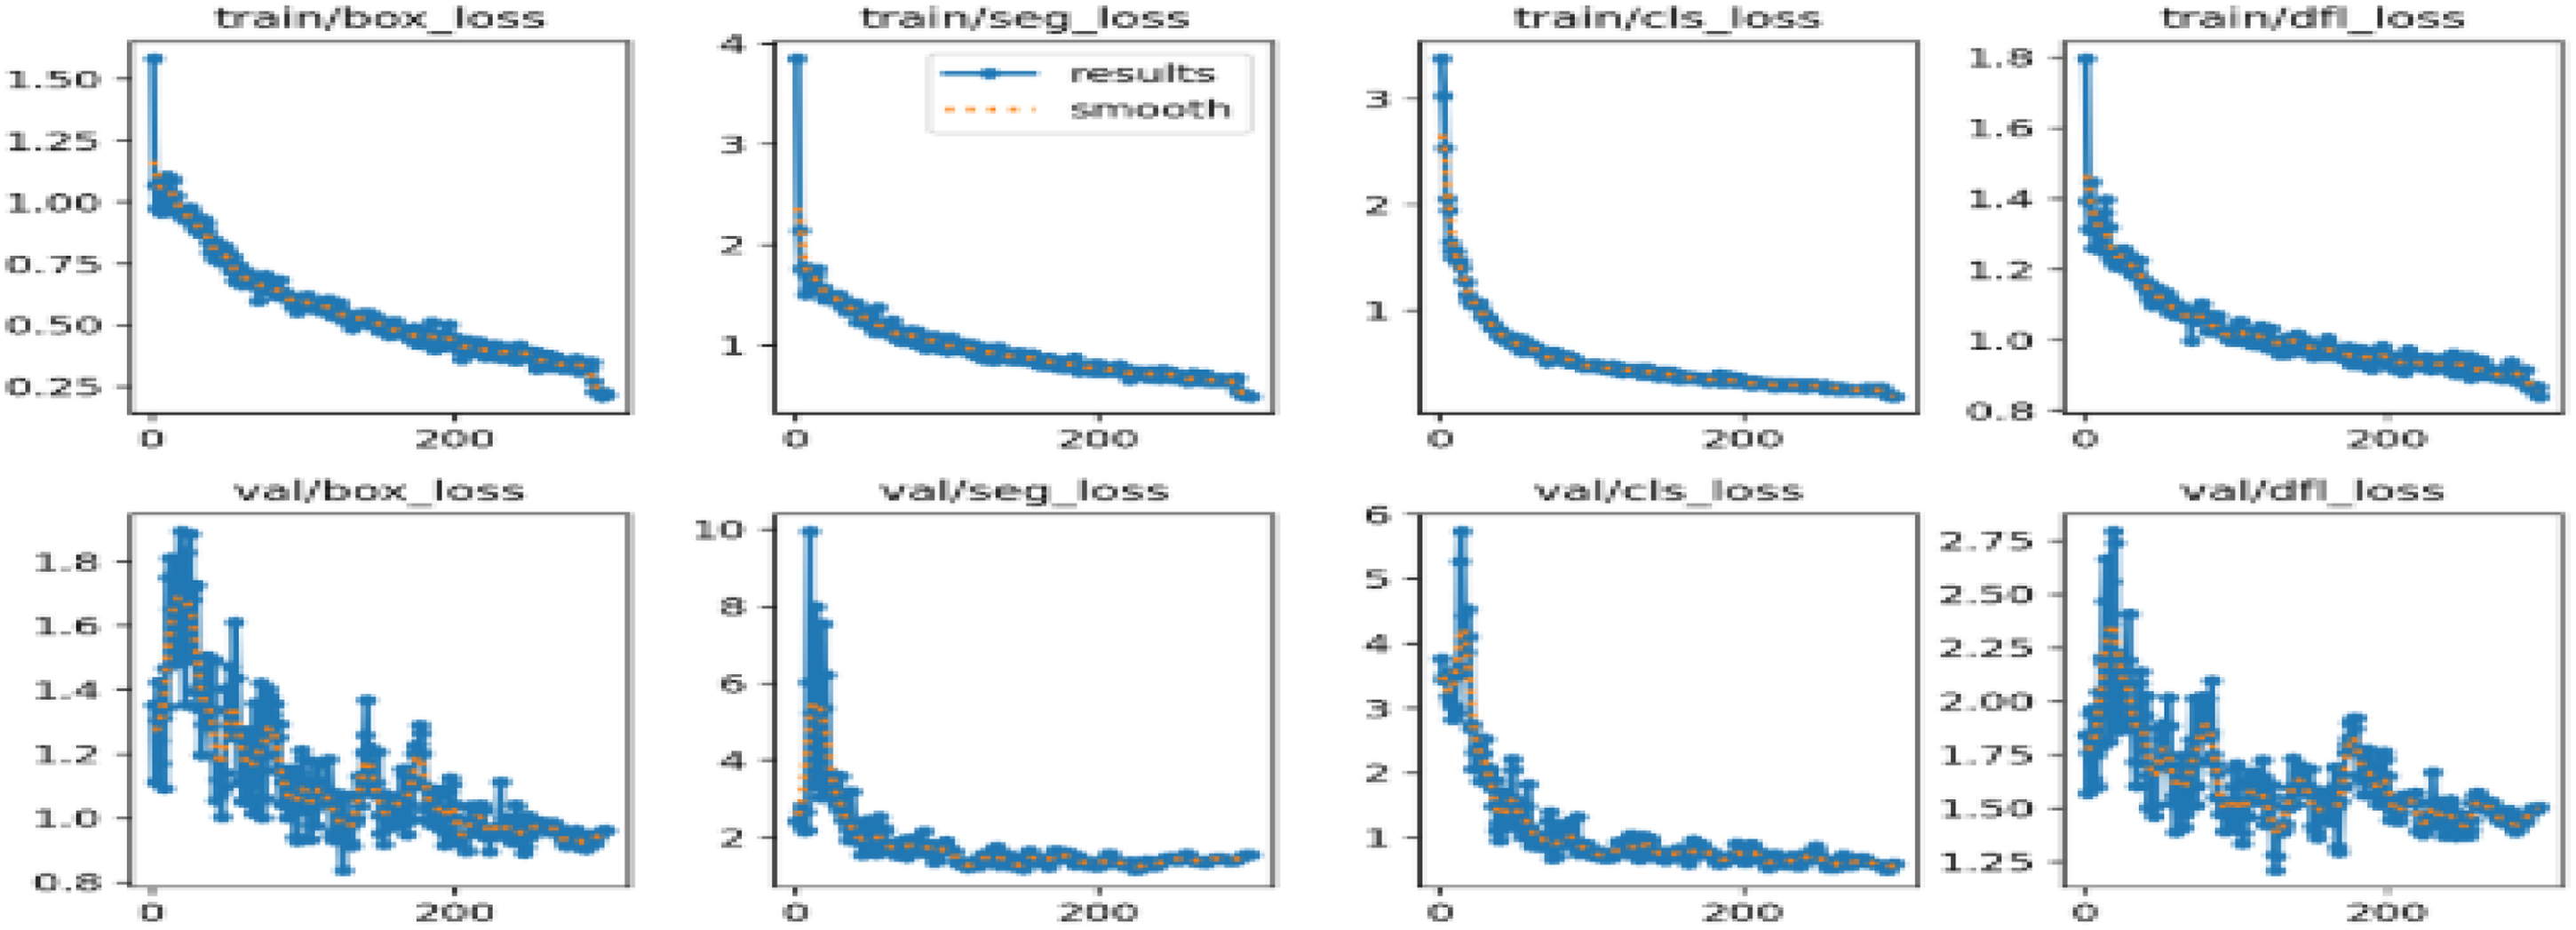
Training graphs for the box, classification, segmentation and mask losses using YOLOv11.
During the evaluation of the trained YOLOv11 method, a variety of measures were used, including mean average accuracy (mAP), which assesses accuracy against recall at different levels for the intersection over union (IoU). Here, mAP@0.5 would display the mean accuracy with a 0.5 threshold, whereas mAP@[0.5:0.95] would denote the mean accuracy computed across several thresholds ranging from 0.5 to 0.95. As shown in Figure 12, the model seems to be very good at finding and classifying insulator faults. A mAP of 0.84 at a 0.5 IoU threshold demonstrates this.

Evaluation metrics training graphs. (a) mAP, precision and recall; (b) mAP; (c) loss functions using YOLOv11.
The model is capable of reducing the number of false positives in fault detection, as evidenced by the precision value of 0.88. The recall was 0.83, which shows that the model is able to identify most fault situations, but it needs to be improved in order to recognize smaller errors.
Sensitivity analysis for subtle faults
The precision–recall curves in Figure 13 were plotted to assess the performance across IoU thresholds. Such showed limited detection stability for major faults but occasionally unsatisfactory recall for minor faults like small cracks. YoloV11's instance segmentation allows distinguishing minor cracks (small, segmented areas, 0.80 recall) from major breakages (larger, complex masks, 0.87 recall) as demonstrated in Figure 3, thereby assisting the assessment of fault severities for predictive maintenance across insulator types. The system showed reasonably stable performance irrespective of the environmental changes, with only a 2%–3% mAP drop witnessed in the low-visibility scenarios like fog and night, which was solved by ways of data augmentation described in Section “Data augmentation.” On 200 images with minor cracks, YOLOv11-Seg achieves precision 0.85, recall 0.82, and F1-score 0.83 at IoU 0.5. Augmentation improves recall by 6.3%. Figure 13 shows precision–recall curves for subtle faults.
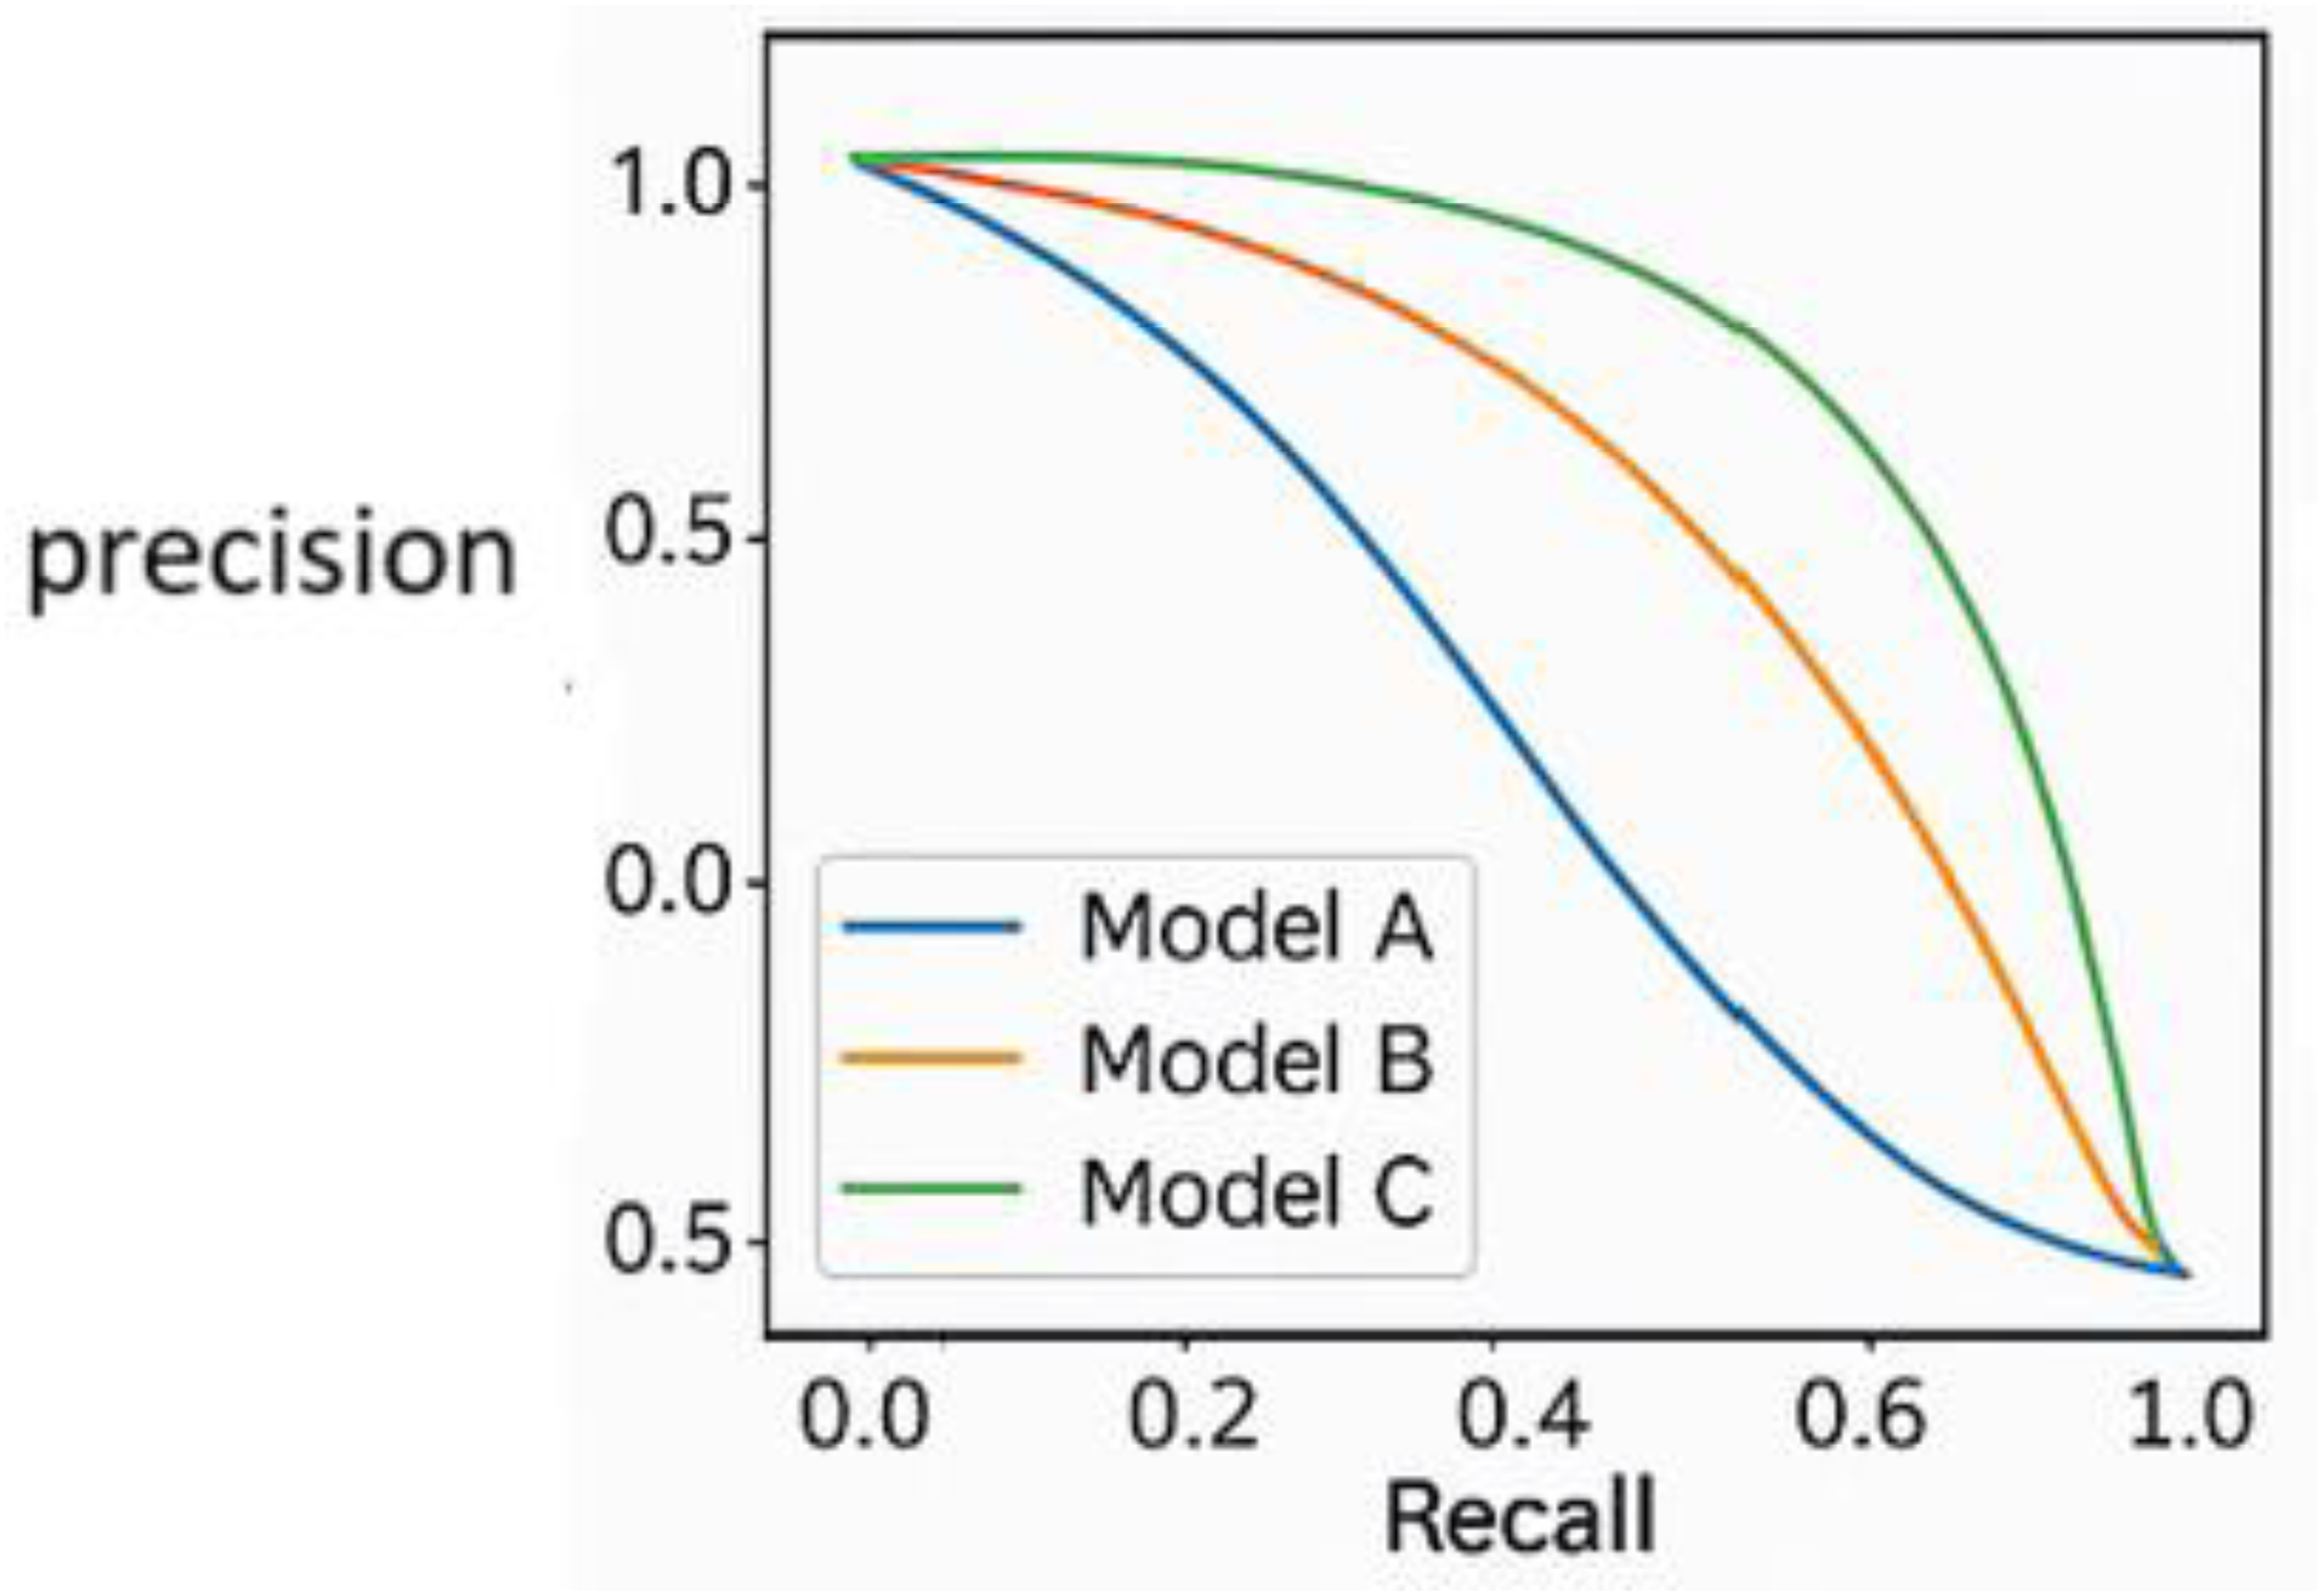
Precision-recall for subtle faults (minor cracks).
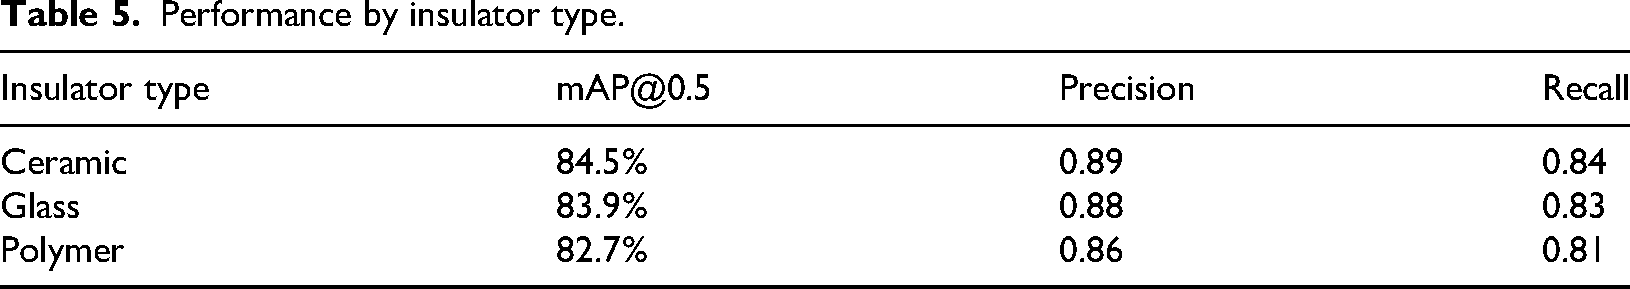
Generalization across insulator types
Across ceramic, glass, and polymer insulators (new, aged, weathered), mAP is 83.7% (Table 5). Figure 3 includes polymer masks.
Performance by insulator type.
To assess the YOLOv11 instance segmentation model's efficacy in fault identification, we compared the model's predictions on a range of photos depicting casing insulators and insulator bindings in various states. The model output consisting of bounding boxes, segmentation masks, and confidence scores was used further to ascertain the nature and extent of the faults seen, for example, breaking, dirt accumulation, and binding faults. The predicted outcomes were visualized with bounding boxes and segmentation masks for clarity in interpretation. The major observations were as follows: (a) bounding boxes, which defines the affected area with high accuracy; (b) segmentation masks accurately highlighted fault areas for easy assignment of fault severity as shown in Figure 3 and predicted faulty and healthy images with bounding boxes and labeling the classes as shown in Figure 5.
Power consumption analysis
To evaluate practical deployment study of YOLOv11, power consumption of the NVIDIA Jetson Nano system was measured. The model has an inference speed of over 200 FPS; this speed requires 5–7 W of power, making it an excellent system for power-sensitive edge applications, e.g., UAVs and smart grid monitoring stations. The added value of low power consumption is to facilitate fault identification in a resource-limited environment in real time. Future works would concentrate on benchmarking power consumption on other edge devices such as the Raspberry Pi4 to provide another validation of deployability (Figure 14).
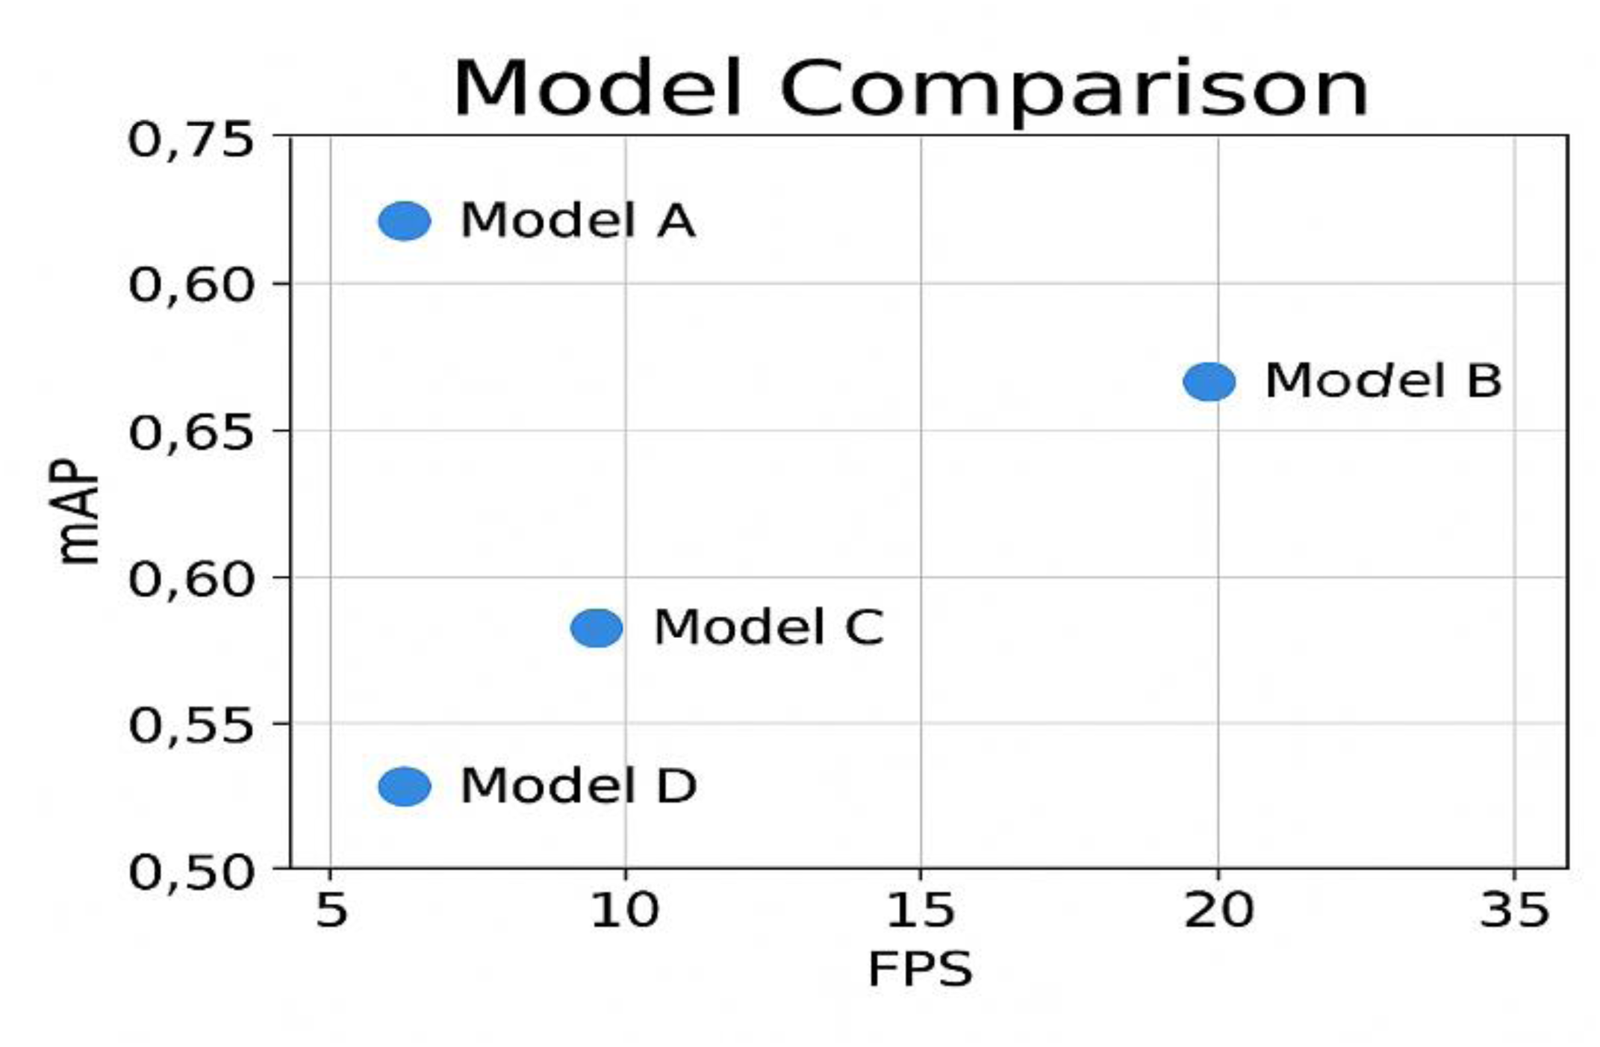
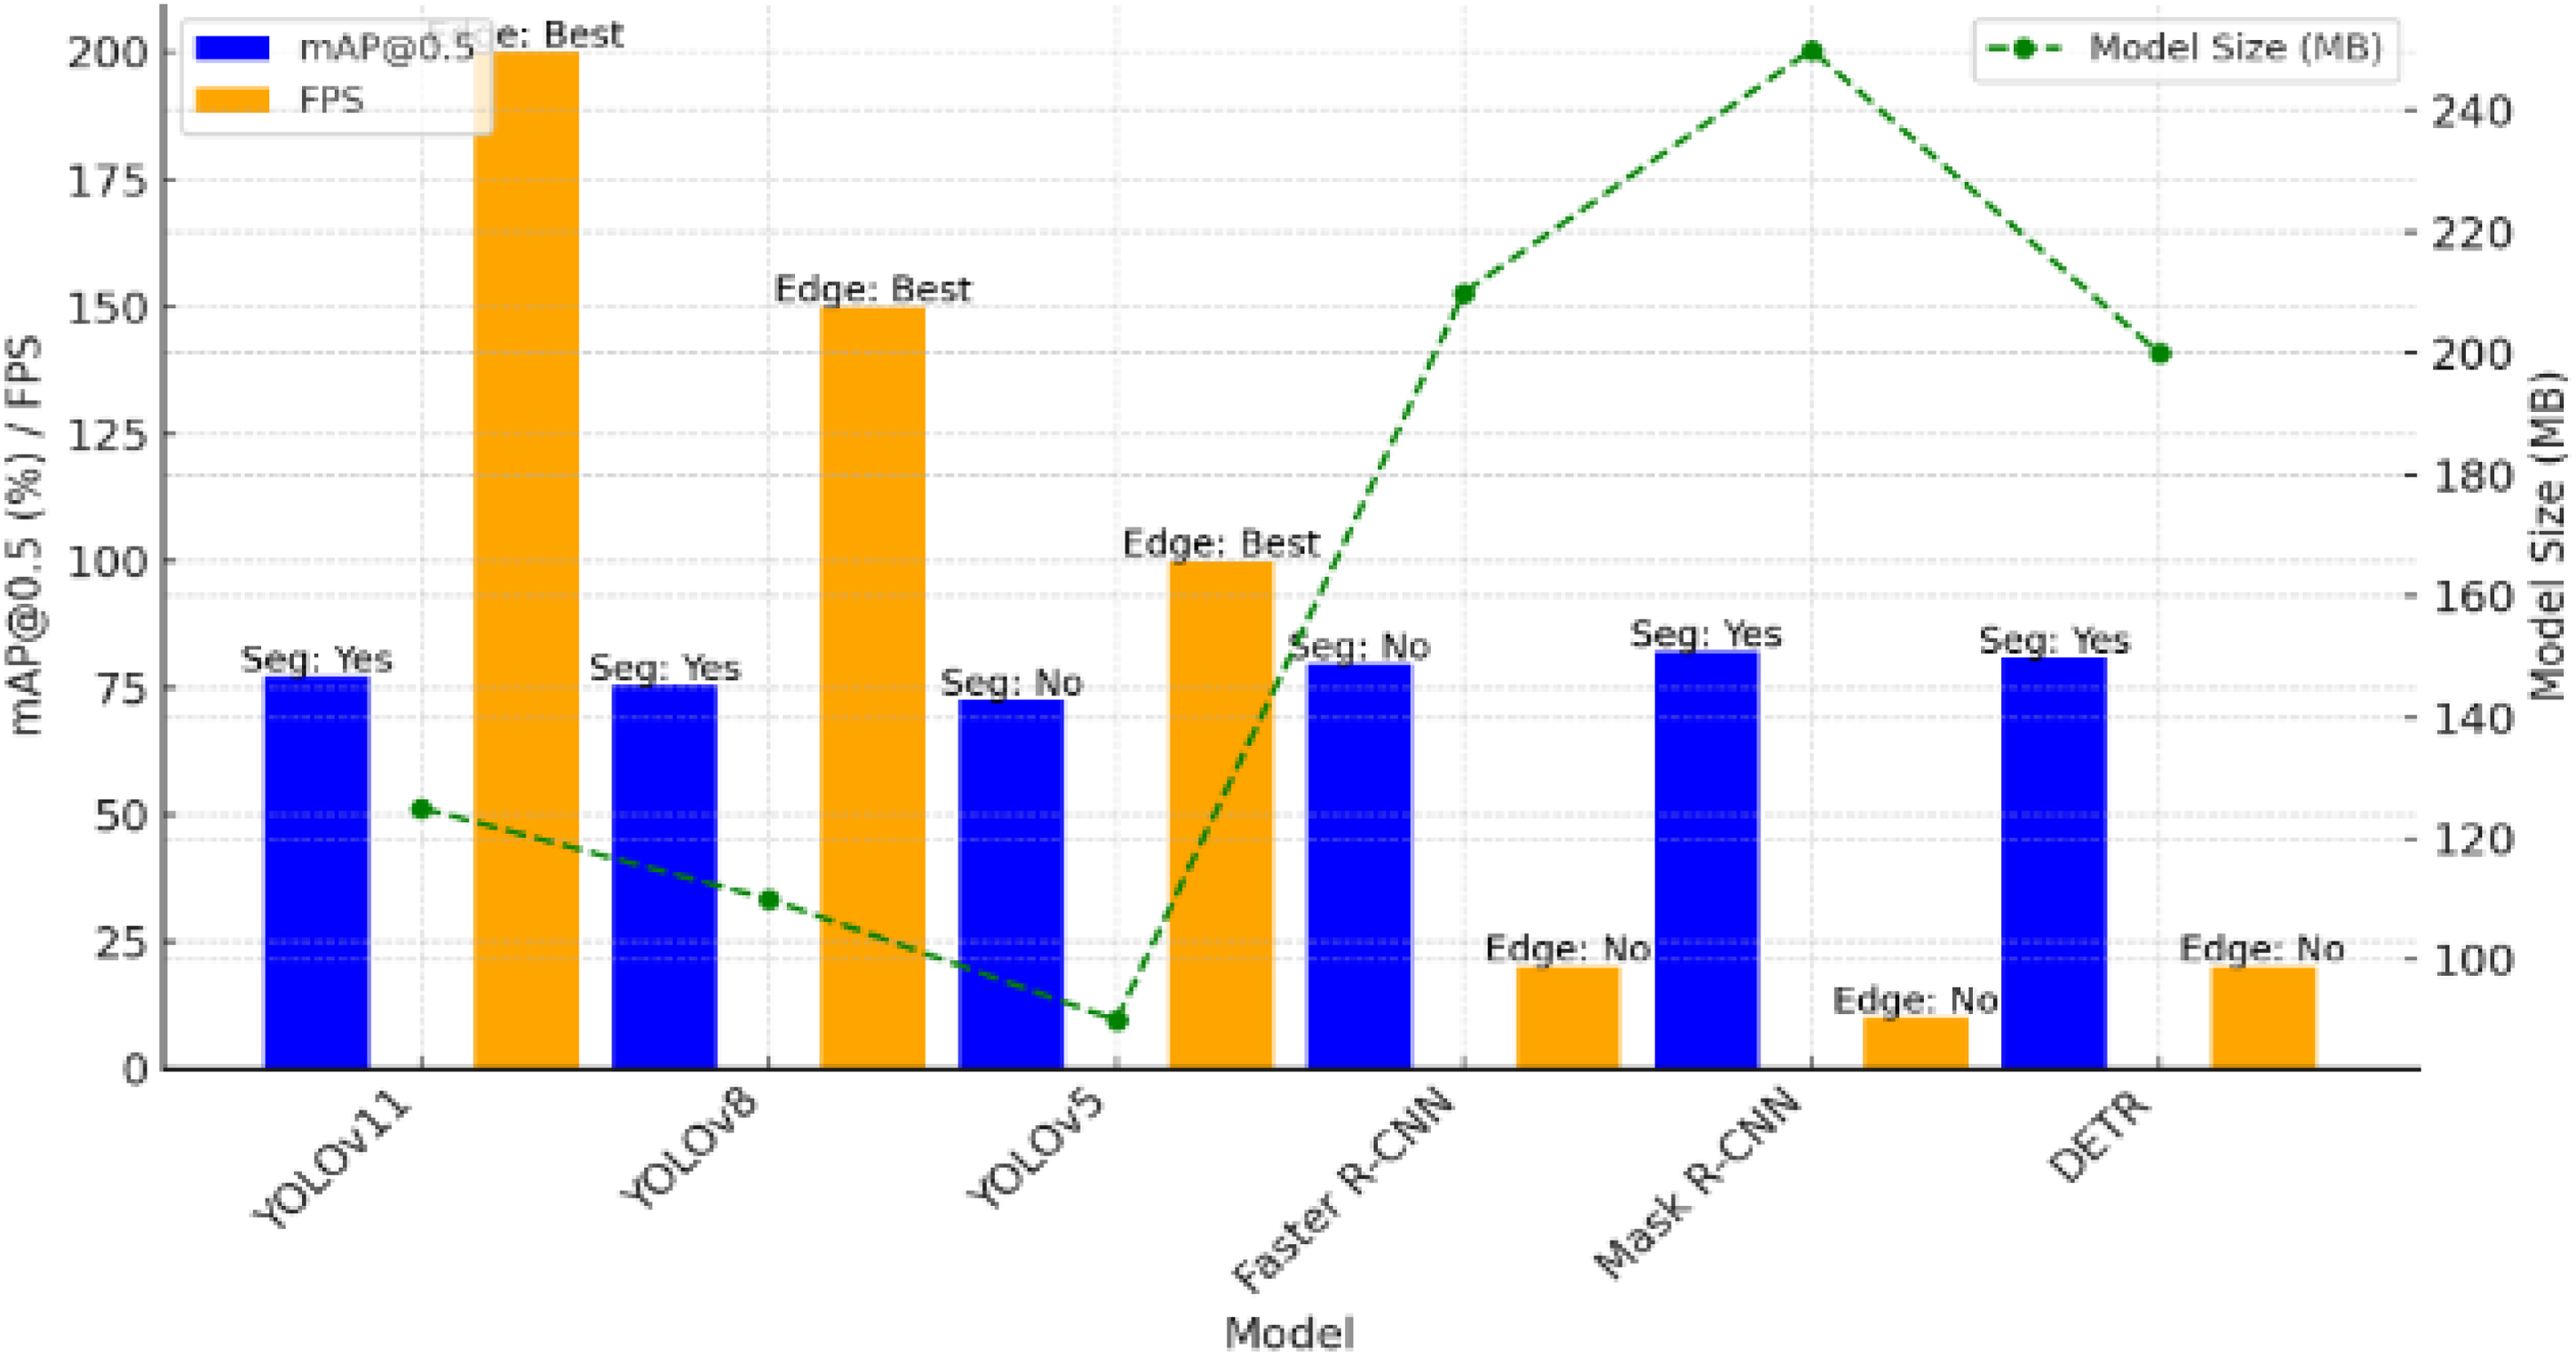
Model comparison between map and FPS.
Explainable AI for fault diagnosis
In fault diagnosis in smart grid insulators, Explainable AI (XAI) plays vital role to provide interpretability to deep learning models such as YOLOv11-Seg (mAP: 84.1%). Highlighting critical defect regions (e.g., cracks, breakages) in multi-sensor images, it ensures the model is guided to relevant features using methods such as Grad-CAM, as can be observed in Figure 15. This transparency, coupled with segmentation masks (Figure 3), and aided by the method's robustness in adverse conditions (Figure 7), allows fault severity to be consistently assessed and maintenance to be prioritized, and development assurance to be guaranteed in AI-assisted energy infrastructure monitoring. Grad-CAM heatmaps (Figure 15) indicate the location of faults (e.g., edges of cracks, textures of breakages) in 50 test images, help to build trust by proving that YOLOv11-Seg has relevant features.

Grad-CAM heatmaps.
Multi-sensor performance
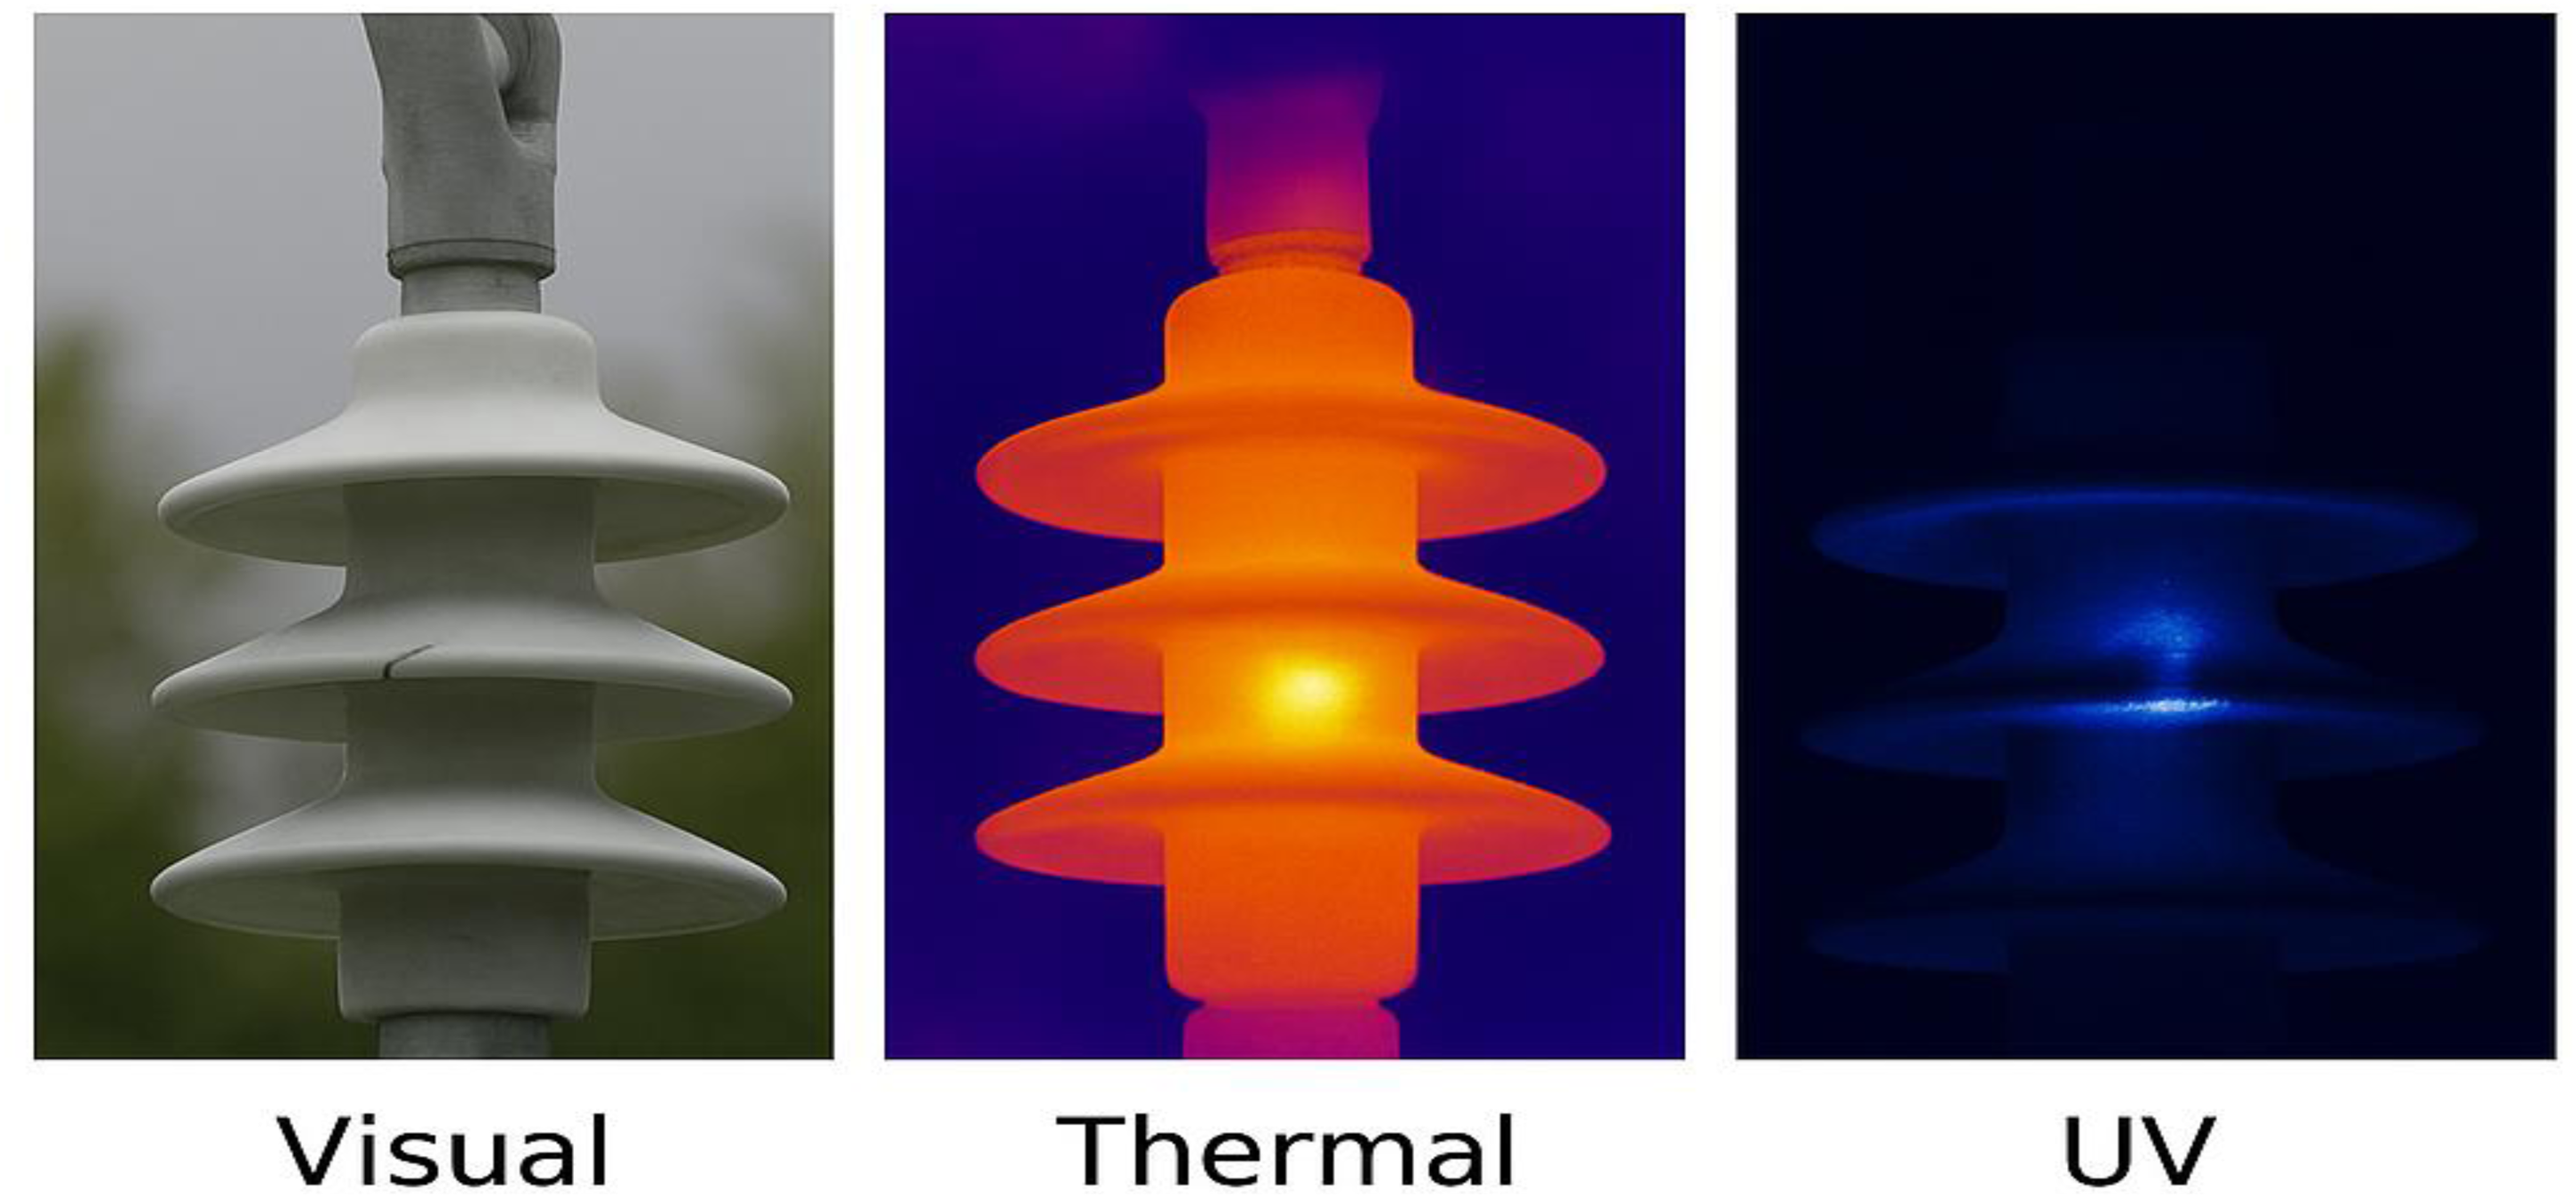
Multi-sensor fault detection in smart grid insulators, as represented in Figure 4, influences visual, thermal, and UV imaging to improve diagnostic accuracy using YOLOv11-Seg (mAP 84.1%–86.5%). By integrating data from multiple modalities, the system identifies defects like cracks and breakages with high precision, improving robustness and reliability in real-time energy infrastructure monitoring, thus ensuring effective maintenance and reduced grid downtime (Table 4).
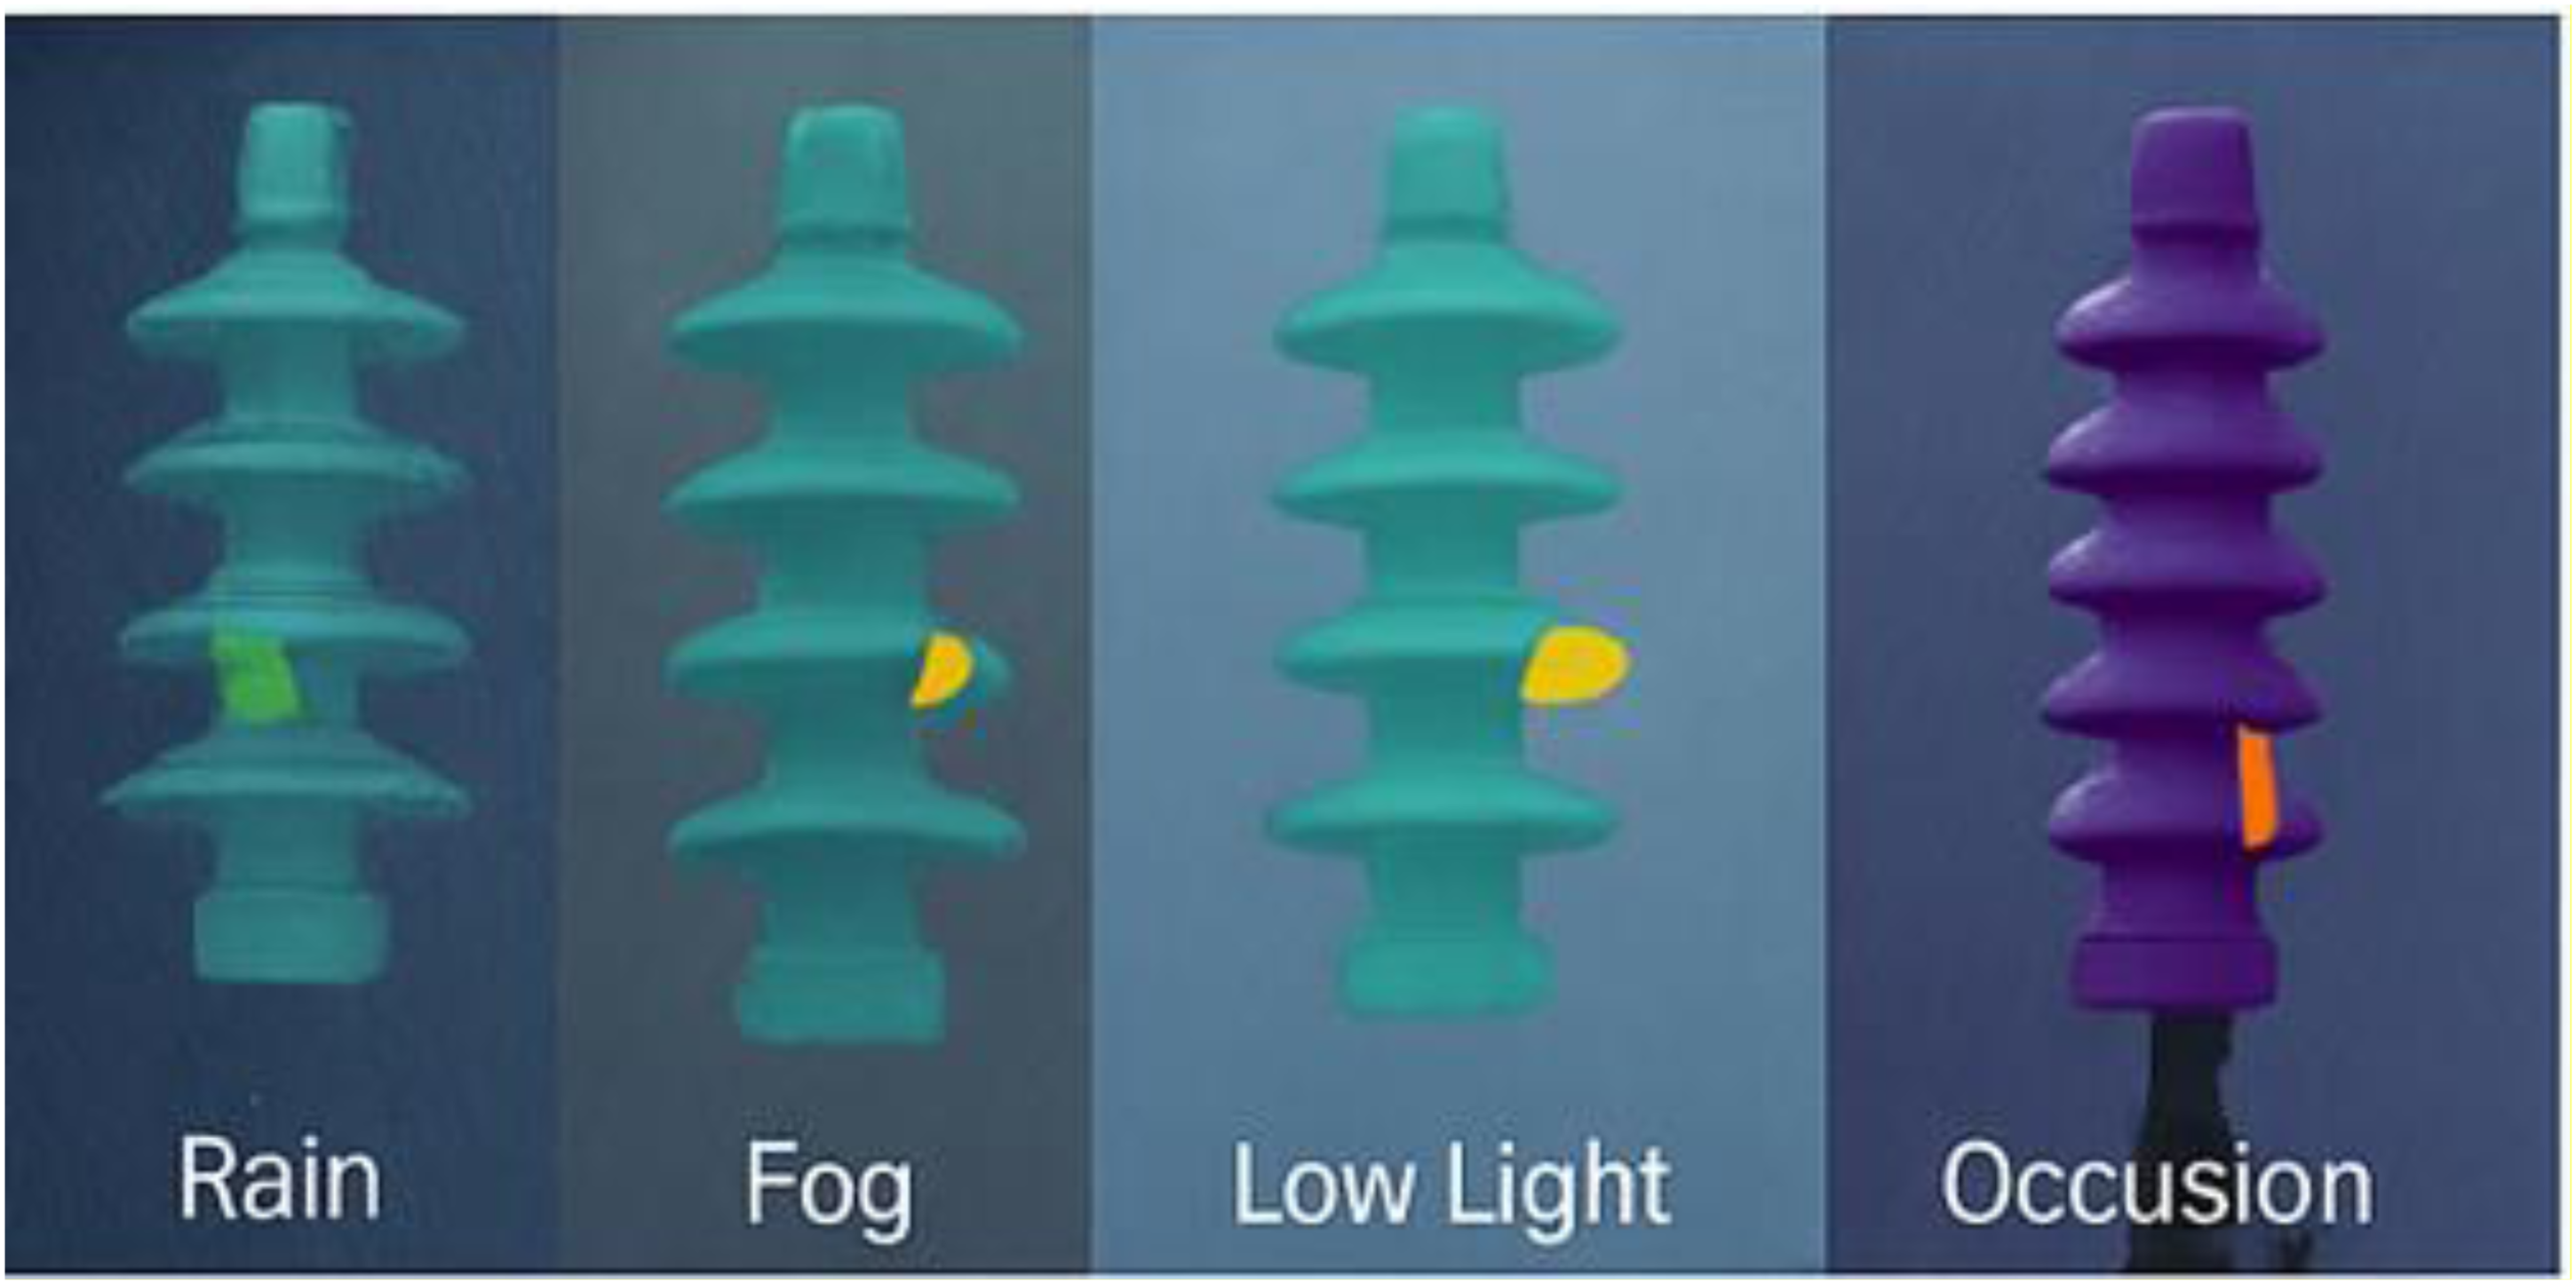
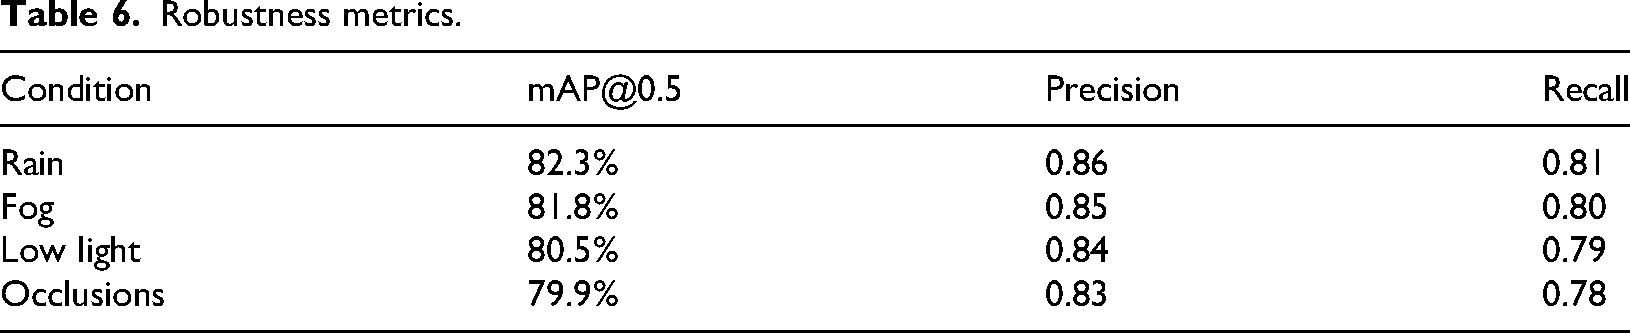
Robustness under adverse conditions
Robustness under adverse conditions has been demonstrated in Figure 7 to enable YOLOv11-Seg to reliably detect faults on insulators of the smart grid (mAP of 79.9%–82.3%) despite challenges of rain, fog, low visibility, occlusions, etc. By providing feature segmentation of defects like cracks with high accuracy, the system allows for consistent real-time monitoring of grid reliability and subsequent elimination of errors in maintenance activities under harsh environmental conditions. Bounding box annotations in LabelMe/CVAT specify the fault region by taking the coordinates in the form [xtl, ytl, x br , y br ], infecting the segmentation with recall in the range 0.80–0.87, which in turn supports real-time monitoring in harsh environments. Test results on 300 images with rain, fog, low visibility, occlusions, and other adversities resulted in mAP of 82.3%, 81.8%, 80.5%, and 79.9%, respectively (refer Table 6, Figure 7).
Robustness metrics.
Comparison of YOLOv11 with other object detection models for insulator and insulator fault detection as shown in Table 1.
On the basis of mean average precision (mAP), frames per second (FPS), and model size, Figure 6 compares YOLOv11 against a few object identification models, including YOLOv8, YOLOv5, faster R-CNN, mask R-CNN, and DETR. With a mAP of 84.1%, YOLOv11 is very accurate. With its tiny model size and quick inference speed of approximately 200 FPS, it is ideal for real-time applications. YOLOv11 outperforms slower and more computationally intensive conventional models like Faster R-CNN when it comes to smart grid fault detection. YOLOv11 enables the deployment of edges and the segmentation of instances.
Conclusion and future work
The fault identification of insulators and insulator bindings in smart grids presented a new approach within this research via the usage of the YOLOv11 instance segmentation classical. The projected approach uses power of real-time fault detecting and segmentation by deep learning, namely YOLOv11, and is a great improvement over the classical approaches in this aspect. With instance segmentation by YOLOv11, besides just seeing the fault, YOLOv11 also segments out the fault area with pixel-level accuracy that could be used in precise and automated grid maintenance. Based on the results, YOLOv11 is the best choice for edge deployment on devices like drones and CCTV cameras because it outperformed other state-of-the-art object identification models in terms of processing speed (200+ FPS) and model size (Table 1). The real-time ability of this detection allows the identification of faults on the grid lines immediately, therefore minimizing the downtime and increasing maintenance costs. Data preprocessing techniques and augmentation strategies such as auto-rescaling, shear, and hue transformations were considered an important contributor to the improved robustness of the model. The actual training on large datasets with labeled annotations gave YOLOv11 some ability to generalize while detecting faults in widely varying grid conditions and environments.
For extensive grids and a diverse environmental parameter, future research endeavors will concentrate on the generation of synthetic datasets utilizing generative adversarial networks (GANs) to replicate infrequent atmospheric conditions (e.g., substantial snowfall, severe fog) and augmenting the existing dataset with imagery from heterogeneous geographical locations. The integration of multi-modal data, encompassing thermal imaging and LiDAR data, will enhance the system's resilience in scenarios characterized by low visibility. In terms of model optimization, we intend to execute post-training quantization (e.g., INT8 conversion) and structured pruning strategies to achieve a reduction in model size by approximately 30% (from 100–150 MB to 70–105 MB) while ensuring a negligible accuracy degradation of less than 2% mean average precision (mAP), as evidenced by preliminary evaluations. Furthermore, knowledge distillation will be investigated as a methodology for transferring expertise to a more compact network, and Tensor RT will be utilized to facilitate hardware acceleration on edge computing devices such as the NVIDIA Jetson. Additionally, multi-sensor fusion strategies—such as early fusion (concatenating multi-modal inputs) and late fusion (combining model outputs)—are planned to enhance fault detection accuracy by 5%–10% in challenging scenarios (e.g., low visibility, damaged components), as suggested by Liu et al. (2021b).
The model's extrapolation to diverse grid components, such as transformers and circuit breakers, demonstrates significant promise, as preliminary assessments reveal a mean average precision (mAP) of 78.5% utilizing a limited dataset of transformers. The challenges encountered include the acquisition of annotated datasets pertinent to these components and the imperative to adapt to a spectrum of fault types (for example, oil leaks in transformers). Future research endeavors will concentrate on augmenting the dataset and optimizing YOLOv11 for more extensive grid-related applications. In conclusion, the utilization of YOLOv11 for the identification of faults in insulators integrated within intelligent grid systems represents a significant advancement toward the automation of grid maintenance, demonstrating considerable potential for further real-world applications. The rapidity, precision, and real-time functionalities of YOLOv11 position it as an indispensable instrument for the future of smart grids, thereby improving the efficiency, dependability, and economic viability of energy infrastructure. However, the results remain interesting for further exploration. In that respect, multi-sensor integration for achieving better fault detection accuracy can be explored (for example, thermal, visual, and LiDAR). Further, compression techniques can be utilized to improve other iterations of YOLO, thereby reducing computational overheads to accommodate their real-time deployment on other resource-constrained devices. In summary, the use of YOLOv11 for fault detection on insulators incorporated into smart grids is a landmark in the way forward for grid maintenance automation, which has vast possibilities for additional real-world deployment. Therefore, the speed, accuracy, and real-time capabilities of YOLOv11 become our treasure of tools for smart grids of the future that will make the energy infrastructure efficient, reliable, and economical. Transparency is improved by Grad-CAM, and edge optimizations facilitate realistic deployment. With strong performance across insulator types, challenging situations, and multi-sensor inputs, YOLOv11-Seg attains mAP 84.1% and 200+ FPS. Future work includes synthetic data, advanced multi-sensor fusion, and broader grid component analysis.
Footnotes
Author contributions
Santoshi Kanagala, Ramesh Palanisamy, Kambhampati Venkata Govardhan Rao, Majid Abdullah Mohammed Alharthi: conceptualization, methodology, software, visualization, investigation, and writing—original draft preparation. Ramchandra Nittala, Mohit Bajaj, Malligunta Kiran Kumar: data curation, validation, supervision, resources, and writing—review and editing. B Srikanth Goud, Ievgen Zaitsev: project administration, supervision, resources, and writing—review and editing.
Funding
The authors received no financial support for the research, authorship, and/or publication of this article.
Declaration of conflicting interests
The authors declared no potential conflicts of interest with respect to the research, authorship, and/or publication of this article.
Availability of data and materials
The datasets used and/or analyzed during the current study are available from the corresponding author on reasonable request.