
Abstract
Fault analysis and classification play a critical role in ensuring the reliability and safety of complex industrial systems, particularly in high-risk environments such as power generation. Failure mode and effects analysis (FMEA) is one of the tools used to identify, analyze, and classify faults to minimize their frequency, reduce their impact, enhance reliability, save operating costs, and improve competitiveness. However, FMEA is often limited by the subjective nature of expert evaluations, which can lead to inconsistencies when different experts assign varying scores to the same failure mode. To address this issue, a hybrid approach combining FMEA with the decision-making trial and evaluation laboratory (FDEMATEL) model was proposed. By integrating these tools, critical faults can be prioritized more effectively. This study aims to determine the priority of faults in gas units in a combined cycle power plant in Libya by using a hybrid method that was previously mentioned. FMEA initially prioritized critical failures, while FDEMATEL supplemented this analysis by evaluating the cause-effect relationships between failures, enabling a systemic reassessment of their rankings based on interdependencies. Python and Excel were used to perform the mathematical operations for both methods. The study revealed three key causal failure patterns: control system failure, air filtration system clogging, and fuel gas system leakage, which should be the focus of attention. The study recommends applying the FDEMATEL model to fields that require knowledge of the relationships between these elements.
Introduction
Failure mode and effects analysis (FMEA) is an engineering process used to analyze potential failure patterns within a system. FMEA helps to identify potential failure modes, evaluate their effects on operation, and determines procedures to mitigate these failures. This proactive approach enhances reliability by addressing potential issues early, making it easier to implement measures to overcome failure modes (Cooper, 2015; Mi et al., 2018; Pascu et al., 2020). Failure in this context means potential harm or injury to the end user, so FMEA is considered a preventive or proactive process. Currently, FMEA is widely used in manufacturing industries at various stages and is applied by manufacturers and service providers (La Fata et al., 2022).
FMEA is employed to improve component reliability in continuous processes, ensuring failures are preemptively addressed. It prioritizes system failure risks by assigning a risk priority number (RPN) to each failure mode (Koomsap and Charoenchokdilok, 2016; Pamungkas et al., 2020; Yang et al., 2011). Despite its popularity, FMEA is limited by its reliance on expert judgment, which introduces variability when different experts assign differing risk scores to the same failure mode. Therefore, there is a need for alternative tools that enhance the decision-making process in fault risk assessment, particularly through multi-criteria decision-making (MCDM) (Boral et al., 2020; Chang et al., 2013; Ma et al., 2024).
The decision-making trial and evaluation laboratory (DEMATEL) is an effective method for identifying and prioritizing causal factors. This method evaluates the interconnected relationships between factors and identifies critical relationships through a visual structural model, thereby increasing decision-making flexibility. To prioritize risks more accurately while addressing subjectivity and uncertainty, the fuzzy DEMATEL model is applied (Fang et al., 2021; Noor et al., 2021; Pellicer et al., 2023; Si et al., 2018).
Ensuring the reliability of production sites is a major concern for management and employees alike, especially in vital areas, such as the Misurata dual power station in Libya. Given the importance of the station as a key feeder to the public electricity grid, this study combines the FMEA and FDEMATEL models to analyze failure patterns within the station.
Through field visits to some local production and service institutions, it was noted that they lacked scientific foundations for classifying faults if not entirely absent in some cases. Despite the existence of many methods and techniques that help these institutions classify and evaluate faults, most rely on the experience of their employees for classification. This reliance results in decreased equipment reliability, increased operating costs, and a lack of understanding of the interrelationships between failures, which should be part of the risk assessment process.
The traditional FMEA framework, while foundational in risk assessment for industrial systems, exhibits inherent limitations, particularly concerning the handling of uncertainty and subjectivity in evaluating risk parameters. The reliance on crisp numerical values for severity (S), occurrence (O), and detection (D) ratings, which are then multiplied to yield an RPN, often fails to capture the nuanced and sometimes vague nature of expert judgments (Yang et al., 2011). Experts frequently express risk levels using linguistic terms like “very high,” “moderately likely,” or “almost impossible to detect,” which are difficult to map accurately onto a precise 1–10 scale. This forced precision can lead to inconsistencies, loss of information, and potentially misleading prioritization, especially when different combinations of S, O, and D yield identical RPN values despite representing distinct risk profiles (Boral et al., 2020).
In this regard, introducing fuzzy logic into the FMEA framework offers significant advancement in addressing these challenges, particularly within the context of complex systems such as gas units in combined-cycle power plants. Fuzzy logic, specifically through fuzzy set theory, provides a robust mathematical mechanism for representing and manipulating imprecise or vague information (Zadeh, 1965). Instead of forcing expert assessments into rigid numerical scales, fuzzy FMEA allows the use of linguistic variables (e.g. low, medium, and high), which are then represented by fuzzy sets. These sets define the degree of membership for a range of possible numerical values, thereby capturing the inherent uncertainty and ambiguity of the assessment process (Boral et al., 2020; Boral and Chakraborty, 2021). For gas units, where operational complexity is high and historical failure data for specific novel components or operating conditions may be sparse, the ability to systematically incorporate expert knowledge is paramount. Fuzzy logic facilitates this by translating qualitative expert opinions into a quantitative framework, without losing the richness of the original assessment. Techniques such as expert elicitation combined with fuzzy inference systems (FISs) allow for the aggregation of judgments from multiple experts, even when opinions diverge, leading to a more reliable and representative evaluation of risk factors (Arce et al., 2015; Sharma et al., 2005; Wang et al., 2021). The resulting fuzzy RPN is not a single crisp number but rather a fuzzy number that provides a more comprehensive representation of the risk associated with a failure mode, reflecting the uncertainty involved. This nuanced risk picture enables more effective differentiation between failure modes, overcoming the issue of tied RPN scores and leading to more reliable prioritization for maintenance and mitigation efforts (Balaraju et al., 2019; Yang et al., 2011). This enhances the decision-making process by providing a more realistic and flexible approach to risk assessment in environments characterized by complexity and uncertainty, directly improving the safety and reliability management of critical assets, such as power plant gas units.
Literature review
Extensive research has explored failure risk assessment, a persistent challenge for decision-makers in various sectors (Ribas et al., 2021; Wang et al., 2022a). This article reviews relevant studies, highlighting how traditional methods have been adapted to address limitations. For instance, Almashaqbeh et al. (2018) adapted the FMEA method to assess non-technical risks in electricity generation. By replacing the traditional 1–10 scale with a simplified 1–5 scale and applying weighted averaging to aggregate expert ratings, their approach reduced ambiguity and enhanced consistency in risk evaluations compared to conventional FMEA. In another work, Gueorguiev et al. (2020) examined the “AIAG & VDA FMEA Handbook,” a new FMEA method introduced in 2019 by the Automotive Industry Action Group and the German Association of the Automotive Industry. This method, designed for the automotive industry, incorporates additional evaluation steps and alternative tables in place of the traditional RPN table. The study primarily focused on defining the new method and outlining its implementation steps. However, traditional methods have limited impact due to their inability to fully consider the relative importance of the three parameters (severity, occurrence, and detection) and the interrelationships between failure modes. Integrating MCDM tools with FMEA has demonstrated efficacy in overcoming this limitation (Abu Dabous et al., 2021a, 2021b; Hariri et al., 2023; Khaleel et al., 2025; Nassar et al., 2025; Schramm et al., 2020; Sousa et al., 2021).
While traditional MCDM methods assume certainty, uncertainty-based MCDM approaches offer a more realistic perspective by acknowledging inherent uncertainties in decision-making processes (Abdulgader et al., 2018; Dhurkari, 2022; Liu et al., 2019; Mohammed et al., 2025; Seiti et al., 2018; Zavadskas et al., 2020). A notable study by Liu et al. (2015) developed a hybrid MCDM approach for FMEA. Integrating VIKOR, DEMATEL, and AHP, this approach uses AHP to rank failure mode risks, VIKOR to assess the collective impact of failure modes, and DEMATEL to map the causal relationships between failure modes and their underlying causes. A DEMATEL-based AHP method then determines influence weights and prioritizes failure patterns. This hybrid approach enables analysts to identify high-risk failure modes and select appropriate maintenance strategies. In the same vein, other studies have explored innovative approaches to FMEA. For instance, Tsai et al. (2017) combined FMEA with DEMATEL in the photovoltaic cell industry to identify and prioritize key problems, using FMEA to pinpoint areas for improvement and DEMATEL to analyze causal relationships. Similarly, Fattahi et al. (2020) employed fuzzy AHP to analyze occupational hazards in a fertilizer factory, demonstrating the benefits of fuzzy data analysis for enhanced risk assessment. Furthermore, Lo et al. (2021) expanded the FMEA model with TOPSIS for a steam turbine case study, improving failure mode understanding and plant performance. Meanwhile, Huang et al. (2020) utilized rough fuzzy TOPSIS to enhance FMEA for product life cycle risk analysis, achieving more reliable risk classification. Finally, Yener and Can (2021) introduced the IFA-MABAC method for improved fuzzy rating of failure mode hazards, emphasizing the importance of modern risk assessment tools. Alrifaey et al. (2019) proposed a hybrid framework that integrates linguistic FMEA, analytic network process (ANP), and DEMATEL to assess and prioritize failure modes in electrical generators operating in hazardous environments. This approach effectively captures the interrelationships among failure modes, offering a comprehensive and systematic methodology for risk assessment. Similarly, Bari et al. (2022) developed a hybrid MCDM framework that combines FMEA with fuzzy DEMATEL to evaluate and prioritize operational hazards in heavy fuel oil-based power plants. Their approach successfully accounts for the interdependencies among failure modes and provides a structured framework for risk evaluation and decision-making in complex industrial contexts. Furthermore, Ren and Guo (2023) introduced a hybrid methodology that combines failure mode, effects, and criticality analysis (FMECA) with the house of reliability approach to analyze failure interactions in marine diesel power plants. By addressing the interdependencies among failure modes, this framework delivers a more comprehensive risk assessment, thereby enhancing the reliability analysis of complex power systems.
The exhaustive review of existing literature reveals that there is a consensus on the importance of fault classification and evaluation for enhancing FMEA efficacy. This holds true regardless of whether traditional methods are employed or integrated with other approaches, depending on the specific requirements. Improved failure risk assessment in maintenance systems mitigates limitations that negatively impact system reliability (El-Thalji, 2019; Fithri et al., 2020; Ramírez et al., 2021). The limitations of traditional methods have driven the development of alternative tools that augment existing methodologies, leading to more effective failure risk assessment and improved machinery and equipment reliability.
Data and methods
Maintenance systems focus on preserving the functionality of physical assets to maximize their value, which is essential for achieving organizational financial goals, safety, and environmental protection. Asset functions form the basis for developing effective maintenance plans. Assets possess primary, secondary, and hidden functions that require detailed documentation based on their operational context and performance standards defined by asset owners. Therefore, function statements consider both the operational context and user-defined performance levels (Boral and Chakraborky, 2021). Functional failures arise when assets cannot fulfill their intended functions at the required performance level. Failure is inherently linked to a required task, typically defined by performance or functional requirements. It occurs when a function cannot be executed or performance deviates from established parameters. Upon failure, equipment enters a malfunctioning state, characterized by unintended operation (Zhu and Liu, 2021).
Functional failure
According to the Society of Automotive Engineers (SAE JA1011), functional failure is defined as “a condition in which a physical asset or system is unable to perform a specific function to the required level of performance.” It is important to have a full understanding of asset functions and the performance levels required to identify functional failures. There may be a complete or partial functional failure, where the asset is either unable to perform a particular function or perform it at a level less than required (Boral and Chakraborky, 2021).
Failure mode
Failure mode is a brief description of how a failure occurs (Zhu and Liu, 2021). This is the pattern we are trying to prevent, and if we fail to prevent it, we must fix it. A failure mode can be defined as the way a failure in an element is observed, or a description of the possible state of the element after it fails (Liu et al., 2022; Xu et al., 2020a). Each failure mode is usually evaluated for its effect, considering its impact on the device in question, the next higher-level subsystem, and the system or factory as a whole (Lee et al., 2016).
Classification of failure patterns
Failure patterns can be distinguished based on symptoms of failure. These faults are relatively easy to discover and are called “clear” or “gradual” faults. At other times, there were no symptoms or warnings of failure. Once a failure occurs, there is no longer any indication of its presence; rather, its effects are felt. These are called “hidden faults” or “surprises” (Lee et al., 2016).
Classification by failure causes
Malfunctions can be classified into two main types according to their causes, with some sources including a third type.
Primary failure
This type of failure does not result directly or indirectly from the failure of another element. An example is component failure due to natural causes such as aging, which requires repair or replacement to restore functionality (Ma et al., 2021).
Secondary failure
This failure results directly or indirectly from the failure or error of other components. It is usually caused by one or more of the following reasons: primary failure of another component in the system, environmental factors, or user behavior (Ma et al., 2021).
Command failure
This type occurs when a component is in a down state, owing to incorrect control signals or noise. Often, no corrective action is required to restore the component to the working conditions in this case (Arjomandi et al., 2021).
Classification by failure effects
The effects of failures are classified into categories based on their impact, such as safety, environment, operational capability, and cost. Generally, they can be classified into two types.
Critical failures
These have negative consequences for the organization by jeopardizing the achievement of business objectives. Functional failures that affect production capacity are classified as dangerous owing to economic risks. Failures that do not affect production capacity but have significant economic consequences owing to high repair or replacement costs, increased energy consumption, risks to individual health or safety, or damage to the company's image or reputation are also considered critical (Lee et al., 2016).
Non-critical failures
These do not affect production capacity, the safety of people, the environment, or the company's image and reputation. They are generally inexpensive to repair (Lee et al., 2016).
Reliability
Without a clear understanding of the failure terminology, reliability analyses can become confusing and lead to incorrect decisions. Failure modes significantly contribute to reduced reliability (Hao et al., 2022; Liu et al., 2020; Xu et al., 2020b). They can be defined as the probability that an element or system performs a specific function under certain operating and environmental conditions for a specific period. Reliability is the probability of success (not failure) (Galar et al., 2017). The primary role of reliability engineering is to identify and manage asset reliability risks that can negatively impact factories and business operations. This broad role can be broken down into three smaller and more manageable roles: eliminating loss, risk management, and life cycle management of assets (Laubach, 2021).
Reliability-based maintenance (RBM)
RBM involves the evaluation of risks to understand the potential failures of a system and its consequences. The risk assessment process consists of four steps:
Understanding failures: Identifying potential failures and assessing their probability. Failure prevention: Examining methods to prevent failures. Mitigating consequences: Reducing the negative consequences of failures. Planning and procedures: Developing plans and procedures to address failures when they occur.
The first stage, which involves understanding the potential sources of risk, includes evaluating where failures might occur and their likely consequences. Failure to recognize these risks can lead to further issues. Following this, the remaining risk assessment activities focus on implementing measures to prevent or reduce the impact of potential failures and address them if they occur (Bahamid et al., 2022; JTFTI, 2018). RBM employs tools such as FMEA to assess and mitigate asset risks through strategic and appropriate maintenance activities (Galar et al., 2017).
FMEA
FMEA is a systematic approach employed to identify potential and known failure modes within systems, products, processes, or services, and analyze their impact on users or the system itself. This methodology facilitates risk assessment and prioritization of identified failure modes, enabling proactive interventions and corrective actions for critical failures to enhance reliability and safety. Essentially, FMEA allows analysts to strategically allocate resources by prioritizing failure patterns based on risk level (Lv et al., 2019; Pascu et al., 2020; Taylor and Ranganathan, 2013; Wang et al., 2022b). Historically, FMEA has served as a valuable tool in supporting design, manufacturing, service, and maintenance processes. While its origins trace back to the 1920s, its documented use became prominent in 1949 when adopted by the US military to identify potential failures in various processes. The efficacy of FMEA in identifying and evaluating failure effects led to its adoption by NASA in the 1960s for the Apollo Space Program. Subsequently, it was integrated into the aviation industry in the mid-1960s and the automotive industry in the 1970s by Ford Motor Company (Davis, 2013). FMEA's application has since expanded to diverse fields, including nuclear, semiconductor, food service, plastics, software, and healthcare (Górny, 2019; Pascu et al., 2020; Wolniak, 2019). In pursuit of enhanced component reliability, FMEA utilizes the RPN to prioritize system failure risks, as illustrated in Figure 1 (Bluvband et al., 2004; Dumitrescu et al., 2016; Górny, 2019; Pillay and Wang, 2003; Wolniak, 2019). The RPN was calculated using the following equation:

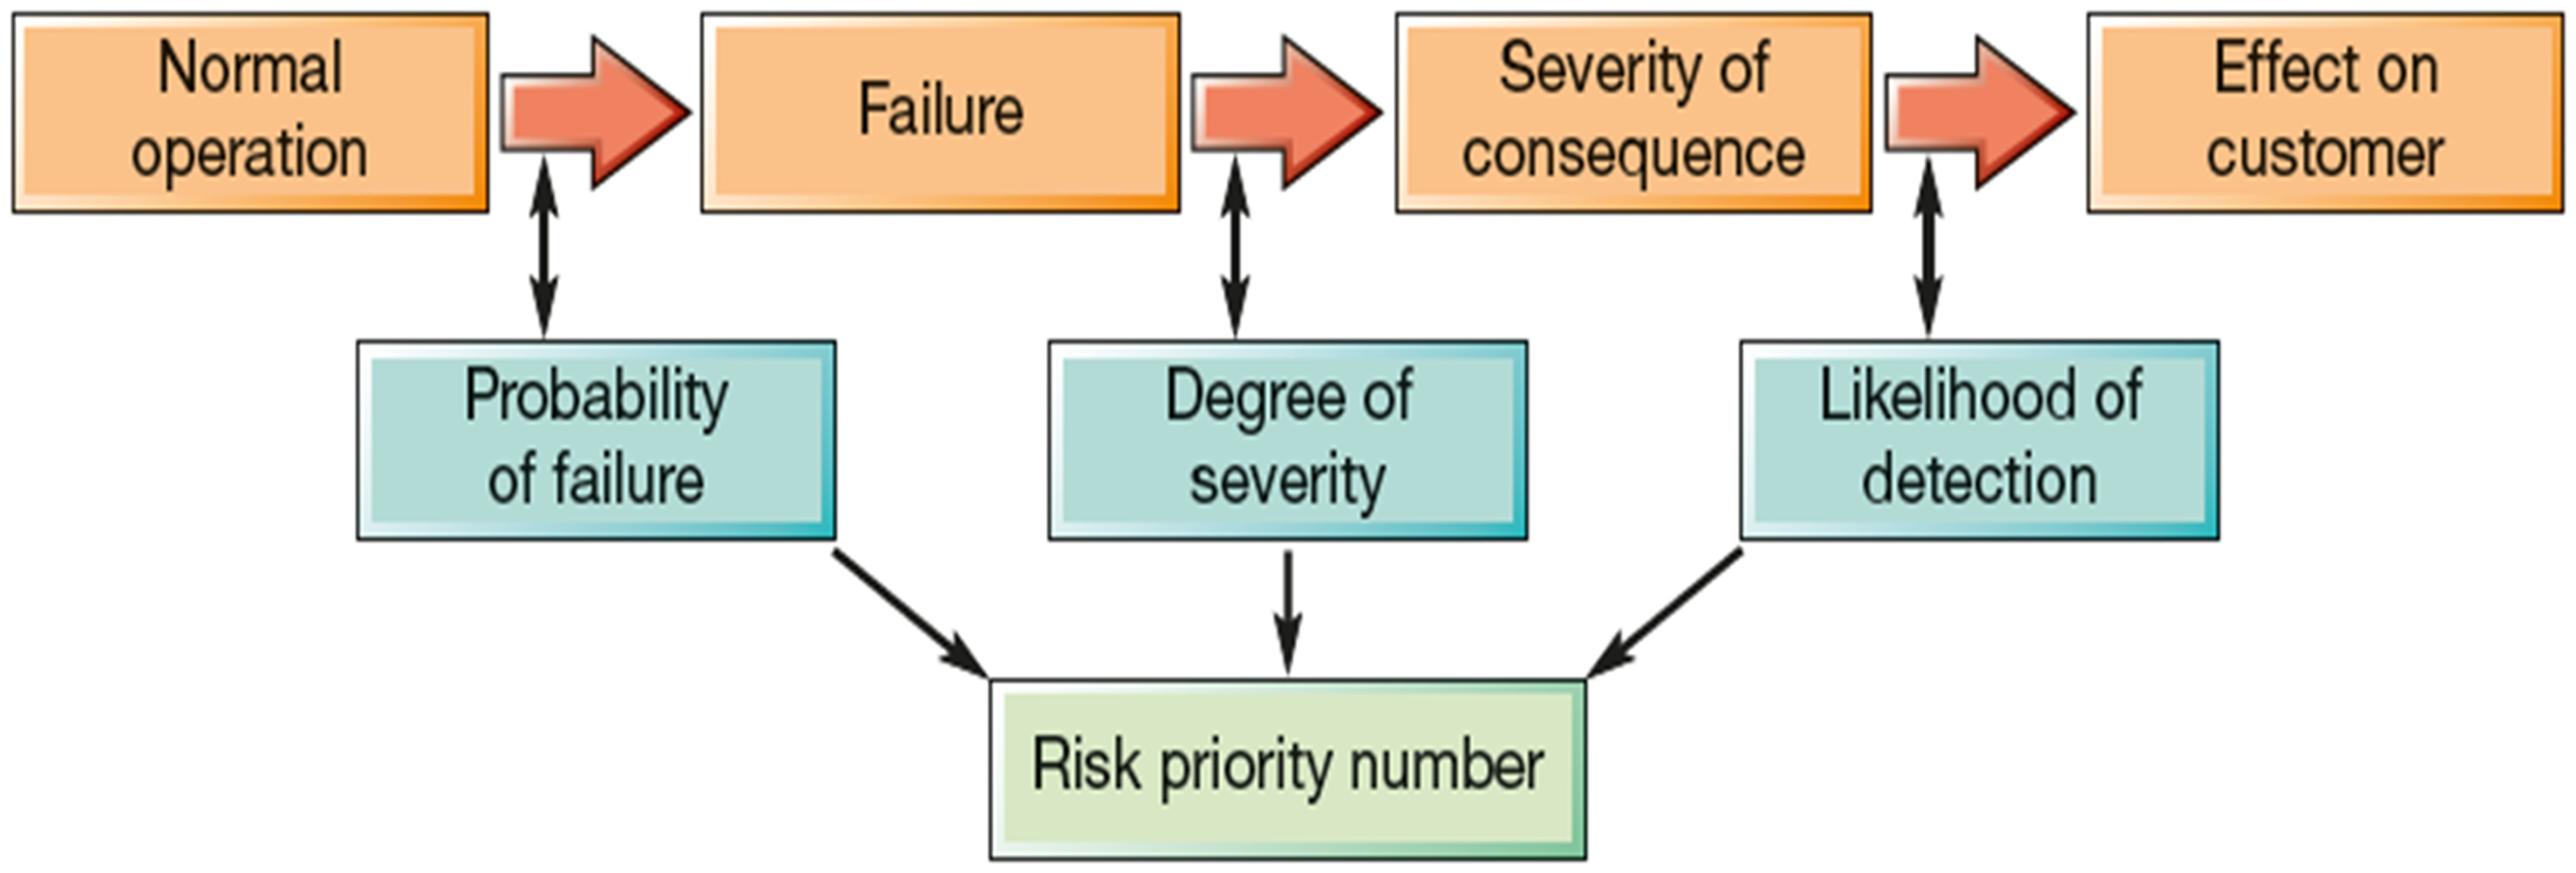
Steps to apply the method failure mode and effects analysis (FMEA) (Slack et al., 2016).
Despite the popularity and prevalence of the FMEA method, it has some limitations. The FMEA methodology faces a scale limitation, as it relies on the multiplication of ordinal ratings to calculate the RPN, which can result in inconsistent risk prioritization due to the non-linear and non-compensatory nature of the scales. Additionally, it neglects to identify factors of influence and impact and does not consider the direct and indirect relationships between failure modes and causes. This method can only analyze one impact factor according to its priority, making it ineffective for systems with multiple failure modes whose effects are simultaneous or interact with each other.
MCDM
MCDM methods provide structured frameworks for navigating the complexities of decision-making when multiple objectives are at play. These methods aim to identify the optimal choice among available alternatives by considering potentially conflicting criteria (Ilbahar et al., 2019; Rekik and El Alimi, 2023a, 2023b, 2023c; Shao et al., 2020). The MCDM process generally involves defining objectives, establishing criteria to measure those objectives, identifying alternatives, quantifying criteria measurements, and applying a mathematical algorithm to rank and select the best alternative (Rekik et al., 2025a; Rekik and El Alimi, 2024a, 2024b, 2024c). The weighted sum method is commonly applied and practical, but it can be enhanced by incorporating more sophisticated techniques, such as outranking methods or non-linear aggregation functions, to more effectively address complex decision-making scenarios and provide a more solid theoretical foundation (Belton and Stewart, 2002). This process acknowledges the inherent uncertainties, complexities, and potential conflicts among objectives, accommodating both cardinal and ordinal criteria, as well as precise and ambiguous information (Alkout et al., 2024; Rekik, 2024; Rekik et al., 2025b). The strength of MCDM lies in its ability to guide decision-makers toward a solution that addresses these challenges (Lee and Yang, 2018; Rekik and El Alimi, 2024d). Effective decision-making is paramount in management, as organizational success hinges on the quality of decisions made. This involves accurately defining objectives, exploring potential solutions, evaluating feasibility, assessing consequences, and ultimately selecting and implementing the chosen solution (Alinezhad and Khalili, 2019; Rekik and El Alimi, 2021). Furthermore, it is a critical determinant of organizational success, particularly in addressing multiple objectives simultaneously, as often encountered in risk, reliability, and maintenance contexts. Decisions related to rapid response mechanisms can have far-reaching implications for strategic outcomes, human life, safety, public health, and the environment (De Almeida et al., 2015).
Fuzzy logic
Traditional MCDM methods operate under the assumption of clearly defined criteria and weights, facilitating straightforward ranking and selection of alternatives. However, real-world decision-making scenarios often involve imprecise or ambiguous criteria, posing challenges for traditional methods. In many instances, criteria performance can only be expressed qualitatively or linguistically, necessitating more specialized approaches (Hashmi et al., 2021; Kahraman, 2008). First proposed by Zadeh, fuzzy logic theory, a mathematical framework, enables programs to simulate real-world reasoning by handling vague and imprecise inputs or knowledge (Mytilinou and Kolios, 2017). Unlike traditional binary logic, which assigns strict true or false values (one or zero), fuzzy sets allow for partial truths, reflecting the nuances of real-world logic.
DEMATEL model
The DEMATEL method effectively identifies cause-and-effect relationships within complex systems. It analyzes interconnections between factors and visually represents these relationships to determine critical factors (Chen et al., 2014; Si et al., 2018). Developed as an MCDM technique by Fontela and Gabus in the early 1970s at the Battelle Memorial Institute, DEMATEL transforms complex interrelationships into a clear structural model, categorizing factors into cause and effect groups. This method provides a practical tool for analyzing relationships and interdependencies within complex systems, facilitating long-term strategic decision-making, and identifying areas for improvement (Rekik and El Alimi, 2024d, 2024e). A key characteristic of DEMATEL is its use of matrix operations to highlight causal relationships and the degree of influence between factors (Tsai et al., 2017). Table 1 presents several recent studies that have applied the DEMATEL technique, whereas Figure 2 illustrates the framework and direction of the impact of each factor.
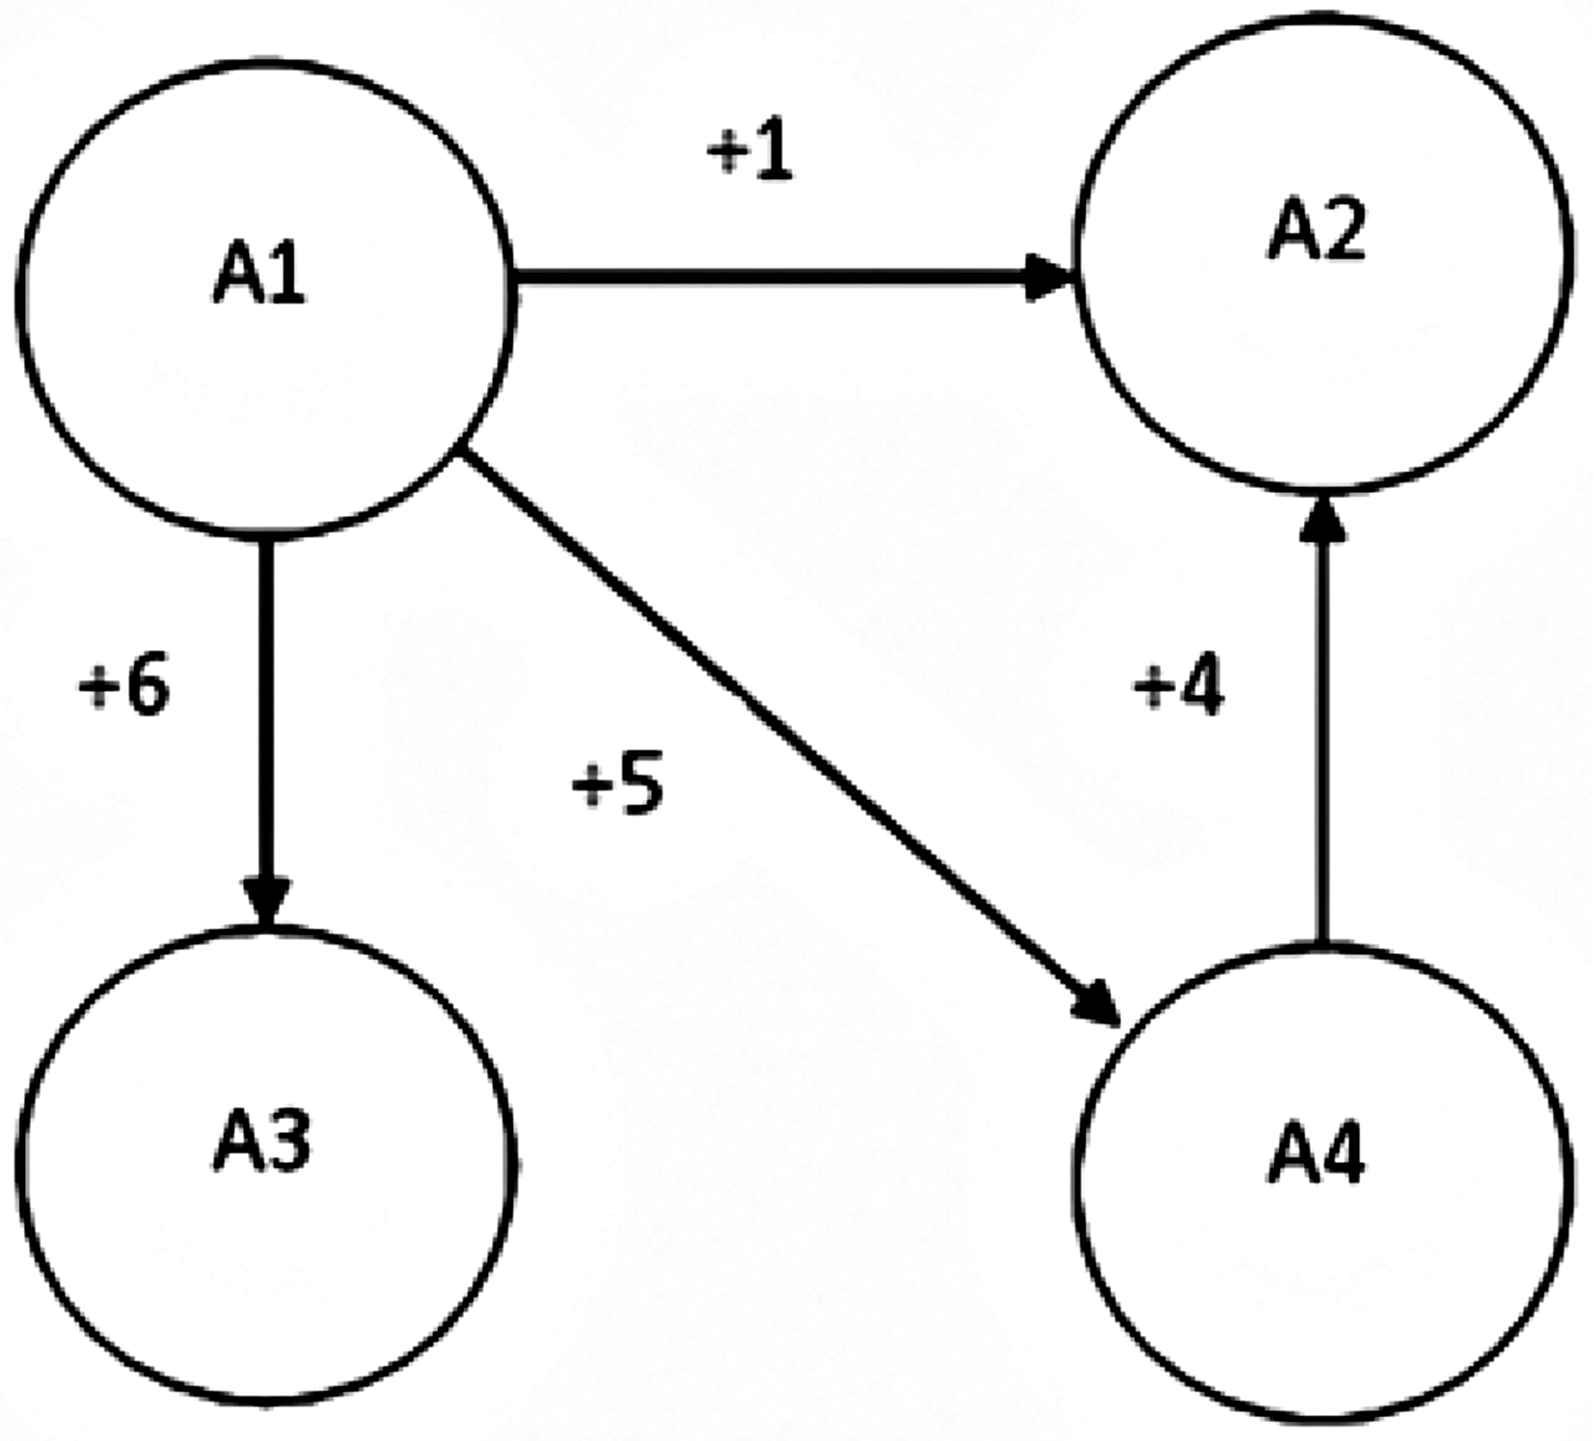
Influence relationship diagram (Tsai et al., 2017).
The use of DEMATEL in various fields in literature.
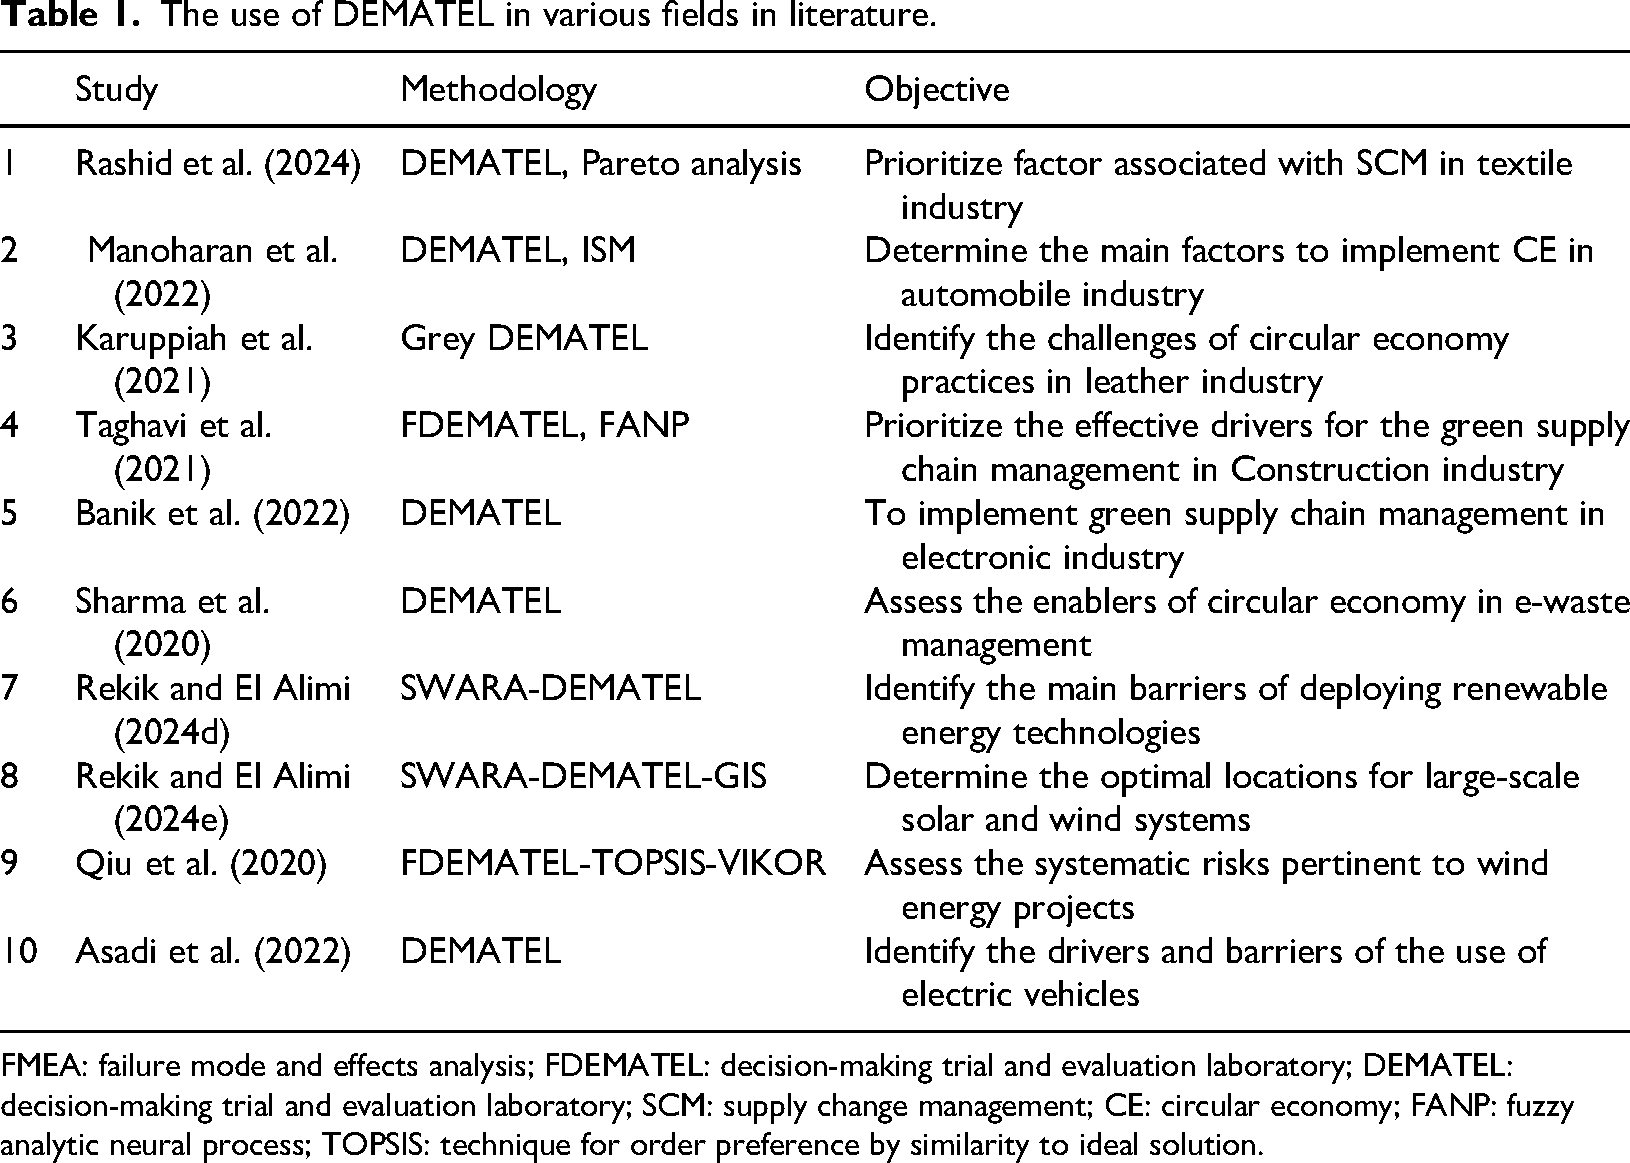
FMEA: failure mode and effects analysis; FDEMATEL: decision-making trial and evaluation laboratory; DEMATEL: decision-making trial and evaluation laboratory; SCM: supply change management; CE: circular economy; FANP: fuzzy analytic neural process; TOPSIS: technique for order preference by similarity to ideal solution.
The influence relationship diagram derived through the DEMATEL method indicates that factor A1 functions as the principal causal element, exerting a low influence on A2 (+1), a strong influence on A4 (+5), and a very strong influence on A3 (+6), thereby positioning A1 as the primary driver within the system. Furthermore, A4 demonstrates a significant influence on A2 (+4), suggesting that A2 operates predominantly as a dependent factor, indirectly shaped by A1 through A4 as well as directly. This configuration underscores the pivotal role of A1 in propagating influence throughout the network, with A4 acting as both an influenced and influencing factor, and A3 and A2 primarily serving as recipients of influence.
The selection of FDEMATEL in this study is based on its unique capability to model and visualize causal relationships among failure modes, which is essential for understanding the interdependence and propagation effects in complex systems such as power plants. While methods like AHP and ANP are effective for hierarchical decision-making and handling interrelated criteria, they primarily focus on priority ranking rather than capturing the direction and strength of influence between elements. Fuzzy TOPSIS, on the other hand, is suitable for evaluating and ranking alternatives based on proximity to an ideal solution but lacks the structural insight into cause-effect dynamics. Since the primary objective of this study is not only to prioritize faults but also to understand how certain failures influence or is influenced by others, FDEMATEL offers the most appropriate framework. Table 2 summarizes the comparative strengths of each method and supports the selection of FDEMATEL for this article (Saaty, 2001; Wu and Lee, 2007).
Comparison of MCDM methods based on key features.
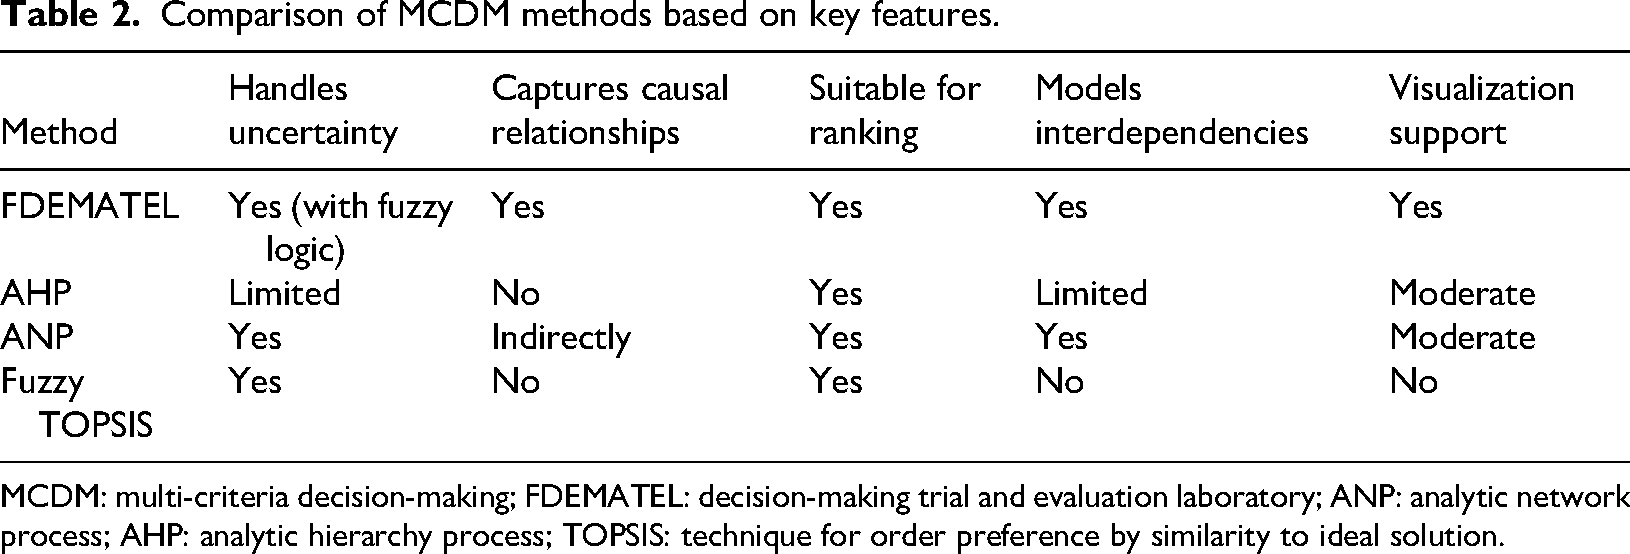
MCDM: multi-criteria decision-making; FDEMATEL: decision-making trial and evaluation laboratory; ANP: analytic network process; AHP: analytic hierarchy process; TOPSIS: technique for order preference by similarity to ideal solution.
Two primary types of fuzzy DEMATEL models exist: classical and a fuzzy-based DEMATEL model, the latter being employed in this article. Fuzzy logic addresses the inherent ambiguity and imprecision in estimating influence degrees. Fuzzy numbers are processed throughout the DEMATEL analysis and finally converted to crisp values for decision-making (Si et al., 2018). A fuzzy membership function quantifies the degree of membership of an element to a fuzzy set, ranging from 0 to 1. Various types of fuzzy membership functions exist, with the triangular fuzzy function being commonly used due to its simplicity and clarity in representing fuzzy numbers (Rekik and El Alimi, 2023d, 2023e, 2024f ). A triangular fuzzy number (TFN) is defined by three values (l, m, u) representing the lower, medium, and upper bounds, respectively. The fuzzy number function can be described by the following equation: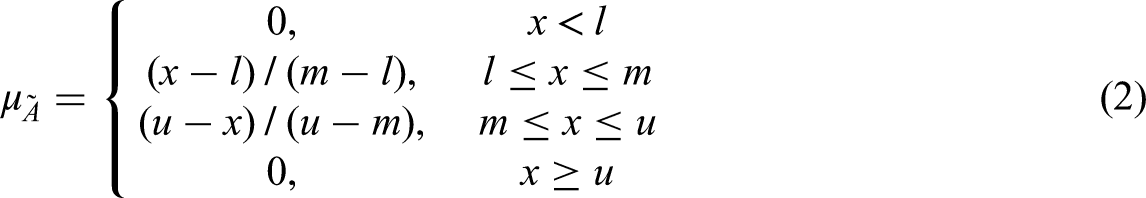
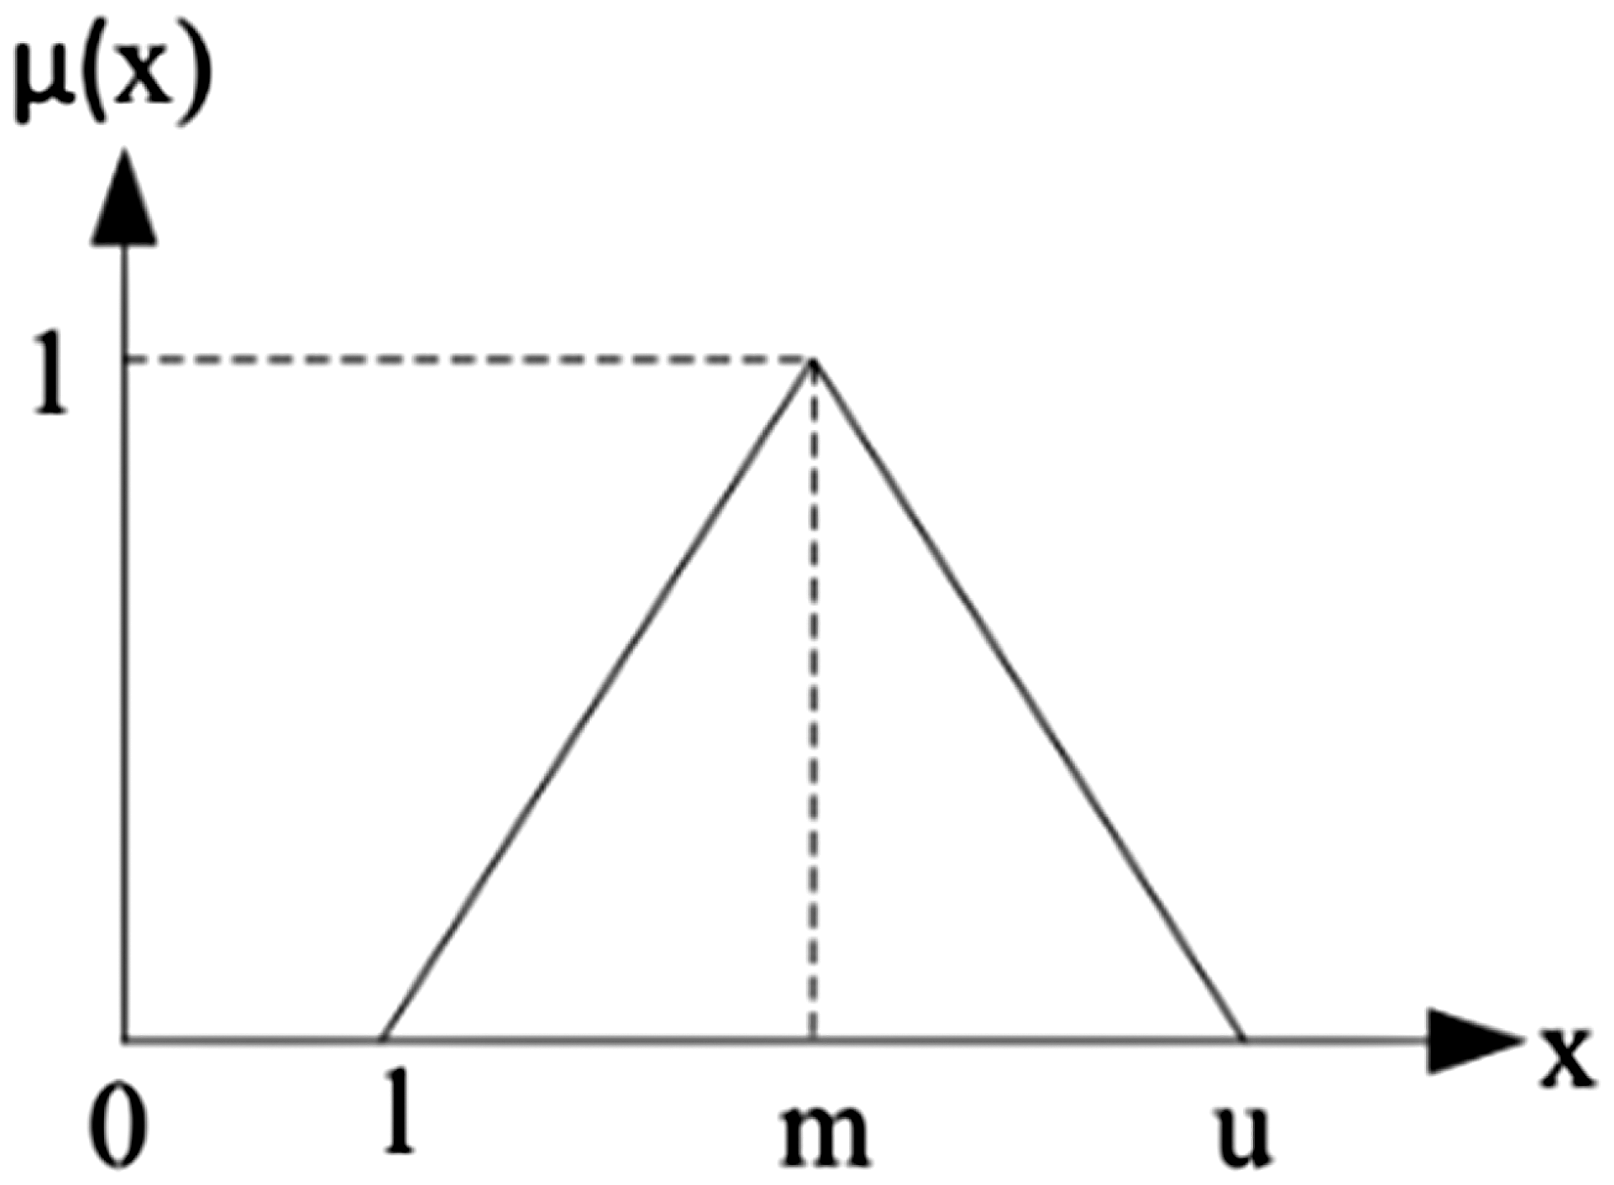
Triangular fuzzy numbers (Suzan and Yavuzer, 2020).
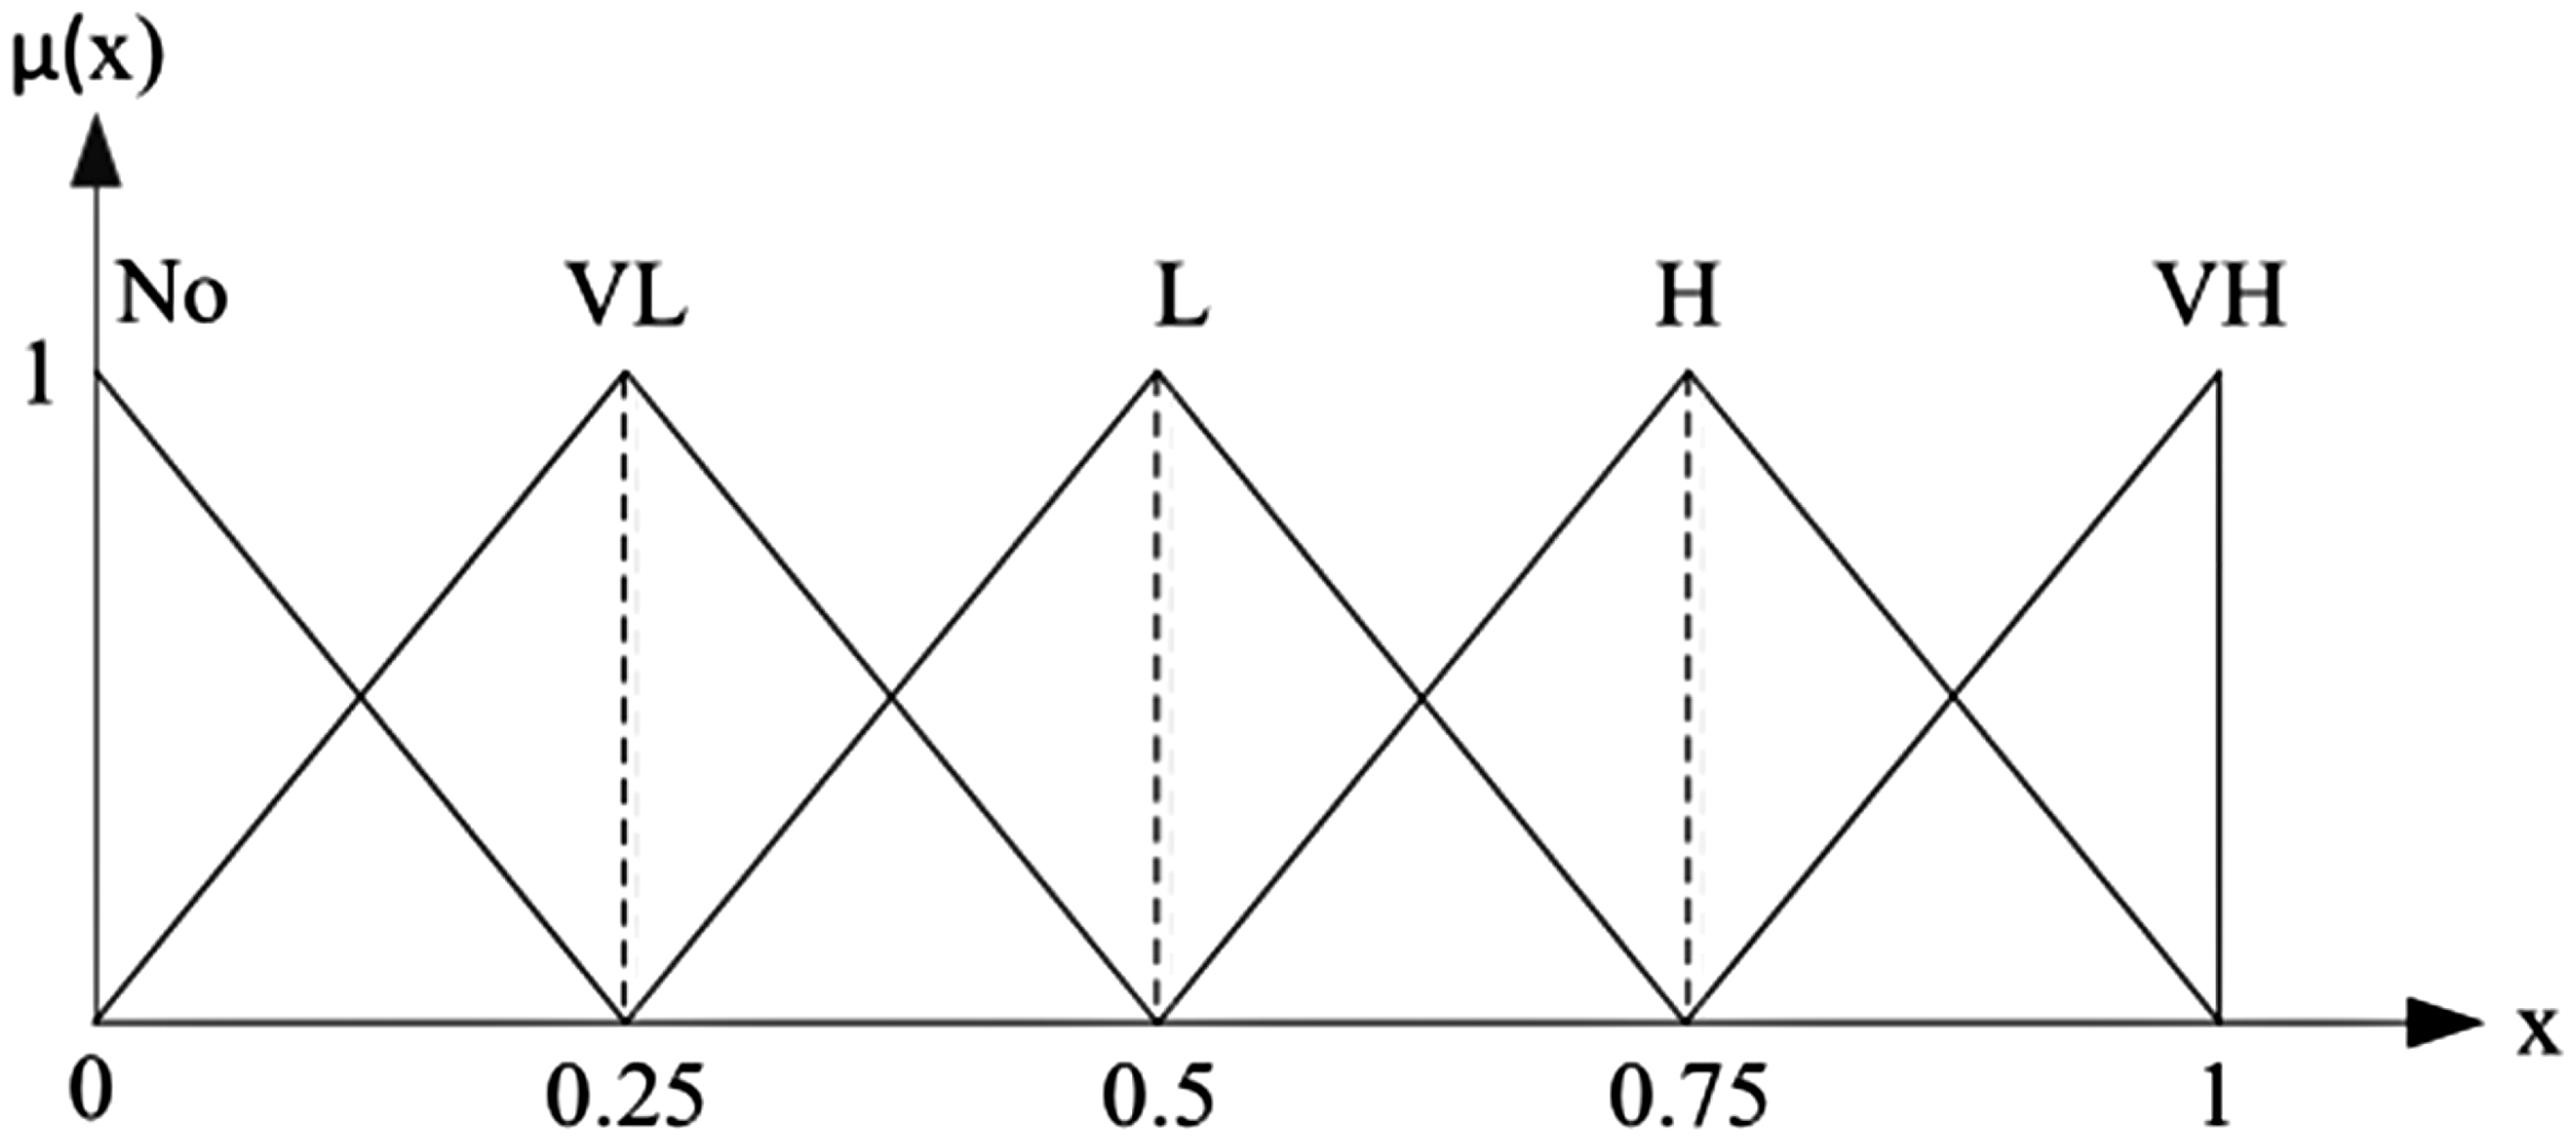
Fuzzy evaluations and their associated affiliation functions (Suzan and Yavuzer, 2020).
Relationship between expert linguistic terms and trigonometric ambiguous numbers.
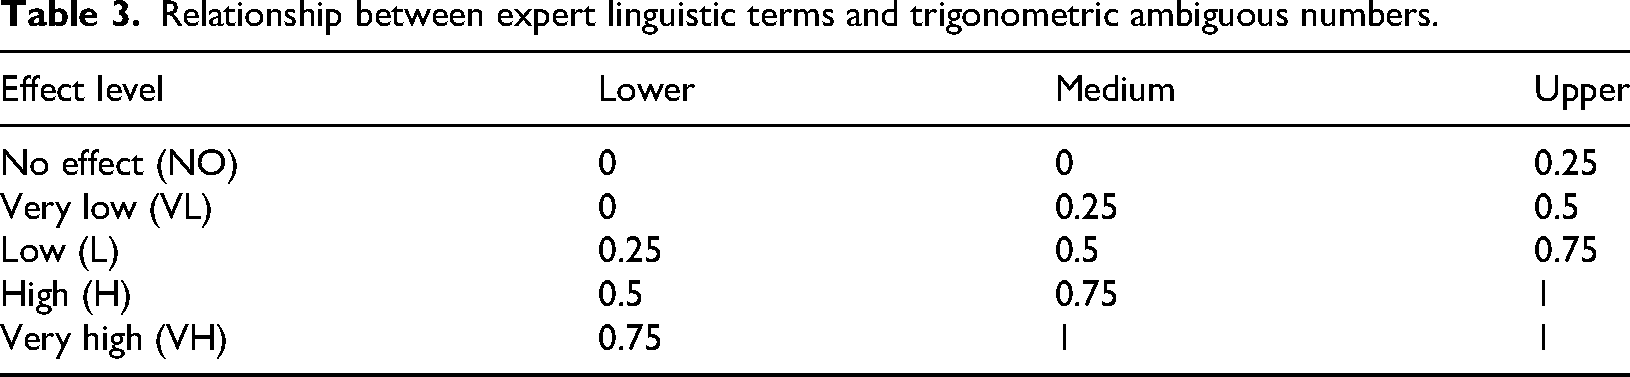
To mitigate ambiguity arising from overlapping fuzzy intervals such as the shared boundary at 0.25 between no effect and adjacent categories expert interpretation was standardized through a structured calibration process and consensus-building sessions prior to data collection. This alignment ensured consistency in linguistic-to-numeric mappings during the construction of the direct-influence matrix, minimizing subjectivity in defining TFNs (e.g. low as 0.25–0.5). The causal diagrams and factor rankings derived from the FDEMATEL framework revealed stable relative positioning and classification of key influencing factors despite the inherent vagueness of fuzzy logic. This stability underscores the robustness of the approach in capturing expert judgment while maintaining interpretative validity, even without formal sensitivity testing. Thus, the structured calibration process successfully reduced reliance on arbitrary boundary definitions, supporting the reliability of the model for critical maintenance prioritization in high-stakes environments.
The triangular membership functions often imply fixed bounds on certainty, and there is flexibility in fuzzy evaluations to adjust the representation of uncertainty. The uncertainty in the membership function can indeed be treated as a tunable parameter, especially when it is necessary to reflect different levels of certainty across different factors. This can be done by adjusting the parameters of the membership function or by selecting different types of membership functions to more accurately capture the uncertainty associated with each specific factor (Dalalah et al., 2011).
It is to be noted that TFNs undergo various arithmetic operations. Suppose two fuzzy numbers 


After this quick look at fuzzy logic, let us return to the steps of FDEMATEL (Si et al., 2018):
Evaluating the mutual influences between factors using a fuzzy linguistic measure, where a single fuzzy matrix of direct influence

A fuzzy matrix with a direct effect was normalized to the group. 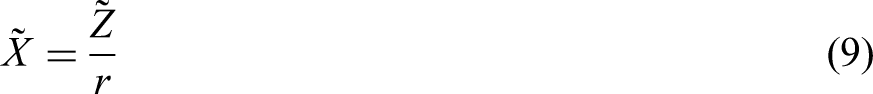
Obtain the total impact fuzzy matrix 

“I” refers to the identity matrix which is a square matrix with all elements equal to zero except for those on its main diagonal, where they are all equal to one, its most important property is that the product of any matrix with the identity matrix equals the matrix itself. The elements of the TFNs in the matrix,
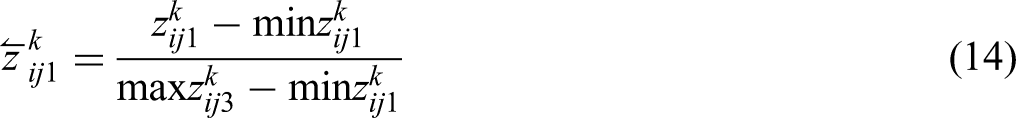
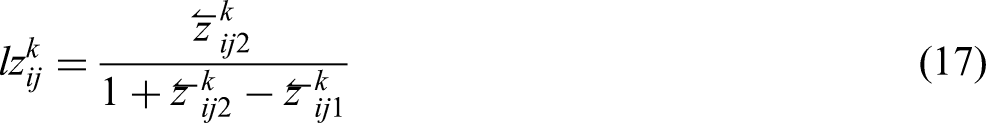
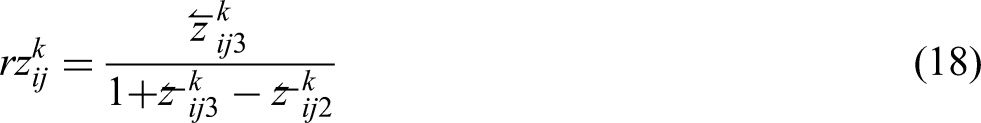
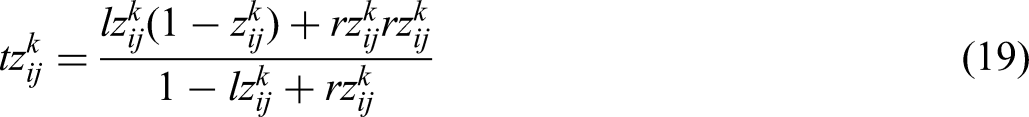
Convert fuzzy values to crisp values as follows:
Normalize fuzzy numbers using the following equations: Calculate the measured values for the left and right sides using the following equations: Calculate the total apparent measured value using the following equation: Calculate the explicit values


Draw the influential relation map (IRM) by summing the rows and columns of the total influence matrix (T) as shown in the following equation: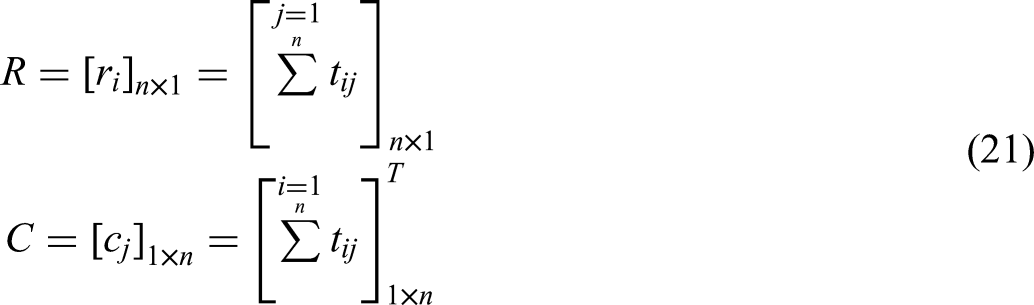
The index
The index
The index
The index
The map of influential relationships is divided into four quadrants, as shown in Figure 5. By calculating the average, the factors in the first quadrant were identified as primary factors or donors because of their high importance and relevance (R + C). Factors in the second quadrant are identified as drivers or independents because they have low importance, but high relationships. Factors in the third quadrant have low importance and relationships, and are relatively separate from the system, also called independent factors or independent receptors. Factors in the fourth quadrant have high importance but low correlation and are called receptors, which are affected by other factors and cannot be directly improved. Decision-makers can visually uncover complex causal relationships between factors and gain valuable insights for decision-making.
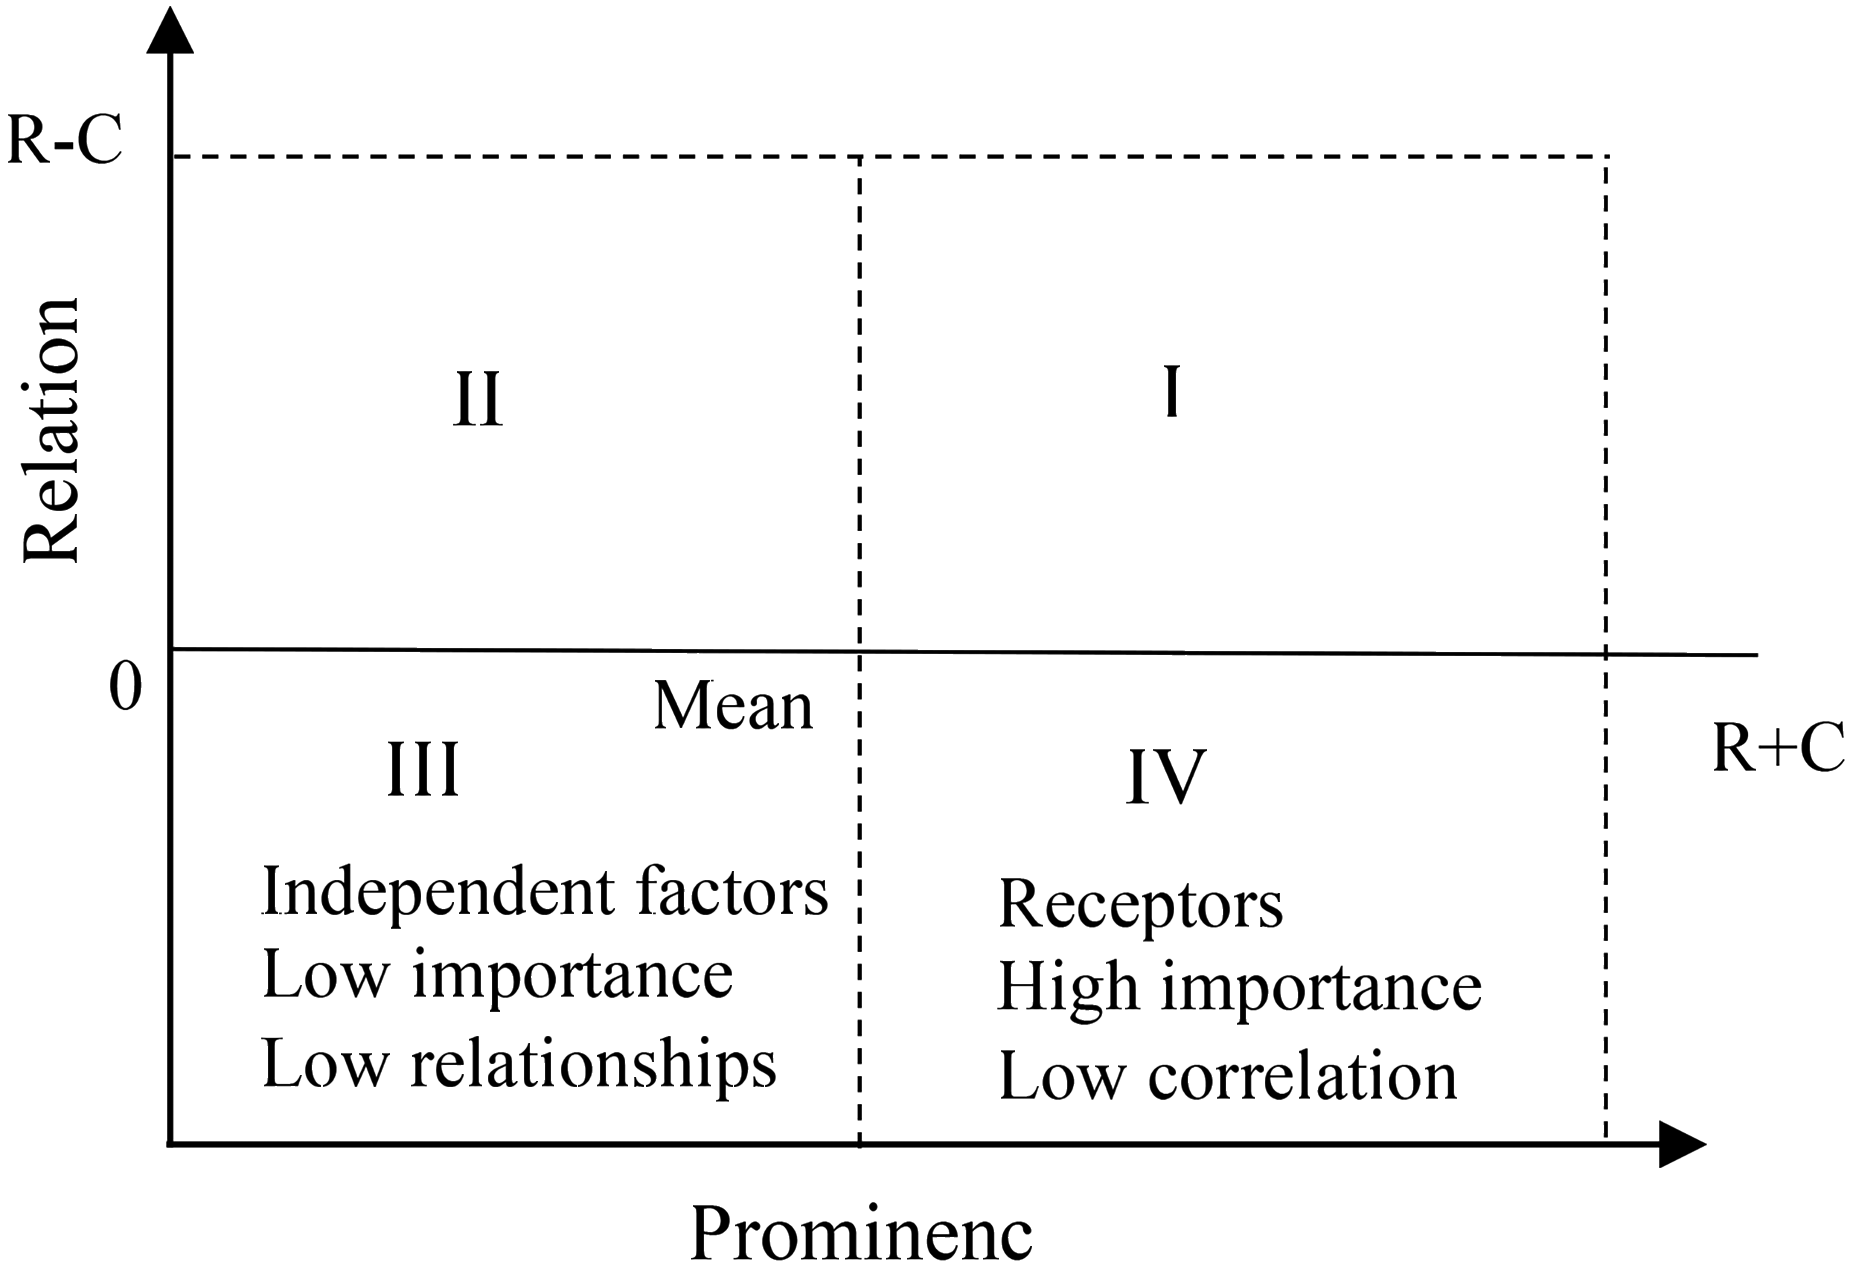
Segmentation of the influential relationships map (Si et al., 2018).
To easily interpret the results and maintain the manageability of the system complexity, a threshold value 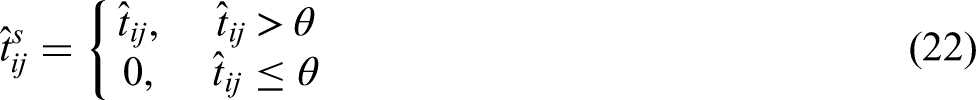
Case study
Libya relies on hydrocarbon energy for electricity generation at a rate of ∼100%. Therefore, three types of thermal power plants are widespread: gas turbine power plants, internal combustion or diesel power plants, and steam turbine power plants. They rely on various types of fuel that are converted into thermal energy after combustion and from there into kinetic energy by directly exploiting combustion gases, as in gas turbine power plants or diesel power plants, or by heating water and using steam pressure to move turbines, as in steam power plants. This mechanical power is transferred to electric generators via a shaft to transmit motion, which, in turn, is converted into electrical power with specific standards and performance. The performance of any power plant can be determined using the following four elements:
Ability to meet functional needs. Efficiency in the effective use of energy input. Reliability in starting or continuing the job. Maintainability for a quick return to service after any failure.
The ability and efficiency are affected by how well the station is designed and built, while reliability and maintainability are operational issues. The ability to continue operating the power plant and the efficiency of the repair with the aim of returning to service operations are crucial (De Sousa, 2012).
Failure modes in power plants are an integral part of a plant's operating environment, and their assessment, classification, and impact remain the basis for dealing with them. This research focuses on the extent of the impact and influence of each failure mode on the rest of the Misurata dual power station by applying the FMEA method and FDEMATEL model using Excel and Python as part of the risk assessment process. This will help in prioritizing precautionary measures to prevent occurrences or mitigate effects and the subsequent allocation of resources, which leads to an increase in the reliability of the station, thereby reducing maintenance costs and overall operating costs.
Misurata Dual Power Station
The Misurata Dual Power Station is classified as one of the largest and largest stations in the electricity grid in Libya. It is one of the stations established by the General Electricity Company to meet the increasing energy demand. Construction of the station began at the beginning of 2008 in the Qasr Ahmed area on the Mediterranean coast, 15 km east of the center of Misurata City. It entered the service at the end of 2013. The current energy yield reaches 1390 MW.
Data collection
As part of the FMEA process, the data for severity, occurrence, and detection scores were assessed by experts based on the maintenance records of the Misurata Dual Power Station. Each failure mode was scored on a scale of 1 to 10 by experienced engineers and technicians from various departments within the power station. They were then classified by the causes of failure into a secondary classification so that the secondary failure pattern included any primary failure patterns for any unit that made up the system. For example, Cooling System Failure (COSF) includes any failure in the system components, such as the failure of one or more cooling fans for any reason, bearing failure, disconnection or looseness of the transmission belt, and any leakage in the exchangers or any other failure in the electrical or mechanical system components.
Results
The FMEA involved evaluating the failure modes across three categories: severity, occurrence, and detection, each scored on a scale of 1 to 10 by experienced engineers and technicians from various departments within the Misurata Dual Power Station. The RPN for each failure mode was calculated using equation (1). Results presented in Table 2 indicate “Exhaust Gas System Leak” as the most critical failure mode due to its high RPN, driven by a high occurrence rate despite a lower severity classification. “Fuel Filter Clogged” ranked second, with a high occurrence and severity similar to “Exhaust Gas System Leak,” but a lower detection score due to ease of identification. Table 4 presents the remaining identified faults in descending order of the RPN. Table 4 also highlights the areas for improvement in each failure mode. Higher scores indicate a greater potential for improvement, with higher severity scores prompting preventative measures, high occurrence scores necessitating investigation into design and environmental factors, increased preventative maintenance, and high detection scores requiring improved detection methods.
Application results FMEA.
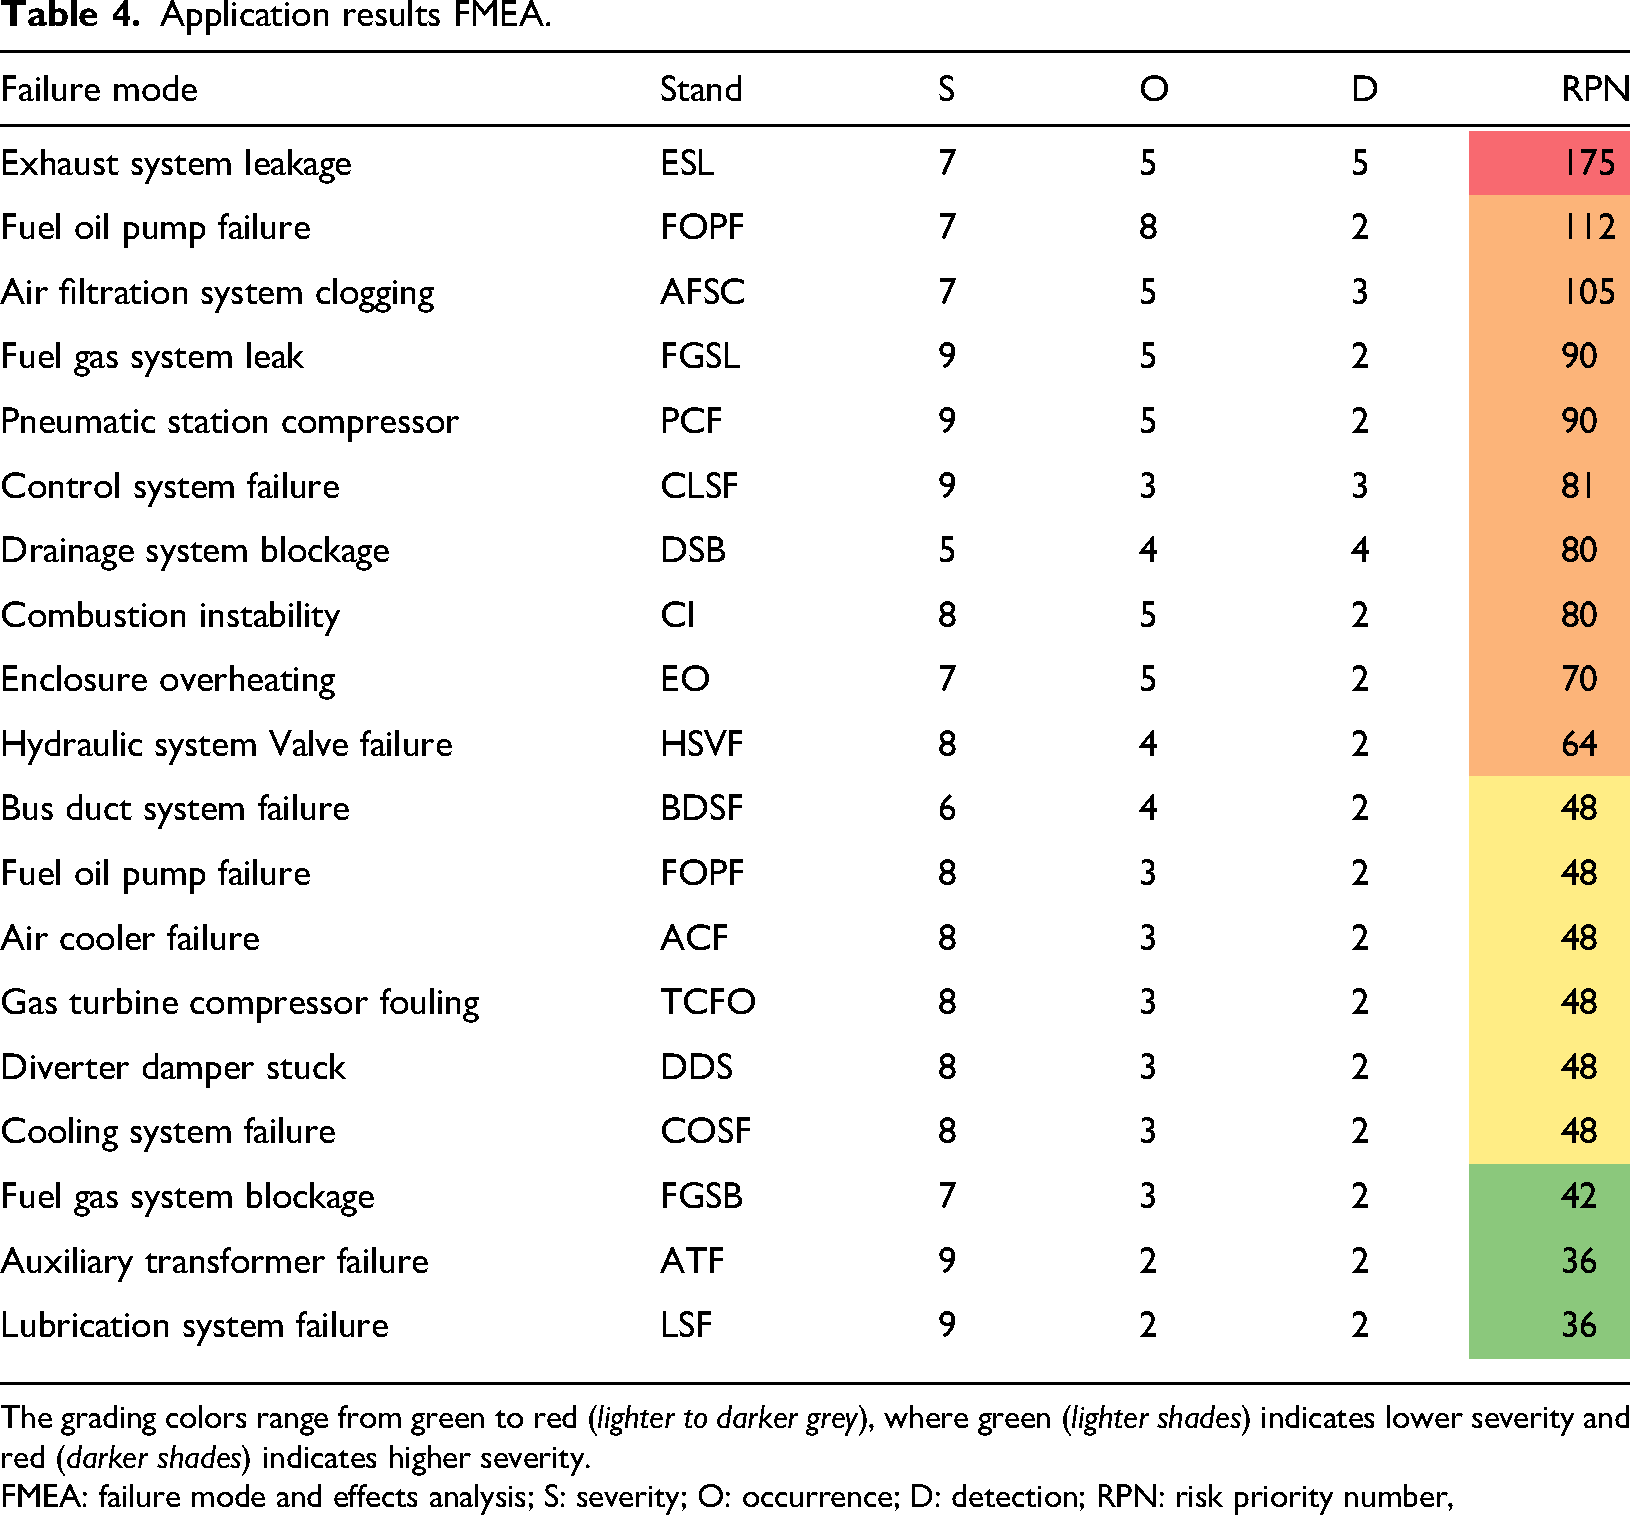
The grading colors range from green to red (lighter to darker grey), where green (lighter shades) indicates lower severity and red (darker shades) indicates higher severity. FMEA: failure mode and effects analysis; S: severity; O: occurrence; D: detection; RPN: risk priority number,
Based on the results of the FMEA, the top six failure modes were selected to evaluate the cause-effect relationships between failures using FDEMATEL. A 6 × 6 matrix was initially constructed using fuzzy numbers to represent the influence of each row element on each column element. Expert judgments were then used to populate the matrix, as shown in Table 5.
Expert language assessments.
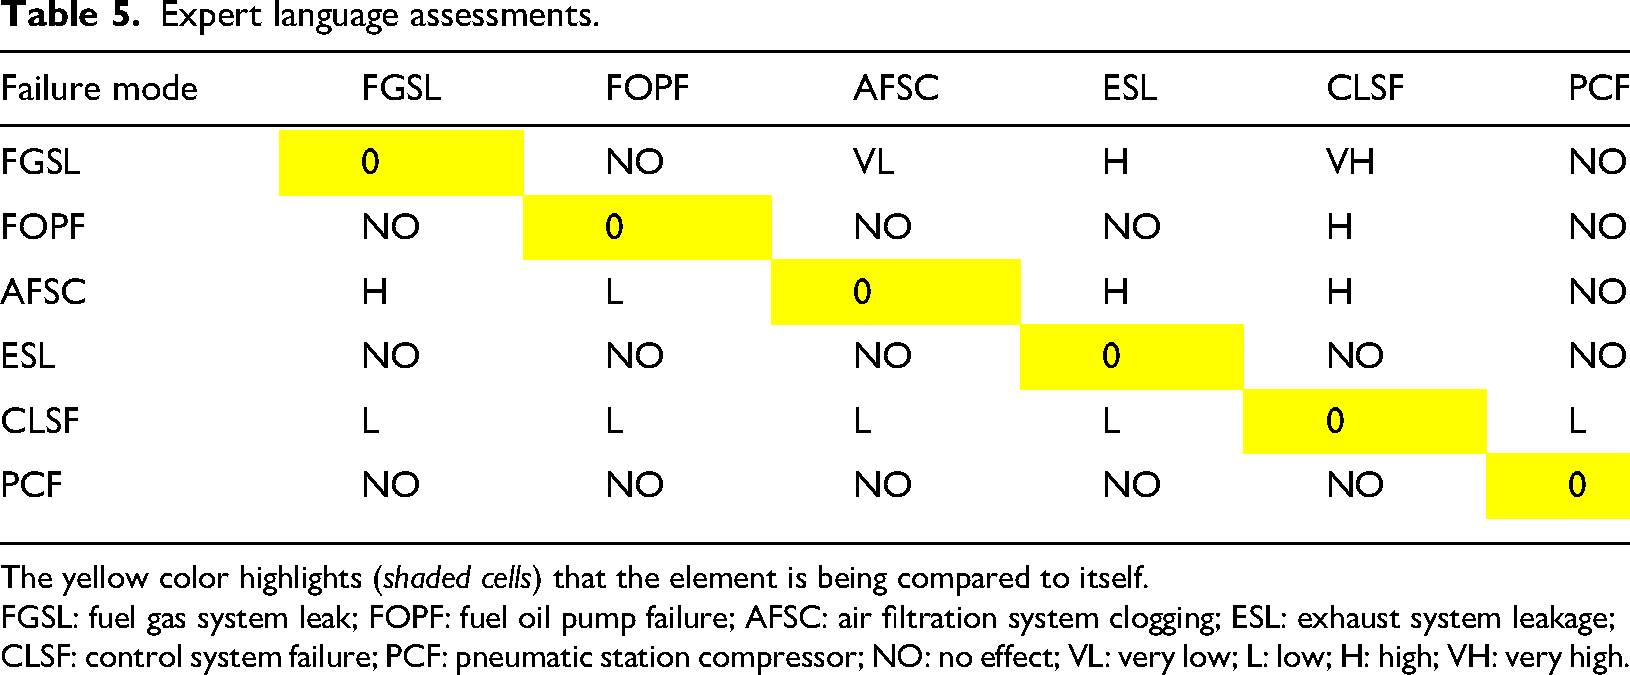
The yellow color highlights (shaded cells) that the element is being compared to itself. FGSL: fuel gas system leak; FOPF: fuel oil pump failure; AFSC: air filtration system clogging; ESL: exhaust system leakage; CLSF: control system failure; PCF: pneumatic station compressor; NO: no effect; VL: very low; L: low; H: high; VH: very high.
While the traditional RPN formula has known limitations, its role in our hybrid framework is intentionally limited to generating preliminary rankings, which are then rigorously refined by FDEMATEL to address non-compensatory risks. The RPN was retained for its simplicity, compatibility with historical data, and ease of expert validation, with severity scores (S ≥ 7) triggering mandatory review regardless of RPN. Crucially, all failure modes including low-RPN/high-severity cases like “Control system failure” (S = 9) were included in the FDEMATEL analysis to evaluate systemic interdependencies, ensuring high-severity failures were not overlooked. For instance, while “Fuel Gas System Leak” (S = 9, RPN = 90) ranked lower by RPN, FDEMATEL elevated its priority due to strong causal links to cascading outages. This dual-phase approach mitigates RPN's linear bias by integrating systemic risk propagation, where FDEMATEL's causal weighting inherently prioritizes severity-driven vulnerabilities. However, our case study demonstrated that the hybrid framework effectively balances simplicity with robustness, as FDEMATEL's interdependency analysis compensates for RPN's structural limitations, ensuring critical failures are holistically assessed.
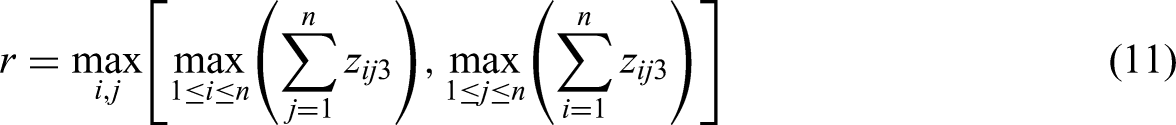
The expert opinions are converted to fuzzy values, and then the arithmetic mean of the sum of each threshold value of the expert opinions is taken separately to obtain a matrix (Z), as shown in equation (8). All the values of the matrix were normalized using equation (9). To calculate the value of (r), we used equation (11). The highest row sum was 3.6, while the highest column sum was 3.35; therefore, the value of (r) is

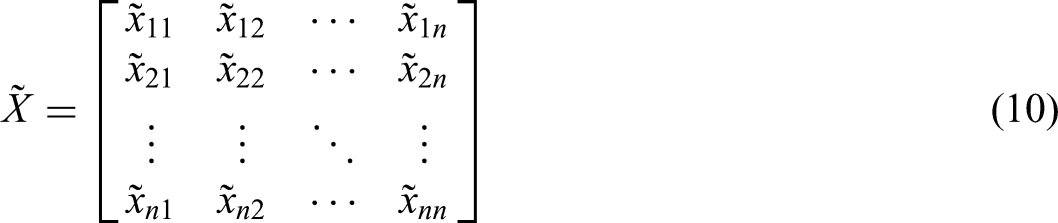
Then, each term of each fuzzy triangular number is divided by (r) to obtain the elements of the fuzzy direct relationship matrix, resulting in the normalized fuzzy direct relationship matrix, as shown in Table 6.
Fuzzy direct relationship matrix X.
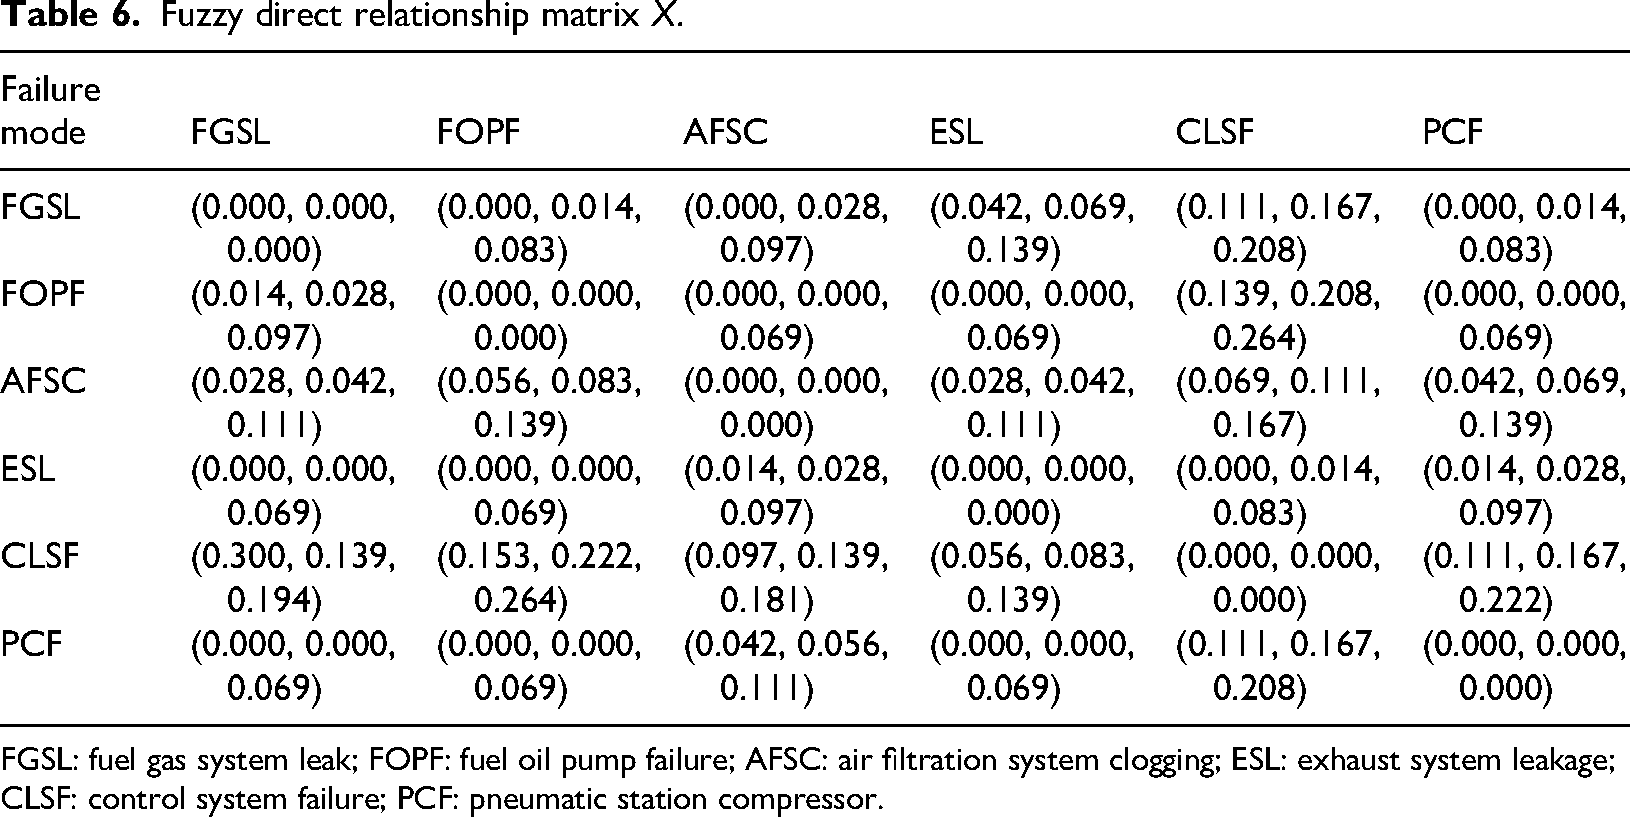
FGSL: fuel gas system leak; FOPF: fuel oil pump failure; AFSC: air filtration system clogging; ESL: exhaust system leakage; CLSF: control system failure; PCF: pneumatic station compressor.
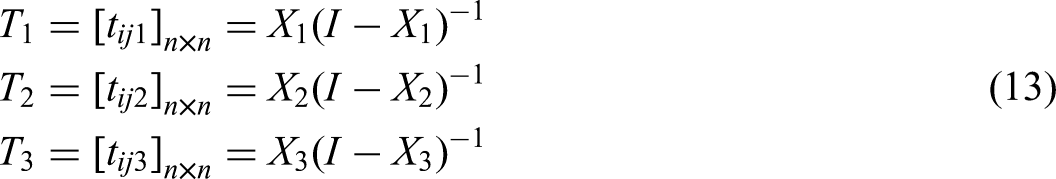
The total relationship matrix is calculated using the equation, resulting in a fuzzy triangular number for each element, as shown in equation (14). Here,
Overall explicit relationship matrix.
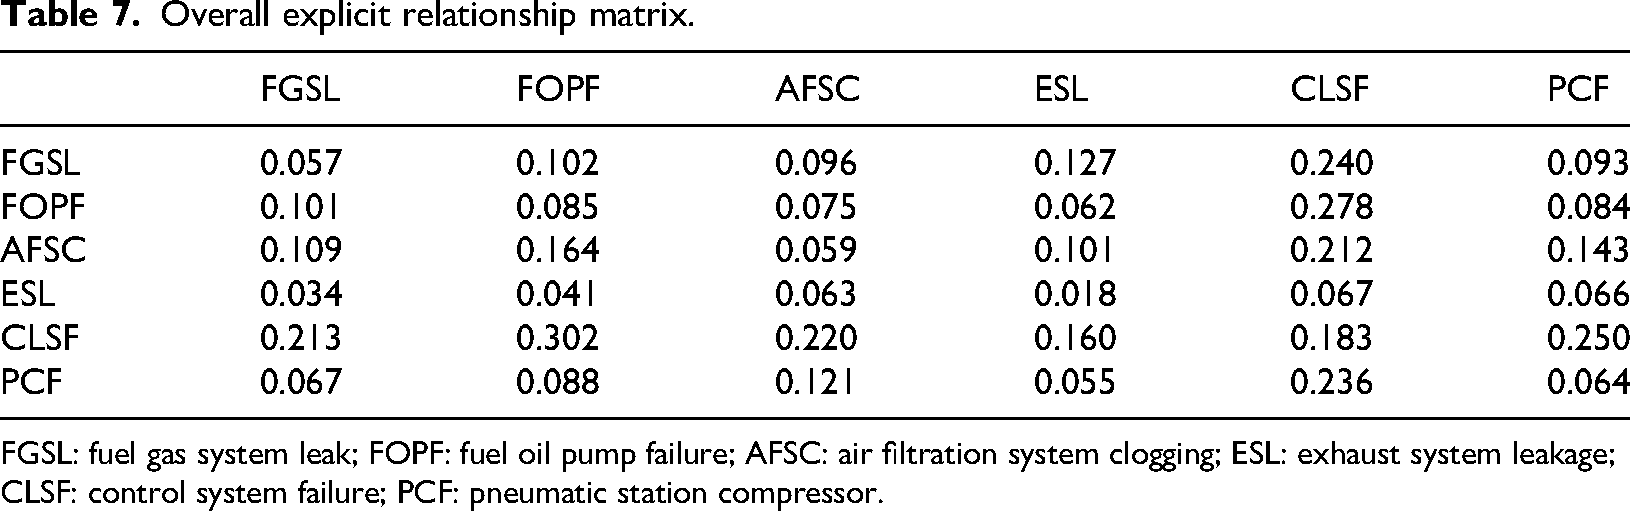
FGSL: fuel gas system leak; FOPF: fuel oil pump failure; AFSC: air filtration system clogging; ESL: exhaust system leakage; CLSF: control system failure; PCF: pneumatic station compressor.
Subsequently, the sum of each row (R) and column (C) of the matrix (T) was calculated using an equation. The row sum represents the total value for each failure mode, whereas the column sum represents the influence of the same failure mode on the other modes. This process was repeated for all six failure modes, as listed in Table 8. The sum of the row and column values (R + C) represents the degree of importance of each failure mode, whereas their difference (R – C) represents the degree of relationship. These values are visualized in a scatter plot, with (R + C) on the horizontal axis and (R − C) on the vertical axis, depicting the influential relationships between the failure modes.
Final output.
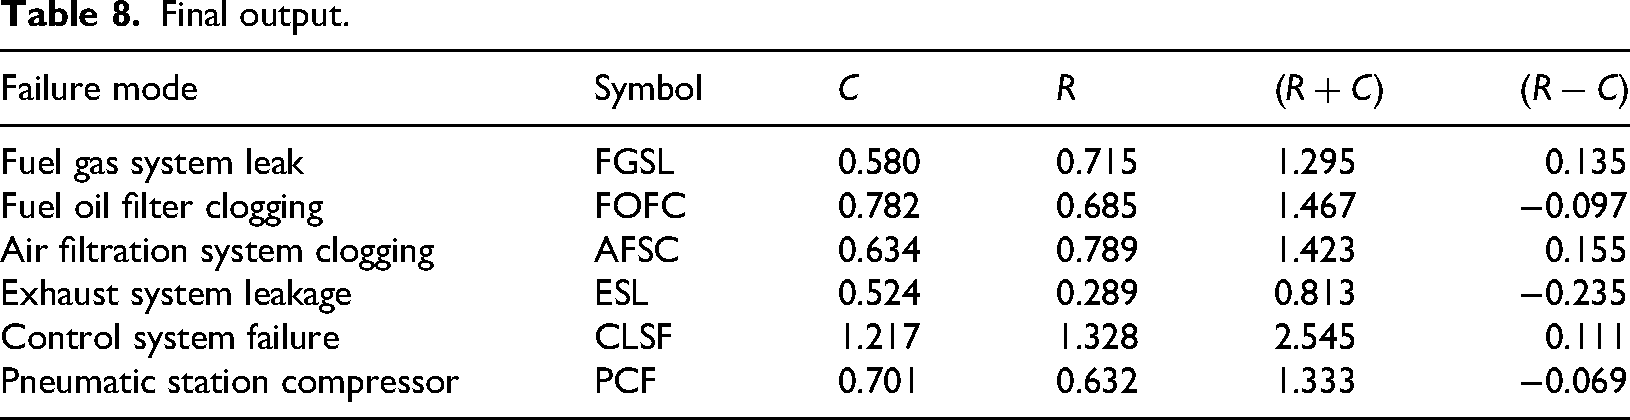
The threshold value (θ) was determined by calculating the arithmetic mean of the elements in matrix (T) from Table 5. The values in the matrix (T) below this threshold (θ = 0.123, derived from a total sum of 4.438 and 36 elements) were set to zero, effectively neglecting these causal relationships. The resulting influence relationships depicted in Figure 6 only include values exceeding the threshold, with red vectors representing mutual effects between failure modes and orange vectors indicating unidirectional influence.
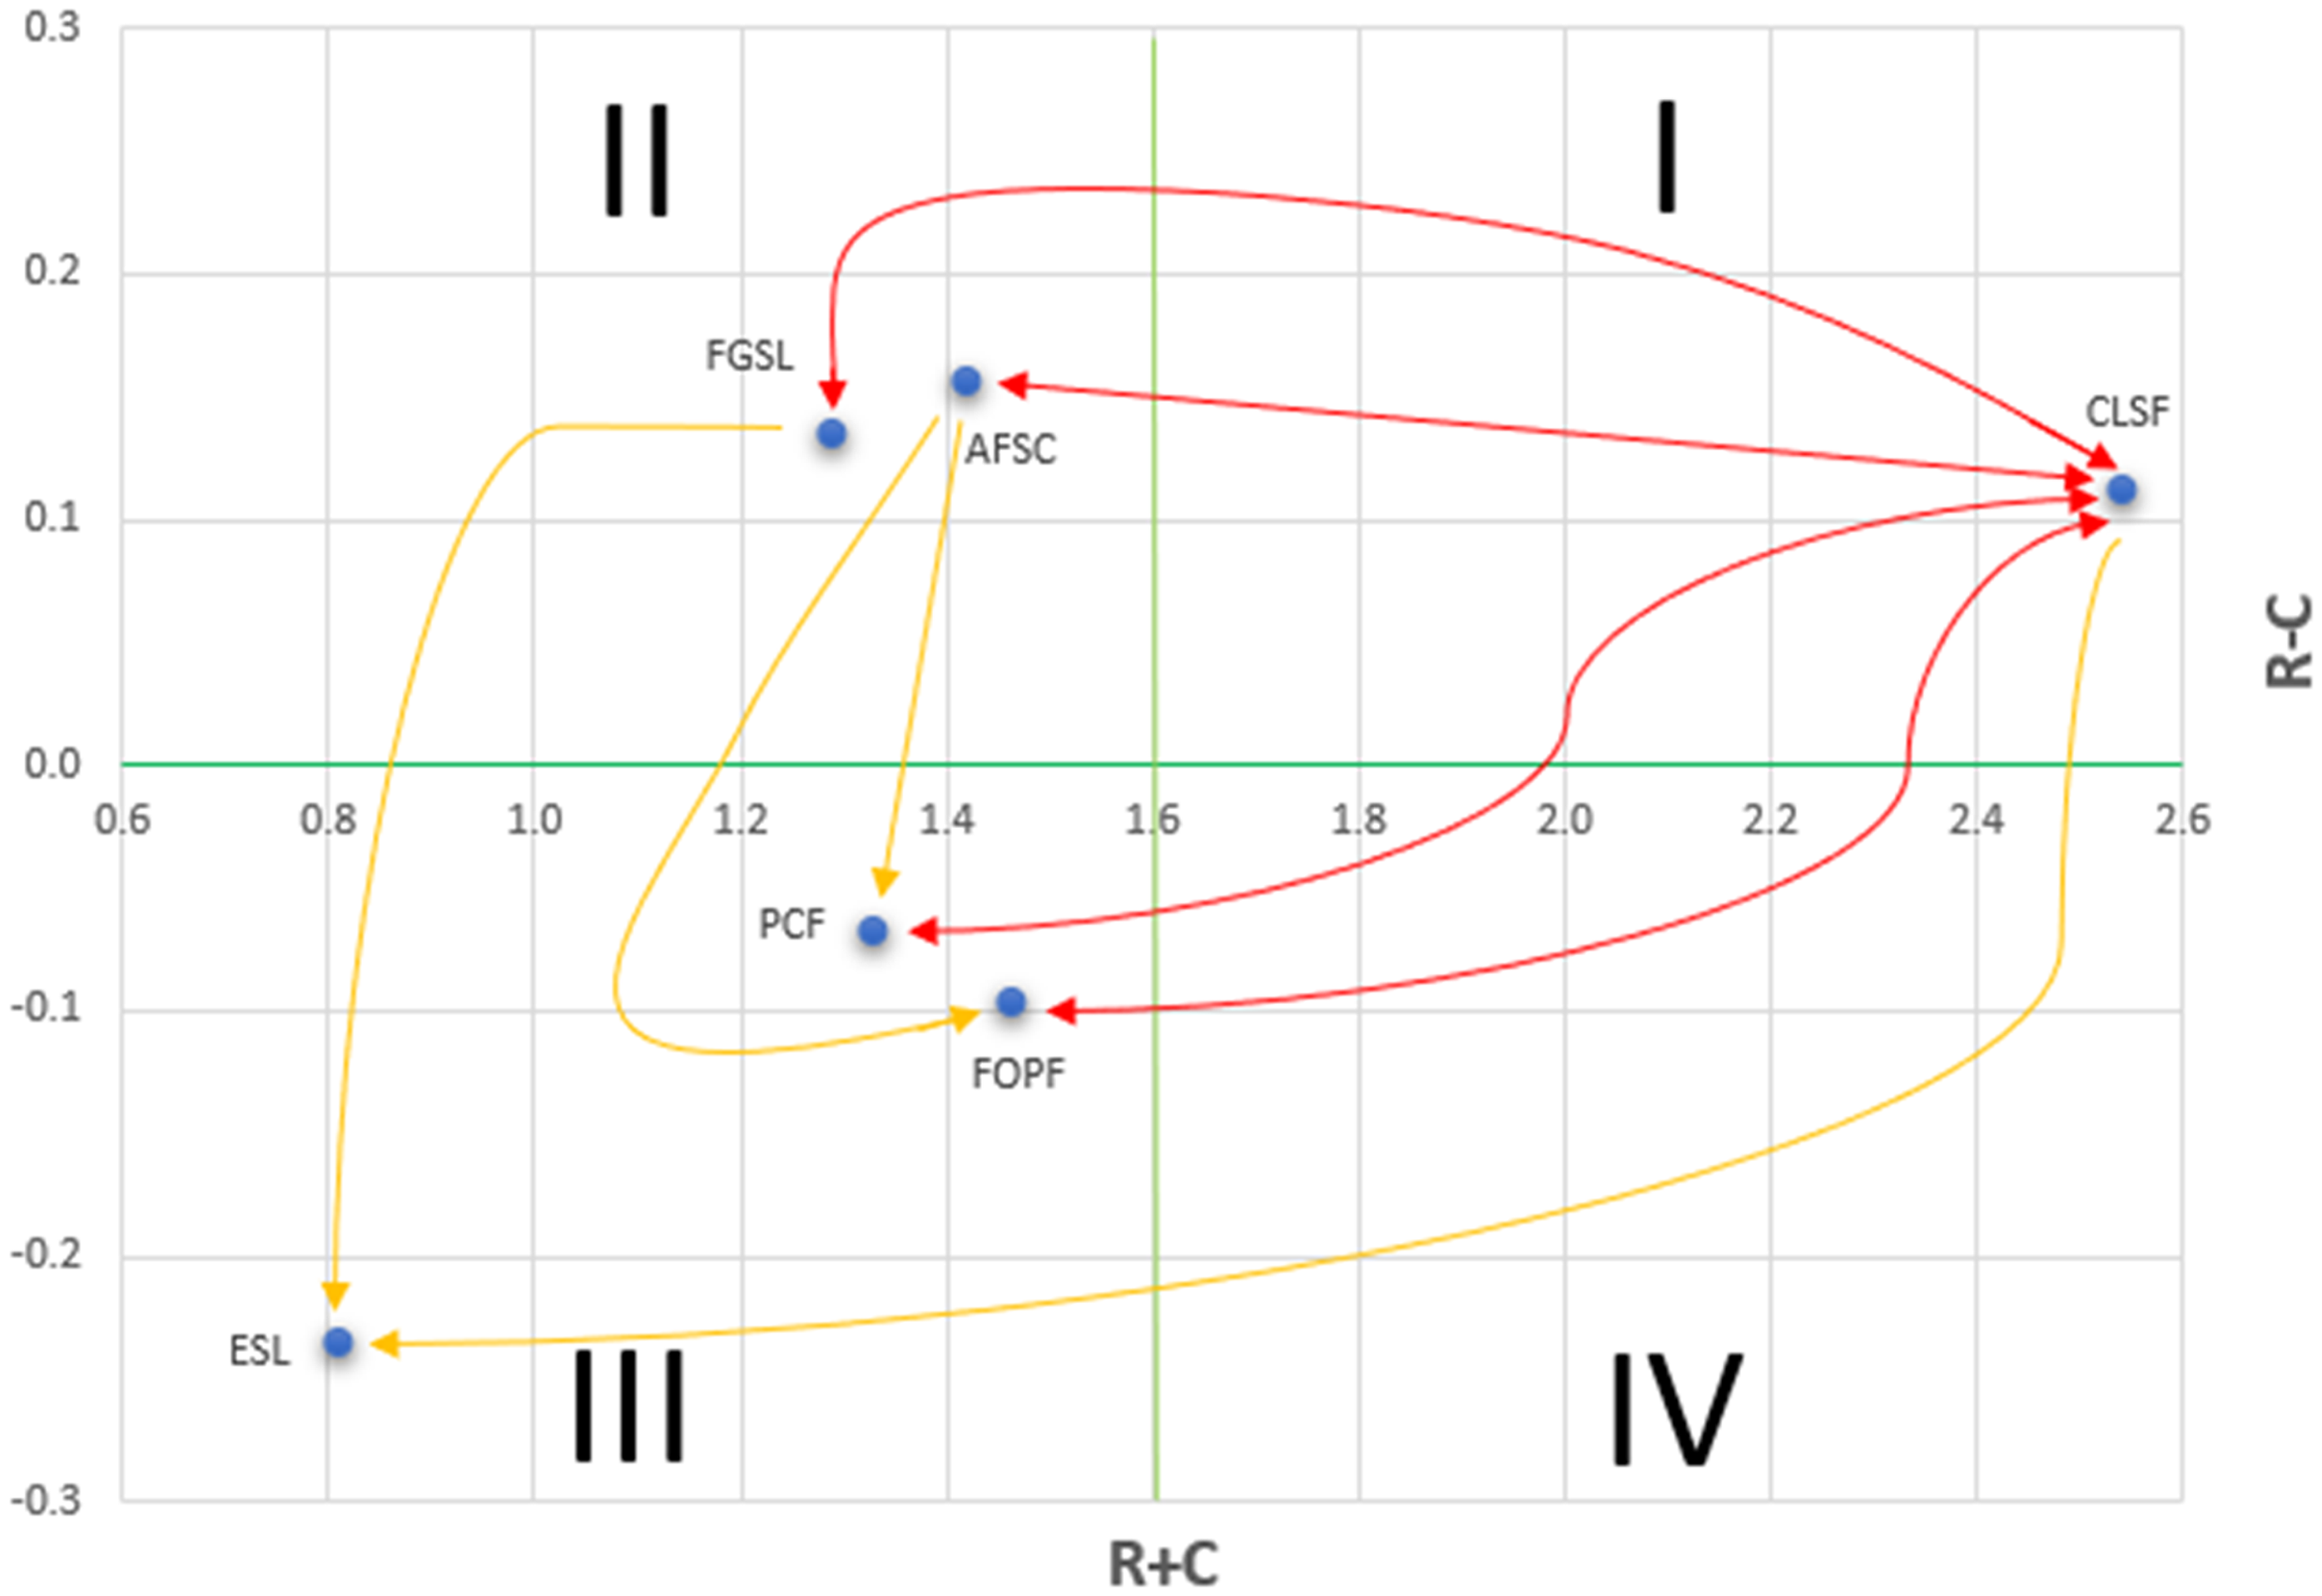
Scatter plot of the relationship between failure modes.
The use of uniform arithmetic mean (θ = 0.123) as the threshold in the FDEMATEL process is acknowledged as a limitation, potentially excluding low-intensity yet critical interdependencies, particularly in tightly coupled systems. Although a formal threshold sensitivity analysis was not conducted in this study, the importance of such analysis is recognized. Additionally, exploring alternative thresholding techniques, such as percentile-based or entropy-weighted methods, is identified as a meaningful direction for future work to enhance the robustness of failure mode classification and preserve subtle but significant influences, thereby improving the detection of emergent or hidden vulnerabilities in complex systems
Discussion
The ranking of failure modes by importance (R + C) identifies “Control System Failure” as the most critical, significantly exceeding other failure types. However, the relationship indicator (R − C), visualized in Figure 6, provides further insight. Positive values above the horizontal axis signify influential failure modes, while negative values below indicate affected modes. Based on these two indicators, the failure modes are categorized into four quadrants:
Quadrant 1: Contains only CLSF, indicating high importance and strong influence on other failure modes, requiring immediate intervention. Quadrant 2: Includes “Air Purification System Clogged” and “Leak in the Gas Fuel System,” representing dependent factors with moderate impact on other modes, requiring timely attention. Quadrant 3: Contains “Clogged Liquid Fuel Filter,” “Air Pressure System Failure,” and “Exhaust Gas System Leak,” representing independent factors with minimal impact and lower priority. Quadrant 4: This quadrant, characterized by high importance but low influence, contains no identified failure modes in this analysis.
FDEMATEL facilitates the analysis of interrelationships between failure modes, identifying influential modes to prioritize for system-wide performance improvement. Integrating FDEMATEL results with FMEA provides a comprehensive understanding of the system. The analysis reveals “Control System Failure,” “Air Purification System Clogged,” and “Gas Fuel System Leak” as the primary causal failure modes, exhibiting high-risk priority numbers and requiring focused attention. Addressing “Exhaust Gas Leak,” despite its high FMEA ranking, would not yield the desired improvement, as it demonstrates low importance and relationship in the FDEMATEL analysis.
While quantitative comparative analysis with previous studies could further highlight the advantages of the proposed method, such comparisons are limited by significant differences in study contexts, the number and types of failure modes analyzed, and the methodological approaches employed. Therefore, this study emphasizes comparisons with research conducted in similar emerging economies that share comparable objectives and methodologies, ensuring a more meaningful and contextually relevant evaluation. The results gain additional significance when viewed alongside similar studies conducted in other regions, as illustrated in Table 9, thereby contributing to improved failure analysis and the development of more effective maintenance strategies. Accuracy of risk assessment, enhance the effectiveness of risk analysis, reducing costs and increasing system reliability can be obtained by modifying FMEA method (Bhattacharjee et al., 2022; Carpitella et al., 2018; De Almeida et al., 2015; Liou et al., 2024; Lo et al., 2020; Maghami et al., 2024; Shahri et al., 2021; Shao et al., 2024). Risk analysis can help save costs and reduce plant downtime by identifying and prioritizing critical failure modes in the system, enabling us to develop effective preventive and corrective measures to proactively address them. To increase model adaptability to changing conditions for the handling of uncertainty in risk assessment, the concept of fuzziness is introduced and combined with FMEA (De Almeida et al., 2015; Górny, 2019; Lv et al., 2019; Wang et al., 2022a). To develop a relationship map between failure patterns, enhancing prioritization, and the selection of appropriate maintenance strategies a hybrid study combining FMEA and MCDM (Atin and Lubis, 2020; Balaraju et al., 2019). Prediction of failure plays an important role in enhancing the effectiveness of maintenance strategies (Bonato et al., 2018; Faur and Bungău, 2021; Wei et al., 2023).
Comparison with similar emerging economies.
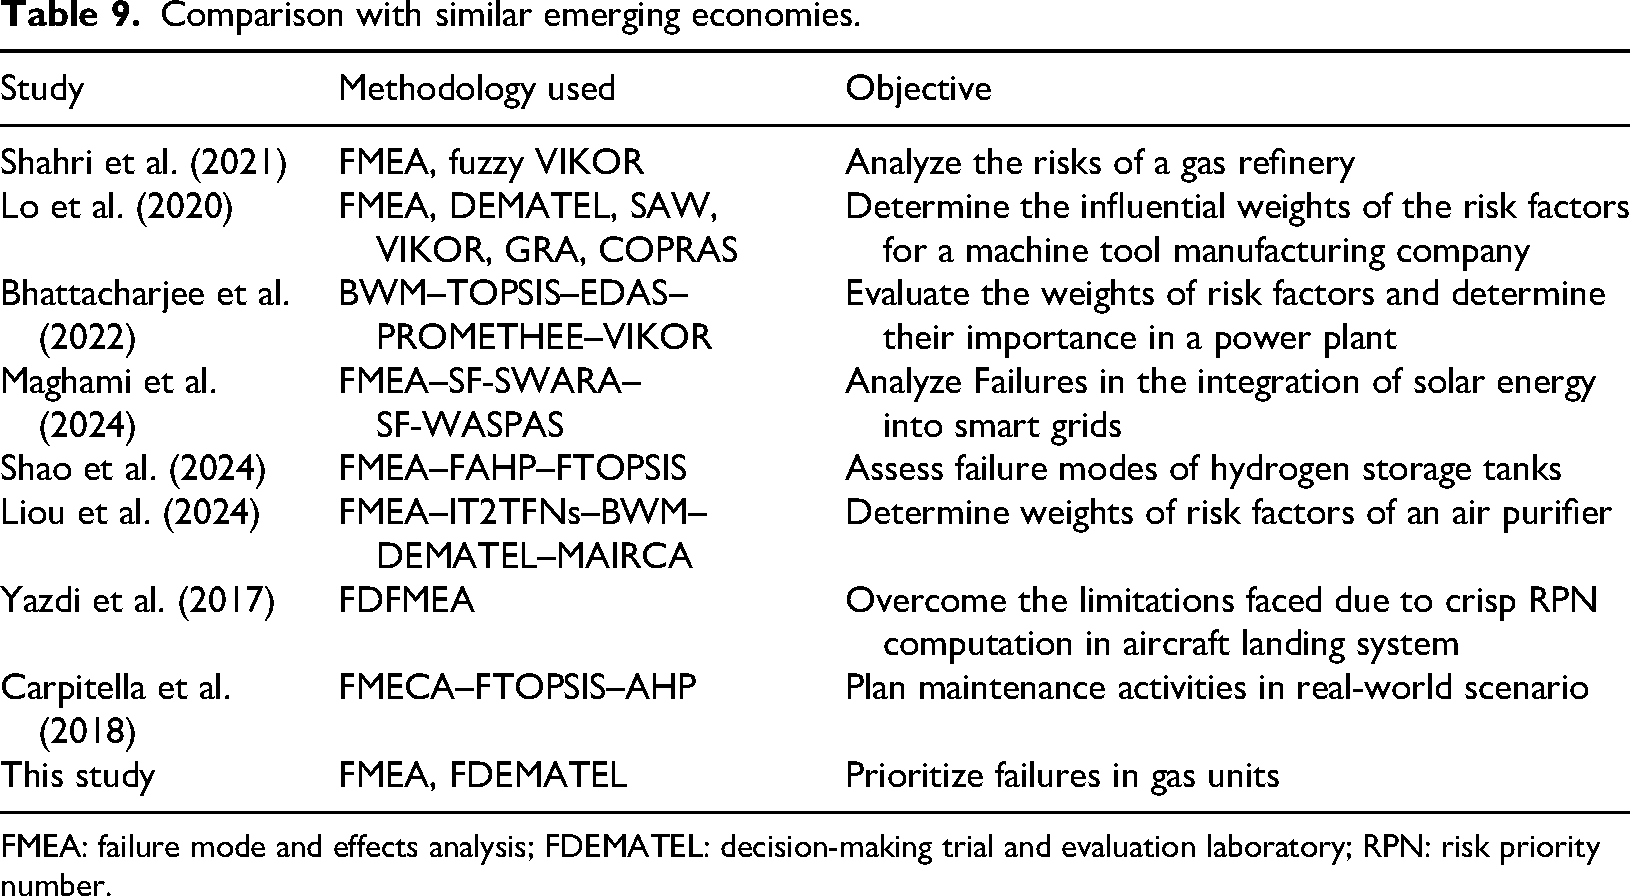
FMEA: failure mode and effects analysis; FDEMATEL: decision-making trial and evaluation laboratory; RPN: risk priority number.
This study prioritizes the faults of gas units at the Misurata combined cycle power plant by using a hybrid model of FMEA and fuzzy DEMATEL to examine the interaction between the faults and improving maintenance strategies. This study shares common goals with previous studies in enhancing the effectiveness of the FMEA method. It is unique in its use of fuzzy DEMATEL methodology to analyze simultaneous effects, which enhances the accuracy of risk assessment and supports more effective decision-making. The obtained outcomes can help the decision makers to improve the allocation of resources, such as personnel, equipment, and spare parts, to critical components and systems. By focusing resources on critical failure modes of the plant, thus ensuring that resources are used effectively and efficiently. Furthermore, the analysis results can be used to develop emergency plans and emergency response procedures for critical failure modes.
While previous studies have integrated FMEA with FDEMATEL, this work advances the field in three distinct ways. First, the hybrid methodology is applied to a high-stakes, underexplored operational context: gas units in a Libyan combined-cycle power plant a critical infrastructure subject to region-specific environmental and operational challenges (e.g. extreme temperatures, frequent dust storms, and aging facilities). This focus on contextual specificity extends prior applications, which often prioritize generic or less complex systems. Second, the methodological depth is enhanced through computational tools (Python and Excel) to rigorously quantify interdependencies, enabling dynamic recalibration of failure rankings a capability absent in traditional FMEA-FDEMATEL frameworks that rely on manual or static analyses. Third, the study identifies systemically overlooked, actionable causal patterns (e.g. control system failures, fuel gas leaks) whose interdependencies were historically underweighted in fault prioritization. By mapping cascading cause-effect relationships, this analysis demonstrates how localized failures propagate risks across subsystems a critical insight for high-risk industries where conventional FMEA oversimplifies system connectivity. This systemic, context-sensitive perspective provides a replicable framework for prioritizing faults in resource-constrained, high-consequence environments with analogous operational profiles.
FMEA and FDEMATEL: A comparative approach
A primary weakness of the traditional FMEA is the treatment of failures as isolated occurrences. Although effective in identifying potential issues and assessing their local risks through the RPN, conventional FMEA often neglects the intricate interdependencies within modern systems such as gas units in combined-cycle power plants (Yang et al., 2011). It typically focuses on direct cause-effect relationships for individual failure modes, failing to model or quantify how one failure can trigger or be influenced by others. This narrow perspective can lead to an incomplete understanding of risks, potentially underestimating the impact of cascading failures or shared root causes and missing opportunities to mitigate multiple failures (Chang et al., 2013).
To address this constraint, methodologies that incorporate causal analysis provide a more comprehensive approach by explicitly modeling the interdependencies among failure modes. Techniques such as the FDEMATEL, which accommodate uncertainty and linguistic expert judgments, provide a robust framework for this purpose. FDEMATEL extends beyond simple ranking by analyzing the causal structure among the identified failure modes. It uses expert assessments, often captured using fuzzy linguistic terms analogous to fuzzy FMEA, to construct a matrix representing the direct influence of each failure mode on every other mode. Through mathematical processing of this matrix, FDEMATEL quantifies both direct and indirect influence relationships, facilitating the construction of a causal diagram or influence map (Akhtar et al., 2024; Taghavi et al., 2021; Wang et al., 2022b).
This provides a clear visual and quantitative representation of how system failures are connected. Using FDEMATEL with FMEA for gas unit analysis, the focus shifts from simply addressing high-risk failures individually to understanding how risks spread throughout the system. This helps to identify the most critical failure modes, which are the main causes or drivers within the network of failures. This understanding is essential for creating more effective risk-management strategies. By addressing the most influential “cause” failures, it's possible to prevent or reduce the impact of related “effect” failures, leading to a more strategic approach to improving the gas unit's reliability and safety (Fithri et al., 2020; Nidd et al., 2014; Yang et al., 2011).
Integrating fuzzy FMEA with FDEMATEL provides unique insights into system risk by combining individual failure mode assessments with an analysis of causal interdependencies. FMEA addresses uncertainty and incorporates expert opinions, whereas FDEMATEL maps causal relationships. This integrated framework moves beyond traditional risk prioritization based on the RPN. It considers both the inherent risk characteristics of a failure mode and its influence within the causal structure of the system. FDEMATEL can identify failure modes that significantly drive other failures, highlighting critical leverage points where mitigation can prevent downstream effects (Akhtar et al., 2024). Conversely, a failure mode with a high fuzzy RPN might primarily be an effect, suggesting that addressing its root causes elsewhere in the causal chain is more effective. The combined approach also clarifies systemic risk pathways, visualizing how failures propagate through interconnected components and uncovering hidden vulnerabilities. This enables a shift from reactive localized risk management to proactive intervention focused on the underlying causal structure of failures, enhancing the safety and reliability of complex systems. However, this shift in prioritization based on causal influence, rather than solely on the RPN's combined S, O, and D scores, is intended to provide insights for improved maintenance and reliability by focusing resources on faults that significantly impact others within the system. Hence, FDEMATEL is not strictly a replacement for FMEA's initial risk identification, but as a tool for re-prioritization and enhanced decision-making by revealing underlying causal structures that FMEA misses, suggesting that its output provides a different, structurally informed perspective on which failure modes are most critical to strategically address system-wide improvement. Therefore, using a hybrid FMEA-FDEMATEL model can improve the accuracy of risk assessment and help improve maintenance strategies.
To sum up, the integration of FMEA and FDEMATEL is a practical way to address the empirical limitations of FMEA, offering a more accurate risk assessment that accounts for causal relationships and uncertainty. However, this method does not rely on formal probabilistic or utility-theory frameworks. Instead, FDEMATEL complements FMEA by providing a more comprehensive, structural understanding of failure modes, enabling organizations to better allocate resources to critical issues that affect overall system performance and reliability.
Conclusion
The main objectives of the study were to analyze the effects of failure modes in the gas units of the Misurata Dual Power Plant and to build a general methodology to classify and prioritize faults. The study concluded that knowing the actual causal failure patterns that have high-risk priority numbers is crucial. The difference in the analysis results between FMEA and FDEMATEL is due to the different bases on which each method was built. Integrating the combined results can help in selecting effective failure patterns with higher risk priority numbers, enabling decision-makers to understand the relationship between failure patterns and their impact on each other visually through the influential relationship map and deal with them systematically and comprehensively.
The study recommends increasing attention to failure analysis methods and including them in the planning department's work within the station. This includes the use of specialized expertise and software to reduce effort and time. Applying such methods to similar stations in Libya and exchanging their results would enhance the accuracy of the results and contribute to the exchange and transfer of expertise between the maintenance and operation teams. It is also recommended to expand this study in the future by applying it to the rest of the station units, such as the steam unit and seawater desalination unit. Artificial intelligence techniques can also be used in a broader and more comprehensive study of failure patterns in all station units and linking them together.
Future studies will address the limitations of fixed thresholding in the FDEMATEL methodology by examining the impact of various thresholding strategies on the stability and accuracy of failure mode classifications. This includes conducting threshold sensitivity analysis and exploring alternative methods such as percentile-based, entropy-weighted, and adaptive thresholds. Additionally, future work will consider advanced prioritization techniques such as AHP, entropy-based weighting, and non-linear aggregation to better reflect the non-compensatory nature of risk. These improvements aim to enhance the identification of critical failure modes and improve the input selection for FDEMATEL, ultimately leading to more accurate detection of root causes and systemic vulnerabilities in complex power systems.
Supplemental Material
sj-xlsx-1-eea-10.1177_01445987251350736 - Supplemental material for A hybrid failure mode and effects analysis with decision-making trial and evaluation laboratory approach for enhanced fault assessment in power plants
Supplemental material, sj-xlsx-1-eea-10.1177_01445987251350736 for A hybrid failure mode and effects analysis with decision-making trial and evaluation laboratory approach for enhanced fault assessment in power plants by Ali Gassim Shetwan, Sassi Rekik and Yousef Ghlaio in Energy Exploration & Exploitation
Supplemental Material
sj-docx-2-eea-10.1177_01445987251350736 - Supplemental material for A hybrid failure mode and effects analysis with decision-making trial and evaluation laboratory approach for enhanced fault assessment in power plants
Supplemental material, sj-docx-2-eea-10.1177_01445987251350736 for A hybrid failure mode and effects analysis with decision-making trial and evaluation laboratory approach for enhanced fault assessment in power plants by Ali Gassim Shetwan, Sassi Rekik and Yousef Ghlaio in Energy Exploration & Exploitation
Footnotes
Funding
The author(s) received no financial support for the research, authorship, and/or publication of this article.
Declaration of conflicting interests
The author(s) declared no potential conflicts of interest with respect to the research, authorship, and/or publication of this article.
Supplemental material
Supplemental material for this article is available online.
References
Supplementary Material
Please find the following supplemental material available below.
For Open Access articles published under a Creative Commons License, all supplemental material carries the same license as the article it is associated with.
For non-Open Access articles published, all supplemental material carries a non-exclusive license, and permission requests for re-use of supplemental material or any part of supplemental material shall be sent directly to the copyright owner as specified in the copyright notice associated with the article.