
Abstract
The incomplete understanding of the geothermal history and thermal events impacting hydrocarbon generation in the Risha Gas Field, Jordan, poses a significant challenge for accurate exploration and resource assessment. The Risha Gas Field, located in northeastern Jordan, hosts a significant hydrocarbon resource, yet its development has been hindered by limited knowledge of the area's complex geothermal and tectonic history. This study aims to reconstructing the thermal history of wells RH-1, RH-2, and RH-11 using apatite fission track analysis (AFTA) and vitrinite reflectance (VR) data, which is critical for assessing hydrocarbon generation potential. Through detailed thermal modeling, two significant episodes are identified: a Late Paleozoic heating (300–265 Ma) and Oligocene-Miocene cooling (30–10 Ma). Paleozoic units in RH-2 show cooling from 20–30 °C, while Triassic heating is identified between 245–200 Ma, suggesting a complex thermal regime with local anomalies. Paleogeothermal gradients were reconstructed using integrated AFTA and VR data, revealing gradients ranging from 25 to 52.5 °C/km during the mid-Cretaceous to Early Cenozoic periods, with higher gradients associated with deeper burial and increased basal heat flow. The findings offer new insights into the timing and magnitude of thermal events that have influenced hydrocarbon maturation in the Risha Gas Field. The geothermal and tectonic history of the Risha Gas Field has significantly shaped hydrocarbon maturation by influencing the thermal conditions for organic matter transformation. The Late Paleozoic heating event (300–265 Ma) initiated hydrocarbon generation, while Triassic heating (245–200 Ma) caused localized maturation anomalies. The Oligocene-Miocene cooling episode (30–10 Ma) preserved hydrocarbons by slowing over-maturation, with variable paleogeothermal gradients further contributing to maturation heterogeneity. Tectonic uplift and erosion also influenced hydrocarbon migration and reservoir distribution, highlighting the complex interplay of thermal and tectonic processes in the field. This study contributes to an enhanced understanding of the region's geothermal history and provides valuable information for future hydrocarbon exploration, particularly in the deeper Paleozoic horizons.
Introduction
Geothermal gradients, which quantify the increase in temperature with depth in the Earth's crust, are essential in understanding the thermal history of sedimentary basins and are critical in hydrocarbon exploration (Bray et al., 1992; Green et al., 1997; Kolawole and Evenick, 2023). Globally, accurately reconstructing these gradients is vital for identifying regions where organic matter has been sufficiently heated to generate hydrocarbons, a key factor in assessing the viability of hydrocarbon reservoirs (Duddy et al., 1988; Gleadow et al., 1983). However, despite their significance, the geothermal histories of many regions, particularly in underexplored areas like Jordan, remain poorly understood.
Jordan's hydrocarbon exploration efforts have historically lagged behind those of its neighbors, primarily due to the complex geological history that has made exploration challenging (Al-Zoubi and Batayneh, 1999; Naylor et al., 2013). The Risha Gas Field, located 270 km northeast of Amman, represents Jordan's most significant natural gas discovery and is a critical component of the nation's energy strategy (Farouk et al., 2024b; Hamdy et al., 2024). The field's complex tectonic and sedimentary history has created significant challenges in understanding its thermal evolution, presenting both obstacles and opportunities for hydrocarbon exploration (Farouk et al., 2024b; Naylor et al., 2013). Previous studies have highlighted the hydrocarbon potential of Jordan's sedimentary basins; however, the geothermal history of the Risha Field remains unclear, with conflicting data from apatite fission track analysis (AFTA) and vitrinite reflectance (VR) analyses (Green et al., 1989; Tingate, 1990). These uncertainties in thermal events have complicated the assessment of the field's hydrocarbon generation history, hindering exploration efforts (Al-Rawi, 2014; Farouk et al., 2024a).
This study seeks to address these knowledge gaps by reconstructing the thermal history of the Risha Gas Field using new AFTA and VR data from the RH-1, RH-2, and RH-11 wells. By integrating these data with thermal history modeling, this research provides a comprehensive framework for understanding hydrocarbon generation and preservation in the region (Gleadow et al., 1986; Green et al., 1989). Specifically, the study aims to: (1) Identify and quantify key episodes of heating and cooling. (2) Assess the impact of these thermal events on hydrocarbon formation. (3) Provide a consistent thermal history framework to guide future exploration in Jordan and similar geological settings (Farouk et al., 2016; Green et al., 1989).
The insights gained from this study are expected to advance understanding of the Risha Gas Field and contribute to broader hydrocarbon exploration in tectonically complex regions, with the potential for more targeted exploration strategies across the Middle East (Farouk et al., 2024b; Hamdy et al., 2024; Sorkhabi, 2010).
Geological setting
The Risha Gas Field is located in northeastern Jordan, approximately 270 km northeast of Amman, within a complex geological framework that has significantly influenced its hydrocarbon potential (Figure 1(a)). The field lies on an unstable shelf between the stable Nubo-Arabian Platform and the tectonically active Alpine mobile geosynclines, with its geological setting marked by eastward-dipping Paleozoic sequences and westward-thickening Mesozoic deposits beneath a basalt plateau (Farouk et al., 2023; Powell et al., 2018; Qteishat et al., 2024; Sorkhabi, 2010).
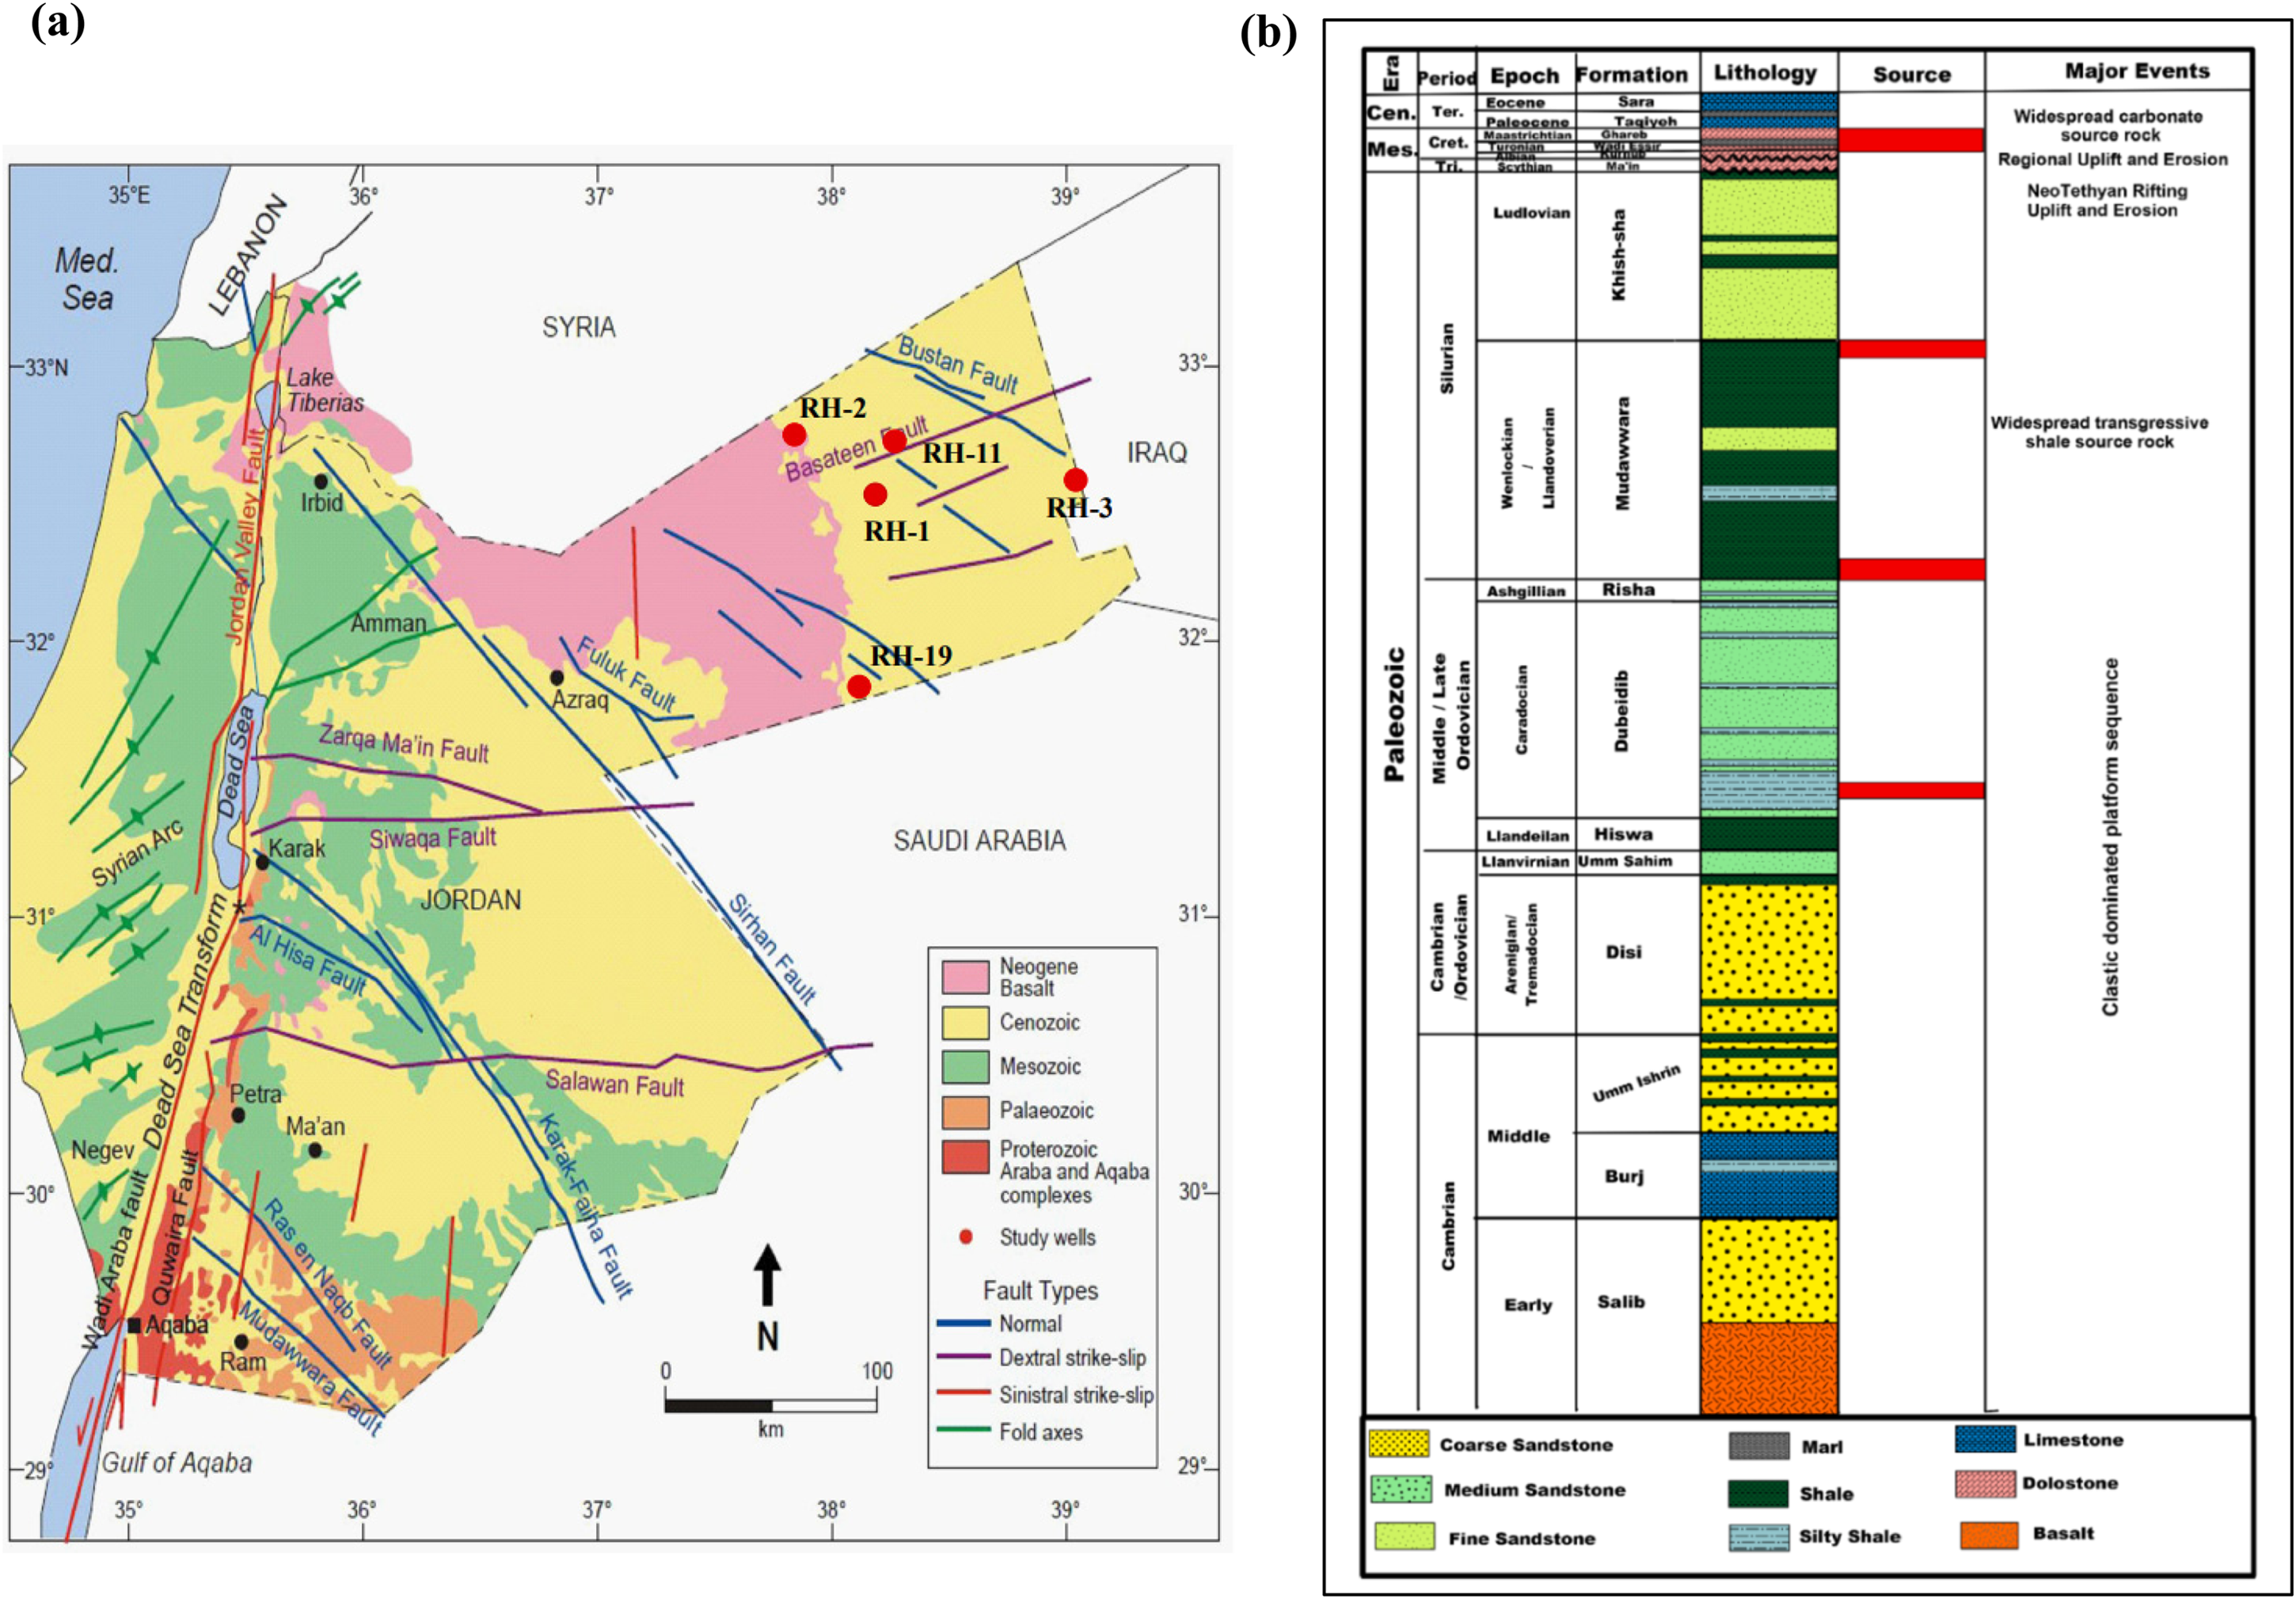
(a) The location map of the Risha field in Jordan with an overview of the studied petroleum wells. (b) The stratigraphic column of the Risha field plateau (Farouk et al., 2023).
Tectonic framework and basin evolution
During the Paleozoic Era, the region now known as Jordan was located on the southern margin of the Tethys Ocean, characterized by passive margin conditions that persisted until the onset of Hercynian tectonics in the Late Carboniferous (Zou et al., 2007). These tectonic events led to significant compressional forces, resulting in the uplift and subsequent erosion of Paleozoic strata. The Hercynian orogeny profoundly reshaped the region, leading to the formation of the Hercynian unconformity, a key stratigraphic marker that separates the deeply buried Paleozoic sequences from overlying Mesozoic deposits (Al-Rawi, 2014; Naylor et al., 2013).
The Paleozoic sedimentary sequence in the Risha Field, which reaches thicknesses exceeding 5 kilometers, is composed of various formations including the Salib, Umm Sahm, and Disi formations, along with the Risha Sandstone Member of the Dubeideb Formation (Abed, 2000; Bandel and Khoury, 1981; Jassim and Goff, 2006). These formations represent potential reservoir intervals, particularly in the context of hydrocarbon exploration. The region's tectonic history, marked by periods of subsidence followed by uplift, has created a complex burial and thermal history that is crucial for understanding hydrocarbon generation and preservation within these sequences (Farouk et al., 2024b; Pang et al., 2018; Perrodon and Masse, 1984).
Stratigraphy and sedimentary environment
The stratigraphic architecture of the Risha Gas Field reflects a long and varied depositional history, spanning from the Cambrian to the Eocene. The lower Paleozoic sequences, dominated by shallow marine to fluvial sandstones, are recognized for their reservoir potential (Pang et al., 2018; Powell et al., 2018). The Ordovician Hiswa and Dubeideb formations, along with the Silurian Mudawwara Formation, are of particular interest due to their potential as source rocks within the broader Tabuk-Nafud Basin, which extends into western Iraq and northern Saudi Arabia (Jassim and Goff, 2006; Naylor et al., 2013) (Figure 1(b)).
Above the Hercynian unconformity, the Mesozoic sequence in the Risha Field is characterized by the deposition of Triassic, Jurassic, and Cretaceous sediments, which thicken to the west as they dip beneath the basaltic plateau (Abed, 2000; Farouk et al., 2016). These Mesozoic units, particularly those from the Triassic and Jurassic periods, are also of interest due to indications of localized heating events that may have impacted their hydrocarbon potential (Farouk et al., 2024a; Jassim and Goff, 2006). The depositional environments during the Mesozoic were varied, ranging from fluvial to shallow marine settings, which influenced the quality and distribution of potential reservoir and source rocks; Figure 1(b)).
Thermal history and geothermal gradients
The geothermal history of the Risha Field is complex and has been shaped by multiple phases of burial, heating, and uplift (Farouk et al., 2024a). Present-day geothermal gradients in the Risha Field range from 29.8 to 40.8 °C/km, derived from corrected bottom-hole temperature (BHT) measurements in wells RH-1, RH-2, and RH-11 (Naylor et al., 2013). These gradients, combined with a surface temperature of approximately 20 °C, reflect the current thermal regime but are influenced by past geological events that have altered the subsurface temperature distribution (Powell et al., 2018).
Key episodes of heating and cooling, identified through AFTA and VR data, suggest that the Paleozoic sections experienced elevated temperatures during the late Paleozoic, likely due to deeper burial and higher basal heat flow associated with Hercynian tectonics (Farouk et al., 2024a; Gleadow et al., 1983; Zou et al., 2007). Subsequent cooling during the Oligocene-Miocene is attributed to regional uplift and erosion, which has further complicated the thermal history of the field (Farouk et al., 2024a; Green et al., 1989).
The intricate interplay between tectonic forces, sedimentation, and thermal processes has created a unique geological environment in the Risha Gas Field. Understanding this geological setting is critical for accurate thermal history reconstruction, which in turn is essential for assessing the field's hydrocarbon potential. By unraveling the geological and thermal history of the Risha Field, this study aims to provide a clearer picture of the factors controlling hydrocarbon generation and preservation in this key Jordanian resource (Farouk et al., 2024a; Naylor et al., 2013).
The differences in present-day geothermal gradients among the RH-1 (35.5 °C/km), RH-2 (29.8 °C/km), and RH-11 (40.8 °C/km) wells stem from lithological contrasts, structural controls, and residual thermal effects from paleo-events. RH-2's lower gradient reflects sandstone-dominated Paleozoic units with high thermal conductivity, facilitating efficient heat dissipation, combined with ∼1000 m of Oligocene-Miocene (20–15 Ma) section removal that enhanced cooling. In contrast, RH-11's elevated gradient arises from shale-rich Mesozoic intervals with low thermal conductivity that inhibit heat loss, exacerbated by ∼600 m of retained Cenozoic cover and residual heat from a Late Paleozoic thermal event (300–265 Ma) linked to deeper burial (∼3 km additional section) and elevated basal heat flow (45 °C/km). RH-1's intermediate gradient reflects mixed lithologies and moderate cooling from ∼500 m of Cenozoic exhumation. Structural controls, including variable burial/exhumation histories and localized heating in Permian-Triassic units, further modulated heat retention, with RH-11 preserving the strongest Late Paleozoic thermal imprint due to its higher reconstructed paleogeothermal trajectory.
Materials and methods
The study primarily focuses on the RH-1, RH-2, and RH-11 wells, located within the Risha Gas Field. But it also references the RH-3 and RH-19 wells for comparative purposes. The RH-3 and RH-19 wells (Naylor et al., 2013) provide additional data points that help to contextualize and validate the findings from the RH-1, RH-2, and RH-11 wells. These wells were selected based on their strategic positions within the field, their geological significance, and the availability of sufficient apatite for AFTA. The RH-1, RH-2, and RH-11 wells intersected a few hundred meters of post-Cretaceous sediment overlying variable thicknesses of Cretaceous, Jurassic, Triassic, and Permian units, separated by a major unconformity from underlying Early Paleozoic units, reaching total depths slightly in excess of 3000 m. Initially, the study aimed to concentrate on the RH-1 and RH-2 wells, but due to insufficient apatite samples from the Mesozoic section in the RH-1 well, corresponding samples from the RH-11 well were also incorporated. Present-day geothermal gradients of 35.5, 29.8, and 40.8 °C/km were derived from single corrected BHT values in the RH-1, RH-2, and RH-11 wells, respectively. These gradients, coupled with a surface temperature of 20 °C, represent the present-day thermal regime in each well.
Samples were obtained from cuttings and cores collected at various depths within these wells. A total of 21 samples were selected for AFTA and VR analysis, ensuring a broad coverage of both the Paleozoic and Mesozoic stratigraphic sequences. Specifically, samples were gathered from six depth intervals in the RH-1 well, eight intervals in the RH-2 well, and seven intervals in the RH-11 well. A comprehensive sample processing was performed, and apatite suitable for analysis was obtained from four samples in the RH-1 well, six samples in the RH-2 well, and four samples from the RH-11 well (Table 1). These samples included representative lithologies such as sandstones, siltstones, and shales, which are known to preserve thermal history markers essential for reconstructing the geothermal history (Gleadow et al., 1986; Green et al., 1989).
Sampling's depth intervals, present temperature, age, for AFTA and VR analysis from RH-1, RH-3, RH-2, RH-11and RH-19 wells.
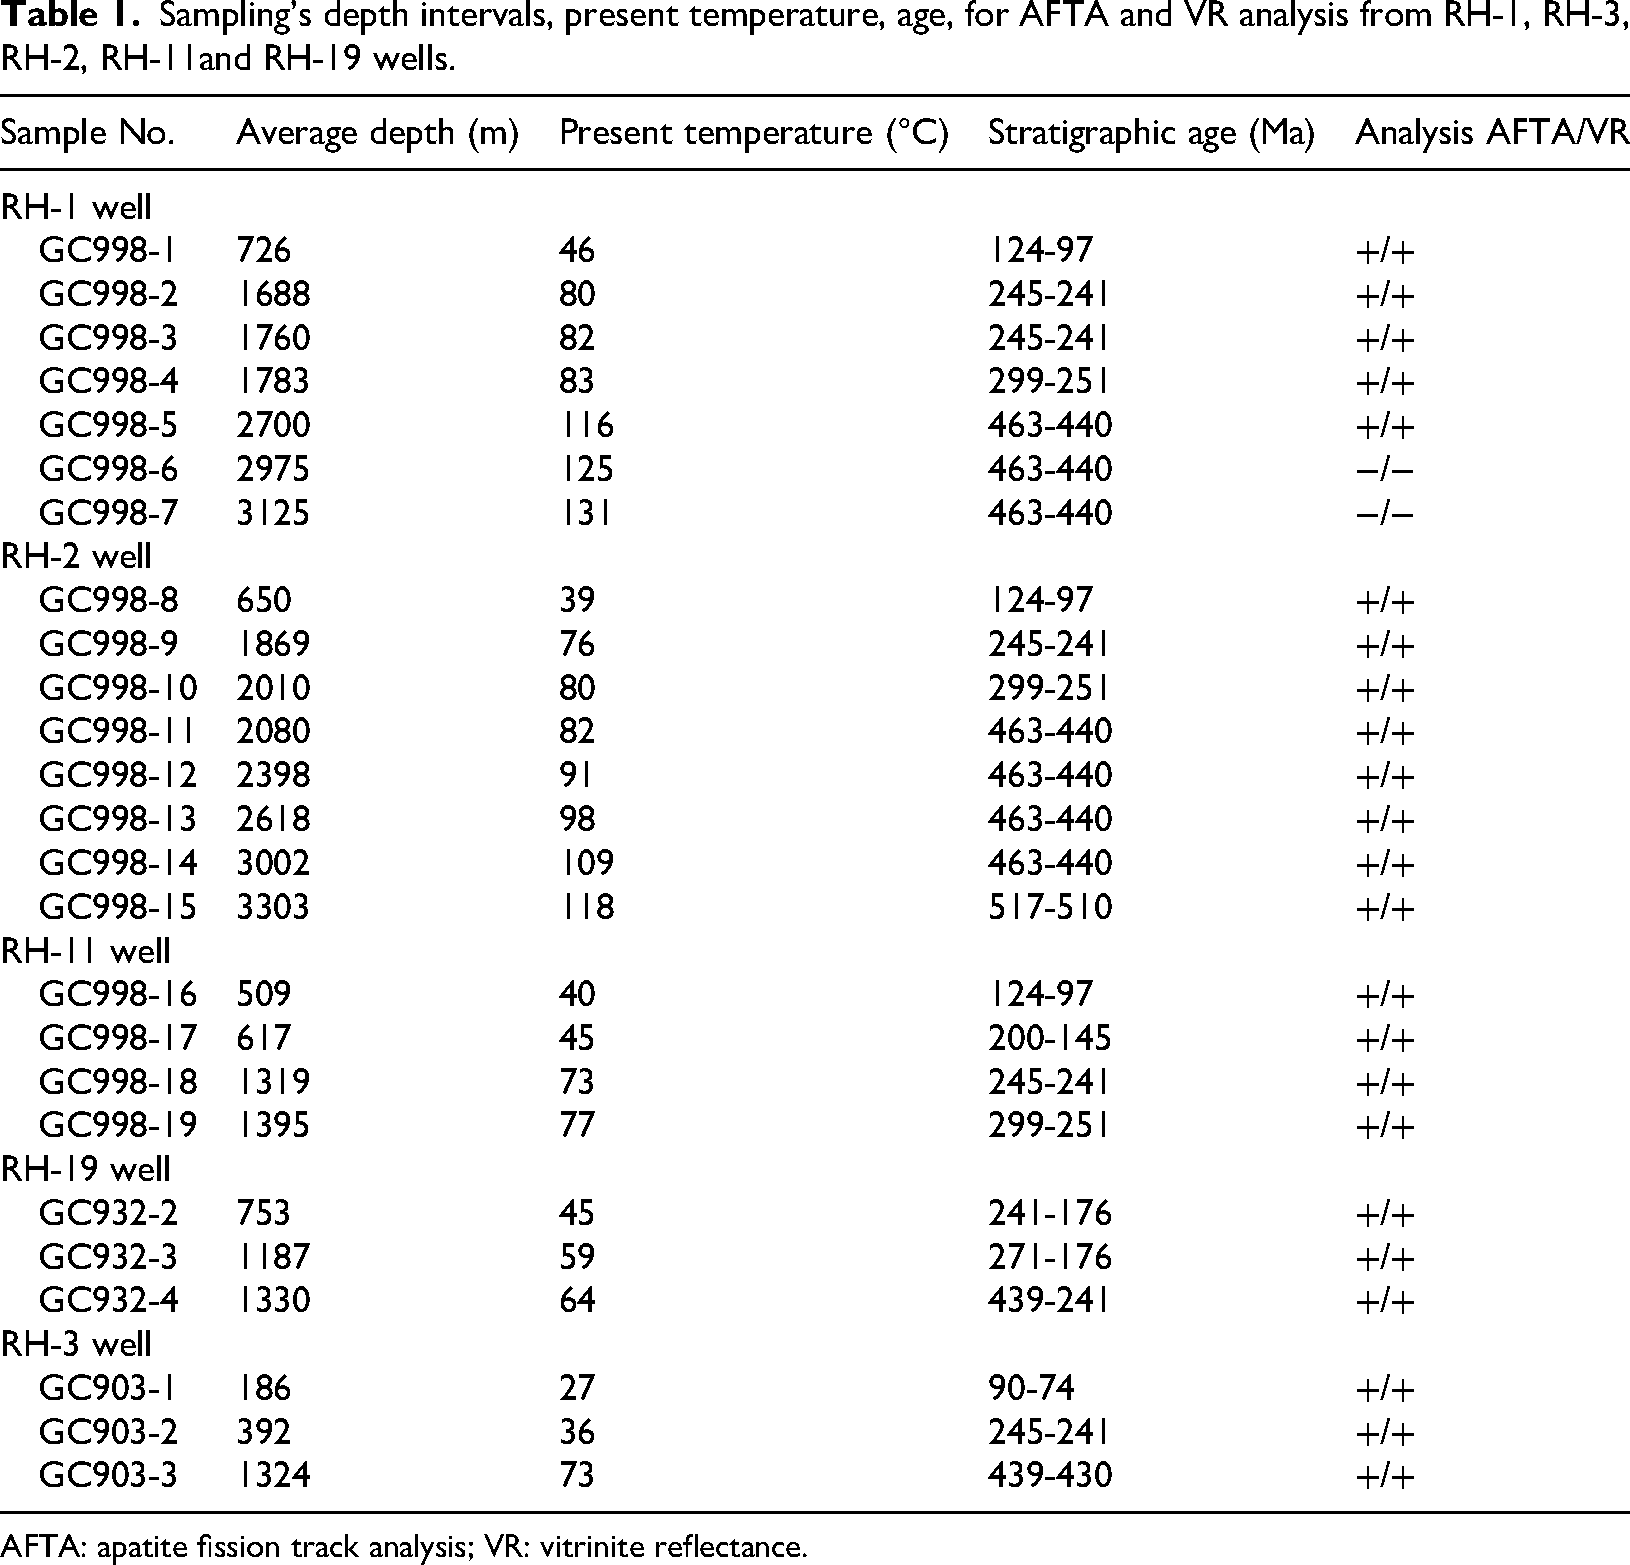
AFTA: apatite fission track analysis; VR: vitrinite reflectance.
Sample preparation and AFTA
AFTA was conducted to reconstruct the thermal history of the Risha Gas Field, focusing on understanding the timing and magnitude of past thermal events. Apatite, a common accessory mineral in sedimentary rocks, records thermal histories through the annealing of spontaneous fission tracks produced by the decay of uranium-238 (Gleadow et al., 1986; Green et al., 1989). The annealing process, which reduces the number of fission tracks over time, is temperature-dependent, making AFTA an ideal method for thermal history reconstruction. The basic approach involved applying AFTA to determine the magnitude of maximum paleotemperatures in individual samples and the time at which each sample began to cool from the paleo-thermal maximum.
Samples were first processed to extract apatite grains. The preparation involved crushing the rock samples and separating the apatite using heavy liquids and magnetic separation techniques. The isolated apatite grains were then mounted in epoxy resin and polished to expose internal crystal surfaces for track counting (Gleadow et al., 1986). Fission tracks in apatite were revealed using an etchant of 5.5 M nitric acid at 20 °C for 20 s, which selectively dissolves damaged zones along the fission tracks (Laslett et al., 1987). The etched grains were then analyzed under a high-power optical microscope equipped with an automated stage to measure the track lengths and count the number of tracks. The fission track ages were calculated using the zeta calibration method, which compares the observed track densities in the samples with those of known-age standards (Hurford and Green, 1983).
The obtained fission track ages and track length distributions were used to model the thermal history of each well. The thermal history modeling involved using forward and inverse modeling techniques to reconstruct the temperature-time (T-t) paths that best explain the observed fission track data (Gleadow and Brown, 2000; Kamp et al., 1996). The T-t paths provided insights into the timing and extent of heating and cooling events, essential for understanding the geothermal history of the Risha Gas Field.
VR analysis
VR is a widely used method to assess the thermal maturity of sedimentary organic matter, providing a complementary approach to AFTA in thermal history reconstruction (Burnham and Sweeney, 1989). VR measures the percentage of light reflected from vitrinite particles, a type of maceral derived from woody plant material, within the sedimentary rock matrix. The reflectance increases with burial depth and temperature, making it a reliable indicator of maximum paleotemperature experienced by the rocks (Dow, 1977).
For VR analysis, five samples from the RH-1, RH-2, and RH-11 wells were selected based on the availability of vitrinite macerals. The samples were prepared by embedding in epoxy resin, cutting into thin sections, and polishing to a high luster. The polished sections were examined under a reflected light microscope, where vitrinite particles were identified, and their reflectance was measured using a photomultiplier-equipped microscope (Hackley, 2022). Reflectance measurements were taken on at least 20 vitrinite particles per sample to ensure statistical reliability. The mean reflectance values (Ro%) were calculated and interpreted to determine the thermal maturity of the samples (Tissot and Welte, 1984).
Thermal history modeling
The integration of AFTA and VR data was performed for constructing detailed thermal history models for the RH-1, RH-2, and RH-11 wells. These models aimed to elucidate the complex geothermal history of the Risha Gas Field, including the assessment the maximum paleotemperatures and dentification of key heating and cooling episodes that influenced hydrocarbon generation.
Thermal history modeling was performed using Petrel Software, which allows for the integration of AFTA and VR data to produce time-temperature paths (Ketcham, 2005). The modeling process involved both forward and inverse modeling approaches. Forward modeling was used to simulate potential thermal histories based on geological constraints and compare these with the observed data. Inverse modeling was employed to iteratively adjust the model parameters to find the best fit between the observed and simulated data (Gallagher, 1998, 2012).
The thermal history interpretation relied on the annealing behavior of spontaneous fission tracks (Gleadow et al., 1983; Green et al., 1989), supported by track length and age data from geological samples (Gleadow et al., 1983) and laboratory-based studies (Duddy et al., 1988; Laslett et al., 1987). These data were integrated into thermal history models using Petrel Software, combining forward and inverse modeling approaches to reconstruct temperature-time (T-t) paths and iteratively adjust model parameters for the best fit with observed data (Gallagher, 1998, 2012; Ketcham, 2005). The models revealed key thermal events, including Late Paleozoic heating (300–265 Ma) with gradients up to ∼45 °C/km, initiating hydrocarbon generation in deeper Paleozoic units; Triassic heating (245–200 Ma), causing localized maturation anomalies in RH-2 and RH-11 wells, where the source rock reached the late oil (VR = 1.0–1.3%) and gas windows (VR = 1.3–2.6%); and Oligocene-Miocene cooling (30–10 Ma), preserving hydrocarbons as gradients decreased to ∼25–30 °C/km due to regional uplift and erosion. These findings provide a robust framework for understanding hydrocarbon generation and preservation in the Risha Gas Field.
Results
The apatite fission track (AFTA) age and mean track length data for all samples containing suitable apatite are summarized in Table 2. These data are plotted as a function of depth and present-day temperature as shown in Figure 2(a): RH-1 well, (b): RH-2 well, and (c): RH-11 well. Each sub-figure contrasts the fission track ages with stratigraphic age variations throughout the section. Additionally, the predicted variations in fission track age and length based on the Default Thermal History for each well are shown in these figures for selected apatite chlorine contents.
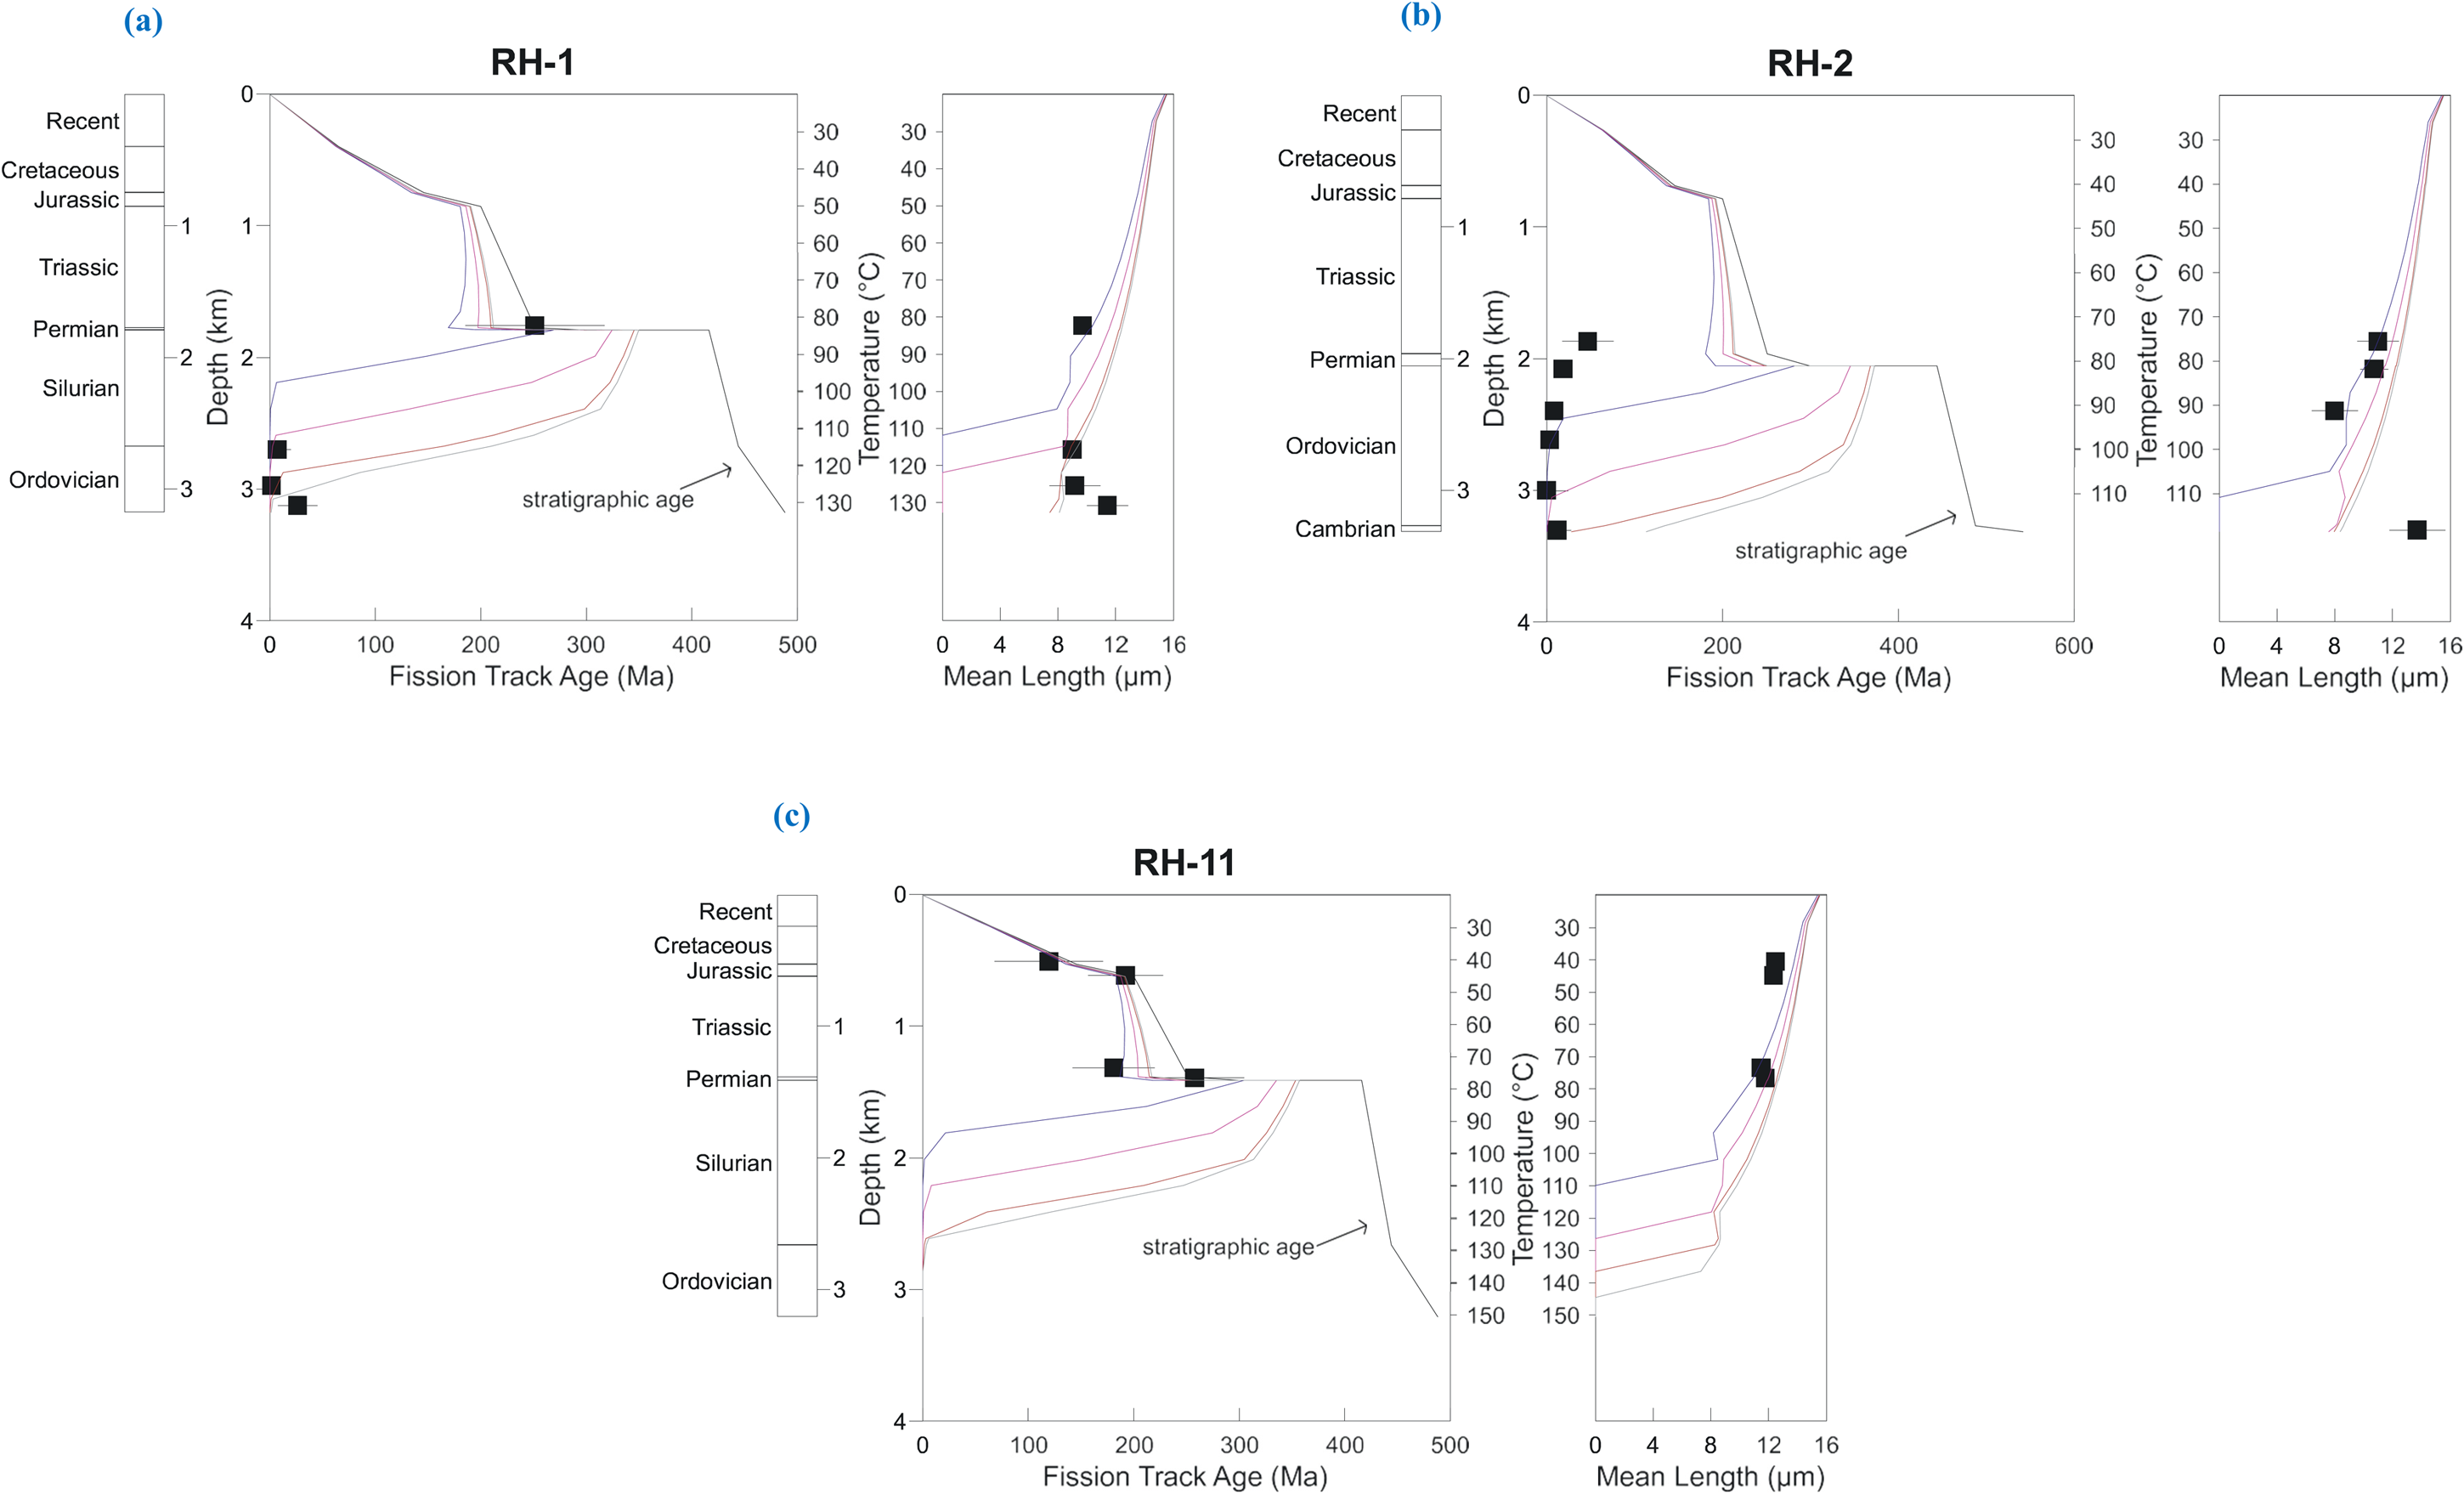
Apatite fission track analysis (AFTA) parameters plotted against sample depth and present temperature for samples from the Risha gas field, Jordan. The plots represent data from RH-1 (a), RH-2 (b), and RH-11 (c), illustrating the variation in AFTA parameters with depth and current temperature across the three wells.
Summary of apatite fission track analysis (AFTA) data for the RH-1, RH-3, RH-2, RH-11and RH-19 wells.
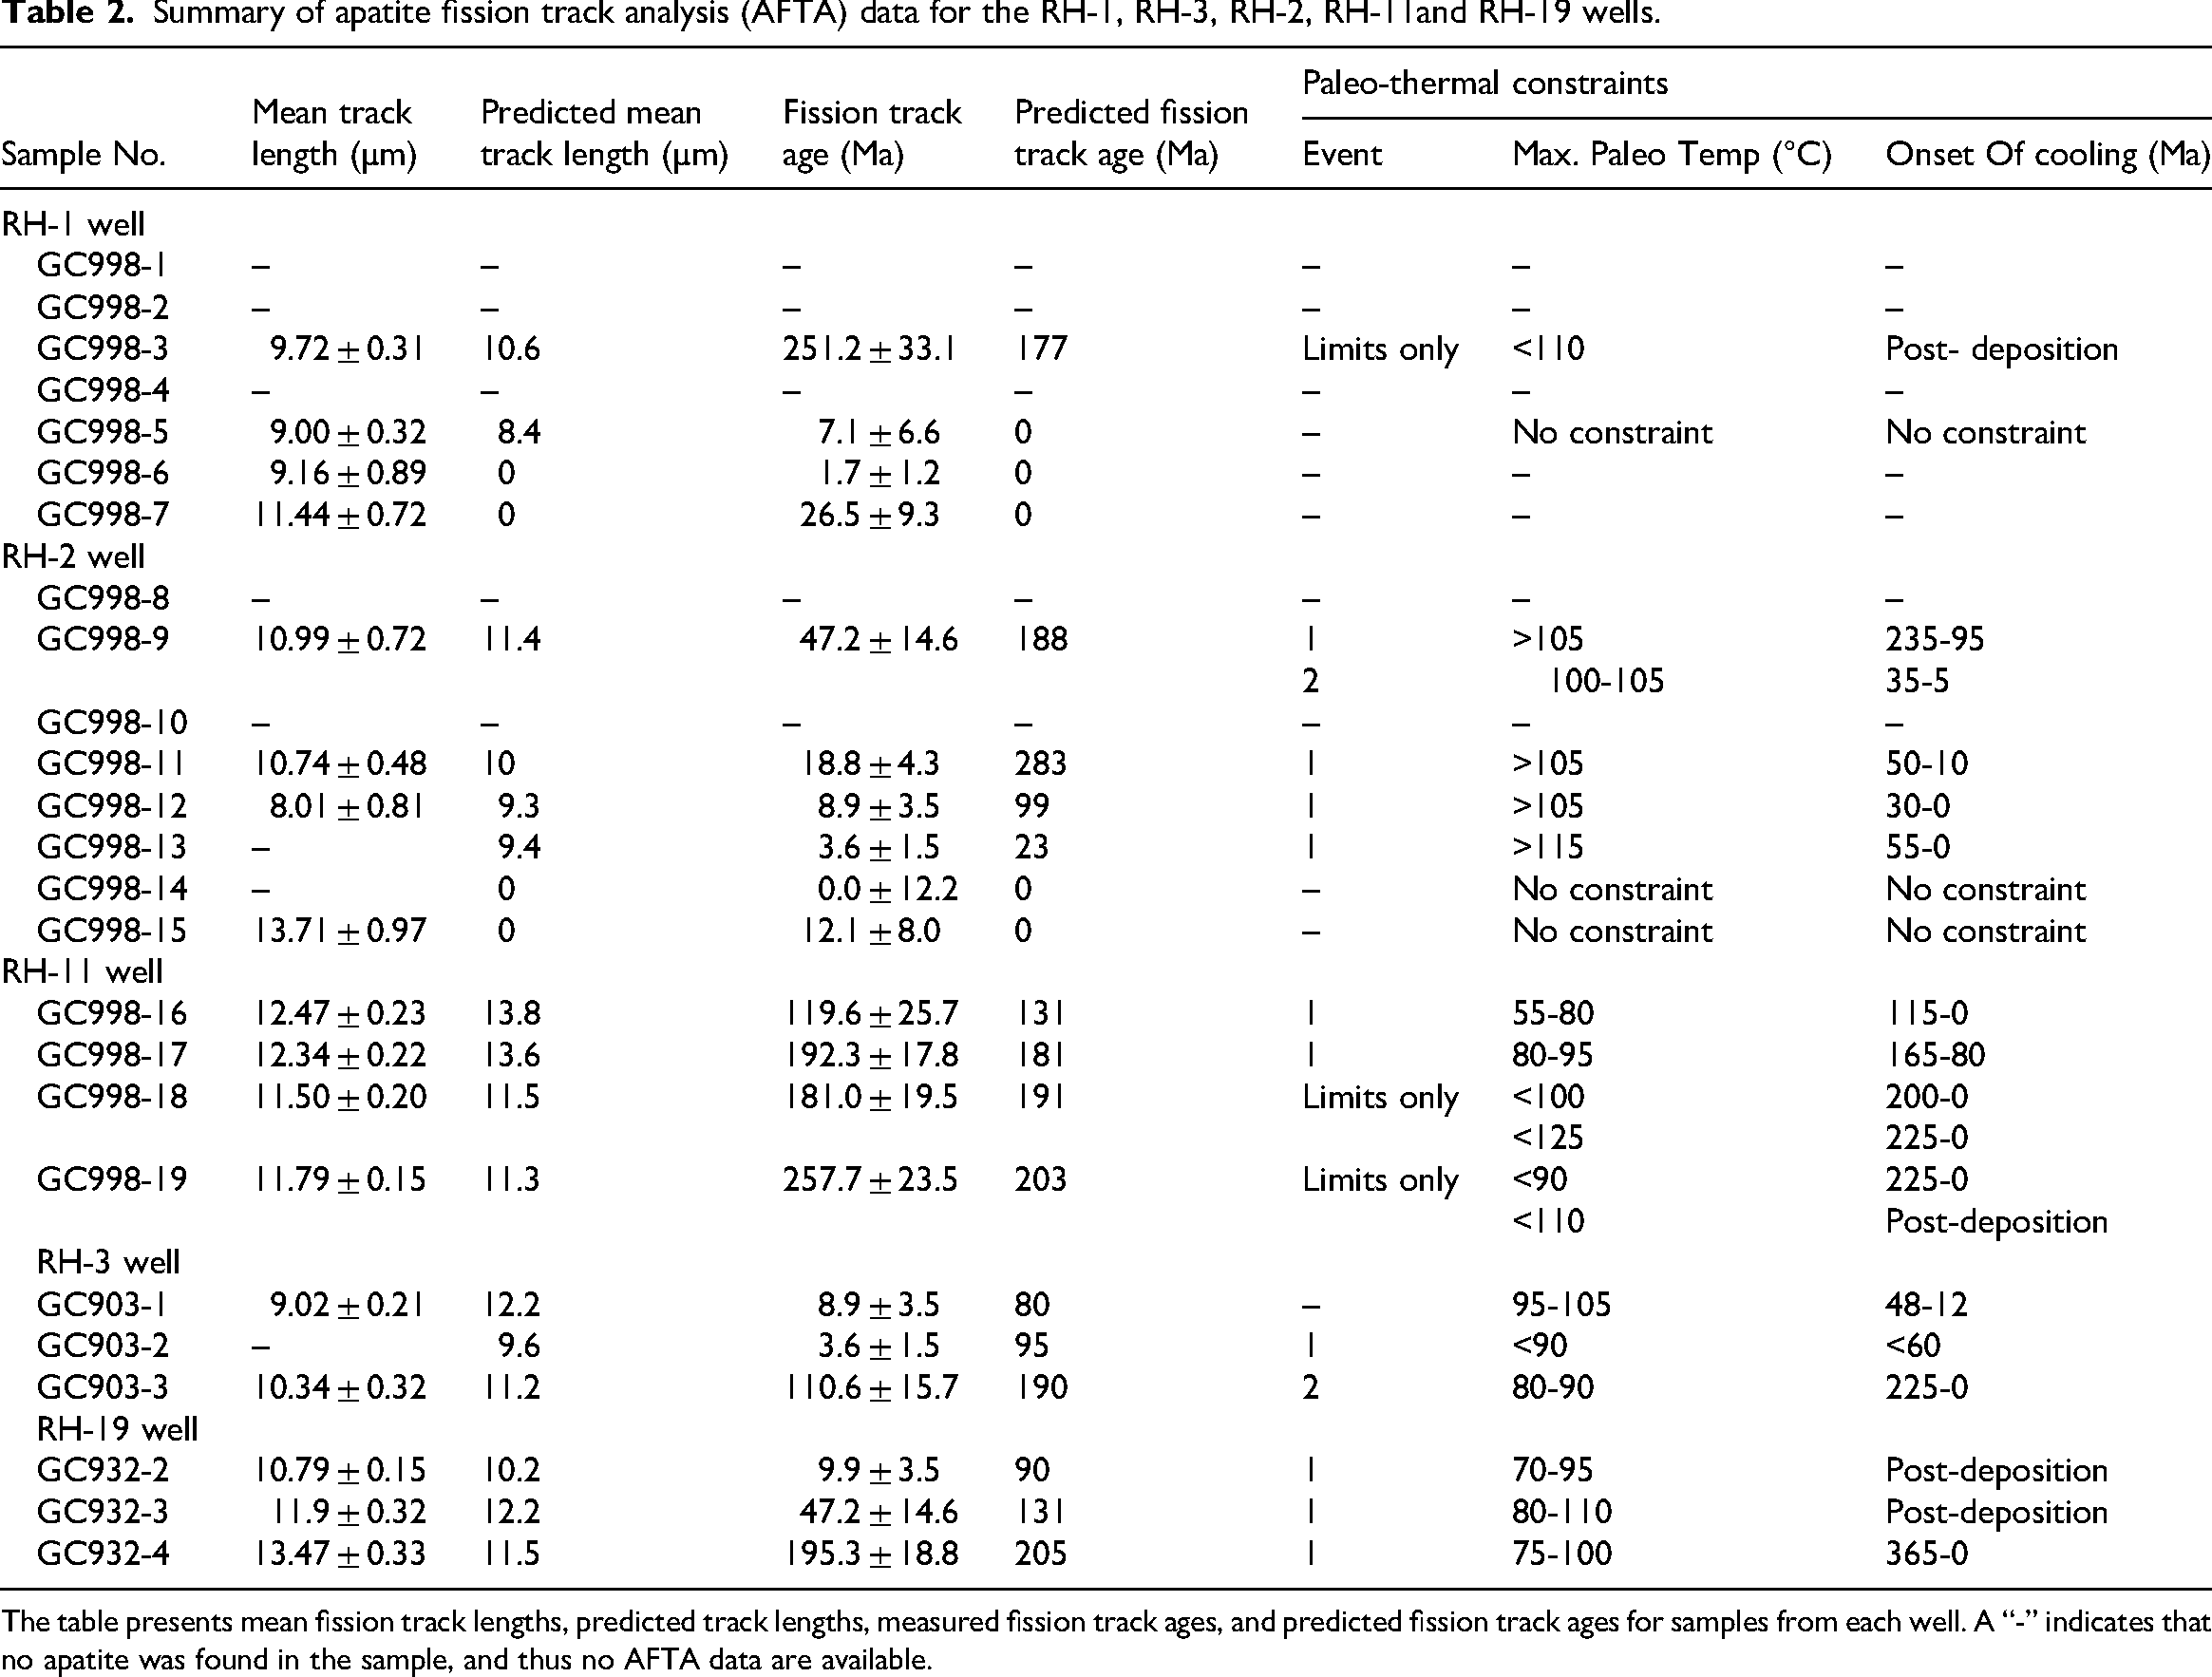
The table presents mean fission track lengths, predicted track lengths, measured fission track ages, and predicted fission track ages for samples from each well. A “-” indicates that no apatite was found in the sample, and thus no AFTA data are available.
In the RH-2 well, fission track ages from the three shallowest samples were significantly younger than those predicted by the Default Thermal History (Figure 2(b)), indicating past higher temperatures. Conversely, four Mesozoic section samples from the RH-11 well (Figure 2(c)) align closely with the Default Thermal History predictions, complicating the interpretation. The RH-1 well results (Figure 2(a)) remain inconclusive, requiring further detailed analysis. Qualitative assessments indicating past elevated temperatures the maximum post-depositional paleotemperature and the onset of cooling are presented in the supplementary section (Tables S1 and S2).
Additionally, we observed a variation in the AFTA data due to differences in apatite yields across samples. Excellent apatite yields, with fission track ages determined from 20 or more grains, were obtained from eight samples, including two from the Paleozoic section in the RH-1 well, three from the Paleozoic section in the RH-2 well, and three from the Mesozoic section in the RH-11 well. Five samples yielded fair to good results (10–19 single-grain ages), one sample produced poor results (five ages), and five samples failed to yield suitable apatite. The target of 100 track lengths was achieved in only one sample; other samples had between 0 and 53 track lengths, with most having fewer than 10. These low counts reflect the extensive annealing caused by the current thermal regime but have little impact on overall interpretation. The quality of etched surfaces was generally high across the samples.
New VR analyses were performed for five samples identified after AFTA analysis, with results summarized in Table 3.
Maximum paleotemperatures from VR data in the RH-1, R-2, and RH-11 wells.
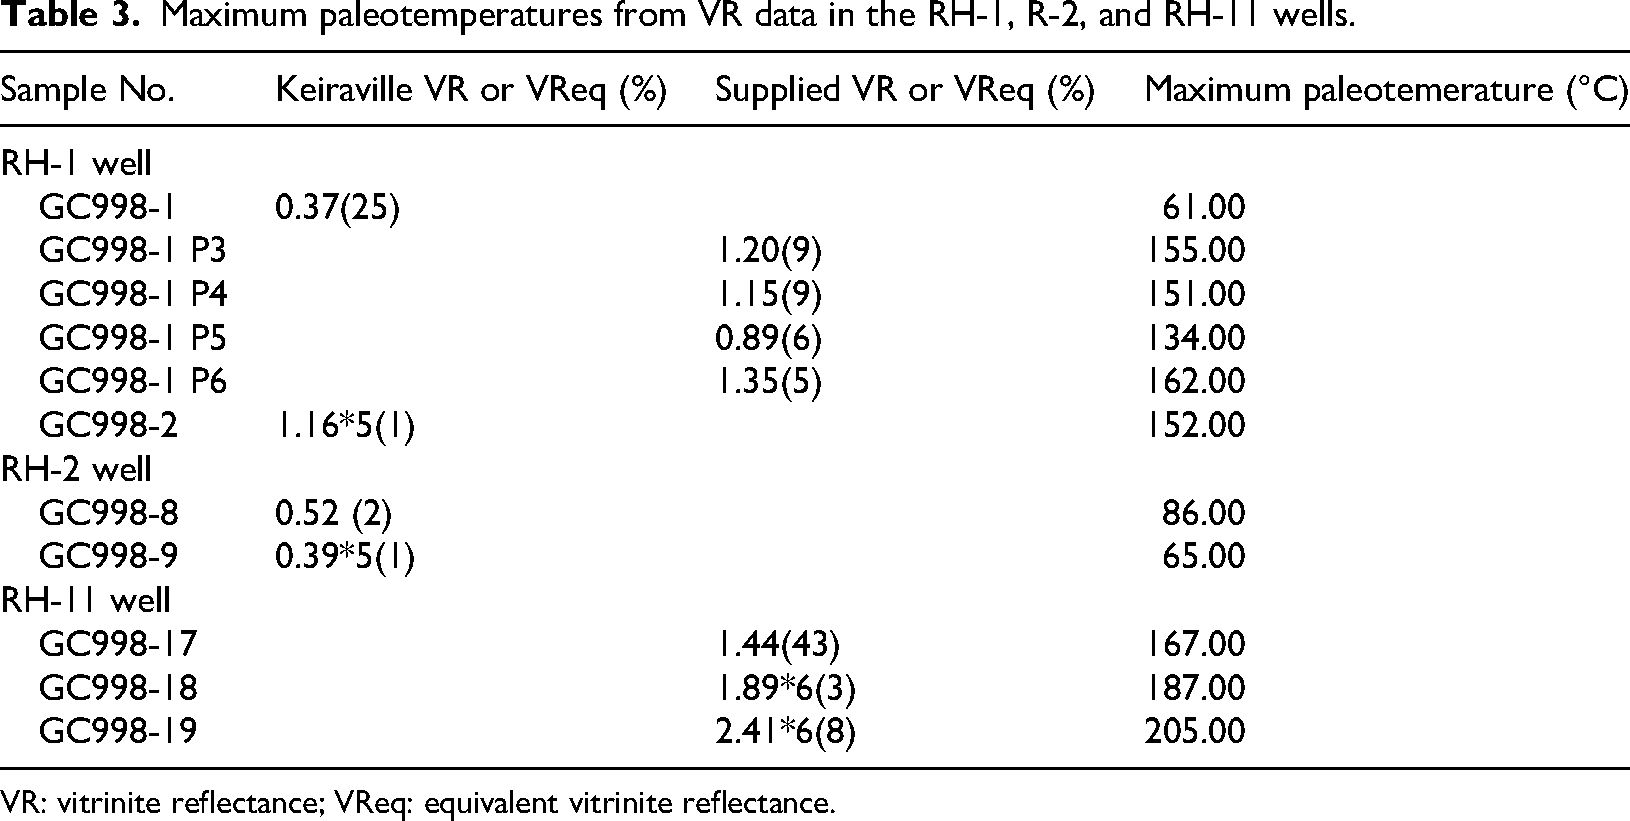
VR: vitrinite reflectance; VReq: equivalent vitrinite reflectance.
Vitrinite was found in two of these samples, while two additional samples contained inertinite macerals. Mean Inertinite reflectance (IR) values were converted to equivalent vitrinite reflectance (VReq) using the relationship provided in Figure 3.
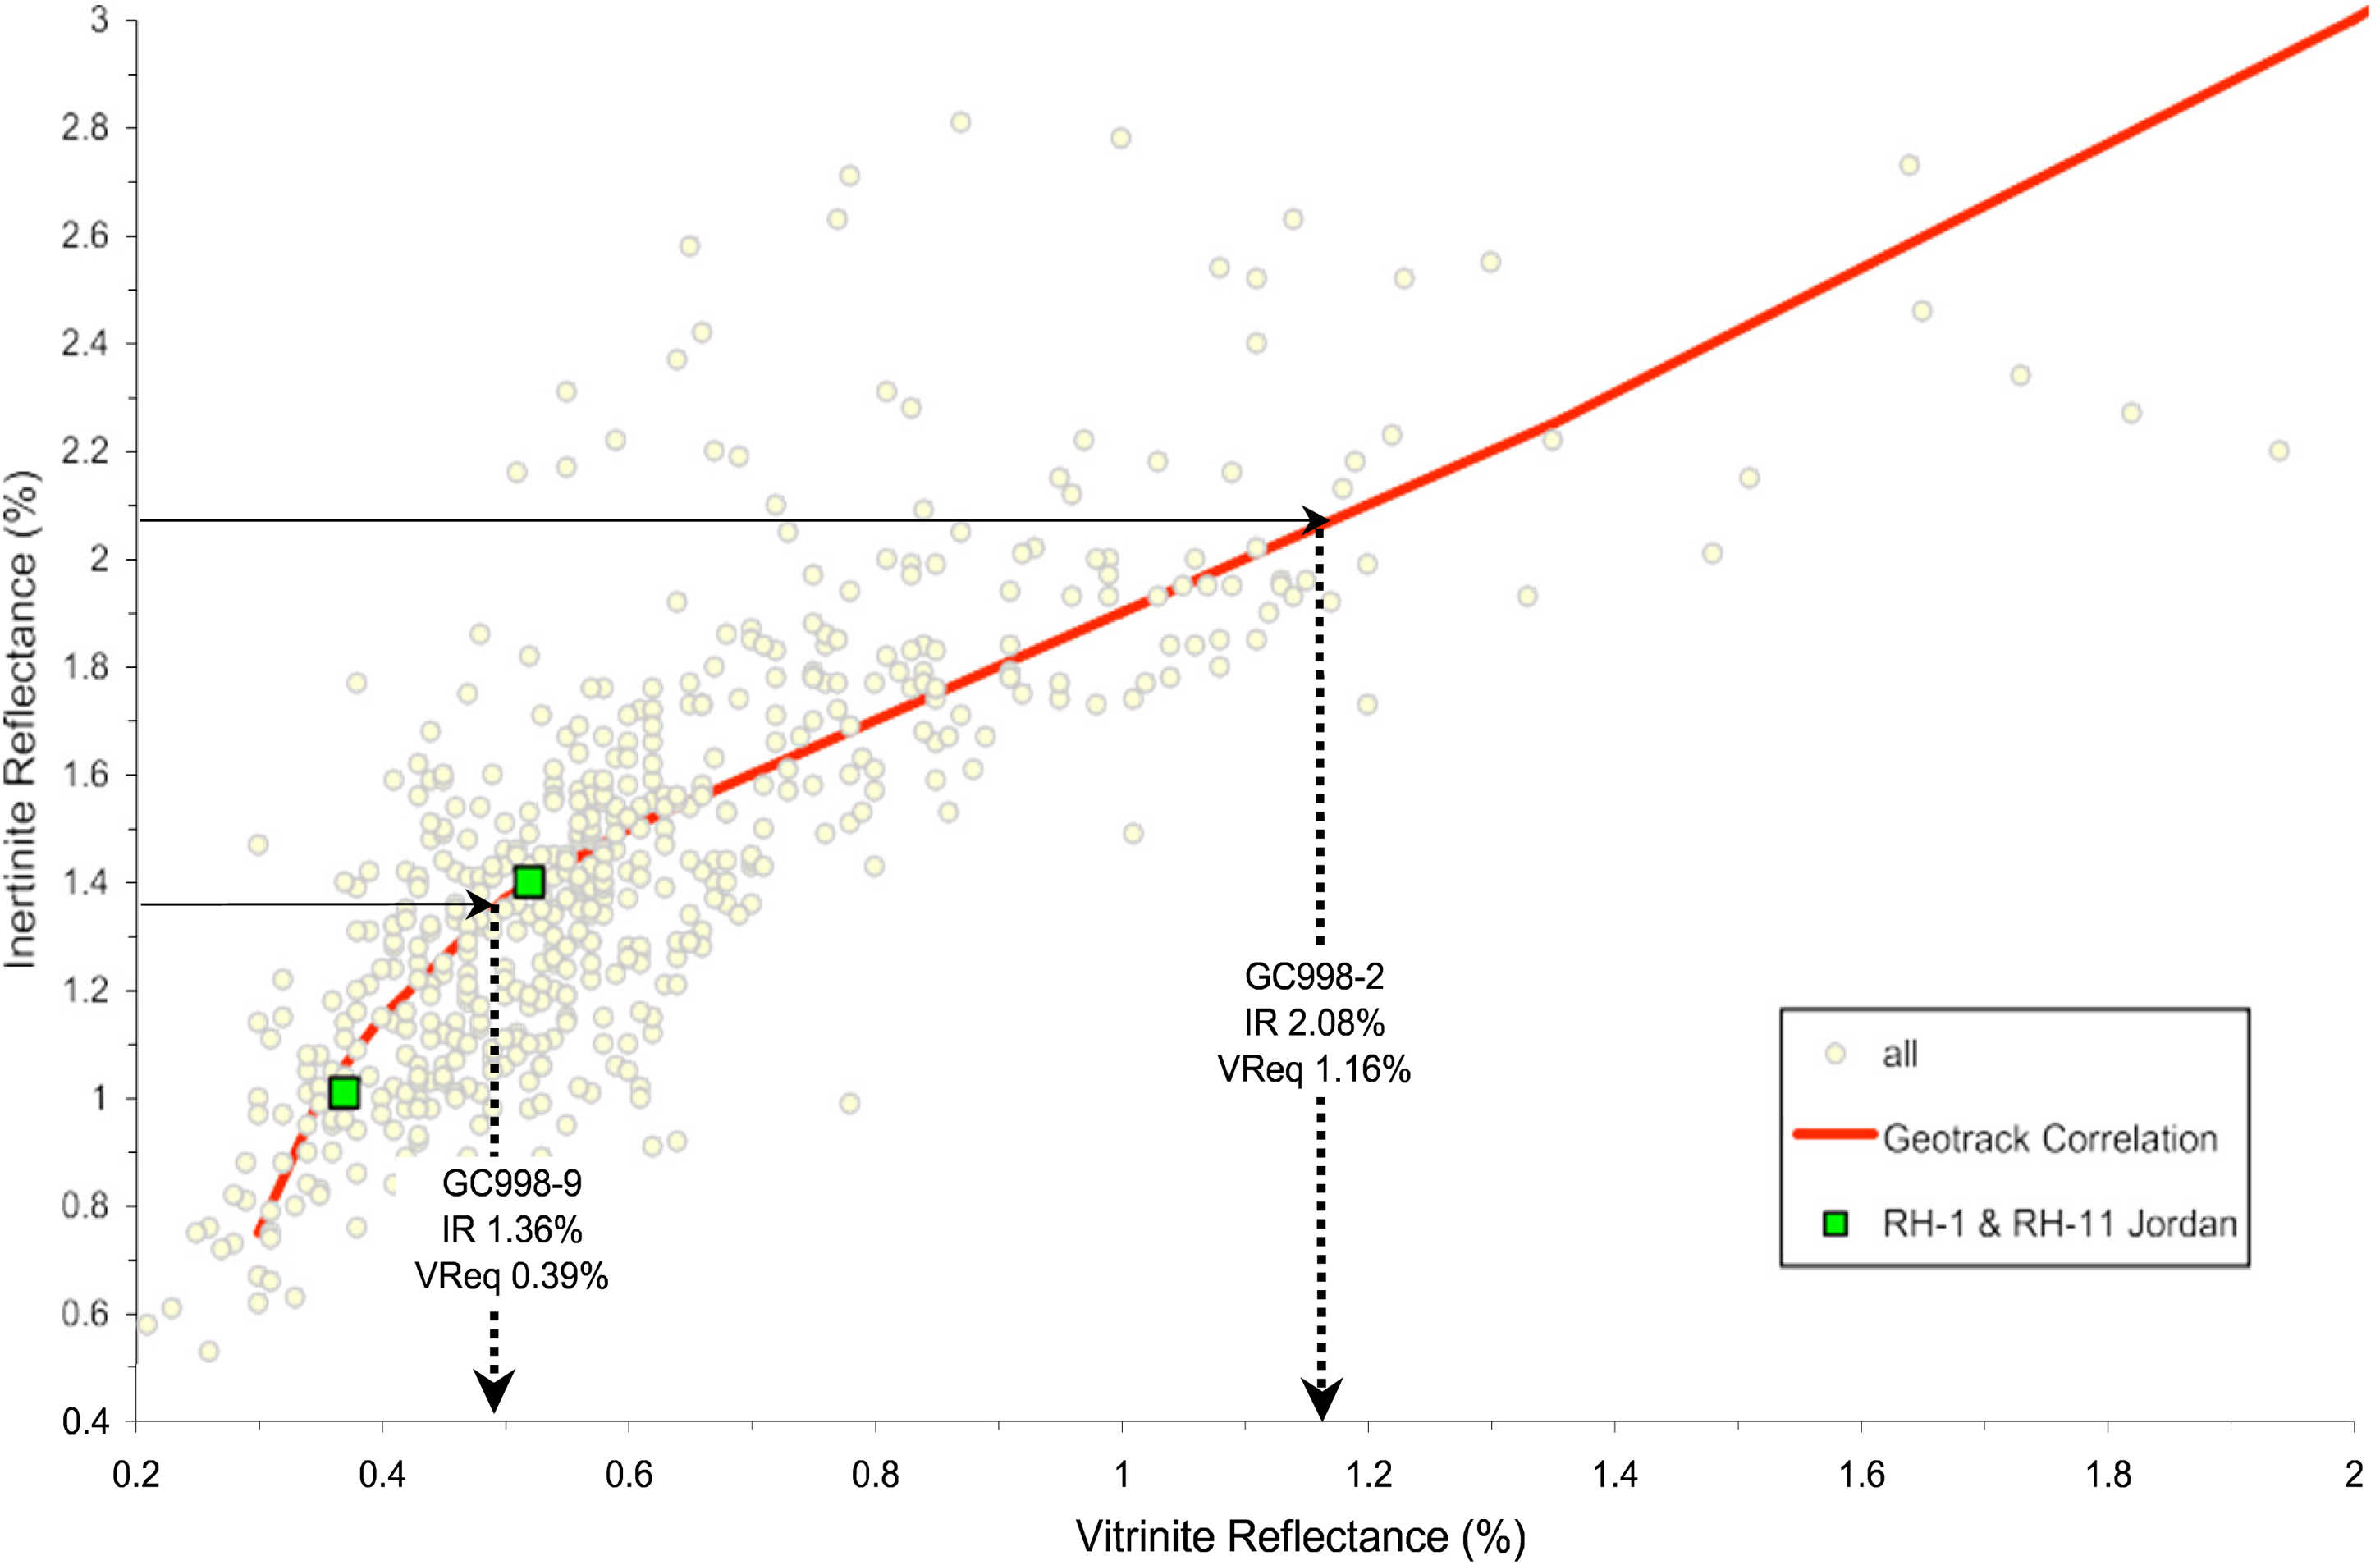
Using a compilation of mean VR and IR values measured in samples from a wide range of settings around the world (all), mean IR values measured in samples from Jordan wells RH-1 and RH-11. VR: vitrinite reflectance; IR: inertinite reflectance.
Five VR analyses were performed on samples from the RH-1 and RH-2 wells, with one providing high-quality data and three yielding lower-quality results with only one or two measurements each. One sample failed to yield data. Additional VR and VReq values for the RH-1 and RH-11 wells are summarized in Table 3, but most values are based on fewer measurements and show scatter, requiring cautious interpretation. Notably, the VR data from a Permian sample in the RH-1 well, which included 43 measurements, offer reliable mean reflectance values.
The AFTA data from the RH-1, RH-2, and RH-11 wells provide reliable constraints on paleo-thermal events, despite the variations in sample quality. The fission track ages and lengths indicate a complex thermal history, with some units having experienced higher temperatures in the past, particularly in the RH-2 well. VR data, although more limited in scope, offer further support for the thermal history interpretations, especially in samples with reliable measurements from the RH-1 well. Quantitative thermal history reconstructions based on AFTA and VR data are further detailed in subsequent sections, providing a comprehensive view of the Risha Gas Field's thermal evolution.
Discussion
Experimental data and thermal history modeling
In the RH-1 well, present-day thermal regimes align with AFTA predictions, indicating that current thermal gradients can be reliably estimated from corrected BHT values. Samples GC998-3 and GC998-5 reveal consistent track length data, while deeper sections show no evidence of significantly higher past temperatures, likely due to post-depositional heating and cooling. In RH-2, AFTA data identify two paleothermal episodes (235–95 and 30–10 Ma), with shallow samples, such as GC998-9, showing localized heating and cooling events, while deeper samples are dominated by present-day thermal conditions (Green et al., 1997). Evidence from samples GC998-11 and GC998-12 supports recent thermal effects in localized areas (Table S1). In RH-11, shallow samples (e.g., GC998-16 and GC998-17) indicate past elevated temperatures and a Mesozoic paleothermal event, while deeper sections reflect a more stable thermal history. Sample GC998-19 aligns closely with the present-day thermal regime, with deeper samples showing limited signs of past heating (Table S1).
The thermal analysis of the RH-1, RH-2, and RH-11 wells reveals varied thermal histories. In RH-1, present-day thermal conditions align with AFTA predictions, suggesting stability in current gradients with no significant past heating in deeper sections. RH-2 exhibits two distinct paleo-thermal episodes (235–95 and 30–10 Ma), with shallow samples showing past heating and cooling, while deeper sections are influenced by present-day conditions. RH-11 shows signs of past elevated temperatures in shallow samples and a single Mesozoic paleo-thermal event, with deeper sections remaining thermally stable. These findings highlight complex thermal histories and the influence of past and present thermal regimes in the Risha Gas Field.
Magnitude of paleotemperatures and timing of cooling
The AFTA data provided key insights into the magnitude and timing of paleotemperatures across the RH-1, RH-2, and RH-11 wells. In the RH-1 well, the shallowest sample (Sample GC998-3) suggests an upper limit for heating and cooling, while the deeper samples (Samples GC998-4–GC998-7) are dominated by present-day thermal conditions, indicating limited paleo-thermal effects. In contrast, RH-2 data reveal more complexity, with Sample 9 identifying at least two distinct paleo-thermal episodes. Deeper samples (GC998-11–GC998-13) show a dominance of recent thermal conditions, suggesting the overprinting of earlier thermal events by later ones, as seen in the shallower samples. The deepest samples (GC998-14 and GC998-15) exhibit only present-day thermal characteristics, providing no further insight into paleothermal conditions. In the RH-11 well, shallow samples (GC998-16 and GC998-17) highlight a singular paleothermal episode, while deeper samples (GC998-18 and GC998-19) are limited to upper constraints for both heating and cooling. Collectively, such pattern emphasizes that the influence of recent thermal regimes only works for the deeper sections, particularly in RH-2 and RH-11, while the shallower sections were more likely influenced by older thermal events. Furthermore, the variation in thermal histories across these wells points to localized thermal events, with cooling episodes likely overprinted by later tectonic or geothermal activities.
Comparison of AFTA and VR data
The integration of AFTA and VR data provides a more complete picture of the thermal history of the Risha Gas Field as shown in Figure 4.
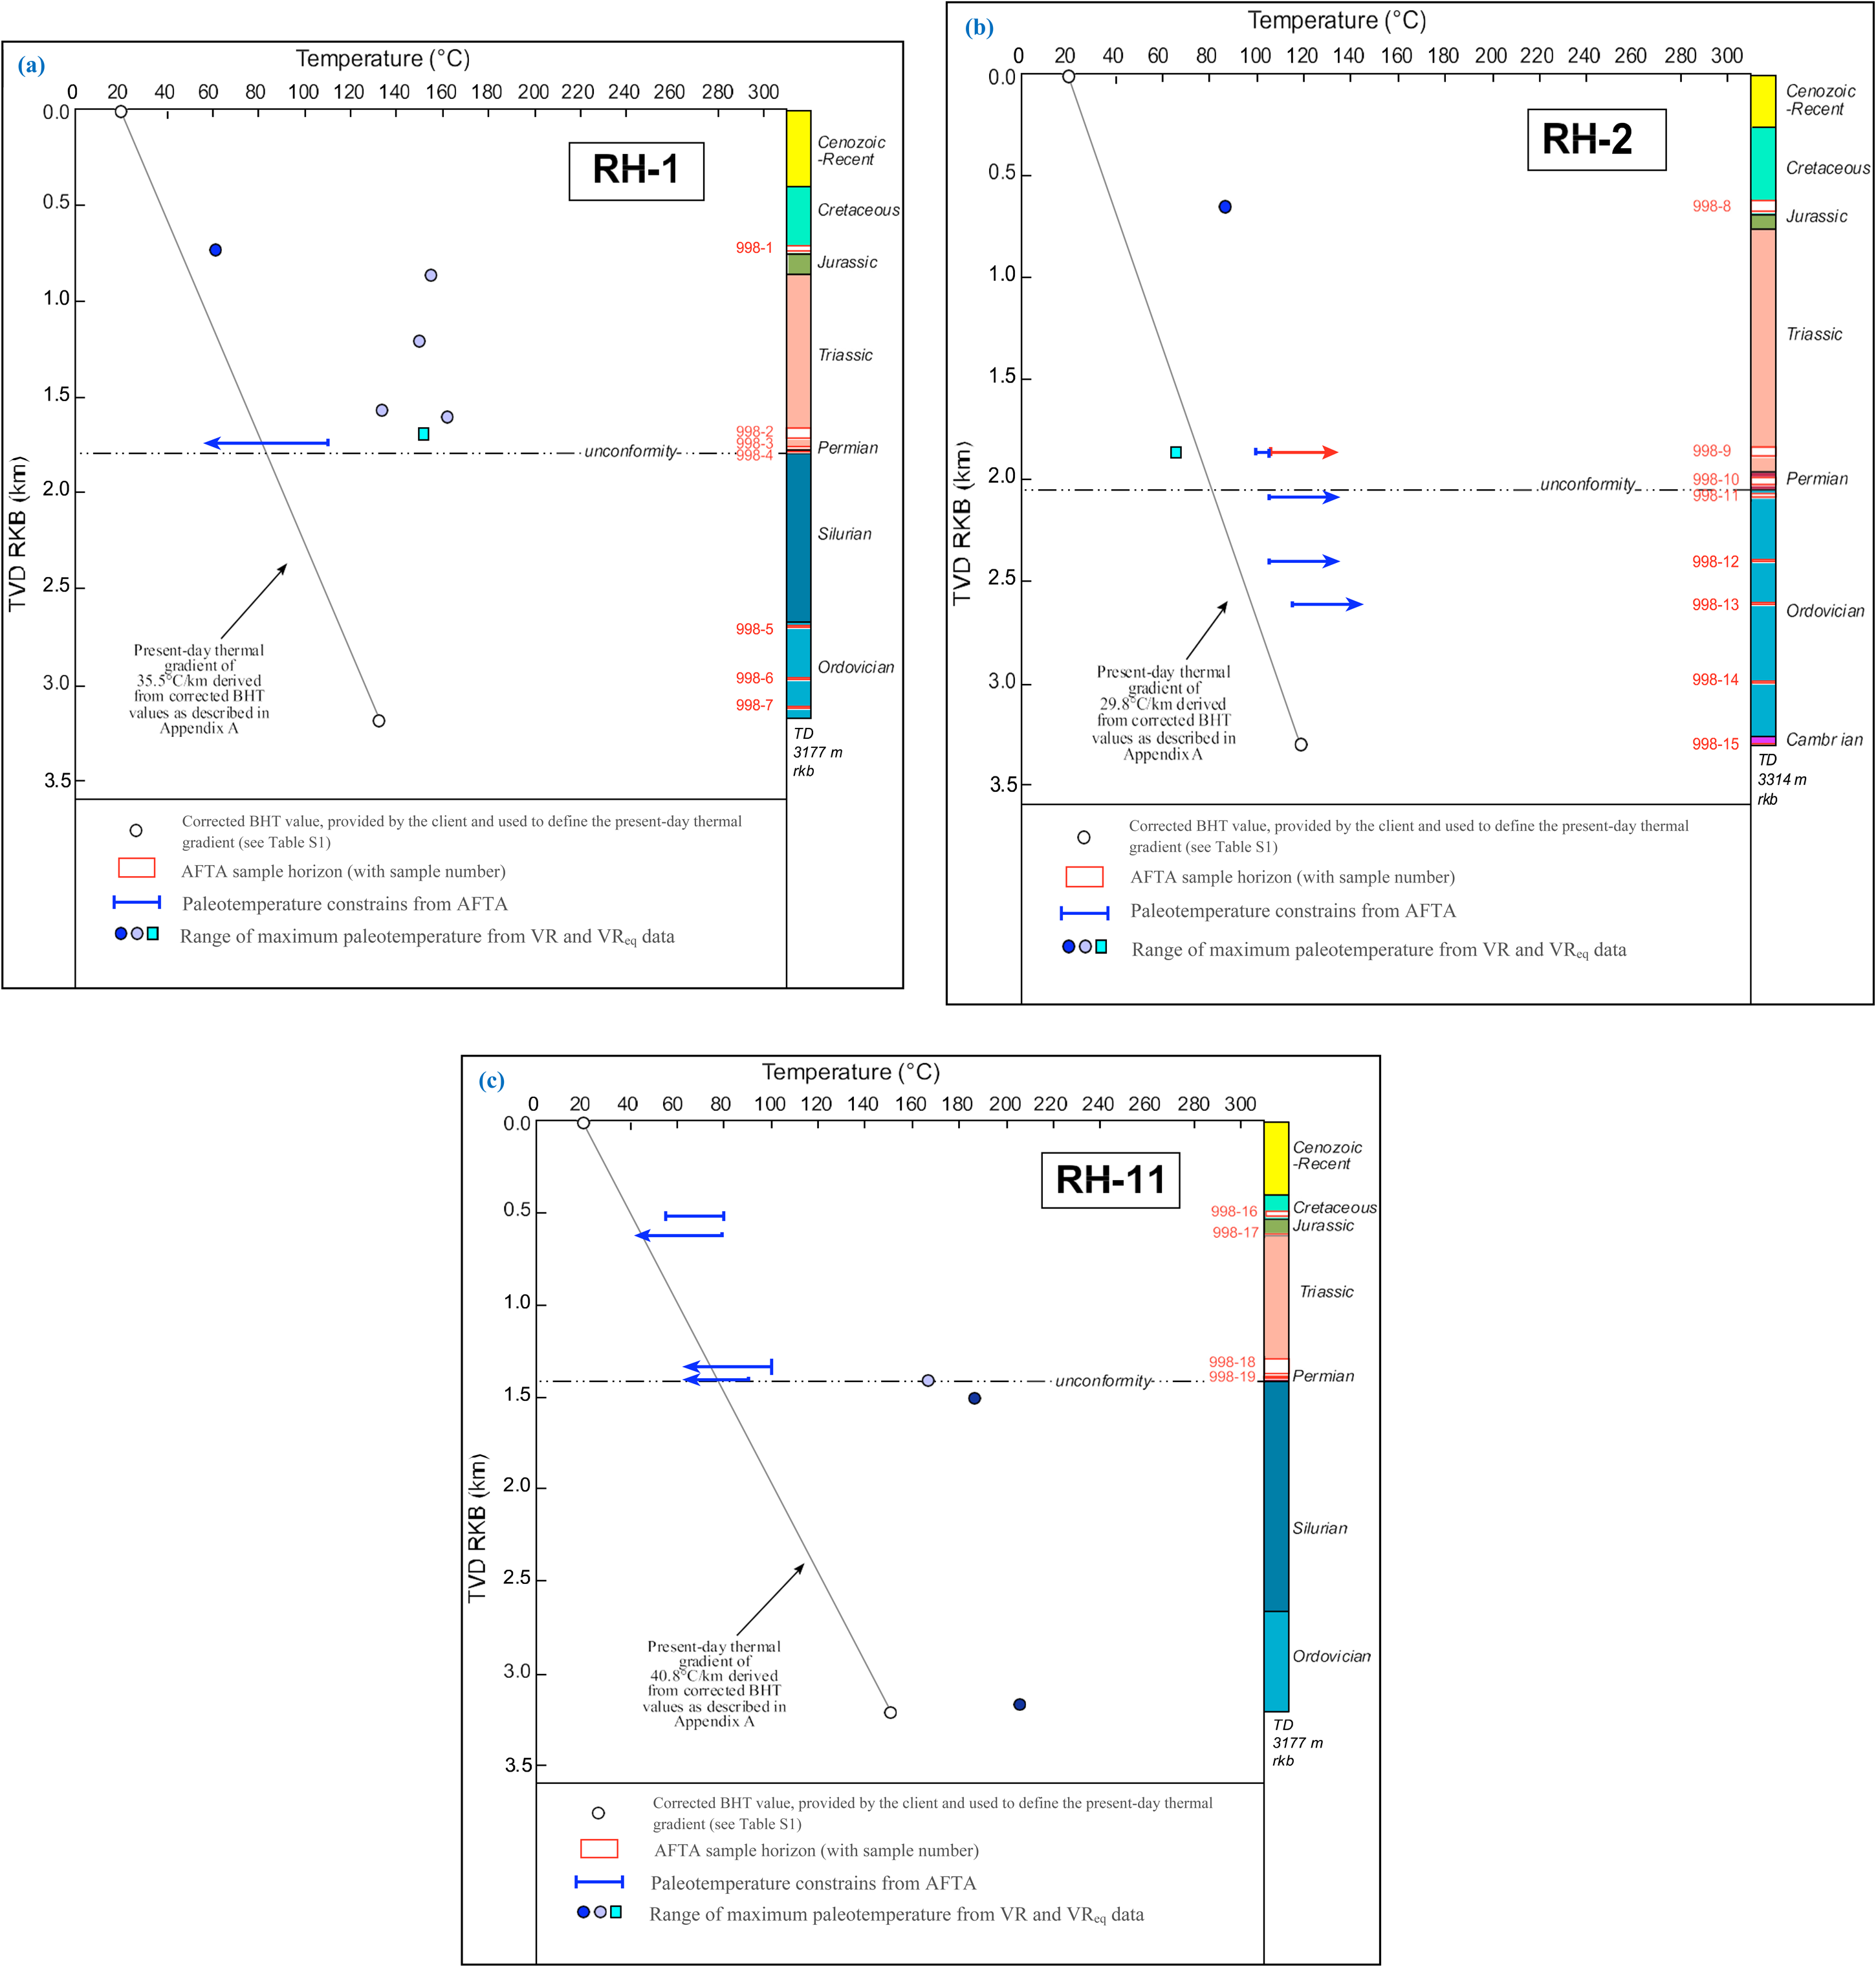
Paleotemperature constraints derived from AFTA and VR data plotted against depth (rkb) showing insights into the thermal histories and geothermal gradients across the studied wells in the Risha Field. Top plot shows the RH-1 well (a) with a thermal gradient of 35.5 °C/km, Middle subplot displays the RH-2 well (b) with a gradient of 29.8 °C/km, while the bottom plot illustrates the RH-11 well (c), with a gradient of 40.8 °C/km. AFTA: apatite fission track analysis; VR: vitrinite reflectance.
In the RH-1 well (Figure 4(a)), VR data suggest higher temperatures in Triassic units compared to AFTA data, with VR-derived temperatures between 134 and 162 °C, as indicated in Table 3. These discrepancies could be attributed to local heating events, which are captured by VR but not by AFTA, highlighting potential variations in heat flow or differences in data sensitivity (Naylor et al., 2013). In RH-2 (Figure 4(b)), VR data are less consistent, likely due to the lower data quality, but they still provide evidence of past heating. For instance, the lower VR values from GC998-9 suggest that paleotemperatures in this well were lower than AFTA-derived values. On the other hand, AFTA data suggest a cooling event between 235 and 95 Ma, consistent with regional tectonic uplift during the Late Triassic. This, in conjunction with VR data, suggests that hydrocarbon maturation may have occurred during this period of uplift and subsequent cooling. In contrast, the RH-11 well (Figure 4(c)) exhibits more consistent VR and AFTA data: Both methods confirm a relatively stable thermal regime, with paleo-temperatures consistent between the two datasets. However, localized heating in the Jurassic and Permian sections may have influenced the VR data more strongly, especially in the deeper sections.
The integration of AFTA and VR data reveals that thermal events directly influenced hydrocarbon maturation in the Risha Gas Field. Elevated temperatures in the Triassic units of RH-1 (134–162 °C) indicate conditions suitable for gas generation, while regional uplift and cooling events (235–95 Ma) in RH-2 likely preserved mature hydrocarbons by halting further thermal degradation. Localized heating in Jurassic and Permian sections, particularly in RH-11, pushed organic matter into hydrocarbon generation windows, enhancing thermal maturity. Additionally, significant burial of Paleozoic and Triassic units provided the heat necessary for maturation, while subsequent exhumation stabilized hydrocarbons in their traps. Paleotemperature constraints derived from AFTA and VR data for wells RH-3 and RH-19 from the same gas filed (Naylor et al., 2013) reveal two significant cooling episodes (Figure 5(a) and (b)).
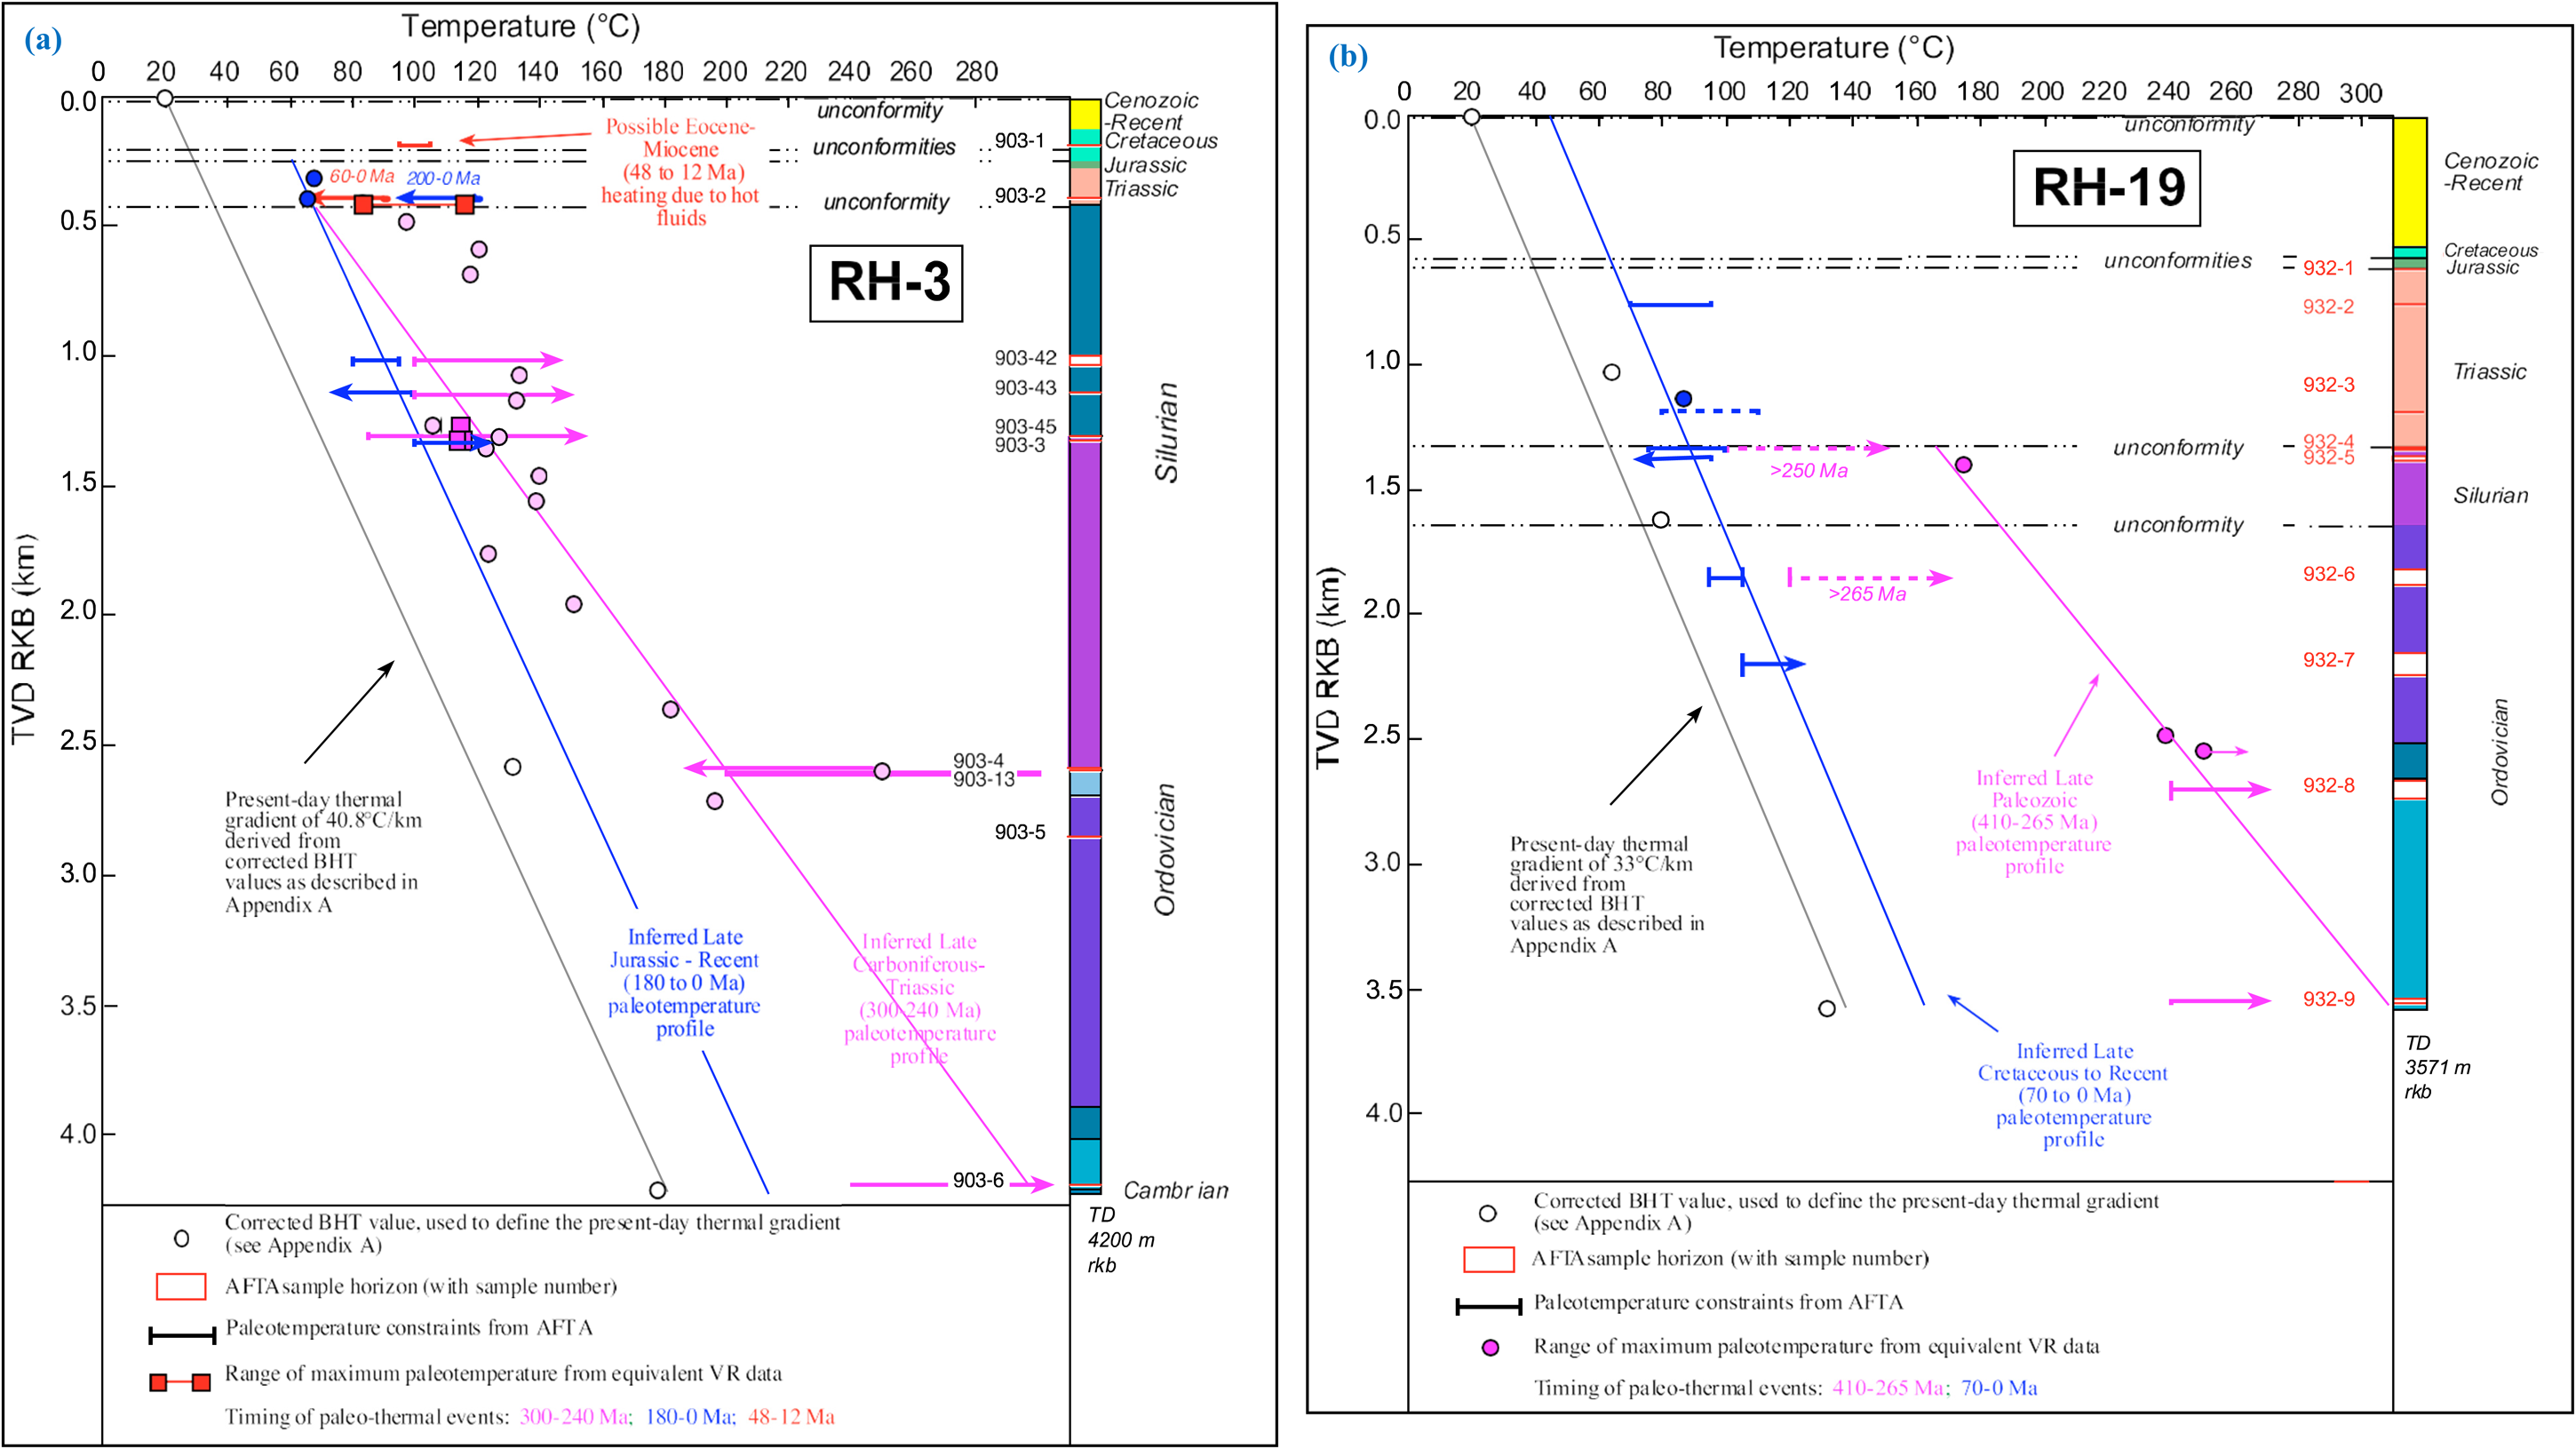
Paleotemperature constraints derived from AFTA, ZFTA, and VR/VReq data plotted against depth (rkb) for wells RH-3 (a) and RH-19 (b), Jordan. (a) Subfigure displays the geothermal profile for RH-3, with a present-day gradient of 40.8 °C/km, while (b) subfigure shows the RH-19 well, based on a geothermal gradient of 33 °C/km. Both subfigures provide essential data on paleotemperature trends, aiding in the reconstruction of the geothermal history of the region (Naylor et al., 2013).
The discrepancies between measured and VReq values, along with a poor fit of the modeled line in Figure 5, can arise from the Risha Gas Field's complex thermal history involving multiple heating and cooling episodes, localized thermal anomalies (particularly in Triassic and Permian units), lithological effects, limitations in VR data quality and quantity, and the simplifying assumptions inherent in thermal history models.
The first occurred during the Early Paleozoic (300–265 Ma), where samples from both wells show cooling from maximum post-depositional paleotemperatures exceeding 100 °C. This period of elevated temperatures was likely driven by a high paleogeothermal gradient, which was the result of both deeper burial and increased basal heat flow (Naylor et al., 2013). The consistent cooling observed in these wells during this time correlates with broader regional tectonic activity that affected sedimentary basins across the Middle East (Naylor et al., 2013).
The second episode of cooling occurred during the Late Mesozoic to Cenozoic (70–0 Ma). In both wells, cooling from peak paleotemperatures of 20–40 °C above present-day values is evident, beginning between 70 and 0 Ma. This later event is attributed to the combined effects of deeper burial, followed by exhumation during tectonic uplift (Japsen et al., 2007). The presence of these two distinct cooling episodes provides a framework for understanding the geothermal evolution of the Risha Gas Field and its implications for hydrocarbon generation.
Insight from chitinozoan reflectance data
A comparison with the RH-11 well (Figure 6(c)) suggests that paleotemperatures of around 200 °C, derived from chitinozoan reflectance data, likely correspond to the Late Paleozoic cooling episode (300–265 Ma) identified in RH-3 and RH-19. However, the absence of a rapid increase in temperature with depth in RH-11 indicates that the effects of this episode may have been less pronounced or that data limitations have obscured its signature. Similarly, while no VReq values are available for RH-1 (Figure 6(a)) and RH-2 (Figure 6(b)), the widespread occurrence of the Paleozoic cooling episode across multiple wells in the region supports the hypothesis that this event impacted these wells as well.
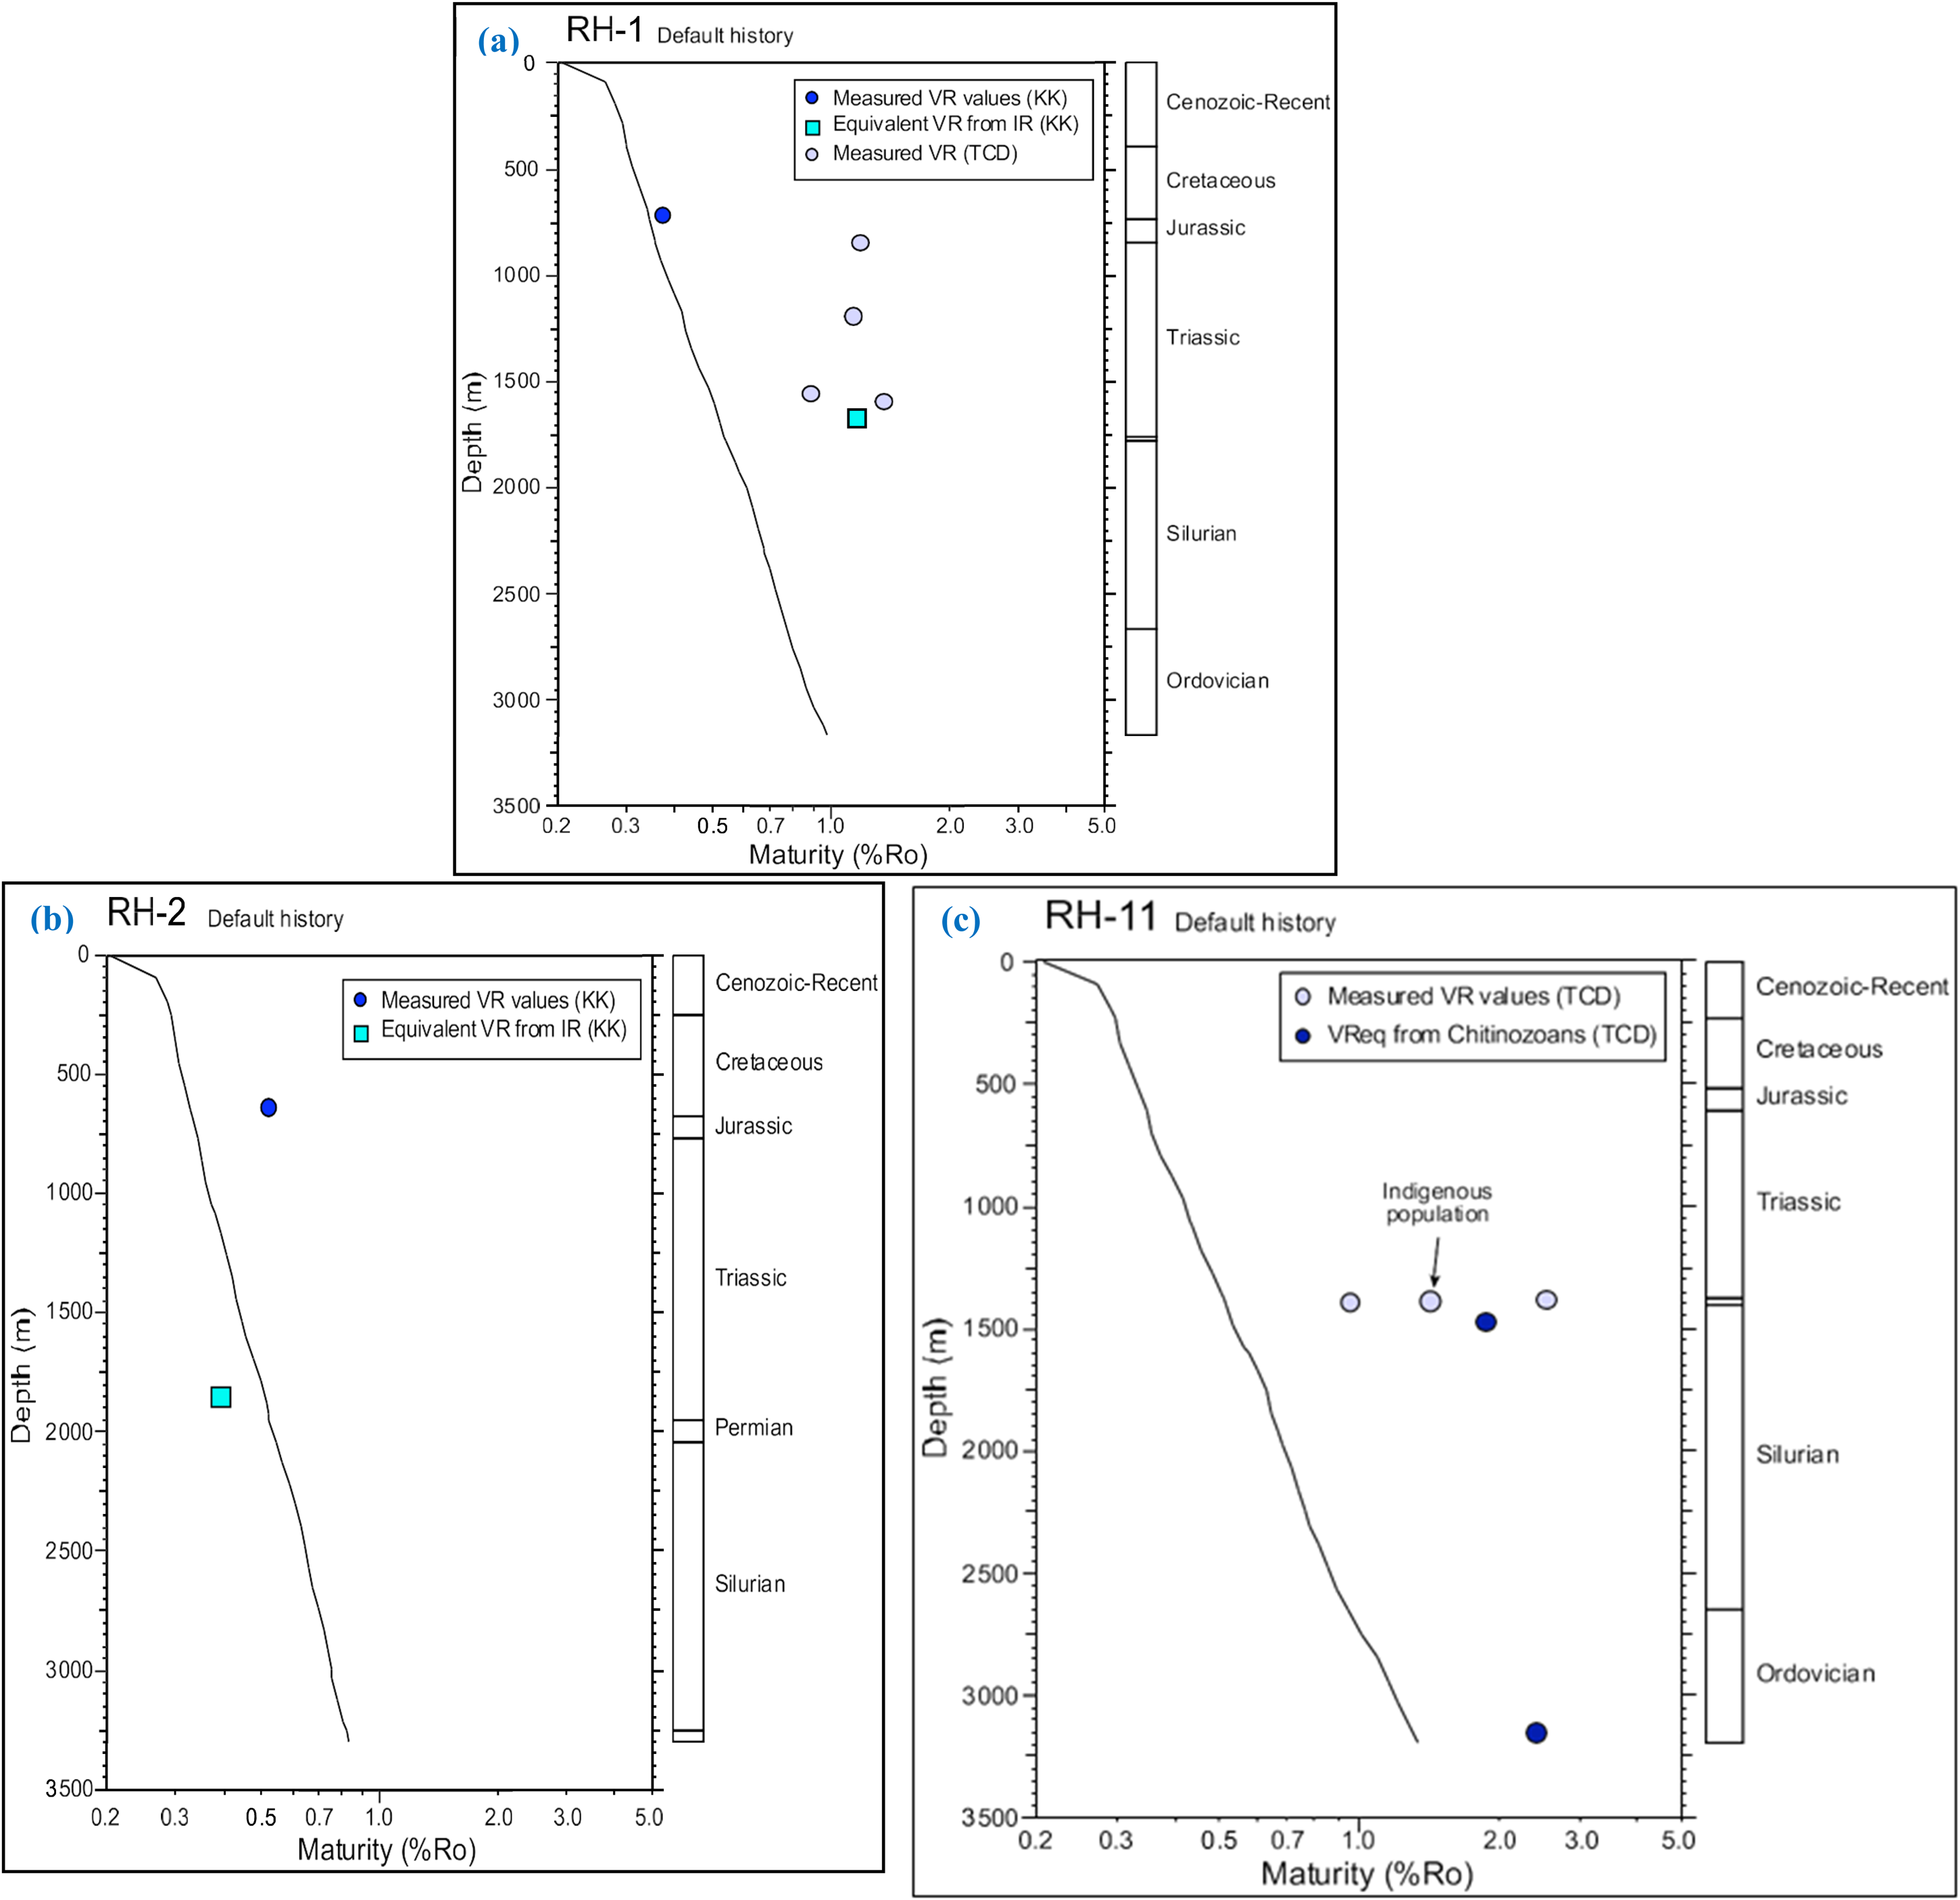
VR data from two sources and VReq values derived from inertinite reflectance data (KK) in the RH-1 well, Jordan, plotted against depth (a), VR data and VReq values derived from inertinite reflectance data (KK) in the RH-2 well, Jordan, plotted against depth (b) and VR data and VReq values derived from Chitinozoan reflectance data (TCD) in the RH-11 well, Jordan, plotted against depth (c). VR: vitrinite reflectance; VReq: equivalent vitrinite reflectance.
The cooling episode identified between 30–10 Ma in the RH-2 well aligns with widespread cooling observed during the Oligocene-Miocene period (Holford et al., 2005). This episode can be understood in conjunction with the extensive tectonic activity associated with the uplift and erosion of large sedimentary basins during this time. The single VR value from RH-1; and AFTA data from RH-11 further support the presence of this Oligocene-Miocene cooling episode, indicating that the event had a significant impact on the thermal regimes in the Risha Gas Field.
Synthesis of paleothermal episodes
Furthermore, the data collected from the RH-1, RH-2, and RH-11 wells, along with data from RH-3 and RH-19; support the identification of two major paleothermal episodes that affected the region (Figure 7). The first, from the end-Carboniferous to Permian (300–265 Ma), was characterized by increased basal heat flow and deeper burial, followed by cooling (Grobe et al., 2015). This episode is clearly reflected in VReq values from the Paleozoic units in RH-11 and is consistent across other wells (Table 2). The second episode, occurring during the Oligocene-Miocene (30–10 Ma), was driven by further burial followed by cooling, as indicated by VR and AFTA data from RH-1 and RH-2. The magnitude of this event appears to be more limited in RH-1 and RH-11, as AFTA data constraints suggest that the impact was less severe in these wells compared to RH-2.
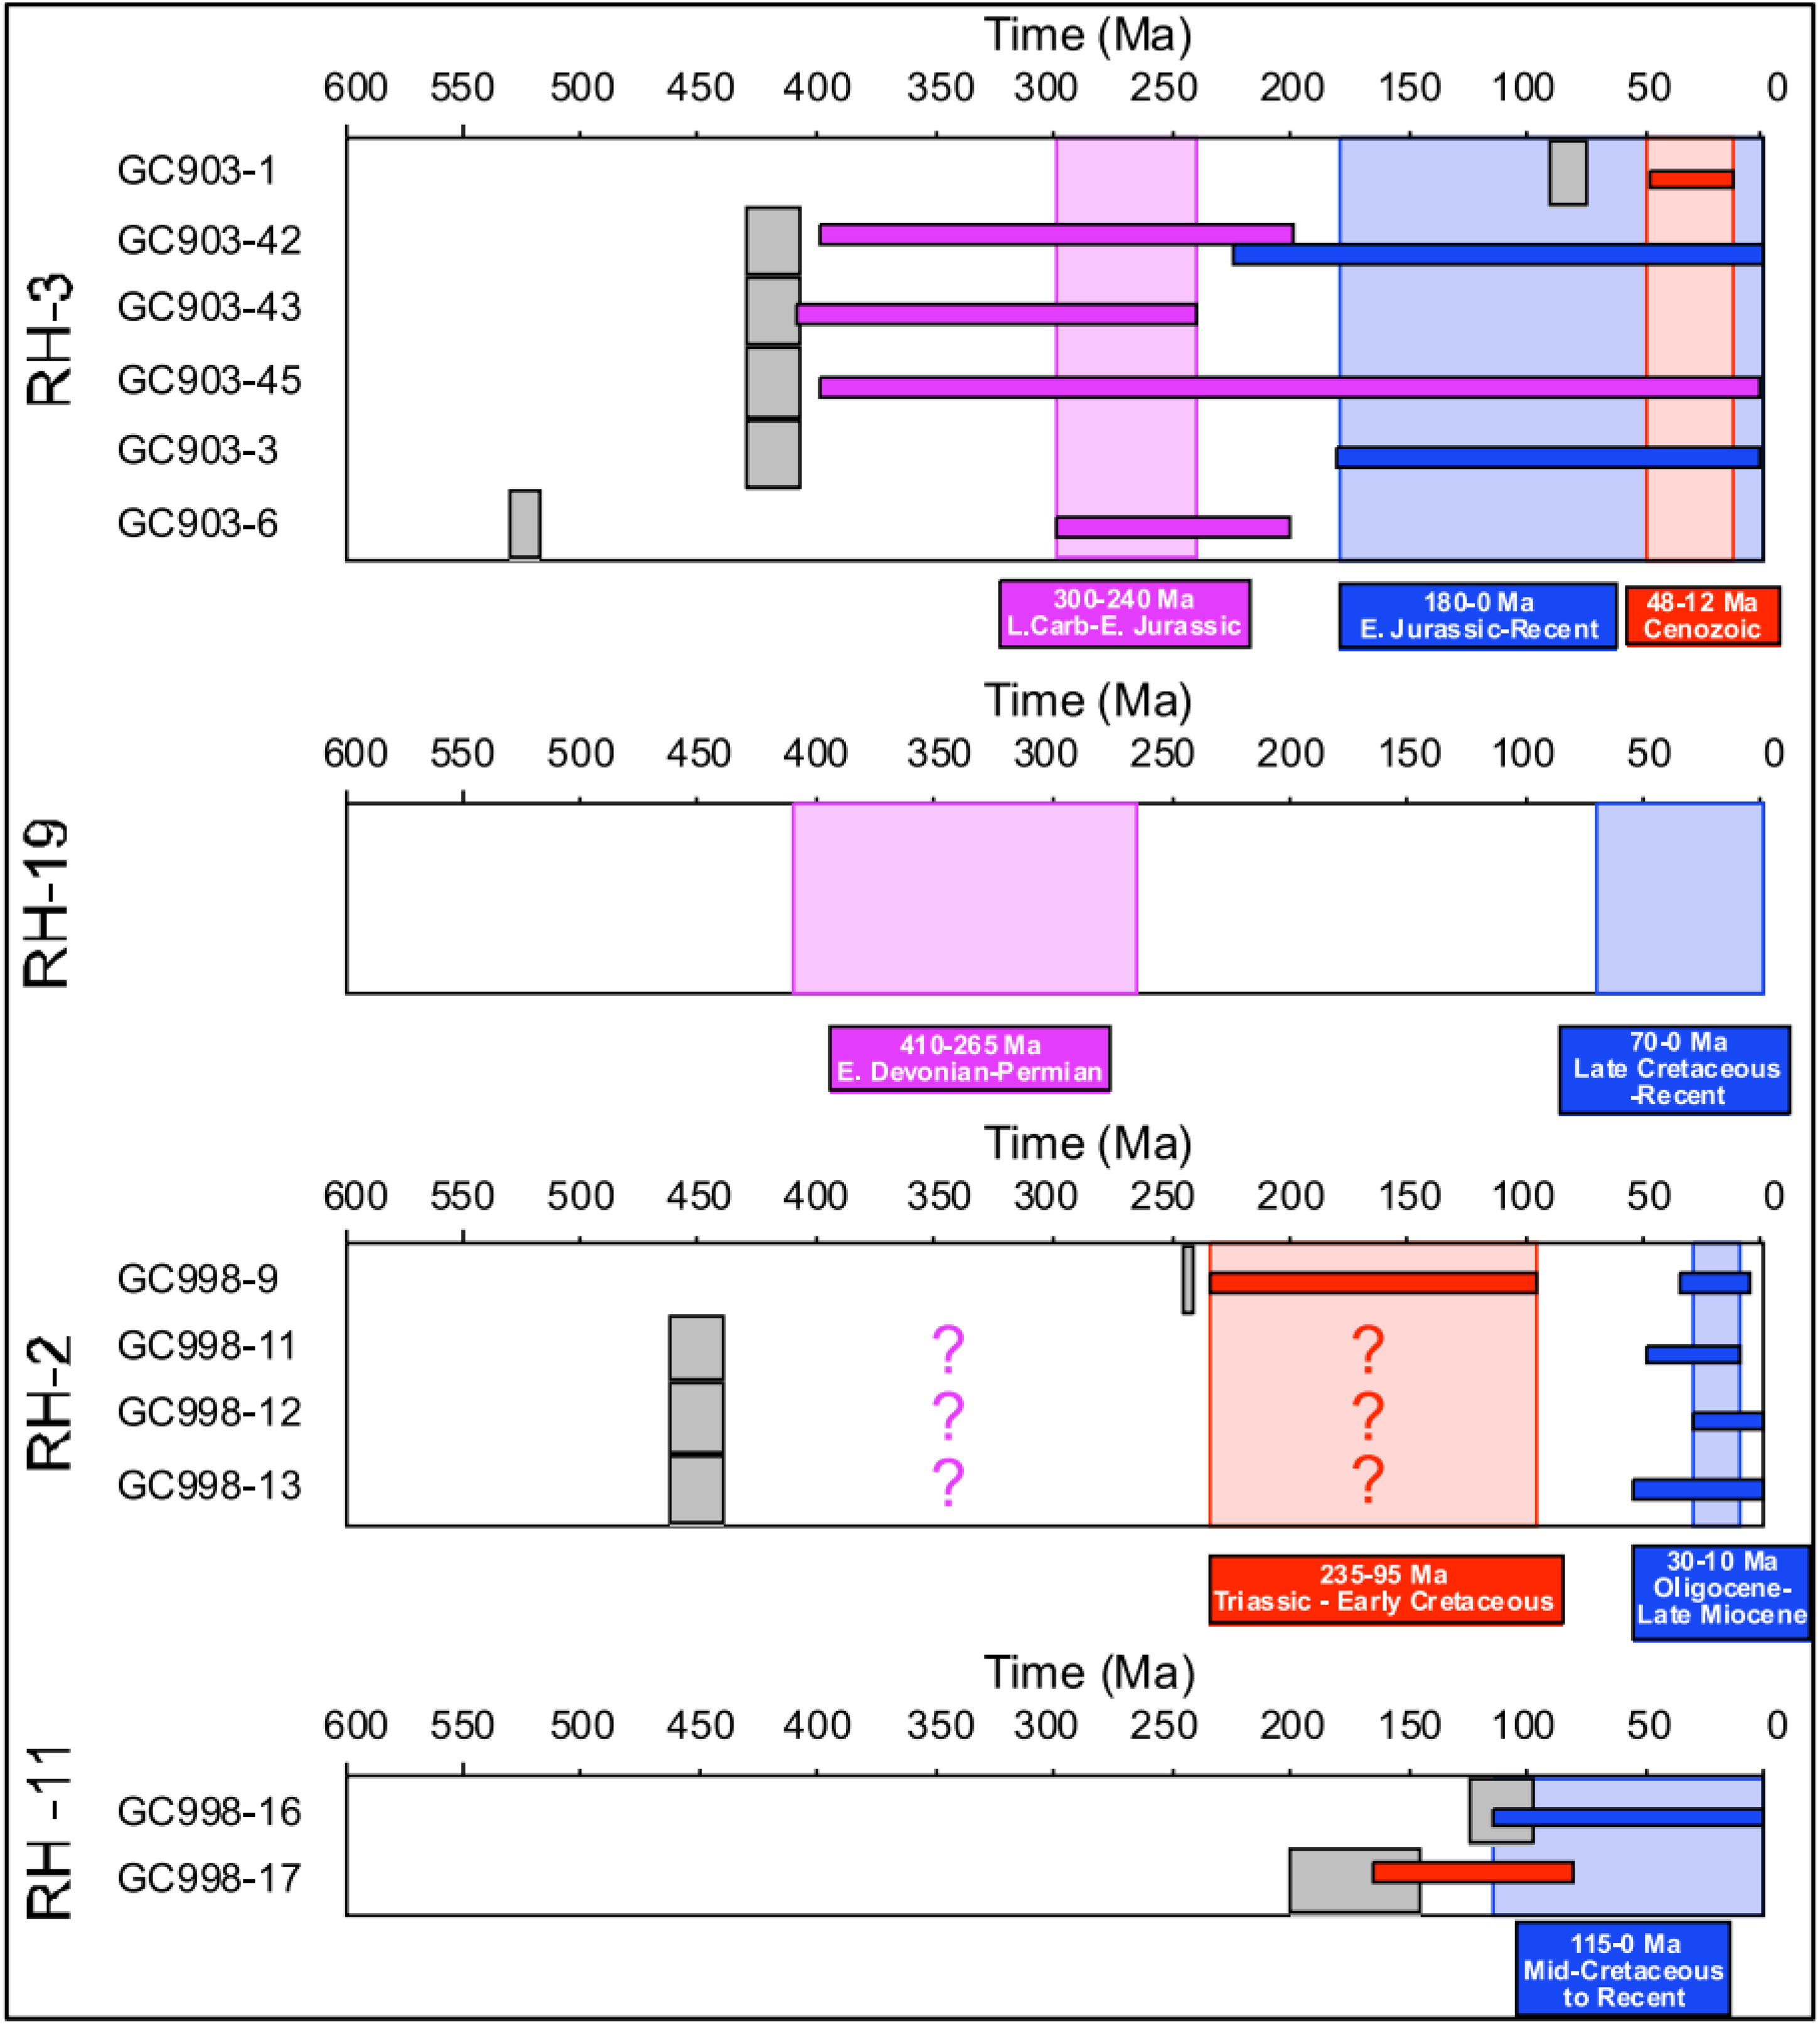
Timing constraints for cooling episodes identified from apatite fission track analysis (AFTA) data in individual samples from the RH-2 and RH-11 wells in this study, compared with similar information from the RH-3 well (Naylor et al., 2013) and estimated timing derived from synthesis of AFTA, ZFTA and maturity data in the RH-19 well (Naylor et al., 2013).
Additional localized heating in the Triassic units, particularly in RH-11, provides evidence for smaller-scale thermal events. These local heating episodes, which likely occurred between 115 and 80 Ma, are consistent with VR and AFTA data from RH-1, RH-2, and RH-11. The presence of multiple local heating episodes suggests that the thermal history of the Risha Gas Field was influenced by a combination of regional tectonic processes and localized geothermal anomalies.
Thermal and burial history reconstructions
The thermal reconstruction for RH-1, RH-2, and RH-11 shows distinct geothermal gradients and burial histories. RH-1 reveals evidence of significant burial followed by exhumation between 300 and 265 Ma, with local heating in the Triassic section. In RH-2, the paleo-geothermal gradient increased significantly around 300 Ma and then cooled during exhumation events between 50 and 15 Ma. RH-11 exhibits a similar trend, though localized heating in the Jurassic and Permian sections suggests more complex geothermal activity during burial.
The erosion time and thickness in Figure 8 were estimated by integrating AFTA, VR, and stratigraphic data (Fernandes et al., 2015). The timing of erosion was inferred from cooling episodes identified in the AFTA data, such as the Late Paleozoic (300–265 Ma) and Oligocene-Miocene (30–10 Ma) events, which correlate with regional tectonic uplift and erosion. The thickness of eroded sections was calculated by comparing the maximum burial depths, derived from thermal history modeling, with the present-day depths of the sedimentary units.
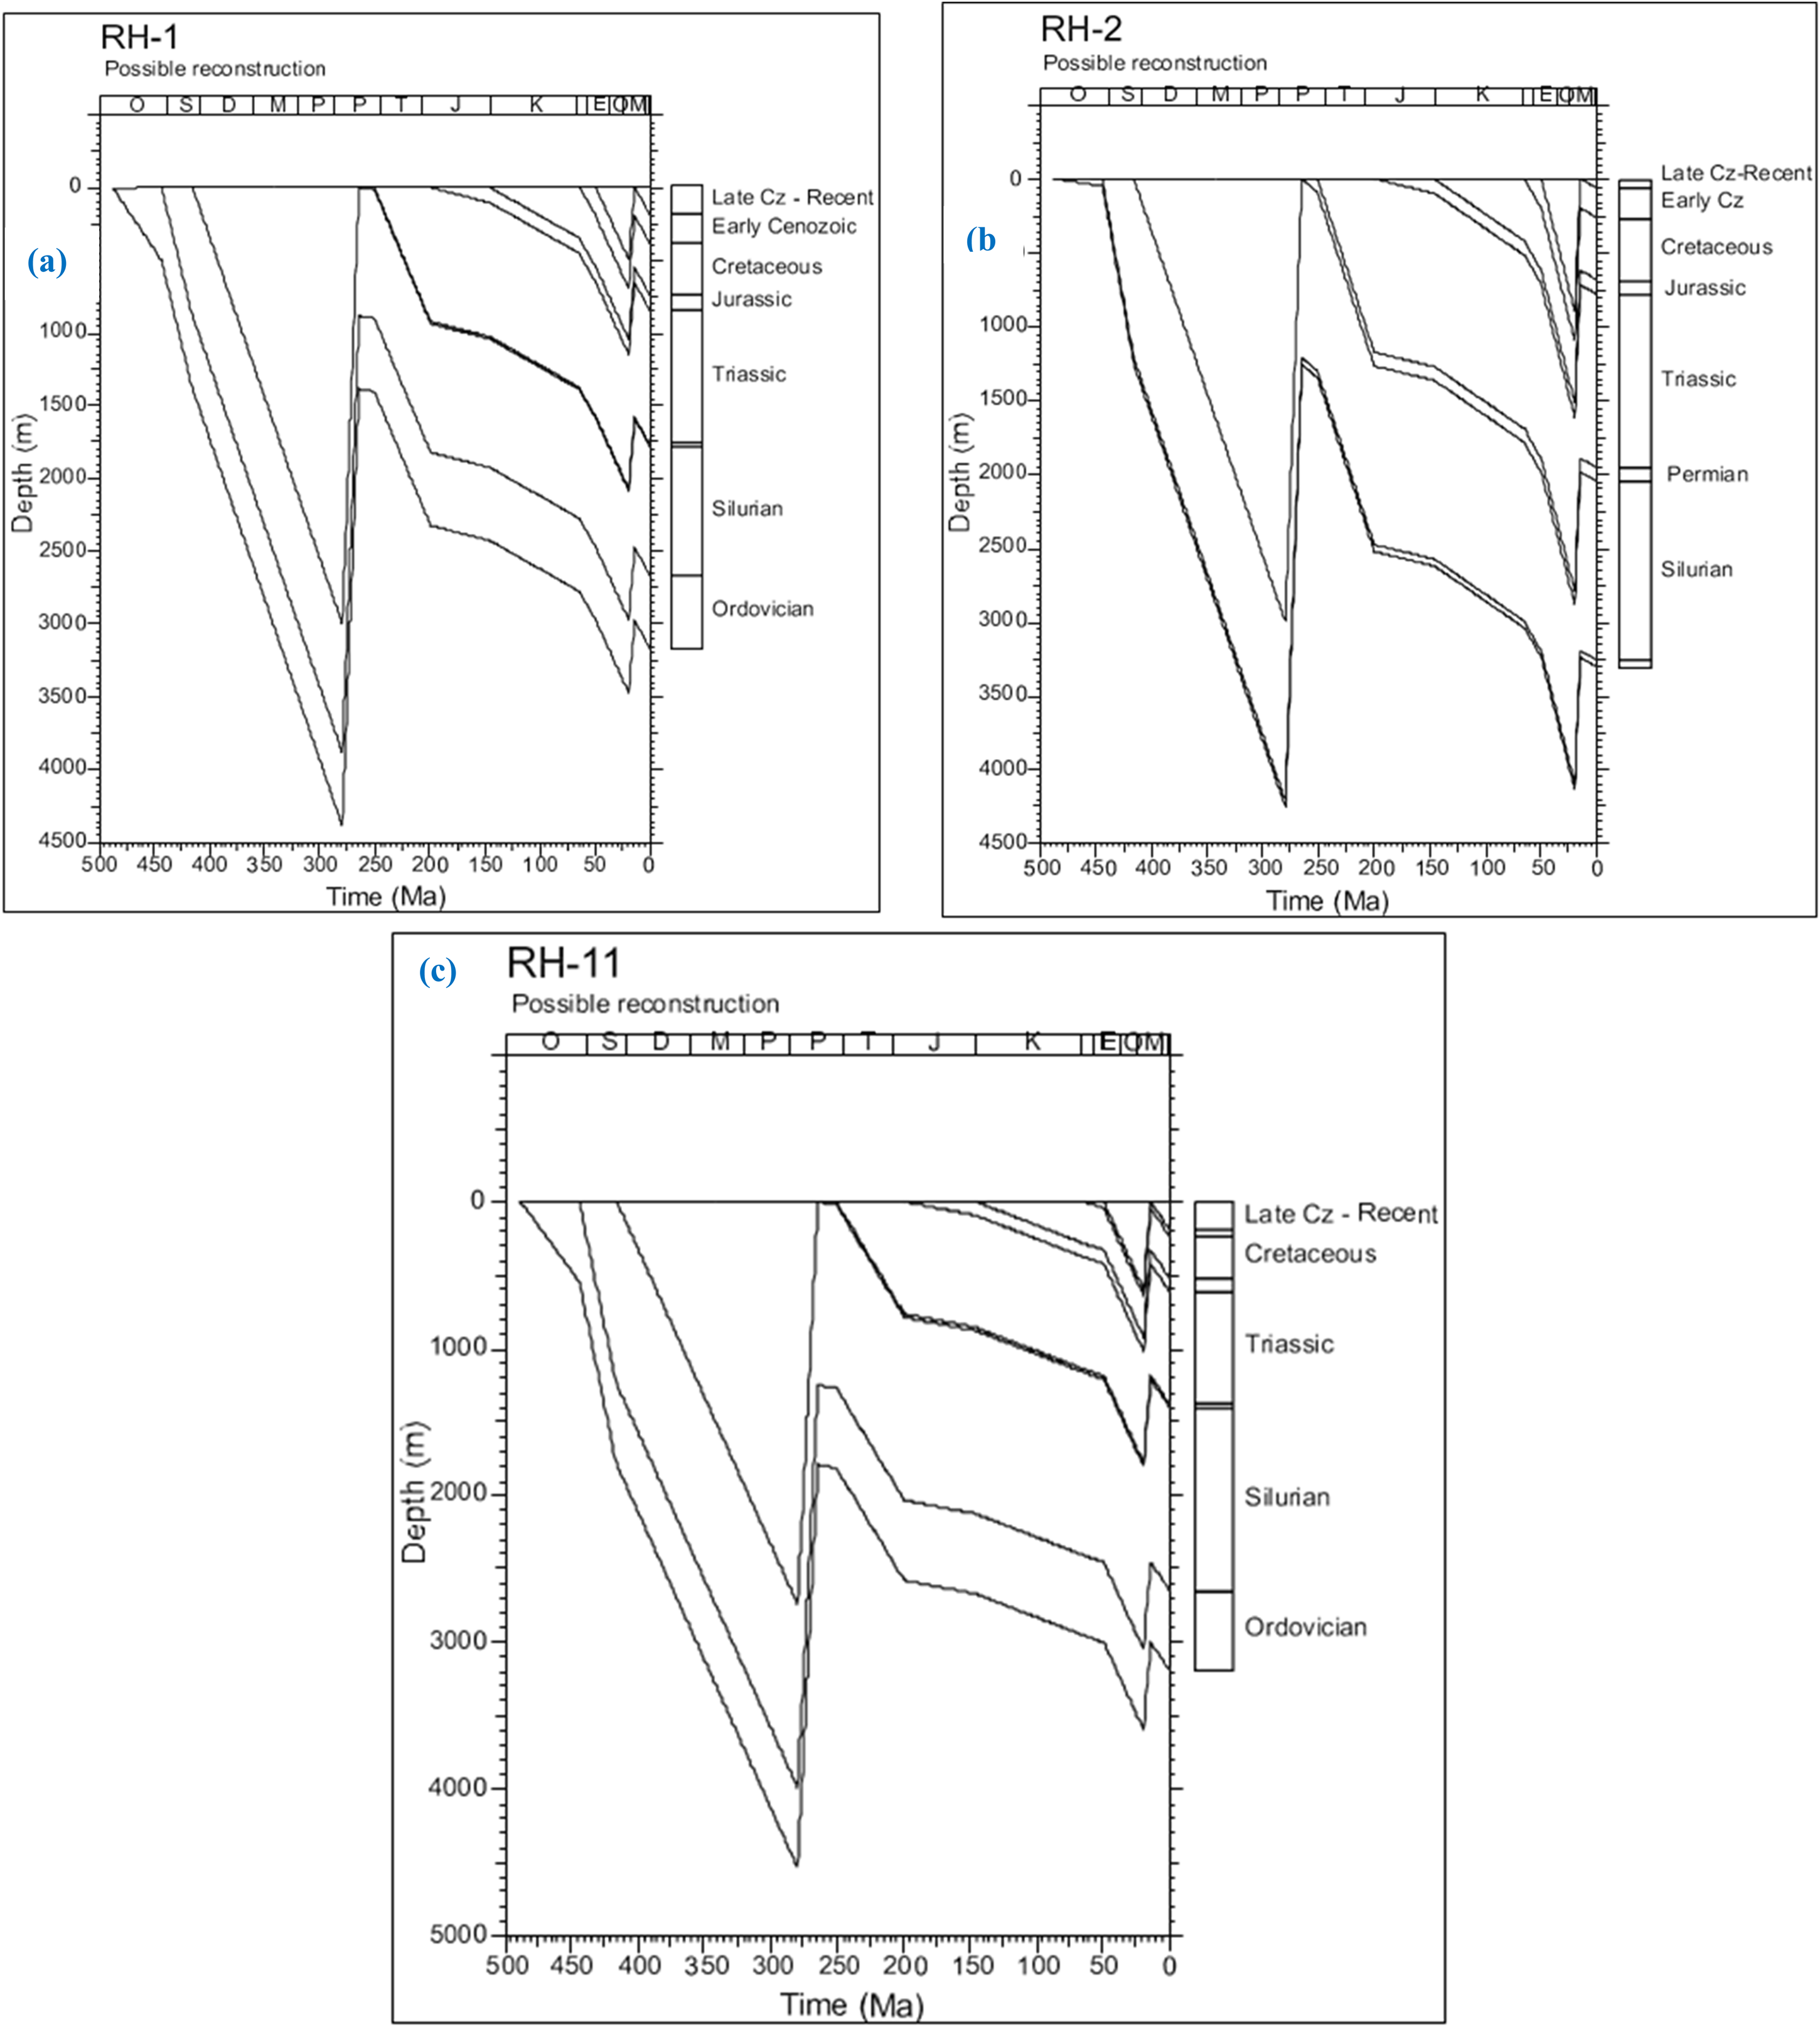
Preferred burial and uplift history reconstructions for wells RH-1 (a), RH-2 (b), and RH-11 (c), Jordan. The figures depict the geological evolution of each well, illustrating burial depths and uplift phases critical to understanding the thermal and hydrocarbon maturation history in the Risha Gas Field. Each well highlights variations in geothermal gradients and tectonic processes, providing insight into the region's structural development.
The thermal and burial history reconstructions for the RH-1, RH-2, and RH-11 wells provide a more detailed view of the geothermal evolution in the region. The thermal and burial histories of RH-1, RH-2, and RH-11 wells show both similarities and differences. All maintained a surface temperature of 20 °C and saw paleogeothermal gradients rise to 45 °C/km by 300 Ma before decreasing by 200 Ma. Significant sedimentation occurred from 416 to 285 Ma (3000 m in RH-1 and RH-2; 2750 m in RH-11), followed by exhumation by 260 Ma and additional burial from 50 to 15 Ma (500–1000 m). Differences include initial gradients (35.5 °C/km in RH-1, 29.8 °C/km in RH-2, and 40.8 °C/km in RH-11) and burial extents. Local heating events, varying by time and section, reflect regional tectonic impacts. In RH-1, the surface temperature remained relatively constant at 20 °C, with a paleogeothermal gradient of 35.5 °C/km before 400 Ma. This increased to 45 °C/km at 300 Ma, followed by a decrease back to 35.5 °C/km by 200 Ma. Burial events involved 3000 m of additional sedimentation between 416 and 285 Ma, followed by exhumation by 260 Ma, with further burial of 500 m from 50 to 15 Ma. Local heating in the Triassic section complicates the thermal history but provides insight into the geothermal evolution during this period (Figure 8(a)).
In the RH-2 well, the paleogeothermal gradient shows a similar trend, with a value of 29.8 °C/km before 400 Ma, increasing to 45 °C/km by 300 Ma. The burial history involves 3000 m of additional sedimentation from 444 to 285 Ma, followed by exhumation by 260 Ma, and 1000 m of further burial from 50 to 15 Ma. Local heating events in the Triassic section suggest that regional tectonic activity influenced geothermal conditions in this well (Figure 8(b)).
The RH-11 well also shows a constant surface temperature of 20 °C, with a paleogeothermal gradient of 40.8 °C/km before 400 Ma, increasing to 45 °C/km by 300 Ma, and decreasing to 40.8 °C/km by 200 Ma. Burial in RH-11 involved 2750 m of sedimentation between 416 and 285 Ma, followed by exhumation by 260 Ma and further burial of 600 m between 50 and 15 Ma. Local heating events are evident in the Jurassic and Permian sections, further complicating the thermal history in this well (Figure 8(c)).
Implications for source rock maturation and hydrocarbon exploration
The maturation and thermal history of the East Safawi Block in Jordan, as revealed by studies of wells RH-1, RH-2, and RH-11, demonstrate a complex interplay of burial, heating, and exhumation events. Organic petrology indicators (VR, chitinozoa reflectance, and palynomorph fluorescence) suggest that the Lower Paleozoic section (Silurian-Ordovician) is post-mature with respect to oil generation, reaching dry gas window conditions (VR∼eq∼: 1.89–2.41%), likely due to deep burial and Late Paleozoic heating (∼300–265 Ma). In contrast, AFTA data indicate lower maturity for the Permo-Triassic sections, attributing discrepancies to localized igneous heating or fluctuating geothermal gradients (NRA, 2004). The Triassic units show variable maturity, with some zones within the oil window (RH-2: VR 0.82–0.93%) and others influenced by thermal anomalies (Collins, 1984). Oligocene-Miocene cooling (30–10 Ma) preserved these maturity states. Key findings include: (1) Paleozoic sections attained peak maturity by the Late Paleozoic, with subsequent exhumation removing ∼3000 m of overburden; (2) Triassic units exhibit conflicting maturity estimates between organic and AFTA methods, highlighting localized thermal overprints; and (3) post-Triassic sections remain largely immature (Naylor et al., 2013).
The integration of AFTA and VRdata provides critical insights into the maturation evolution history of the source rock and its implications for hydrocarbon exploration in the Risha Gas Field. The deeper Paleozoic sections of RH-2, particularly in the Permian and Triassic units, lie within the main gas generation window, as indicated by VR values exceeding 1.3%. In contrast, the Triassic units in RH-11 are within the early mature oil window (VR = 0.5–0.7%), suggesting localized but significant hydrocarbon maturation. The Mesozoic and Cenozoic units remain largely immature across all wells, with little evidence of significant heating in these shallower sections (Table 2). These findings highlight the importance of focusing exploration efforts on the deeper sections of the Risha Gas Field, where the greatest potential for hydrocarbon generation exists (Table S1).
The maturity-depth profiles and maturity evolution for the RH-1 well (Figure 9(a) and (b)), RH-2 well (Figure 9(c) and (d)), and RH-11 well (Figure 9(e) and (f)) provide insights into the hydrocarbon potential of the region. The Paleozoic section is mostly within the main gas generation window, with only shallow levels within the late mature (oil) window. In contrast, the Mesozoic and Cenozoic units are largely immature across all wells. The Triassic units show evidence of being within the early mature (oil) window, with predicted marginal maturity levels that are consistent with palynological assessments, particularly in RH-2 and RH-11.
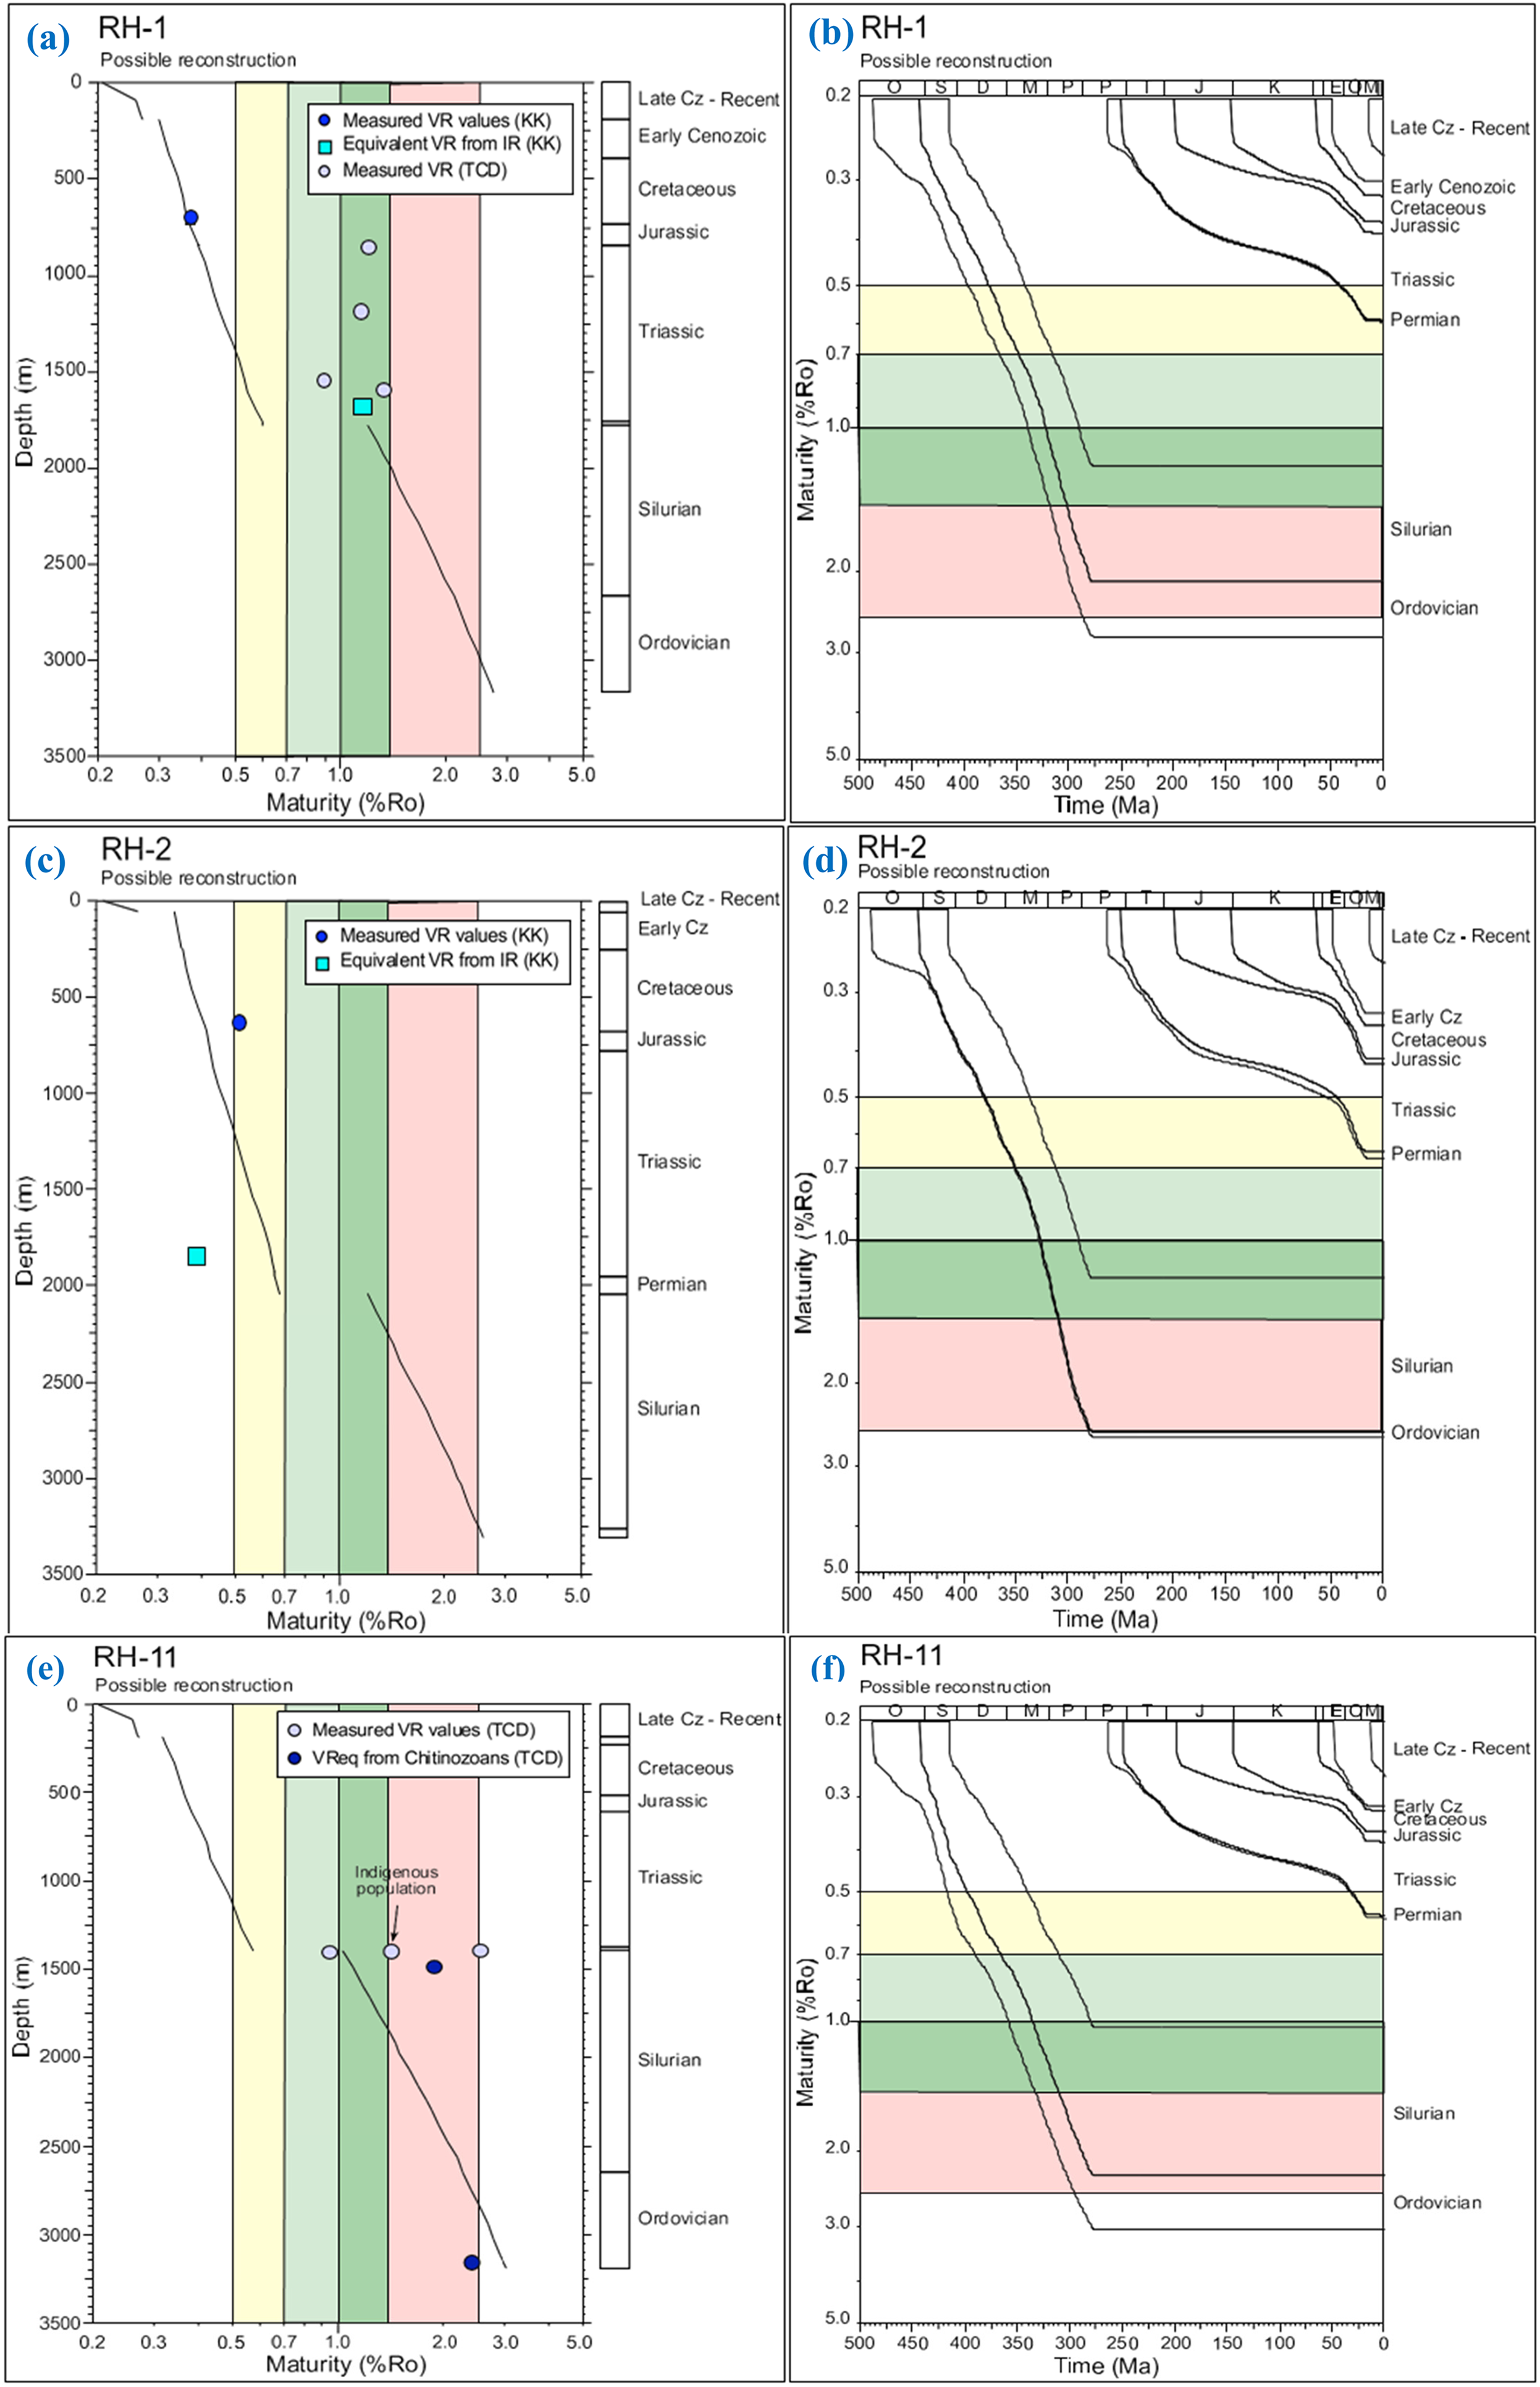
VR data and equivalent vitrinite reflectance (VR) values plotted against depth (left column) and maturation patterns over time for the preserved sedimentary section (right column) in wells RH-1, RH-2, and RH-11, Jordan. The top row represents RH-1 (a-b), the middle row RH-2 (c-d), and the bottom row RH-11 (e-f). Maturity windows include: Yellow (Early Mature-oil, 0.5–0.7%Ro), Light Green (Mid Mature-oil, 0.7–1.0%Ro), Dark Green (Late Mature-oil, 1.0–1.3%Ro), and Light Red (Main Gas Generation, 1.3–2.6%Ro). Mesozoic units remain largely immature, while Paleozoic sections span the Main Gas Generation Window.
These results suggest that while the region holds hydrocarbon potential, particularly in the Paleozoic and Triassic units, further exploration should focus on the deeper sections of the field, where the greatest potential for hydrocarbon generation exists.
The thermal history derived from AFTA and VR data across all wells suggests potential implications for hydrocarbon exploration. The RH-2 well, in particular, shows evidence of significant post-depositional heating, which could have contributed to hydrocarbon generation in the deeper Paleozoic units. The presence of localized heating episodes, particularly in RH-11's Triassic section, suggests the existence of hydrocarbon maturation zones that may not have been fully recognized in earlier exploration efforts (Farouk et al., 2016). Further exploration should focus on identifying these localized heat flow anomalies, which could affect the timing and extent of hydrocarbon generation.
The maturation evolution history of the source rock in the Risha Gas Field was reconstructed by integrating thermal history modeling, burial history, and geothermal gradient evolution. AFTA and VR data revealed that the source rock experienced significant heating during the Paleozoic (416–285 Ma), with geothermal gradients reaching ∼45 °C/km. This period of deep burial and high heat flow caused the source rock to enter the early oil window (VR = 0.5–0.7%) by the end of the Paleozoic. During the Triassic (245–200 Ma), the geothermal gradient decreased to ∼35–40 °C/km, but localized heating events pushed the source rock into the mid oil window (VR = 0.7–1.0%) in some areas, such as the RH-1 well. In the RH-2 well, the source rock reached the late oil window (VR = 1.0–1.3%) during the Triassic and entered the gas window (VR = 1.3–2.6%) during the Oligocene-Miocene (30–10 Ma), driven by further burial and heating. Regional uplift and cooling during the Oligocene-Miocene stabilized the hydrocarbons, preserving them in their traps. This detailed reconstruction of the maturation evolution history provides valuable insights into the timing and extent of hydrocarbon generation in the Risha Gas Field.
Conclusions
The thermal history reconstruction of the Risha Gas Field, based on AFTA and VR data, highlights a complex interplay of regional tectonic activity, localized heating events, and paleothermal episodes. The findings have significant implications for understanding the field's geothermal evolution and hydrocarbon generation potential. There are two cooling episodes, Late Paleozoic cooling (300–265 Ma): Characterized by a high paleogeothermal gradient due to deep burial and increased basal heat flow, followed by exhumation and cooling. This episode occurs consistently across wells, with VR and AFTA data supporting significant hydrocarbon maturation in the Paleozoic units. Oligocene-Miocene cooling (30–10 Ma): Associated with regional tectonic uplift, burial, and subsequent exhumation, this event introduced secondary cooling effects, with evidence seen particularly in RH-2 and supported by AFTA data from RH-1 and RH-11. Triassic and Jurassic units in RH-11 and RH-2 show localized heating events (245–200 Ma), contributing to hydrocarbon maturation zones. The field experienced significant burial (up to 3000 m in RH-1 and RH-2) during the Paleozoic, followed by exhumation around 260 Ma and secondary burial from 50 to 15 Ma. Geothermal gradients peaked at 45 °C/km by 300 Ma, declining steadily after the Paleozoic cooling episode. The deeper Paleozoic and Triassic units are within the gas generation and early oil maturity windows, with Mesozoic and Cenozoic units remaining largely immature. Future efforts should target deeper, thermally mature sections and investigate localized thermal anomalies for enhanced hydrocarbon discovery.
Supplemental Material
sj-docx-1-eea-10.1177_01445987251341917 - Supplemental material for Paleothermal field reconstruction and its implications for hydrocarbon exploration in the Risha Gas Field (Jordan)
Supplemental material, sj-docx-1-eea-10.1177_01445987251341917 for Paleothermal field reconstruction and its implications for hydrocarbon exploration in the Risha Gas Field (Jordan) by Sherif Farouk, Mahmoud Hefny, Abdelrahman Qteishat, Fayez Ahmad, Mohamed Arafat, Khaled Al-Kahtany, Lei Jiang, Luigi Jovane and Amr S Zaky in Energy Exploration & Exploitation
Supplemental Material
sj-docx-2-eea-10.1177_01445987251341917 - Supplemental material for Paleothermal field reconstruction and its implications for hydrocarbon exploration in the Risha Gas Field (Jordan)
Supplemental material, sj-docx-2-eea-10.1177_01445987251341917 for Paleothermal field reconstruction and its implications for hydrocarbon exploration in the Risha Gas Field (Jordan) by Sherif Farouk, Mahmoud Hefny, Abdelrahman Qteishat, Fayez Ahmad, Mohamed Arafat, Khaled Al-Kahtany, Lei Jiang, Luigi Jovane and Amr S Zaky in Energy Exploration & Exploitation
Footnotes
Acknowledgments
The authors extend their gratitude to the two anonymous reviewers for their valuable feedback and constructive suggestions, which significantly enhanced the quality of this paper. Additionally, Khaled Al-Kahtany acknowledges the support provided by the Research Support Project (RSP-2025R139) at King Saud University, Riyadh, Saudi Arabia.
Funding
The authors disclosed receipt of the following financial support for the research, authorship, and/or publication of this article: Luigi Jovane and CORE lab are supported by Fundação de Amparo à Pesquisa do Estado de São Paulo (FAPESP) project 2016/24946-9. Amr S. Zaky is also supported by FAPESP grant number 2022/08285-3. Lei Jiang is support by the Strategic Priority Research Program of the Chinese Academy of Sciences (grant no. XDA0430202).
Declaration of conflicting interests
The authors declared no potential conflicts of interest with respect to the research, authorship, and/or publication of this article.
Data availability statement
Data supporting this paper are available based on request.
Supplemental material
Supplemental material for this article is available online.
References
Supplementary Material
Please find the following supplemental material available below.
For Open Access articles published under a Creative Commons License, all supplemental material carries the same license as the article it is associated with.
For non-Open Access articles published, all supplemental material carries a non-exclusive license, and permission requests for re-use of supplemental material or any part of supplemental material shall be sent directly to the copyright owner as specified in the copyright notice associated with the article.