
Abstract
The rock mass damage and failure induced by underground coal resource exploitation are strongly influenced by the confining pressure unloading (CPU) rate. However, the impact of CPU rate as a sole variable remains inadequately understood. This study utilizes discrete element numerical tests to explore the influence of CPU rate on the mesoscopic fracturing mechanism of sandstone. Homogeneous three-dimensional models with consistent mesoscopic parameters and constant axial pressure are subjected to varying CPU rates. By isolating the CPU rate as the sole variable, macroscopic failure patterns, mesoscopic damage evolution, and energy density distributions are investigated. The numerical results are validated against existing physical experimental results, confirming the rationality of the discrete element model parameters. The results show that lower CPU rates induce multistage, sudden, and progressive failure, characterized by stepwise increases in energy density, more abrupt fractures, and enhanced mobilization of local load-bearing capacity. The defined medium CPU rate results in distinct physical responses, attributed to particle rearrangement driven by unloading rate. Particle displacement is identified as a quantitative indicator of rock damage. The results underscore the importance of isolating the CPU rate effect to improve the understanding of rock fracturing mechanisms and associated physical properties.
Keywords
Introduction
Dynamic disasters in underground coal mines are closely related to the confining pressure unloading (CPU) rate (Wu et al., 2017; Zeng et al., 2023). In high ground stress environments, adjusting the unloading rate can effectively mitigate the occurrence of dynamic disasters (Ha, 1998; Huang, 2008). The unloading rate significantly affects the physical properties of rocks, including strength, deformation, and failure modes (Li et al., 2015; Xu et al., 2019).
Early studies in the 1970s using conventional triaxial testing apparatus suggested that stress paths had minimal influence on rock strength (Crouch, 1972; Swanson and Brown, 1971). However, advancements in experimental techniques revealed a strong dependence of rock strength, strain, and failure modes on stress paths. Subsequent research demonstrated that unloading conditions generally result in more severe damage than loading conditions, with pronounced dilatancy along the confining pressure direction (Chen et al., 1979; Xu and Geng, 1986). Jointed rocks under unloading often exhibit sudden instability and failure due to heterogeneous fracture propagation (Ling and Liu, 1998),
Further investigations have examined the relationship between unloading rates and damage variables. Huang and Huang (2010) identified a threshold for damage variables under specific unloading conditions, indicating that unloading-induced failure is primarily driven by lateral tensile forces and dilatancy. Qiu et al. (2010) explored the mechanical behavior of deep-buried marble under varying unloading rates and found that certain rates can induce significant deformation under constant axial pressure, attributable to changes in cohesion and frictional strength. Energy conversion mechanisms have also been studied, with acoustic emission (AE) monitoring revealing that unloading rates significantly influence rock bursts, AE energy release, fracture patterns, and strain energy storage (Hua and You, 2001; Li et al., 2017).
Despite these advancements, the effect of unloading stress paths on rock strength remains debated. While Chen and Dai (1982), as well as Wu and Li (1984), suggested that unloading paths primarily affect deformation rather than strength. Researchers (Qiu et al., 2014; Wu, 1997; Wu and Sun, 1998) showed that that rock strength increases with higher unloading rates. These discrepancies are partly due to the inherent heterogeneity of natural rock specimens, underscoring the need for further studies under controlled conditions to fully elucidate the relationships.
The fracturing behavior under complex unloading stress paths has also attracted significant attention. Si et al. (2022) compared excavation unloading processes under natural stress with predrilled specimen modes, finding that the latter exhibited greater strength enhancement. Wang et al. (2020) examined how accumulated fatigue damage influences final fracturing behavior in marble specimens but noted that stress path changes during multistage loading compounded the results. Numerical studies have provided additional insights. Yang and Zhang (2020) analyzed fracturing processes in prefabricated fracture specimens under sudden unloading, while Liu and Deng (2019) examined fracture propagation using numerical models, highlighting the importance of loading and unloading rates. However, research on 3D cylindrical specimens under constant axial pressure and varying unloading rates remains limited, leaving mesomechanisms of unloading-induced damage and failure underexplored.
This study isolates CPU rate as a single variable, eliminating the influence of specimen heterogeneity, which is challenging to achieve in physical experiments. The findings reveal that particle rearrangement governs variations in mechanical responses and physical properties under different unloading rates. Additionally, particle displacement is identified as a metric for quantifying rock damage. The results provide new insights into the mechanisms of rock damage and fracture under unloading conditions, advancing the understanding of the strength and deformation characteristics.
Material and method
Modeling and calibration
Modeling method
The discrete element model is a computational approach that simulates a continuum medium using discrete particles, effectively capturing the inherent discontinuities of rock materials. The Particle Flow Code is used to construct numerical models capable of simulating the fundamental mechanical behaviors of rocks and rock-like materials (Potyondy and Cundall, 2004; Scholtes and Donze, 2012).
Contact model selection
In this study, PF3D 5.0 modeling software is used, employing the linear parallel bond model to simulate contact interactions. This model is chosen for its ability to capture both tensile and shear failures. It establishes elastic interactions between particles via parallel bonds, which permit slip while enabling the transmission of both force and moment across the contacting particles (ltasca Consulting Group Inc, 2019). Below are the control equations and failure criteria for the contact model:
Control equations
The parallel bond model includes two types of forces and moments at contact points: Normal and shear forces, bending and torsional moments. The governing equations are as follows:
Normal force Shear force Moments


where Mb is bending moment, Mt torsional moment, kb and kt are rotational stiffness in bending and torsion, respectively. Δθb and Δθt are rotational displacements in bending and torsion, respectively.
Failure criteria
Tensile failure criterion

Shear failure criterion

where τs is shear stress and τmax is maximum shear strength of the bond.
Specimen properties and parameter calibration
The study area is located in Liuzhuang Coal Mine, Yingshang County, Fuyang City, Anhui Province. The rock mechanics parameters used for calibration are sourced from existing studies (Liu et al., 2016; Zhao, 2015), where the coal mine is situated in a neighboring region of the same coalfield as the study area of this research. The physical and mechanical properties of the rocks in both areas are comparable.
The dimensions of the numerical model are a cylinder with a diameter of 5 cm and a height of 10 cm. The model utilizes commonly used spherical particles, with a minimum diameter of 1.5 mm and a maximum diameter of 4 mm, resulting in a total of 13,788 particles. To adequately capture the mesostructure of the specimen, the maximum particle size is limited to less than 10% of the model's dimensions (Kong et al., 2022; Yin et al., 2011). A scaling ratio of 10−2 is applied, consistent with prior studies demonstrating its suitability for such specimens (Bazant and Chen, 1997; Tang et al., 2000; Yang et al., 2005). The model particles in the specimen follow a log-normal distribution, which enables a more realistic simulation of the behavior of real rocks.
The parameter calibration process involves repeatedly adjusting the parameters of the contact model's linear and parallel bond components. Key parameters for the linear component include effective modulus, stiffness ratio, and friction coefficient, while for the parallel bond component, the primary parameters include bond effective modulus, bond stiffness ratio, tensile strength, cohesion, and friction angle. The strength characteristics and failure modes of the numerical specimen are compared with available data (Zhao, 2015), and this iterative process continues until the model parameters are reasonably calibrated. The calibration of numerical parameters is typically achieved by comparing the macroscopic mechanical properties and failure modes of numerical specimens with physical experimental results. Compression, tensile, or other tests are conducted to refine numerical parameters to align with experimental conditions. However, parameters derived from one test type cannot be directly applied to others due to interdependencies among testing methods, a key distinction between numerical and physical experiments. For real rocks, mechanical parameters are determined through a series of physical tests under varying boundary conditions to reduce specimen heterogeneity, such as by comparing failure modes at different CPU rates. In contrast, numerical simulations eliminate the heterogeneity by assigning identical random numbers to all specimens, ensuring consistent material properties across models. Thus, numerical specimens are assigned fixed parameters for all numerical tests, differing from the various testing results of physical experiments.
Model calibration was performed using a triaxial compression test under an initial confining pressure of 10 MPa, reflecting the in situ conditions at Liuzhuang Mine. A comparison of numerical and physical specimens (Figure 1) demonstrates sound agreement in failure curves, with both exhibiting brittle tensile and shear failure modes (Zhao, 2015). The validity of the numerical parameters is further corroborated in the Results comparison with physical experiments section through comparisons with existing physical experimental results. The mesoscopic parameters are listed in Table 1.
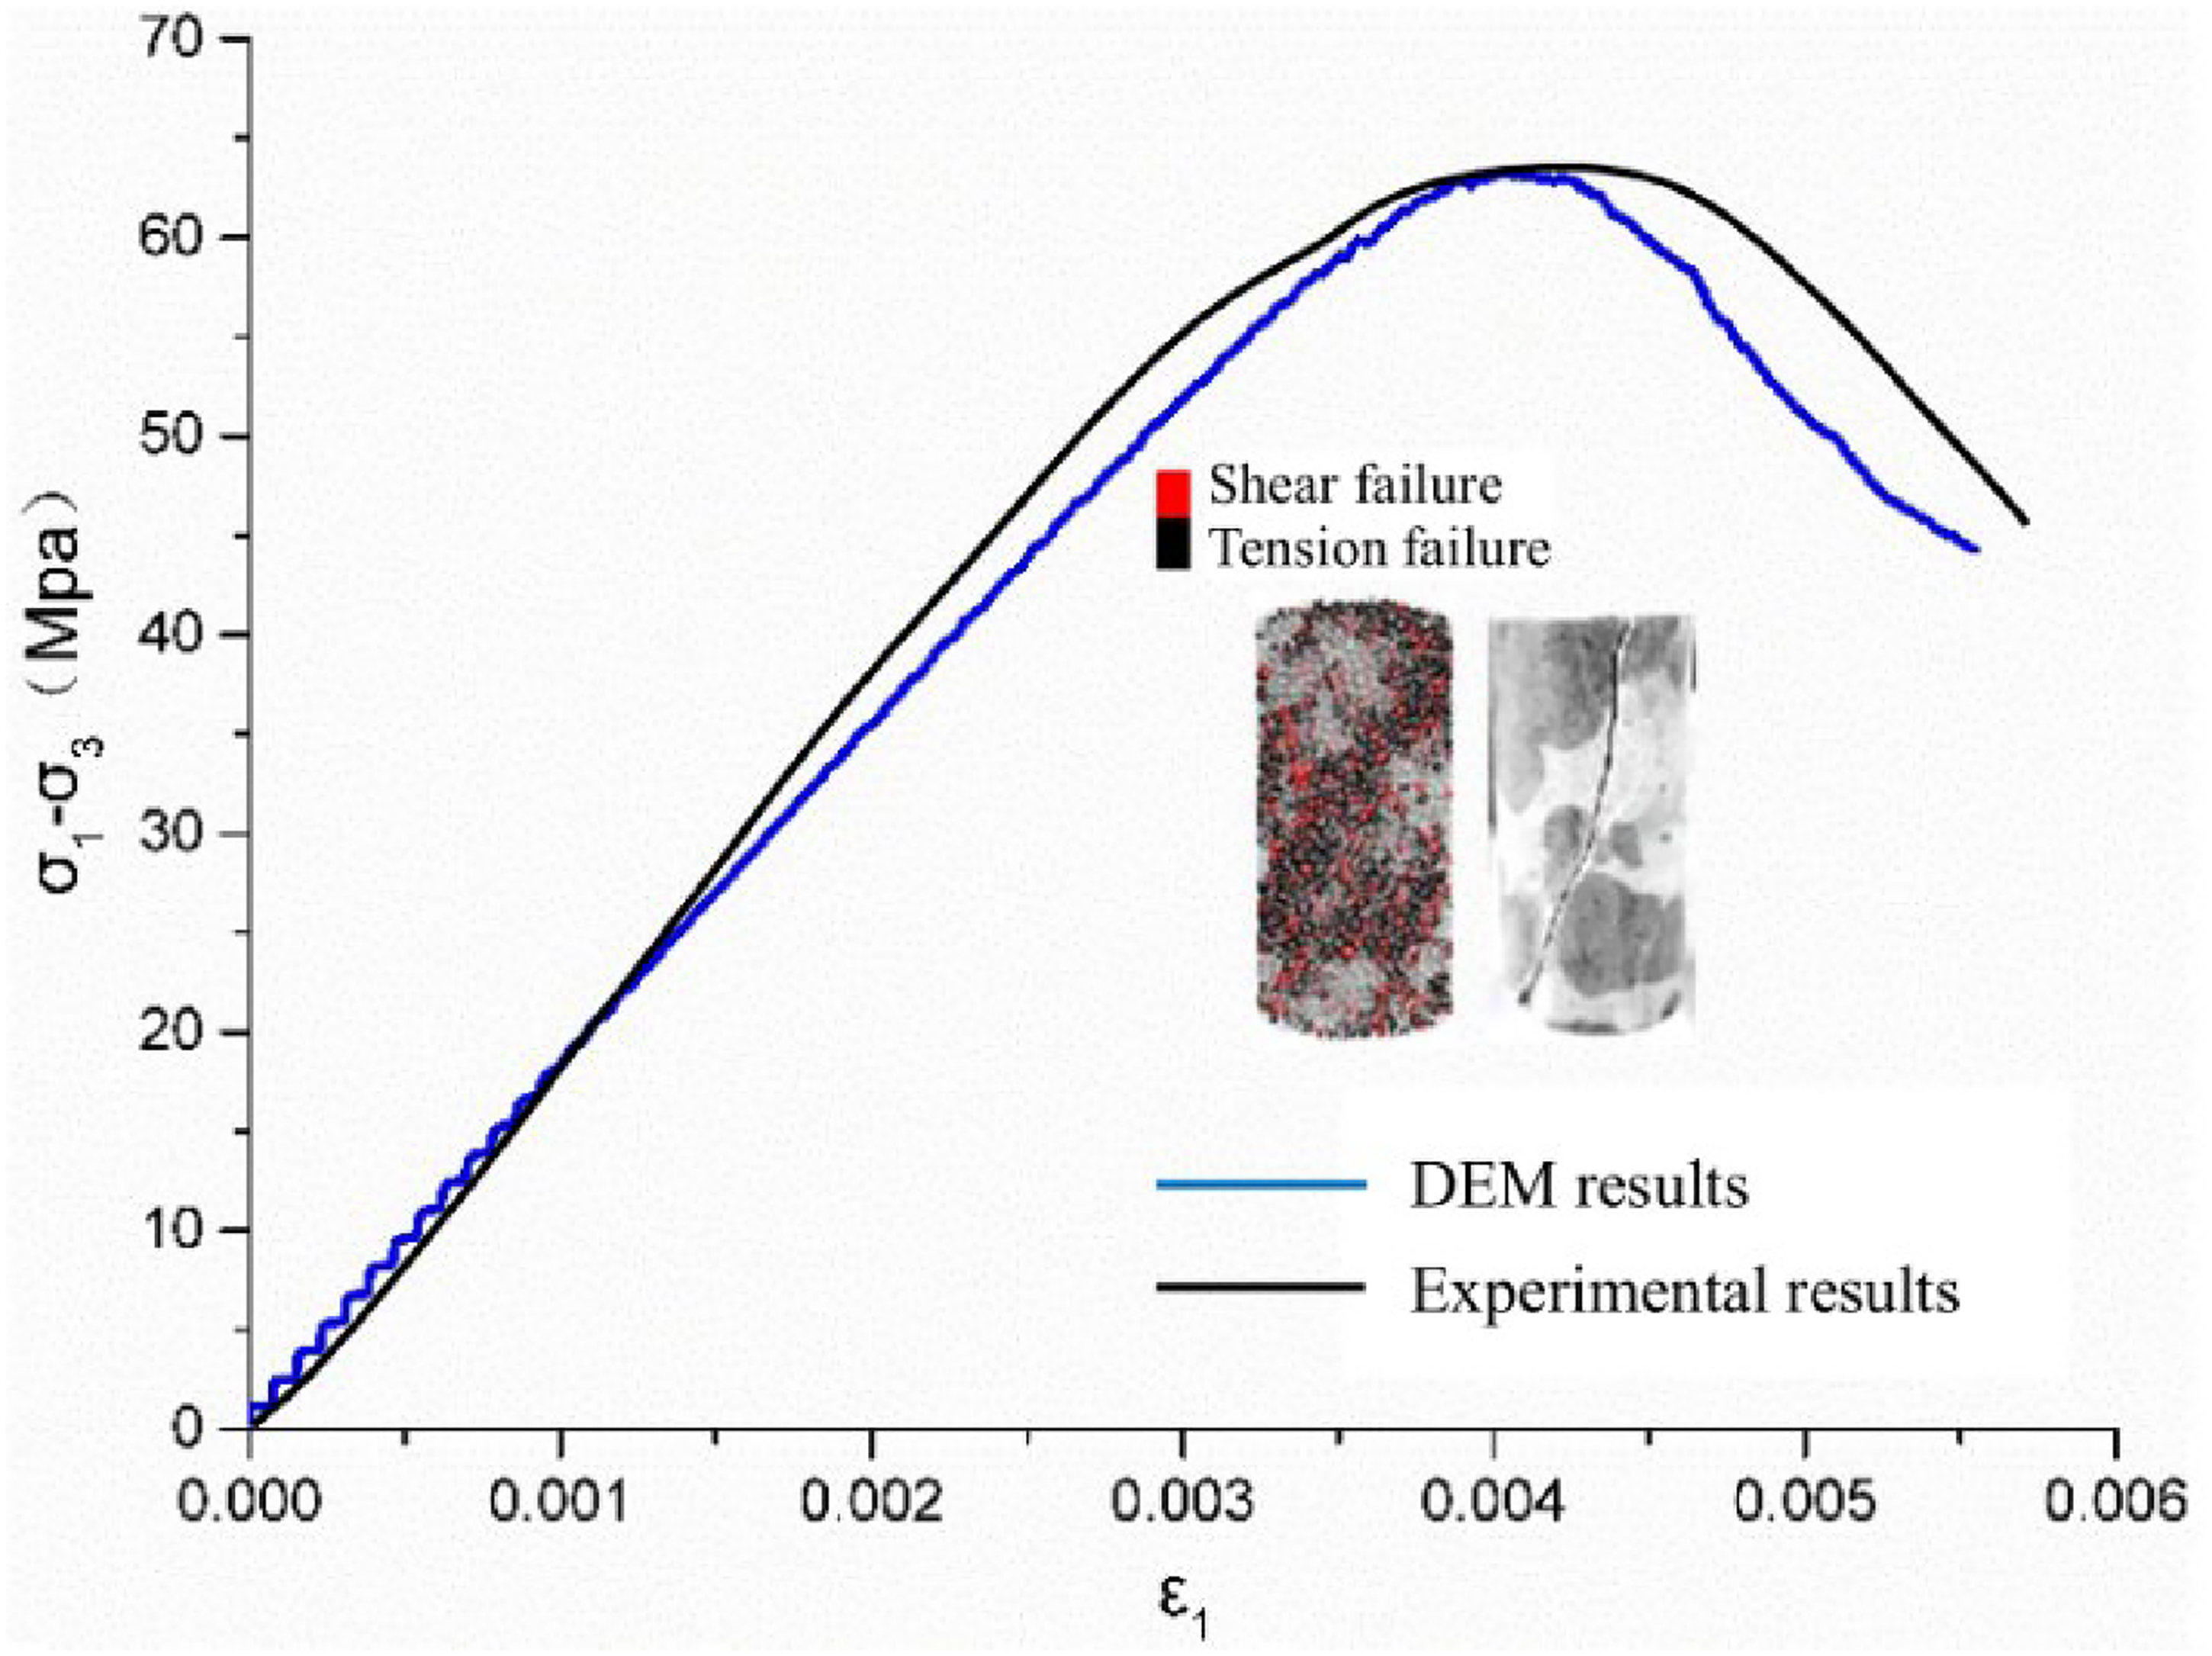
Test results comparison of numerical and actual specimens. DEM: discrete element model.
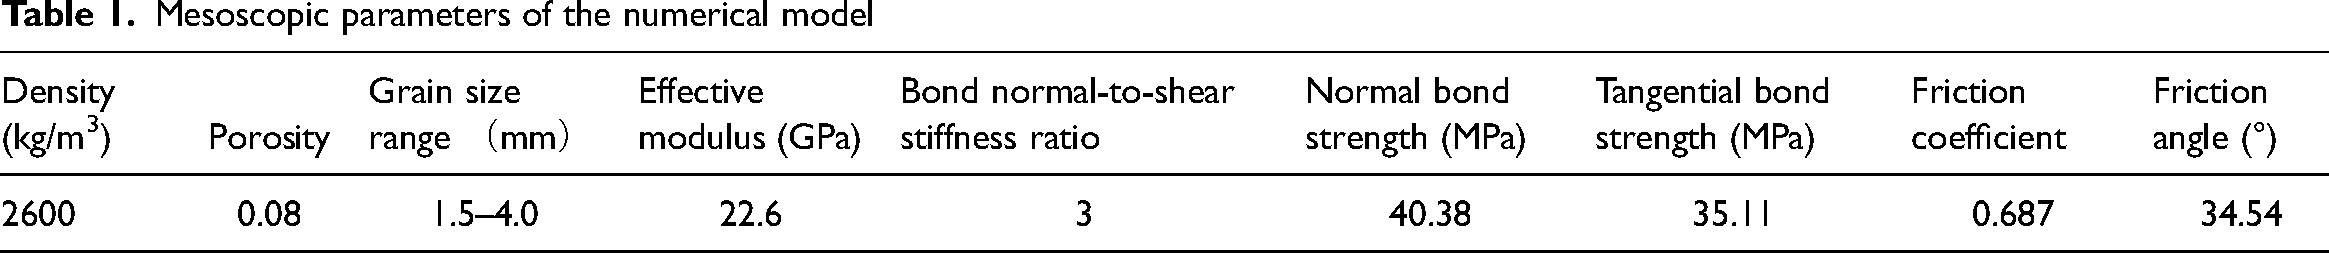
Mesoscopic parameters of the numerical model
To isolate the effect of the CPU rate and eliminate specimen heterogeneity, numerical specimens are modeled as homogeneous with identical mesoscopic parameters. This ensures that the CPU rate is the only variable influencing the results. Unlike physical experiments, where inherent heterogeneity in natural rocks is unavoidable, numerical simulations allow for precise control over boundary conditions and result reproducibility.
Numerical experiment setup
Initial confining pressure
The initial confining pressure is set at 10 MPa, corresponding to the current ground stress conditions of Liuzhuang Coal Mine.
Numerical CPU rates
Due to the absence of established reference values, substantial computational resources were required to determine appropriate numerical CPU rates. Several factors were considered when setting the rates.
Calculation time cost
Existing physical tests typically set CPU rates at lower magnitudes, ranging from 0.01 MPa/s to 1 MPa/s (Huang and Huang, 2010; Qiu et al., 2010). However, these rates differ from those encountered in deep engineering applications, where test equipment limitations prevent direct replication of field CPU rates.
In numerical simulations, the time step represents the discretization of time, with each step advancing the system's state based on physical laws and computational methods. While smaller time steps increase accuracy and stability, they also raise computational costs. For instance, when the time step is set at 10−7, a total of 107 steps corresponds to unit physical time. Assuming that the physical experiment unloading rate is in the range of 0.01–1 MPa/s and setting the numerical time step to 10−7, the corresponding rate in the numerical experiment, based on the relationship between the time step and unit real time, would be between 0.001 and 0.1 Pa/step. Such a rate is impossible to achieve in numerical simulations, as the total number of computational steps would exceed the software's capacity, leading to potential system crashes and prohibitive computational costs. Therefore, the rate in the numerical experiment is higher than that in the physical experiment. Although neither the physical nor the numerical experiment rates correspond exactly to the real rate, both can provide valuable data to support an understanding of the underlying mechanisms.
Trial calculations
Assuming that the excavation of rock blocks within 0.1 s at a confining pressure of 9.5 MPa is interpreted as a CPU rate of 95 MPa/s, the numerical time step is set to 10−7 for high accuracy, and using the relationship between unit physical time and numerical time step, a CPU rate of 95 MPa/s corresponds to 9.5 Pa/step. The highest unloading rate, 95 Pa/step, is then set to 10 times the initial rate. Following this, four different rates were chosen for trial calculations: 95 Pa/step, 66.5 Pa/step, 28.5 Pa/step, and 9.5 Pa/step.
Although the numerical CPU rates setting approximate physical rates, results show no significant difference across the four rates. To refine the outcomes, four additional rate magnitude orders (101, 102, 103, and 104) were tested, resulting in 16 groups of simulations. The result of each group under a same magnitude order indicated that the variation in numerical CPU rates was not reflected in the outcomes. If rates beyond this range are chosen, the calculations approach instantaneous results with negligible differences. This highlights the importance of selecting an appropriate range of numerical CPU rates for calculations. Setting rates too high may obscure the results and diverge from the research objectives.
The unloading rate in physical experiments spans several magnitude orders, and comparisons between numerical unloading rates at different orders show varying strength and fracture characteristics consistent with the physical results. Although a mathematical relationship between physical and numerical CPU rates can be established using unit physical time and time steps, the correlation between numerical CPU rates and the real unloading rate requires further investigation. Currently, there is no established quantitative relationship between the physical unloading rate and the on-site excavation unloading rate. However, this does not affect the objectives of the study. Based on the trial calculations, four numerical CPU rates were selected for comparison: 75,000 Pa/step (high), 7500 Pa/step (medium-high), 750 Pa/step (medium), and 68 Pa/step (low). Although the four rates defined cannot be directly compared to those used in physical experiments, their comparison effectively captures the phenomena observed in existing physical experiments. The four rates are intended to represent relative magnitudes, and the validity of the results can be further corroborated by the existing physical experimental results presented in the Results comparison with physical experiments section.
Numerical experiment procedure
Figure 2 illustrates the initial damage of the specimen after loading to the initial confining and axial pressures, as well as the loading stress path. To minimize excessive damage during the initial loading phase, the axial pressure is set to 80% of the peak axial pressure obtained from a triaxial test under 10 MPa confining pressure, specifically 58.62 MPa. The confining pressure is then gradually unloaded until failure, while the axial pressure remains constant throughout the test. This constant axial pressure ensures that the effect of the CPU rate on the specimen's deformation and failure is accurately captured. Fluctuations in axial pressure could distort the results.
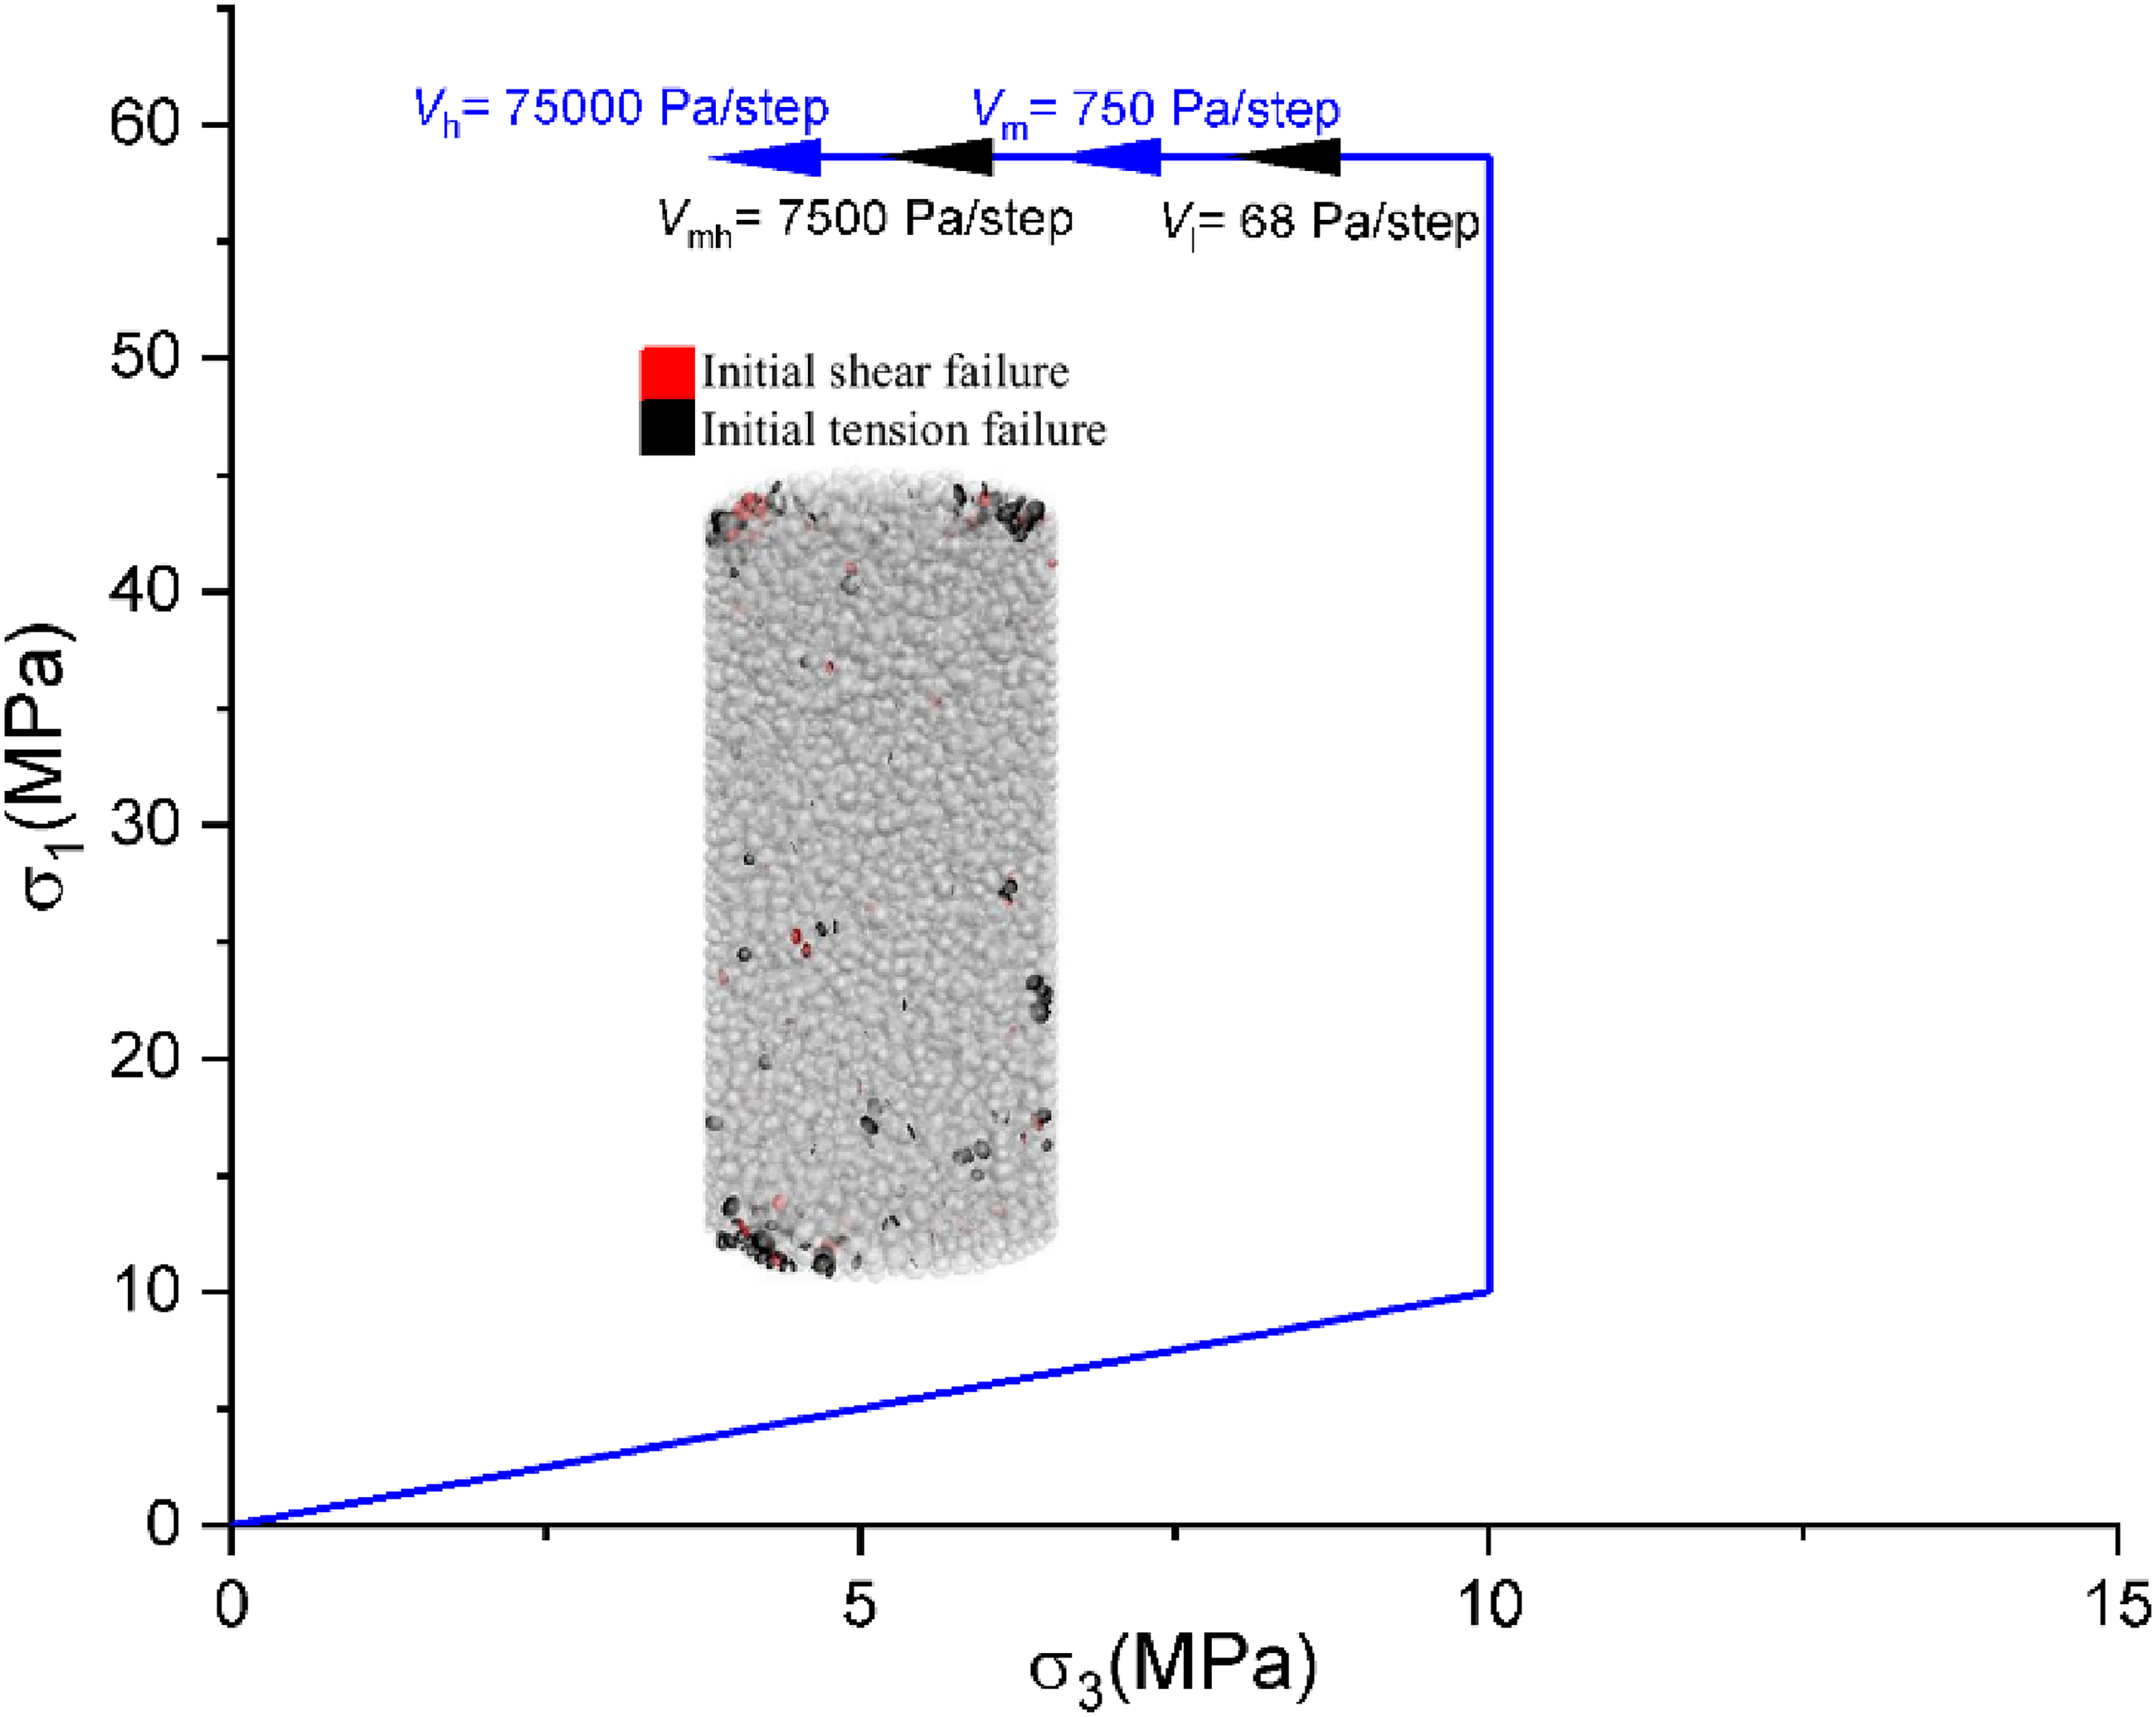
Stress path of confining pressure unloading test.
Results analysis
Macroscopic failure characteristics
The model particles are set to 90% transparency to facilitate the observation of bond failure distribution within the specimen. As shown in Figure 3, from left to right, each column displays the top, side, and bottom surfaces. The side surface is shown from four different viewing angles, with each subsequent angle obtained by rotating the previous angle 90° clockwise along the specimen's axial direction. Each view angle retains the right half of the previous angle, and after a 90° rotation, the fourth view angle corresponds to the first.
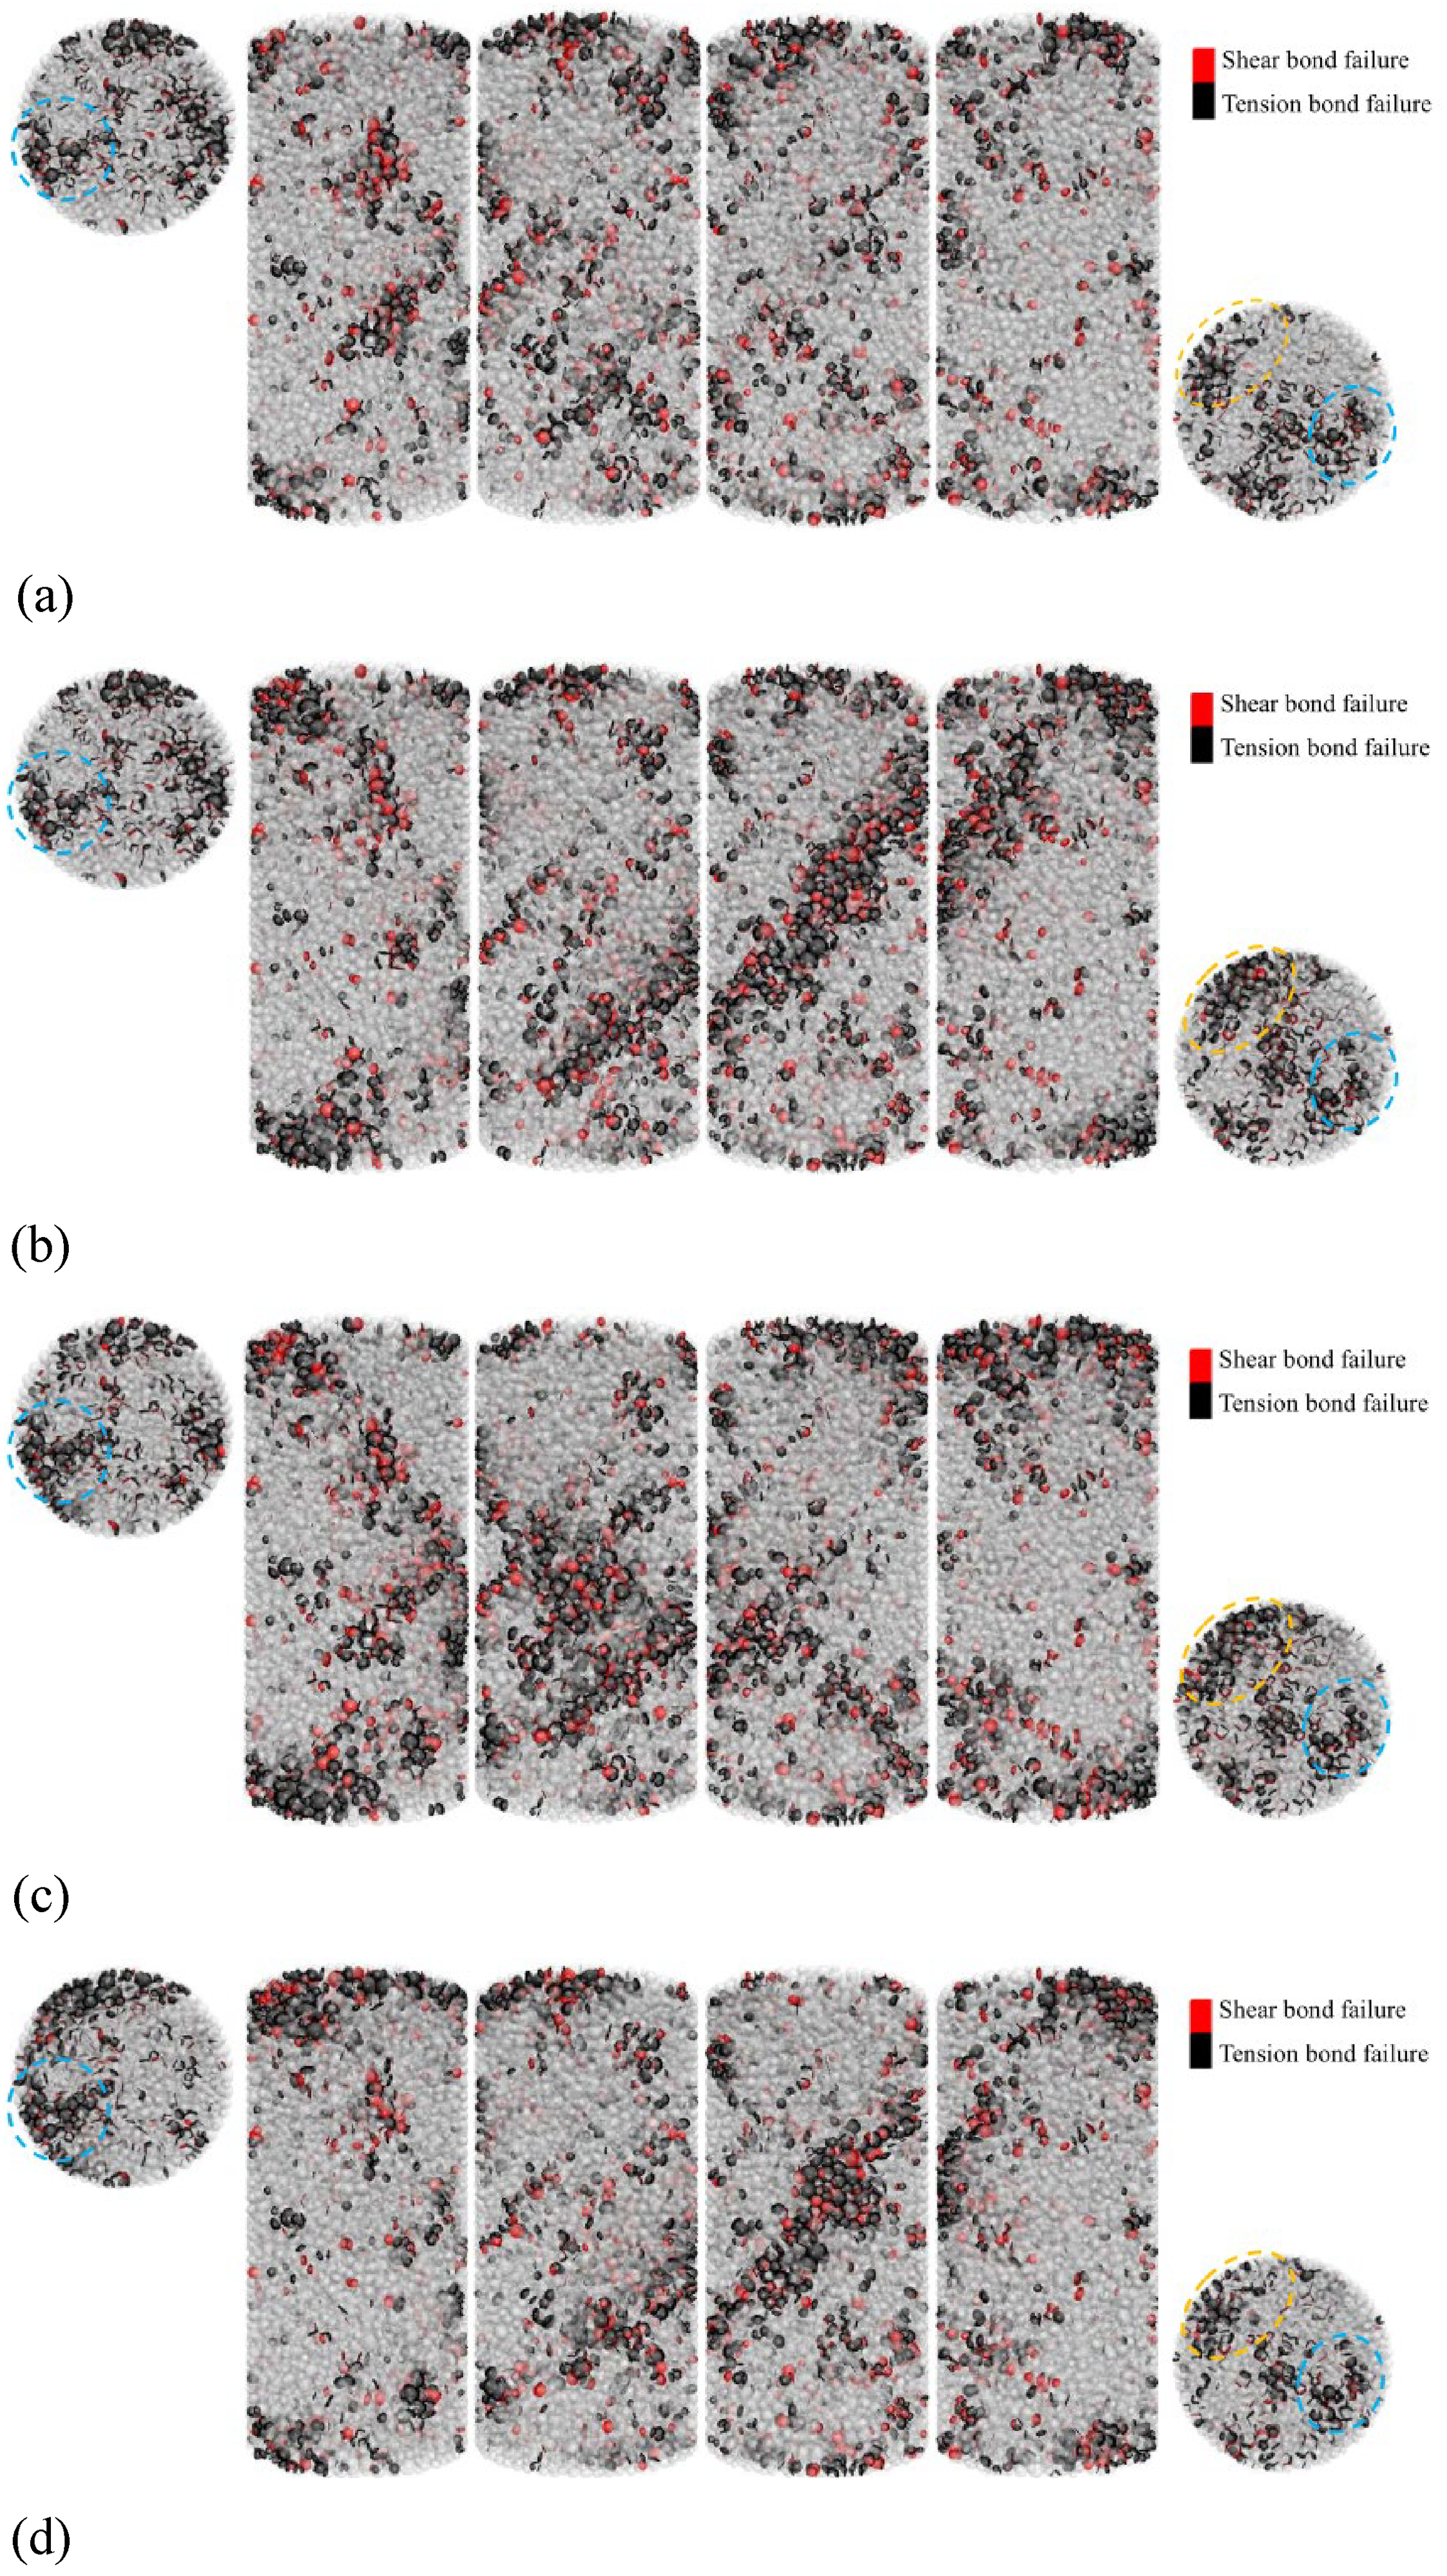
Bond failure distribution characteristics. (a) The high rate, (b) the medium-high rate, (c) the medium rate, and (d) low rate.
Bond failure distribution characteristics
The distribution of bond failure locations follows consistent patterns across the four CPU rates. Given that all specimens exhibit the same initial damage, the number, location, and failure mode of the bonds are nearly identical, as illustrated by the blue dotted circles in Figure 3. On the bottom surfaces, indicated by the yellow dotted circles, the local bond failure density progressively increases as the unloading rate decreases, peaking at the medium CPU rate. The highest bond failure density occurs at the medium unloading rate, suggesting the presence of an optimal unloading rate that facilitates bond failure formation.
On the side surfaces, at the high rate, the distribution of concentrated bond failures is relatively limited and scattered across different regions of the specimen. Local bond failures interconnect, leading to overall instability and failure, with a total of 4058 bond failures. At the medium-high rate, the concentration of bond failures significantly increases, forming a fracture zone that spans the specimen. More concentrated bond failures are observed near the upper and lower ends, resulting in a total of 5207 bond failures. At the medium rate, several X-shaped damage zones develop, and the bond failure density on both the top and bottom surfaces reaches its highest levels, totaling 5887 bond failures. At the low rate, the bond failure distribution resembles that of the medium-high rate, but the extent of the damage zone and bond failure concentration are markedly reduced, with the total number of bond failures decreasing to 4234. Notably, the bond failure count at the medium rate is significantly higher than the other rates.
Strength and deformation characteristics
Stress–strain curves characteristics
As shown in Figure 4, prior to the onset of unloading, all four rates undergo an identical initial axial and confining pressures loading process, resulting in identical stress–strain curves. During the unloading process, up to 95% of the peak deviatoric stress, the stress–strain curves exhibit distinct characteristics, as highlighted in the enlarged dashed-line region. The peak deviatoric stresses for the four rates are 50.75 MPa, 51.68 MPa, 51.79 MPa, and 51.95 MPa, respectively. The results suggest that the ultimate load-bearing capacity of the specimens progressively improves, reaching its highest value at the low rate. All four scenarios display a stress drop after reaching the peak partial stress.
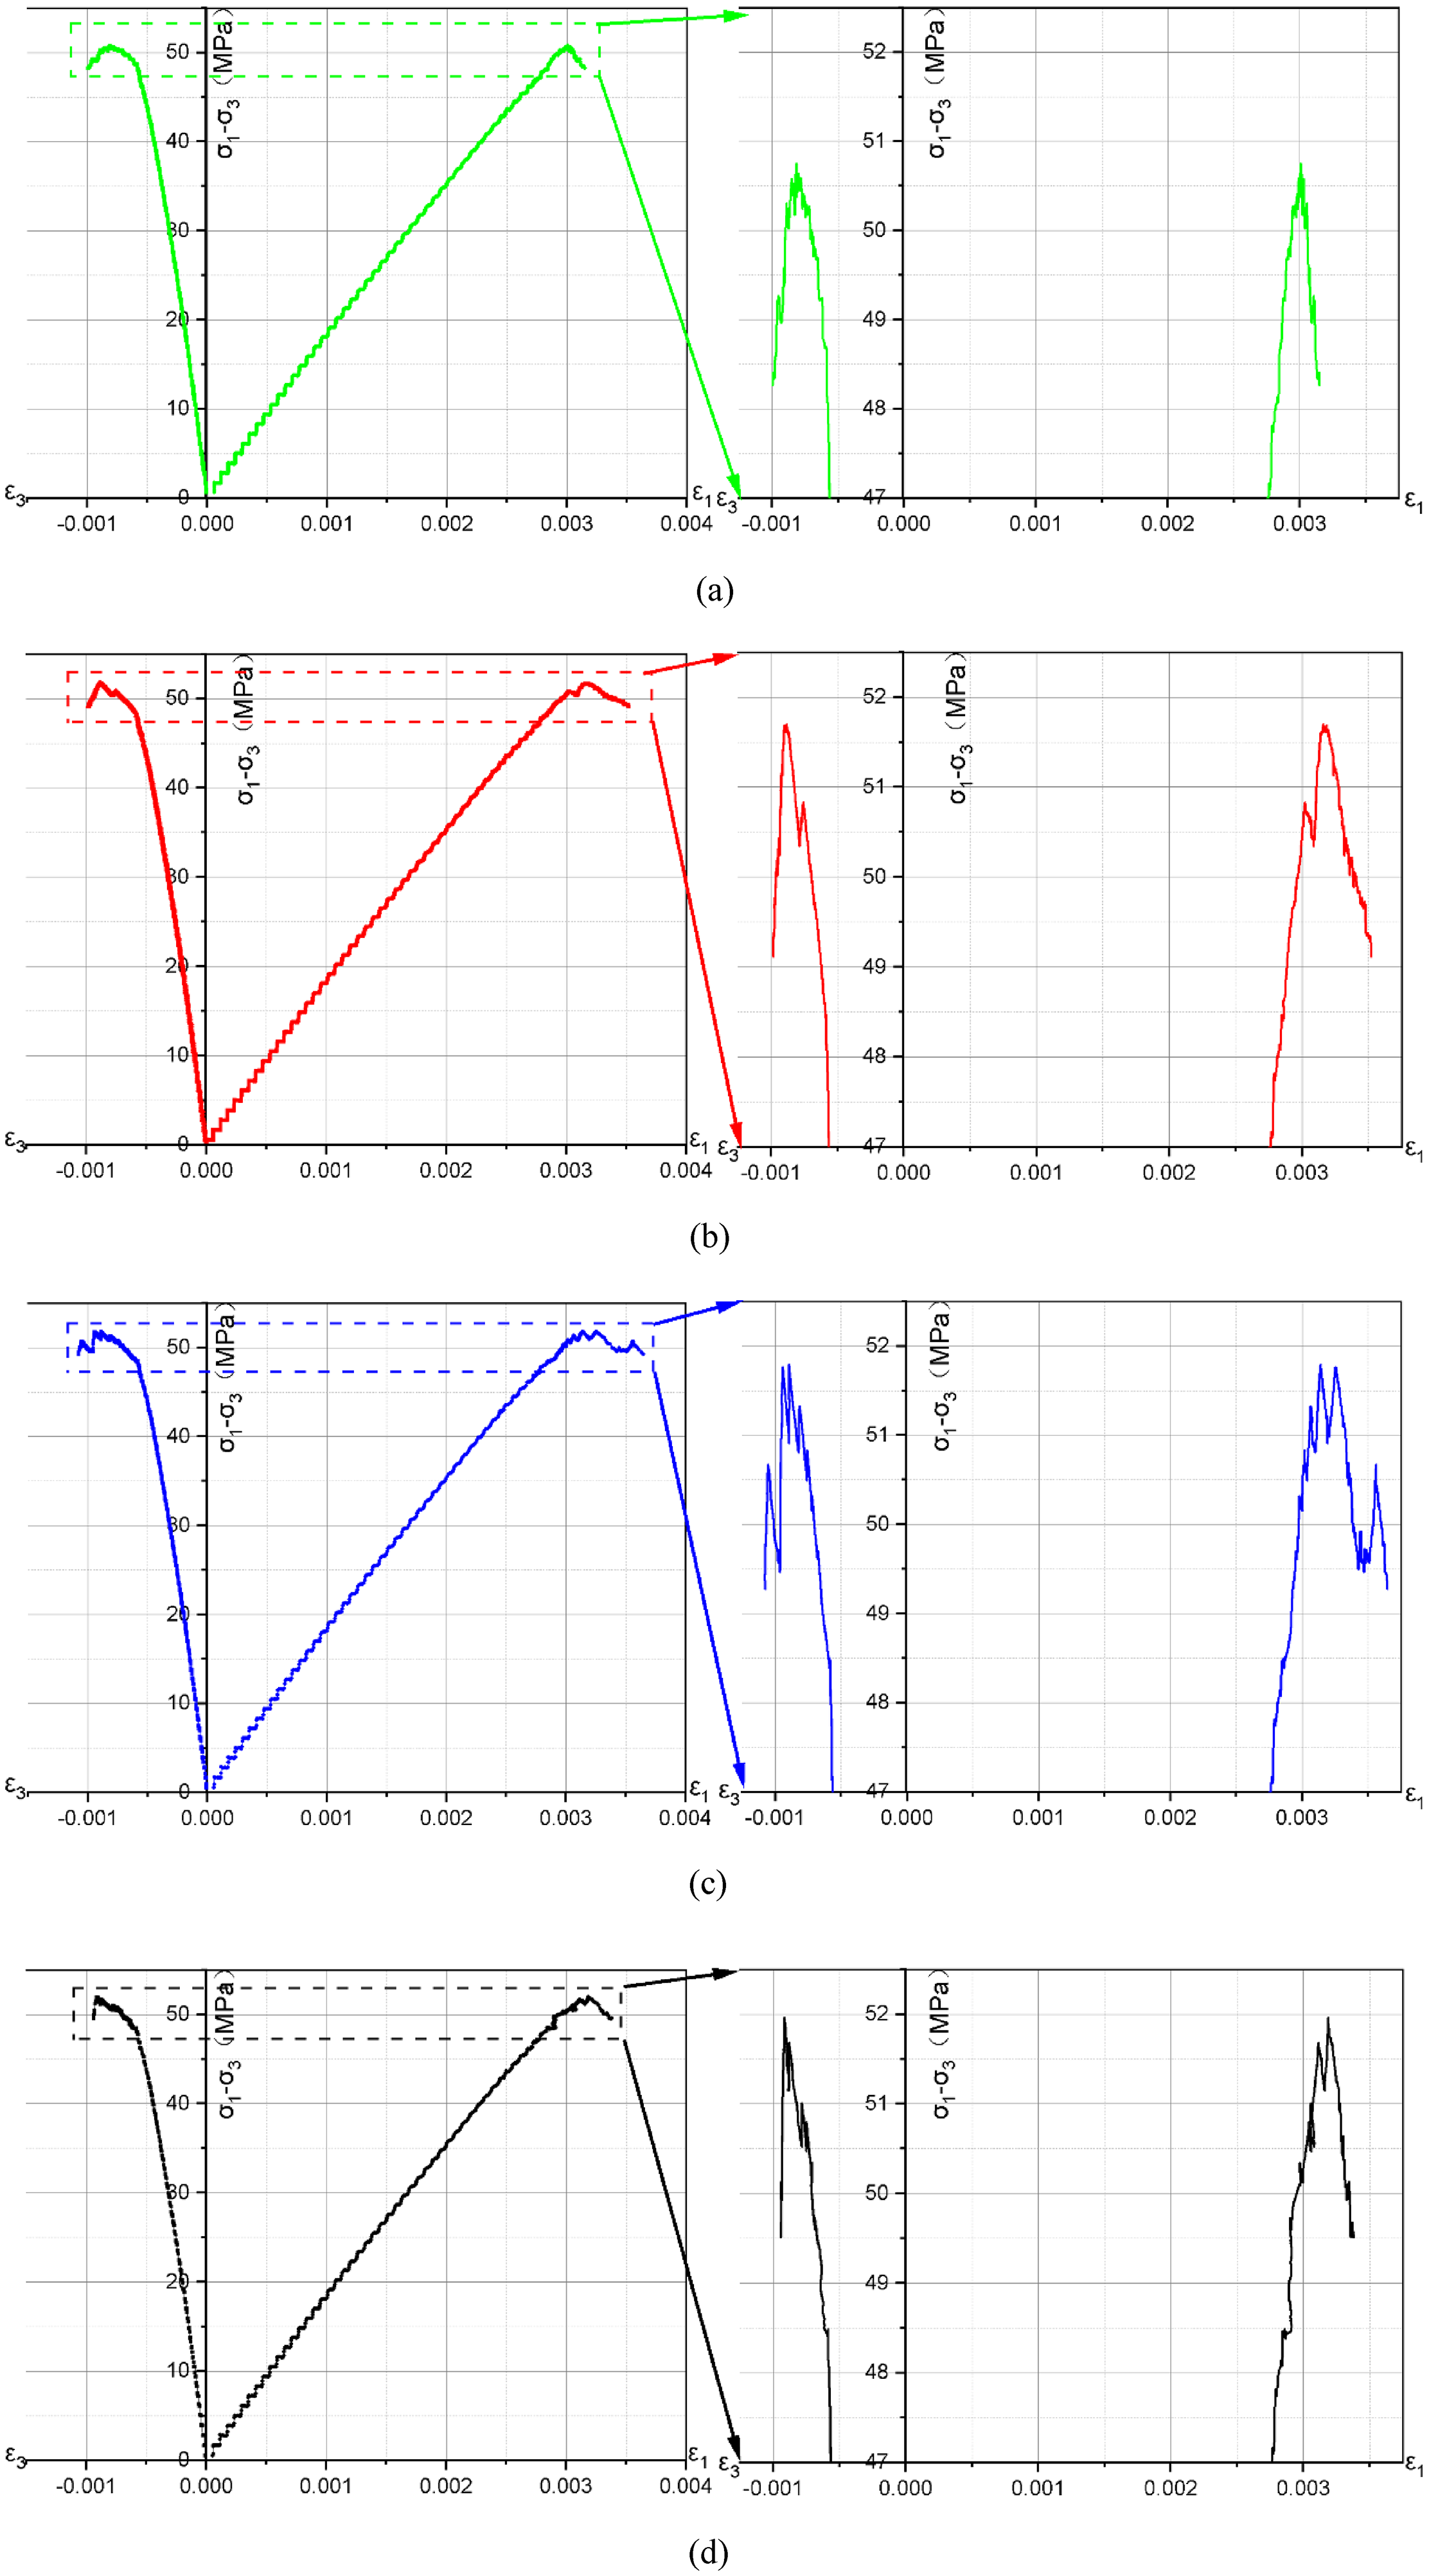
Stress–strain curves characteristics. (a) The high rate, (b) the medium-high rate, (c) the medium rate, and (d) low rate.
Axial and confining pressures variation characteristics
In physical experiments, steady-state control of constant axial pressure is typically achieved by setting critical axial displacement or stress control. During testing, if the axial pressure remains constant while the confining pressure is unloaded, the deviatoric stress will continue to increase, ultimately leading to rupture and fluctuations in the specimen's axial load-bearing capacity. However, the magnitude of the fluctuations can be minimized through the aforementioned methods, which maintain relatively constant axial pressure, such as by limiting axial pressure variations to less than 1% of the set value while unloading the confining pressure at a fixed rate. The testing process is monitored using calculation programs, which is essentially similar to the procedure employed in numerical simulations.
Figure 5 omits the initial axial and confining pressures loading phase, focusing on the stage where the axial pressure remains stable, while the confining pressure exhibits a relatively linear unloading pattern. The confining pressure values at the end of the process for the four rates are 7.42 MPa, 6.88 MPa, 6.52 MPa, and 6.83 MPa, respectively. Since the axial pressure fluctuation is constrained to within 1% of the fixed value, it remains stable at all four rates. The confining pressure decreases over time at the four fixed rates but exhibits slight oscillations due to the abrupt brittle rupture of the specimens, which causes a sudden drop in axial pressure, even though the specimens have not completely lost their load-bearing capacity. To maintain constant axial pressure under numerical program control, the side surface loading boundary rapidly increases the confining pressure to counterbalance the sudden decrease in axial bearing capacity, ensuring dynamic equilibrium of the specimens. This process mirrors the servo mechanism employed in physical experiments.
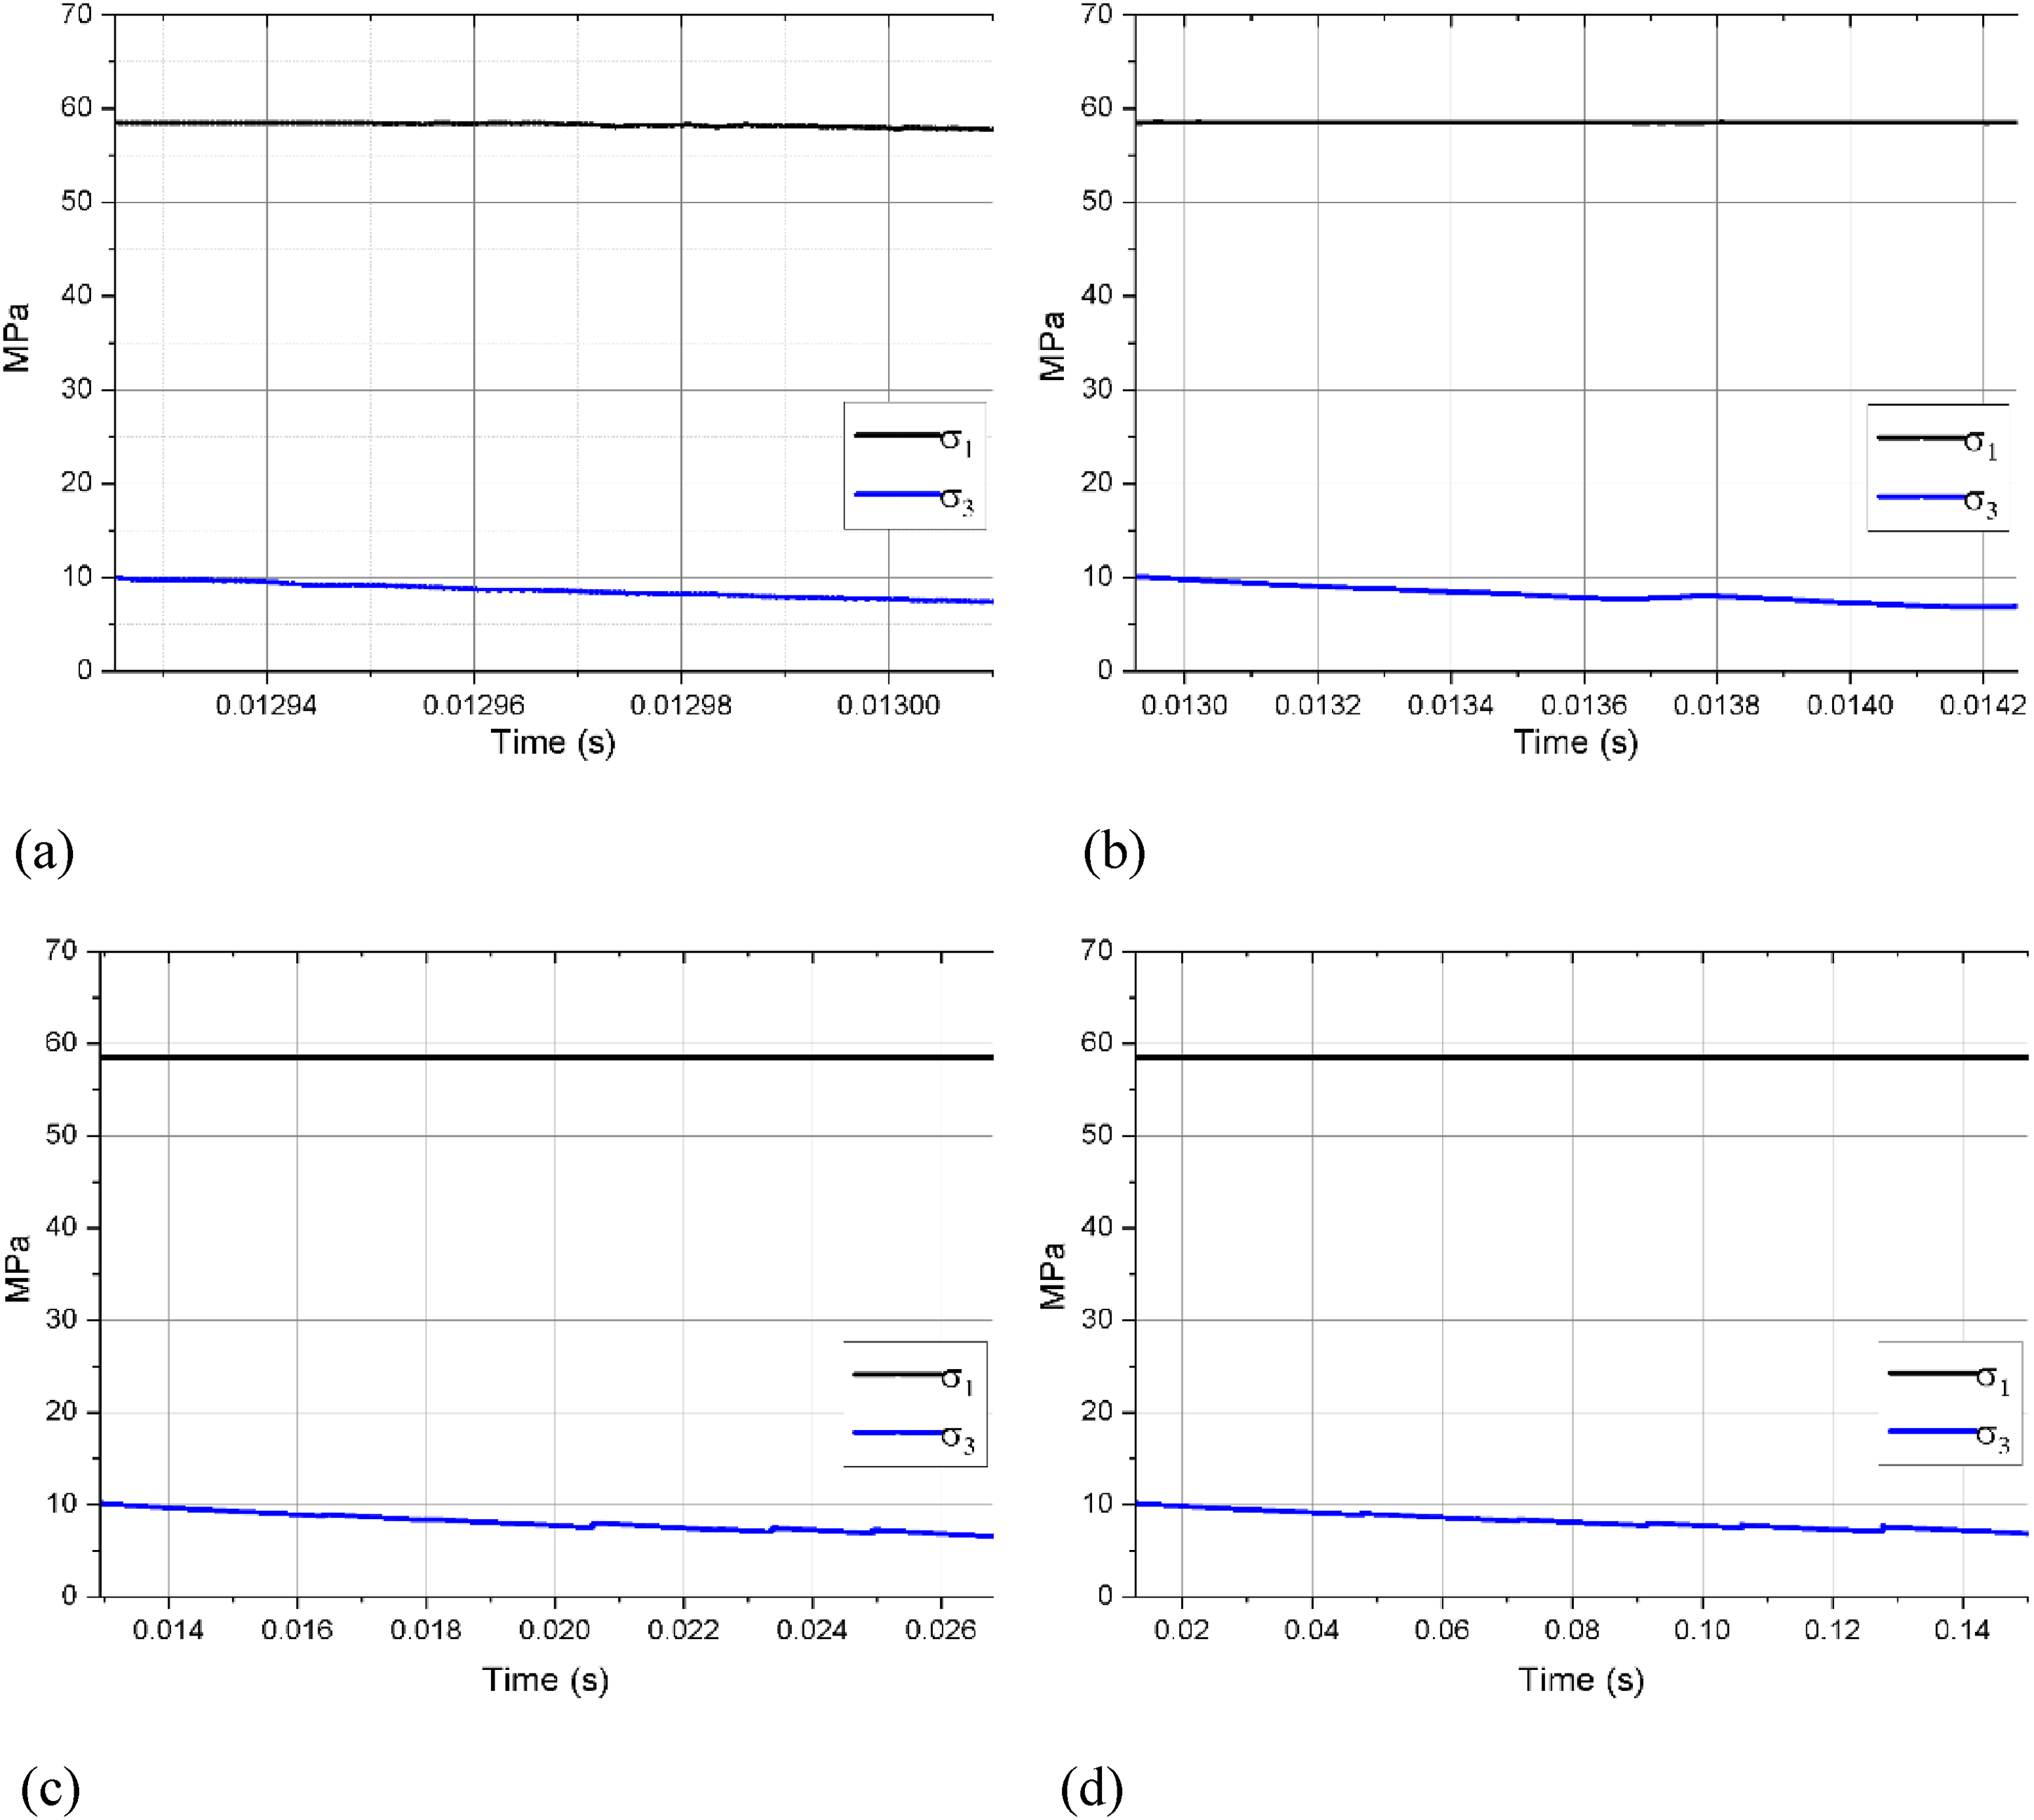
Axial and confining pressures characteristics of unloading process. (a) The high rate, (b) the medium-high rate, (c) the medium rate, and (d) low rate.
At the four unloading rates, the slight fluctuations in axial and confining pressures reflect the multistage, sudden, and progressive damage process, indicating brittle behavior. If the testing time in the post-peak phase were extended, such as continuing to 90% of the peak deviatoric stress, maintaining constant axial pressure would result in frequent and significant fluctuations in the confining pressure, making it challenging to satisfy the conditions of constant axial pressure and stable CPU rate. Therefore, the tests were terminated when 95% of the peak deviatoric stress was reached based on repeated trial calculations that reflected the characteristic changes observed in all four rates.
Strain response due to unloading rate
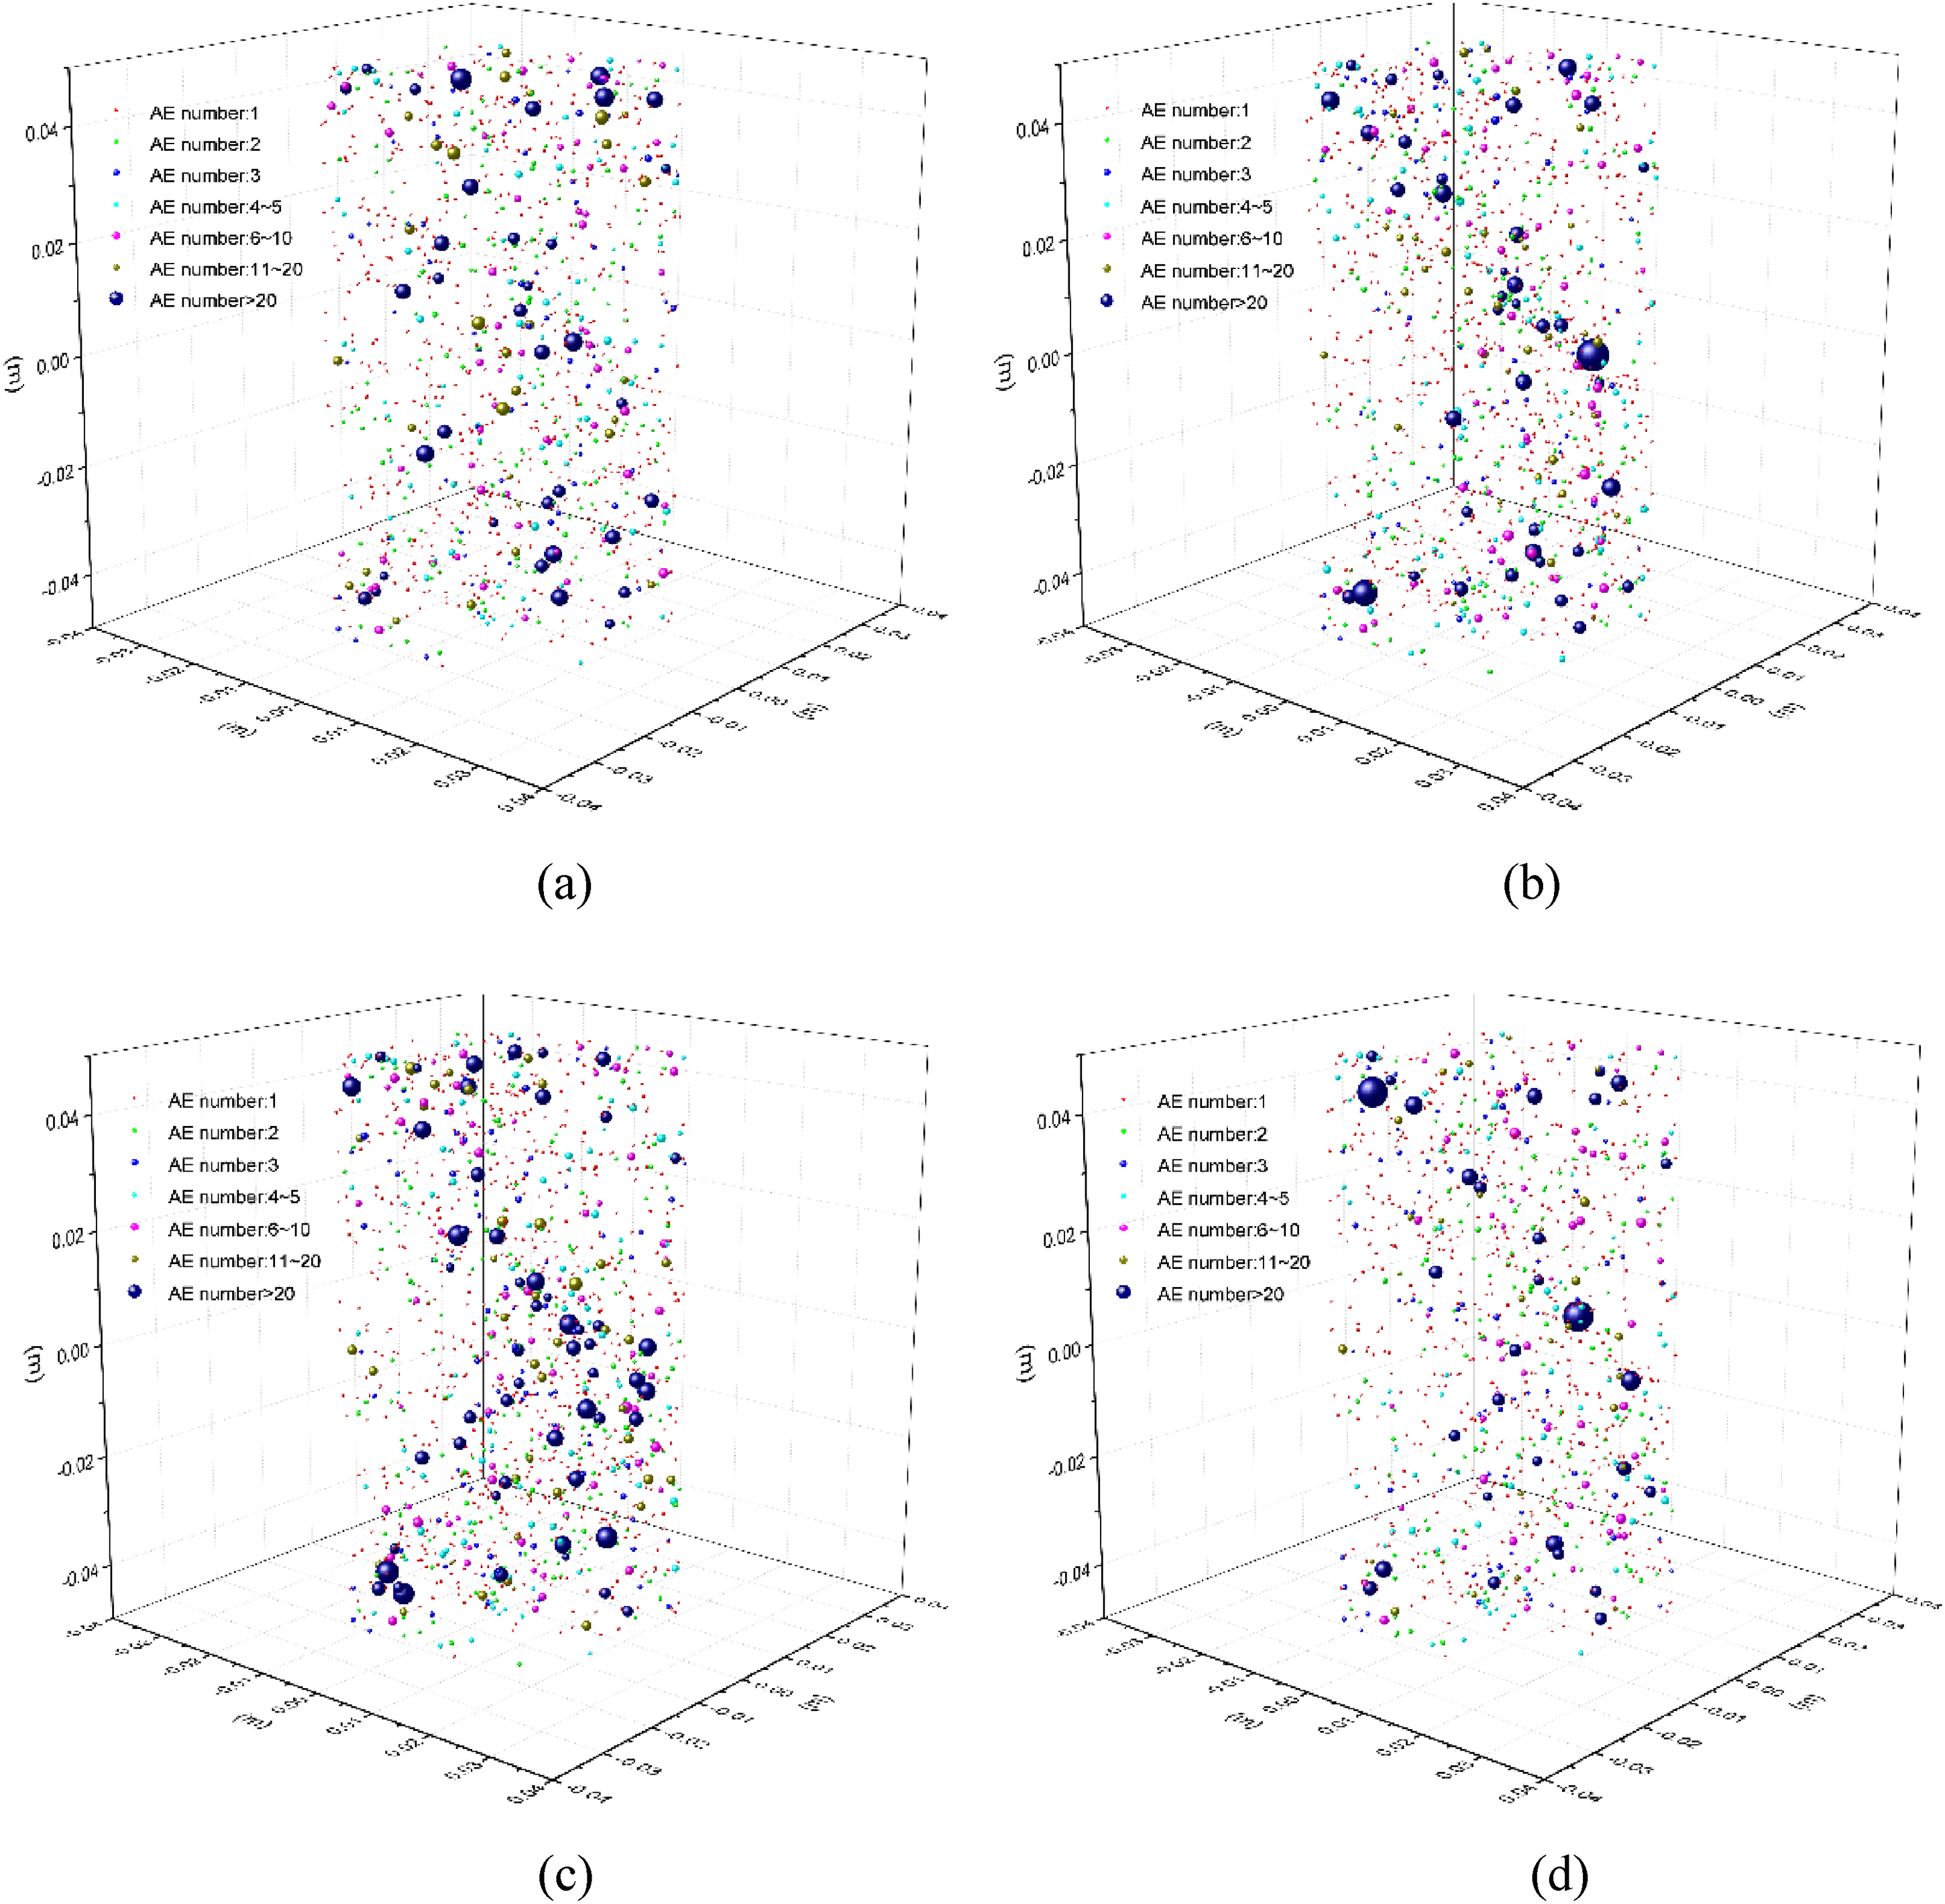
Figure 6 illustrates the relationship between AE events and volumetric strain. Due to the stabilization of axial pressure and the continuous CPU, the specimen undergoes radial tension and axial compression during the test. The negative volumetric strain indicates a slight volumetric expansion of the specimen as a whole. At the high rate, fractures occur within a short period, with AE events distributed relatively uniformly over time. As the unloading rate decreases, spontaneous microfractures in the specimen become increasingly frequent, as evidenced by the higher occurrence of blue AE events at nearly regular intervals. This is accompanied by more pronounced instances of instantaneous volumetric expansion due to radial tension in the specimen. As the unloading rate decreases, the failure mode of the specimen transitions from rapid and concentrated fracturing leading to instability to a multistage failure process characterized by successive bursts of fracturing.
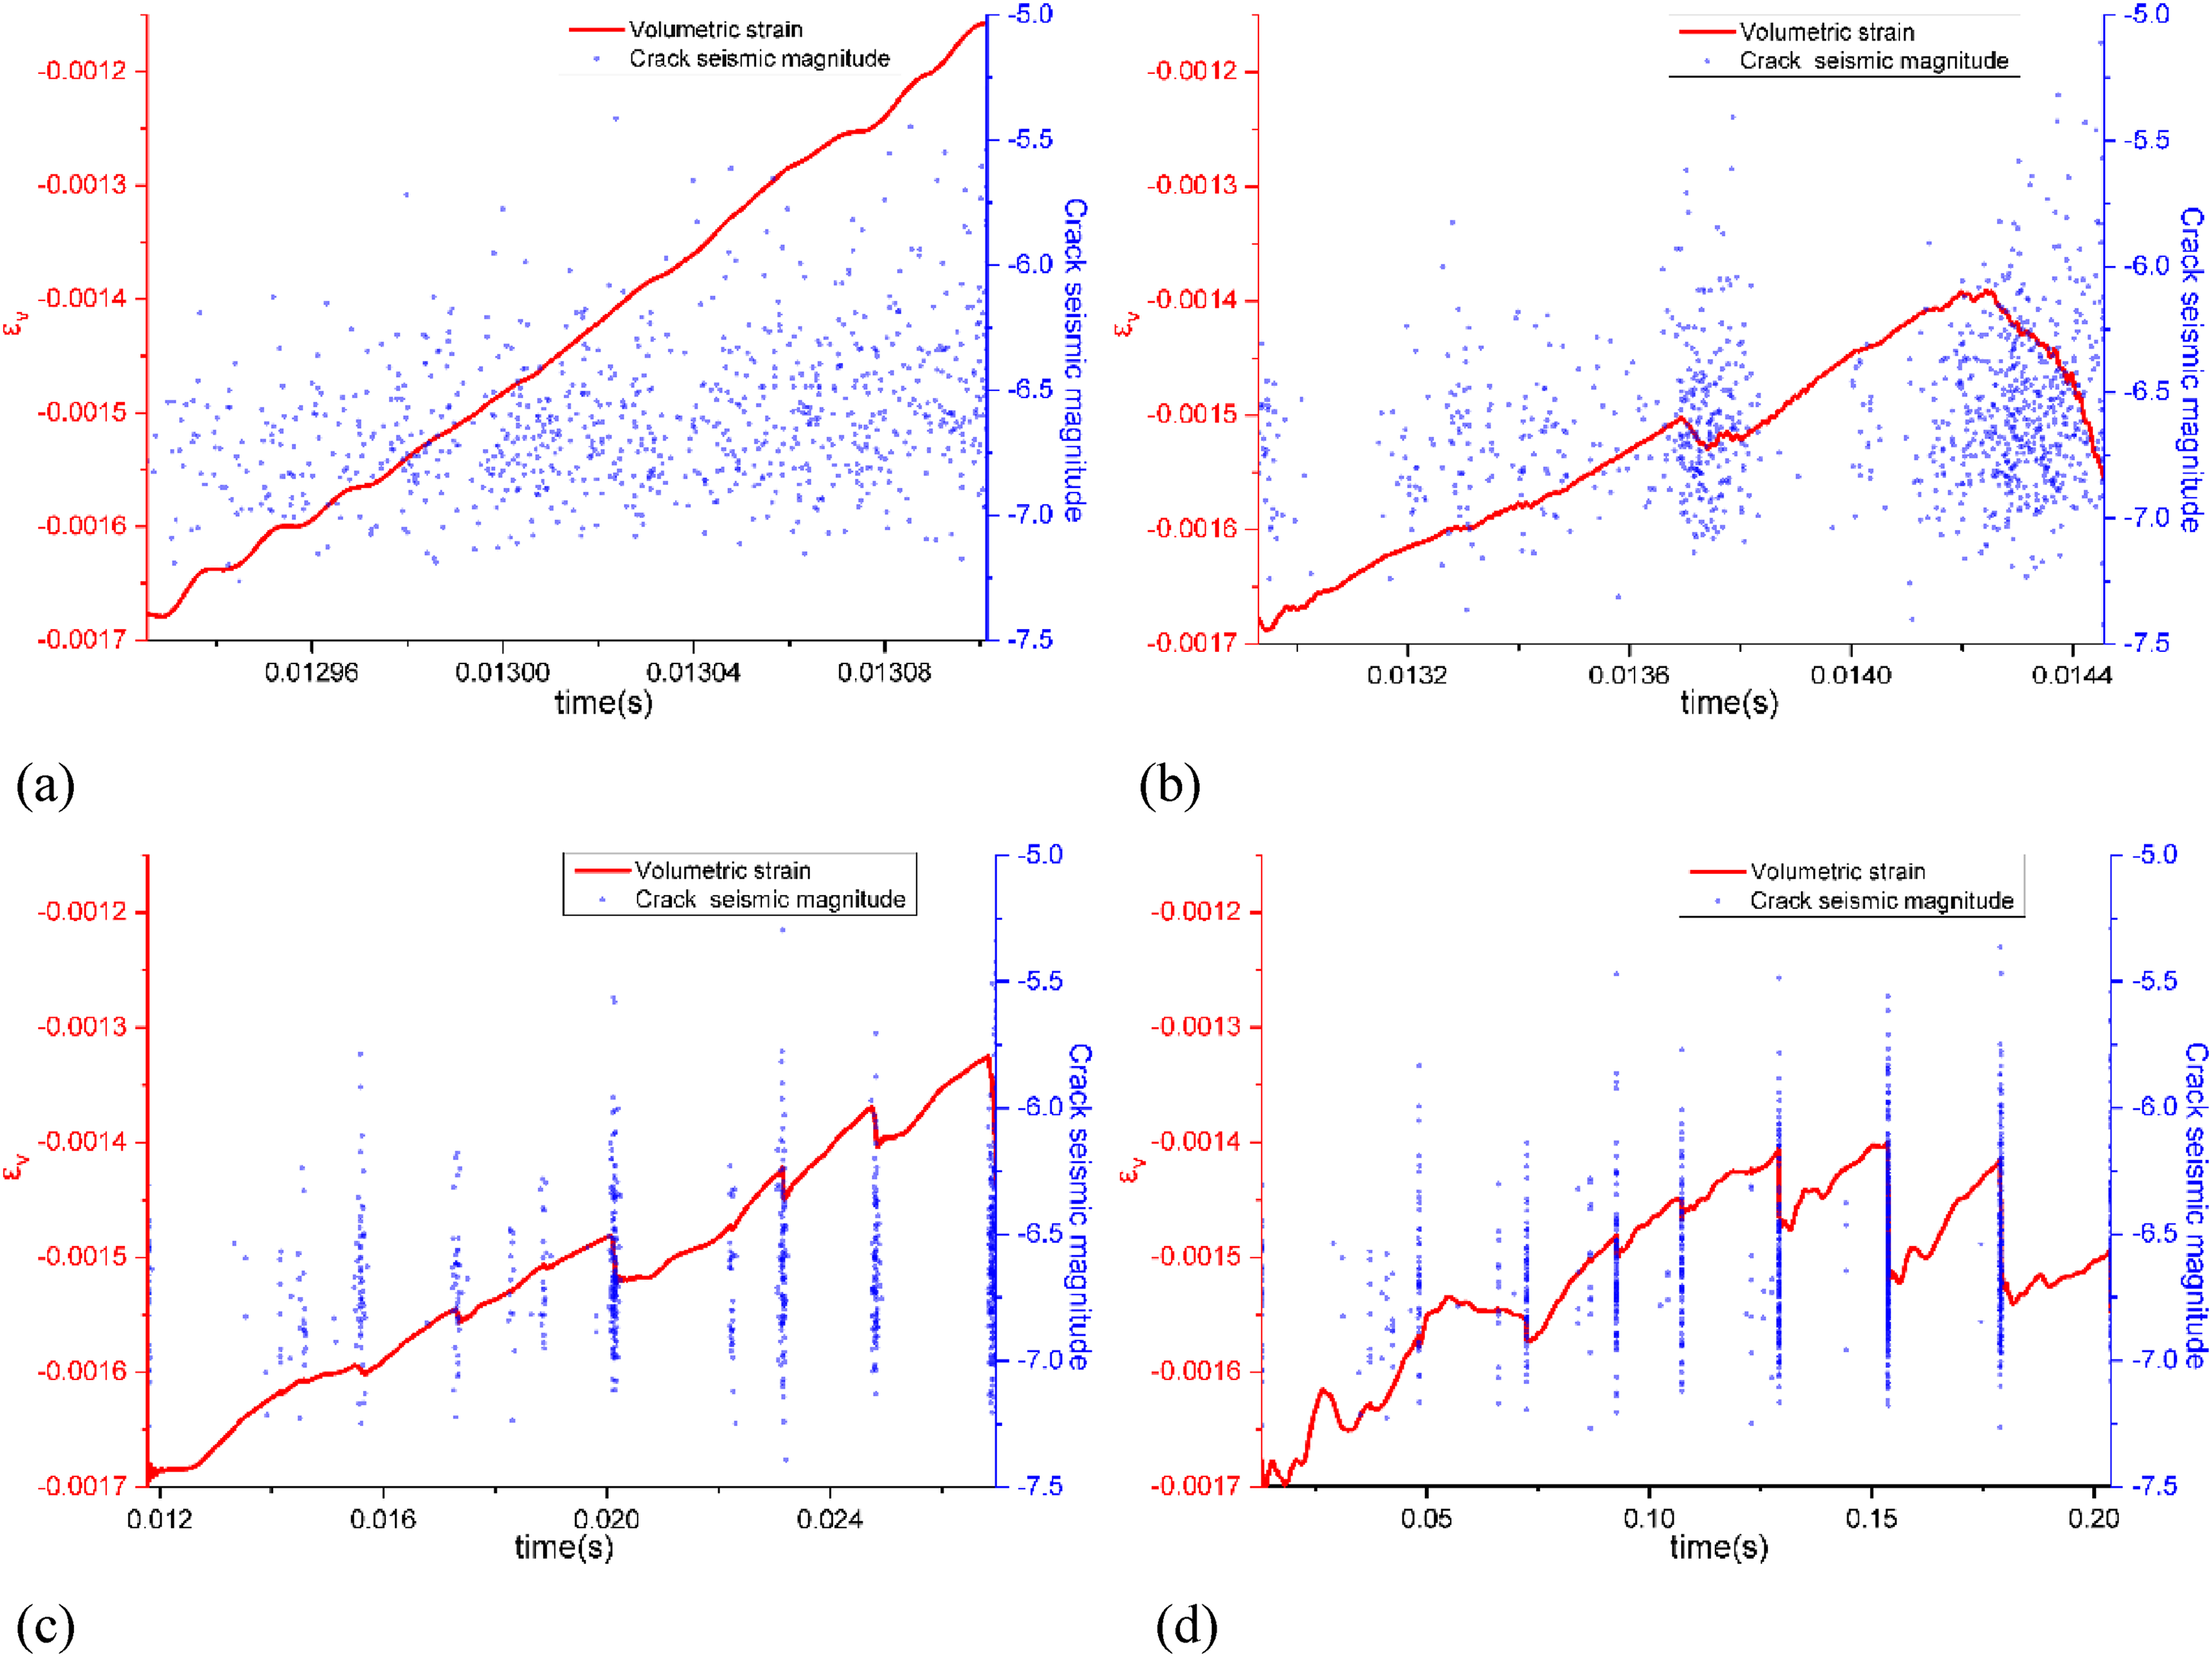
Volumetric strain curves and seismic magnitude distribution of unloading process. (a) The high rate, (b) the medium-high rate, (c) the medium rate, and (d) low rate.
To analyze the effect of confining pressure reduction on strain, the ratio of strain variation to confining pressure variation between the starting point of CPU and the stress drop point is used as a parameter (Qiu et al., 2010). This ratio serves as an indicator of the strain response of the specimen to the CPU rate and is expressed as equation (7)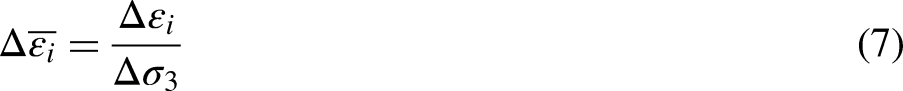
As shown in Figure 7, at the four rates, all
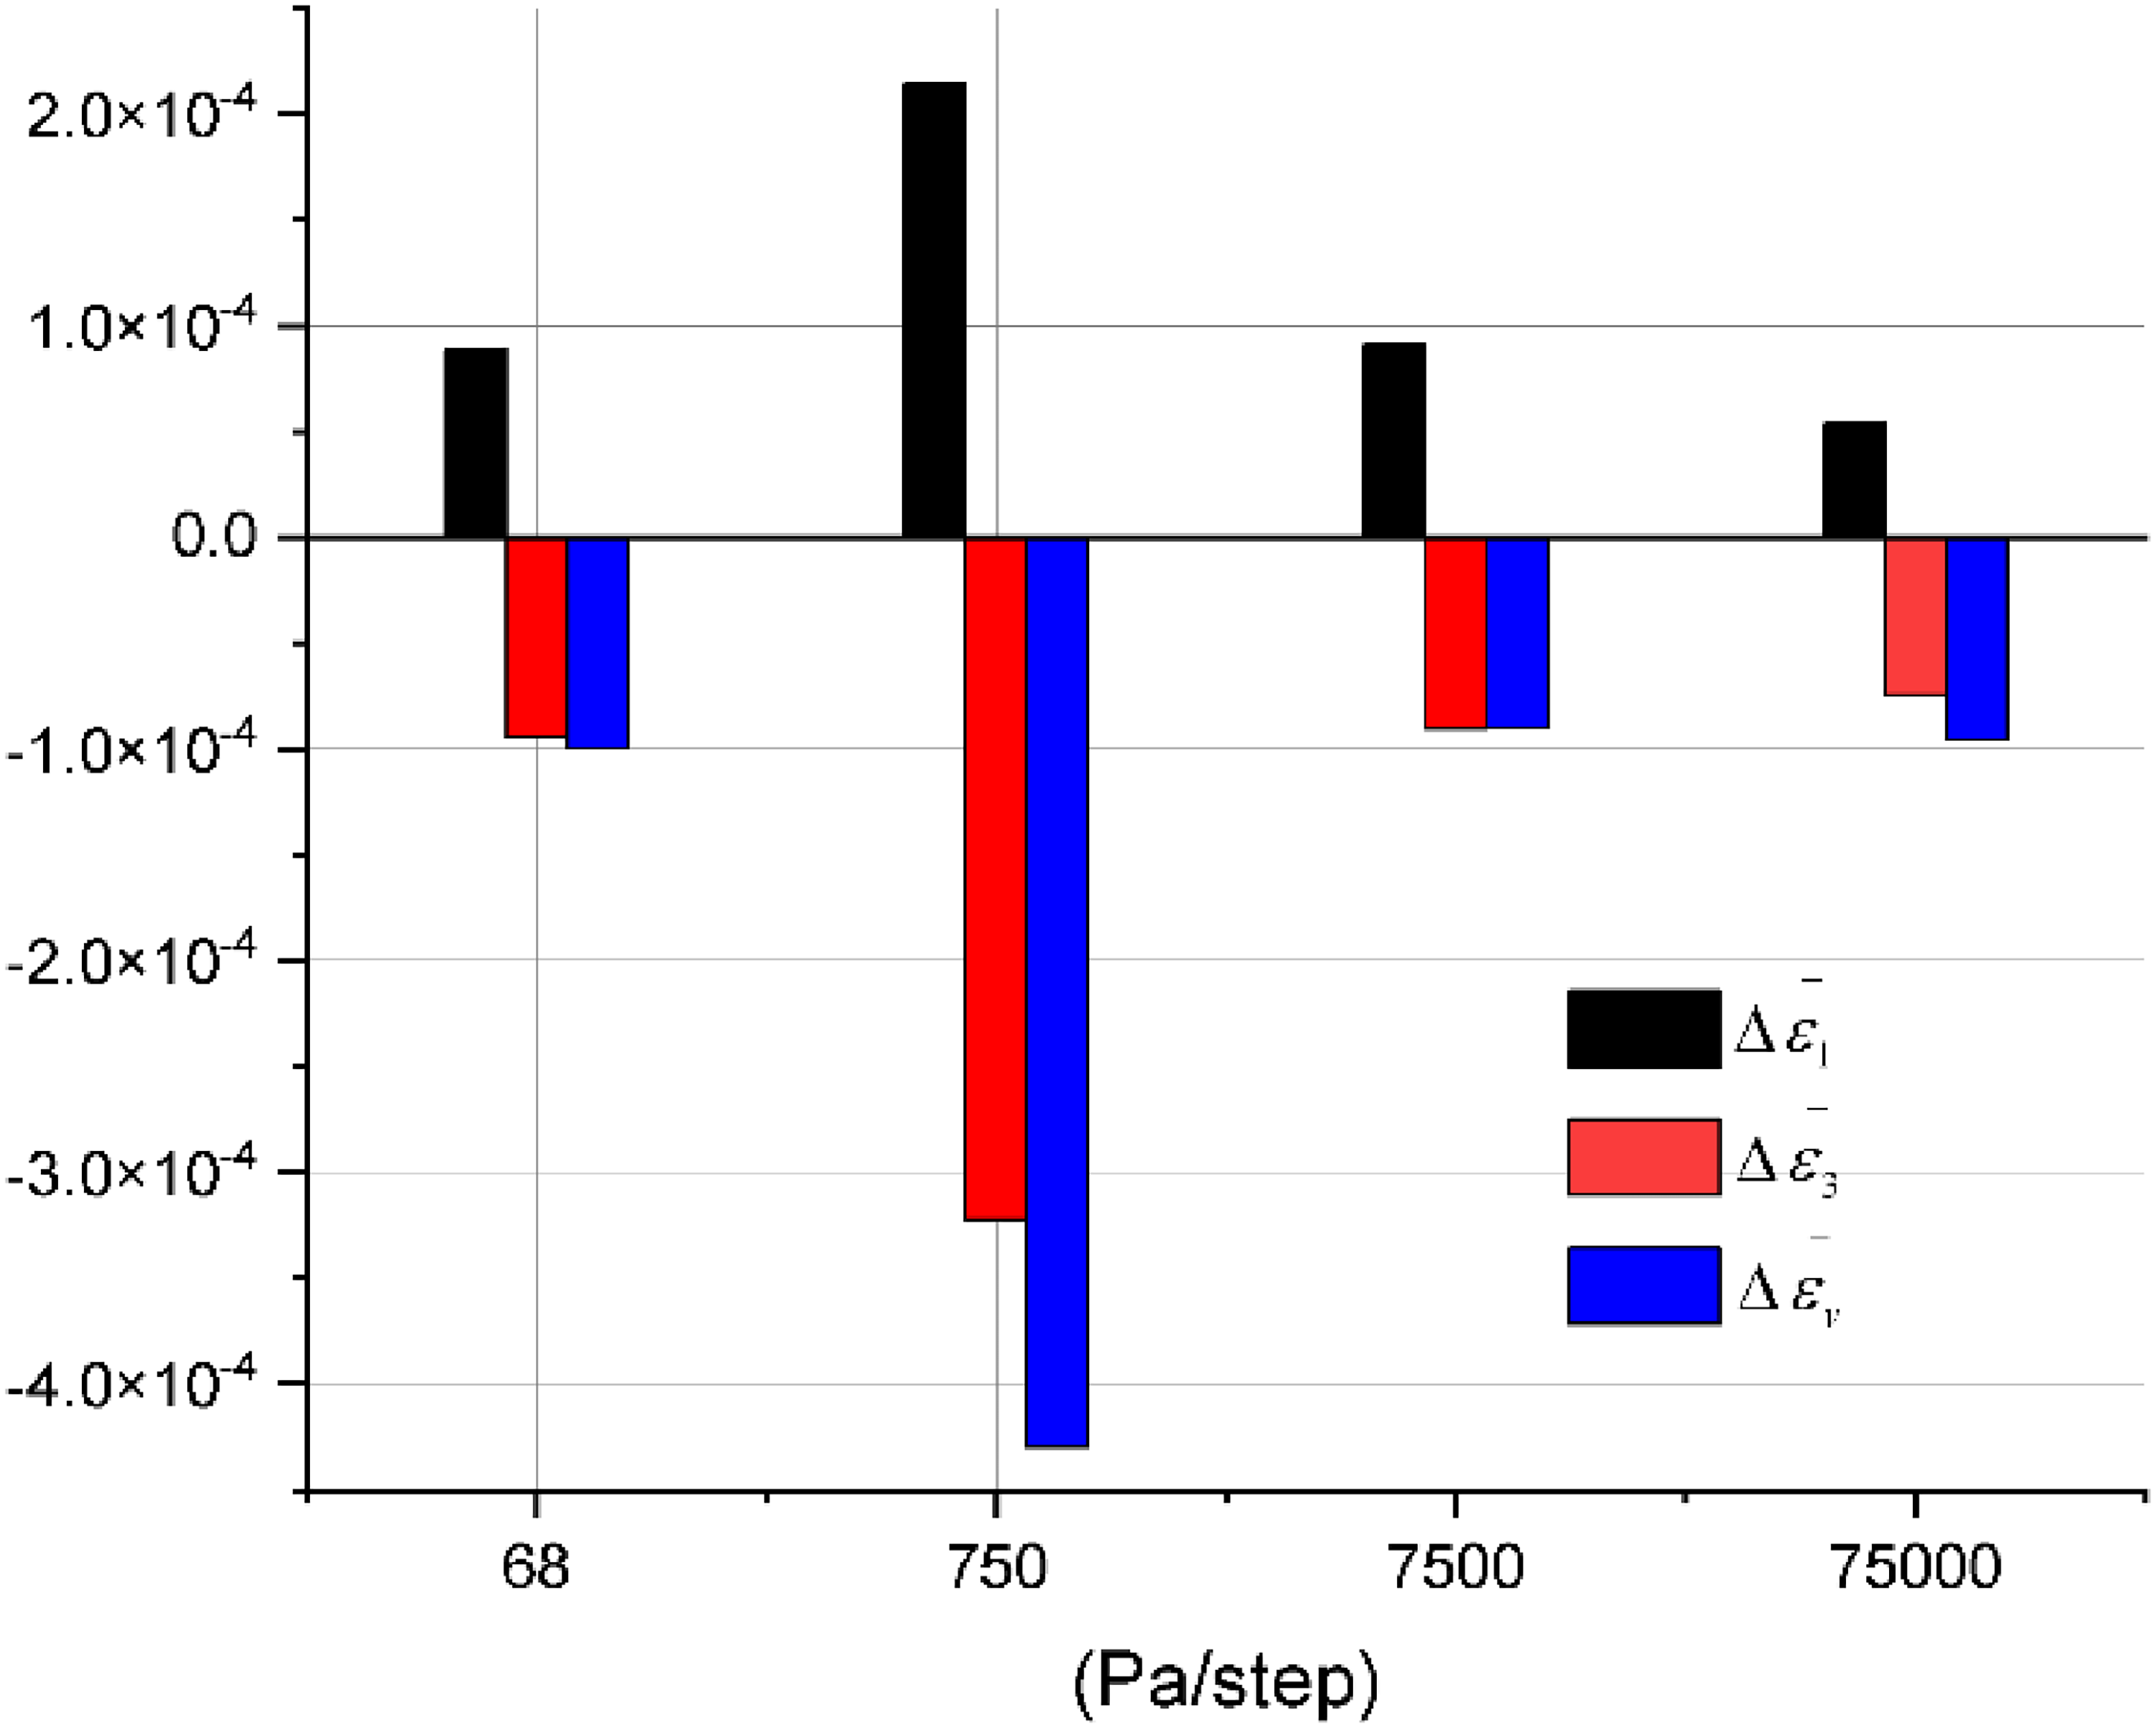
Strain response degree characteristics at four rates.
The magnitude of particle displacement offers valuable insight into the strain characteristics of the four rates. Figure 8 shows the relative particle displacement at the final state for each unloading rate, with the x axis representing the ratio of particle displacement to its radius. All four rates display a decreasing trend after reaching the peak of probability density, with the proportion of particles exhibiting larger displacements decreasing as displacement increases. The general displacement range for particles at the high rate is the smallest, followed by the medium-high rate, while the displacement range for the medium and low rates is relatively broader.
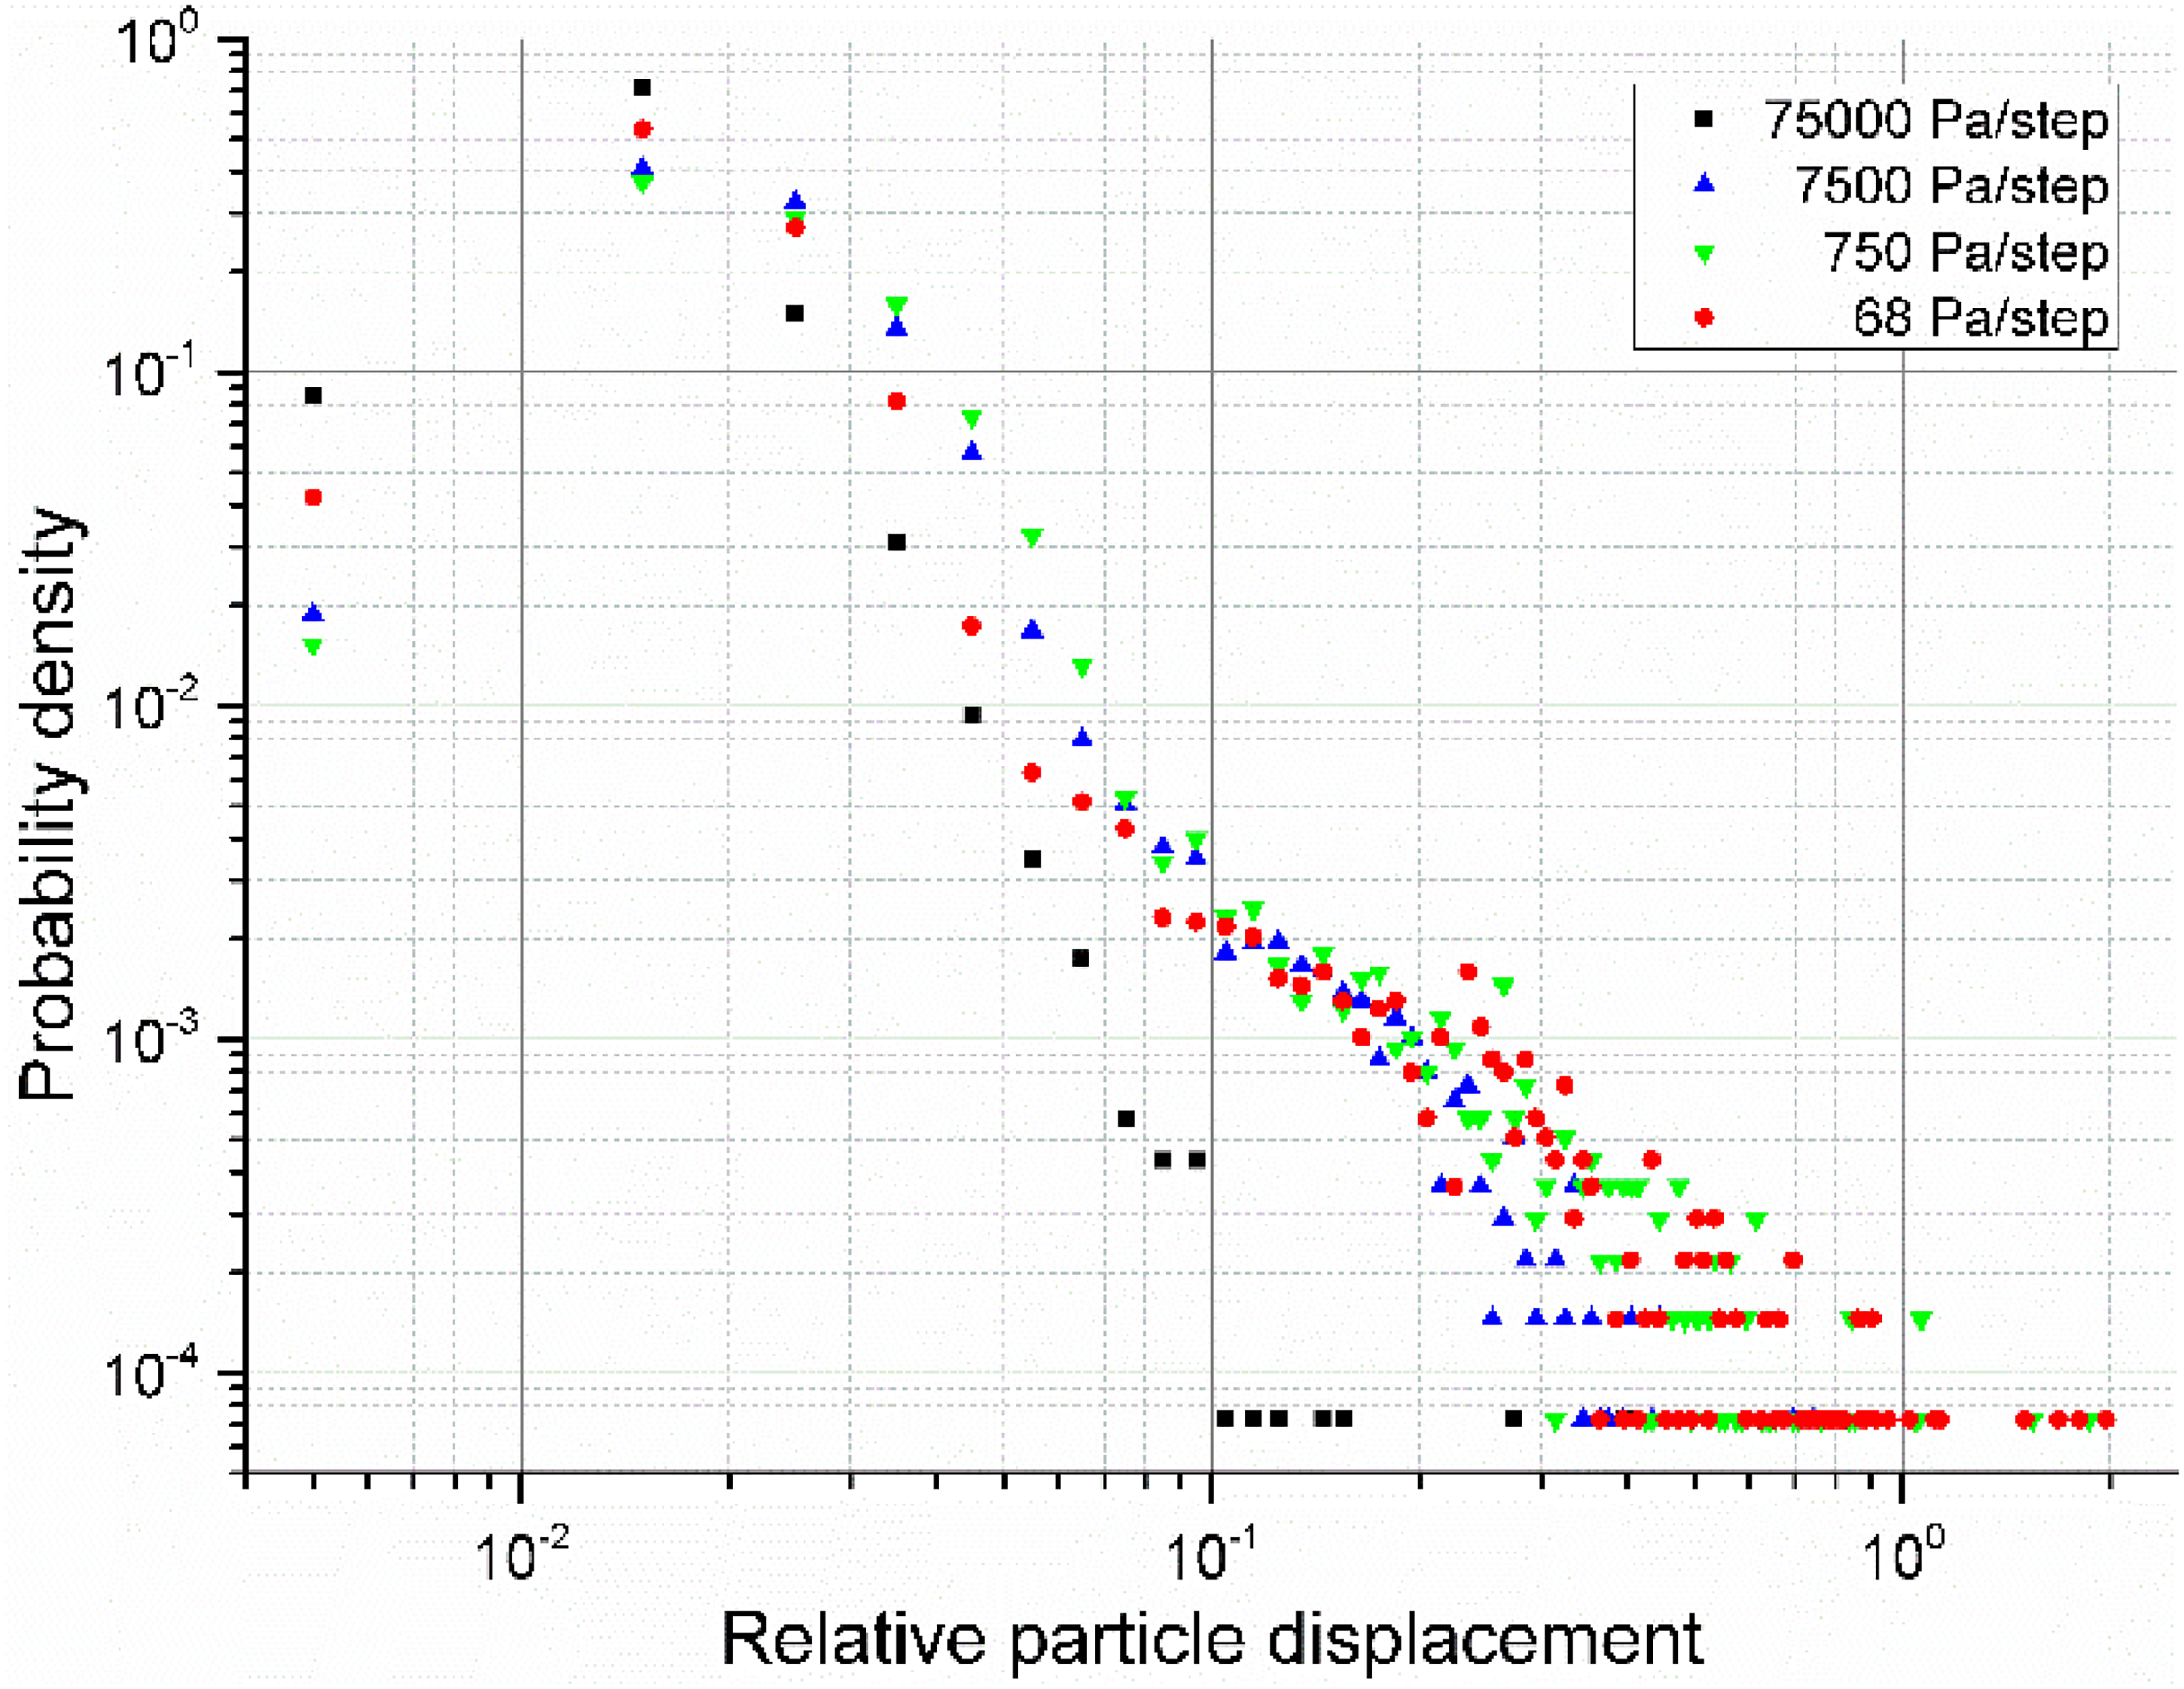
Comparison of relative particle displacement.
Figure 9 illustrates the axial displacement magnitude (along the z axis) of particles from the initial to final state at the four rates. The data distribution for the low and medium rates is considerably wider than that for the medium-high and high rates. The standard deviations of the four data sets, from high to low rates, are 1.07 × 10⁻⁵, 2.61 × 10⁻⁵, 3.63 × 10⁻⁵, and 3.08 × 10⁻⁵, with the peak occurring at the medium unloading rate.
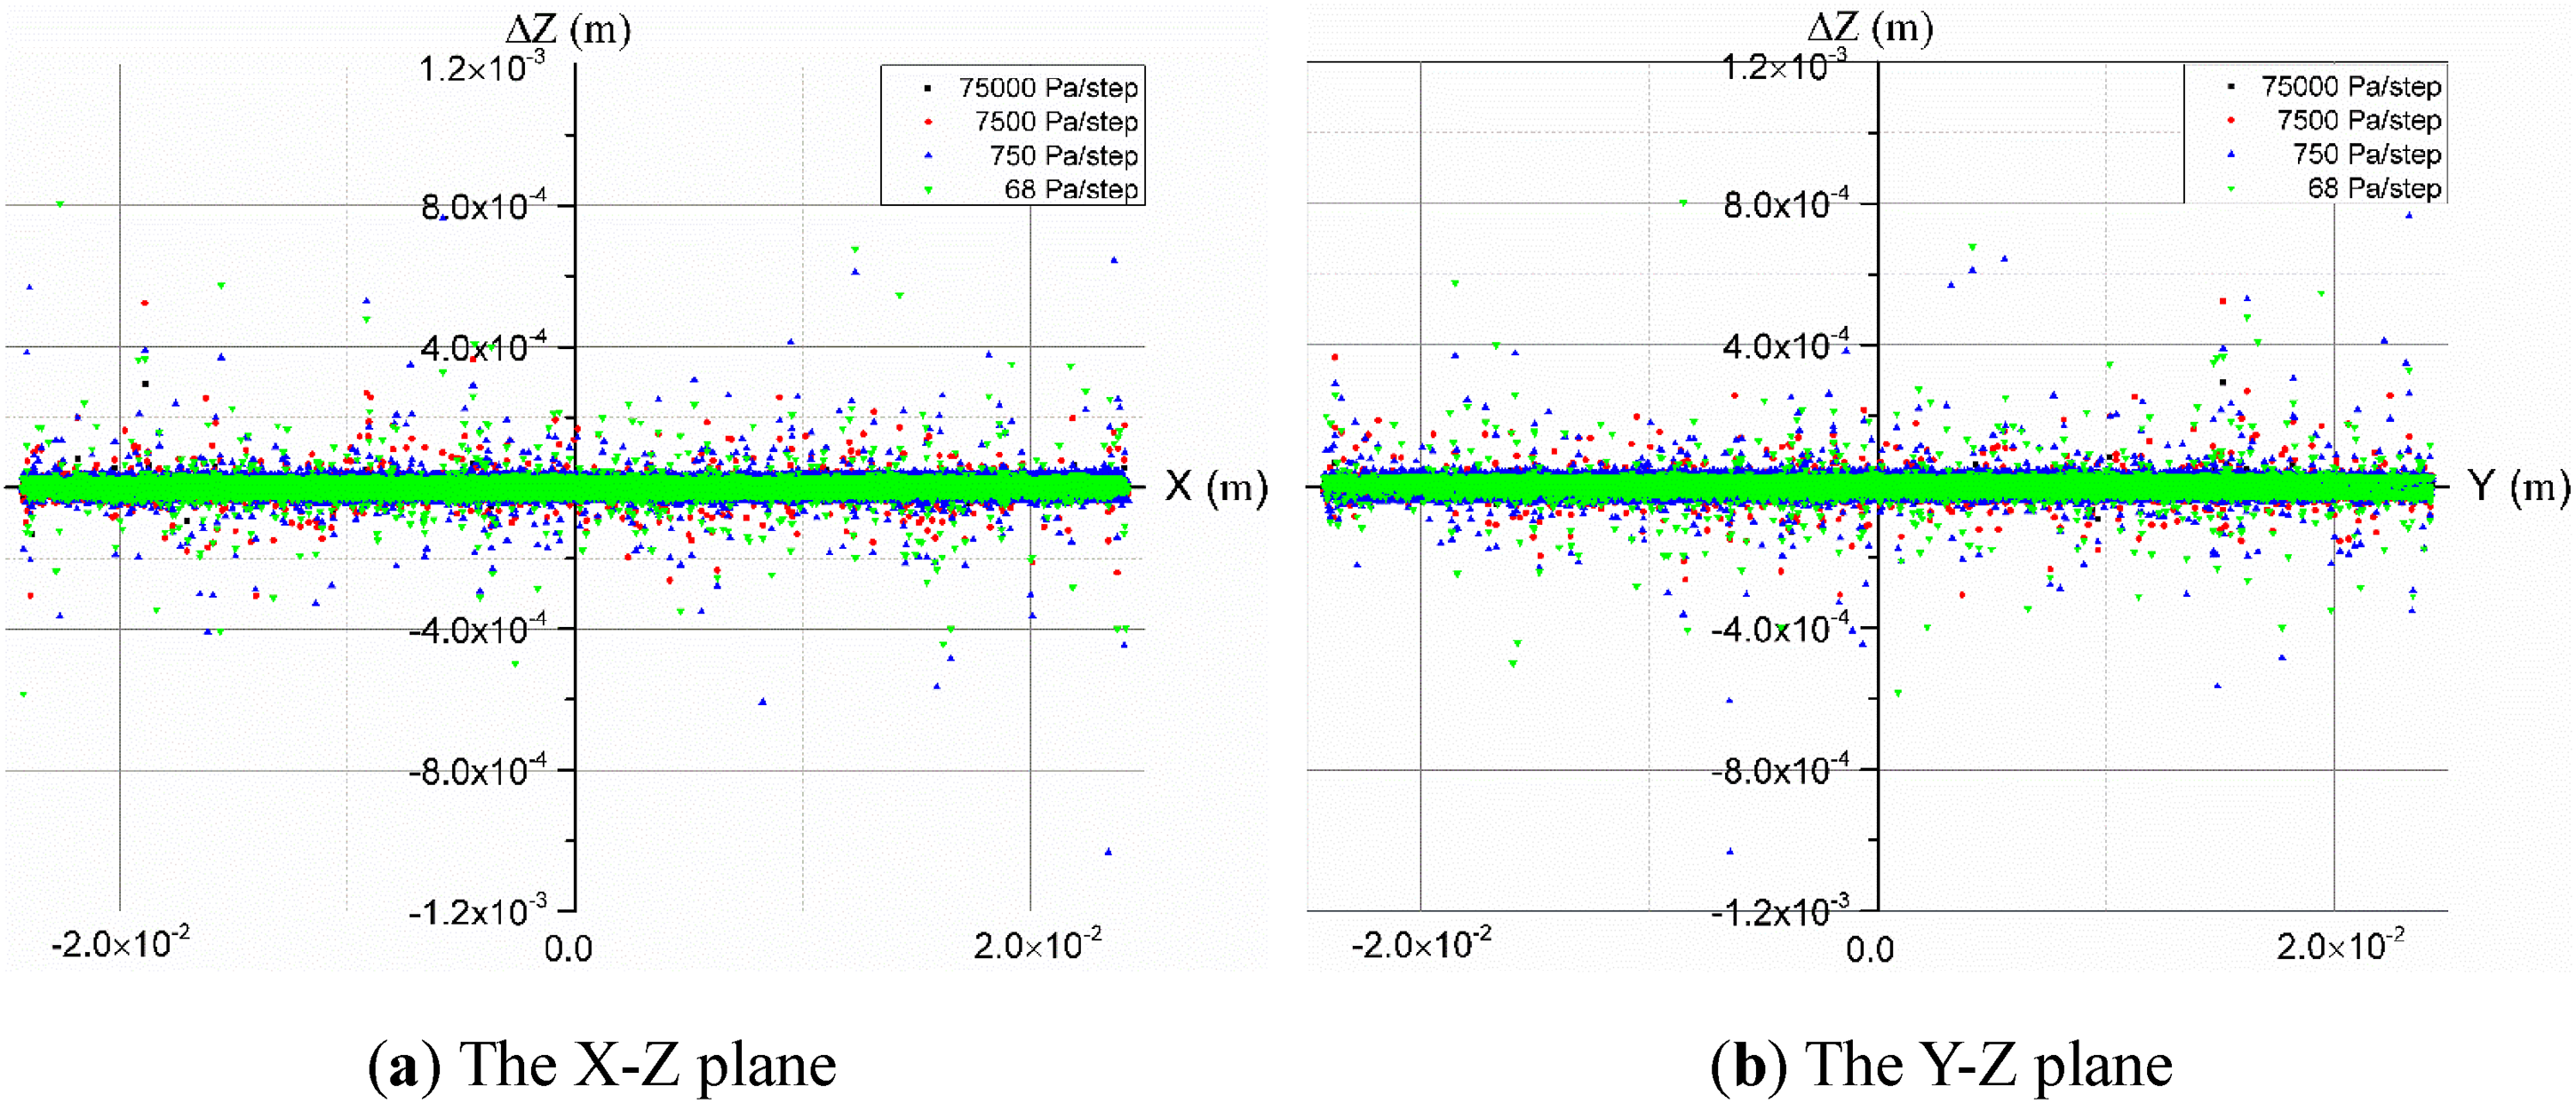
Axial displacement change magnitude of particles.
Similarly, the radial displacement change magnitudes for the four rates, as shown in Figure 10, follow a similar pattern, with the data distribution for the low and medium rates being substantially wider than for the higher rates. The standard deviations from high to low rates are 1.12 × 10⁻¹, 1.63 × 10⁻¹, 2.17 × 10⁻¹, and 1.85 × 10⁻¹. Both results indicate that axial and radial displacement changes are most sensitive to the medium unloading rate. The values suggest that the magnitudes of particle displacement have a significant impact on specimen deformation, with variations in displacement reflecting corresponding differences in strain.
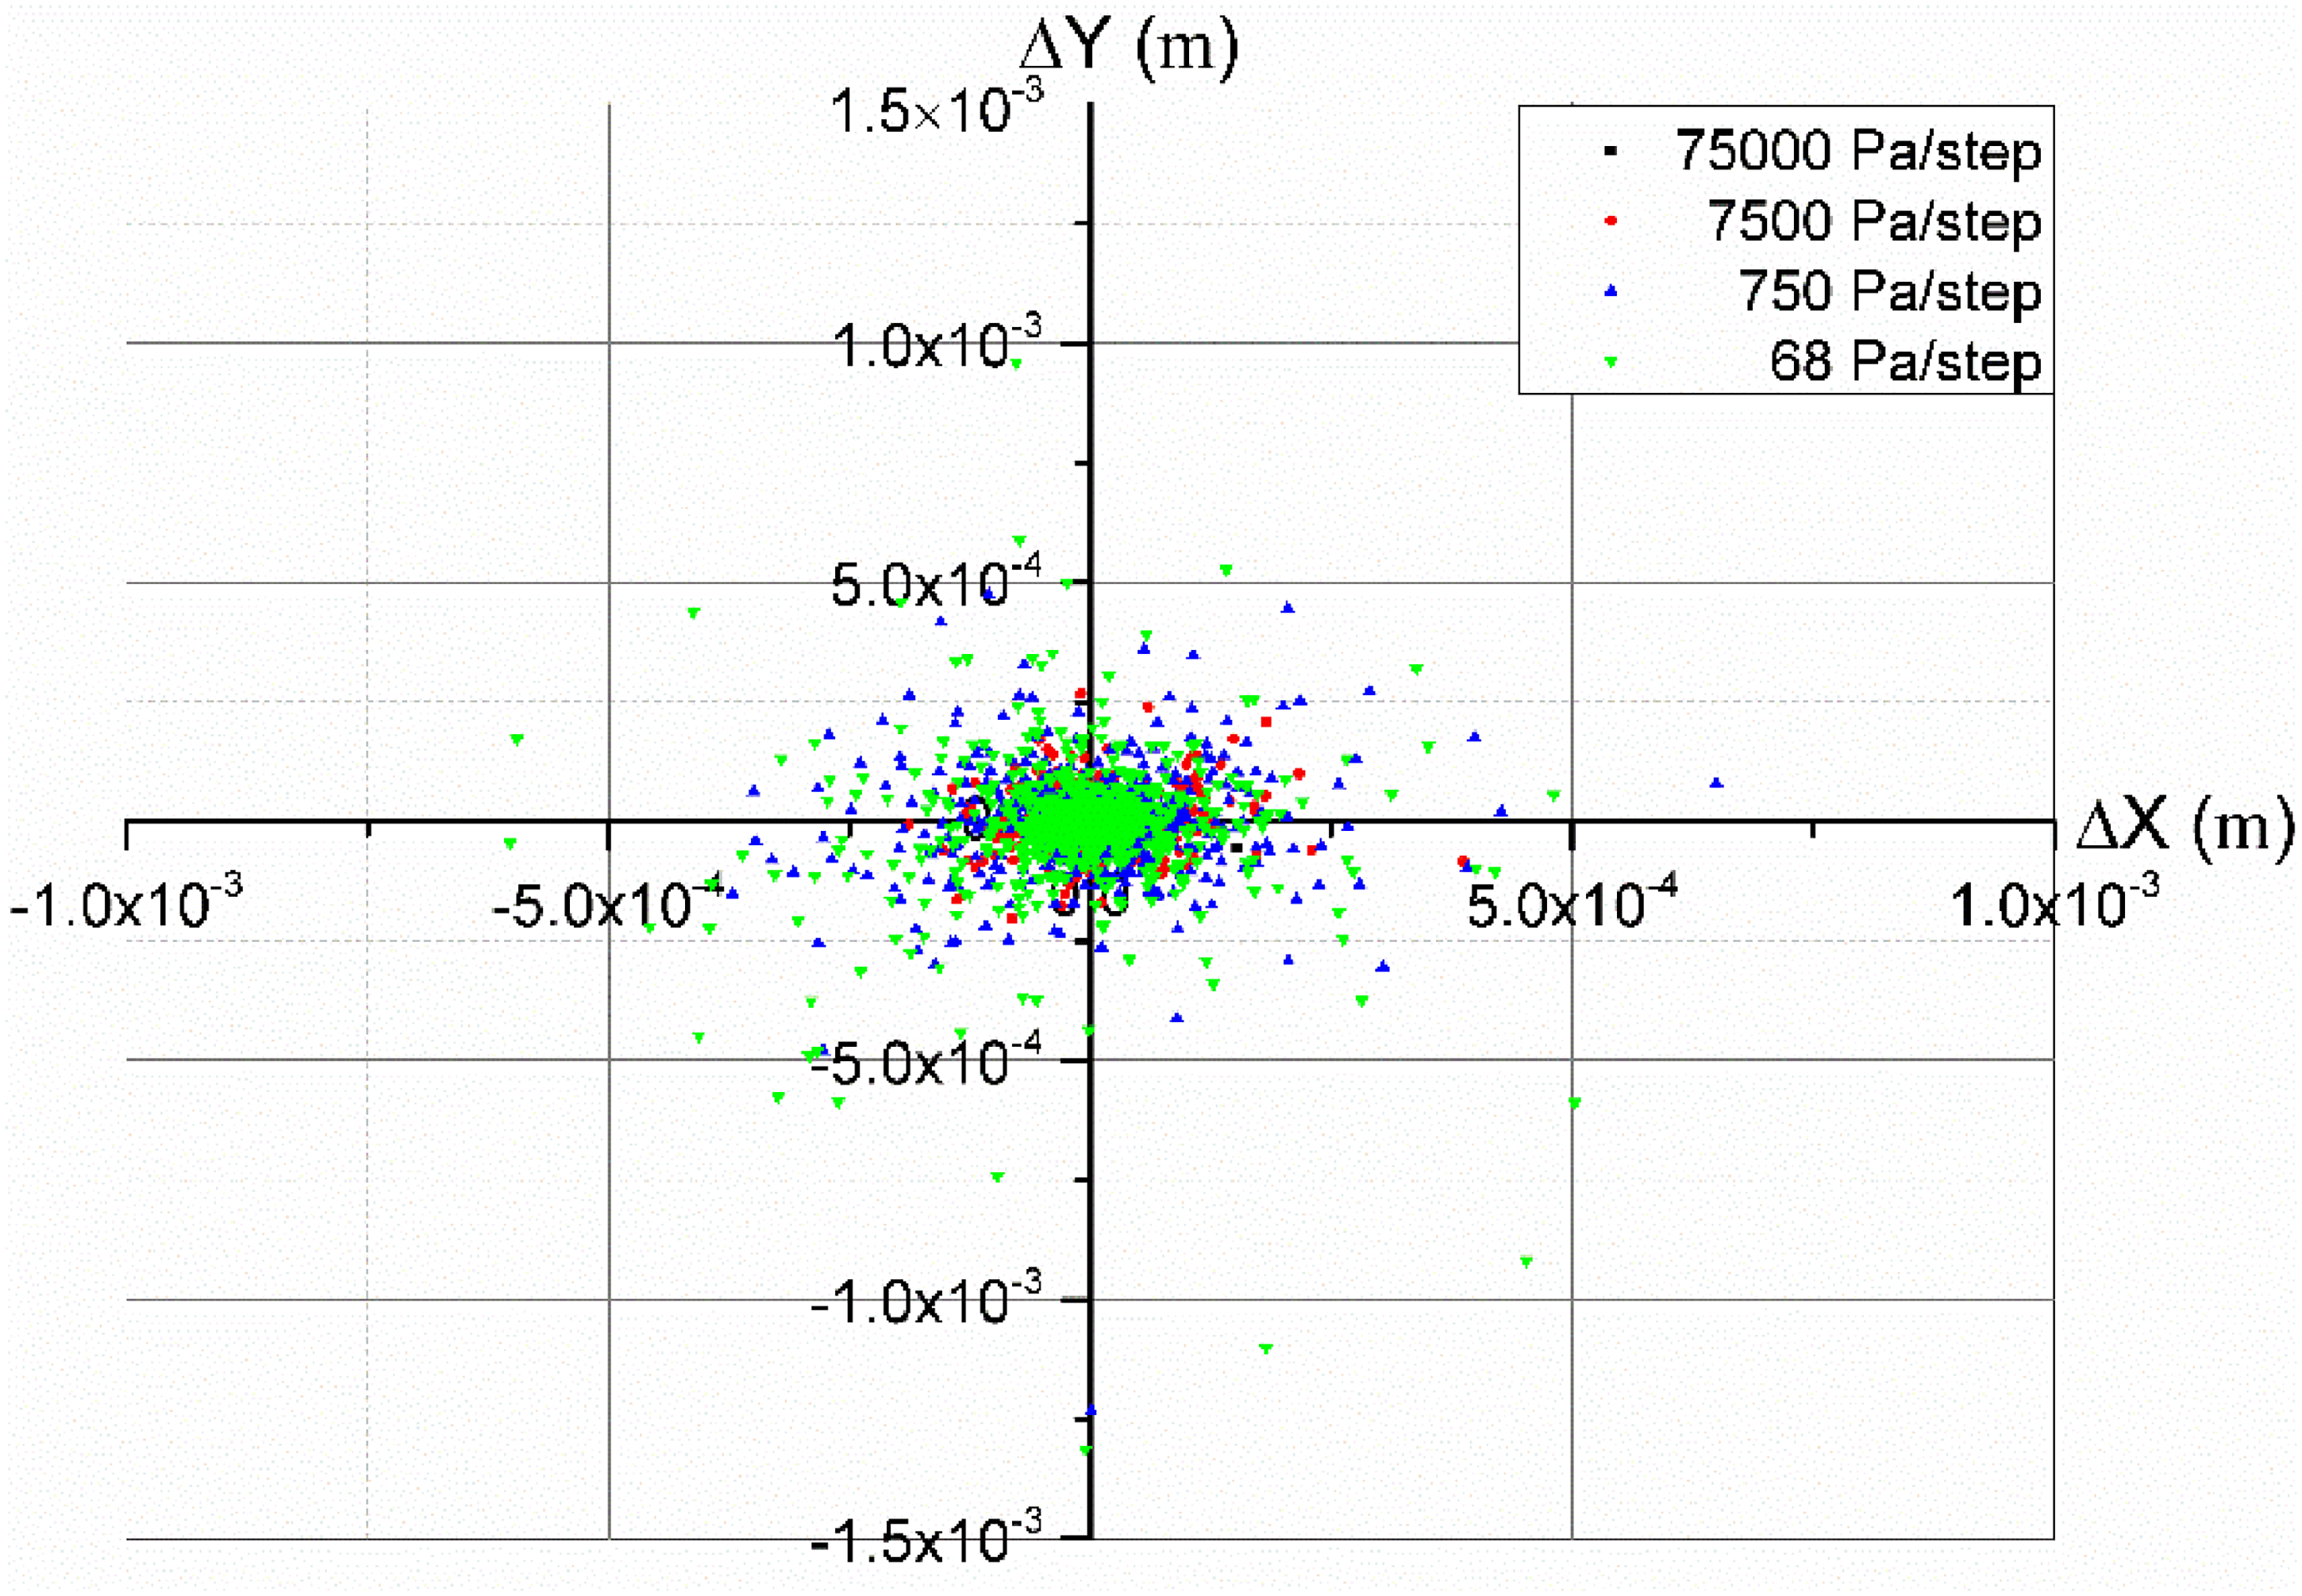
Radial displacement change magnitude of particles.
Although the particle displacement magnitudes do not significantly alter the spatial distribution of particles across the four rates, the results suggest that the unloading rate plays a critical role in controlling particle rearrangement, leading to variations in strain responses. To investigate this, we randomly extracted the spatial locations of identical particles at the final state for each rate. As shown in Figure 11, the medium rate induces the most pronounced strain response and particle displacement magnitude, corresponding to the relatively higher degree of damage and failure. In contrast, the low rate appears to limit the extent of rock damage. The subtle variations in particle locations across all four rates indicate that particle rearrangement is influenced by the unloading rate. Specific ranges of unloading rate can induce significant mesoscopic particle rearrangements, which in turn manifest as notable macroscopic strain responses.
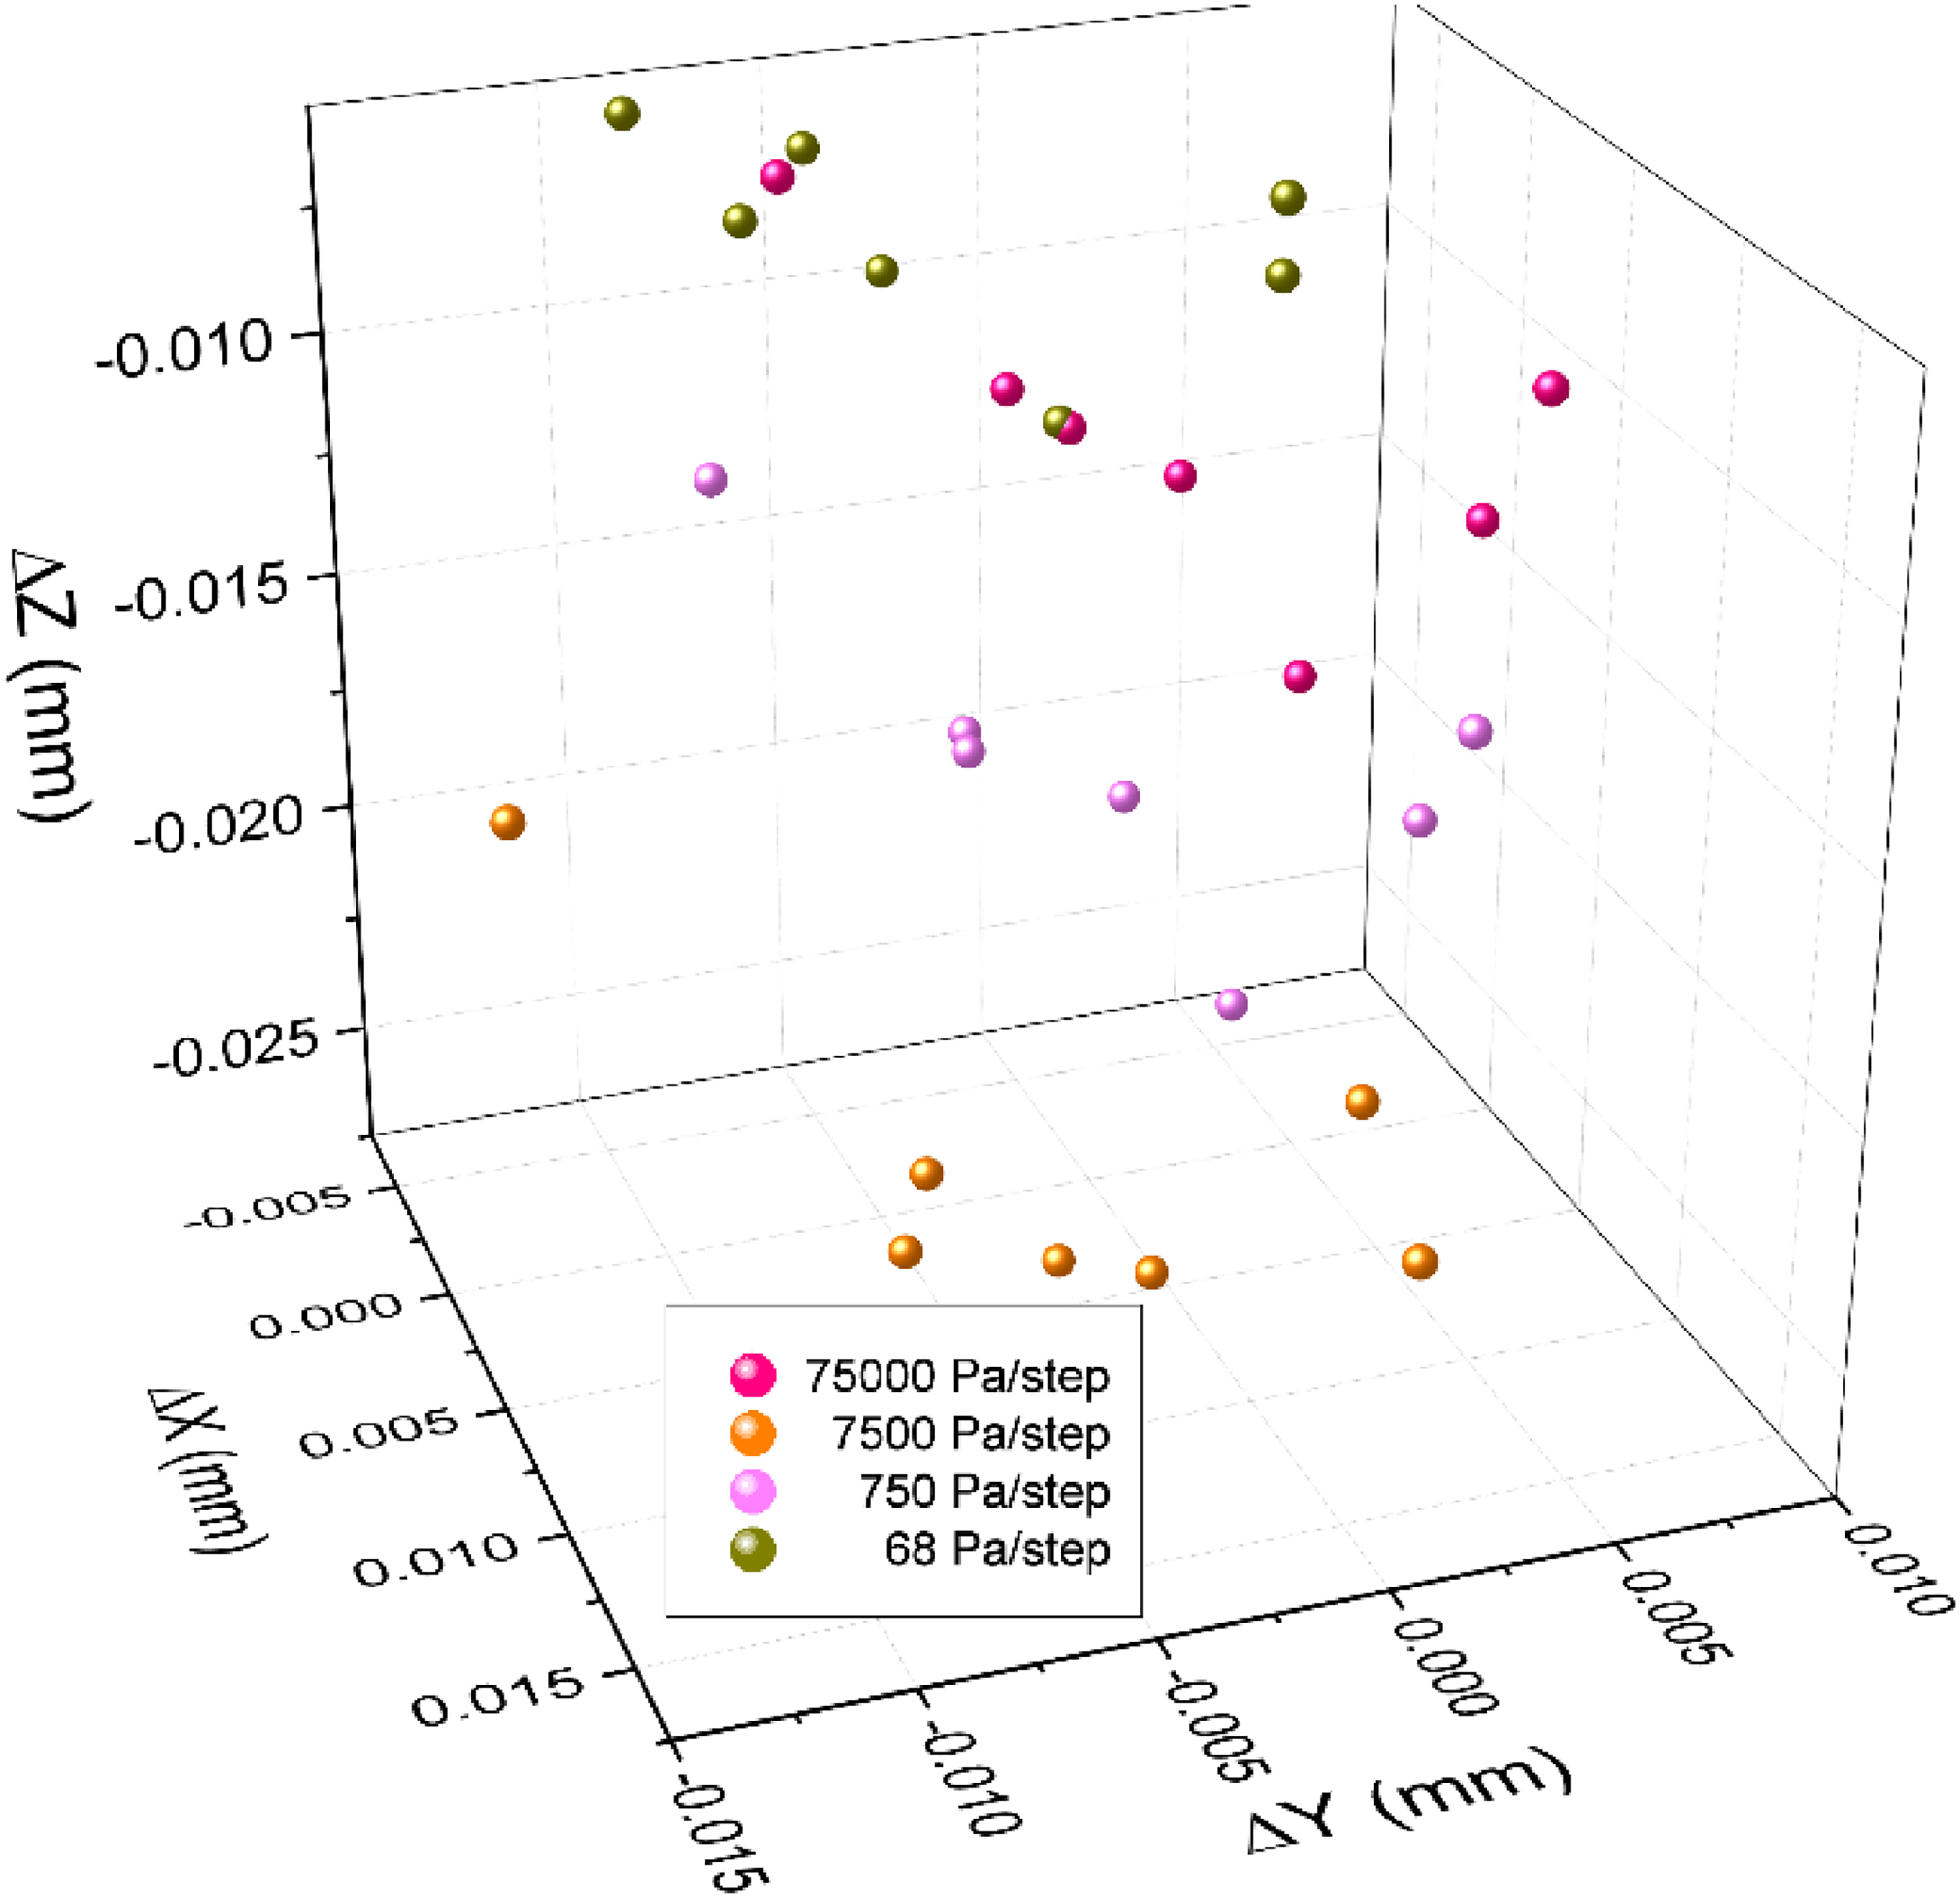
The displacement variation of the seven particles relative to the initial state.
Mesoscopic damage characteristics
Bond failure number characteristics
In all four rates, the number and growth rate of tensile bond failures are significantly greater than those of shear bond failures, with the specimens primarily undergoing tensile failure (Figure 12). The bond failure number increases progressively as the CPU rate decreases, peaking at the medium unloading rate. As the unloading rate decreases further, the bond failure growth pattern transitions from a nearly parabolic increase at high unloading rates to a multistage, stepwise growth. Furthermore, the bond failure number does not increase within each stepwise phase, indicating the accumulation of contact forces within the specimen. Bond failures begin to propagate once the accumulated contact force exceeds the local contact strength. This phenomenon highlights the transition from instability driven by overall rupture propagation at high rate to instability resulting from the accumulation of local ruptures at low rate.
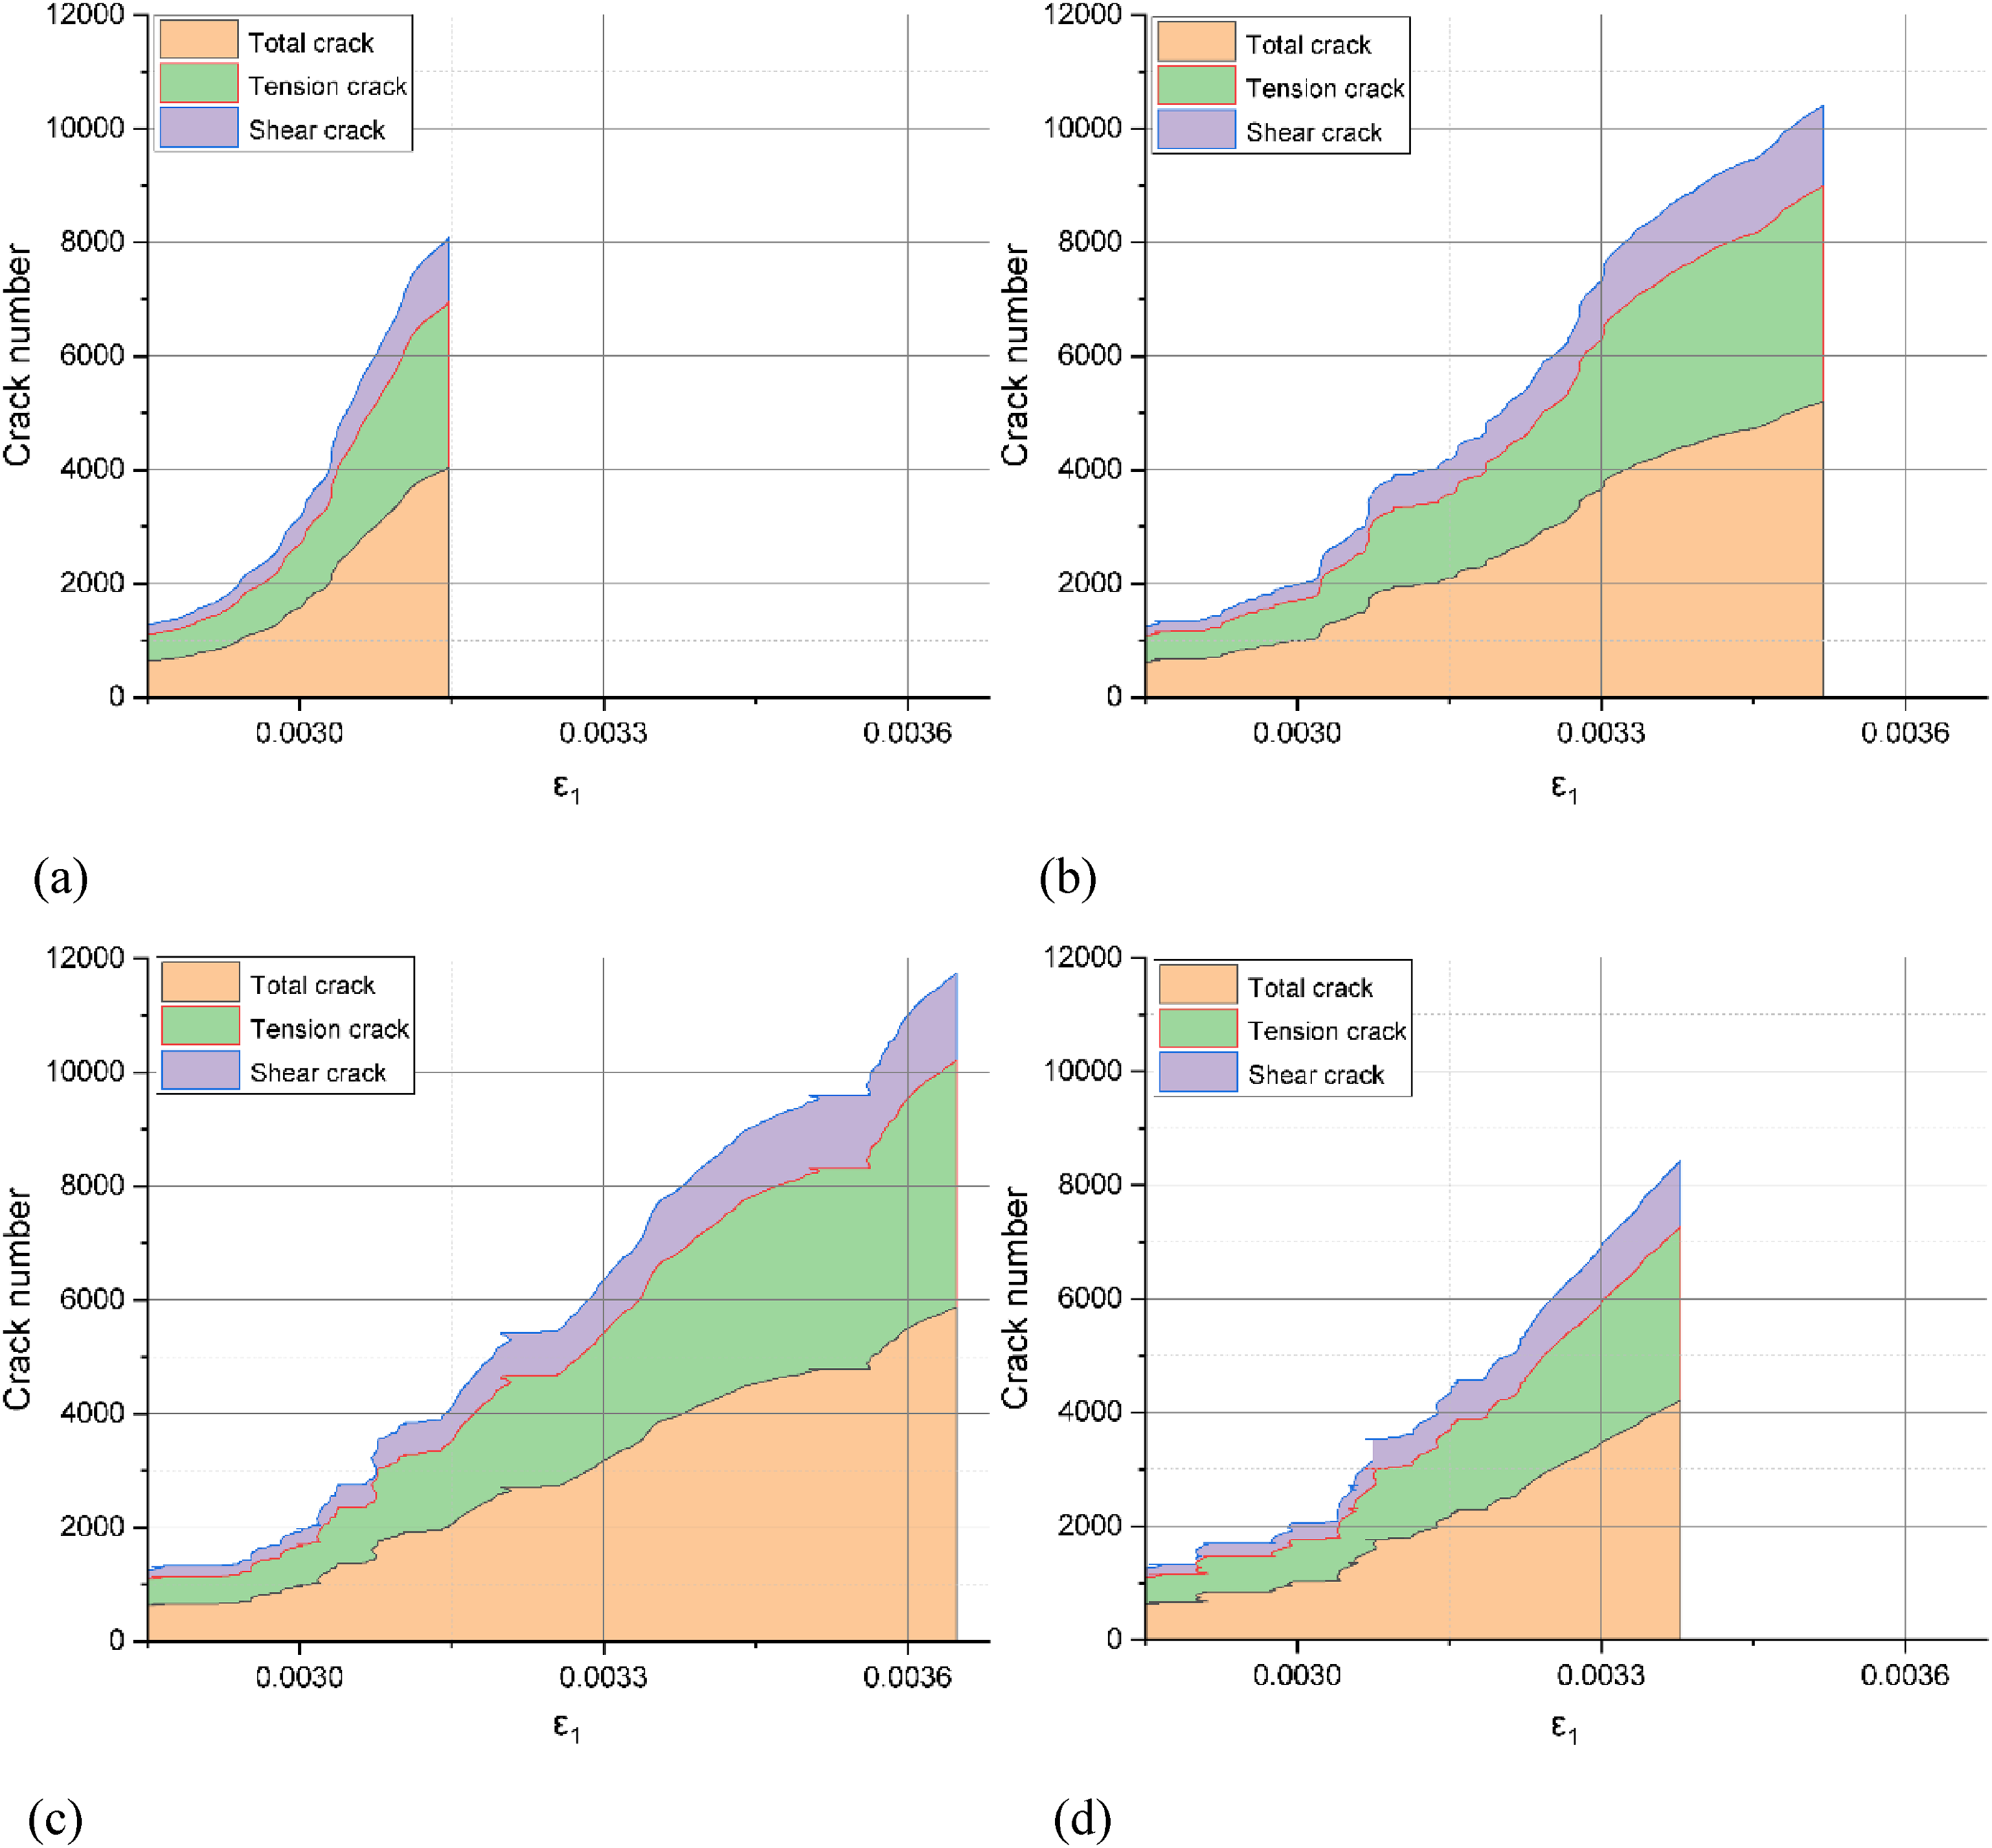
Bond failure number characteristics. (a) The high rate, (b) the medium-high rate, (c) the medium rate, and (d) low rate.
AE event distribution characteristics
AE events can be analyzed using moment tensor theory (Hazzard and Young, 2000, 2002). The bond failure between two particles is considered a microcrack or AE event. Upon bond failure, the contact force changes as a result of particle displacement. The changes in contact forces at all neighboring particle contacts are multiplied by their respective moment arms, and the moment tensor Mij is obtained by summing the contributions from all contacts
However, to improve the computational efficiency, the moment tensor of a single AE event is replaced by the maximum scalar moment value of the moment tensor. The scalar moment M0 can then be expressed as equation (3)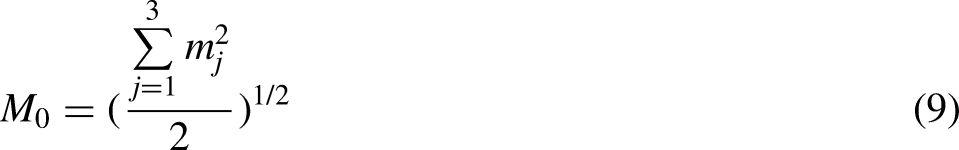
Then, the seismic magnitude M of an AE event can be calculated as equation (4)
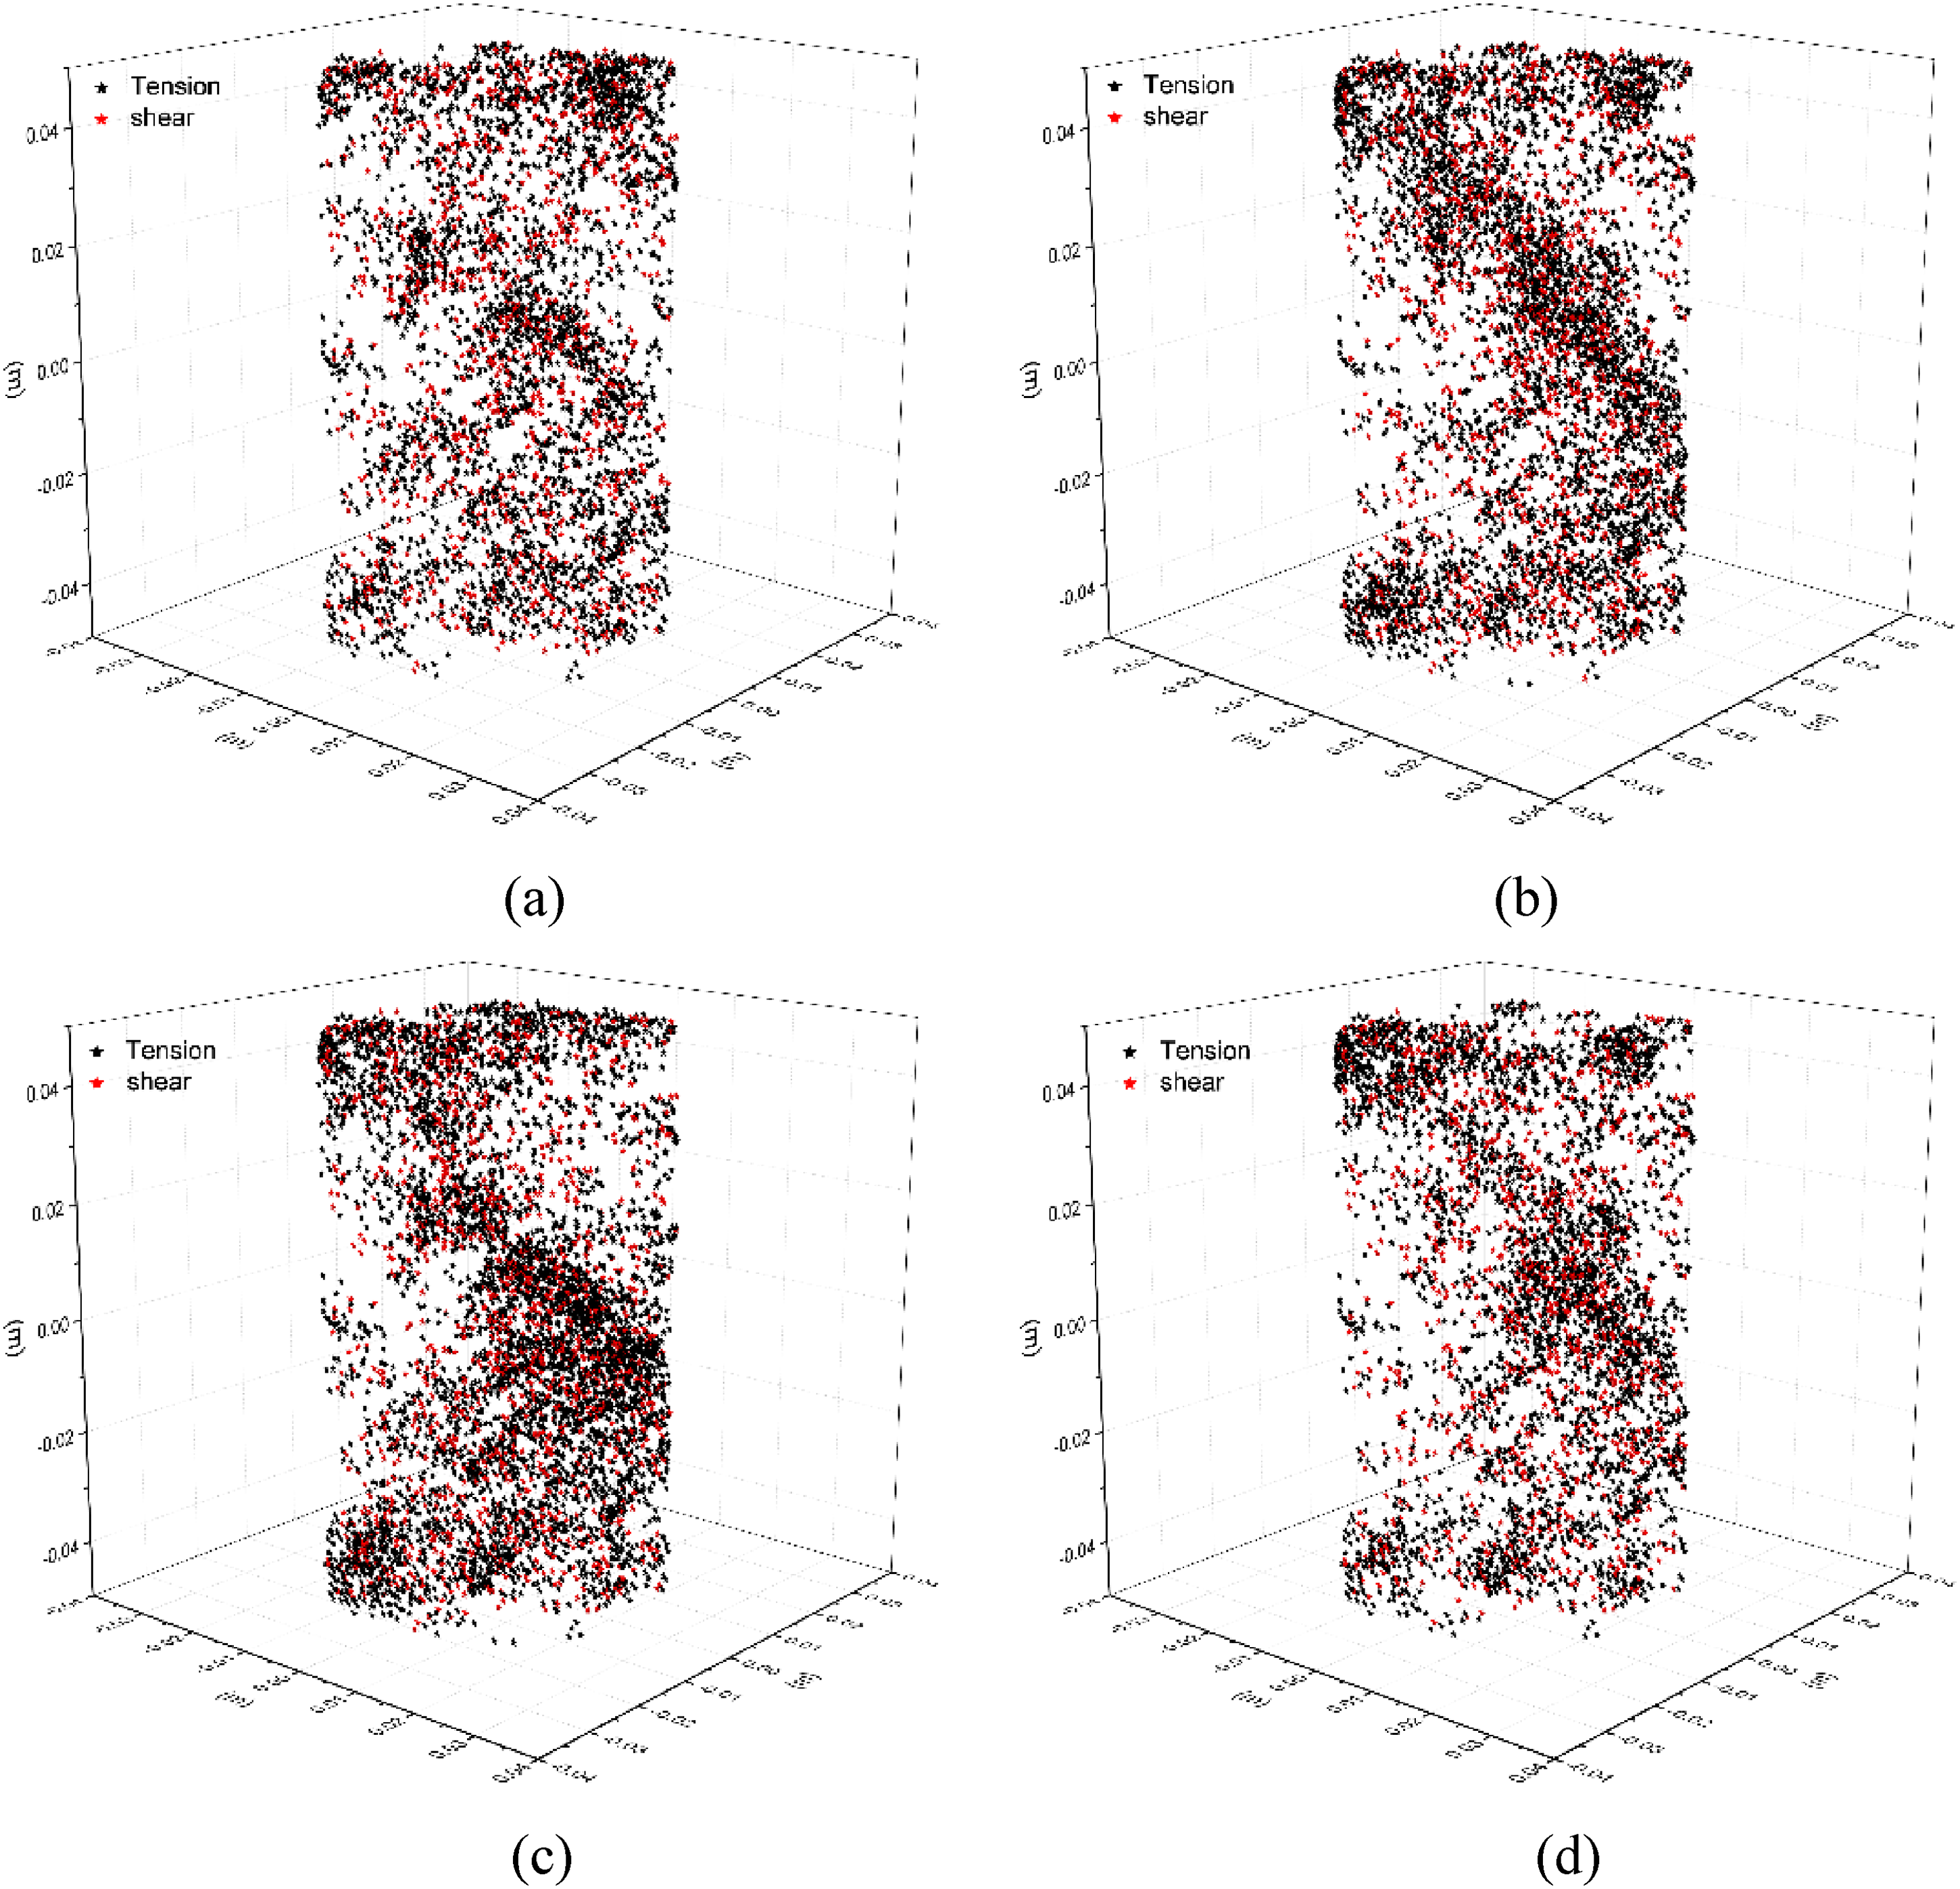
AE event distribution characteristics. (a) The high rate, (b) the medium-high rate, (c) the medium rate, and (d) low rate. AE: acoustic emission.
Relative fracture size and seismic magnitude distribution characteristics
As shown in Figure 14, the center of each sphere represents an individual fracture, and the size of the sphere corresponds to the spatial extent of the fracture. All fracture spatial extensions are scaled by the same factor. The red spheres indicate that the number of fractures formed by an AE event varies across four unloading rates but remains relatively uniformly distributed throughout the specimen. As the number of AE events required to form a fracture increases, particularly for fractures formed by more than 20 AE events, the fracture distribution becomes increasingly uneven as the unloading rate decreases, with the most significant variation observed at the medium unloading rate. In all four rates, fractures formed by more than 20 AE events are primarily located in regions with relatively high seismic magnitudes.
Relative fracture size distribution characteristics. (a) The high rate, (b) the medium-high rate, (c) the medium rate, and (d) low rate. AE: acoustic emission.
As shown in Figure 15, at the low unloading rate, two fractures are formed by 228 and 496 AE events, with a difference of 268 AE events; yet, their seismic magnitudes remain comparable. This suggests that the low unloading rate promotes the greatest extent of rupture propagation and a more uniform distribution of AE energy. The seismic magnitude of the fracture formed by 496 AE events does not increase proportionally with the number of AE events. Additionally, at medium rate, fractures formed by more than 75 AE events exhibit relatively small fluctuations in seismic magnitude, with values centered around −5.5. This indicates that the medium unloading rate suppress the increase in both fracture size and seismic magnitude.
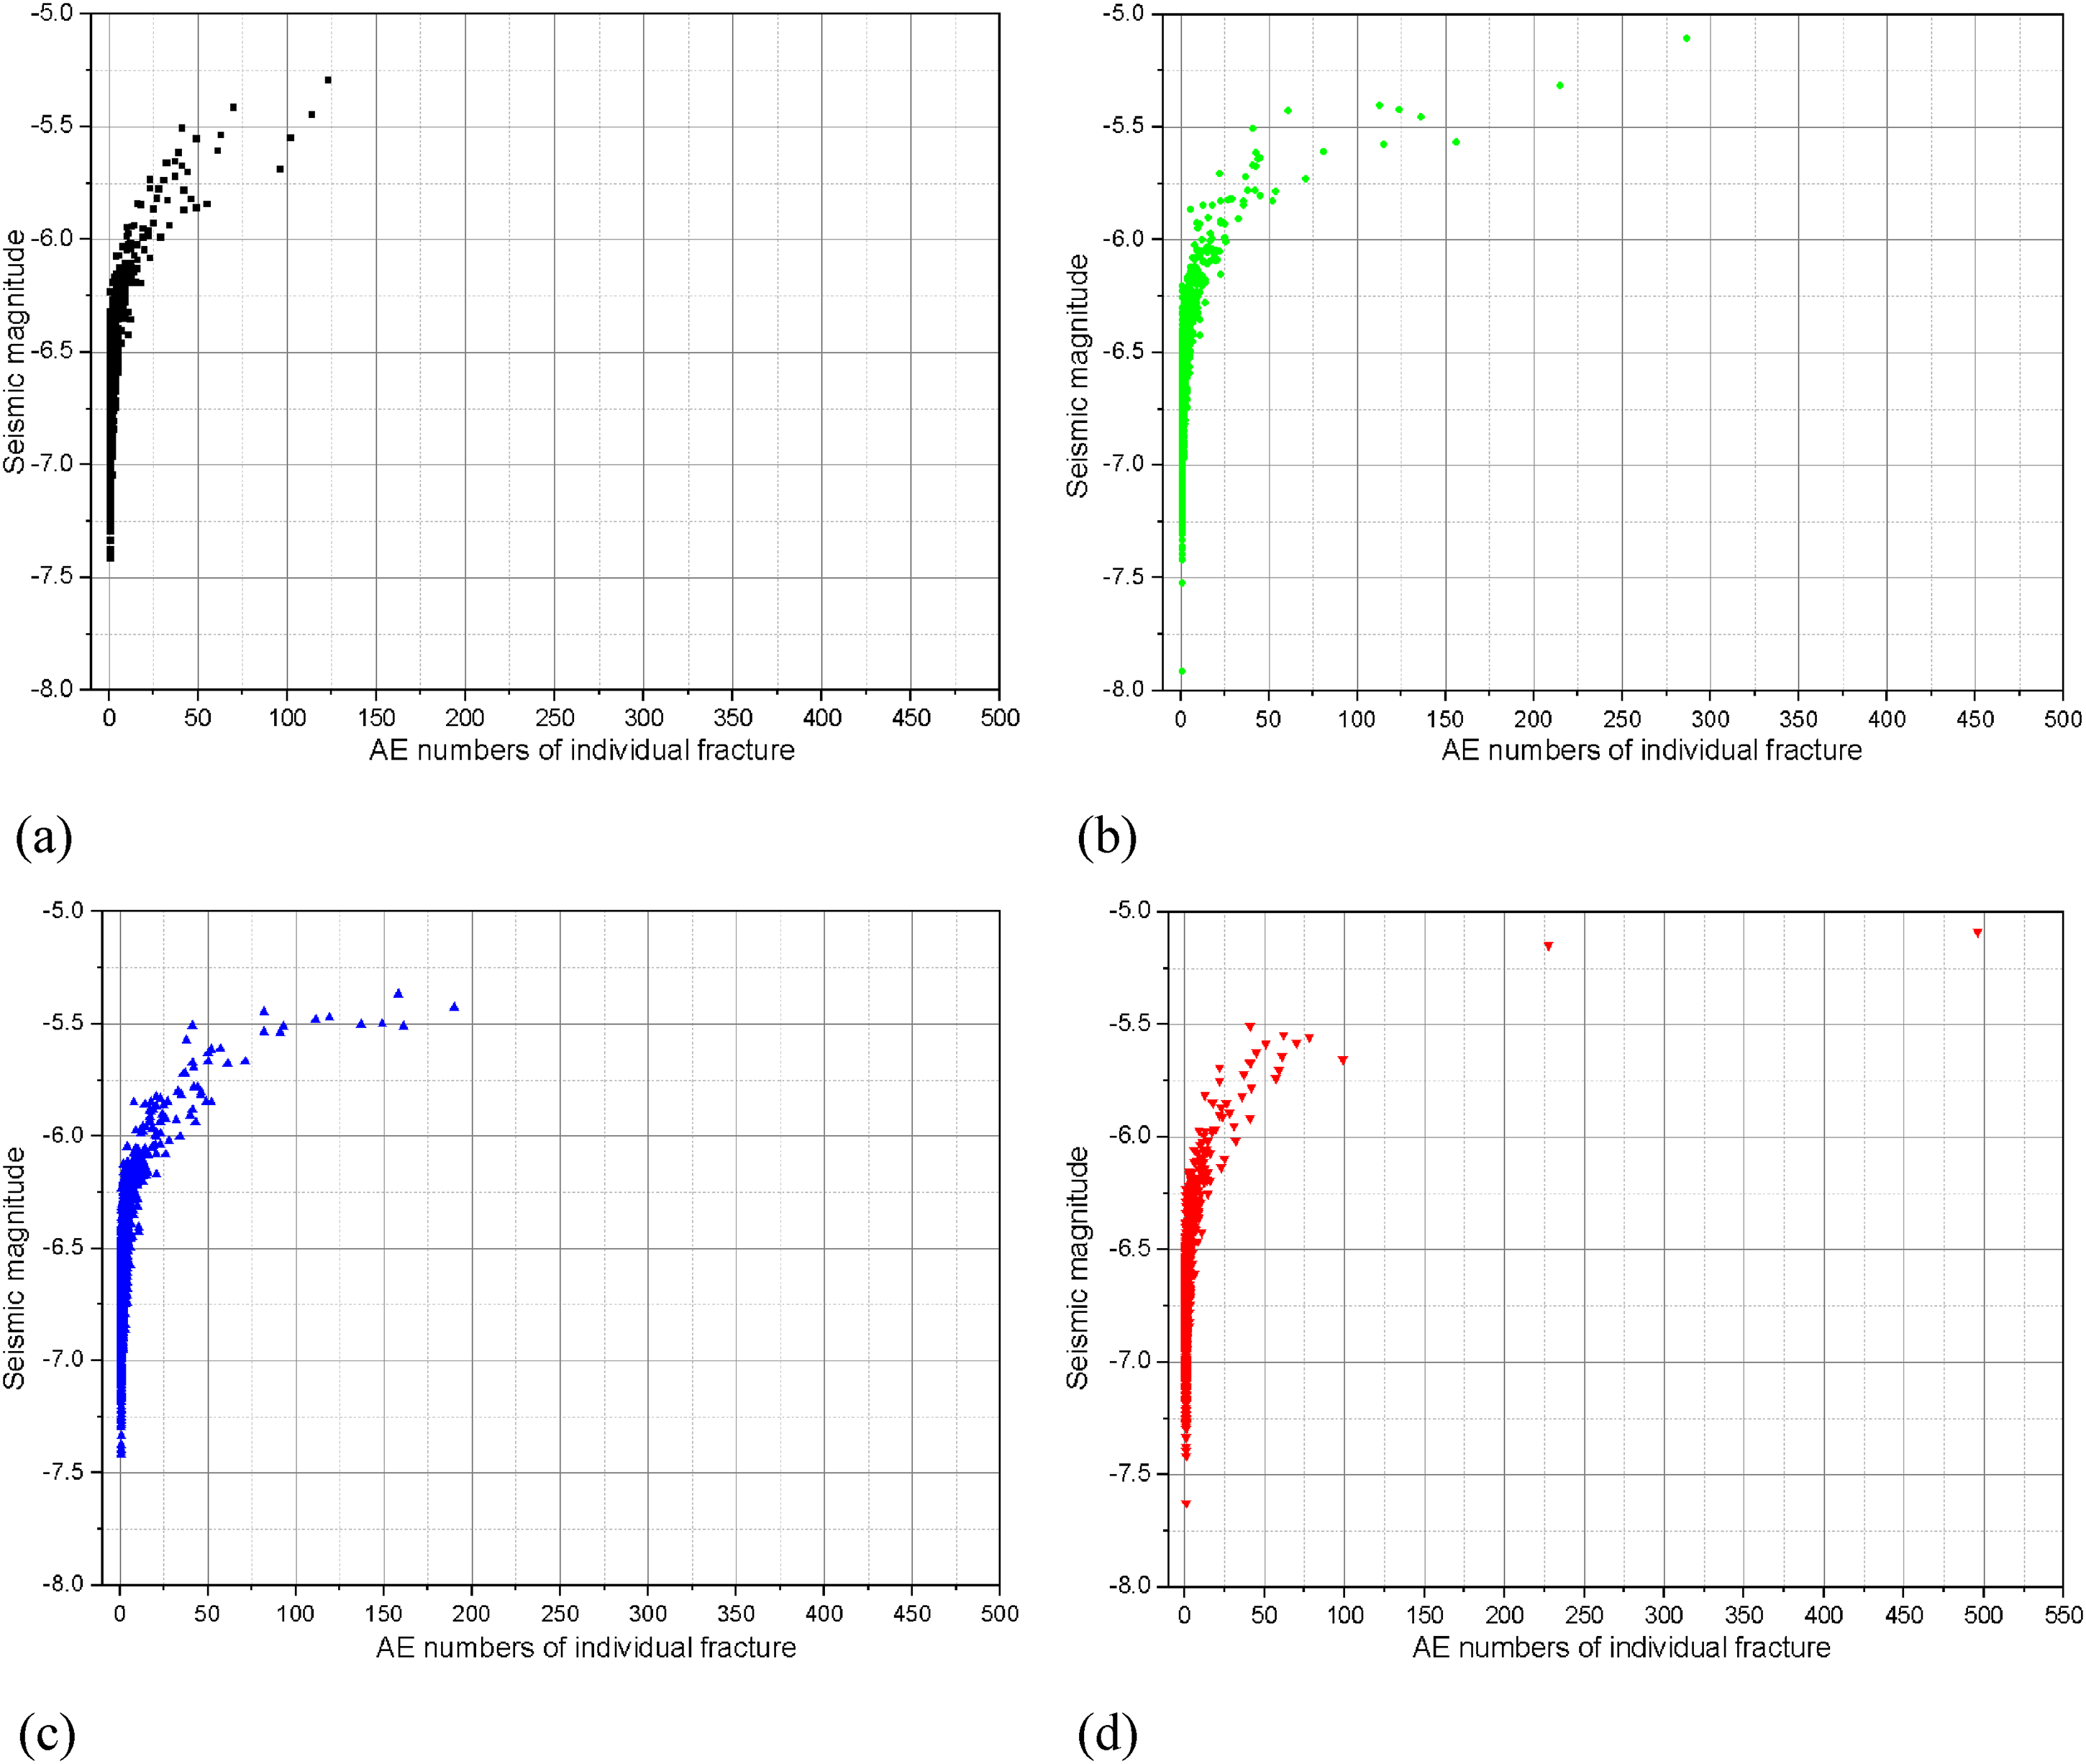
Fracture seismic magnitude distribution characteristics. (a) The high rate, (b) the medium-high rate, (c) the medium rate, and (d) low rate.
Energy density evolution characteristics
During the test, the loading boundaries at both ends and the side surfaces of the specimen input energy, most of which is stored as strain energy in the contact model components, while the remainder is dissipated as energy through particle bond failure, friction, and displacement. The three energy densities represent the input, storage, and dissipation of energy, respectively. As shown in Figure 16, at high unloading rates, the strain energy density decreases, indicating that the stored strain energy is rapidly dissipated. In contrast, at the other three rates, all three energy densities increase throughout the unloading process, suggesting simultaneous energy storage and dissipation. The energy densities increase in a stepwise manner at medium-high, medium, and low unloading rates, reflecting the sudden rupture of the specimens, which induces instantaneous deformation and a rapid increase in the input energy density at the loading boundary. This results in corresponding increases in strain energy and dissipated energy densities.
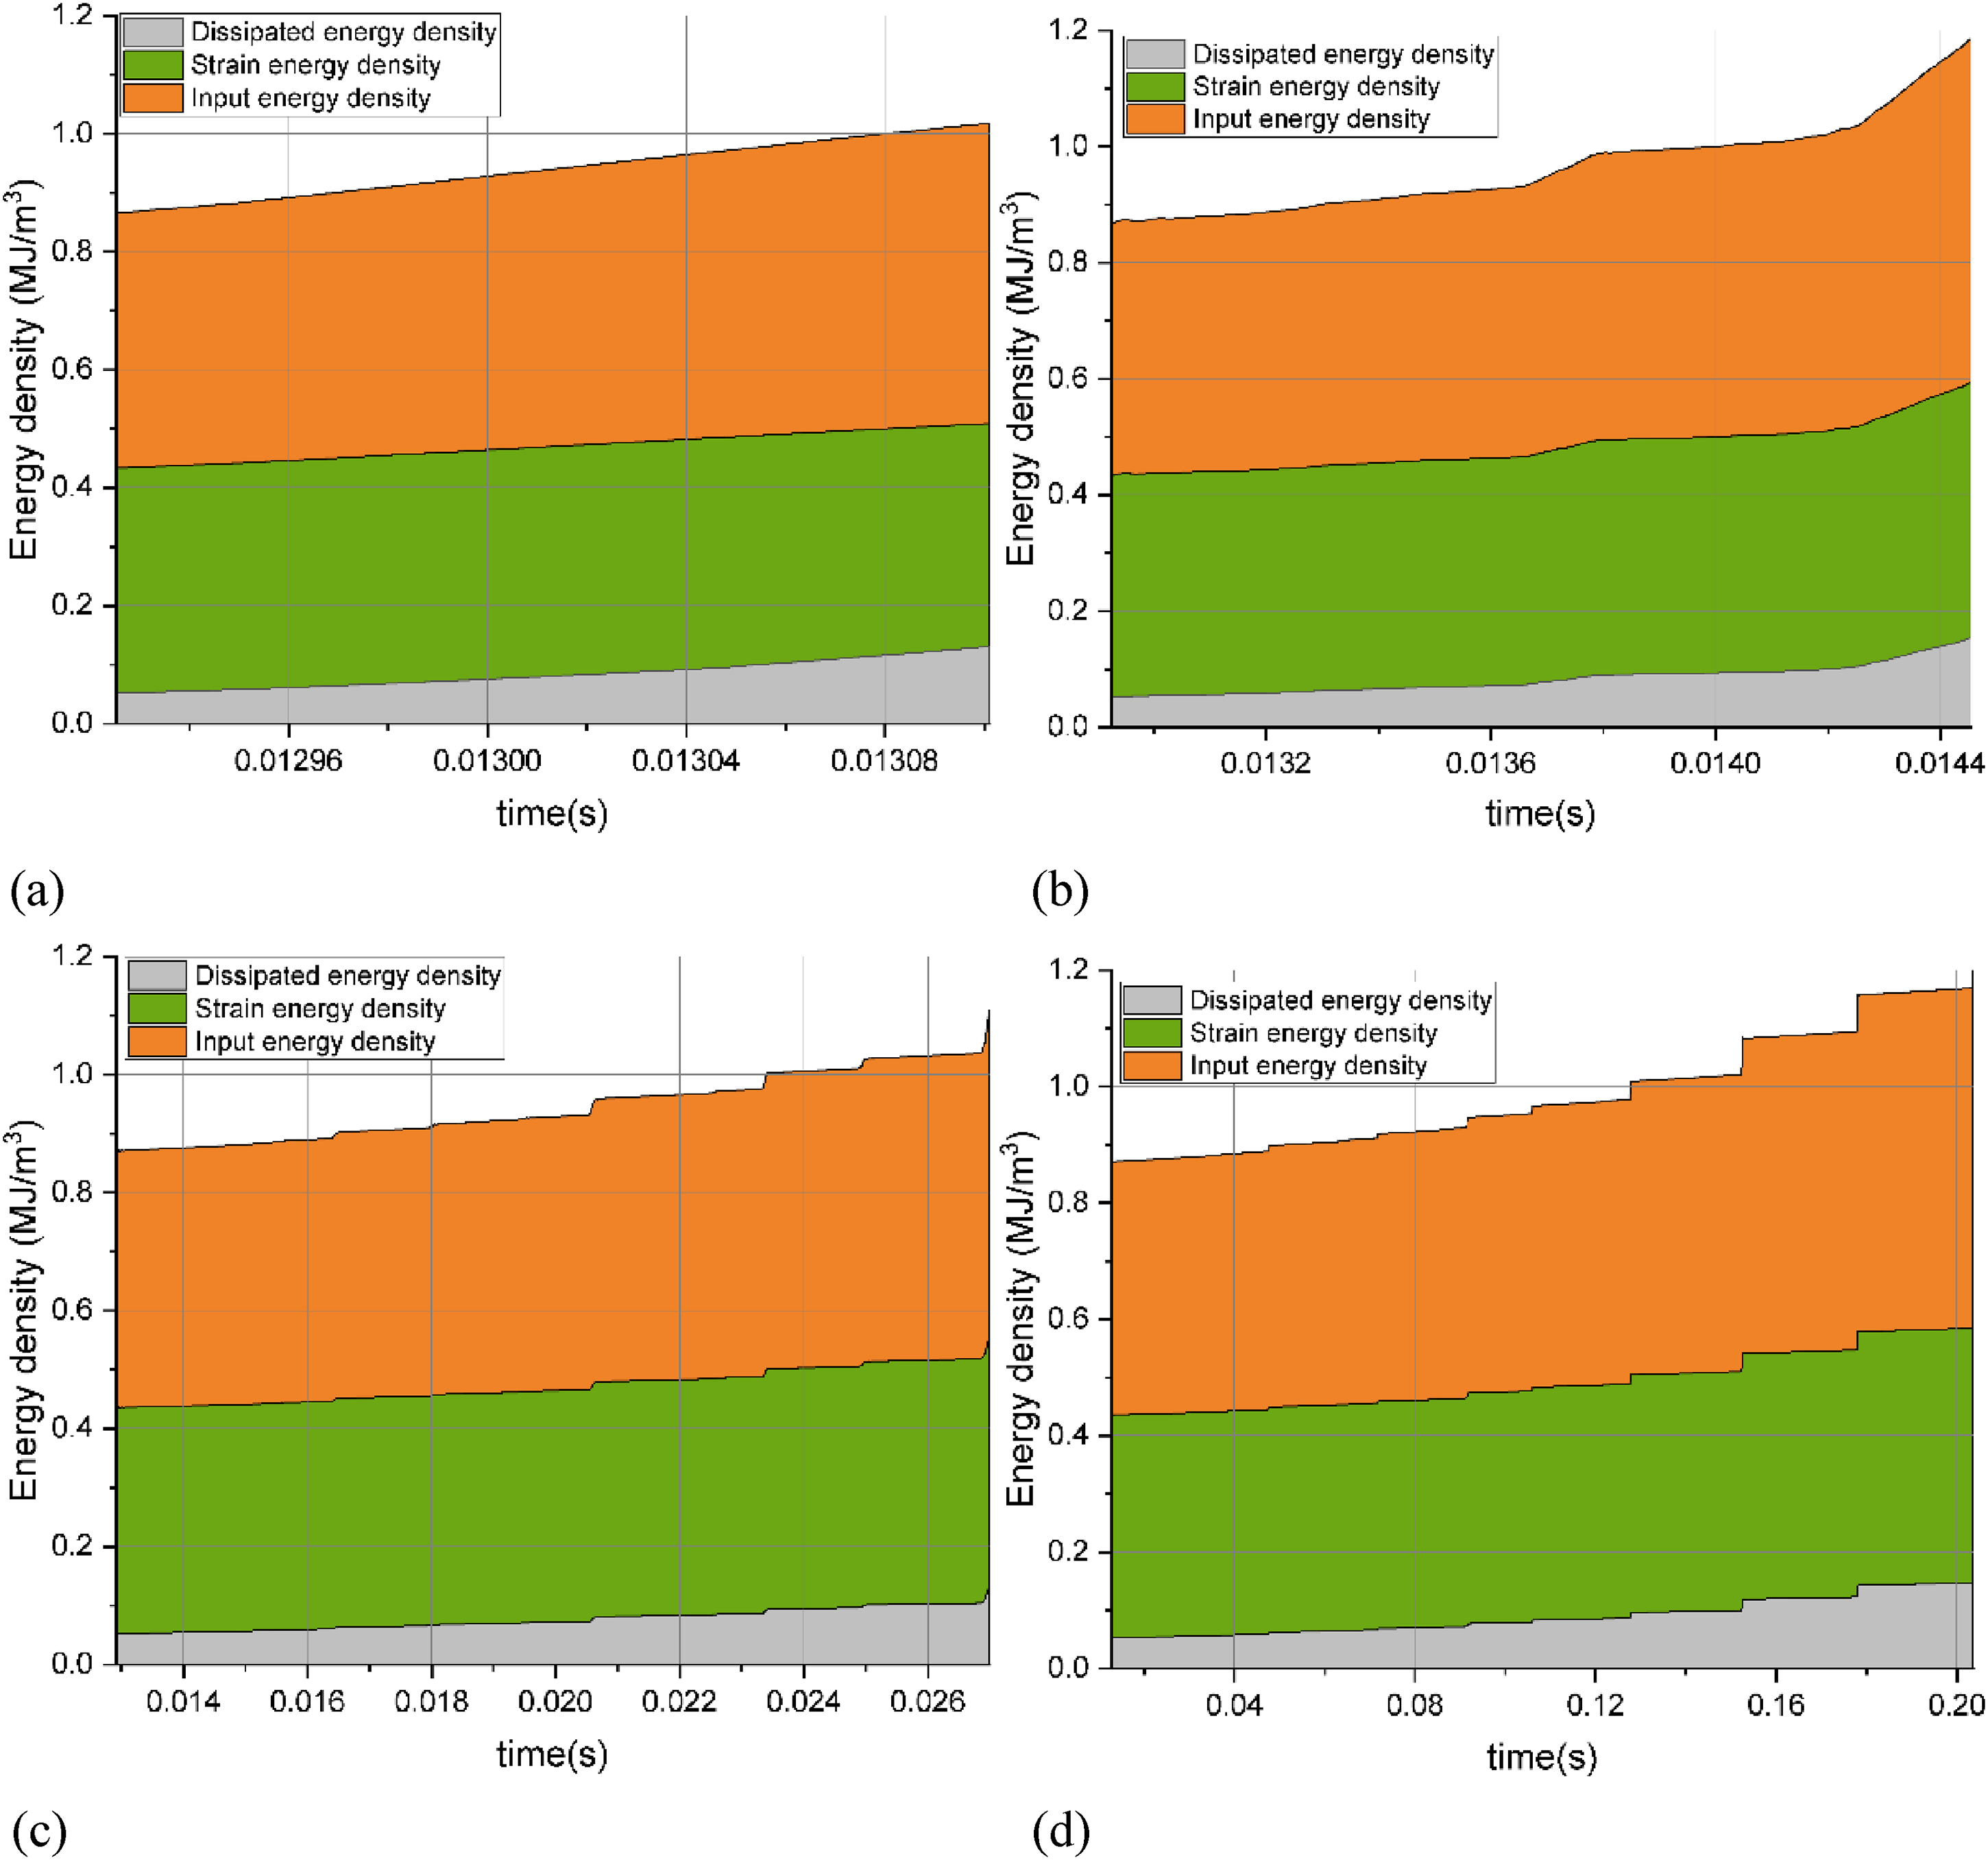
Energy density change characteristics. (a) The high rate, (b) the medium-high rate, (c) the medium rate, and (d) low rate.
As shown in Figure 17, the results are plotted on the same coordinate system, with each energy density curve representing the data for four rates. Each type of energy density curve represents, from left to right, high, medium-high, medium, and low unloading rates. At the high rate, the strain energy density curve appears as a short, nearly vertical line. As the unloading rate decreases from high to low, the rate of change in the three energy densities gradually decreases. The high unloading rate induces a rapid surge in energy density within a short period, while the low unloading rate provides the specimen with relatively sufficient time to change energy density in a stepwise manner. Interestingly, the three energy densities increase at the end of each test, except at the medium unloading rate. At the medium rate, the energy densities at the end of the test are between those of the high and medium-high rates, indicating that the medium rate suppresses the increase in energy density.
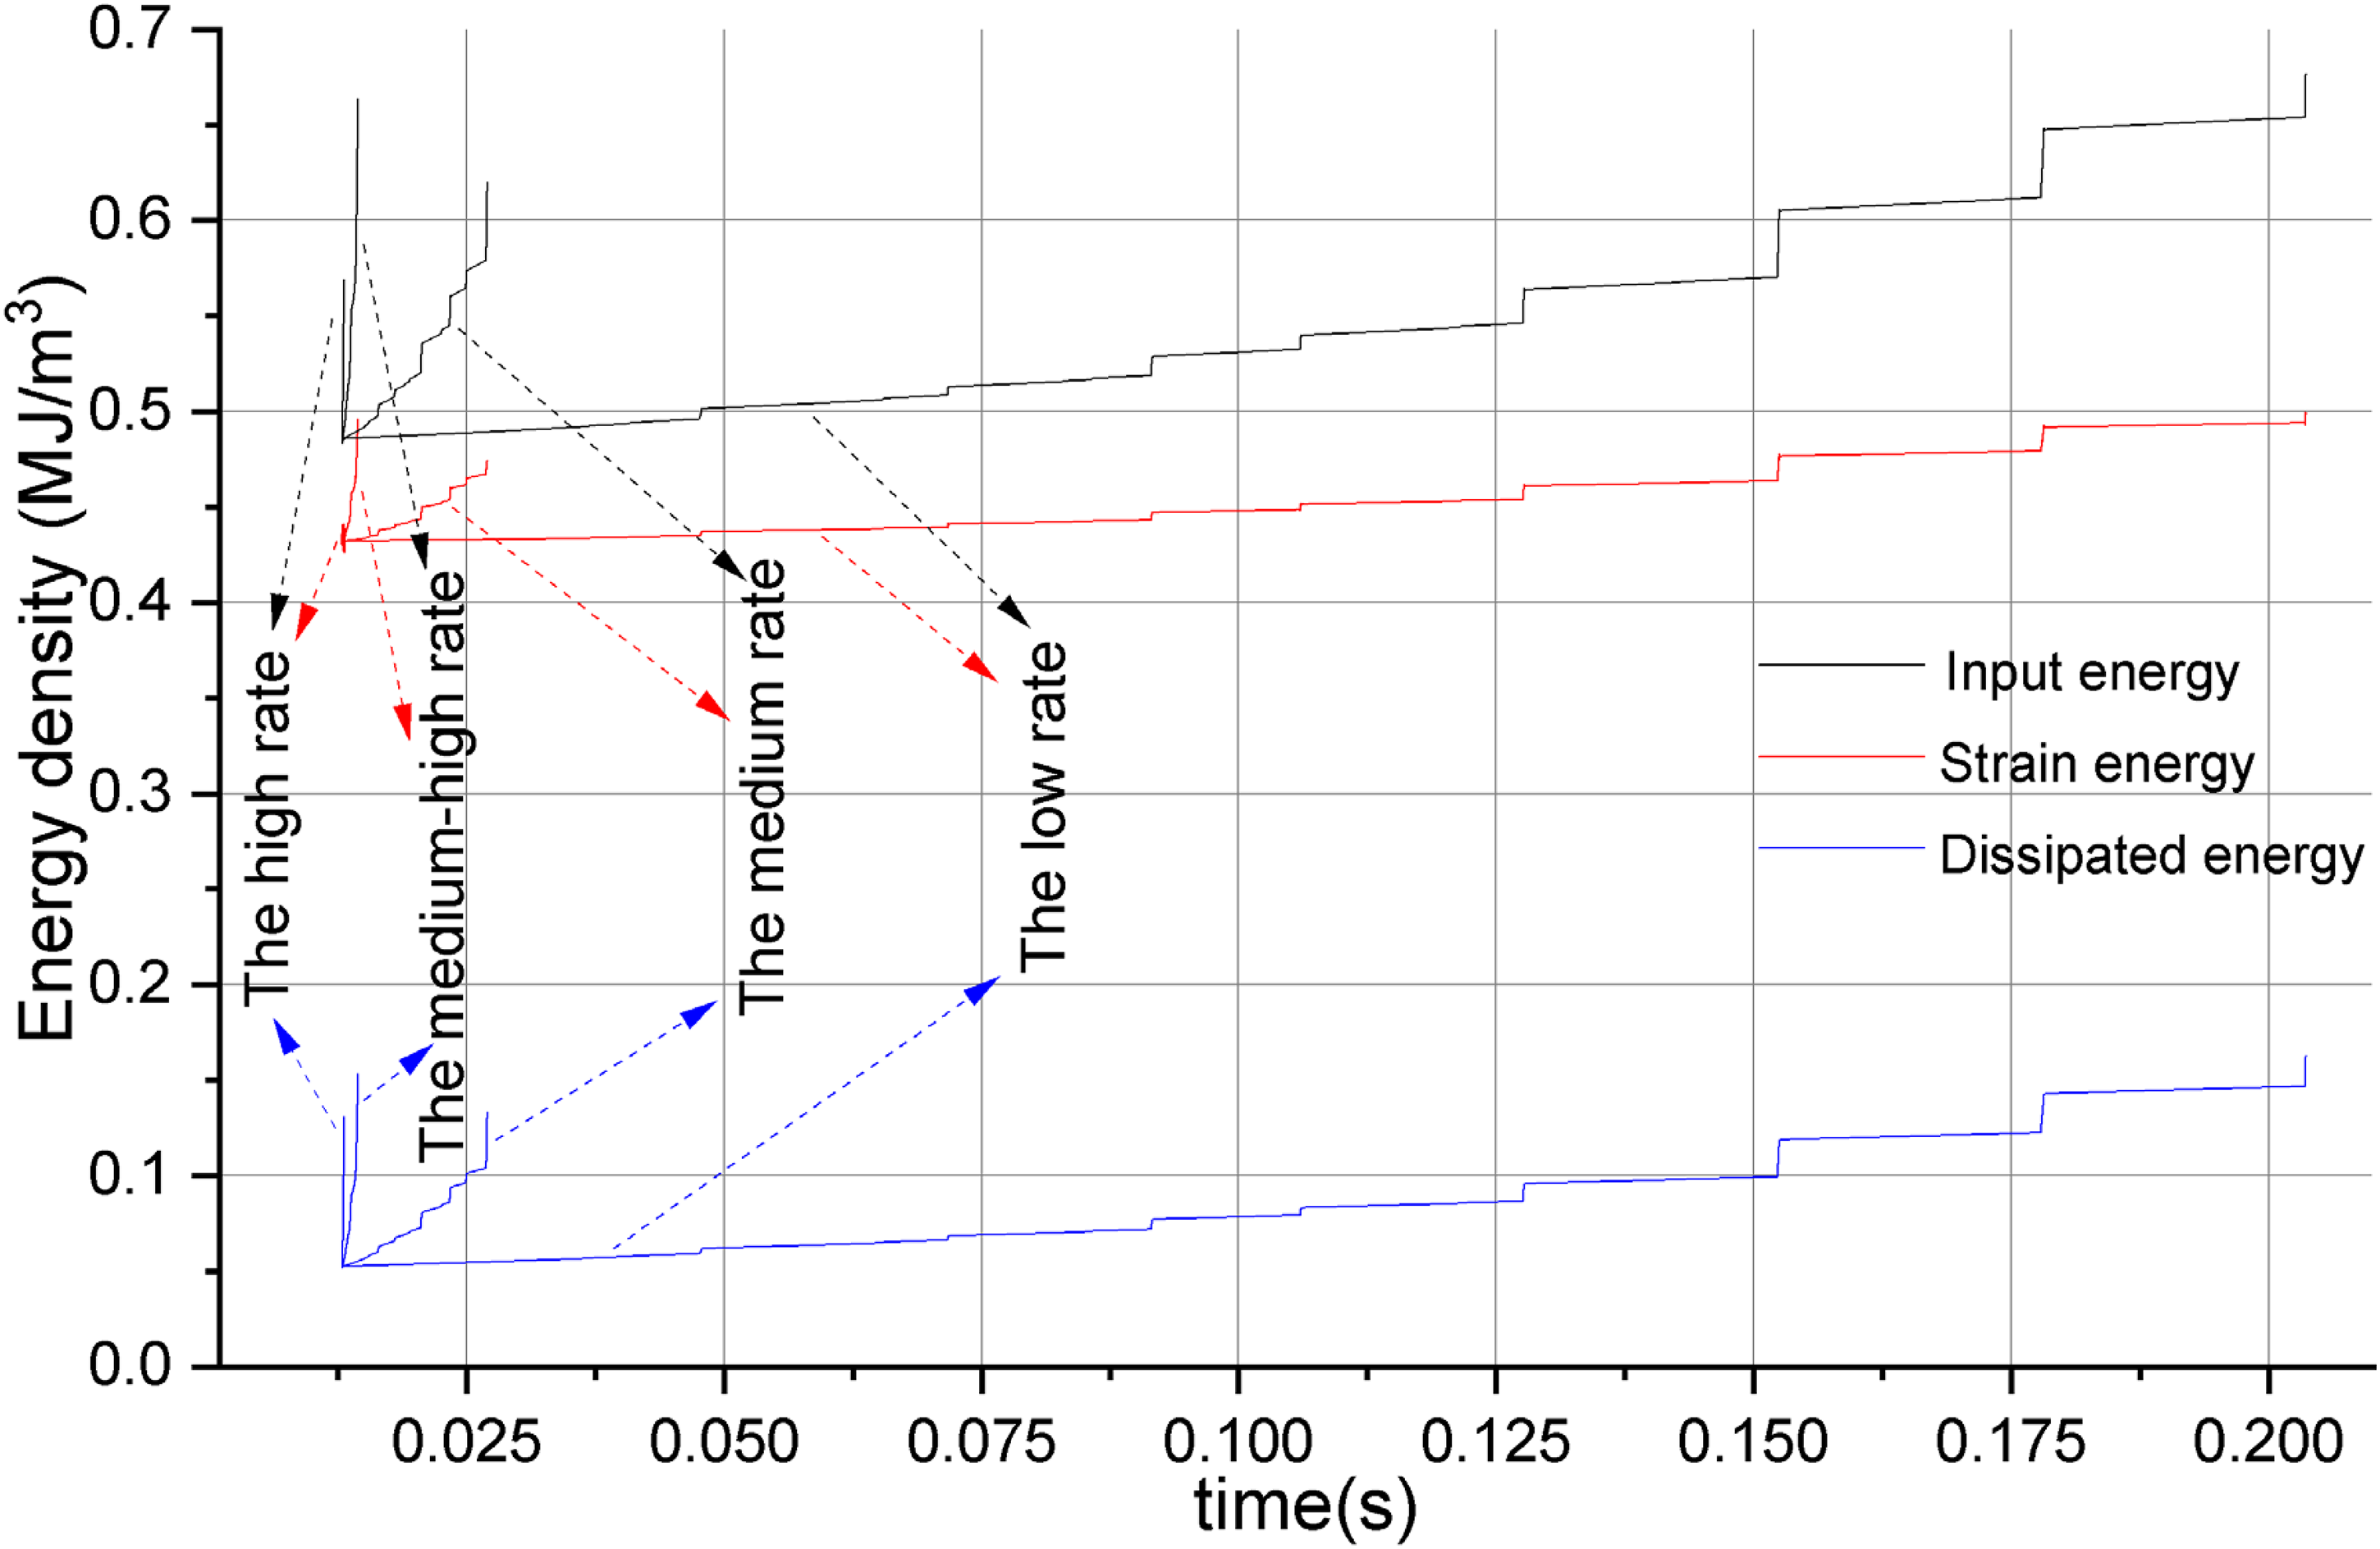
Comparison of energy density characteristics at four rates.
Discussion
Results comparison with physical experiments
Consistency
The work highlighted the significant influence of unloading rate on rock fracture patterns and strain energy storage (Hua and You, 2001; Li et al., 2015; Li et al., 2017; Zhao et al., 2018), which is consistent with the findings presented in the Bond failure number characteristics and AE event distribution characteristics sections. Similarly, existing research (Chen et al., 1979; Duan et al., 2019; Xu and Geng, 1986) demonstrated that specimens exhibit greater dilatancy in the unloading direction, a trend corroborated by the results in Strength and deformation characteristics. Furthermore, Ling and Liu (1998) identified that the unloading damage failure mode of rocks manifests as sudden instability, which aligns with the observations presented in Figures 6 and 12. Huang and Huang (2010) and Hao et al. (2022) suggested that unloading-induced rock failure typically results in lateral tensile failure, a phenomenon also observed in the numerical model, as shown in Figures 6 and 7. Additionally, Qiu et al. (2010) proposed that specific CPU rates could induce significant deformation, a finding consistent with the observation that strain response at the medium rate is most pronounced (Figures 7 and 11). The consistency between the numerical model and existing physical experimental results confirms the validity of the mesoscopic parameters used in the simulations.
Difference
Huang and Huang (2010), as well as Qiu et al. (2010), suggested that rock strength increases with the increase in CPU rate. However, numerical results demonstrate that the ultimate load-bearing capacity of the numerical specimens reaches its maximum at the low unloading rate. Specifically, the peak partial stress of specimens with identical contact model types and parameters under the four rates shows an increasing trend, which can be attributed to the effect of varying CPU rates on particle interactions.
Makse et al. (2000) proposed the concept of the participation number to quantitatively characterize the localization of dense packing arrangements. This number reflects the degree of disorder in particle arrangements and indicates the homogeneity of contact forces. As shown in equation (11)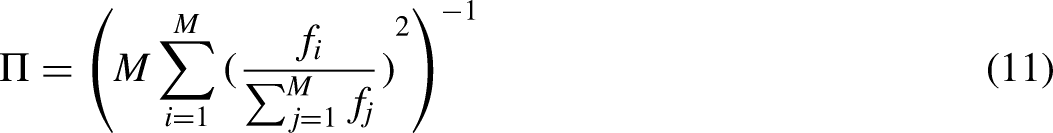
The participation numbers for the peak deviatoric stress state at the four unloading rates, ranked from high to low, are calculated as 0.516, 0.532, 0.541, and 0.554, respectively. The values exhibit an increasing trend, indicating that as the unloading rate decreases, the orderliness of particle arrangements and the homogeneity of contact forces improve. With a decrease in the CPU rate, the contact stresses are more effectively redistributed across the particles, owing to the extended time available for stress adjustment. As a result, the load is progressively transferred from the entire specimen to localized regions, allowing more particles to participate in stress redistribution, which in turn enhances the ultimate load-bearing capacity. However, natural weak surfaces with varying strengths exist within real specimens, resulting in an uneven distribution of bearing capacity.
The tests employ numerically homogenized specimens to investigate the micromechanical damage and fracture mechanisms of sandstone under the influence of CPU rate as the sole variable, under strictly controlled initial and boundary conditions. The numerical simulations captured more detailed fracture information and finer details compared to physical experiments. Notably, it was observed that the ultimate bearing capacity of the specimens continuously increased as the CPU rate decreased, which contrasts with the conclusions of existing physical experiments. The results also confirm that specific CPU rates can induce unique strain phenomena. These finding serves as a valuable supplement and refinement to the current understanding.
Conclusions
Based on the conditions defined in this study, the following conclusions can be drawn:
The local load-bearing capacity of the specimens increases as the CPU rate decreases, resulting in a corresponding rise in overall load-bearing capacity. The fracture density is highest at the medium unloading rate, and both axial and radial strain responses are more pronounced compared to the other rates. The number and growth rate of tensile bond failures significantly exceed those of shear bond failures across all four rates. At the medium unloading rate, the increase in seismic magnitude and individual fracture size are suppressed. As the unloading rate decreases, the variation in the three energy densities progressively follows a stepwise pattern, which corroborates the sudden rupture characteristics observed during the unloading process. The rate of change in energy densities gradually decreases, with the medium unloading rate suppressing the increase in energy density at the end state. The low unloading rate facilitates the most efficient stress transfer and distribution, leading to a relatively uniform distribution of AE energy. The consistency between the numerical and physical test results validates the rationality of the mesoscopic parameters in the numerical model. Discrepancies can be attributed to the differences in the material composition heterogeneity between the numerical and physical specimens. The rearrangement of particles leads to variations in mechanical property and strain responses. The degree of particle displacement serves as a metric for quantitatively assessing rock damage. The results underscore the importance of isolating the CPU rate effect to improve the understanding of rock fracturing mechanisms and physical properties. The findings have important implications for engineering practices, highlighting that careful selection of excavation rates can help minimize rock damage and failure.
Footnotes
Acknowledgements
The authors are grateful to all the individuals who contributed to the research. The authors also thank the editors and anonymous reviewers whose comments allowed improving the scientific quality of the research.
Author contributions
Conceptualization and methodology were performed by JZ. Formal analysis and investigation were performed by LG. The first draft of the manuscript was written by KT. Review and editing were performed by WMu and DZ. Funding Acquisition was provided by JZ, LG, and DZ. All authors read and approved the final manuscript.
Data availability
The data used to support the findings of this study are available from the corresponding author upon request.
Declaration of conflicting interests
The authors declared no potential conflicts of interest with respect to the research, authorship, and/or publication of this article.
Funding
The authors disclosed receipt of the following financial support for the research, authorship, and/or publication of this article: This work was supported by Natural Science Foundation of China (Grant 52379018), China Postdoctoral Science Foundation (Grant 2024T171050), and Shanxi Province Fundamental Research Program (Grants 20210302124485, 202203021211127).