
Abstract
The gross calorific value (GCV) of coal is pivotal in shaping policies across various sectors of the Indian economy. It plays a crucial role in classification and valuation of coal and is a major factor in determining electricity tariffs charged by thermal power plants. With coal production escalating year-on-year to meet India's increasing electricity demand, there is significant rise in coal testing activities along the pit-to-power supply chain at multiple points and by multiple testing agencies often driven by sector-specific policy requirements. While laboratory testing accurately determines GCV, it is costly and time-consuming due to the reliance on expensive equipment and skilled personnel. Global researchers have previously devised a plethora of empirical formulae predicting GCV based on its correlations with easy-to-measure properties like moisture and ash content. However, the applicability and utility of these formulae to the prevalent policy matrix of coal and power sector remain to be explored. The introduction of independent third-party assessment of coal quality by Coal India Limited in 2016 has generated a vast dataset of coal sample-test results, offering an opportunity to reassess existing empirical formulae, test their alignment with existing policies, and explore possibility of a unified, region-neutral formula for rapid GCV prediction with a special focus on alleviating the current overload in coal testing.
Introduction
Coal holds a significant status as the most abundant and crucial fossil fuel in India, meeting 55% 1 of the country's energy need. Over the past four decades, commercial primary energy consumption in India has surged by approximately 700%. India, with world's fourth largest coal reserve 2 (10%), world's largest coal producer company, 3 being world's second largest coal producer, consumer, and coal market country, 4 is expected to maintain strong dependency on coal for the coming few decades despite climate concerns. Coal has underpinned the expansion of electricity generation and industry in the country, and remains the largest single fuel in her energy mix. A direct relationship exists between the economic development and the per capita energy consumption of a country (Khandelwal et al., 2017).
The gross calorific value (GCV) is a crucial parameter defined as the amount of heat evolved when a unit weight of coal is entirely burned, indicates the useful energy content of coal (Patel et al., 2007). A greater GCV indicates that less coal is needed to produce one unit of electricity. Consequently, the quantity and cost of coal required to be consumed by a power plant to produce electricity at the conversion efficiency prescribed for it by CERC (Central Electricity Regulatory Commission) depend upon accurate assessment of GCV of coal purchased. In addition, it is the GCV measured by power utilities at receiving end which fixes the annual entitlement of coal to be provided to a particular power plant. Similarly, the valuation policy of coal consignments sold by coal producers is done based on grade of coal determined by the GCV of coal as measured at dispatch end. Higher GCV translates to higher grade and larger coal revenue for the seller. Given the pivotal role played by GCV, influencing key financial and operational performance indicators in various sectors connected to the coal value chain, the methodology for its measurement, accuracy, and indisputability become important policy issues, often leading to inter-sectoral disputes.
Among the two types of coal produced in India—coking and non-coking—the latter constituted 93.19% of the national production in 2022–2023 (Office of Coal Controller, Ministry of Coal, Government of India, 2024). This type of coal is primarily used in thermal power plants for electricity generation. The price of coal sold by a seller depends on its “grade”, determined by the GCV of the consignment purchased by a buyer.
Over years, this situation has led to coal being sampled and tested at different points in the pit-to-power supply chain by various testing agencies, each steadfast in their belief in the correctness of their GCV assessments. The net result has been a proliferation of coal testing activities, particularly in the coal and power sector, as coal production and consumption continue to rise to meet the national energy needs. The present policy for discovering GCV of coal requires use of a “bomb” calorimeter which is a scientific instrument used to measure the heat of combustion of a sample, which is typically a solid or liquid fuel. The device works by combusting the sample in a sealed container, known as the “bomb”, which is filled with oxygen and placed in a water bath. The heat released by the combustion process is absorbed by the surrounding water, and the temperature rise of the water is measured. It is a rather expensive instrument whose operation requires a laboratory set up staffed by trained personnel to operate the same. Such method can be cumbersome, costly, and time-consuming (Verma et al., 2010). If coal is required to be tested at different locations along the coal value chain by multiple agencies for complying sectoral-policy requirements, then samples collected from thousands of consignments need to be ferried to select accredited laboratories for testing. The resulting time and cost burden on transacting entities in such a scenario can be overwhelming.
Researchers in past have been developing (and continue to develop) empirical equations for ascertaining GCV based on its correlation with certain properties determined from “proximate analysis” whose measurement is easy and inexpensive. Among the four parameters determined through proximate analysis (moisture, ash, volatile matter, and fixed carbon), moisture and ash are known to strongly influence the GCV of coal (Patel et al., 2007). This is because an increase in ash content results in a decrease in heating value (energy content), as ash is a noncombustible material. Therefore, the more ash present, the less fuel (carbon) is available to burn and produce heat. Similarly, the more moisture in the coal, the more energy is “lost” to evaporating that moisture instead of being available as useful heat. Hence, the percentage of ash and moisture has an inverse relationship with GCV. These two parameters are routinely measured on consignments of coal shipped from mines to consuming industries. As a result, many power industries and large coal consumers estimate the GCV of coal shipments based on these two parameters alone (Kumari et al., 2019). Analysis of the dataset used in our study reveals considerable variation across samples with coefficient of variation (standard deviation/mean) of 34.72% and 25.92% for moisture and ash, respectively.
This has been the trigger for development of many empirical equations by researchers using various types of regression models for predicting the GCV of coal mined in different countries.
For Indian coal, one such empirical formula widely used by many end-use industries like thermal power plants, coal washeries, and by geologists during geological exploration is the “Mazumdar formula” developed by Prof. B.K. Mazumdar in 1954. But since this formula was based on a limited number of samples taken from a particular region of India, that is, Singrauli of Northern Coalfield Limited (NCL) at a time when opencast mining accounted for very little share of coal production, its applicability to coal extracted predominantly by today's open cast method needs to be revisited. An empirical formula applicable to all coalfields (universality feature) of all coal-producing regions (region-neutrality feature) for predicting GCV with a precision level that is policy-compliant can save a lot of time, cost, and disputes involved in coal testing. The criteria used for determining such feature has been elaborated later under “Policy Acceptability of Regression Equations”. After the introduction of third-party agency testing by the Ministry of Coal in 2016, a huge number of sample-test results are now available for exploring such tantalizing possibilities.
While major policies in the Indian coal sector are crafted by the Ministry of Coal, Government of India, Coal India Limited (CIL), a public sector unit under the Ministry of Coal, wields substantial influence, being authorized to formulate key policy aspects such as the coal pricing methodology for coal sold to end-users. Notably, CIL stands as the largest coal-producing company not only in India but globally, contributing 703.204 MT out of the country's total coal production of 893.19 MT (78.73%) in FY 2022–2023. Serving as the primary source of coal for numerous thermal power plants in the country, CIL's policies and procedures, as outlined in the Fuel Supply Agreements (FSAs) with power and non-power utilities, essentially become a de facto national policy for the Indian coal sector concerning those units. Therefore, this article frequently references CIL's policies, procedures, and data to illustrate pertinent issues.
Objective
Using a massive dataset of non-coking coal samples drawn from consignments dispatched by CIL this article aims to: (a) prepare an illustrative estimate of coal testing activities undertaken by Indian coal and power sector today in the backdrop of sector-specific policies; (b) develop empirical equations using linear regression to predict GCV for each subsidiary of CIL as well for the entire dataset and compare their predictive capability to Mazumdar formula; (c) examine whether such empirical equations fit into the current policy matrix and thereby reduce the present coal testing overload; and (d) explore feasibility of developing a single unified region-neutral empirical equation for GCV prediction of Indian non-coking coal.
Literature review
Since laboratory testing to determine the calorific value of coal is both expensive and time-consuming (Akkaya, 2013), requiring skilled personnel, many researchers have tried to be explored empirical relationship between calorific value and its other properties or constituents to develop predictive models. In the literature, various predictor types have been used for estimating coal's heating value, including optical properties like spectral reflectance (Begum et al., 2019), stoichiometric ratios (Zhu and Venderbosch, 2005), laser-induced breakdown spectroscopy (LIBS; Lu et al., 2017), and maceral-mineral matter content (Chelgani et al., 2010). But these too require speciated instruments and unsuitable for handling high-volume coal testing activities.
Among the predictive methodologies, the most prevalent approaches involve using properties or constituents obtained from ultimate and proximate analysis of coal. Predictions based on ultimate analysis, which includes elemental constituents of coal such as carbon (C), hydrogen (H), nitrogen (N), oxygen (O), and sulfur (S), tend to be more accurate but require expensive, specialized analytical equipment (Channiwala and Parikh, 2002; Chelgani et al., 2010; Parikh et al., 2005; Patel et al., 2007). In comparison, predicting GCV through proximate analysis, which involves simpler parameters like ash (A), moisture (M), fixed carbon (FC), and volatile matter (VM), is a quicker, cheaper, and more straightforward method (Akkaya, 2009, 2013; Parikh et al., 2005). Consequently, many researchers have shifted focus towards predicting GCV using proximate analysis. While Dulong was the first to postulate in the early 1800s that the GCV of a sample can be determined from its elemental composition (Buckley and Domalski, 1988), by 1980, at least nine different formulae for calculating GCV from ultimate analysis and eleven from proximate analysis had been developed (Mason and Gandhi, 1980).
Out of four parameters ascertained from proximate analysis—moisture content, ash yield, volatile matter yield, and fixed carbon content—predictive models do not always use all four parameters for GCV prediction. Out of those, moisture and ash yield are known to have the most significant influence on the GCV of coal (Patel et al., 2007).
Several empirical equations have been developed to predict the GCV of coal based on proximate analysis parameters, such as ash (A), moisture (M), volatile matter (VM), and fixed carbon (FC). These models, which vary by geographic region and the number of coal samples used, demonstrate different levels of precision, indicated by the mean absolute percentage error (MAPE).
Majumder et al. (2008) developed a multiple linear regression (MLR) model using 250 coal samples from India, resulting in the equation: GCV (MJ/kg) = −0.03A − 0.11M + 0.33VM + 0.35FC, with a MAPE of 1.49%. Similarly, Kavšek et al. (2013) from Slovenia used 64 samples to produce an MLR model: GCV (MJ/kg) = −3.57 + 0.31VM + 0.34FC, yielding a MAPE of 4.45%. Akhtar et al. (2017) applied their MLR model to 32 samples from Pakistan, producing the equation: GCV (MJ/kg) = −4.45 + 0.02A + 0.32VM + 0.39FC, achieving a MAPE of 0.91%. Ghugare and Tambe (2017), utilizing a large dataset of 6572 samples from various regions, developed a Gaussian process regression (GPR) model: GCV (MJ/kg) = 0.816VM + 0.7008FC + 0.2786A + 0.004835M² + 0.002808M − 0.003026VM² − 34.08, with a MAPE of 3.99%. Go et al. (2019), working with 8039 samples, generated an MLR model: GCV (MJ/kg) = 0.3722FC + 0.3160VM − 0.028A − 0.0977M + 0.0056, which had a MAPE of 3.69%. Onifadea et al. (2019) compared MLR, adaptive neuro-fuzzy inference system (ANFIS), and artificial neural network (ANN) models using 32 samples from South Africa. The MLR model: GCV (MJ/kg) = 1.9249 + 0.1543VM − 0.0245FC + 0.3557A, resulted in a MAPE of 3.55%, while the ANFIS and ANN models had MAPEs of 2.04% and 2.86%, respectively.
Only Ghugare and Tambe (2017) and Go et al. (2019) used large coal datasets encompassing different geographic areas, achieving MAPEs of 3.99% and 3.69%, respectively. When these models were applied to the test dataset in this study, the MAPEs for the developed MLR and GPR models decreased further to 2.739% and 2.50%, respectively, indicating an improvement in prediction accuracy.
The study uses one of the simplest empirical models for predicting GCV, particularly popular in Indian coal-utilizing industries. This model, proposed by Mazumdar (1954) and derived from coal samples collected from Singrauli coal mine of central India, is based solely on ash yield and moisture content, as detailed below:

In this context, the evolution of predictive methodologies for estimating GCV of coal merits some mention. Early methodologies like linear regression (LR) and differential scanning calorimetry laid the groundwork for GCV estimation by relying on ultimate and proximate analysis of coal While foundational, these methods were limited by their dependence on linear relationships and extensive input parameters (Vilakazi and Madyira, 2024).
The 1990s marked a significant advancement with the introduction of artificial intelligence (AI) techniques, such as ANNs, which offered a dynamic approach to GCV prediction by capturing the complex, non-linear relationships inherent in coal properties (Chelgani et al., 2010; Onifadea et al., 2019). This shift towards non-linear regression modeling continued into the 2000s, resulting in more accurate GCV predictions and addressing some limitations of traditional LR methods (Akkaya, 2020; Liu and Lv, 2020).
More recently, the integration of machine learning techniques has further refined predictive models. Studies have explored the use of decision tree regression, ANFISs, and genetic algorithms, each offering varying degrees of success (Onifadea et al., 2019). Among these, GPR has emerged as a particularly robust method, known for its strong generalization capabilities and superior prediction performance compared to MLR models. Akkaya (2020) demonstrated that GPR-based models significantly outperform traditional statistical methods, achieving high precision in GCV prediction across diverse datasets.
The mid-2010s introduced online GCV monitoring technologies, addressing the industry's need for real-time analysis. Methods combining support vector regression with LIBS and AI techniques have shown promise, though their adoption remains limited by complexity and cost (Lu et al., 2021). Concurrently, research into spectral reflectance data and semi-empirical models has presented innovative approaches to GCV prediction by analyzing coal's optical properties and fundamental combustion principles (Begum et al., 2019). Another method of recent origin is the real-time online monitoring of coal GCV, for which available literature is scanty (Vilakazi and Madyira, 2024).
Research gap
Predictive models for estimating the calorific value of coal often focus on specific types or regions, relying on a limited number of samples, which restricts their generalizability across diverse coal fields (Onifadea et al., 2019). Moreover, the complexity and high costs associated with advanced AI and machine learning models pose significant barriers to widespread adoption, particularly in resource-constrained settings (Chelgani, 2021; Vilakazi and Madyira, 2024). van Aarde (2019) evaluated existing GCV estimation models on new coal datasets, revealing errors ranging from 3.7% to 72.1%, highlighting the challenges of applying these models to different contexts.
Despite the development of numerous predictive models, a critical gap persists in aligning these models with India's existing policy framework. Indian standards mandate GCV determination through bomb calorimetry, as specified by IS 1350 (Part-II) (Bureau of Indian Standards, 1970), which is considered the most accurate method (Mazumdar, 1954). Predictive models are typically benchmarked against bomb calorimeter results, which are precise to within 65 kcal/kg (reproducibility), making them crucial for policy compliance.
There is a clear need to explore the feasibility of developing a policy-compliant empirical equation specifically tailored for Indian coal that ensures both accuracy and regional neutrality. Such exploration has the potential to significantly reduce the substantial costs and time associated with the repetitive laboratory testing of hundreds of thousands of coal consignments being undertaken today by various stakeholders to assess GCV. However, the literature reviewed does not adequately address the potential of these empirical equations to alleviate this major challenge faced by the industry.
In recent years, India's coal and power sectors have made extensive coal sample testing data publicly available, particularly after the full implementation of the independent third-party regime in 2017–2018. Despite this, existing literature on GCV prediction, while valuable for research, has not fully accounted for these significant policy developments in coal testing. This article seeks to address these research gaps, focusing on policy design and implementation within the Indian context.
Dataset details
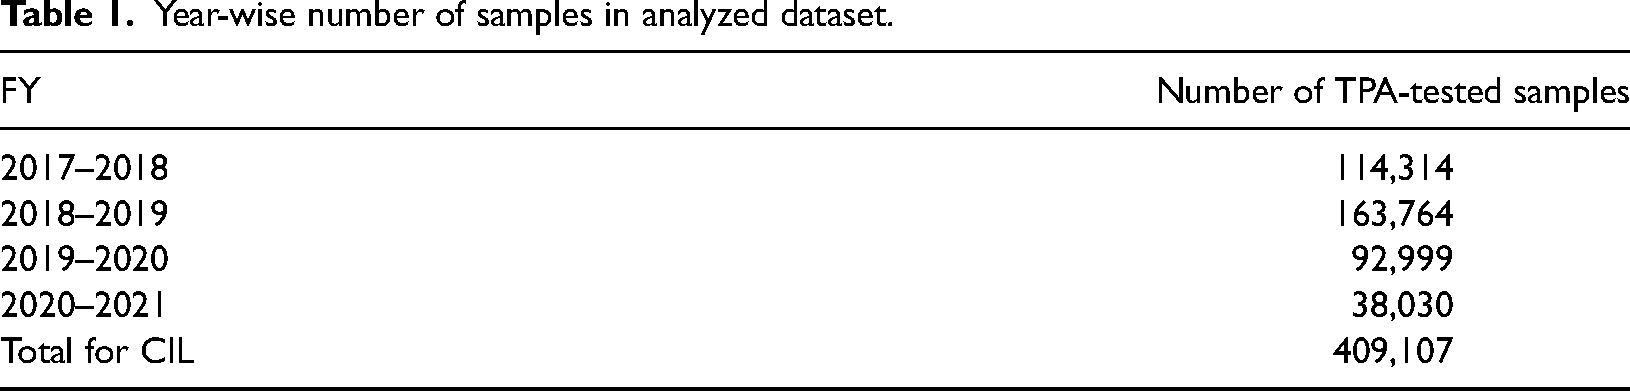
The study leverages an extensive dataset comprising results of tests conducted on samples collected from non-coking coal consignments dispatched by CIL to various end-users. The source for this dataset is the archival data released by CIL in their updated quality portal (uttam.coalindia.in) for financial years 2017–2018 to 2020–2021 containing various quality attributes of coal like GCV, ash content, and total and equilibrated moisture content in samples tested by various third-party testing agencies engaged by CIL. In cases where third-party testing results had been contested either by CIL or end-user, test results undertaken by referee laboratory have been incorporated in the dataset. In total, this study uses quality attributes of 4,09,107 non-coking samples (each sample representing an individual consignment) extracted from coal consignments dispatched to 348 purchasers from all eight subsidiaries, 77 “Areas”, 5 282 mines, and 164 railway sidings. It thus contains tested properties of coal mined in virtually all coal-producing regions of India. As the dataset captures both temporal and spatial variations in coal quality of such a large number of samples, any predictive model derived from it is likely to offer a level of accuracy far beyond what could be obtained from a model derived from analyzing a relatively smaller number of region-specific coal samples.
Beyond statistical analysis of extensive quantitative data, the article also uses qualitative data in the form of reports published by the Comptroller and Auditor General (CAG) of India, Annual Reports of Ministry of Coal, CIL, and its subsidiaries. At times, qualitative data can provide insights that may not be visible from mere statistical analysis. Many analysts, today, agree that “good qualitative research has equaled, if not exceeded, quantitative research in status, relevance, and methodological rigor” (Davis, 2007).
Methodology
Based on the above dataset, predictive equations for each subsidiary of CIL were developed based on linear regression. Since conducting regression analysis on such large volume of data in MS Excel's “Analysis Toolkit” posed problem, statistical and visualization libraries available in Python 3.12 were used. Further consolidated test data of all subsidiaries were used to derive a comprehensive, region-neutral regression-based formula for predicting GCV. The predictive accuracy of these regression models was compared with that of Majumder equation. They were further scrutinized to assess their alignment with current coal testing policy in India's coal and power sector by making a thorough analysis of prediction-error data.
Key policies associated with GCV
Classification policy
The categorization of Indian non-coking coal, widely used in thermal power plants across the nation for electricity generation, is primarily based on its GCV. GCV serves as the determining factor for grade(s) assigned to coal consignments during transaction between buyers and sellers, ultimately influencing the pricing of such coal. In contrast, for coking coal, predominantly employed in steel production, the pivotal grade-defining property is the ash content, expressed as Ash%. Currently, Indian non-coking coal is classified into 17 grades (ref.: Table 1), each separated from the other by GCV “band” of 300 kcal/kg. Each coal grade has two notified prices: one for use in utility and the other in Non-utility sector. Non-coking coal constitutes 93.20% of India's annual coal production (832.43 MT out of 893.19 MT). With these figures in mind, this article focuses on issues and challenges faced by various stakeholders in determining the GCV of non-coking coal and explores whether empirical formulae developed by researchers in the past can provide some solutions.
Year-wise number of samples in analyzed dataset.
Valuation policy
The “As Delivered Price” for coal supplied by a seller to a buyer is the sum of the base price, royalty, central and state taxes, and other applicable charges at the time of delivery. The base price depends on the grade of coal supplied. Grade-wise prices are notified by Coal India Ltd (CIL) periodically for both regulated sectors (such as power) and non-regulated sectors (such as cement and steel). The notified price is uniform for coal purchasing entities across all sectors of the Indian economy for grades G1–G5. From G6 onwards, a price differential exists between the regulated sector (power) and non-regulated sectors like cement and steel as shown in the table.
Sampling and testing policy
As previously mentioned, the price of coal transacted between a seller and a buyer is contingent upon the grade of the consignment, which, in turn, is determined by the GCV of coal contained in it. Accurate GCV assessment is crucial for buyers due to its significant financial and technical implications. However, measuring the quality attributes of coal, a highly heterogeneous fossil fuel, is inherently complex and variable. As discussed earlier, determining the primary distinguishing attribute of non-coking coal, i.e. the GCV, involves a two-step process: “Sampling” and “Testing”. Contracts governing coal transactions between buyers and sellers, often called FSAs, invariably stipulate the methodology for sampling and testing of transacted coal for ascertaining the GCV of the consignment(s).
Post-2016 scenario
Since 2016, major power producers and CIL have embraced a third-party sampling and testing policy. Under this policy, the responsibility for sampling and testing is delegated to independent (neutral) third-party agencies (TPA) formalized through a tripartite agreement involving the buyer, seller, and the empaneled TPA. The primary aim of sampling is to extract a small quantity of coal from the consignment in such a manner that the said quantity accurately represents the entire consignment. This quantity, referred to as the “gross” sample, undergoes a series of processes producing a “laboratory sample” of much lesser quantity. This laboratory sample is then divided into four parts. The TPA tests one part in their laboratory to determine the GCV and grade of the consignment. The buyer and seller retain one part each for conducting test in their respective laboratories to ascertain GCV. The fourth part of the sample is securely sealed, coded, and preserved in joint custody, serving as a “reference” or “umpire” sample. While the TPA's test result is used for grade discovery and coal valuation, the FSA also allows for challenging the same by either the buyer or seller if they choose to do so based on test conducted in their own laboratory. In such instances, the preserved “fourth part” of the sample is sent to be tested in an independent laboratory whose outcome is considered final and binding on the transacting parties. The majority of coal transacted in India is intended for power generation, with its primary mode of dispatch being through railway rakes.
Estimating the coal testing overload
As evident from Table 2, under current policy, the grade boundaries are sharp and without any tolerance. Thus, error of even a single kcal/kg of GCV can change coal grading of the consignment if such error takes place at grade boundaries. No wonder, even a few kcal/kg difference between the GCV determined by buyer or seller and that by TPA is likely to trigger the challenge provision of FSA.
GCV, grades, and notified price of non-coking coal in INR for (power/IPP/defense/fertilizers)a of Coal India Limited.
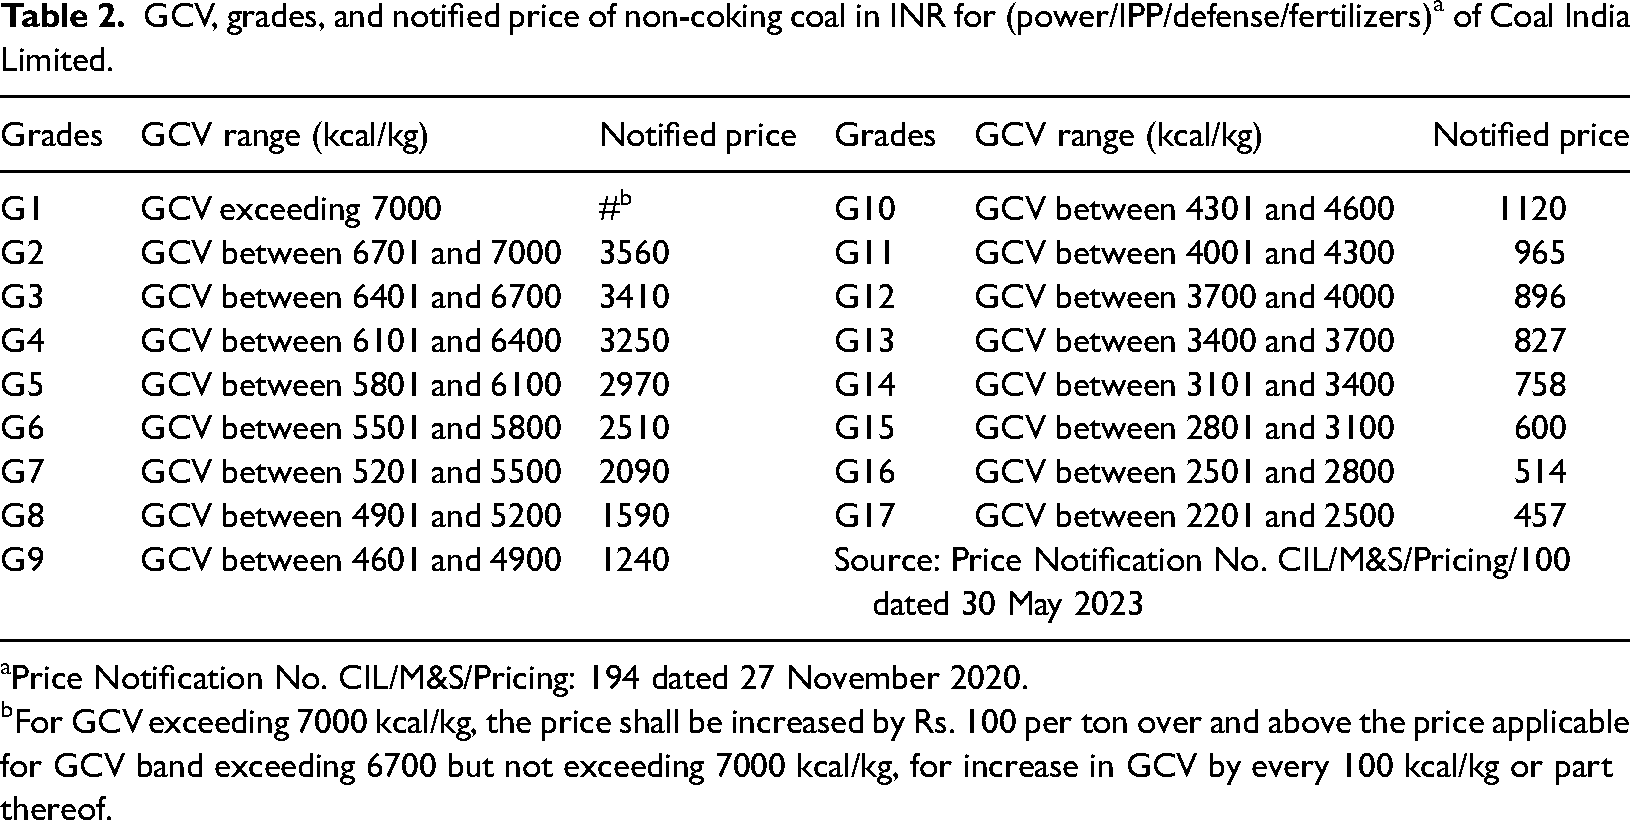
Price Notification No. CIL/M&S/Pricing: 194 dated 27 November 2020.
For GCV exceeding 7000 kcal/kg, the price shall be increased by Rs. 100 per ton over and above the price applicable for GCV band exceeding 6700 but not exceeding 7000 kcal/kg, for increase in GCV by every 100 kcal/kg or part thereof.
Testing time and frequency
In terms of testing time, Clause 6.5 of the Tripartite Agreement mandates that the TPA communicates the results of part-samples tested within 18 working days from the date of collection to both the seller and the buyer. However, in practice, TPA results consistently experience significant delays. An examination of two TPAs (CIMFR and QCI) 6 in April 2020 at Northern Coalfields Limited (NCL), a major subsidiary of CIL, revealed that the average time taken for test completion and result submission was 41 days for CIMFR and 24 days for QCI. As narrated earlier, a fourth agency may be referred for testing if either the buyer or seller decides to challenge TPA's test results. As per FSA, this challenge must be initiated within 7 days of receiving the TPA results. Subsequently, the responsibility of collecting the preserved referee sample, sending it to an empaneled “referee” for testing, and conveying results to CIL and customers lies with the TPA. Each challenge requires sending the preserved “reference” sample to an independent laboratory that might be in a distant location, incurring additional costs to buyers and sellers. But more importantly, delay in getting the referee laboratory delays the reconciliation process between the declared grade and tested grade of a coal consignment (Tables 3 and 4).
Time consumed in making referee laboratory result available.
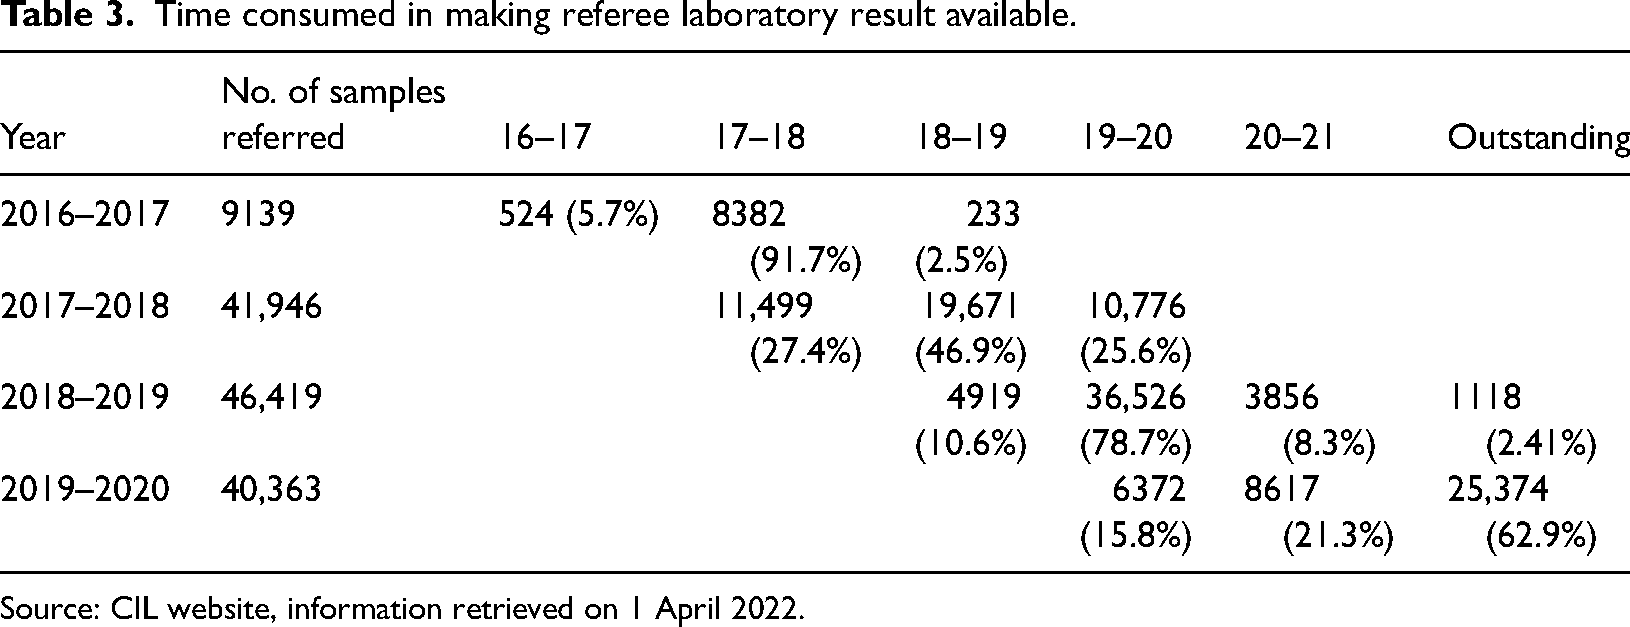
Source: CIL website, information retrieved on 1 April 2022.
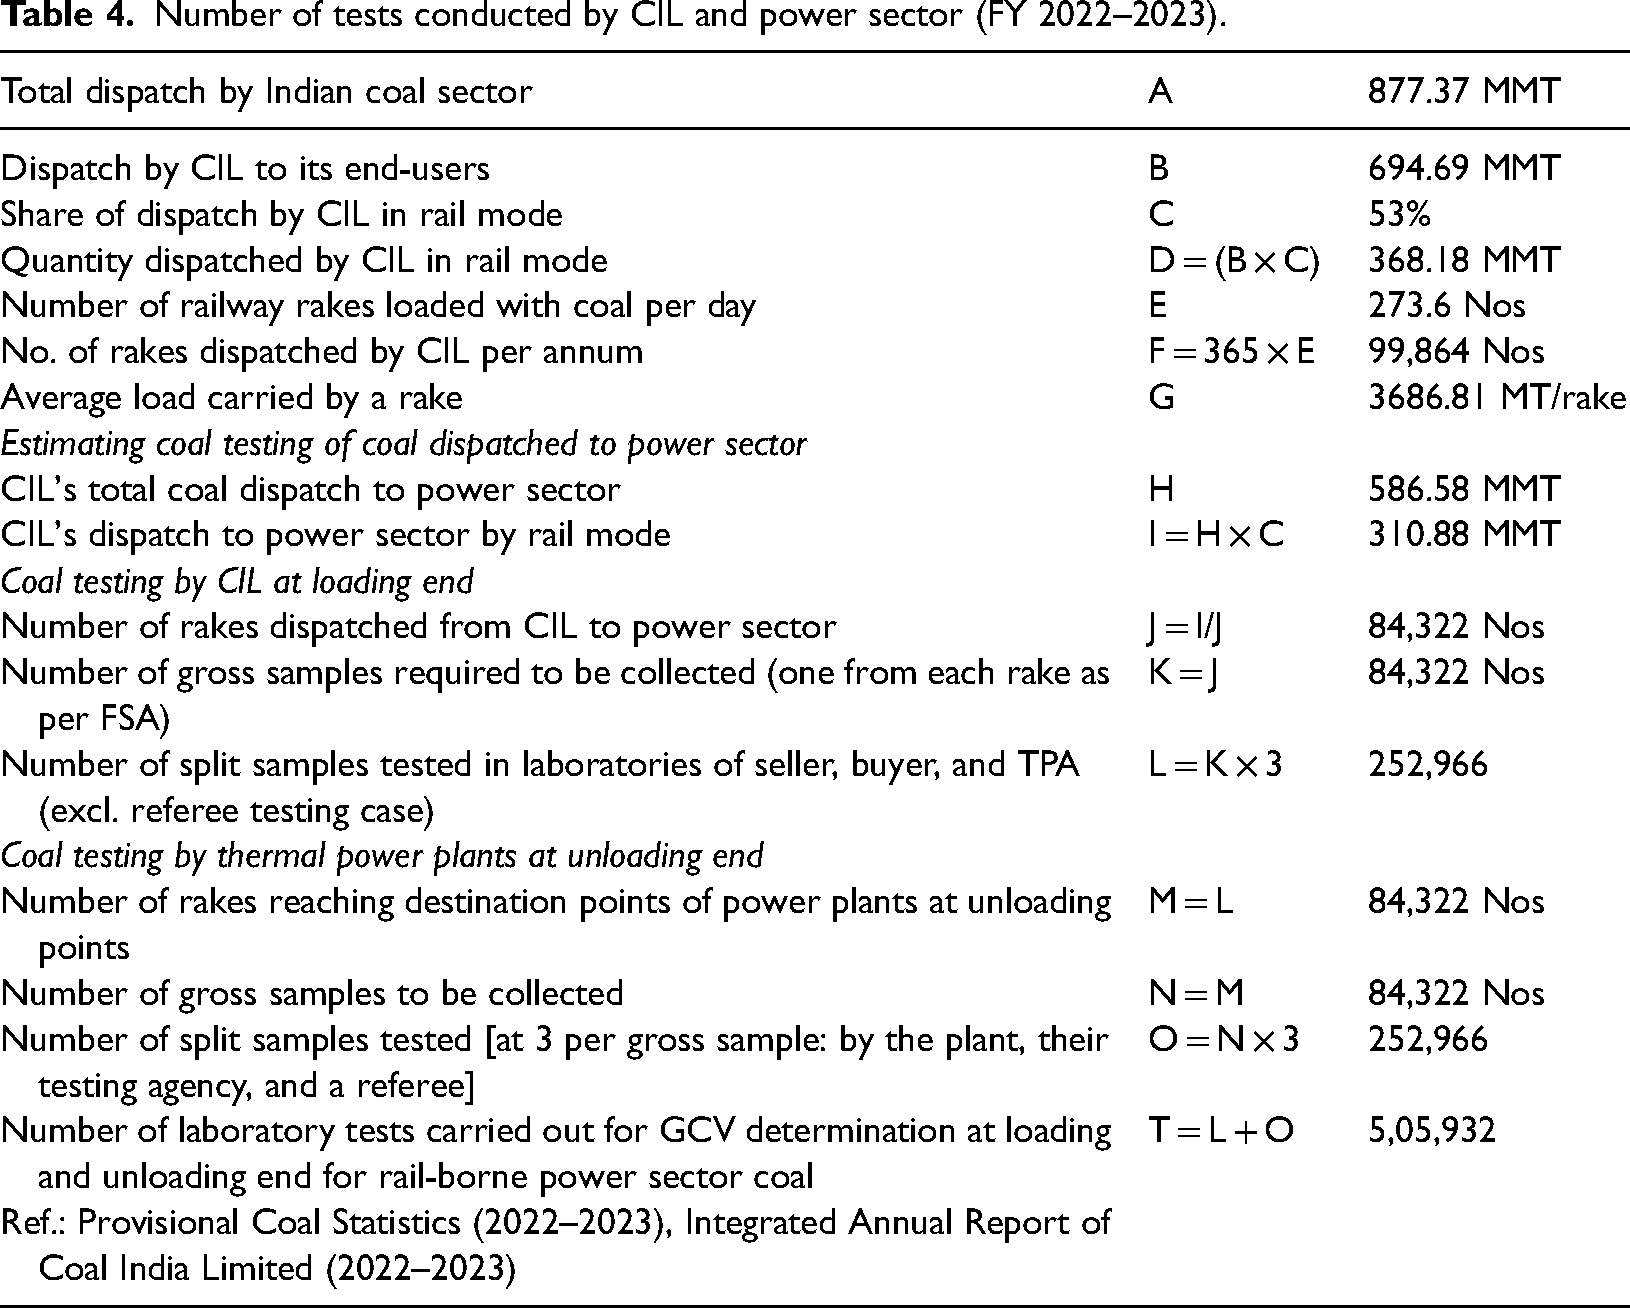
Number of tests conducted by CIL and power sector (FY 2022–2023).
The challenge provision of FSA was meant to be served as a dispute resolution mechanism on rare instances of disagreement among transacting parties. But the number of such challenges has grown exponentially after 2017 as the above table demonstrates.
Repetitive testing and trust deficit?
Coal sampling and testing transcends beyond the boundary of coal transactions between buyers and sellers. For example, in accordance with national legislation, every mine owner must perform sampling and testing of coal on every seams of the mine before commercial operation commences. This is done to propose a “declared grade” for each seam or combination of seams to the Office of the Coal Controller—the national coal regulator.
The Coal Controller's office may independently collect samples from the mine to verify the authenticity of the declared grade proposed by the mine owner. When a coal buyer wants to procure coal from a mine owner, such as one of the subsidiaries of CIL, an upfront payment is required to be paid to the seller. This payment corresponds to the notified price for the “declared grade” of coal sourced from that mine. This price is later adjusted based on the grade discovered by TPA (or “referee” in case of a challenge) from laboratory test before dispatch. If the TPA-tested “grade” of the consignment exceeds the “declared grade” (indicating lower coal quality) the buyer is entitled to a refund. Conversely, if the tested grade is lower than the “declared grade”, the buyer is obligated to pay an amount equivalent to the grade differential.
Power sector policy
In the coal sector, the computation of coal's transaction value hinges on coal sampling and testing at the loading point. However, if the buyer is a power producer, another round of sampling and testing by an independent agency is mandated at unloading point for determining the “as received” GCV of the consignment, according to the provisions outlined in the Central Electricity Regulatory Commission. 7 It is this “as received” GCV, rather than the GCV determined at the loading end, that dictates the quantity of coal consumed for generating a single unit of electricity. The cost of coal required to generate a single unit of electricity constitutes a significant portion of a thermal power plant's variable production cost, subsequently influencing the tariff charged to customers by the power plant. The specific consumption of coal (SCC), defined as the amount of coal consumed by a coal-fired power plant per unit of electricity generated, depends on the “as received” GCV 8 value. The SCC serves as a key indicator of a coal-fired power plant's efficiency and environmental impact.
It is evident that a lower “as received” GCV at the destination justifies higher coal consumption and, consequently, a higher tariff to consumers. Conversely, if GCV measured at loading point by TPA (also known as “as billed” GCV) is elevated and if it aligns with the destination tested GCV, the plant cannot justify imposing a higher tariff. These cross-sectoral-policy considerations contribute to avoidable proliferation of coal testing activities and involve multiple testing agencies along the pit-to-power coal chain.
Estimating coal testing activity
The following table gives an approximate estimate for the number of laboratory tests conducted for coal dispatched to power sector by CIL in FY 2022–2023.
Data presented in the above table represents a conservative, lower-bound estimate of coal testing activity within Indian coal and power sector. It does not include tests conducted (a) by referee laboratories in response to challenges to TPA-discovered GCV; (b) on coal dispatched through non-railway modes such as road, belt, and merry-go-round (MGR); (c) on coal dispatched to captive power plants and non-power sectors; (d) by non-coking washeries, where inferior-quality coal undergoes ash-reduction for grade enhancement; (e) on cores drilled into coal beds during geological exploration to determine underlying seam quality and grade; and (f) within coal-fired power plants. Quantitatively, the table reflects tests conducted on 310.88 MT of coal dispatched by CIL to power sectors through rail mode, out of a total national coal sector dispatch of 877.37 MMT. Thus, while figures shown in the table underscore the magnitude of coal testing activities in India, it's essential to note that they do not encompass the full spectrum of testing scenarios.
The need for empirical equation
A substantial contributor to the temporal and financial investment in coal testing is the necessity of determining GCV by a bomb calorimeter—an expensive instrument mandated by coal testing specifications endorsed in the FSA. This compels transportation of coal samples from numerous delivery points to accredited laboratories at huge cost. Consequently, the quest for more efficient and cost-effective testing methodologies becomes imperative to address this challenge. As previously stated, the GCV of coal exhibits a robust correlation with ash and moisture content. Past researchers have formulated many empirical equations to predict GCV based on easily measurable properties like ash and moisture content, which can be assessed on-site at a relatively low cost. Notably, certain entities such as thermal power plants, coal washeries, and geologists engaged in core testing during exploration tend to rely on regression-based empirical formulae, especially the well-known “Mazumdar formula”.
Considering the escalating burden of coal testing in the Indian coal and power sector, it becomes pertinent to investigate whether empirical equations developed by previous researchers, establishing correlations between GCV and readily measurable coal quality parameters, can present a viable alternative to mitigate this challenge.
Variability in quality attributes of Indian non-coking coal
Ash and moisture variation
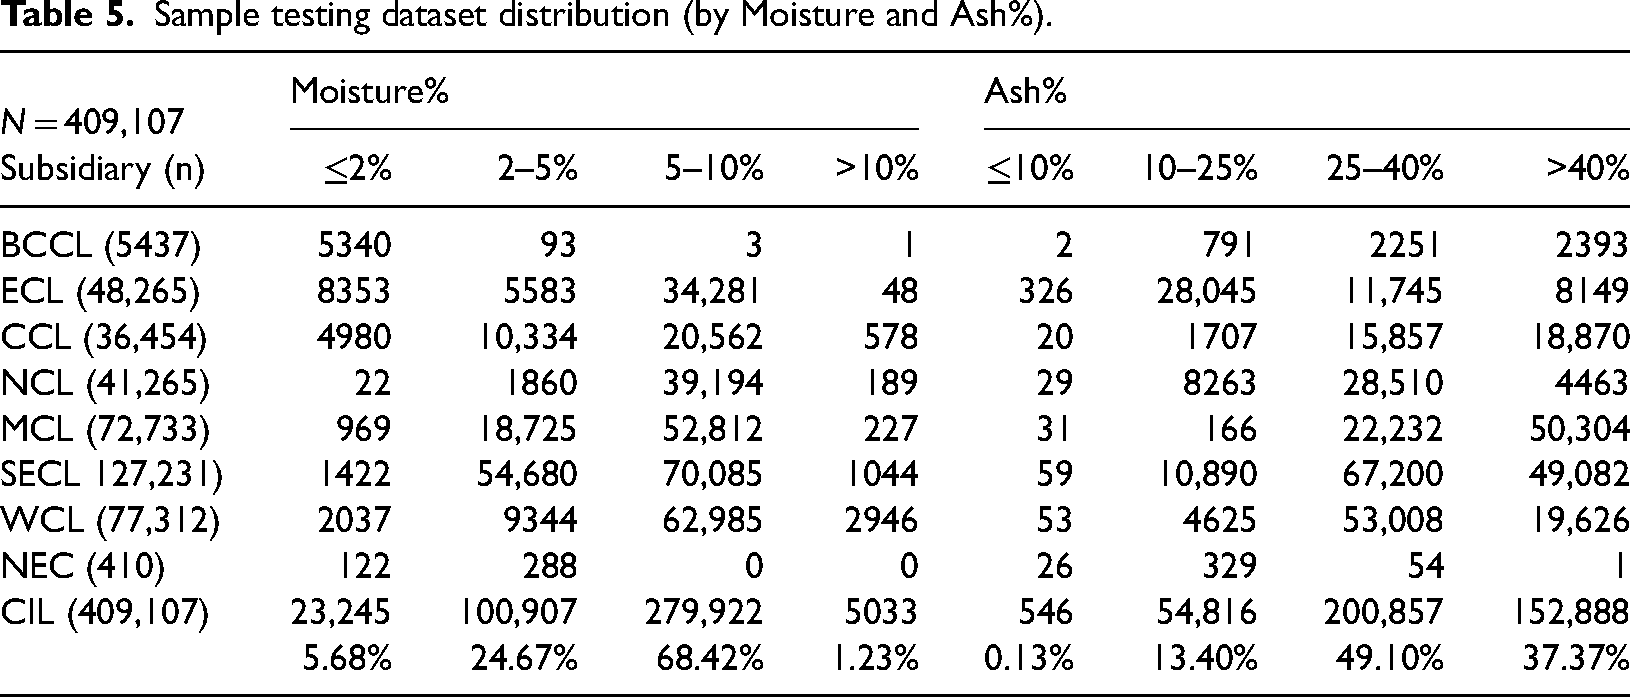
The number of sample-test results taken for analysis in this study is 409,107 spanning the period 2017–2021 belonging to all subsidiaries under jurisdiction of CIL. The grouping of observation points by equilibrated Moisture% and Ash% is as below.
From the above table it can be seen that nearly 86% of tested samples (with each sample representing an individual consignment) had ash exceeding 25% and that. It can be seen that about 68% of sample under study have moisture in the range of 5%–10%. There is also substantial variation in Ash% from subsidiary to subsidiary. The following box plot shows the distribution of Ash and Moisture % along with tested GCV across subsidiaries.
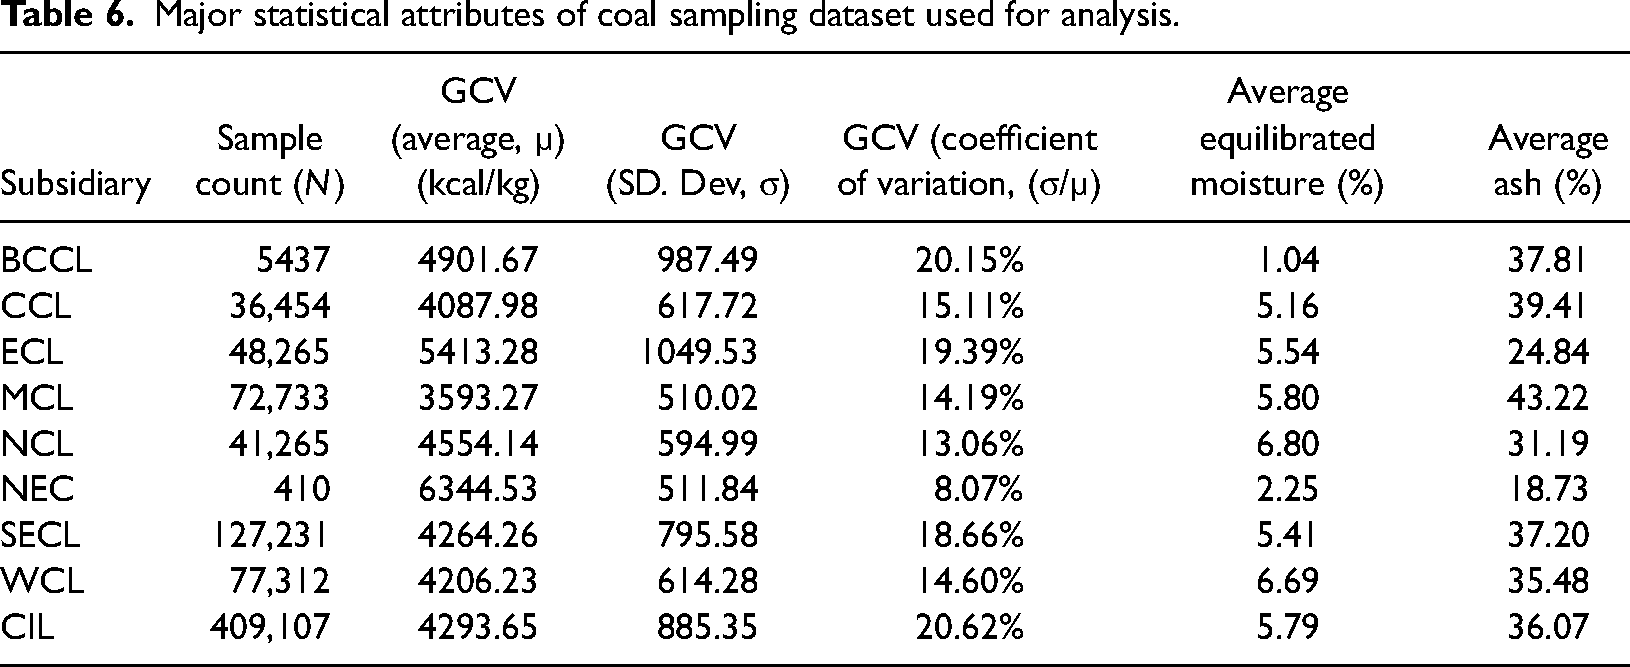
GCV variation
Before delving into a comprehensive regression analysis to predict GCV on the basis of ash and moisture content of a sample, it is essential to scrutinize three key statistical aspects pertaining to it. These aspects include the mean, standard deviation, and coefficient of variation. Out of them, the last one, the coefficient of variation (CV), is a statistical measure that expresses the relative variability of GCV in relation to its mean. From a practical standpoint, it can be said lower the variability in a given attribute of substance, higher will be its predictability from other correlated attribute(s).
Analysis
The table above, particularly the coefficient of variation (CV) for GCV of coal mined in various subsidiaries of CIL, provides a crucial insight into the variability of energy content in Indian non-coking coal. Except for NEC—a subsidiary that produces coal of comparatively very little quantity where CV is 8.07%, it is in double digits for all other subsidiaries. In contrast, non-coking coal produced by the Sangatta Mine—one the largest in Indonesia and world—has a coefficient of variation of only 1% (Nas, 1994: 147–148). Likewise, the Southern Powder River Basin (Wyoming), USA whose coal account for the largest share in US Coal production has a coefficient of variation in GCV is 0.96% (Mazumdar, 1954, p. 13).
Regression model development and comparison
We then proceed to derive empirical equations based on linear regression for each subsidiary separately (subsidiary-specific equation) as well as for CIL taking the entire dataset (a unified regression equation). These are compared for their prediction accuracy with Mazumdar equation after applying it to each sample in our dataset. As narrated earlier, though researchers in past have developed many empirical equations for Indian coal by collecting and analyzing samples form specific region(s), Mazumdar equation still remains popular although it too is region-specific, i.e. Singrauli region of Northern Coalfield Limited.
Root mean squared error (RMSE) and R² are both metrics commonly used to assess the performance of regression models, but they measure different aspects of model performance. While RMSE assesses the precision of predictions, evaluates the goodness of fit of the entire model. In general terms, a lower RMSE suggests better precision in predicting individual data points, but a high R-squared value is needed to confirm that the model is explaining a significant portion of the overall variability in the dependent variable. For comparing the predictive potential of subsidiary-specific, CIL-specific regression equations and Mazumdar formula (i.e. results obtained by applying Mazumdar formula, to the Ash and Moisture % of our dataset), we rely on the two aforementioned statistical features of our dataset as depicted in the table.
Analysis
From the table above, it is evident that nearly all subsidiary-specific regression equations exhibit remarkably high R2 and low RMSE values. This implies a substantial portion of the variability in the independent variables, i.e. Moisture and Ash %, being effectively explained by the dependent variable (GCV). As far as the order of predictive accuracy is concerned, (a) subsidiary-specific regression equations fare better than both Mazumdar equation and the unified CIL-wide regression; (b) CIL-specific regression equation also fares better Mazumdar equation for entire dataset and for all subsidiaries except BCCL and ECL; and (c) even for NCL (from whose coal samples, Mazumdar equation had been developed in 1954), RMSE of regression equations derived from present dataset is significantly lower (131.54 as compared to 176.44), it is associated with an increased R2 value (from 0.91 to 0.95). Another important observation is the huge disparity between the value of “intercept” of the Mazumdar equation and the NCL-Specific equation derived from the present dataset. The intercept represents the maximum value of GCV that can arise if there is no moisture or ash in coal—in practical terms, coal with extremely low moisture and ash content. Over the span of approximately 70 years since then, this intercept has gone down by 895.1 kcal/kg (=8560 − 7664.90).
Error dispersion and distribution analysis
Developing regression equations with ever greater accuracy and statistical fitness may be desirable but using them for actual operational purpose is another aspect all together. Despite the high level of predictive accuracy in the empirical equations developed from the present dataset and the obvious improvement over the Mazumdar equation, acceptability to policy maker's potential for reducing the rising coal testing overload needs to be examined. It is here that two aspects become more relevant (a) role of measurement uncertainties of in independent variables used in the regression equations; and (b) the distribution of prediction errors and their compliance to policy. For both these aspects, it is the statistical characteristics of the error-dataset (the difference between observed and predicted GCV for each sample) which can throw additional light. The following four tables endeavor to do that.
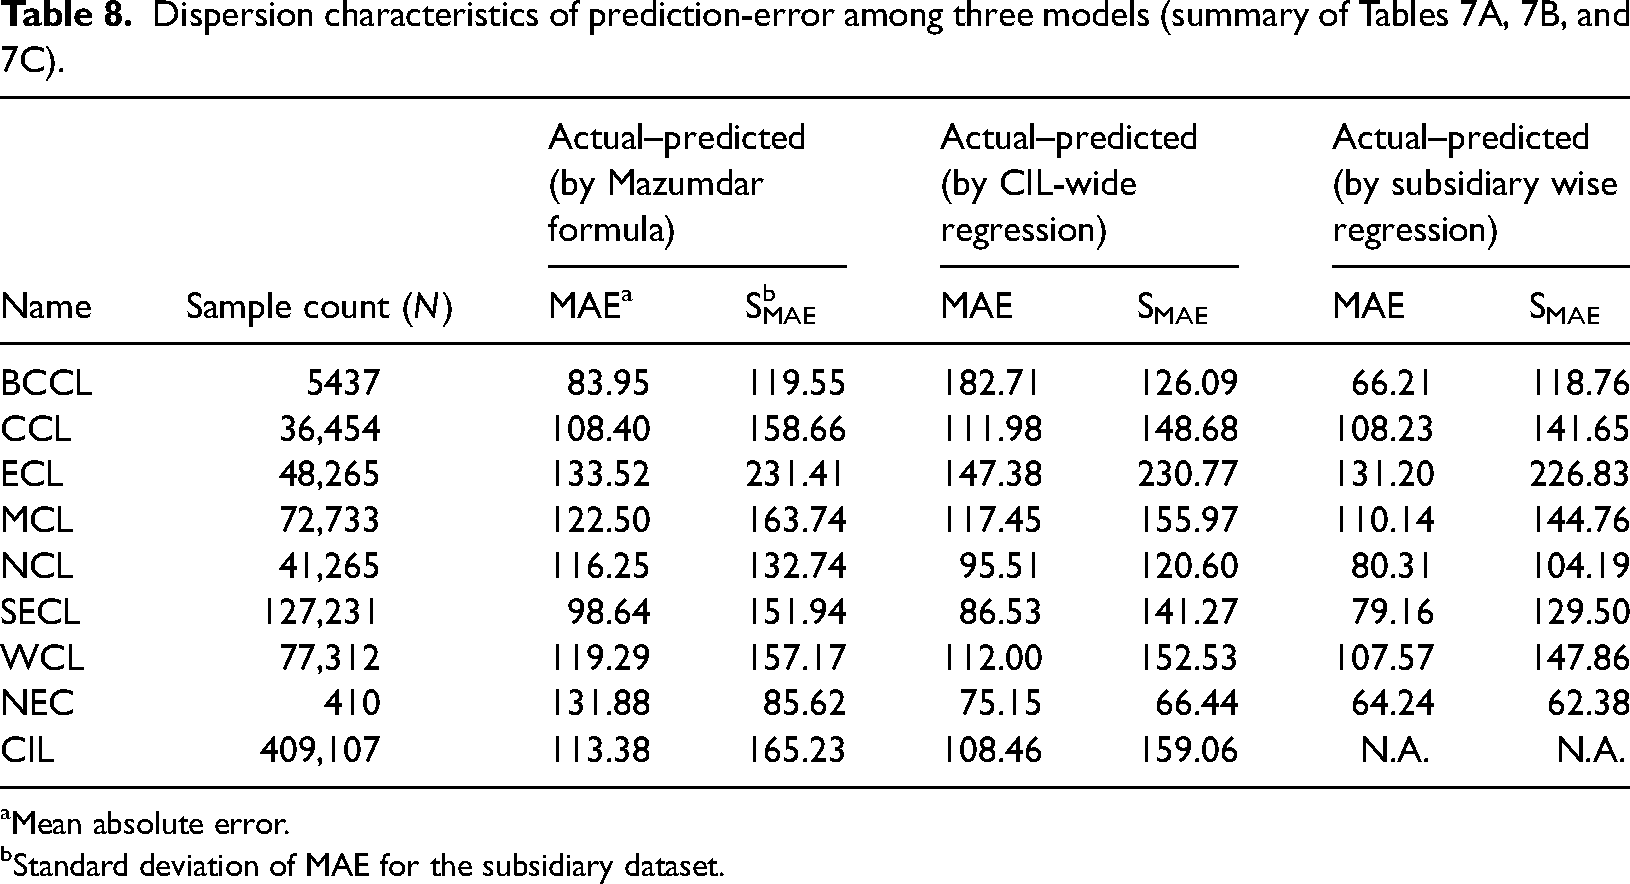
Predictions made by the subsidiary-level regression equations consistently demonstrate lower levels of mean absolute error (MAE) and SMAE compared to Mazumdar's formula. However, when the unified CIL-wide regression equation is applied, then all subsidiaries except BCCL, CCL, and ECL exhibit opposite trend. An intriguing observation is the remarkable proximity of MAE values resulting from Mazumdar formula to that predicted by subsidiary-level equations derived from our dataset, even after passage of nearly 70 years.
Policy acceptability of regression equations
Role of measurement uncertainty
A measurement result is complete only when accompanied by a quantitative statement of its uncertainties (Farrance and Frenkel, 2012). The usual expression for uncertainty associated in measurement of any property of a substance is the “repeatability “and “reproducibility” of its discovered value (normally referred to as “precision” of test result). While attempting to predict GCV from easy-to-measure properties like ash and moisture, it is important to keep in mind that measurement of these independent variables, however easy and uncomplicated, has certain amount of inherent uncertainty. Hence, the GCV value of coal predicted by any regression equation will inherit the combined effect of uncertainty of these two independent variables, no matter whatever regression model one chooses to use.
The reproducibility limit for moisture and ash values as specified in the governing specification 9 is 6.0% for moisture exceeding 3% of the mean moisture value of collected samples (Section 6.6.5 of IS 1350) and 3% of the mean ash value of ash exceeding 10%. As observed from our dataset, for overwhelming number of samples both ash and moisture content exceed these defined limits (refer: Table 5). Hence, for all practical purpose, we can compute the combined effect of these two measurement uncertainties on predicted GCV by using standard statistical principle of uncertainty propagation. While doing so, it is better to consider the “reproducibility” aspect of precision which represents the permissible inter-laboratory difference in tested value since it is the magnitude of such difference (among GCV values discovered in laboratories of stakeholders) that gives rise to dissent, disagreement, and conflict.
Sample testing dataset distribution (by Moisture and Ash%).
The combined effect of uncertainties of continuous independent variables (X,Y) on a continuous dependent variable “Z” where Z = aX + bY + C can be calculated by using the “rule of quadrature” formula as below: var(Z) =
Assuming that X and Y are independent and thus uncorrelated to each other, the covariance term becomes zero. The standard deviation
Major statistical attributes of coal sampling dataset used for analysis.
Developing subsidiary-specific and CIL-wide linear regression models.
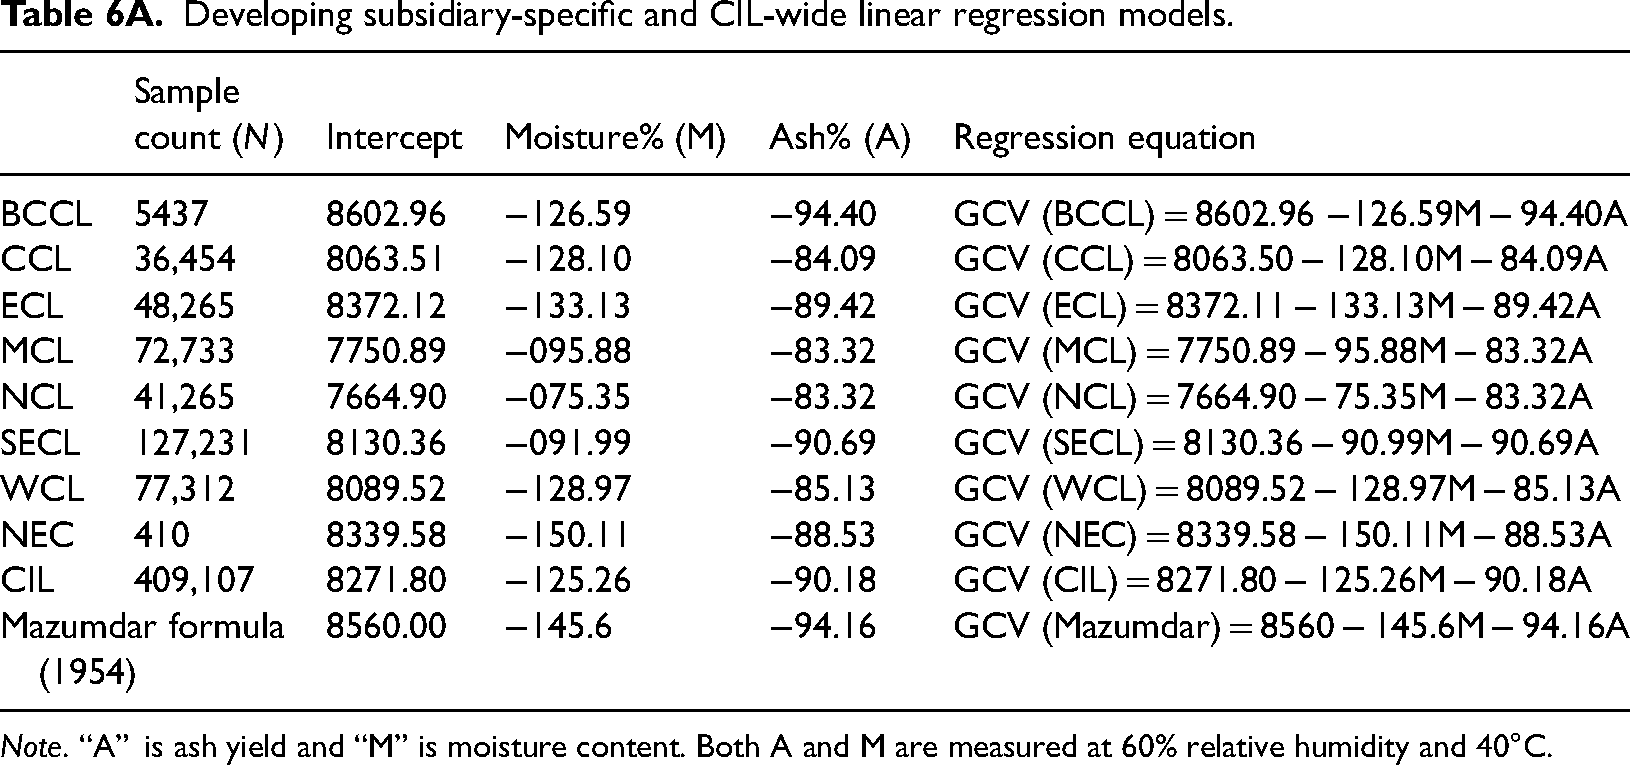
Note. “A” is ash yield and “M” is moisture content. Both A and M are measured at 60% relative humidity and 40°C.
Comparing prediction accuracy among subsidiary-specific, CIL-wide, and Mazumdar regression formula.
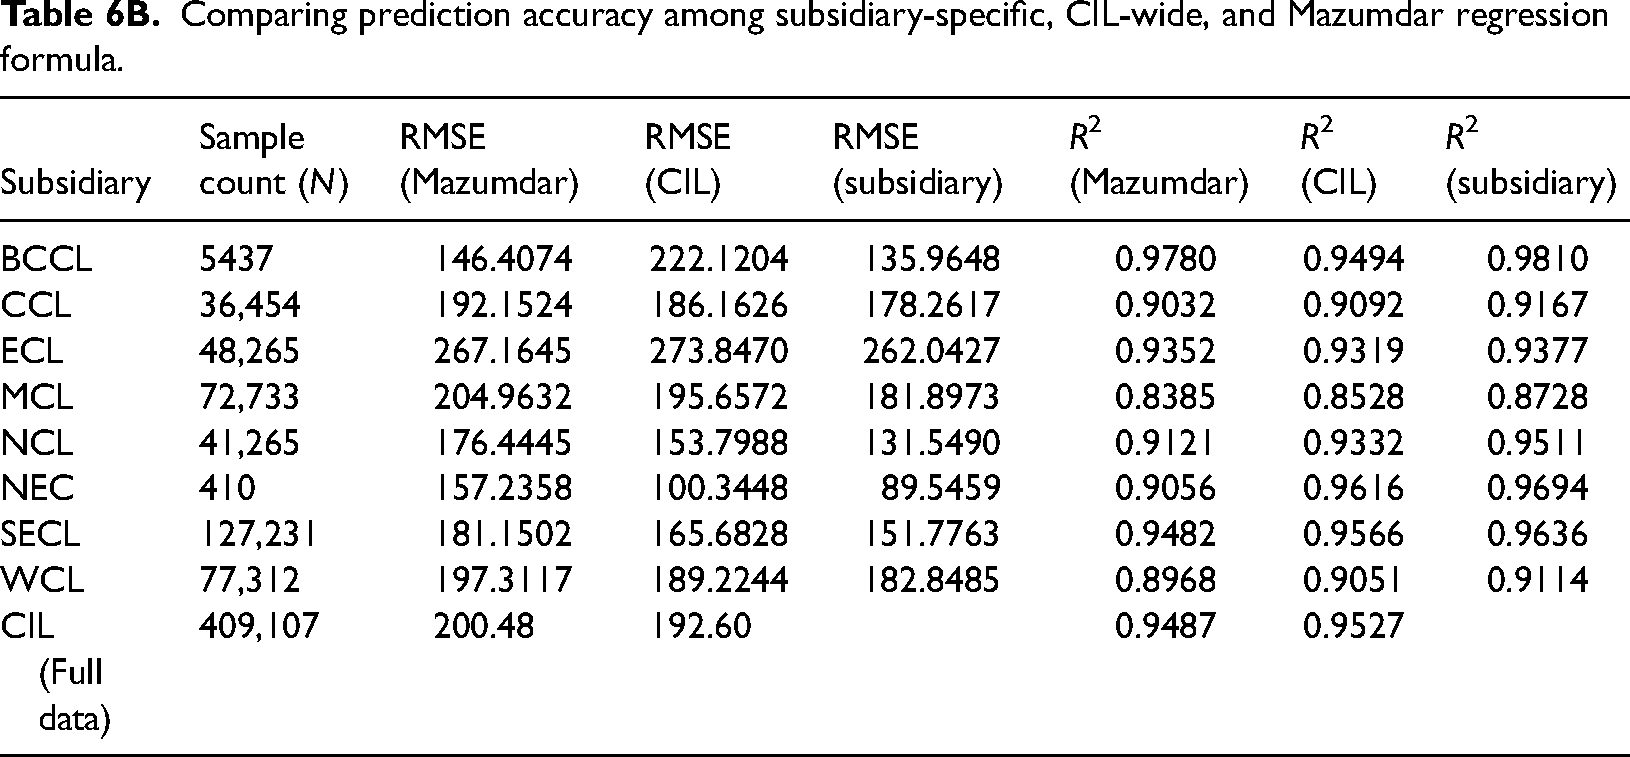
Applying the precision limits (“reproducibility”) for moisture and ash stipulated in IS 1350 to the regression formula derived for SECL, the subsidiary with highest sample count (ref.: Table 6B), yields the precision of predicted GCV as 6.1 kcal/kg. Thus, no matter whatever empirical equation we develop for prediction of GCV based on proximate parameters like moisture and ash, the predicted value will contain uncertainty similar to that amount. But, the present policy of grade classification is sensitive to even a single kcal/kg difference at boundary points. Thus, even if both seller and buyer agree to a common regression formula of having the best predictive potential, they still have to contend with inherent imprecision of that order.
Role of error dispersion
In evaluating the acceptability of any empirical equations to the existing policy framework of coal and power sector, we propose two additional tests that focus on the nature and distribution of absolute errors of prediction (AE in each sample) and the quantum of uncertainty that buyers and sellers must encounter even if measurement of GCV is done in a laboratory by the best available bomb calorimeter. This uncertainty, expressed as “repeatability” and “reproducibility” of the test for GCV, is 30 kcal/kg and 65 kcal/kg, respectively, as per the governing Indian Standard 10 .
In the first test
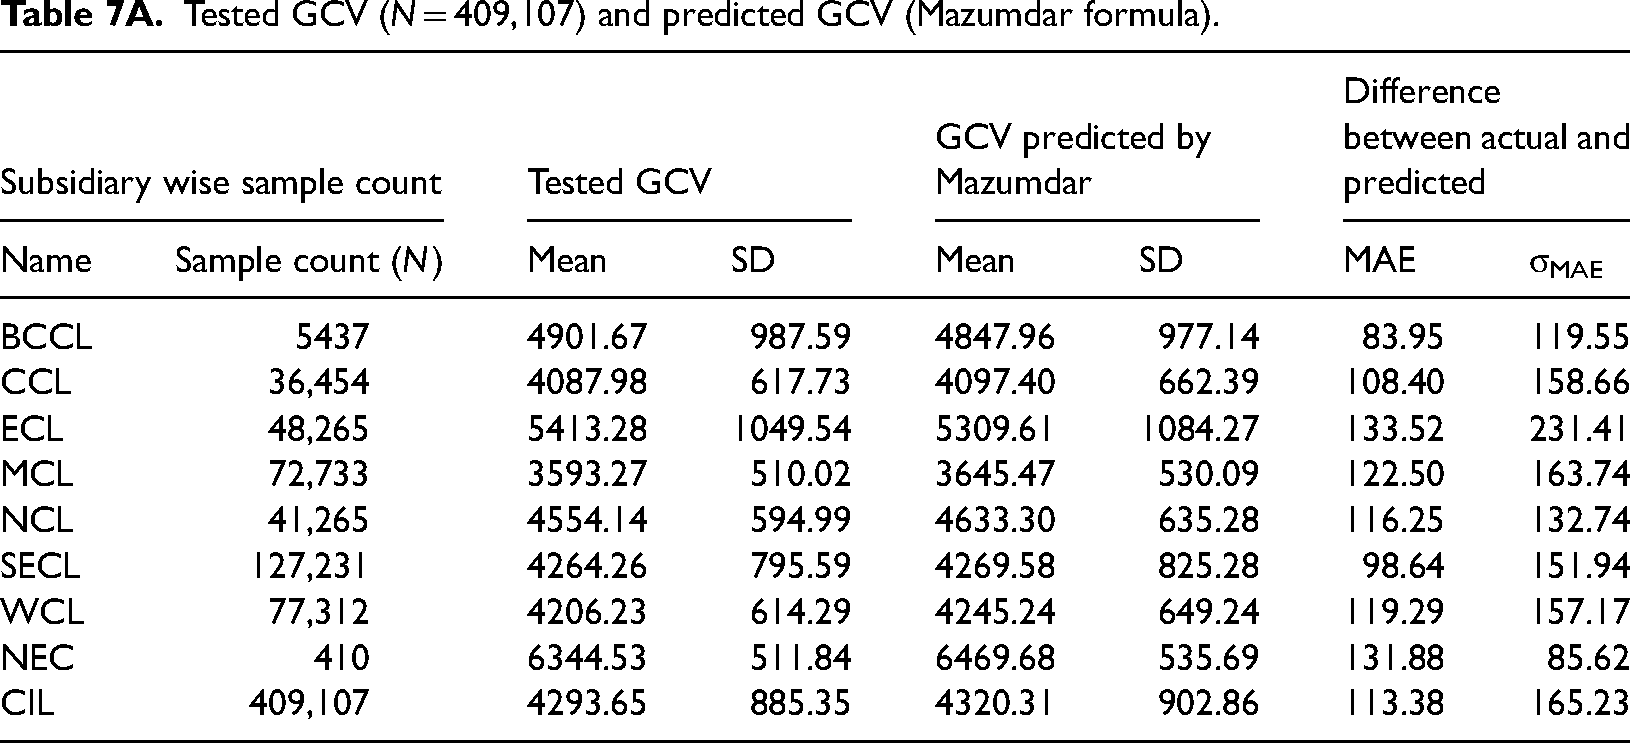
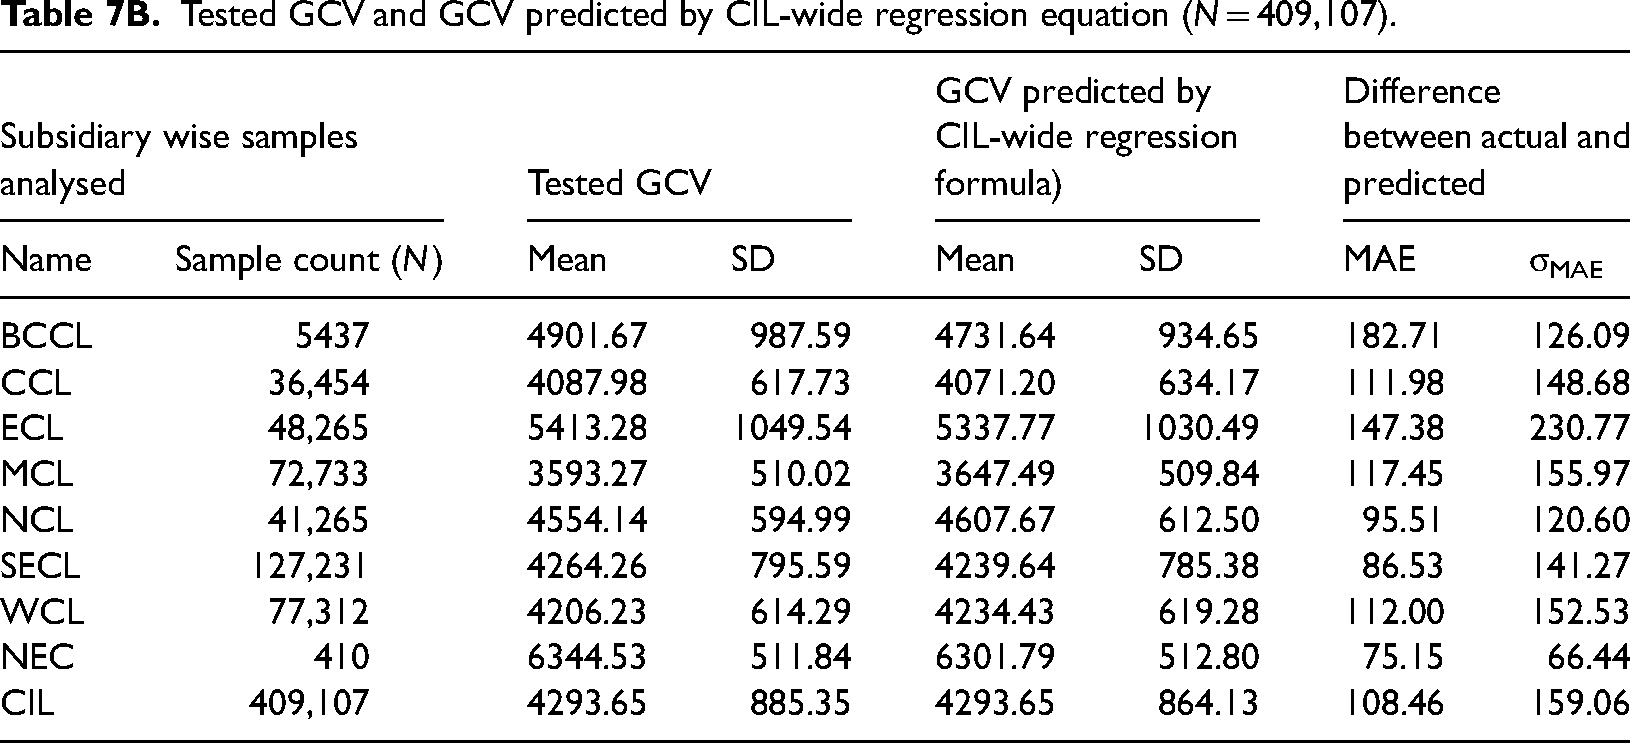
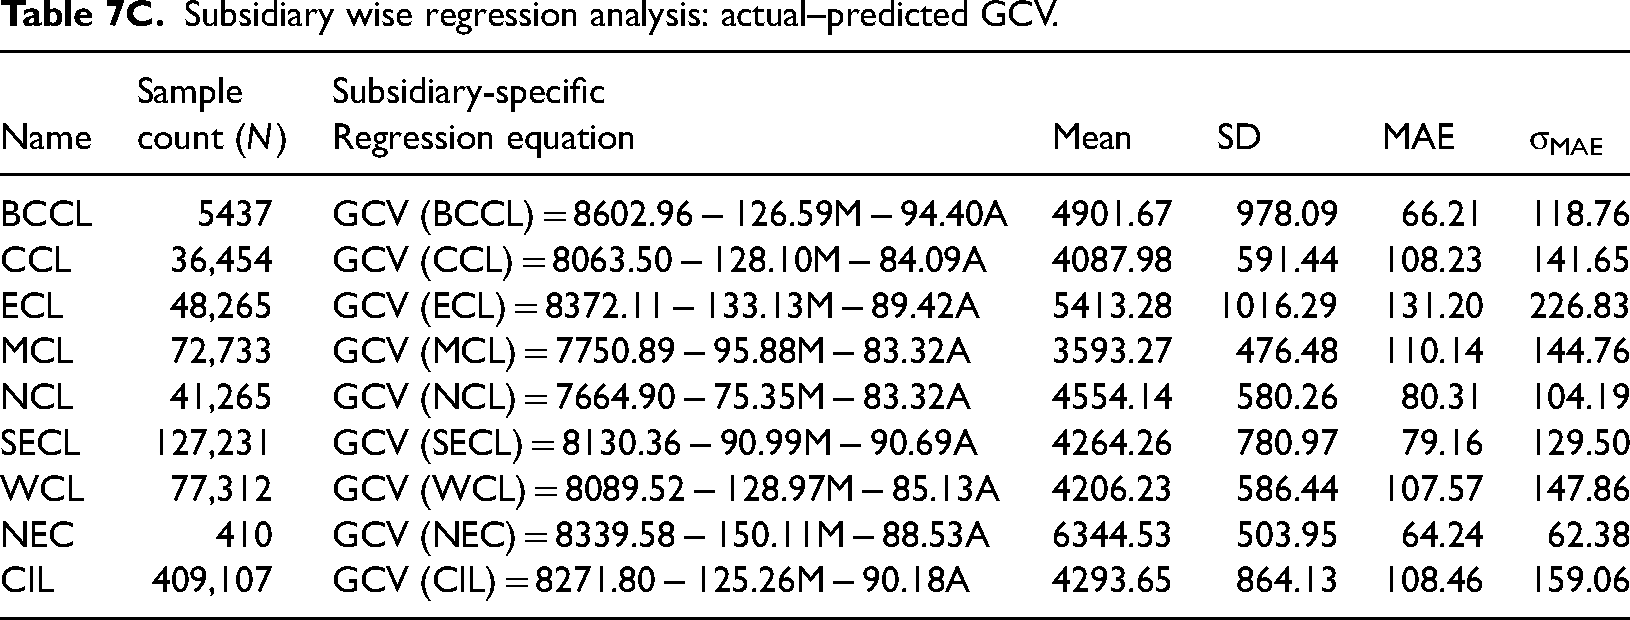
We find out the percentage of samples where the “absolute error” (difference between tested and predicted GCV) exceeds the “reproducibility” limit of 65 kcal/kg. We consider “reproducibility” limit, since it is the magnitude of inter-laboratory difference in the value of tested GCV that triggers referee testing and consequential test overload. If in an overwhelming majority of cases errors fall below this threshold (65 kcal/kg), one can infer that use of a regression equations for GCV-related polices might appear acceptable to stakeholders of coal value chain (Tables 7A, 7B, 7C, and 8).
Tested GCV (N = 409,107) and predicted GCV (Mazumdar formula).
Tested GCV and GCV predicted by CIL-wide regression equation (N = 409,107).
Subsidiary wise regression analysis: actual–predicted GCV.
Mean absolute error.
Standard deviation of MAE for the subsidiary dataset.
Prediction accuracy vs. policy threshold: error distribution study.
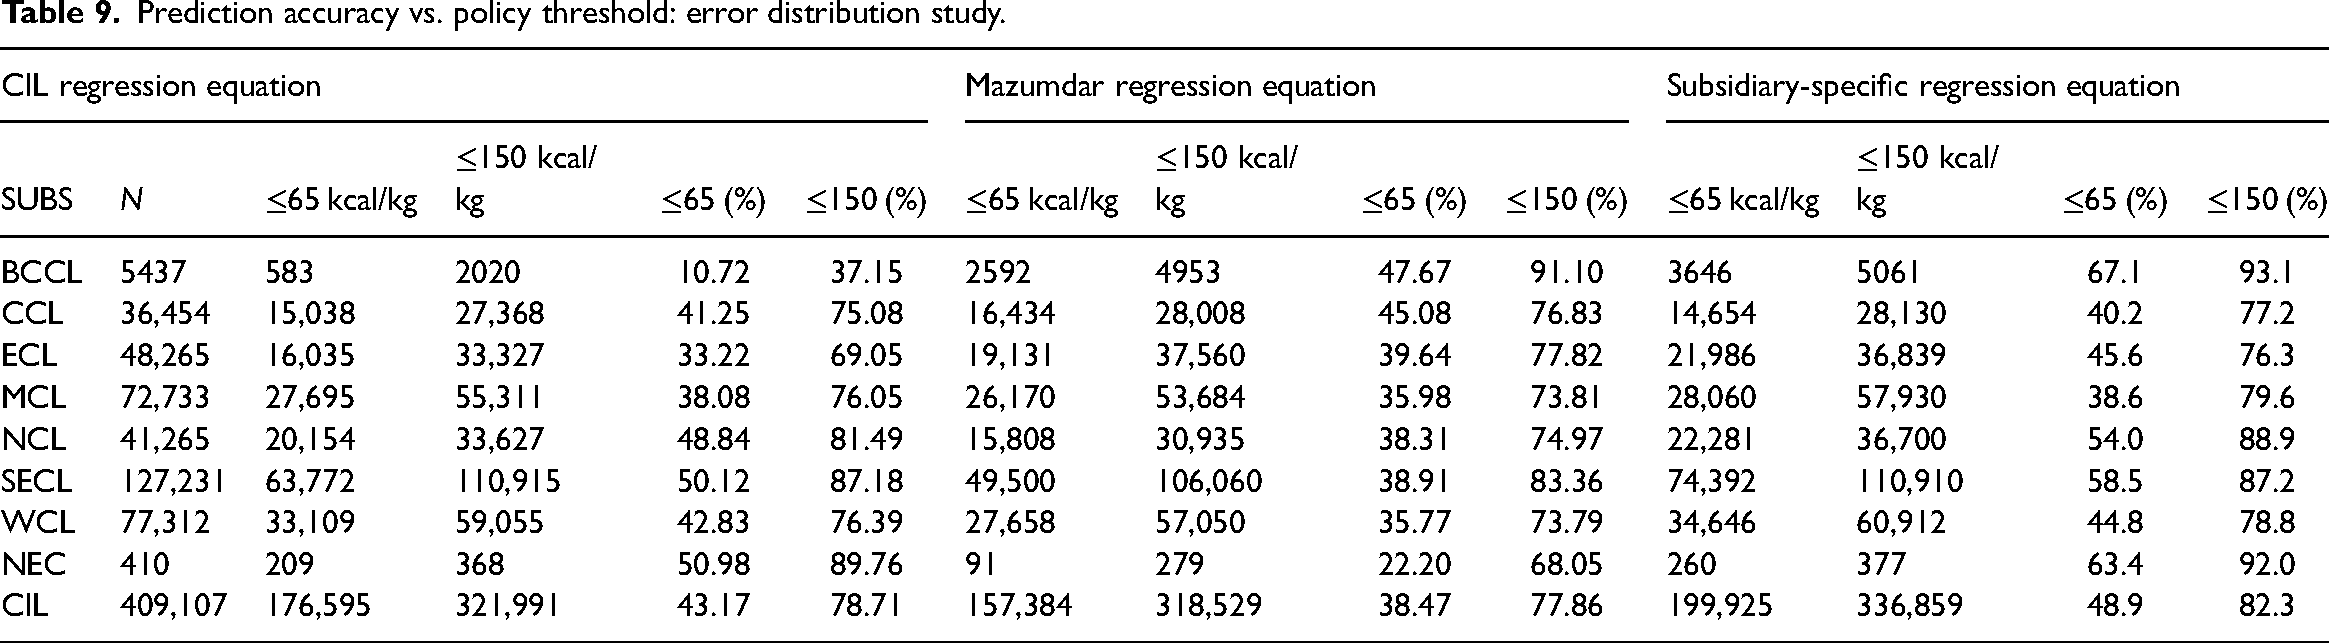
The second test, which we may call the “semi-bandwidth test”, hypothesizes that an error exceeding 150 kcal/kg (half the calorific bandwidth of 300 kcal/kg between two successive grades) is more likely to result in change of grade for the coal consignment and impacting transaction value and energy content expected by an end-user, especially if the end-user is a power producer. Thus, if in an overwhelming number of cases the errors fall below this threshold (150 kcal/kg), stakeholders may agree for a good empirical equation for prediction.
Evidence-based policy
Using regression-based empirical equation to predict GCV—arguably the most important quality attribute of coal for coal and power sector—in place of the current policy of discovering it from laboratory testing does call for a basic understanding of errors on the touchstone of the above two hypothesized tests. The use of statistical information is vital for making evidence-based decisions that guide the implementation of new policy, monitor existing policy, and evaluate the effectiveness of policy decisions. It is therefore essential that policy makers are equipped with the skills and ability to understand, interpret, and draw appropriate conclusions from statistical information (Australian Bureau of Statistics, 2010). The error sets and their distribution below the above two thresholds (65 kcal/kg and 150 kcal/kg) resulting from Mazumdar formula, the unified CIL-wide and subsidiary-specific regression equations are depicted below.
Analysis
Application of Mazumdar formula to the dataset reveals that in 38.47%, the errors were below 65 kcal/kg. In other words, 61.53% (100%-38.47%) of samples of our dataset have an error value exceeding 65 kcal/kg. The figure for the semi-bandwidth threshold (≤150 kcal/kg) for Mazumdar formula is 22.14% (100% − 77.86%). The unified CIL-wide regression equation fares marginally better than Mazumdar formula on the whole, but does not have the same trend for all subsidiaries. Incidentally, for NCL, on whose coal samples were studied by Mazumdar, CIL-wide unified regression formula fares appreciably better. The subsidiary-specific regression equations emerge as least error producing among the three models with 41.1% and 17.7% of samples failing our two hypothesized policy thresholds.
The distribution of errors arising from application of the above three regression models for one subsidiary i.e. SECL having the highest sample count of 127,231 is illustrated below.
Observation
The above analysis shows that subsidiary-specific regression equations always outperform both CIL and Mazumdar regressions in their predictive capability. As the percentage of samples falling within precision limits specified by policy standards is a crucial metric, the robustness of these equation (high R2 and low RMSE), at first sight, may suggest that subsidiary-specific regressions could be acceptable as policy in place of laboratory determination of GCV. But a scenario where 51.1% of the dataset samples surpass the reproducibility limit and 17.7% exceed the half-bandwidth threshold is not likely to be acceptable under the existing policy framework.
Nevertheless, considering the remarkable convergence and relatively moderate MAE, the use of such empirical equations might find suitability for a customer making frequent and regular purchases form a seller. In such the bi-directional nature of errors are likely to even out over numerous transactions and long period resulting in minimal financial repercussion for both the buyer and seller.
On the flip side, one-time customers, who sporadically purchase coal, may be hesitant to embrace such a policy. Their reluctance would stem from the potential disparity between the GCV determined by an empirical equation at the seller's end and the GCV revealed through laboratory testing at the buyer's laboratory with a bomb calorimeter. It is crucial to bear in mind that under the current grade classification policy, characterized by fixed-calorie band-widths and rigid boundaries between grades, even a single kcal/kg difference at grade boundaries could lead to a change in consignment grade and, consequently, its value. This poses a challenge for any predictive equation to be unequivocally accepted, especially by one-time customers.
The following case study underscores the potential risk in using regression formula-based GCV determination instead of bomb calorimeter.
Use of empirical formula in power plant and its policy consequence: a case study
Tamil Nadu Generation and Distribution Corporation Limited (TANGEDCO), responsible for electricity generation and distribution in Tamil Nadu, opted for the formula-based method of GCV determination in some of their power plants instead of bomb calorimeter accepting non-coking coal worth 13.79 lakh MT of coal, valued at 411.63 crores. An audit conducted by CAG (Comptroller and Auditor General of India, 2021) revealed that the variation between the formula-based GCV and bomb calorimeter-based GCV was a considerable 191 kcal/kg. This significant discrepancy raised concerns about the accuracy of GCV determination by empirical formula and its potential impact on the computation of plant efficiency for tariff calculation. TANGEDCO's in-house laboratory testing further revealed variations in GCV, ranging from 50 to 68 kcal/kg (April 2014–July 2017) and a more substantial 194–294 kcal/kg (August 2017–March 2019).
After CAG highlighted this issue, government acknowledged the limitations of the empirical formula-based approach and committed to discontinuing its usage and switching back to the bomb calorimeter method for more accurate GCV determination and tariff calculations.
Conclusion
The efficacy of predictive empirical equations for GCV, developed through linear regression models, within the current policy framework of the coal and power sector hinges more on the distribution of errors than the inherent robustness of these equations. While the continual development of empirical equations is of theoretical interest to researchers, their practical utility is constrained within the current policy matrix, specifically addressing challenges such as test overload and the proliferation of testing agencies.
An analysis of differences (errors) between laboratory and predicted GCV, derived from empirical equations at various levels (CIL and subsidiaries) using a massive dataset of coal sample-test results used in this study, reveals that they are not precise enough to be completely relied upon for coal consignment valuation by sellers like CIL or energy charge determination by thermal power plants under the current policy constraints.
Despite these limitations, subsidiary-specific empirical equations from the study can be instrumental in mitigating test overload for large, long-term continuous customers such as NTPC using laboratory testing at pre-determined intervals as a feedback loop. For enhanced accuracy, area and mine-specific empirical equations can also be developed, offering a more tailored approach for customers consistently sourcing coal from a specific mine throughout the year. However, these solutions may not adequately address the needs of one-time purchasers or those making infrequent coal purchases in a year.
The present policy of coal valuation, based on grades characterized by a fixed bandwidth (300 kcal/kg) with rigid boundaries, presents a statistical anomaly by not accounting for the uncertainty (both repeatability and reproducibility limits) inherent to bomb calorimeter-determined GCV. This uncertainty is a crucial aspect of the policy-specified coal testing standard. As per the current policy, the declaration of a coal seam's grade by the national regulator does not indicate the uncertainty associated with the declared grade. Since a customer is first required to make payment to CIL on the basis of the declared grade and large deviation from testing found later generates trust deficit among stakeholder. Any measurement must be reported with the uncertainty associated with it.
As found from this study, a single unified regression-based empirical formula for all subsidiaries is neither desirable nor more accurate than predictions suited to a particular subsidiary. Given the rise of AI and computing power, such formulae can be developed and continuously updated for any region, coal field, or mine. However, translating this to policy will happen only when such methodology is recognized within the policy framework.
In the broader perspective, while regression equations contribute significantly to our understanding, their application is contingent on policy adjustments that acknowledge and incorporate the inherent uncertainties in GCV determination so that both policy and measurement are aligned. This is the cardinal principle for designing an evidence-based policy framework.
Implication and limitation of study
Implication
The financial impact of accurately predicting GCV is significant, as it can prevent substantial revenue loss due to repetitive coal testing along the pit-to-power value chain. For example, the cost of coal testing, as stipulated in the initial tripartite agreement signed between CIL, Power Utilities, and CIMFR (the designated third-party testing agency) in 2016, was set at Rs. 8.8 11 per ton. At this price, the estimated cost for assessing the GCV of 586 MMT of coal dispatched to the power sector in 2022–2023, using a bomb calorimeter at both loading and unloading points, would amount to approximately Rs. 1031 12 crores—a sum that is more than the annual revenue of 78% 13 of Central Public Sector Enterprises in India. Similarly, almost 30% of cases being sent to referee laboratories today due to either the buyer or seller challenging the laboratory test result of the TPA could be drastically brought down. In fact, despite limitations, the present study does indicate that the subsidiary-specific model can be effectively used for long-term, high-volume customers like NTPC.
Limitation
The study compares actual and predicted values of GCV using only the Mazumdar equation, which, although widely used for obtaining quick estimate of GCV, relies solely on two proximate analysis parameters—ash and moisture. The dataset released by CIL does not include information on volatile matter (VM) or fixed carbon (FC) parameters related to the samples. If these data had been available, a more nuanced analysis could have been conducted, potentially providing deeper insights into the role these factors play in influencing the calorific value of Indian non-coking coal. Similarly, the study analyzes the utility of regression equation in a region-wise manner (for each subsidiaries of CIL). There is scope to extend the analysis to major coal beds within each region for detecting possibility of more accurate seam-specific empirical models.
Footnotes
Declaration of Conflicting Interests
The authors declared no potential conflicts of interest with respect to the research, authorship, and/or publication of this article.
Funding
The authors received no financial support for the research, authorship, and/or publication of this article.