
Abstract
The hydrocarbon potential of the Bodong Sag remains unclear. Investigation and comprehensive evaluation of Paleogene lacustrine source rocks is essential to determine the exploration potential and direction. This study examined the Paleogene source rocks using organic geochemical methods, including total organic carbon (TOC), Rock-Eval pyrolysis, maceral composition, vitrinite reflectance (Ro), and kinetic analysis. For the first time in this study area, a three-dimensional (3D) kinetics-based petroleum system modeling approach was employed to reconstruct the burial history, thermal maturity, and hydrocarbon generation history of the source rocks. The resource mass was evaluated based on the calculated generation mass. Results indicate that the third member (E2s3) and first member (E3s1) of the Shahejie Formation are mainly Type II1 organic matter, exhibiting high generation potential. The third member of the Dongying Formation (E3d3) contains mixed Type II1 and II2 organic matter, with moderate potential. The E2s3 and E3s1 source rocks matured early, entering the oil window in the Early Oligocene (∼30.3 Ma) and Middle Oligocene (∼28 Ma), respectively, and are currently in the wet gas to dry gas stage. The E3d3 source rocks matured later, entering the oil window at the end of the Oligocene (∼24.6 Ma) and are currently in the late oil to the wet gas stage. Subsidence and burial have resulted in higher maturity in the southern subsag compared to the northern subsag, with the margins remaining in low maturity to immature stages. Resource estimates for the Bodong Sag source rocks are quantified at 8.33 × 10⁸ t of oil and 1.68 × 10¹¹ m3 of gas. E2s3, E3s1, and E3d3 contribute 41.62%, 33.95%, and 24.43% respectively, with E2s3 source rocks being the major contributor. The southern subsag, accounting for 76.92%, is the primary hydrocarbon generation kitchen. The significant increase in natural gas resources highlights the prospects for natural gas exploration in the Bodong area.
Keywords
Introduction
Lacustrine petroleum systems are characterized by organic-rich, fine-grained sediments, limited lateral extent, and strong heterogeneity (Keym et al., 2006), yet they play a significant role in global oil and gas production (Chen et al., 2022; Hakimi et al., 2023; Hao et al., 2011; Harris et al., 2004; Jiang et al., 2016; Kumar et al., 2022, 2024; Li et al., 2024; Neumann et al., 2003; Singh et al., 2020; Zhao et al., 2021). The Bohai Bay Basin (BBB) is the petroliferous basin with the highest crude oil production from lacustrine petroleum systems in eastern China (Figure 1(a)) (Hao et al., 2009a, 2011; Li and Qiu, 2017; Yang and Xu, 2004). The Bodong Sag, situated to the west of the Tanlu Fault Zone (TLFZ), is a representative marginal sag in the eastern BBB (Figure 1(b)). It is characterized by the Paleogene deposition of lacustrine fine-grained sediments enriched in organic matter and exhibiting significant heterogeneity. Over the past few decades, petroleum exploration in the Bodong Sag has discovered a series of large- and medium-sized oil fields (Gong et al., 2010; Hao et al., 2009a, 2009b; Tian et al., 2014). Previous studies mainly focused on sedimentary and tectonic evolution (Feng et al., 2023; Huang et al., 2016; Huang and Liu, 2014; Sun et al., 2020; Ye et al., 2021), as well as the origin and formation mechanisms of these oil fields (Hao et al., 2009b; Teng et al., 2019; Tian et al., 2014; Ye et al., 2020a, 2020b). Investigations of the Paleogene lacustrine source rocks in the Bodong Sag are currently limited and there is almost no work to evaluate the resource potential, restricting further oil and gas exploration and development. Therefore, a systematic and comprehensive evaluation of the potential of these organic-rich intervals is essential to refine our understanding of the lacustrine petroleum systems in the Bodong Sag.
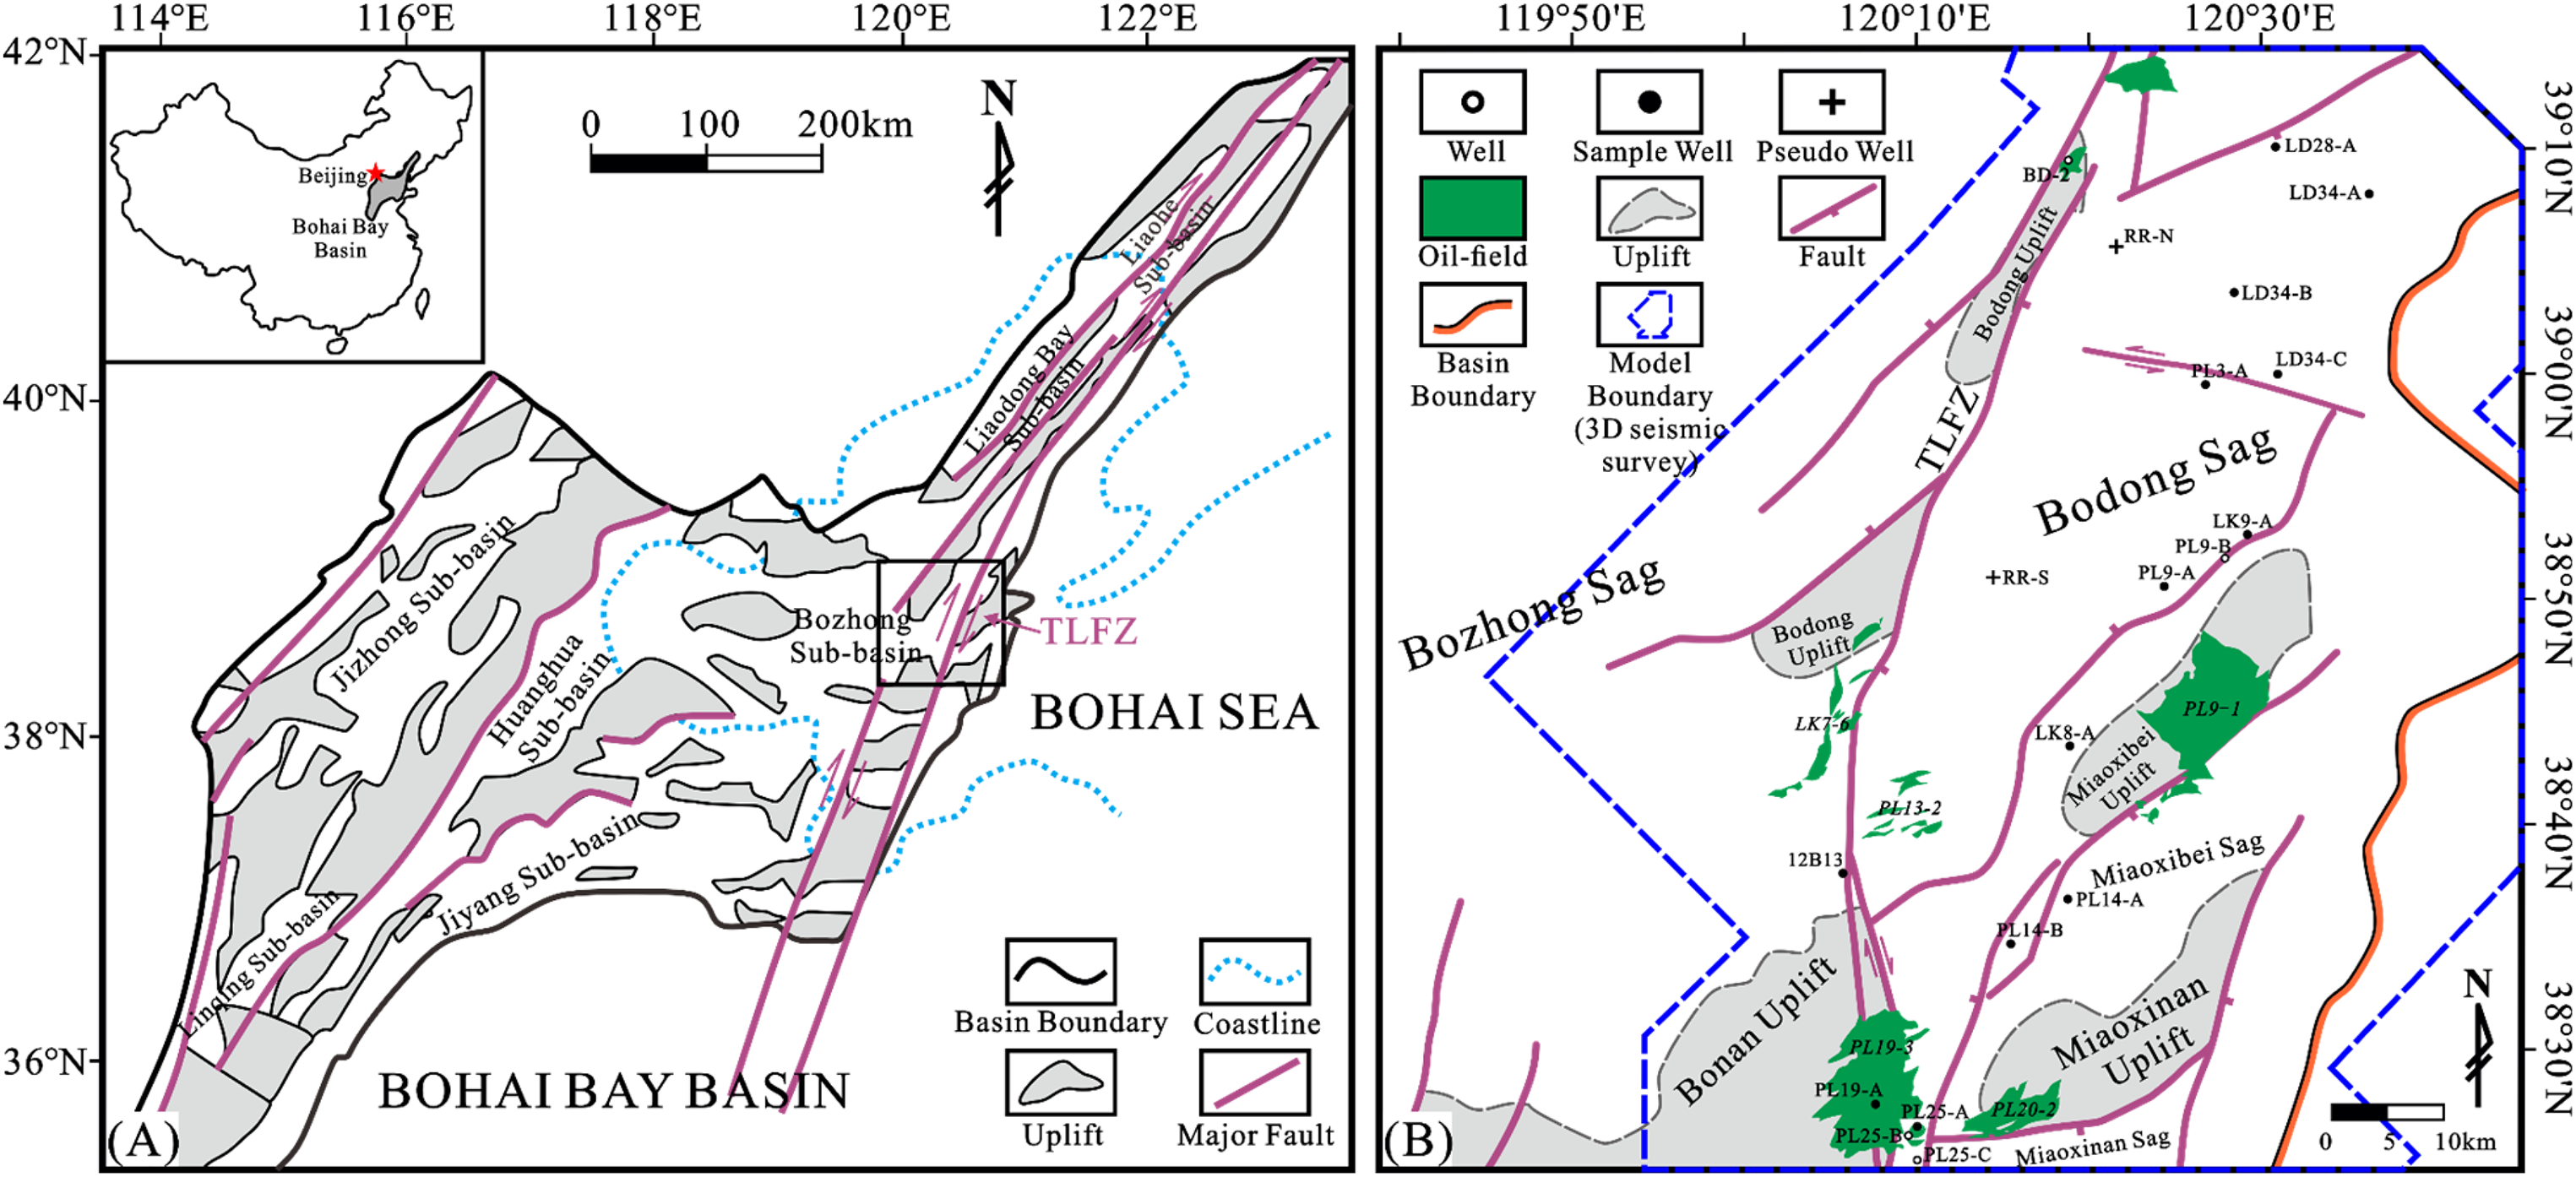
(a) location of the Bohai Bay Basin, Tanlu Fault Zone (TLFZ), and subbasins of the Bohai Bay Basin (modified after Hao et al., 2009a). (b) Location of the study area and wells, showing the structural domains and main traps. The hollow circles represent wells, the solid circles represent sampled wells, and the cross symbols represent pseudo wells. The solid navy blue line indicates the location of the A-A’ sectional profile. The blue dashed line indicates the 3D seismic survey, which is the stratigraphic boundary of the conceptual model.
Research on lacustrine source rocks in the BBB can be summarized in the following four aspects: (1) Studies on the depositional paleoenvironment of source rocks using organic geochemistry, organic petrology, and palynological analysis, exploring the controlling effects of the depositional paleoenvironment (water depth, salinity, redox conditions, preservation conditions, etc.) on organic matter accumulation (Hao et al., 2011; Hu et al., 2023; Sun et al., 2019; Wang et al., 2020b; Wang et al., 2022; Zhao et al., 2021). (2) Studies on source rock evaluation using generation potential methods based on Rock-Eval pyrolysis experimental data (Chen et al., 2022; Jiang et al., 2016; Pang et al., 2005; Wang et al., 2020a). (3) Investigation of the kinetic characteristics of different types of organic matter (Li et al., 2024). (4) One-dimensional (1D) petroleum system modeling to study source rock evolution, including the reconstruction of burial history, thermal maturity, and hydrocarbon generation history (Lei et al., 2024). Currently, a mature understanding of the depositional paleoenvironment of the Paleogene lacustrine source rocks in the Bodong Sag has been established (Hao et al., 2011, 2009a, 2009b). However, there are still the following issues in the evaluation of source rock potential: (1) Insufficient number of source rock samples (Wang et al., 2020a) in the Bodong Sag and improper sample preservation (Chen et al., 2018) have limited the effectiveness of source rock evaluation using the generation potential method. (2) The study of kinetic characteristics and parameters has not been applied to the practical evaluation of source rock resources. (3) The 1D petroleum system modeling has not considered the detailed volume of the sedimentary units, which affects the accuracy of hydrocarbon generation potential calculation. Therefore, this study is the first to comprehensively evaluate the resource potential of the Paleogene lacustrine source rocks in the Bodong Sag using a kinetics-based three-dimensional (3D) petroleum system modeling approach, to provide insights for future oil and gas exploration in the Bodong Sag.
The aims of this study can be summarized as follows: (1) to determine the geological (thickness and distribution) and geochemical (total organic carbon (TOC) and hydrogen index (HI)) characteristics of the Paleogene source rocks under the constraints imposed by the sedimentary facies and considering heterogeneity; (2) to establish the maturity models through thermal correction and calibration; (3) to quantitatively reconstruct the hydrocarbon generation process; and (4) to evaluate the resource potential by discussing the effects of temperature and kinetics on the thermal maturity and hydrocarbon generation.
Geological setting
The BBB is a rift basin formed at the top of the North China Craton (Hao et al., 2007; Huang and Pearson, 1999). The tectonic evolution of the BBB since the Cenozoic has been complex and can be divided into two stages: (1) Paleogene synrift (65.0–24.6 Ma) and (2) Neogene to Quaternary postrift thermal subsidence (24.6 Ma to present) (Allen et al., 1997; Gong et al., 2010; Hsiao et al., 2010; Hu et al., 2001) (Figure 2). A series of grabens and half-grabens developed along NW- and NE-trending faults due to rifting and subsidence (Huang and Pearson, 1999). During the Paleogene syn-rift stage, three sets of predominantly fluvial-lacustrine sediments, confined by grabens and half-grabens were formed. From bottom to top, they are the Kongdian Formation (E1−2k, 65.0–50.5 Ma), the Shahejie Formation (E2−3s, 50.5–32.8 Ma), and the Dongying Formation (E3d, 32.8–24.6 Ma), respectively (Huang and Liu, 2014) (Figure 2). The Neogene to Quaternary post-rift witnessed the development of fluvial sediments, including the Guantao Formation (N1g, 24.6–12.0 Ma), the Minghuazhen Formation (N1mL + N2mU, 12.0–2.0 Ma), and the Pingyuan Formation (Qp, 2.0 Ma to present) (Gong, 1997; Huang and Liu, 2014) (Figure 2).
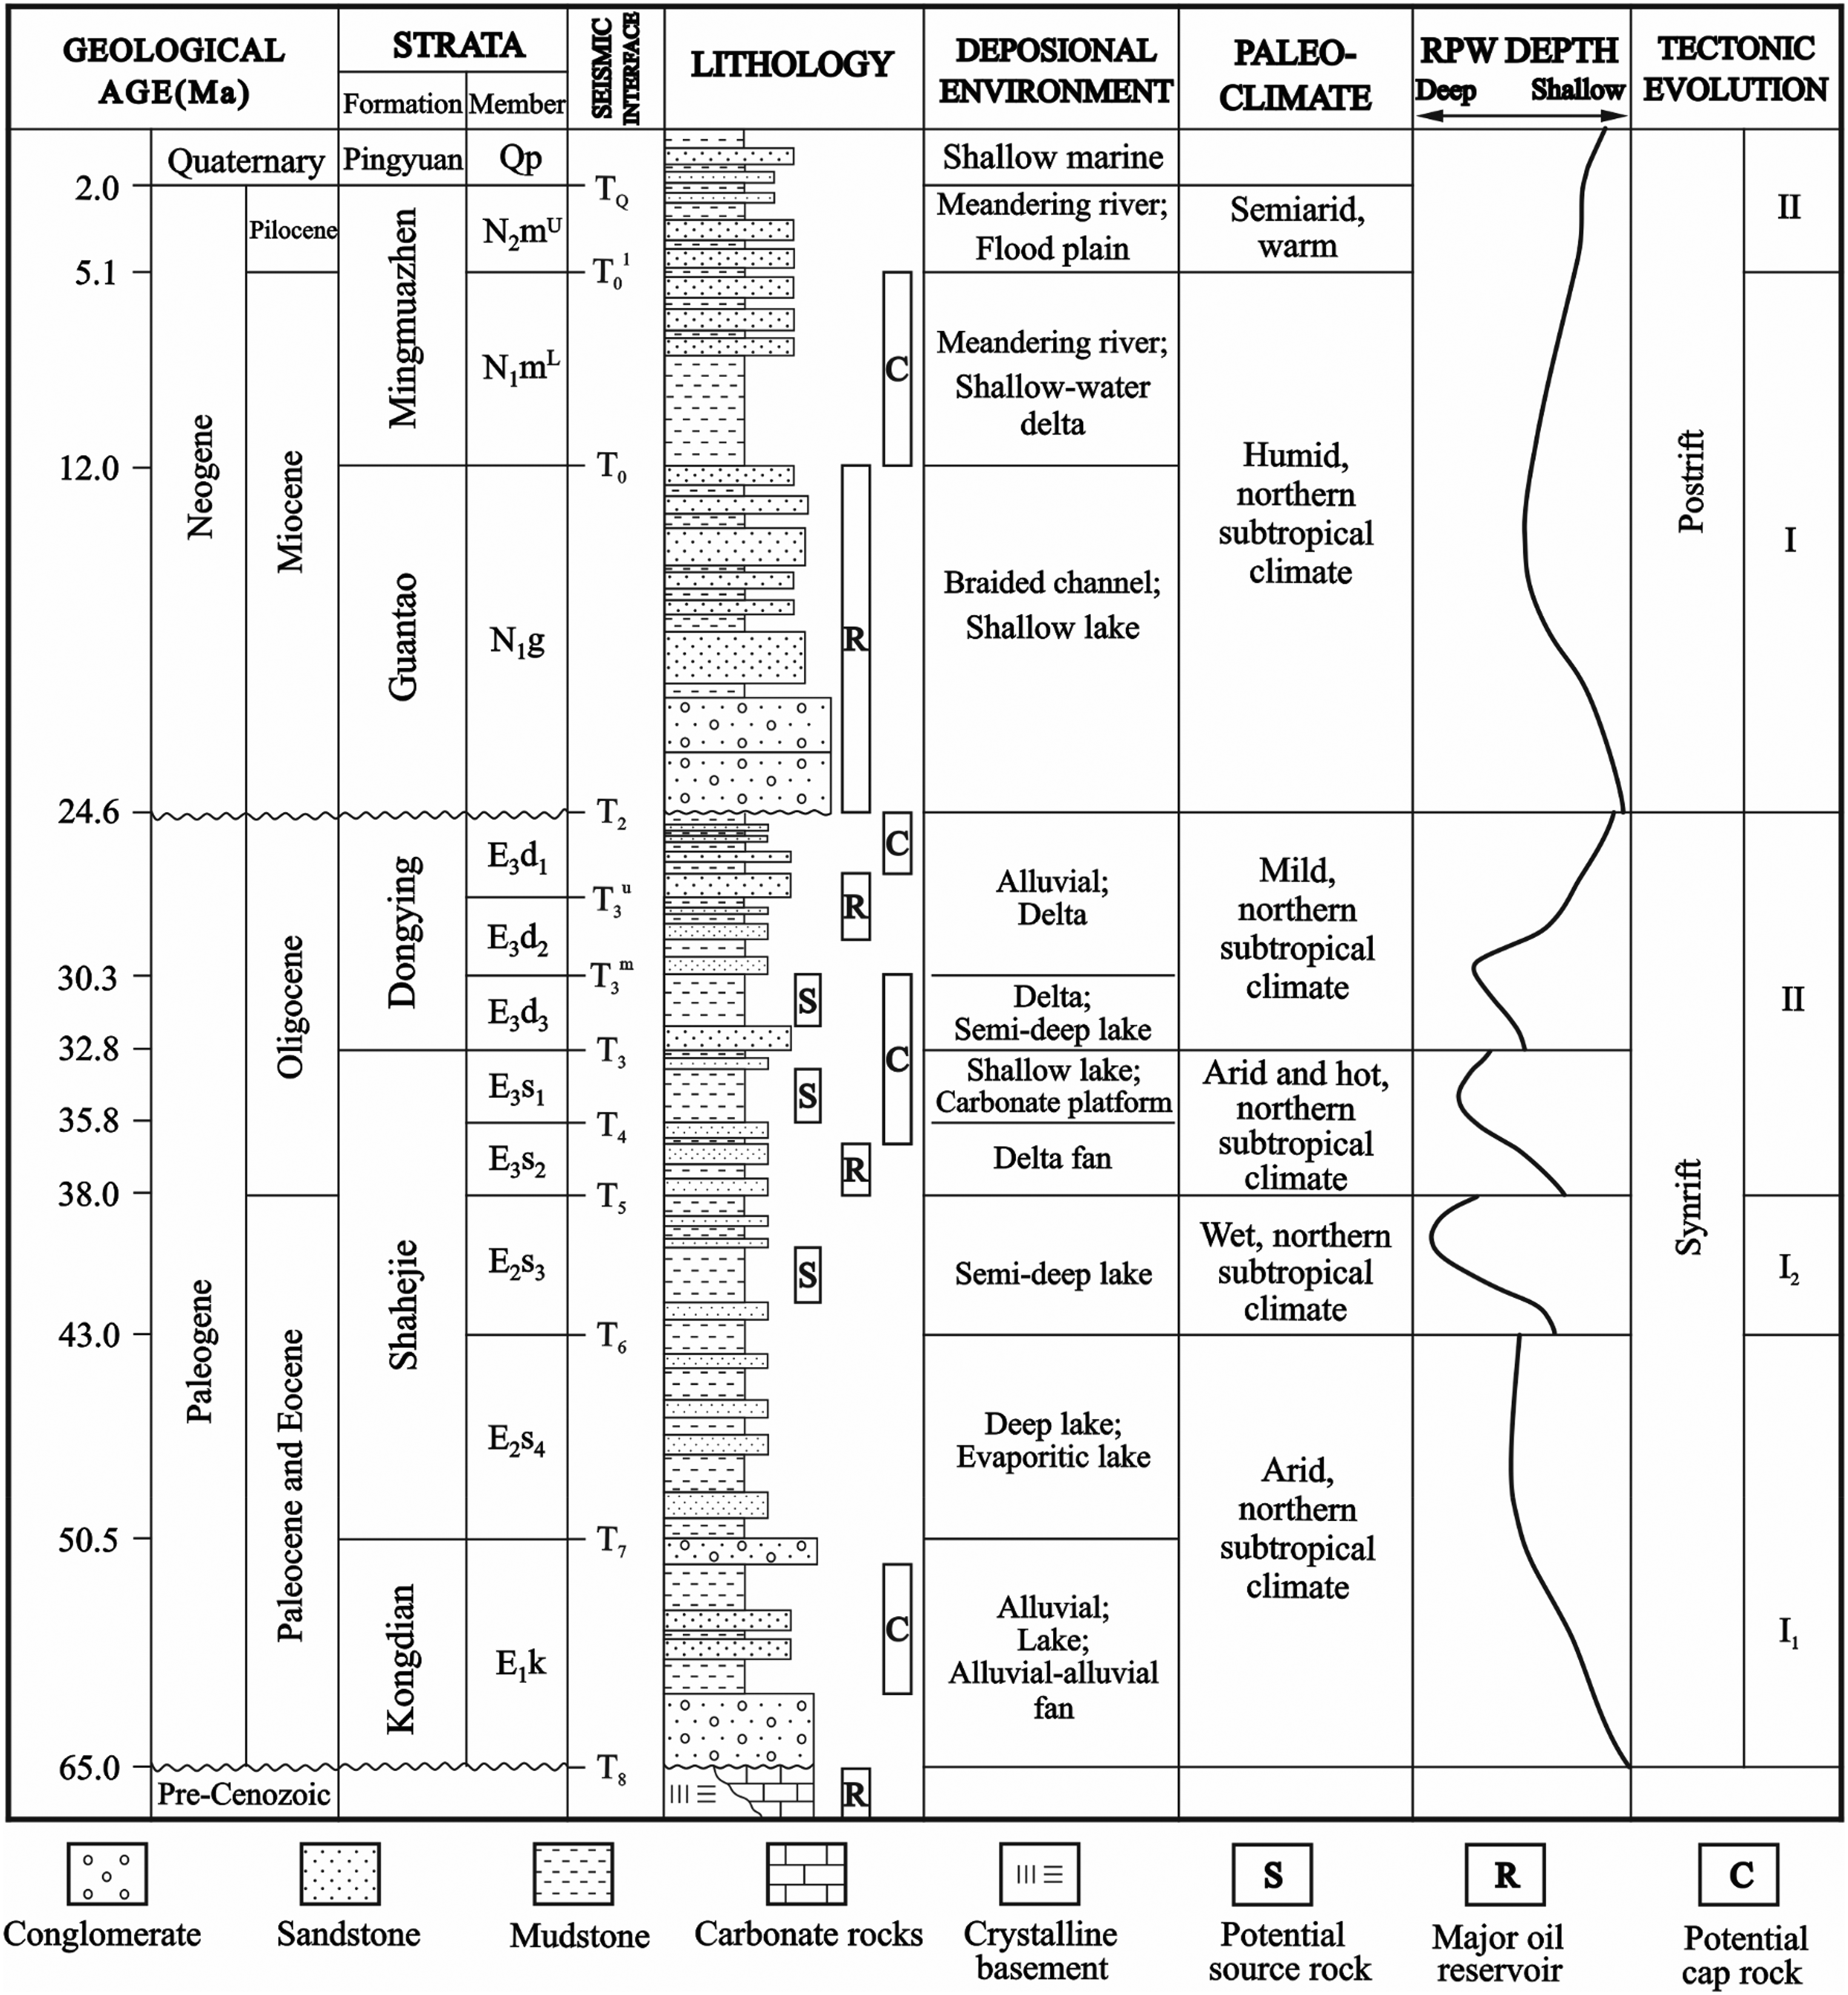
Generalized stratigraphy of the Bohai Bay Basin, modified from Hao et al. (2009a). Abbreviations of formation: Qp: Quaternary Pingyuan Fm; N2mU: the Upper Minghuazhen Fm; N1mL: the lower Minghuazhen Fm; N1g: the Guantao Fm; E3d1: the first member of the Dongying Fm; E3d2: the second member of the Dongying Fm; E3d3: the third member of the Dongying Fm; E3s1: the first member of the Shahejie Fm; E3s2: the second member of the Shahejie Fm; E2s3: the third member of the Shahejie Fm; E2s4: the fourth member of the Shahejie Fm; Ek: the Kongdian Fm.
The BBB consists of six sub-basins: Liaohe, Bozhong, Jiyang, Huanghua, Jizhong, and Linqing (Allen et al., 1997) (Figure 1(a)). The Bodong Sag is located in the eastern part of the Bozhong subbasin, adjacent to the Bozhong Sag to the west and the Jiaoliao Uplift to the east, and covers an area of nearly 5000 km2 (Liu et al., 2015; Wu et al., 2013) (Figure 1(b)). It formed on top of a complex basin basement and experienced a tectonic evolution similar to that of the BBB, characterized by multiple episodes of rifting and subsidence (Sun et al., 2020). The Bodong Sag exhibited a NNE strike with a half-graben structure along the eastern branch of the TLFZ (Liu et al., 2015). Controlled by several sets of complex fault systems, the Bodong Sag is roughly divided into two subsidence centers, north and south, with a maximum basement burial depth exceeding 8000 m (Liu et al., 2015). During the Paleogene synrift stage (65.0–24.6 Ma), three sets of high-quality source rocks developed, namely the third member of the Dongying Fm (E3d3), the first member of the Shahejie Fm (E3s1), and the third member of Shahejie Fm (E2s3) (Liu et al., 2017a). These formations consisted of dark mudstones deposited in lacustrine environments (Figure 2) and served as the primary sources of hydrocarbons in the Bodong Sag. During the Neogene postrift stage, the Guantao Fm (N1g) and Minghuazhen Fm (N1mL + N2mU) were deposited in fluvial and shallow-water delta environments, forming a favorable reservoir-cap combination conducive to hydrocarbon accumulation (Sun et al., 2020; Zhao et al., 2018a) (Figure 2). Additionally, from the Eocene to the Oligocene, fan deltas, deltas, and subaqueous fan bodies were widely developed, forming potential conventional or tight reservoirs.
Dataset and methods
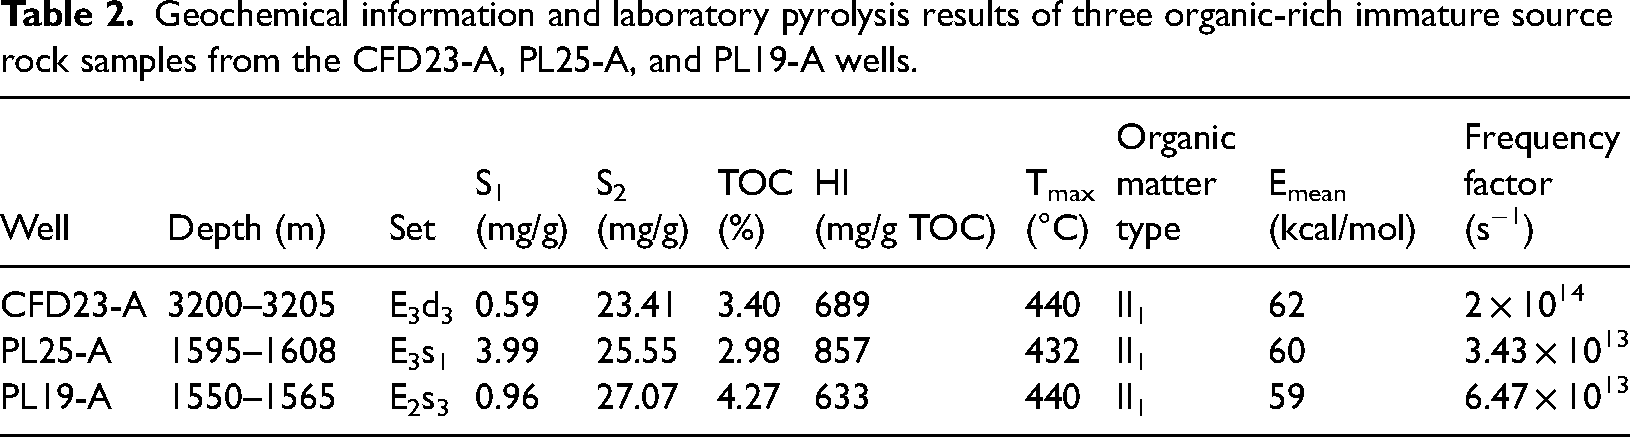
A total of 67 shale samples covering the E3d3, E3s1, and E2s3 members were collected from 14 drilled wells for detailed geochemical characterization of the source rocks. Of these, 64 samples were collected from 12 drilled wells located around the periphery of the Bodong Sag, which have penetrated the Paleogene source rocks (see Figure 1(b) for locations). These selected samples were used for total organic carbon (TOC), Rock-Eval pyrolysis, vitrinite reflectance, and maceral composition. The sampling depths varied widely, ranging from 1600 to 3890 m. Given that most of the samples were collected at the margins of the sag and exhibit low vitrinite reflectance (∼0.5%Ro; see Table 1 for details), it is expected that they have not yet experienced extensive hydrocarbon generation, making them suitable for studying the initial geochemical characteristics. To determine the kinetic parameters for hydrocarbon generation, three representative organic-rich immature samples from wells PL25-A and PL19-A in the Bodong Sag, and well CFD23-A in the neighboring Bozhong Sag, were subjected to closed-system gold tube pyrolysis (see Table 2 for details).
Geochemical data including TOC, Rock-Eval, and vitrinite reflectance of Paleogene source rocks from key wells in the Bodong Sag.
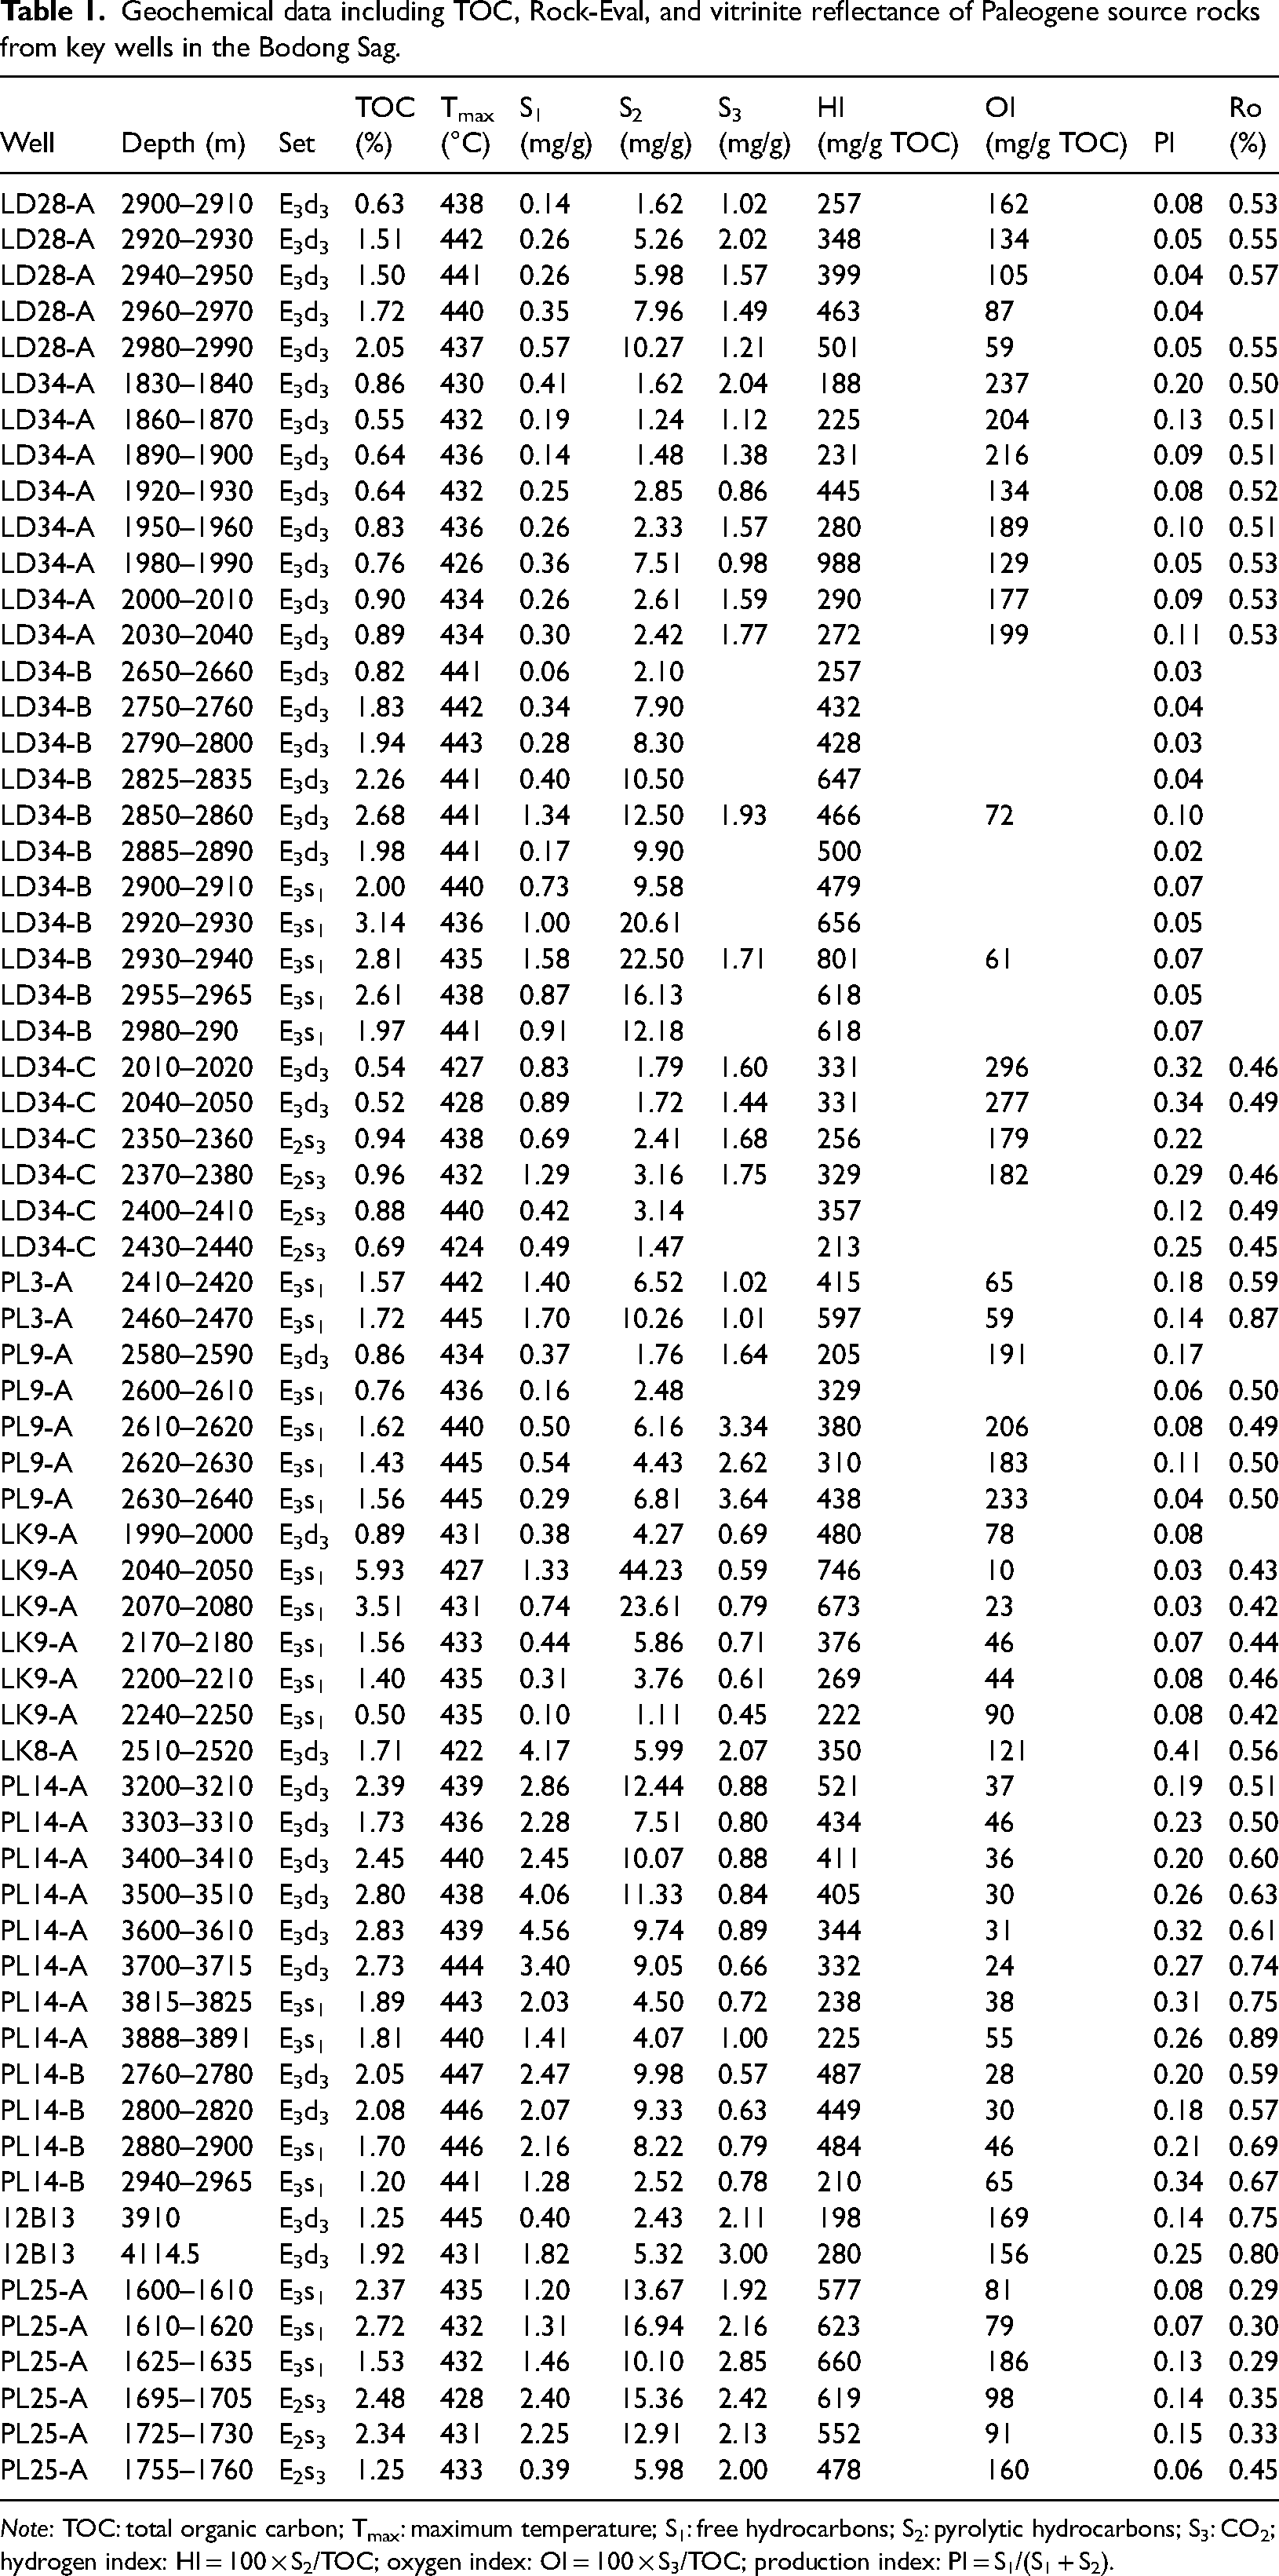
Note: TOC: total organic carbon; Tmax: maximum temperature; S1: free hydrocarbons; S2: pyrolytic hydrocarbons; S3: CO2; hydrogen index: HI = 100 × S2/TOC; oxygen index: OI = 100 × S3/TOC; production index: PI = S1/(S1 + S2).
Geochemical information and laboratory pyrolysis results of three organic-rich immature source rock samples from the CFD23-A, PL25-A, and PL19-A wells.
TOC and Rock-Eval
Selected samples were cleaned prior to crushing and powdering, and the inorganic carbon was removed using hydrochloric acid. The dry, pre-treated rock powder samples were then analyzed for total organic carbon (TOC) using a LECO CS230 carbon analyzer. To ensure the reliability of the experimental data, standard samples were measured in parallel for every 10 samples. The detection limit and relative standard deviation of the TOC measurements are 0.6 ppm and ≤1 wt %, respectively (Zhao et al., 2018b, 2021).
Open system pyrolysis was conducted using an OGE VI rock pyrolyzer. The initial temperature was set to 300°C for holding 3 min to release free hydrocarbons (S1; mg HC/g rock), and then increased to 650°C at a rate of 25°C/min to record pyrolytic hydrocarbons (S2; mg HC/g rock). During the measurement of S2, the maximum temperature (Tmax) was recorded. The measurement procedure followed the methods documented by Espitalié et al. (1985) and Peters (1986).
Organic petrographic analysis
Dried, polished thin sections of the selected samples were prepared for optical microscope observation. Vitrinite reflectance measurements were conducted using a Zeiss Axio Scope.A1 microscope with green reflected light (a wavelength of 546 nm ± 5 nm), equipped with an oil immersion objective. A standard sample with a reflectance of 0.515%Ro was used for calibration. The Vitrinite reflectance (Ro) values were measured in strict accordance with the petroleum industry standard (SY/T 5124-2012). The observation and identification of kerogen maceral compositions were performed using a Zeiss Axio Imager.M2 m microscope with transmitted light and reflected light fluorescence modes.
Kinetics analysis
To more precisely obtain the kinetic parameters for hydrocarbon generation, closed system gold tube pyrolysis was conducted on three representative organic-rich immature shale samples from the Bodong Sag and the neighboring Bozhong Sag. The E2s3 source rock sample was collected from well PL19-A at a depth of 1550–1565 m with a TOC of 4.48 wt%, the E3s1 source rock sample was collected from well PL25-A at a depth of 1595–1608 m with a TOC of 3.10 wt%, the E3d3 source rock sample was collected from well CFD23-A at a depth of 3200–3205 m with a TOC of 3.0 wt%. Details of the experimental samples are summarized in Table 2. Due to the widespread presence of groundwater, the experimental procedure was designed to approach the actual geological conditions by adding water amounting to 20% of the sample mass. The external pressure of the gold tube was preset to be constant at 50 MPa. The temperature was first increased from room temperature to 200°C over 10 h and then gradually heated to 600°C at rates of 2°C/hour and 20°C/hour, respectively. The kinetics of the parallel reactions was illustrated based on the Arrhenius equation (Pepper and Corvi, 1995). The activation energy distributions and frequency factors were determined using KINETICS 2015 software.
Model building and input parameters
Petroleum system modeling, based on petroleum geological theory, offers a new approach to replicating dynamic geological processes such as hydrocarbon generation, migration, and accumulation (Bora and Dubey, 2015). PetroMod®, developed by Schlumberger, is a popular petroleum system modeling tool that supports 1D, 2D, and 3D modeling (Baur et al., 2018) and can be used to characterize burial and thermal history (Hantschel and Kauerauf, 2009; Sweeney and Burnham, 1990) and estimate hydrocarbon generation (Aziz and Settari, 2002; Hantschel et al., 2000).
In this study, a comprehensive 3D model that includes detailed sedimentary unit volumes and geothermal field reconstructions, enhancing the precision of the calculation of source rock maturity and hydrocarbon generation (Schneider and Wolf, 2000), was used to conduct petroleum system modeling. The present-day conceptual model comprises a total of 11 depositional and two erosional events, with the base of the Cenozoic strata (65 Ma) and the present-day seafloor serving as the lower and upper boundaries, respectively. The geometry of the model is based on 3D seismic interpretation data covering approximately 3500 km2 and 99 borehole data, all provided by the China National Offshore Oil Corporation Ltd (CNOOC Ltd.), Tianjin Branch.
The necessary input parameters required to reconstruct the burial and thermal history and hydrocarbon generation process include horizons, ages of deposition and erosion, lithologies, source rock properties, and boundary conditions through geological time (including paleowater depth [PWD], heat flow, and sediment-water interface temperature [SWIT]).
Horizons, ages of surfaces and events, erosion
The stratigraphic framework of the model was constructed using the time-depth converted seismic stratigraphic interpretation data provided by CNOOC Ltd, Tianjin Branch. The depositional and erosion events are detailed in Table 3. The ages of the depositional events corresponding to each horizon were obtained from the established local chronostratigraphic framework documented in previous studies (Hao et al., 2009a; Huang and Liu, 2014). The model comprises a total of 11 key horizons, from bottom to top, which are the fourth member of the Shahejie Fm and the Kongdian Fm (E2s4 + Ek, 54.9–43.0 Ma), the third member of the Shahejie Fm (E2s3, 43.0–38.0 Ma), the second member of the Shahejie Fm (E3s2, 38.0–35.8 Ma), the first member of the Shahejie Fm (E3s1, 35.8–32.8 Ma), the third member of the Dongying Fm (E3d3, 32.8–30.3 Ma), the second member of the Dongying Fm (E3d2, 30.3–27.4 Ma), the first member of the Dongying Fm (E3d1, 27.4–24.6 Ma), the Guantao Fm (N1g, 16.6–12.0 Ma), the Lower Minghuazhen Fm (N1mL, 12.0–5.1 Ma), the Upper Minghuazhen Fm (N2mu, 5.1–2.0 Ma), and the Quaternary Pingyuan Fm (Qp, 2.0 Ma to present). In particular, the strata of the three sets of Paleogene source rocks, the E2s3, E3s1, and E3d3 members, were further subdivided into source rocks and non-source rocks. Since the Cenozoic, the Bodong Sag has experienced two significant episodes of uplift and erosion: the Early Paleocene, corresponding to an absolute age of 65–54.9 Ma, and the Early Miocene, corresponding to an absolute age of 24.6–16.6 Ma. The Early Miocene erosion event resulted in a widespread unconformity above the Dongying Fm (Hu et al., 2001; Huang and Liu, 2014), significantly impacting the thermal evolution of the source rocks and requiring focused consideration. The erosion thickness of this event was derived from previous studies (Hu et al., 2001; Li et al., 2012), which reconstructed the tectonic subsidence process using vitrinite reflectance and apatite fission track analysis. The results indicate that the erosion thickness of the uplifts around the sag varied from 100 to 300 m. Towards the depositional center of the sag, the erosion thickness gradually decreased to 50 m.
Summary of events, assigned ages, facies, lithologies, and corresponding formation applied in the model.
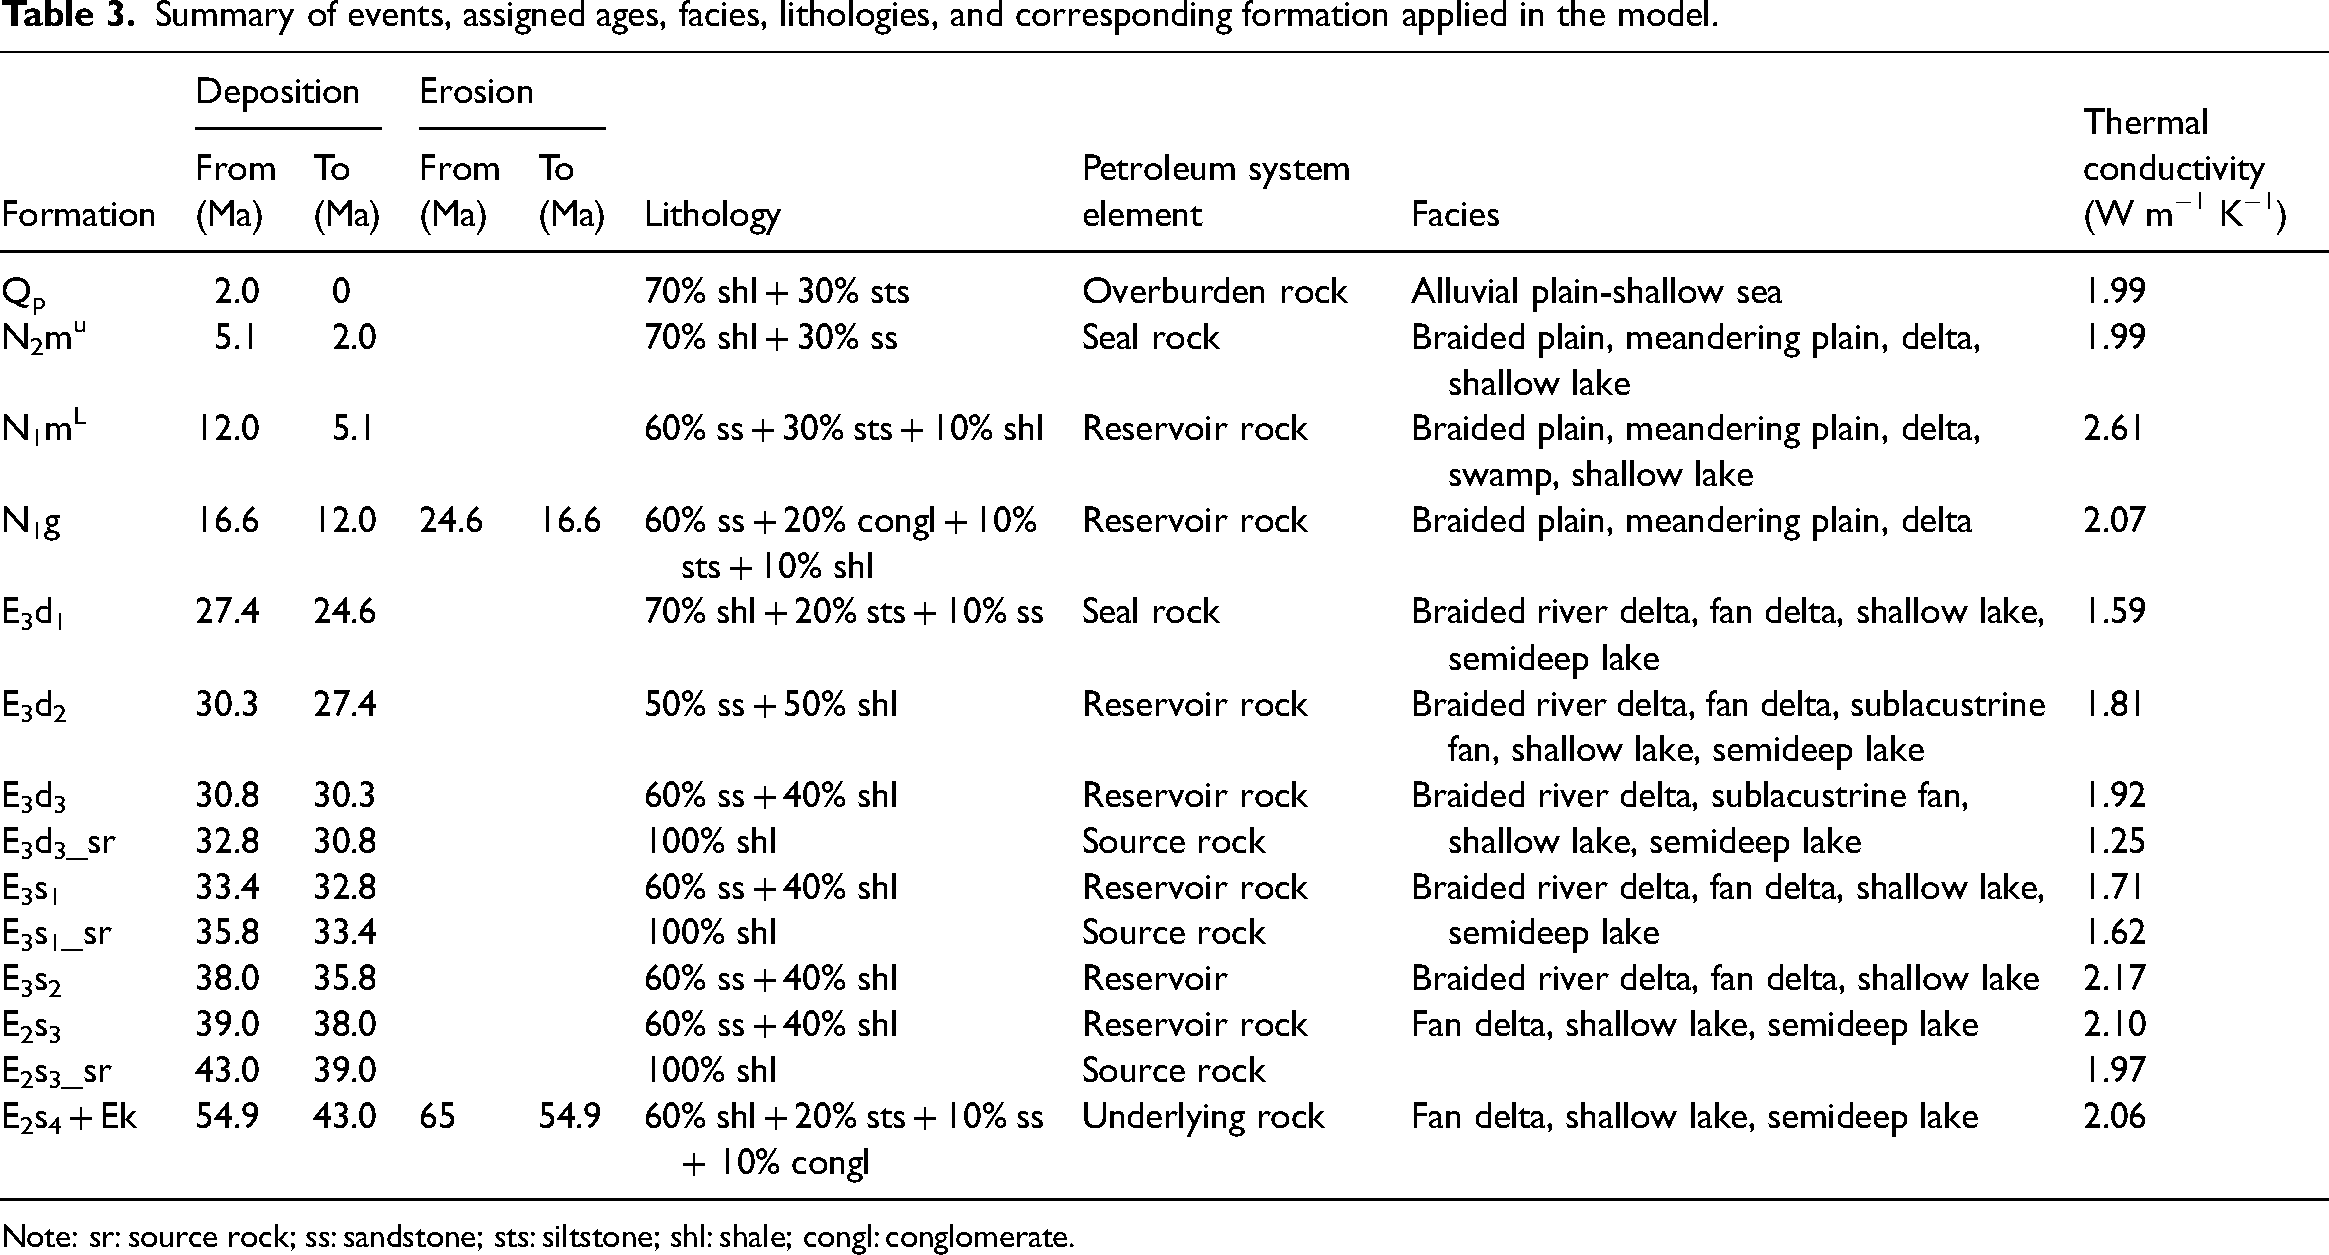
Note: sr: source rock; ss: sandstone; sts: siltstone; shl: shale; congl: conglomerate.
Lithology and physical properties
Major lithologies were assigned to each layer based on well completion reports and sedimentary facies data from CNOOC Ltd., Tianjin Branch. Quaternary deposits are dominated by alluvial plain facies, Neogene deposits are dominated by shallow delta facies, and Paleogene deposits are dominated by shallow lake and semideep lake facies. Lateral facies changes within individual stratigraphic units were also considered. For instance, fan deltas and braided river deltas are characterized by shale-siltstone and sandstone lithologies, respectively, while shallow lakes and semideep lakes are identified primarily with siltstone-shale and typical shale lithologies. The thermal conductivity of each lithology affects the simulation results of thermal maturity. By referring to the investigation by Wang et al. (2002) on the conductivity of sandstone and shale of different strata in the BBB, the conductivity of each layer was determined according to the lithological mixing ratio. A summary of distinguished lithologies and their physical properties is given in Table 3.
Source rock properties
The thickness and distribution of organic-rich units, along with their geochemical properties and spatial distribution, such as TOC and HI, and the kinetics of organic matter conversion are essential parameters for hydrocarbon generation modeling (Hantschel and Kauerauf, 2009).
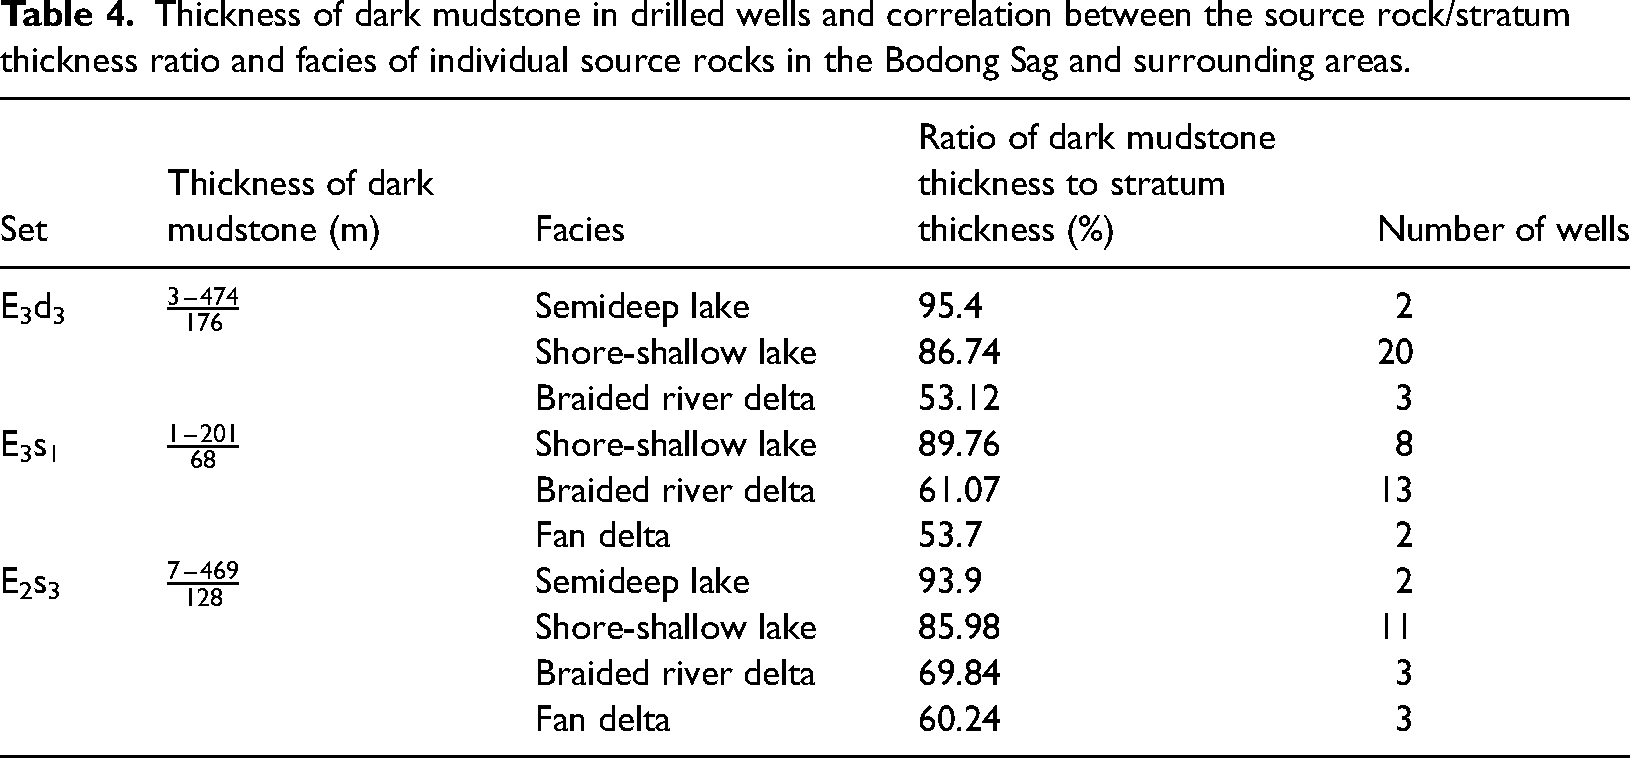
A total of 35 wells that penetrated Paleogene source rocks were drilled in the Bodong Sag. Statistics indicated that the average thicknesses of the E3d3, E3s1, and E2s3 members, based on drilling data are 176, 68, and 128 m, respectively (Table 2). However, due to the extreme lateral variation in the distribution of lacustrine source rocks, these average values do not represent the distribution characteristics of the three sets of Paleogene source rocks. Furthermore, these wells are primarily located in the uplift or slope zone, which also makes them non-representative. To address this issue, the sedimentary facies constraint method (Jiang et al., 2016) was utilized to predict the distribution of the thickness of three sets of Paleogene source rocks. Statistical correlations between the ratio of source rock thickness to formation thickness and sedimentary facies were established. The source rock thickness ratio for different sedimentary facies types in each stratum was calculated. According to Table 4, the source rock thickness ratio increases with water depth. The semideep lake facies have the highest ratios, exceeding 90%, while the shallow lake facies have slightly lower ratios, over 85%. The fan delta and braided river delta facies exhibit the lowest ratios. Using the original thickness distribution of the E3d3, E3s1, and E2s3 strata, combined with the distribution of sedimentary facies, the source rock thickness, and spatial distribution in areas without wells were determined.
Thickness of dark mudstone in drilled wells and correlation between the source rock/stratum thickness ratio and facies of individual source rocks in the Bodong Sag and surrounding areas.
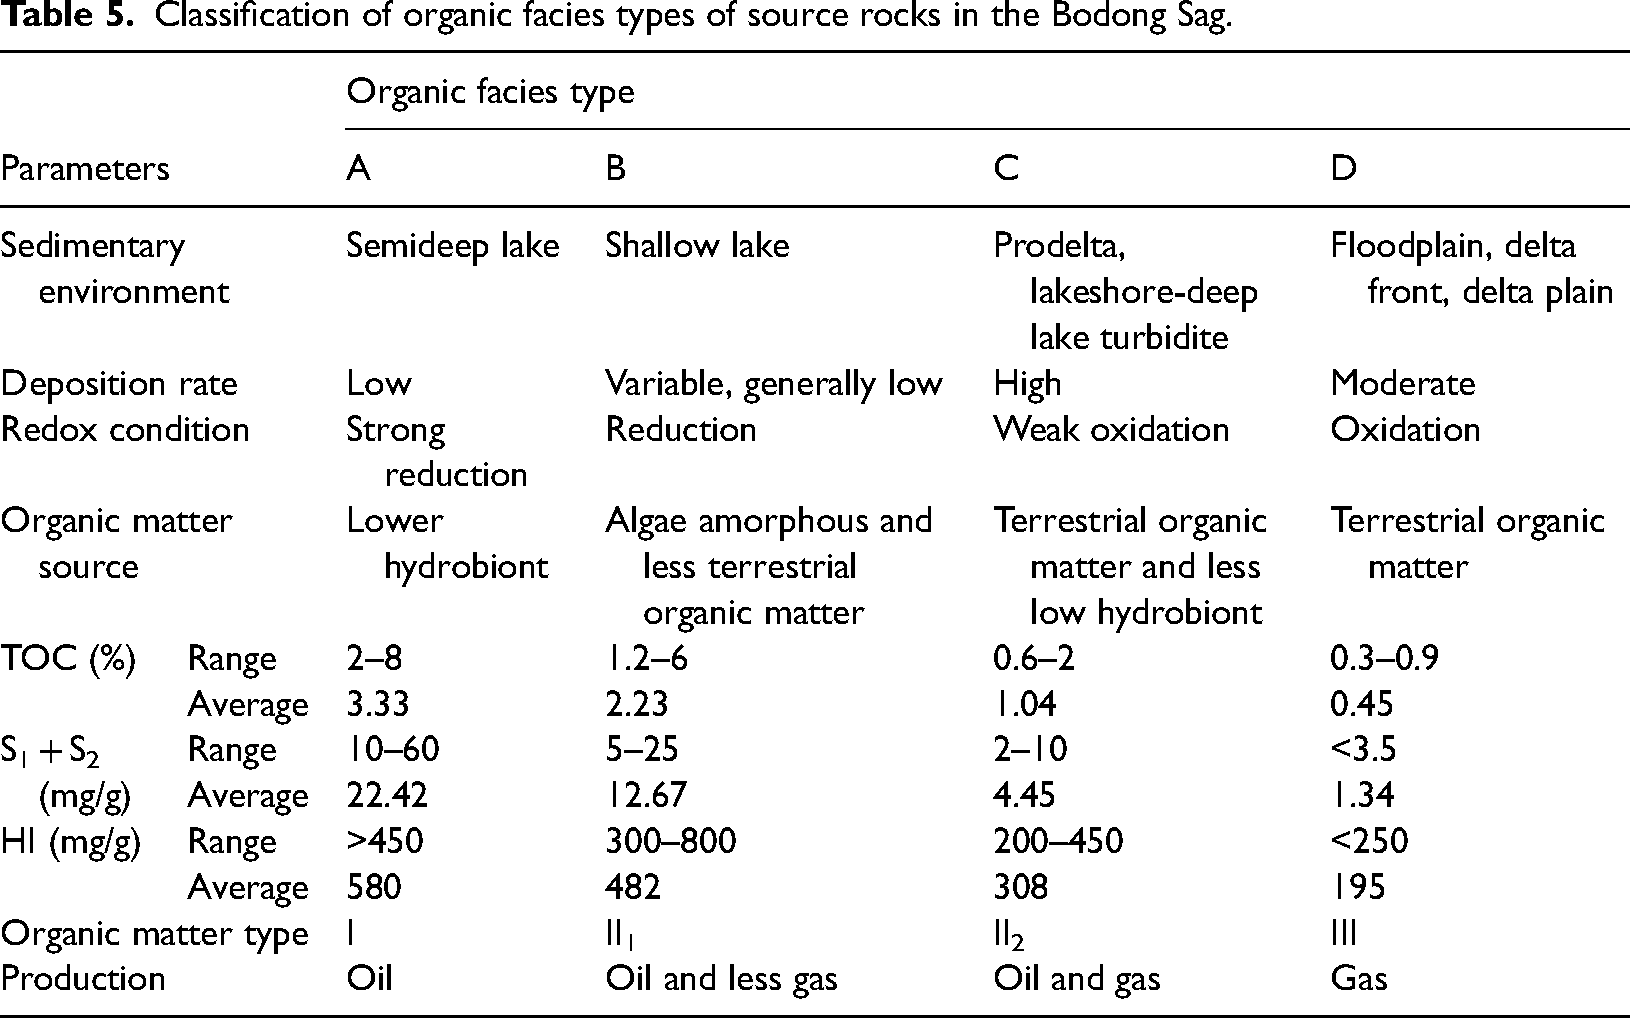
Using the data obtained from TOC measurements and Rock-Eval pyrolysis experiments, combined with the sedimentary facies correlations and references to previous studies on organic facies (Hao et al., 2011; Jiang et al., 2016; Jones, 1987; Wang et al., 2020b), a classification table of organic geochemical parameters for source rocks from different sedimentary facies in the Bodong Sag was reconstructed (Table 5). Constrained by sedimentary facies, the prediction and evaluation of the geochemical characteristics of source rocks in the areas without wells were achieved.
Classification of organic facies types of source rocks in the Bodong Sag.
According to the results of the Closed System Gold Tube pyrolysis experiments (Table 2), three different kinetic were implemented in the model, and the secondary cracking of crude oil was also considered.
Boundary conditions and calibration
To reconstruct thermal and maturity models, boundary conditions must be defined, including paleowater depth (PWD), sediment-water interface temperature (SWIT), and heat flow. The PWD for different periods was referenced from the study by Ye et al. (2021). SWIT was derived from the average surface temperature history at different latitudes as provided in PetroMod® (Wygrala, 1989), with East Asia at 38°N latitude selected. Heat flow is the critical parameter for the construction of thermal and maturity models. Many previous geothermal studies have been conducted in the BBB (Hu et al.,2001; Huang and Liu, 2014; Qiu et al., 2009), yielding a large amount of data on present-day heat flow for reference. The paleoheat flow through geological time was obtained by inversion using the McKenzie crustal stretching model (McKenzie, 1978). First, the rifting and post-rifting thermal subsidence ages (65 and 24.6 Ma, respecitvely) (Gong et al., 2010; Hsiao et al., 2010), the initial lithospheric thickness of the basin (87 km), and the initial crustal thickness (33 km) (Liu and He, 2015, 2019) should be determined. Next, the trend of paleoheat flow evolution is inverted by adjusting the stretching factors to match the tectonic subsidence (Jarvis and McKenzie, 1980; McKenzie, 1978).
A reasonable 3D model provides the foundation for accurate construction of the burial and thermal history. Fifteen drilled wells were initially selected to calibrate the horizons. Of these, 12 wells were calibrated using the modeled base depth of the Dongying Fm against the measured base depth of the strata, and three wells (PL25-A, PL25-B, and PL25-C) were calibrated using the modeled base depth of the E3s1 member against the measured base depth of the strata. Thermal calibration was performed using the EASY%Ro routine (Sweeney and Burnham, 1990). Typically, measured borehole temperature and vitrinite reflectance (%Ro) data are selected for calibration. Measured data were obtained from six drilled wells, including 97 borehole temperature data points and 35 vitrinite reflectance (Ro) data points. All borehole temperature data were derived from well test results, and all vitrinite reflectance (Ro) data were obtained from experiments.
Results
TOC and Rock-Eval pyrolysis
TOC contents vary from 0.50 to 5.93 wt%, with an average of 1.70 wt%. S2 values range from 1.11 to 44.23 mg HC/g rock, with an average of 7.93 mg HC/g rock (Table 1). The hydrogen index (HI) is calculated using the equation HI = 100 × S2/TOC, and the oxygen index (OI) is calculated using the equation OI = 100 × S3/TOC (Espitalié et al., 1977). The HI and OI of the three sets of Paleogene source rocks in the study area range from 188 to 988 mg HC/g TOC and 10 to 296 mg CO2/g TOC, respectively, with an average of 473 mg HC/g TOC and 114 mg CO2/g TOC, respectively (Table 1). Tmax in the range of 430–500°C is statistically considered to be a good indicator of thermal maturity (Evenick, 2021). The Tmax values of the samples are mainly distributed in the range of 422–447°C, with a mean value of 437°C (Table 1), indicating that the samples are in the immature to early mature stage. The Production Index (PI) is calculated using the equation PI = S1/(S1 + S2). The PI index of the samples is predominantly less than 0.1 and up to 0.4, with a mean value of 0.14 (Table 1).
Maceral composition and vitrinite reflectance (Ro)
The organic petrographic analysis employs optical properties and morphological characteristics of macerals under the microscope to identify organic matter. This method is widely utilized for source rock characterization and kerogen typing (Kumar et al., 2021; Li et al., 2024; Singh and Kumar, 2017, 2018; Wang et al., 2022; Zhao et al., 2021). The Paleogene source rocks in the Bodong Sag are characterized by a predominance of lower aquatic organic matter, with a limited content of higher terrestrial organic matter. Microscopic observations indicate that sapropelinite and exinite are the major macerals in the selected samples, with a limited amount of vitrinite and almost no inertinite (Figures 3(a)–(d)). Sapropelinite contains amorphinite and a certain amount of planktonic alginite. Amorphinite occurs in a dispersed flocculent form and appears yellowish under transmitted light (Figure 3(a)–(d)). Exinite contains benthic amorphous algae and some sporinite. Benthic amorphous algae occur in clumps and are yellowish-brown in color under transmitted light (Figure 3(b)–(d)). Sporinite is morphologically intact, appearing reddish brown under transmitted light (Figure 3(a), (b), and (d)). The higher abundance of vitrinite in the samples from the E3d3 member indicates an increased input of terrestrial organic matter (Figure 3(e)).
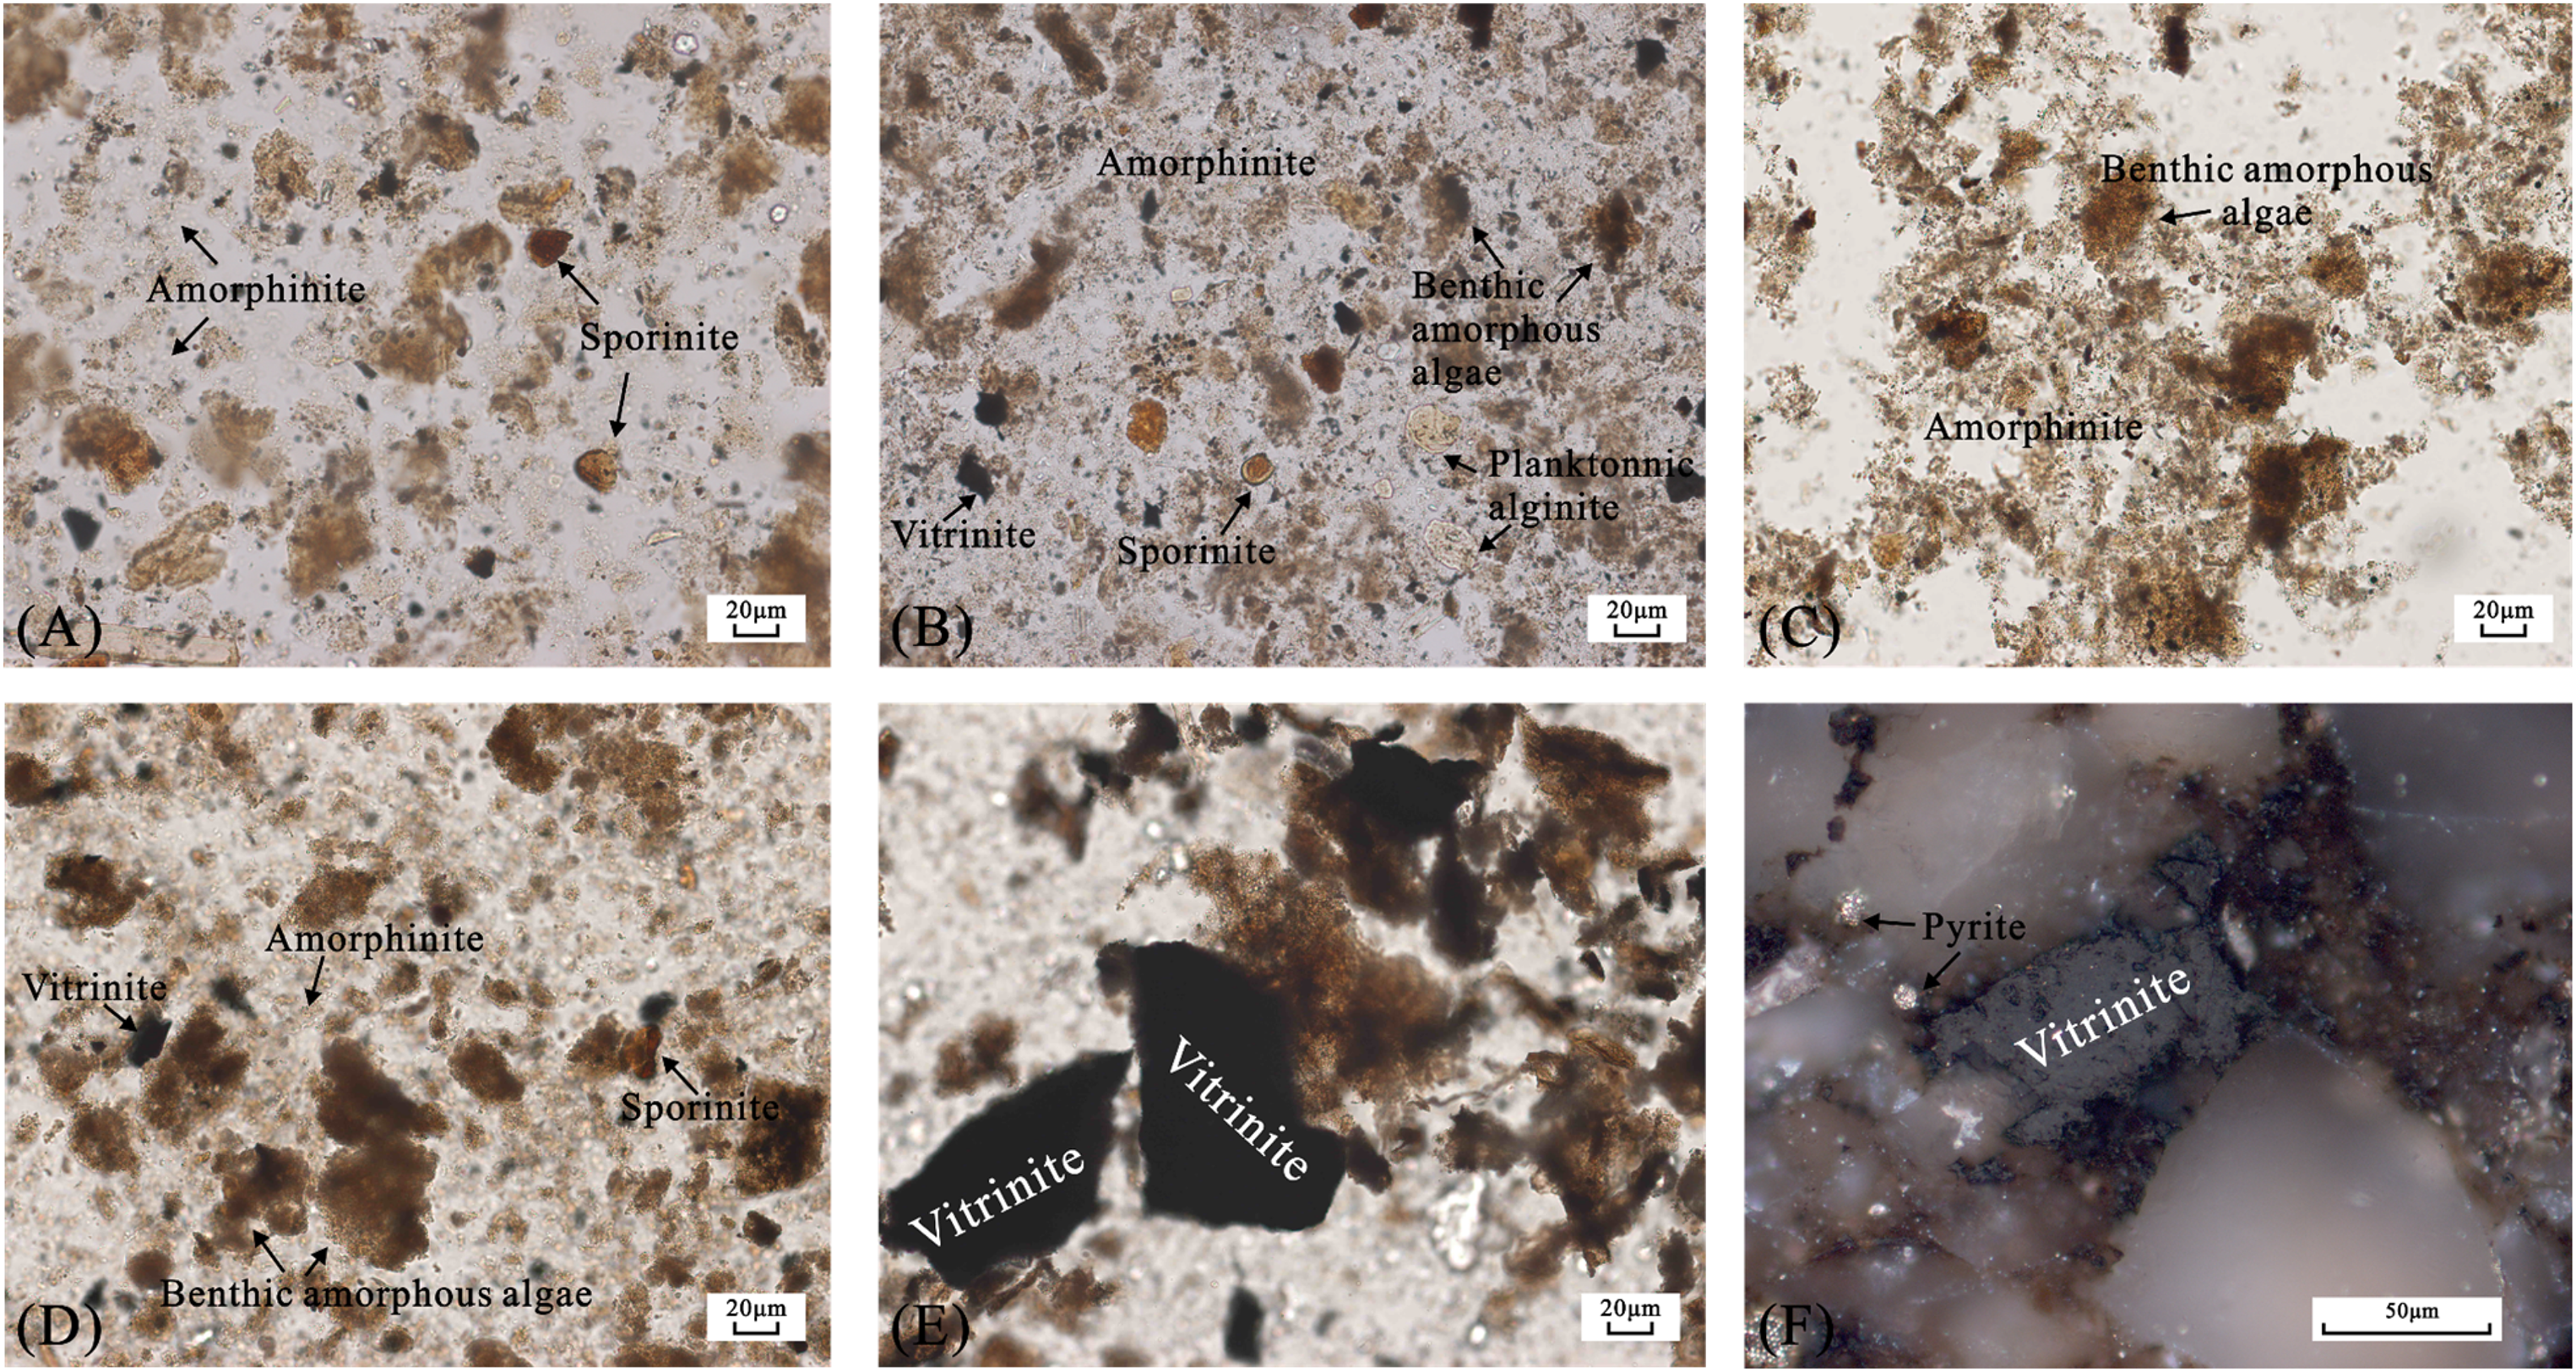
Microphotographs of maceral compositions of the typical source rock samples in the Bodong Sag. (a) Well PL25-A, 1695–1705, E2s3; (b) Well LD34-C, 2370–2380 m, E2s3; (c) Well PL9-A, 2600–2610 m, E3s1; (d) Well LK8-A, 2510–2520 m, E3d3; (e) Well LD34-A, 1890–1900 m, E3d3. And a representative microphotograph of the vitrinite reflectance (Ro) measurement is shown in (f) Well PL14-A, 3500–3510 m, E3d3.
A representative microphotograph of the vitrinite reflectance (Ro) measurement is shown in Figure 3(f). The measured vitrinite reflectance (Ro) values of the samples range from 0.29% to 0.89% with an average of 0.54% (Table 1). These values indicate that the samples are generally of low maturity, falling into the immature to early mature stages, with only a few samples reaching the mature stage. This is primarily because some of the selected samples are located at the edges of the sag and at relatively shallow depths, and thus not typically reaching the oil generation window.
Kinetics
The type of kerogen/organic matter significantly affects the hydrocarbon potential and kinetics of source rocks (Abbassi et al., 2014). The organic matter types in the three sets of Paleogene source rocks in the Bodong Sag are dominated by Type II1 (Figure 3), indicating oil-prone sources. The experimental results indicate a certain degree of variation in the kinetic parameters among source rocks from different formations with the same type of organic matter (Table 2).
The variation of hydrocarbon production rate with temperature in closed system gold tube pyrolysis of source rock samples is shown in Figure 4. It can be observed that the source rock samples start to generate gas (C1–C5) once the temperature reaches 350°C. The oil yield (C6) shows an inflection point at 400°C and then decreases rapidly, while the gas yield increases rapidly after 400°C. The results indicate that these three low-maturity Paleogene source rock samples underwent kerogen degradation to generate oil, followed by high-temperature cracking of the oil to generate gas.
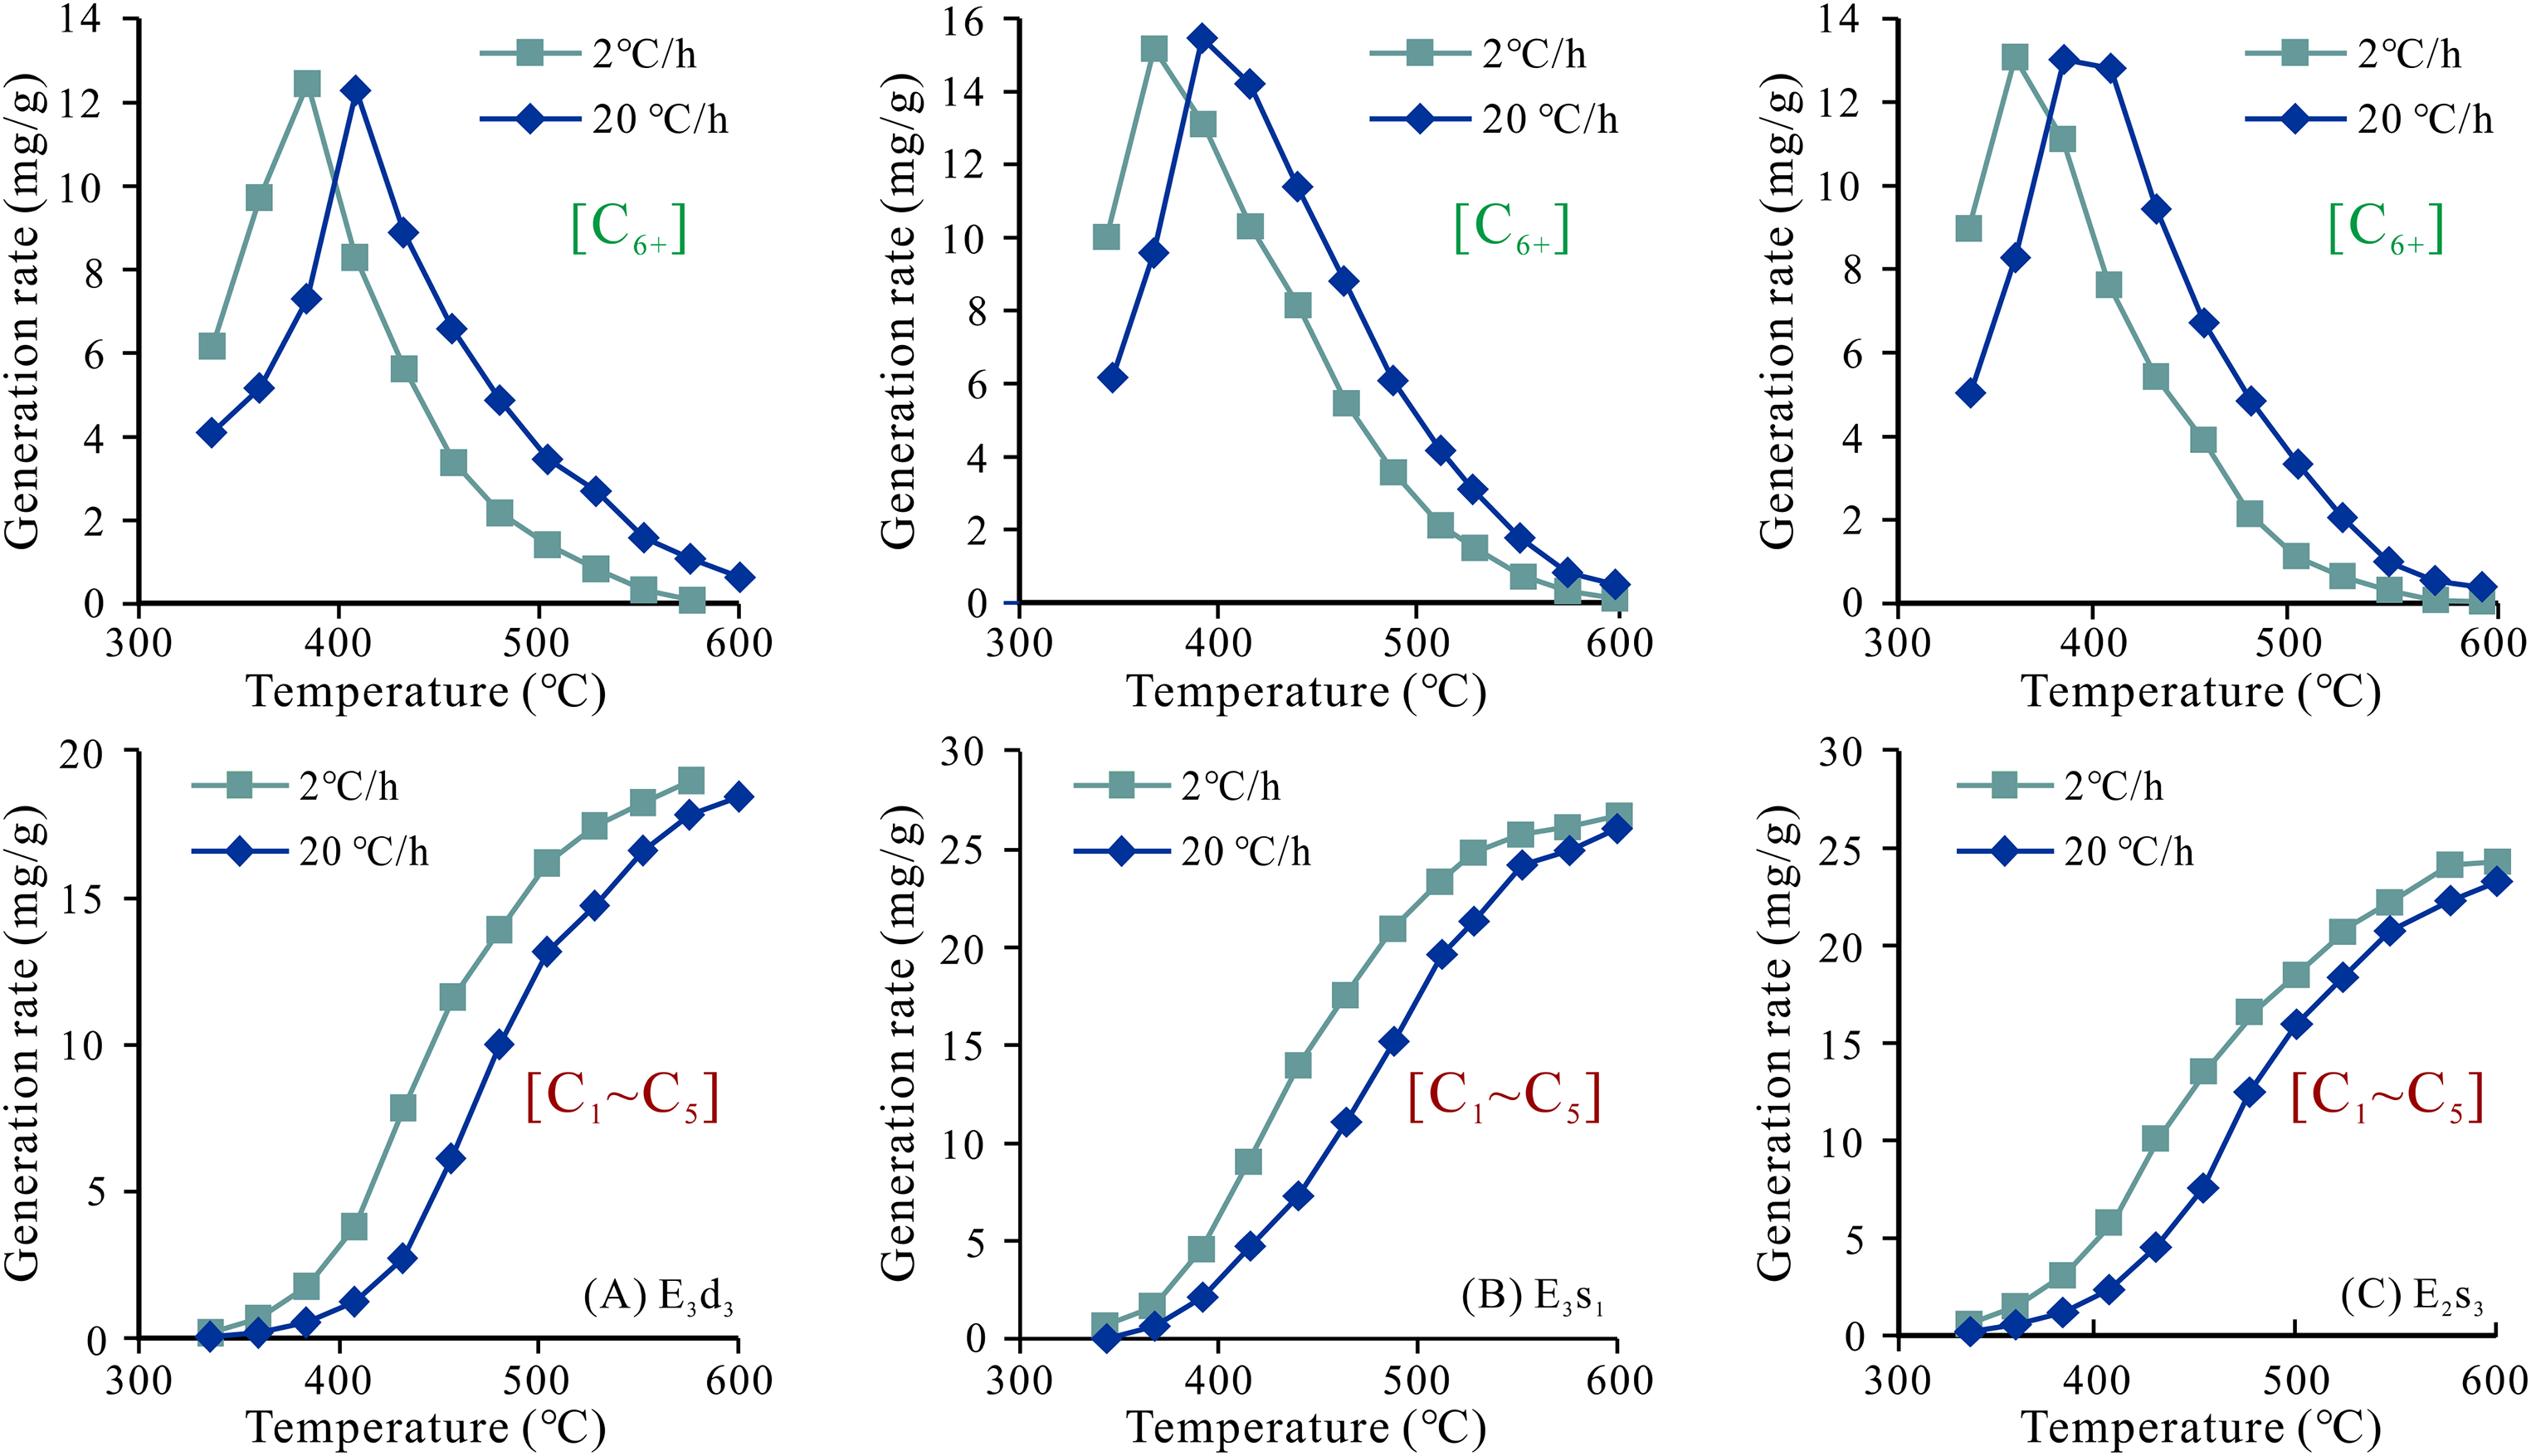
Variation of hydrocarbon production rate with temperature in pyrolysis of source rock samples of (a) the third member of the Dongying Fm (E3d3), (b) the first member of the Shahejie Fm (E3s1), and (c) the third member of the Shahejie Fm (E2s3) at different heating rates (2°C/h and 20°C/h).
The activation energy distributions and frequency factors of the three source rock samples are shown in Figure 5. Source rock samples from the E3d3, E3s1, and E2s3 members exhibit normal distribution centered at 62, 60, and 59 kcal/mol, respectively. The activation energy distribution of the E3d3 sample is broader (51–75 kcal/mol) and has a higher activation energy at the dominant frequency. In contrast, the activation energy distributions of the E3s1 and E2s3 samples are narrower, with both the dominant frequency activation energy and mean activation energy being lower, indicating that these source rocks are more favorable for hydrocarbon generation.
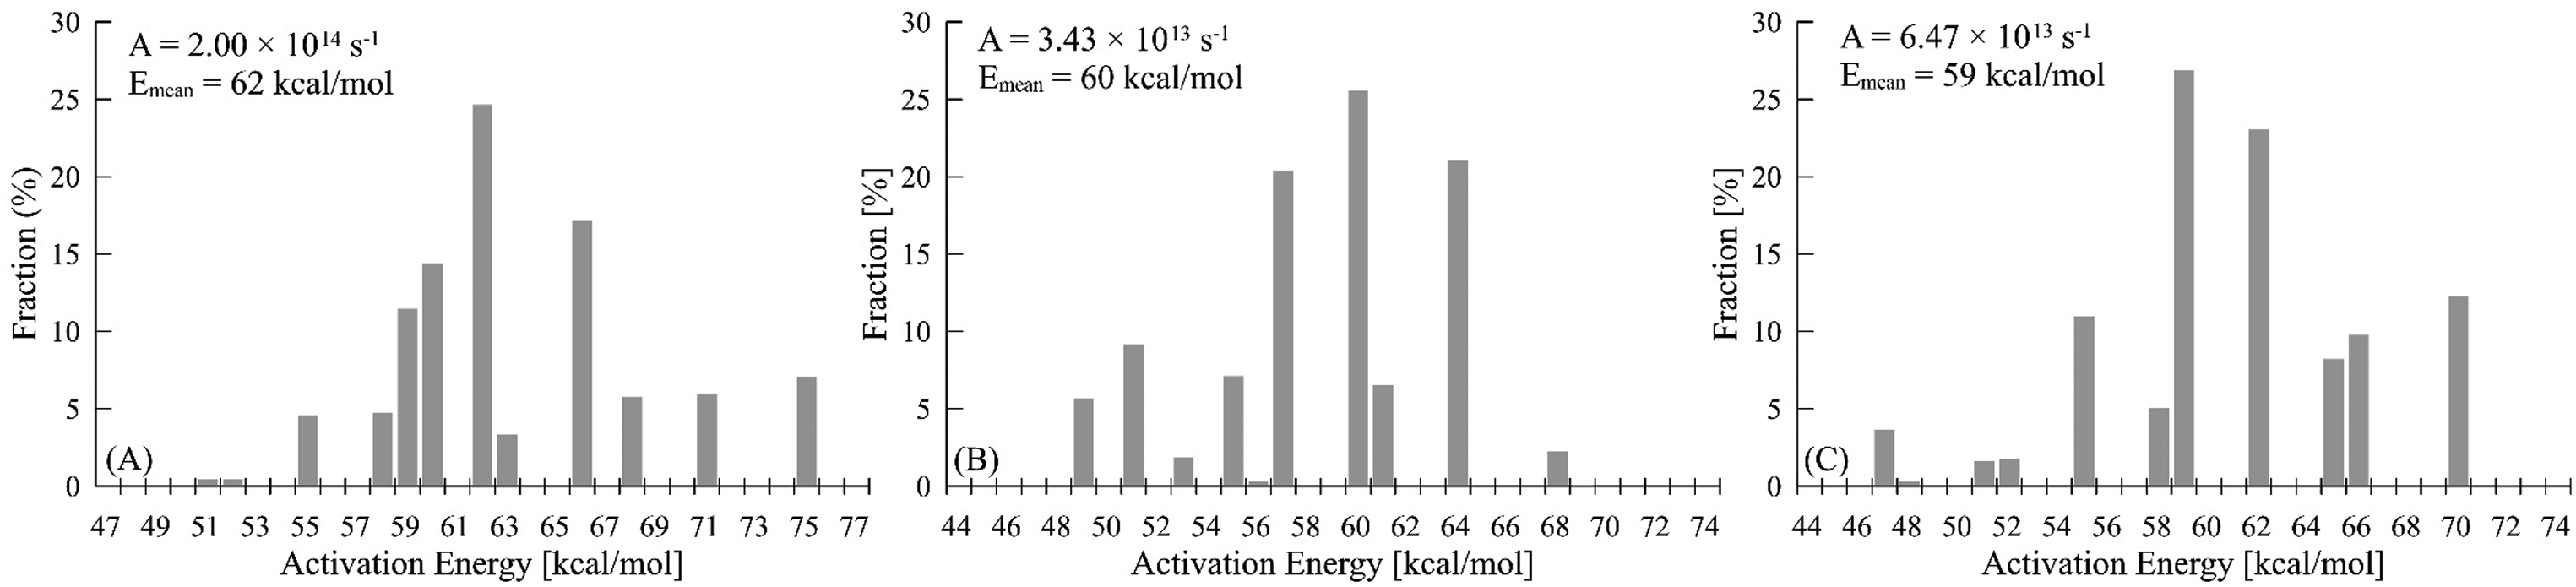
Kinetic parameter sets of the source rock samples of (a) the third member of the Dongying Fm (E3d3), (b) the first member of the Shahejie Fm (E3s1), and (c) the third member of the Shahejie Fm (E2s3) from the CFD23-A, PL25-A, and PL19-A wells, respectively. The location of the CFD23-A well in the Bozhong depression shares the same paleosedimentary environments as the study area during the depositional period of the third member of the Dongying Fm (E3d3), and the samples from CFD23-A are quite representative.
Considering the secondary cracking of crude oil, the conversion rates from Liu et al. (2017b) were referenced and combined with the temperature evolution results of the Bodong Sag. The crude oil cracking conversion rates for E3d3, E3s1, and E2s3 are 30%, 50%, and 70%, respectively.
Source rock distribution and geochemical properties
The development of lacustrine source rocks is controlled by sedimentary facies, with source rocks more developed in semi-deep lake and shore-shallow lake facies (Table 4). The E3d3 member is mainly characterized by semi-deep lake and shore-shallow lake facies, with source rock thickness generally ranging from 100 to 400 m and reaching over 600 m in the center of the southern subsag (Figure 6(a)). The E3s1 member was widely deposited, with good connectivity among subsags, but the depositional thickness is relatively thin. The E3s1 source rocks mainly developed in shore-shallow lakes, with a total thickness generally less than 300 m (Figure 6(b)). The E2s3 member has poor connectivity among subsags, resulting in isolated source rock distributions. The sedimentary facies is mainly semi-deep lake facies, with source rock thickness generally ranging from 100 to 300 m, while reaching up to 700 m in the center of the southern subsag (Figure 6(c)).
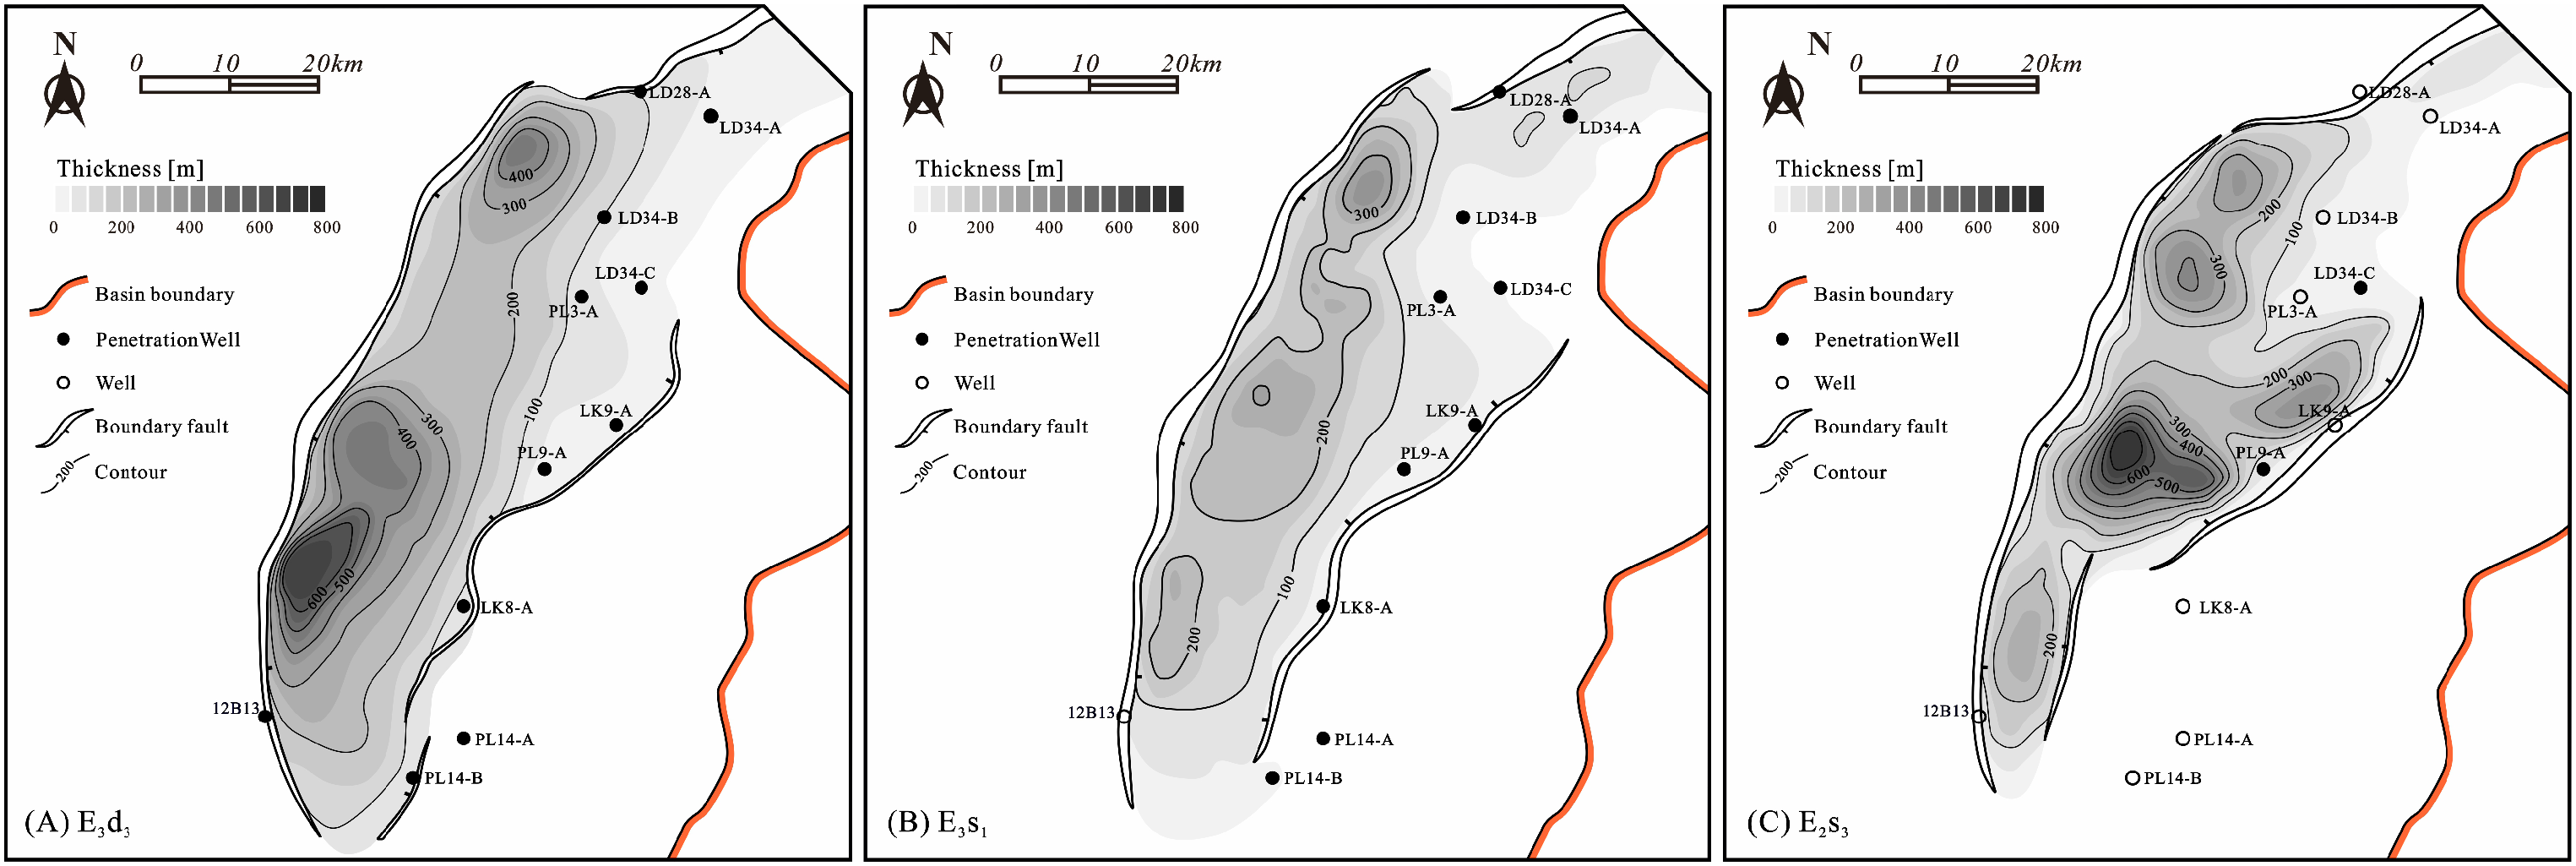
Areal distribution of Paleogene source rocks in the Bodong Sag. The source rocks of (a) the third member of the Dongying Formation (E3d3), (b) the first member of the Shahejie Formation (E3s1), and (c) the third member of the Shahejie Formation (E2s3).
Under the constraints of sedimentary facies, the distribution of source rock geochemical characteristics was determined, as shown in Figure 7. In the E3d3 member, Type B organic facies developed in the sag center, with TOC exceeding 3.0 wt% and HI greater than 500 mg/g TOC. A gradual transition to Type D organic facies occurs at the margins, where TOC and HI are less than 1.0 wt% and 200 mg/g TOC, respectively (Figure 7(a) and (d)). In the E3s1 member, Type A and B organic facies developed in the sag center, with TOC over 3.0wt% and HI above 500 mg/g TOC. These transition to Type D organic facies at the margins, where TOC is below 1.0 wt% and HI less than 250 mg/g TOC (Figure 7(b) and (e)). In the E2s3 member, high TOC areas are relatively isolated and mainly distributed in the southern and northern subsags, with TOC exceeding 3.0 wt%. High HI areas are concentrated in the southern subsag, reaching up to 700 mg/g TOC. Similarly, marginal TOC and HI values are relatively low, corresponding to TOC less than 1.0% and HI less than 200 mg/g TOC (Figure 7(c) and (f)).
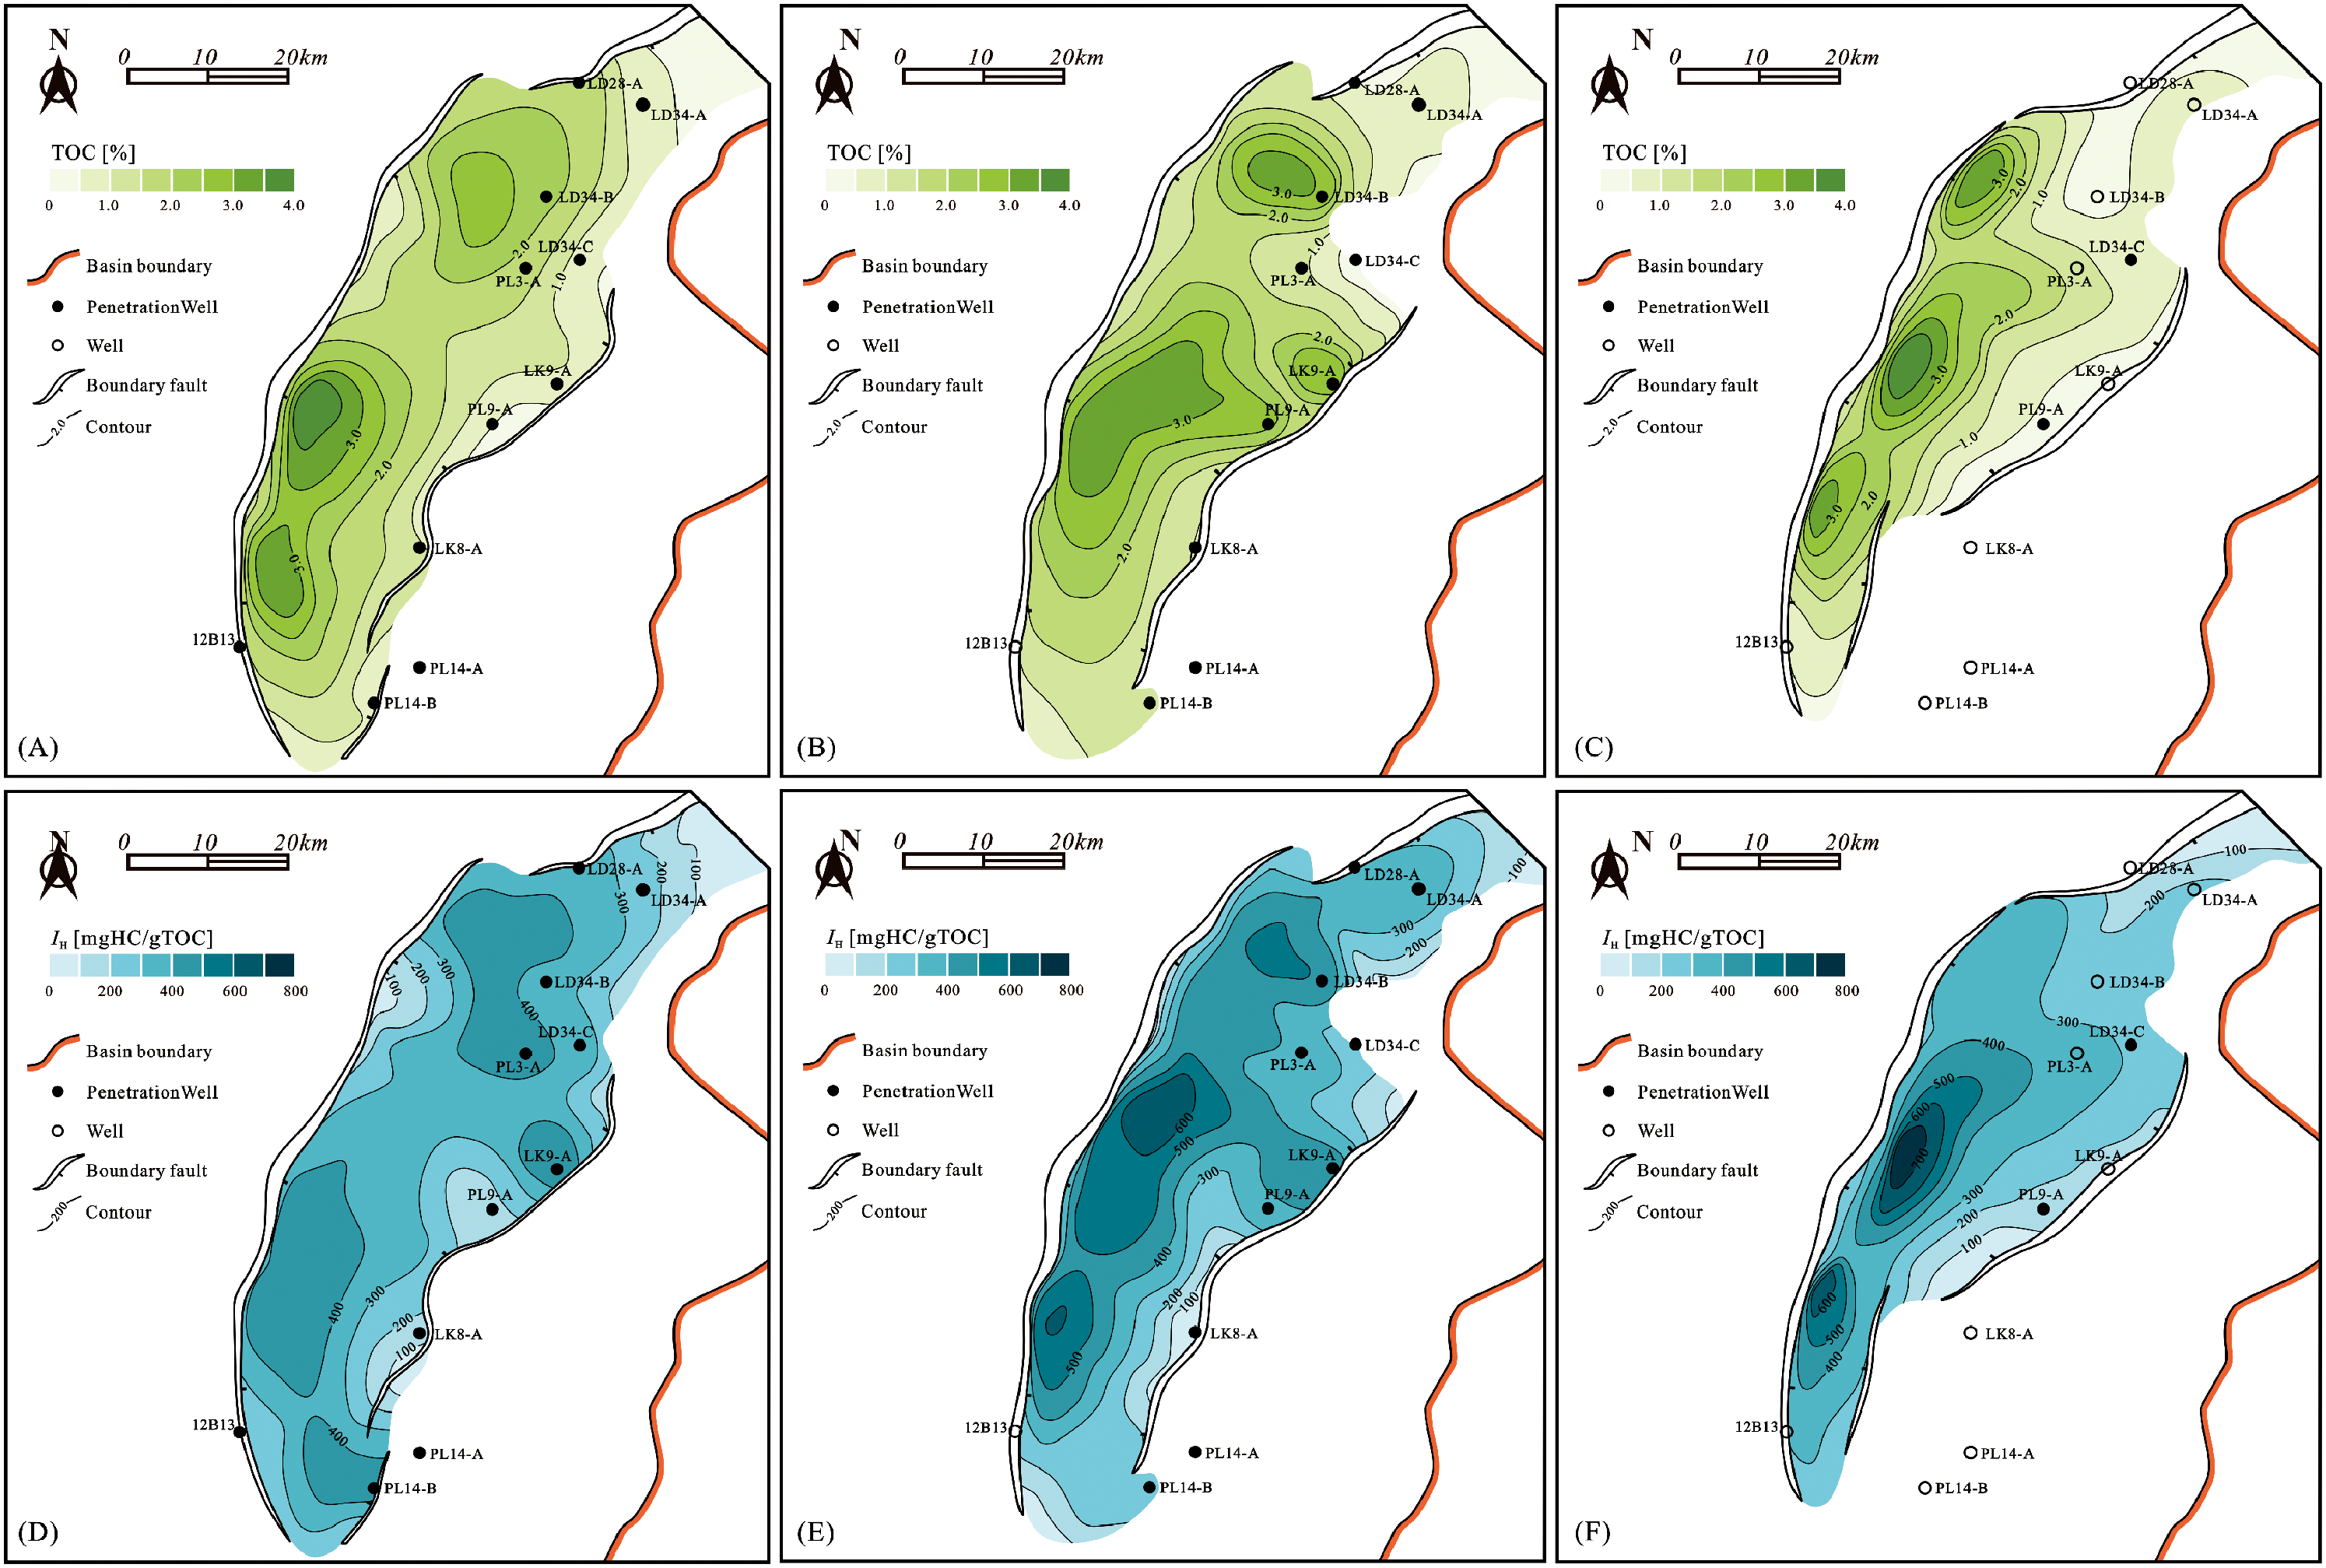
Implemented source rock geochemical parameters in the model, including the total organic carbon (TOC) of (a) the third member of the Dongying Fm (E3d3), (b) the first member of the Shahejie Fm (E3s1), and (c) the third member of the Shahejie Fm (E2s3), and the hydrogen index (HI) of (d) the third member of the Dongying Fm (E3d3), (e) the first member of the Shahejie Fm (E3s1), and (f) the third member of the Shahejie Fm (E2s3).
Heat flow and calibration
The present-day heat flow in the Bodong Sag ranges from 45 to 58 mW/m2. The paleoheat flow was obtained through thermal calibration based on the inversion of the Mckenzie crustal stretching model (McKenzie, 1978), as shown in Figure 8. The results indicate that the sag underwent rifting subsidence during the Oligocene (32.8–24.6 Ma), resulting in a gradual thinning of the lithosphere due to the continuous extension (Hu et al., 2001; Qiu et al., 2015), accompanied by an increase in paleoheat flow. The paleoheat flow peaked at the end of the Oligocene (∼24.6 Ma) at up to 80 mW/m2. Subsequently, the sag entered continuous thermal subsidence, and the paleoheat flow gradually decreased.
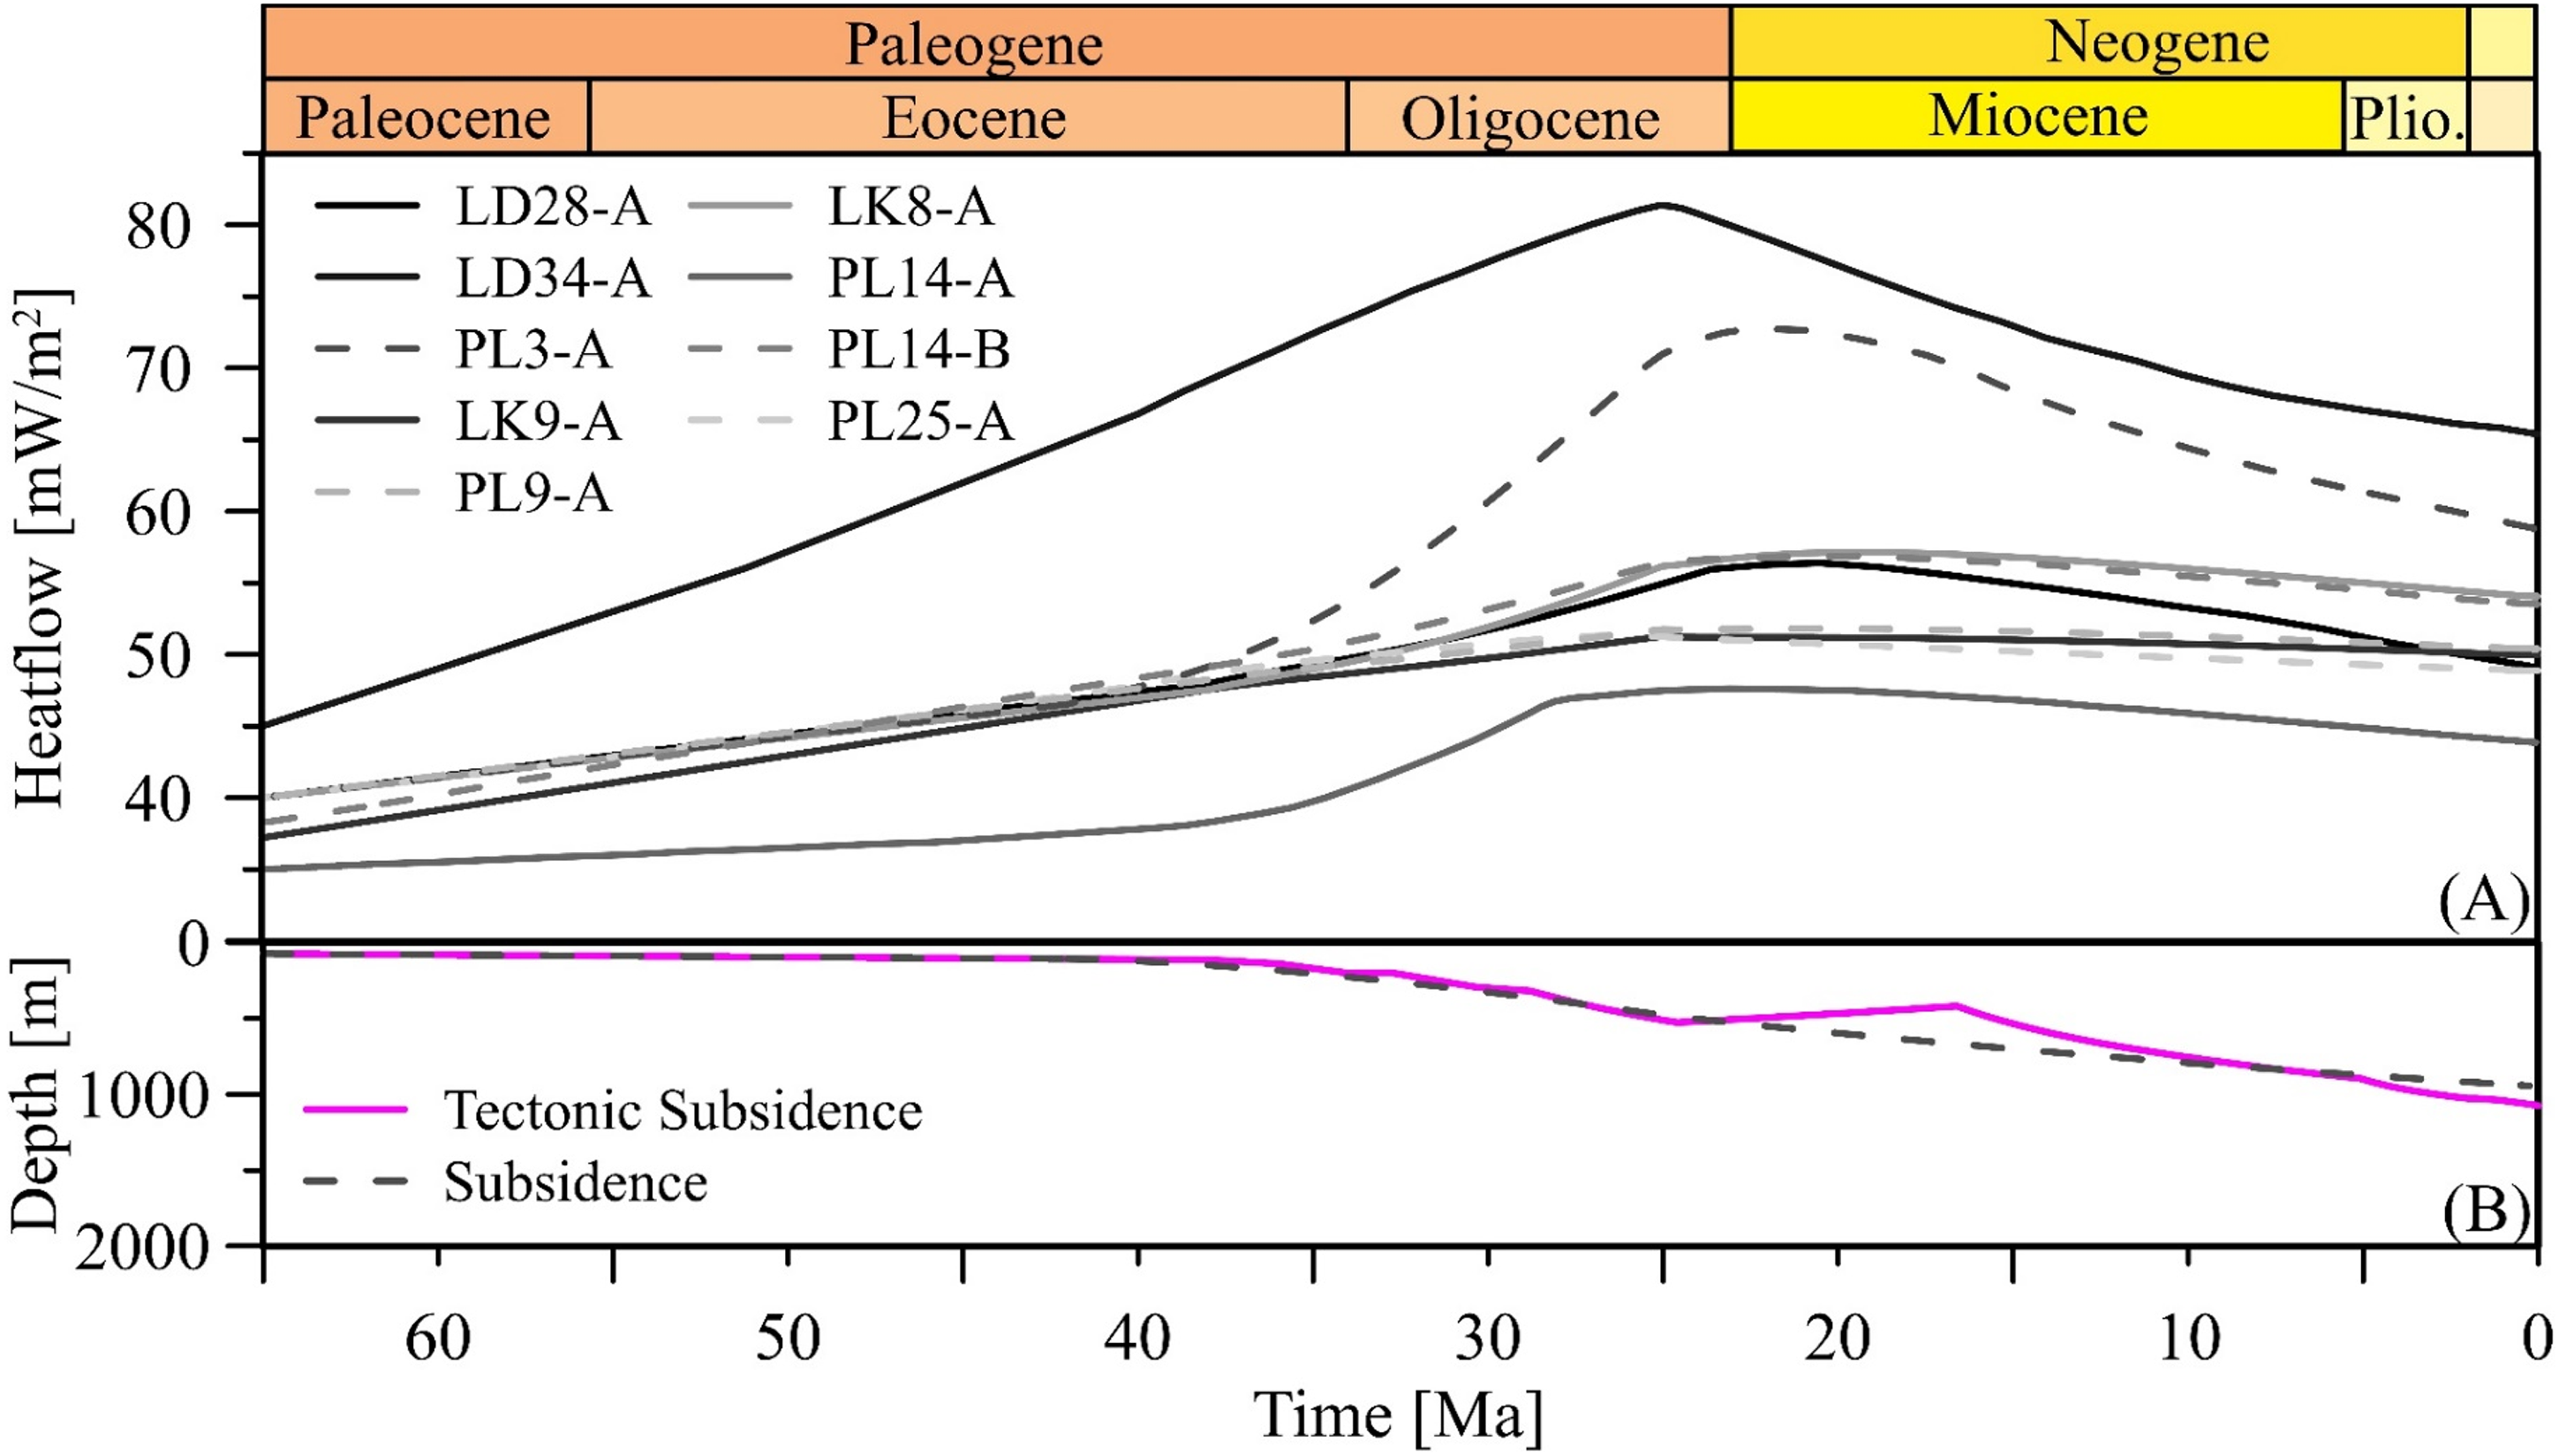
(a) Heat flow evolution trends in nine wells drilled in the Bodong Sag. Location of the wells shown in Figure 1. The EASY%Ro model (Sweeney and Burnham, 1990) has been used to simulate vitrinite maturity. (b) Tectonic subsidence is fitted by varying the stretching factors in the PL3-A well. The dashed line represents the calculated result.
Calibrations focus primarily on present-day stratigraphic burial depths and thermal conditions, corresponding to when maximum burial depths and temperatures were reached. Modeled horizon depths with the calibration data and error analysis for the 15 wells are shown in Figure 9. The results indicate that the modeled depths closely match the measured depths (Figure 9(a)), with most absolute errors being less than 50 m. The relative errors range from 0.25% to 3.80%, with only one well showing a relative error greater than 5.0% (Figure 9(b)), demonstrating that the stratigraphic model is reasonable. The calculated temperatures (°C) and vitrinite reflectance (%Ro) with the calibration data and error analysis for the 6 wells are shown in Figure 10. The results indicate that both the measured borehole temperatures and the vitrinite reflectance (Ro) data are in good agreement with the modeled data (Figure 10(a)–(f)). The relative error analysis shows that 97.14% of the measured and modeled vitrinite reflectance (Ro) data are within ± 5.0% (Figure 10(g)), and all measured and modeled borehole temperatures are within ± 5.0% (Figure 10(h)), demonstrating that the thermal model is reliable.
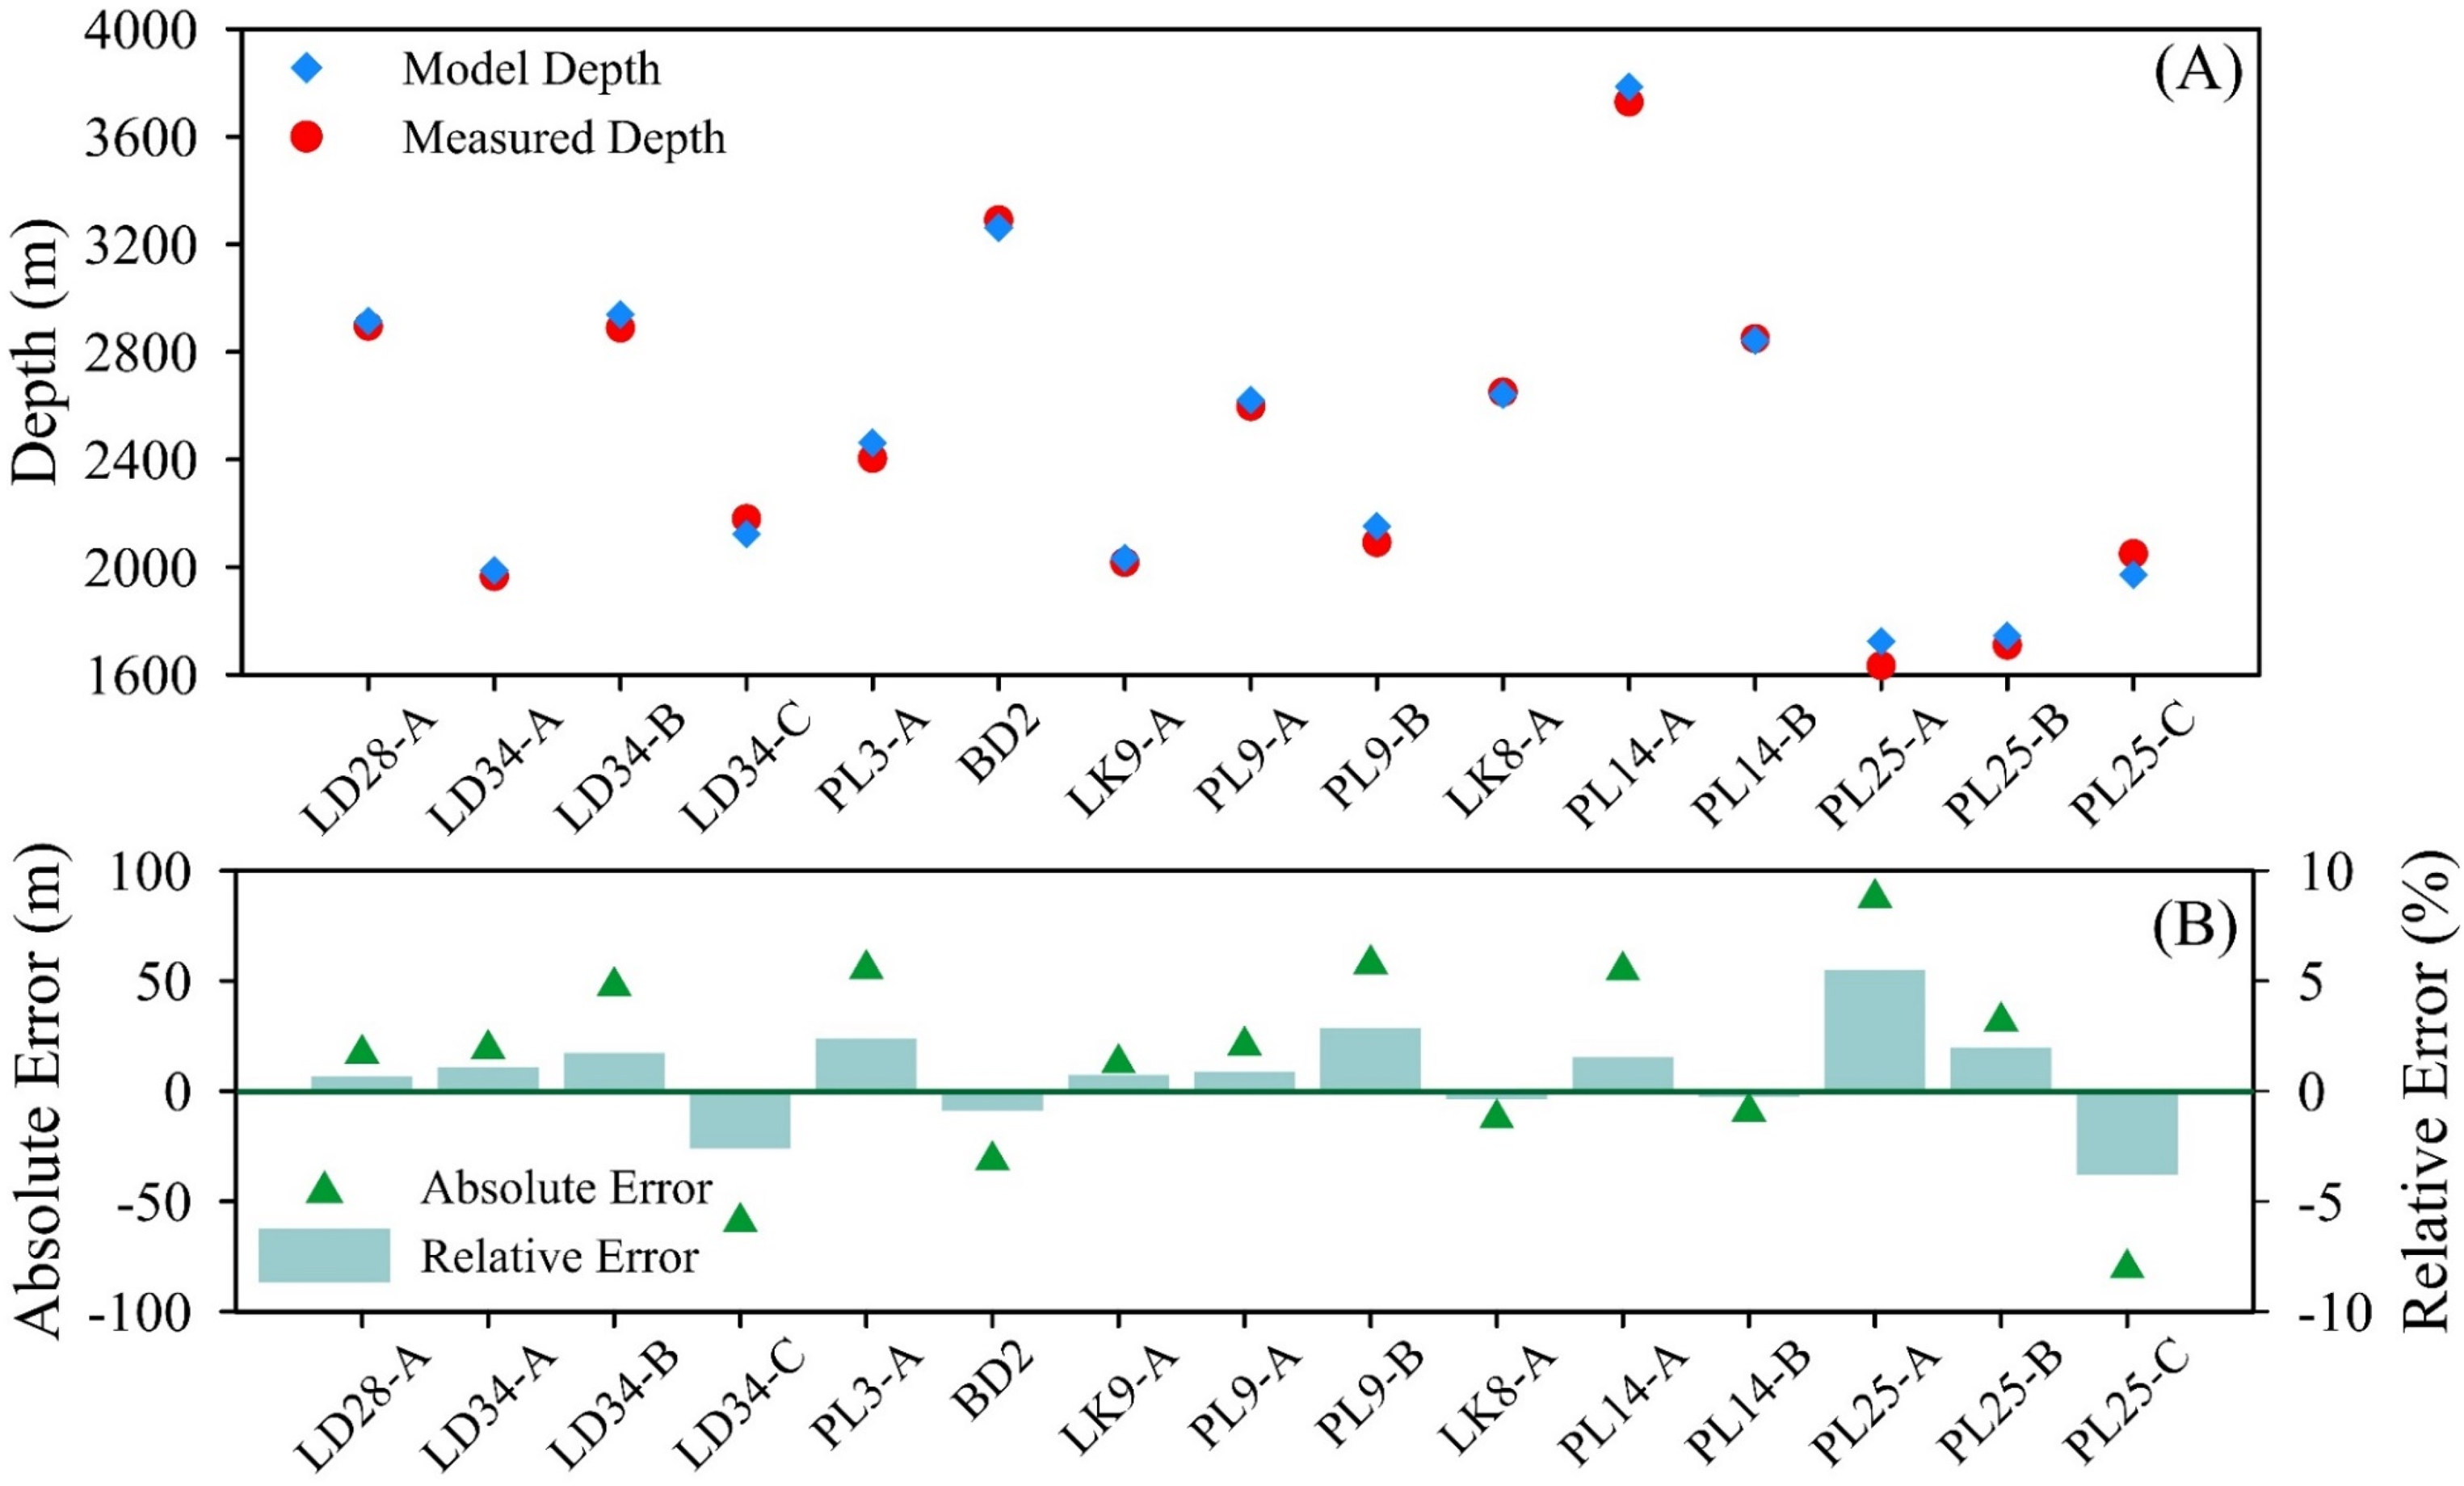
Calibration results of the 3D geological model. (a) Measured versus modeled base depths of the third member of the Dongying Fm (E3d3) and the first member of the Shahejie Fm (E3s1) for 15 wells. The locations of the wells are shown in Figure 1(b) Absolute and relative errors when comparing the measured and modeled base depths.
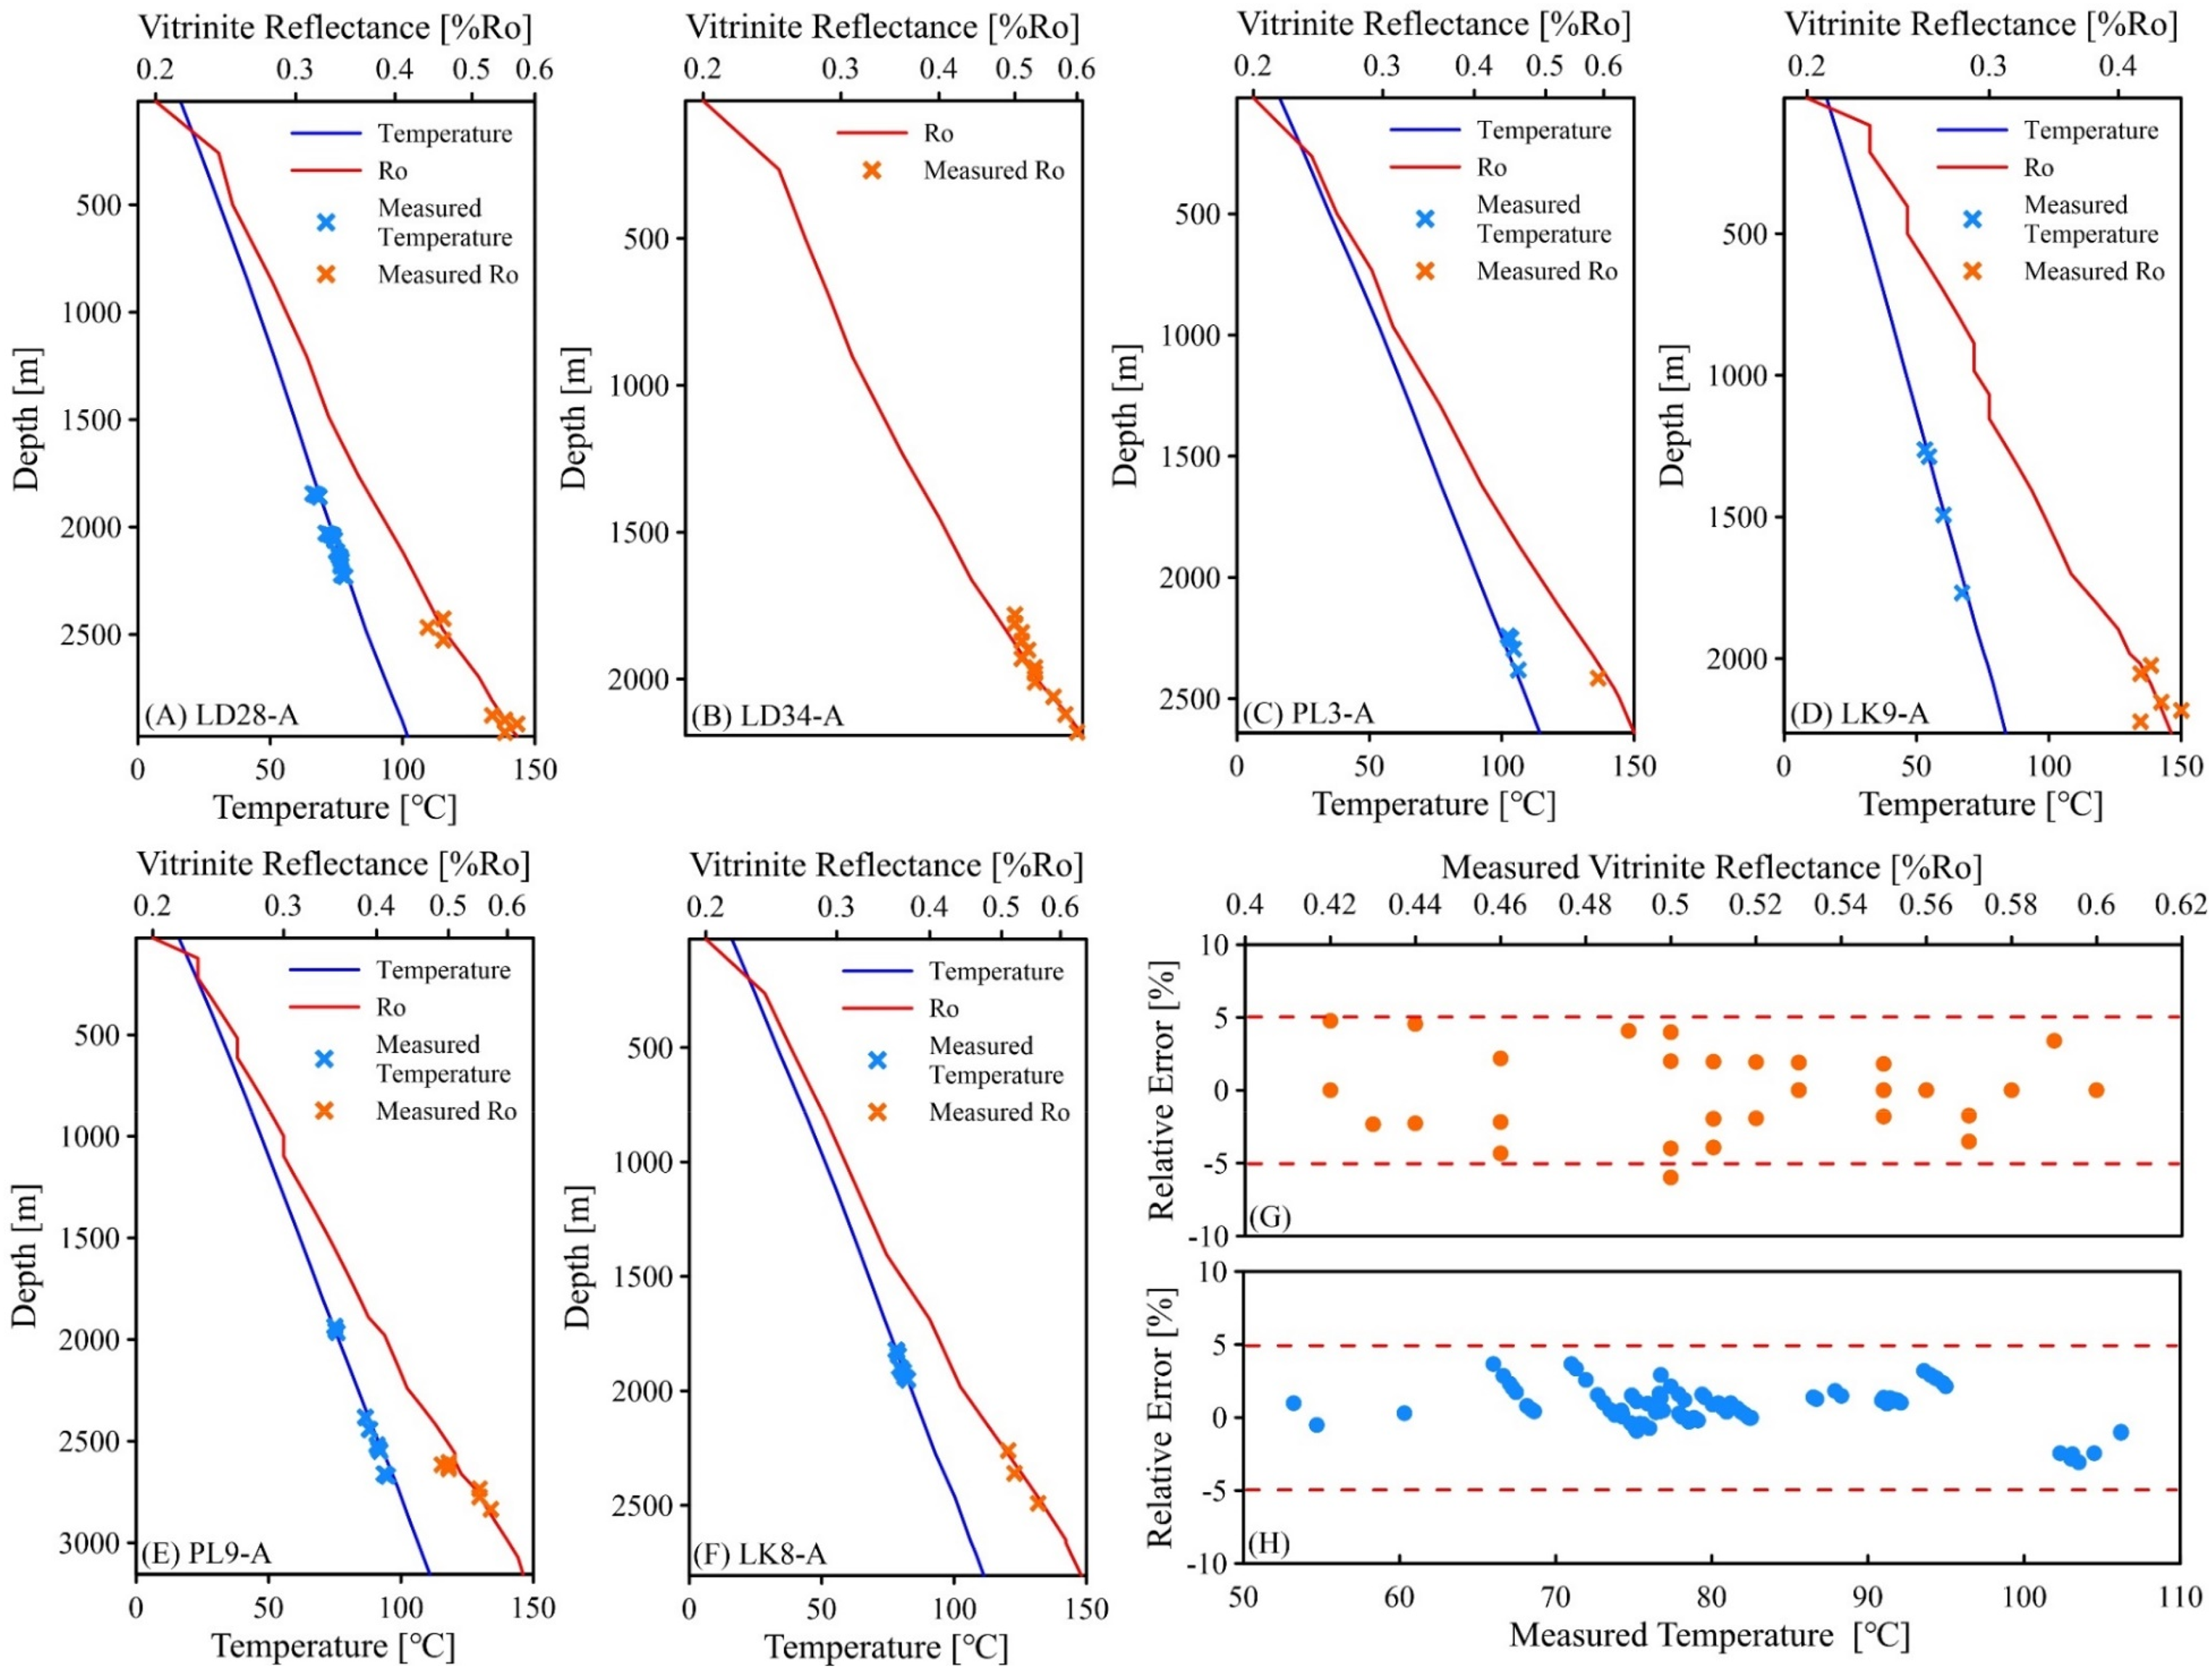
Temperature (°C) and vitrinite reflectance (%Ro) profiles versus depth at the location of selected wells from the 3D model, including (a) LD28-A, (b) LD34-A, (c) PL3-A, (d) LK9-A, (e) PL9-A, and (f) LK8-A. These profiles represent good correlations between the measured (cross) and calculated (line) temperatures (°C) and vitrinite reflectance (%Ro). The relative errors between the measured and calculated temperatures (°C) and vitrinite reflectance (%Ro) are shown in (g) and (h), respectively.
Burial, thermal and maturity history
To quantitatively and dynamically evaluate the hydrocarbon generation process of source rocks, it is essential to understand their burial and thermal maturation histories. Since no wells have been drilled in the center of the Bodong Sag, two pseudowells, RR-N and RR-S, located in the northern and southern subsags, respectively, were selected to reconstruct these histories (Figures 11(a) and (b)).
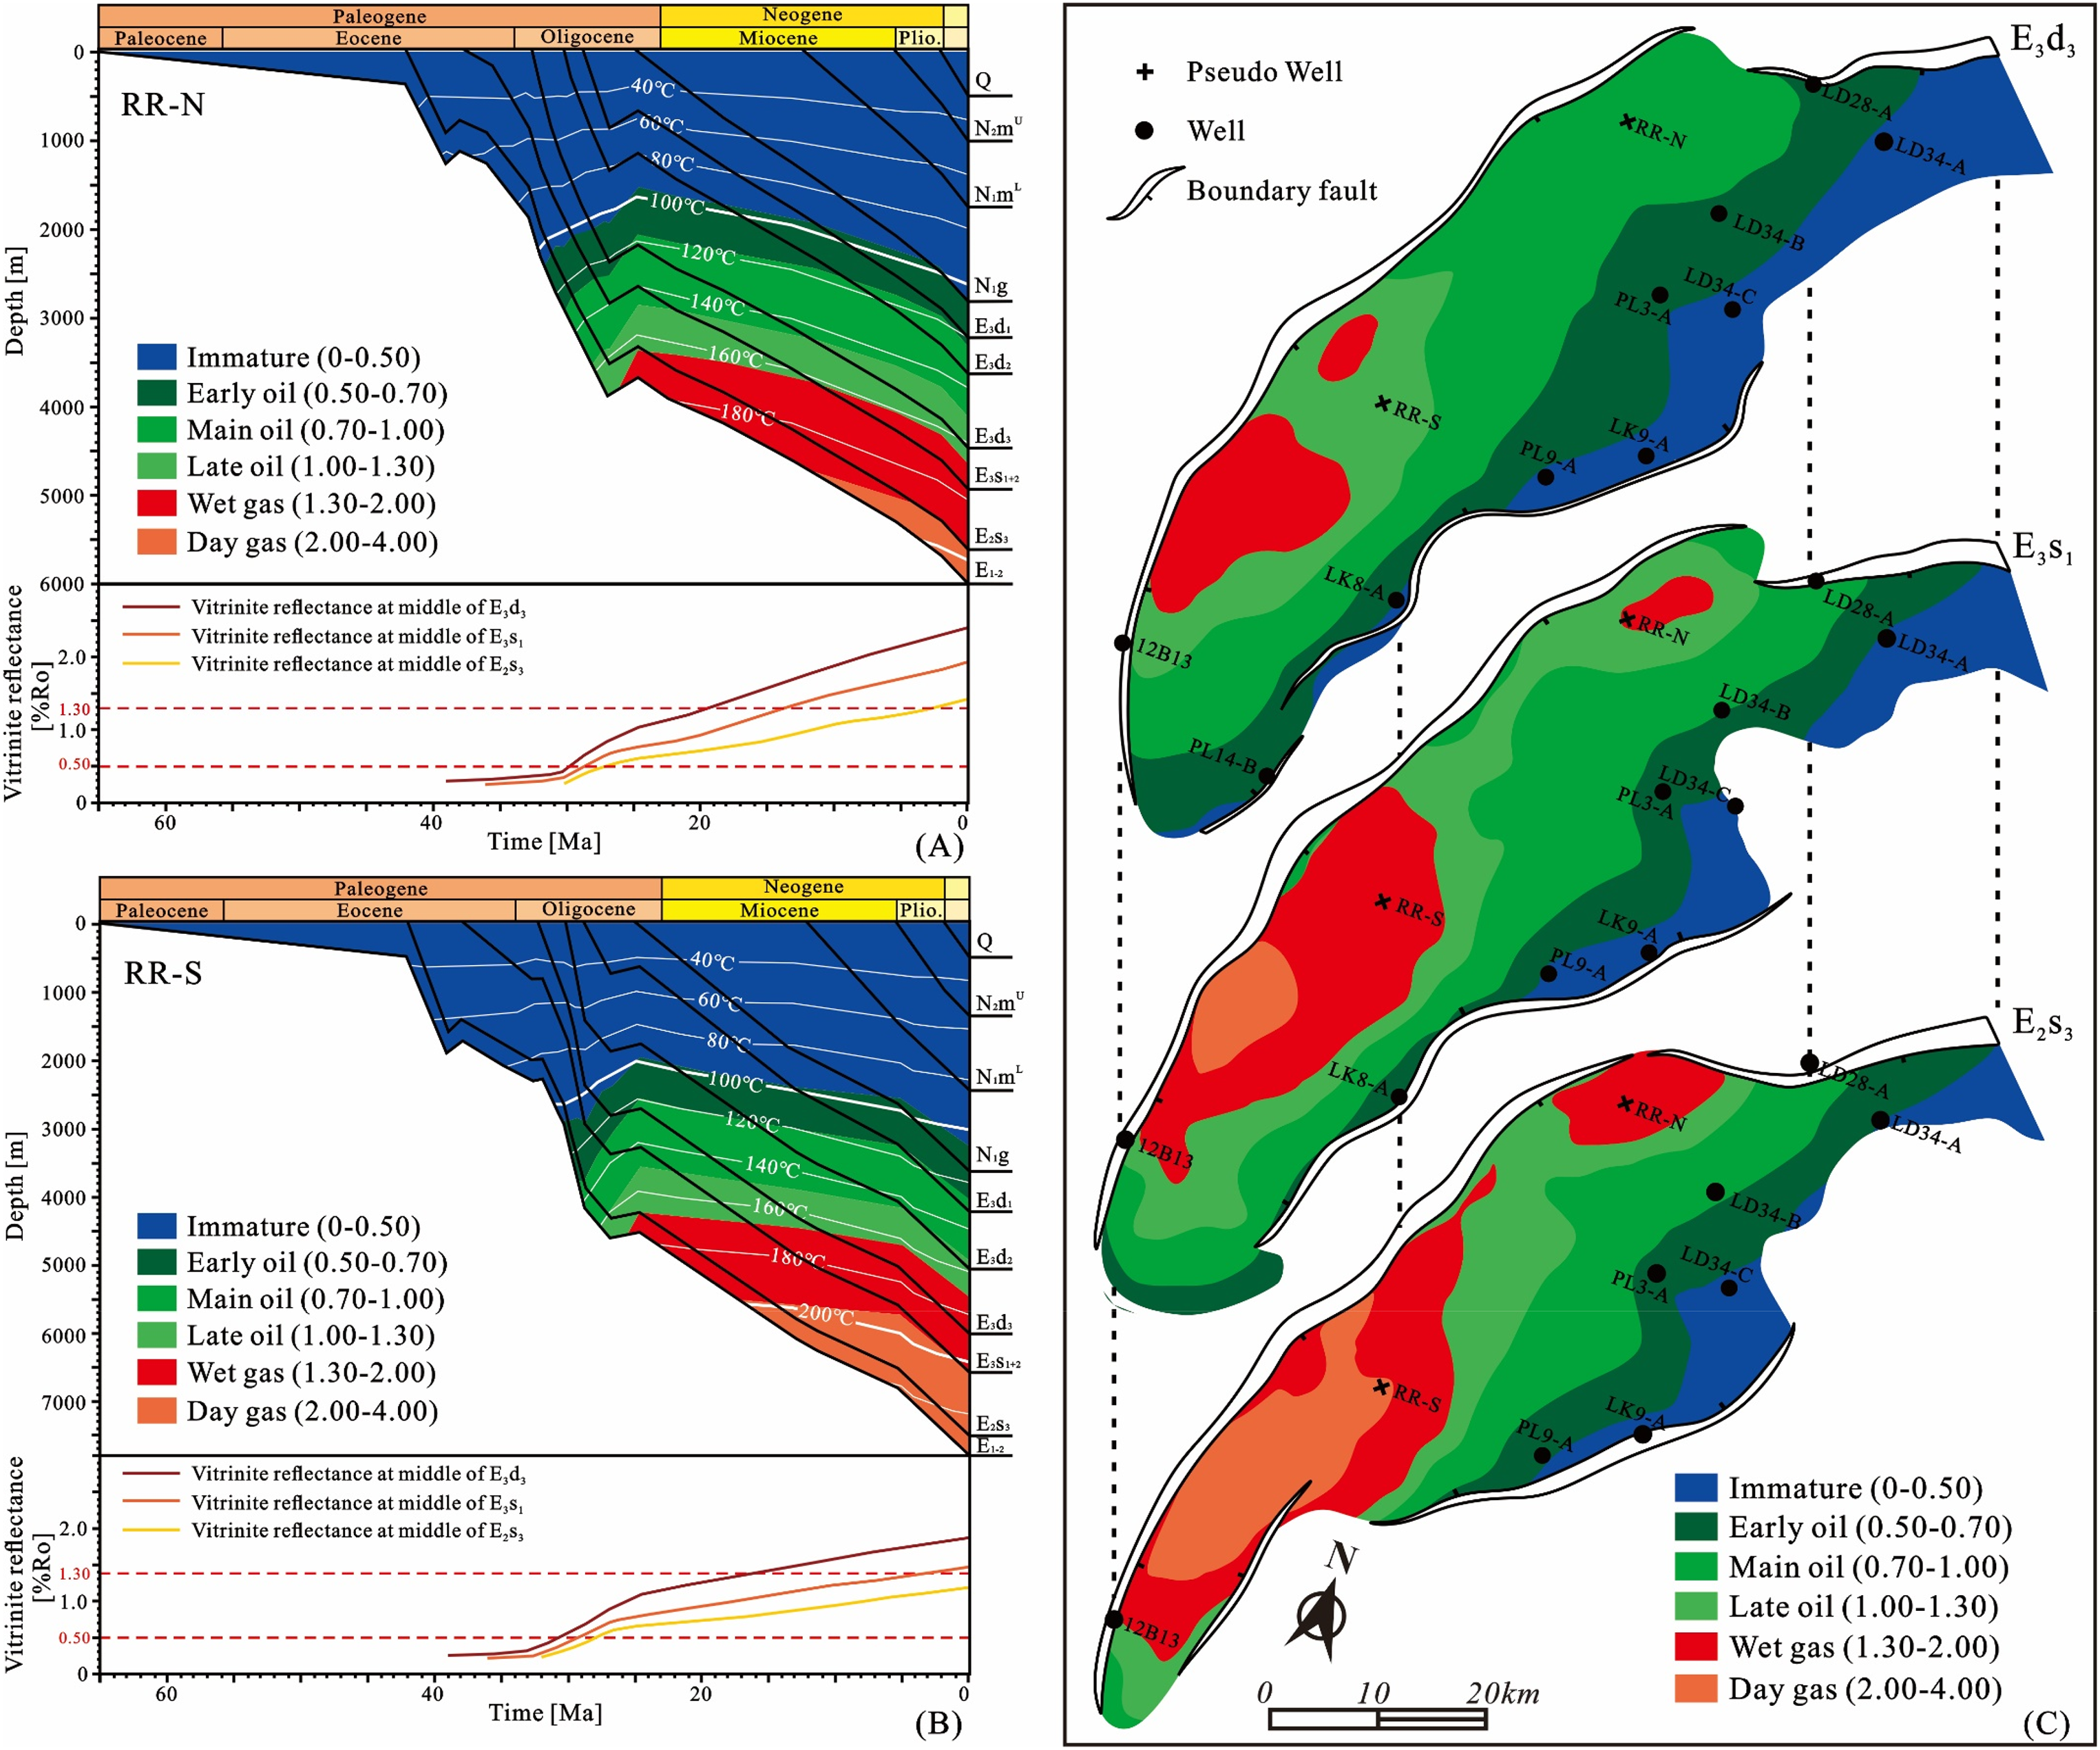
Reconstructed burial and thermal histories through time of two pseudowells: (a) RR-N and (b) RR-S. The locations of the two pseudowells are shown in Figure 1(b). For abbreviations of the formations in the burial and thermal histories see Table 3. (c) Calculated maturity (%Ro) distribution map of Paleogene source rocks in the present-day Bodong Sag. From the bottom to the top are the source rocks of the third member of the Shahejie Fm (E2s3), the first member of the Shahejie Fm (E3s1), and the third member of the Dongying Fm (E3d3).
During the Late Eocene (38–32.8 Ma), corresponding to a lower sedimentation rate, both the RR-S and RR-N wells did not reach the hydrocarbon generation threshold, with temperatures reaching only 80°C (immature). During the Oligocene (32.8–24.6 Ma), the sag underwent rapid deep burial and the sedimentation rate peaked. In the Late Oligocene (∼24.6 Ma), the E2s3 source rocks in the RR-N and RR-S wells reached burial depths of 3500 and 4280 m, respectively, with temperatures around 160°C and thermal maturity over 1.0%Ro (main oil window). Simultaneously, the E3s1 source rocks entered the main oil window, and the E3d3 source rocks entered the early oil window. In the Middle Miocene (∼12 Ma), the E2s3 source rocks in both the RR-N and RR-S wells reached the wet gas stage with maturity greater than 1.3%Ro. At this time, the E3s1 source rocks reached the late oil to the wet gas stage, with maturities ranging from 1.0%Ro to 1.4%Ro, and the E3d3 source rocks remained in the main oil stage. From the Pliocene to the present (5.1–0 Ma), rapid burial caused a significant increase in temperature, and the maturity of the three sets of Paleogene source rocks continuously increased to their present peak.
The present-day thermal maturity (%Ro) distribution of the three sets of Paleogene source rocks is shown in Figure 11(c), which indicates that the sag is generally in the mature stage (>0.7%Ro), while the slope areas at the margins of the sag remain in the immature to early mature stage (0.5–0.7%Ro). The E2s3 source rocks in the northern subsag depocenter have reached the wet gas stage with a maturity of over 1.3%Ro, while in the southern subsag depocenter, due to deeper burial, they have largely entered the dry gas stage with a maturity of over 2.0%Ro. The E3s1 source rocks have reached the wet gas to the dry gas stage (1.3–2.3%Ro) in both the northern and southern subsags, while the area of over maturity is significantly narrower compared to the E2s3. The E3d3 source rocks at lower burial depths have reached a maturity of 0.5–1.3%Ro, with only a small area in the depocenter of the southern subsag reaching the wet gas window.
Hydrocarbon generation process
Following the burial and thermal maturation histories, the hydrocarbon generation process of the Paleogene source rocks was reconstructed as shown in Figures 12 and 13.
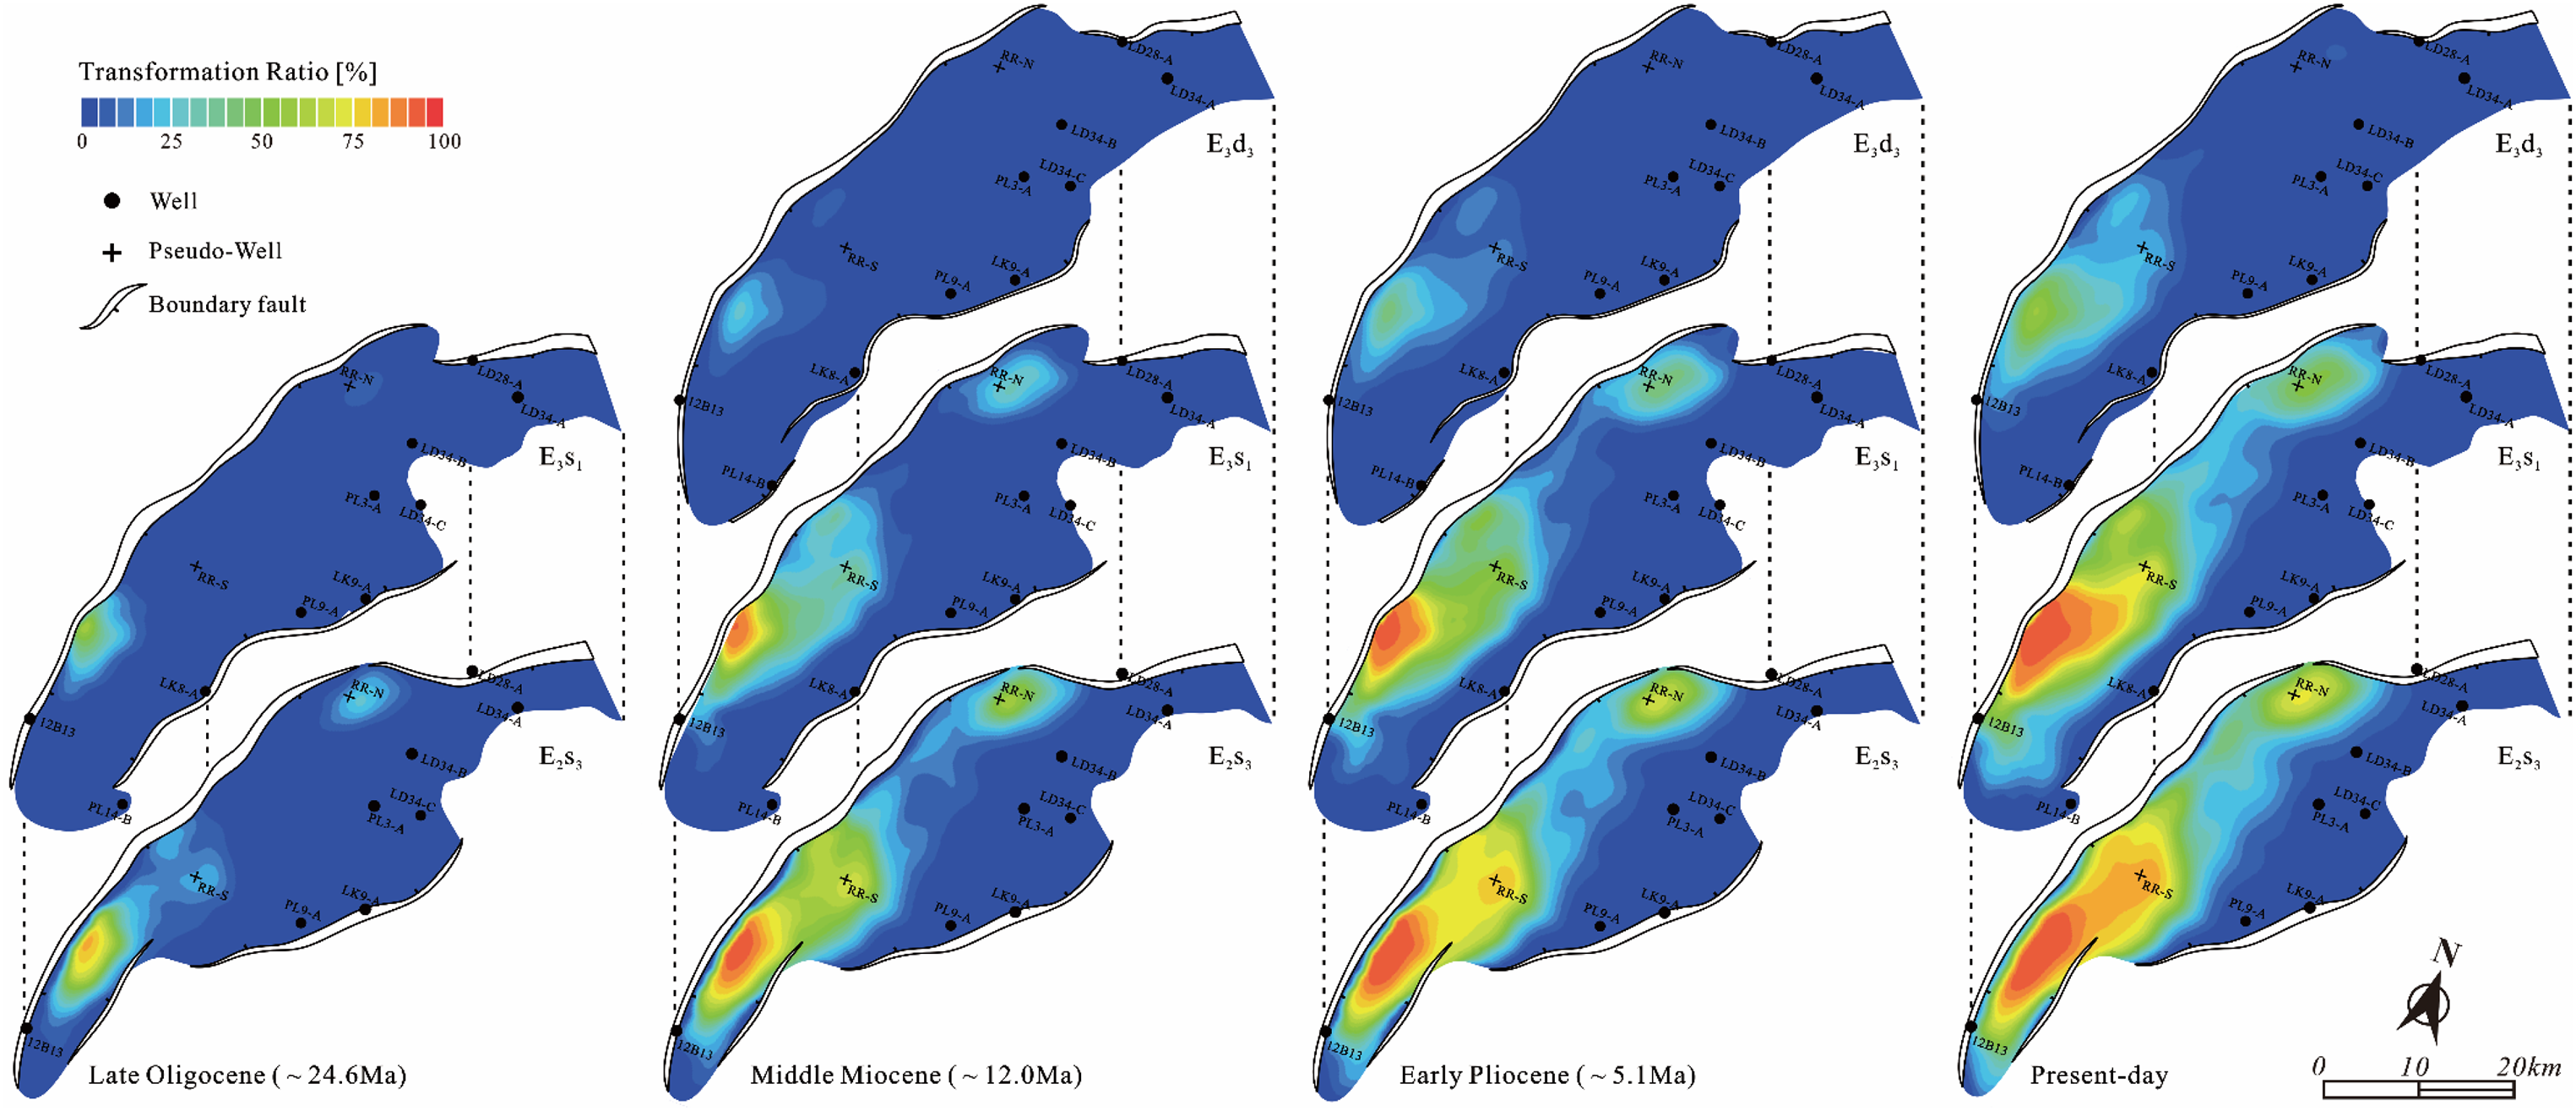
Calculated transformation ratio (%) of organic matter to hydrocarbon over time for Paleogene source rocks. From the bottom to the top are the source rocks of the third member of the Shahejie Fm (E2s3), the first member of the Shahejie Fm (E3s1), and the third member of the Dongying Fm (E3d3).
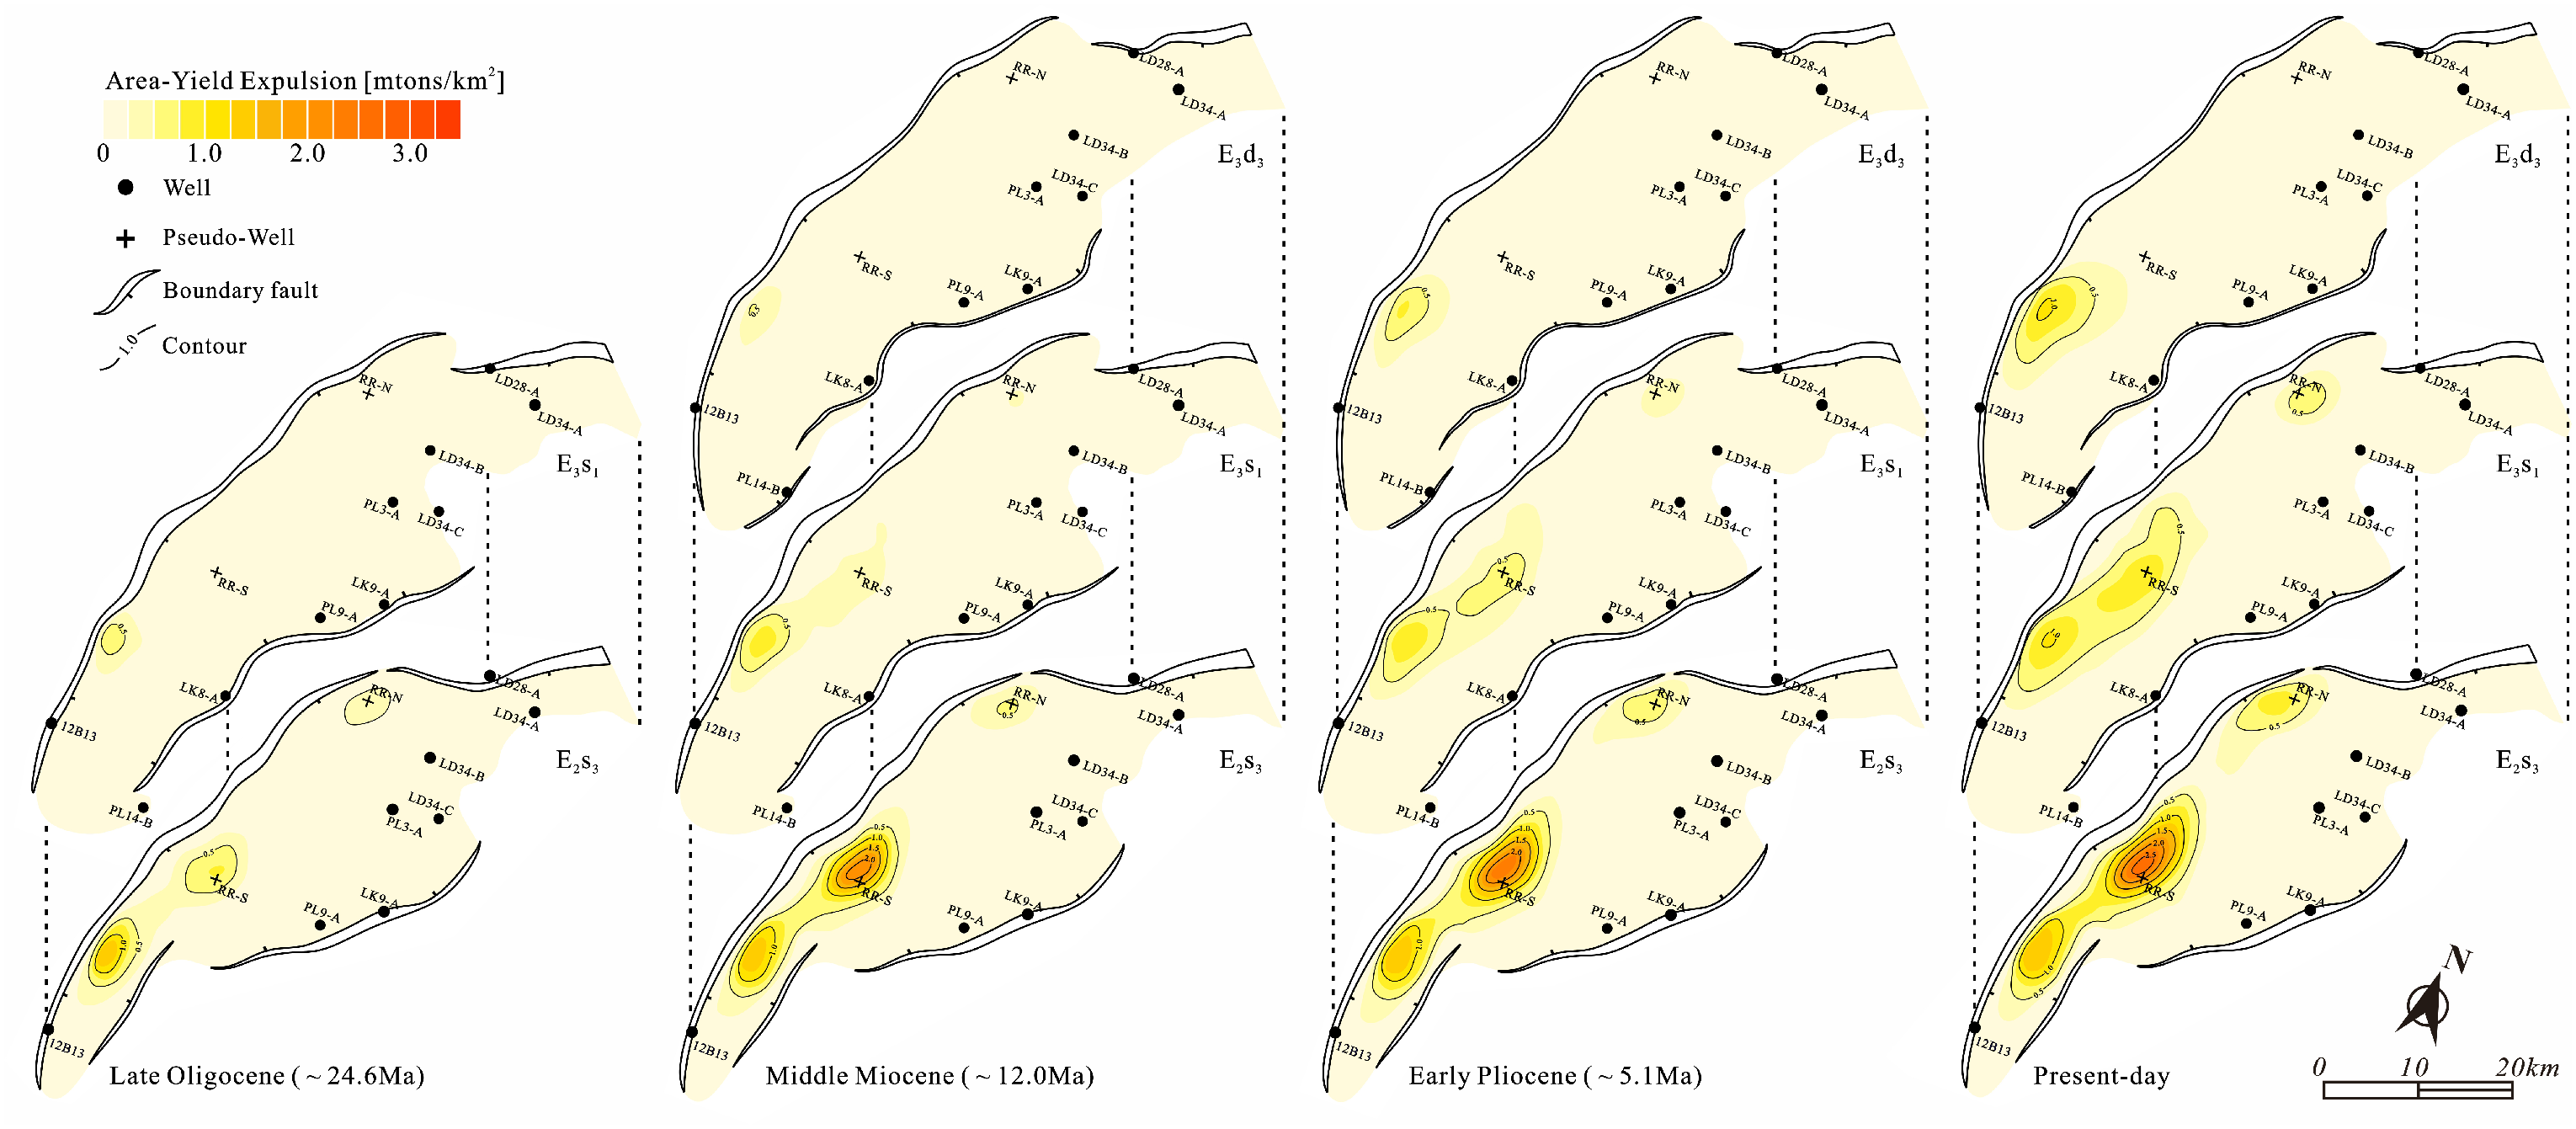
Calculated hydrocarbon generation intensity (mt/km2) over time for Paleogene source rocks. From the bottom to the top are the source rocks of the third member of the Shahejie Fm (E2s3), the first member of the Shahejie Fm (E3s1), and the third member of the Dongying Fm (E3d3).
The results indicate that hydrocarbon generation from the E2s3 source rocks began in the Early Oligocene (∼30.3 Ma) (Figure 11(a) and (b)). Rapid burial resulted in a significant increase in maturity and continued hydrocarbon generation. The E2s3 source rocks entered the oil window in the Late Oligocene (∼24.6 Ma) (Figure 11(a) and (b)) with a transformation ratio (TR) of 10% and a rating of 70% or more in the center of the southern subsag (Figure 12). The hydrocarbon generation intensity in the southern subsag ranged from 0.3 to 3.0 mt/km2, while in the northern subsag, it was less than 0.4 mt/km2 (Figure 13). The E2s3 source rocks reached the wet gas stage in the Middle Miocene (∼12sMa) (Figure 11(a) and (b)), with TR increasing significantly to over 50% and exceeding 90% in the deepest part (Figure 12). Correspondingly, the hydrocarbon generation intensity also increased, ranging from 1.0 to 5.5 mt/km2 in the southern subsag and less than 1.0 mt/km2 in the northern subsag (Figure 13). From the Pliocene to the present (5.1–0 Ma), rapid increases in maturity led to more intensive hydrocarbon generation. At present, the northern subsag has reached the wet gas stage (Figure 11(c)), with a TR of 60% and a hydrocarbon generation intensity of less than 1.0 mt/km2 (Figures 12 and 13). The southern subsag has reached the wet to dry gas stage (Figure 11(c)), with a TR exceeding 70% and reaching up to 98% in the deepest part (Figure 12), and a hydrocarbon generation intensity of up to 6.0 mt/km2 or more (Figure 13).
Hydrocarbon generation of the E3s1 source rocks began in the Middle Oligocene (∼28 Ma), which was later than that of the E2s3 source rocks (Figure 11(a) and (b)). The E3s1 source rocks reached the main oil stage in the Late Oligocene (∼24.6 Ma) (Figure 11(a) and (b)), with TR generally low, exceeding 30% only in the deepest part of the southern subsag (Figure 12). The hydrocarbon generation intensity was also low, being less than 0.2 mt/km2 in the northern subsag and less than 0.8 mt/km2 in the southern subsag (Figure 13). The E3s1 source rocks reached the late oil to the wet gas stage in the Middle Miocene (∼12 Ma) (Figure 11(a) and (b)), with TR ranging from 5% to 30% in the northern subsag and 20% to 80% in the southern subsag (Figure 12). Correspondingly, the hydrocarbon generation intensity increased to 0.2–0.6 mt/km2 in the northern subsag and exceeded 1.0 mt/km2 in the southern subsag (Figure 13). From the Pliocene to the present (5.1–0 Ma), the maturity of the E3s1 source rocks has steadily increased, currently reaching the wet to dry gas stage (Figure 11(c)). TR has increased to 40% and 60% in the northern and southern subsags, respectively, and up to 98% in the deepest part (Figure 12). The hydrocarbon generation intensity of the present day ranges from 0.3 to 1.5 mt/km2 (Figure 13).
Hydrocarbon generation from the E3d3 source rocks began in the Late Oligocene (∼24.6 Ma) (Figure 11(a) and (b)). Due to low thermal maturity, the source rocks remained in the early oil to main oil stage until the Middle Miocene (∼12 Ma). The TR exceeded 5% only in the center of the southern subsag (Figure 12), and the hydrocarbon generation intensity ranged from 0.1 to 1.25 mt/km2 (Figure 13). The E3d3 source rocks reached the main oil stage in the Early Pliocene (∼5.1 Ma) (Figures 11(a) and (b)), with the TR in the southern subsag increasing from 5% to 40% (Figure 12), corresponding to a hydrocarbon generation intensity of 0.4–1.4 mt/km2 (Figure 13). At present, the E3d3 source rocks maturity is generally in the range of 0.5–1.3%Ro (oil window) (Figure 11(c)). It is noteworthy that the maturity in the deepest part of the southern subsag has reached the wet gas stage (Figure 11(c)), corresponding to a TR of up to 50% and a hydrocarbon generation intensity of more than 2.0 mt/km2 (Figures12 and 13).
Resource mass
The hydrocarbon exploration potential is primarily indicated by the available hydrocarbon resource, which is determined from the generation mass obtained from petroleum system modeling, combined with the migration and accumulation coefficients. These coefficients are influenced by various geological factors and show a correlation. Using a statistical correlation model (equation (1)) (Liu et al., 2003), the migration and accumulation coefficients for the E2s3, E3s1, and E3d3 source rocks in the study area were calculated as 11.28%, 10.48%, and 10.01%, respectively (Table 6).
Various geological parameters and migration and accumulation coefficients of the three sets of Paleogene source rocks in the Bodong Sag.
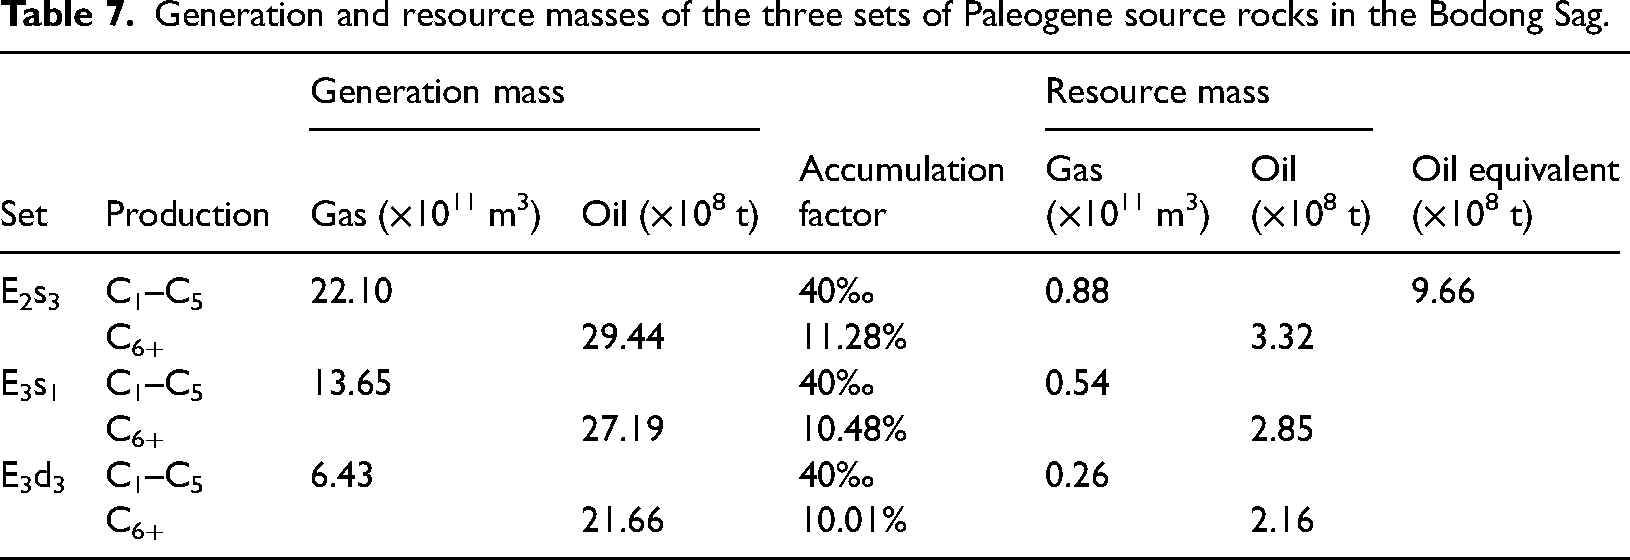
The results indicate that, after accounting for oil secondary cracking to advance the hydrocarbon generation kinetics, the hydrocarbon generation mass of the E2s3 source rocks is 29.44 × 10⁸st of oil and 22.10 × 10¹¹ m3 of gas, the E3s1 source rocks is 27.19 × 10⁸ t of oil and 13.65 × 10¹¹ m3 of gas, the E3d3 source rocks is 21.66 × 10⁸ t of oil and 6.43 × 10¹¹ m3 of gas (Table 7). The total resources of the three sets of Paleogene source rocks in the Bodong Sag are 9.66 × 10⁸ t of oil equivalent, including 8.33 × 10⁸ t of oil and 1.68 × 10¹¹ m3 of gas (Table 7). Specifically, the E2s3 source rocks contain 3.32 × 10⁸ t of oil and 0.88 × 10¹¹ m3 of gas, the E3s1 source rocks contain 2.85 × 10⁸ t of oil and 0.54 × 10¹¹ m3 of gas, and the E2s3 source rocks contain 2.16 × 10⁸ t of oil and 0.26 × 10¹¹ m3 of gas (Table 7).
Generation and resource masses of the three sets of Paleogene source rocks in the Bodong Sag.
Discussion
Source rock bulk properties and the depositional environment
It is common to combine TOC with S2 to evaluate hydrocarbon generation potential (Espitalié et al., 1977; Peters, 1986). As illustrated in Figure 14(a), there is a clear positive correlation between TOC content and S2, with most samples falling into the ‘good’ category (Peters, 1986). The cross-plot of Tmax and HI may provide some clues for the classification of organic types (Espitalié et al., 1977). As shown in Figure 14(b) and (c), the distribution of the data indicates that the Paleogene source rocks in the Bodong Sag are dominated by Type II1. Among them, the E2s3 and E3s1 source rocks are mainly sapropelic kerogen, primarily Type II1 with a small amount of Type I. The E3d3 source rocks is mainly Type II1 and Type II2. This variation is consistent with the microscopic observations of the maceral composition.
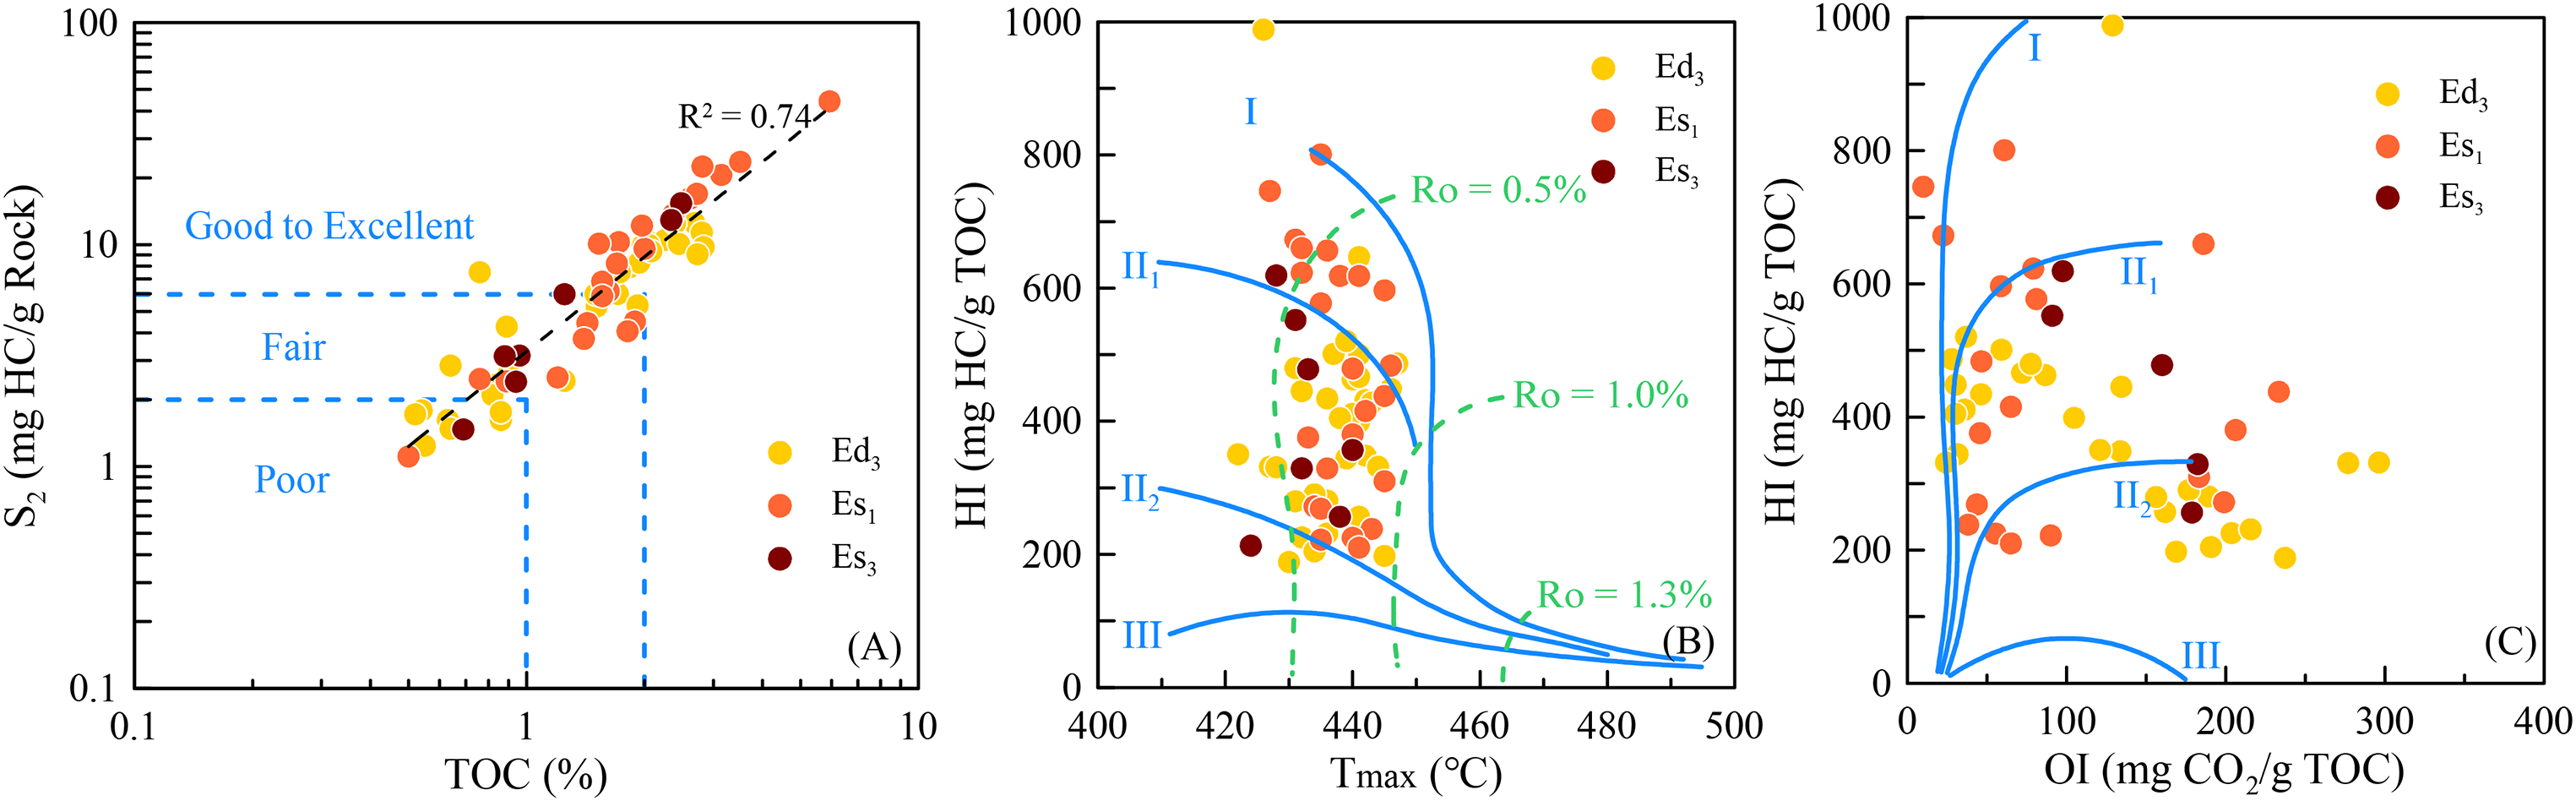
Rock-Eval pyrolysis results for the three sets of Paleogene source rock samples selected from the Bodong Sag. (a) Cross-plot of TOC and S2 for determining the quality of source rocks. Variations of (b) Tmax versus HI and (c) OI versus HI showing the corresponding types of organic matter.
Overall, source rocks from the E3d3, E3s1, and E2s3 members of the Bodong Sag exhibit wide variations in TOC contents and pyrolysis parameters (Table 1 and Figure 14). These variations are attributed to the rapid lateral and vertical changes in the lacustrine depositional environment (paleoclimate, PWD, salinity, and redox conditions), which resulted in a wide range of geochemical features in the three sets of Paleogene source rocks (Hao et al., 2011). The E2s3 source rocks typically developed in a warm and humid semi-deep lake environment, where aquatic organisms such as algae provided organic matter inputs, forming high-quality source rocks dominated by hydrogen-rich algal organic matter, represented by Type A and B organic facies (Table 5) (Hao et al., 2009a; Hao et al., 2011; Wang et al., 2020b). The E3s1 source rocks developed in a brackish lacustrine environment under a hot and arid climate, characterized by organic matter inputs from lower aquatic organisms, which facilitated the preservation of organic matter, also represented by Type A and B organic facies (Table 5) (Hao et al., 2009a; Hao et al., 2011). The E3d3 source rocks developed in a shore-shallow lake environment, dominated by the input of terrestrial organic matter, represented by Type B organic facies (Table 5) (Hao et al., 2009a; Hao et al., 2011; Wang et al., 2020b). Therefore, as manifested in the geochemical characterization, the organic matter type of both E2s3 and E3s1 source rocks is mainly sapropelic, with a high hydrocarbon generation potential (Figures 3 and 14). While the E3d3 source rocks indicate a mix of sapropelic and humic organic matter, with a certain level of hydrocarbon generation potential (Figures 3 and 14).
Effects of temperature and kinetics on the hydrocarbon generation process
The thermal maturation of the organic matter and the hydrocarbon generation are temperature controlled (Hunt, 1979; Tissot and Welte, 1984). This is demonstrated by two key points: (1) the degradation of organic matter to hydrocarbons requires a certain minimum temperature, known as the hydrocarbon generation threshold temperature, to meet the energy requirements of the reaction; and (2) according to the Arrhenius equation, the reaction rate of hydrocarbon generation from kerogen degradation is exponentially related to temperature, with higher temperatures accelerating the rapid conversion of organic matter to hydrocarbons.
There is a strong correlation between geothermal temperature and burial depth in the study area, with the temperature continuously increasing with burial depth (Figures 11(a) and (b) and 15). Consequently, the thermal maturity of the three sets of Paleogene source rocks is highest in the depocenter of the sag and decreases toward the margins (Figure 11(c)), showing a vertical decrease from bottom to top (Figure 11(c)). Temperature primarily controls the timing of when source rocks reach the threshold of hydrocarbon generation. The E2s3 source rocks have greater burial depths and temperatures, reaching the threshold earlier than E3s1 and E3d3 (Figure 11(a) and (b)). Additionally, variations in temperature affect the rate of the hydrocarbon generation reaction. The bottom of the E2s3 source rocks in the RR-S pseudowell was taken as an example to analyze the effect of temperature evolution on hydrocarbon generation (Figure 15). During the Oligocene (32.8–24.6 Ma), continued rifting subsidence caused paleoheat flow to increase, peaking at the end of the Oligocene (Figure 8), which correspondingly increased the geothermal temperature of the E2s3 member from 80°C to over 150°C. During this time, the E2s3 source rocks first reached the hydrocarbon generation threshold and entered the oil window, with the generation rate increasing rapidly and peaking in a short time (section a in Figure 15). At the end of the rifting, the sag entered the thermal subsidence stage, with a gradual decrease in paleoheat flow (Figure 8), corresponding to a slowing down of the temperature increase, leading to a significant decrease in the hydrocarbon generation rate (section b in Figure 15). Following the increase in thermal maturity of the source rocks leading to the wet gas window, the generation rate increased briefly due to the thermal cracking of liquid hydrocarbons to generate gas (section c in Figure 15) and then returned to the previous decreasing trend (section d in Figure 15).
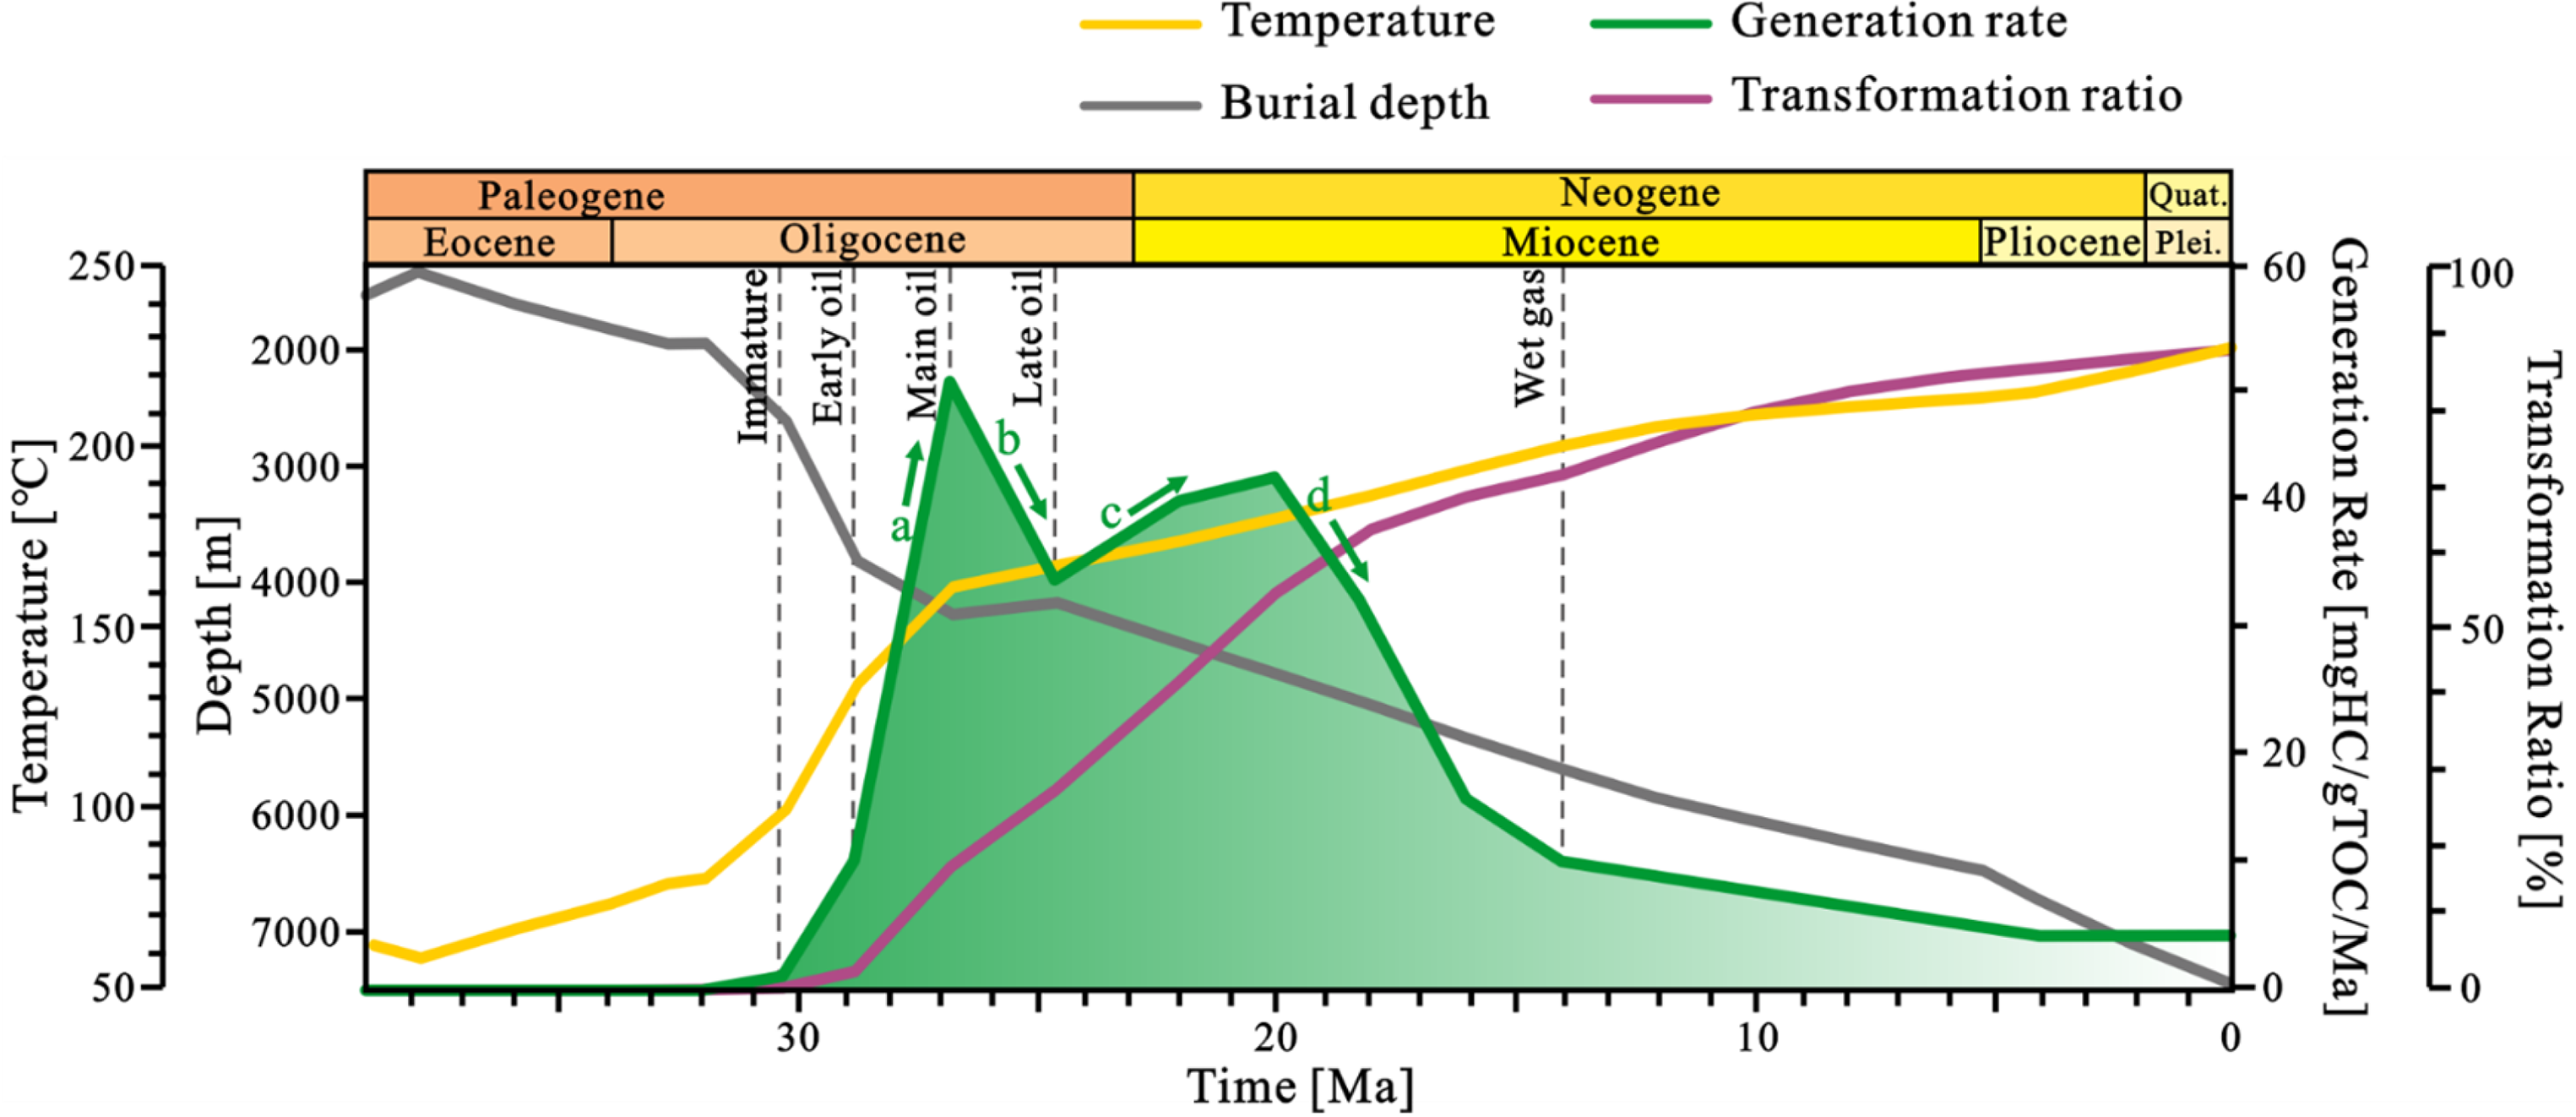
Time extractions of depth, temperature, generation rate, and transformation ratio at the bottom of the source rocks of the third member of the Shahejie Fm (E2s3) at the RR-S pseudowell.
Kinetics describes the chemical reaction process of kerogen degradation to hydrocarbon generation, where the magnitude of the kinetic parameters determines the reactivity of the reaction. The Arrhenius equation indicates that the generation rate is relatively high for organic matter with low activation energy. Compared with the E3d3 source rocks (Table 2 and Figure 5(a)), the E2s3 and E3s1 source rocks have low activation energies and narrow distribution ranges (Table 2 and Figure 5(b) and (c)), resulting in a relatively faster rate of hydrocarbon generation from kerogen degradation. The E2s3 and E3s1 source rocks in the depocenter of the present-day sag have reached the wet gas stage (>1.3%Ro) to the dry gas stage (>2.0%Ro), corresponding to a TR close to 100%, indicating that the kerogen has been almost completely converted into hydrocarbons.
Differential evaluation of the petroleum potential of source rocks
The resources of the three sets of Paleogene source rocks in the Bodong Sag total 9.66 × 10⁸st (oil equivalent) with an average resource abundance of 24.15 × 10⁴ t/km2, exceeding the threshold standard for resource abundance in the hydrocarbon-rich depressions of the BBB, which is 15 × 104 t/km2 (Zhu et al., 2009). Large- and medium-sized oil and gas fields, such as PL9-1, PL19-3, and PL25-6, have been discovered during the peripheral uplifts around the sag. Oil–source correlation studies (Hao et al., 2009b; Tian et al., 2014) also confirmed the substantial resource potential of the Paleogene lacustrine source rocks in the Bodong Sag.
The resources of the E2s3 source rocks account for the largest share of 41.62%, followed by the E3s1 source rocks at 33.95%, and the E3d3 source rocks at 24.43% (Figure 16(a)). The southern subsag exhibits higher thermal maturity and TR (Figures 11(c) and 12), corresponding to intense hydrocarbon generation (Figure 13), which results in a total resource estimate of 7.43 × 10⁸ t (oil equivalent), accounting for 76.92% of the overall resource (Figure 16(b)). Given the geochemical characteristics, thermal maturity, and hydrocarbon generation process of the three sets of Paleogene source rocks, as well as the results of the resource evaluation, it can be concluded that the E2s3 is the primary source rock of the Bodong Sag, and the southern subsag makes a significant contribution to the oil and gas resources.
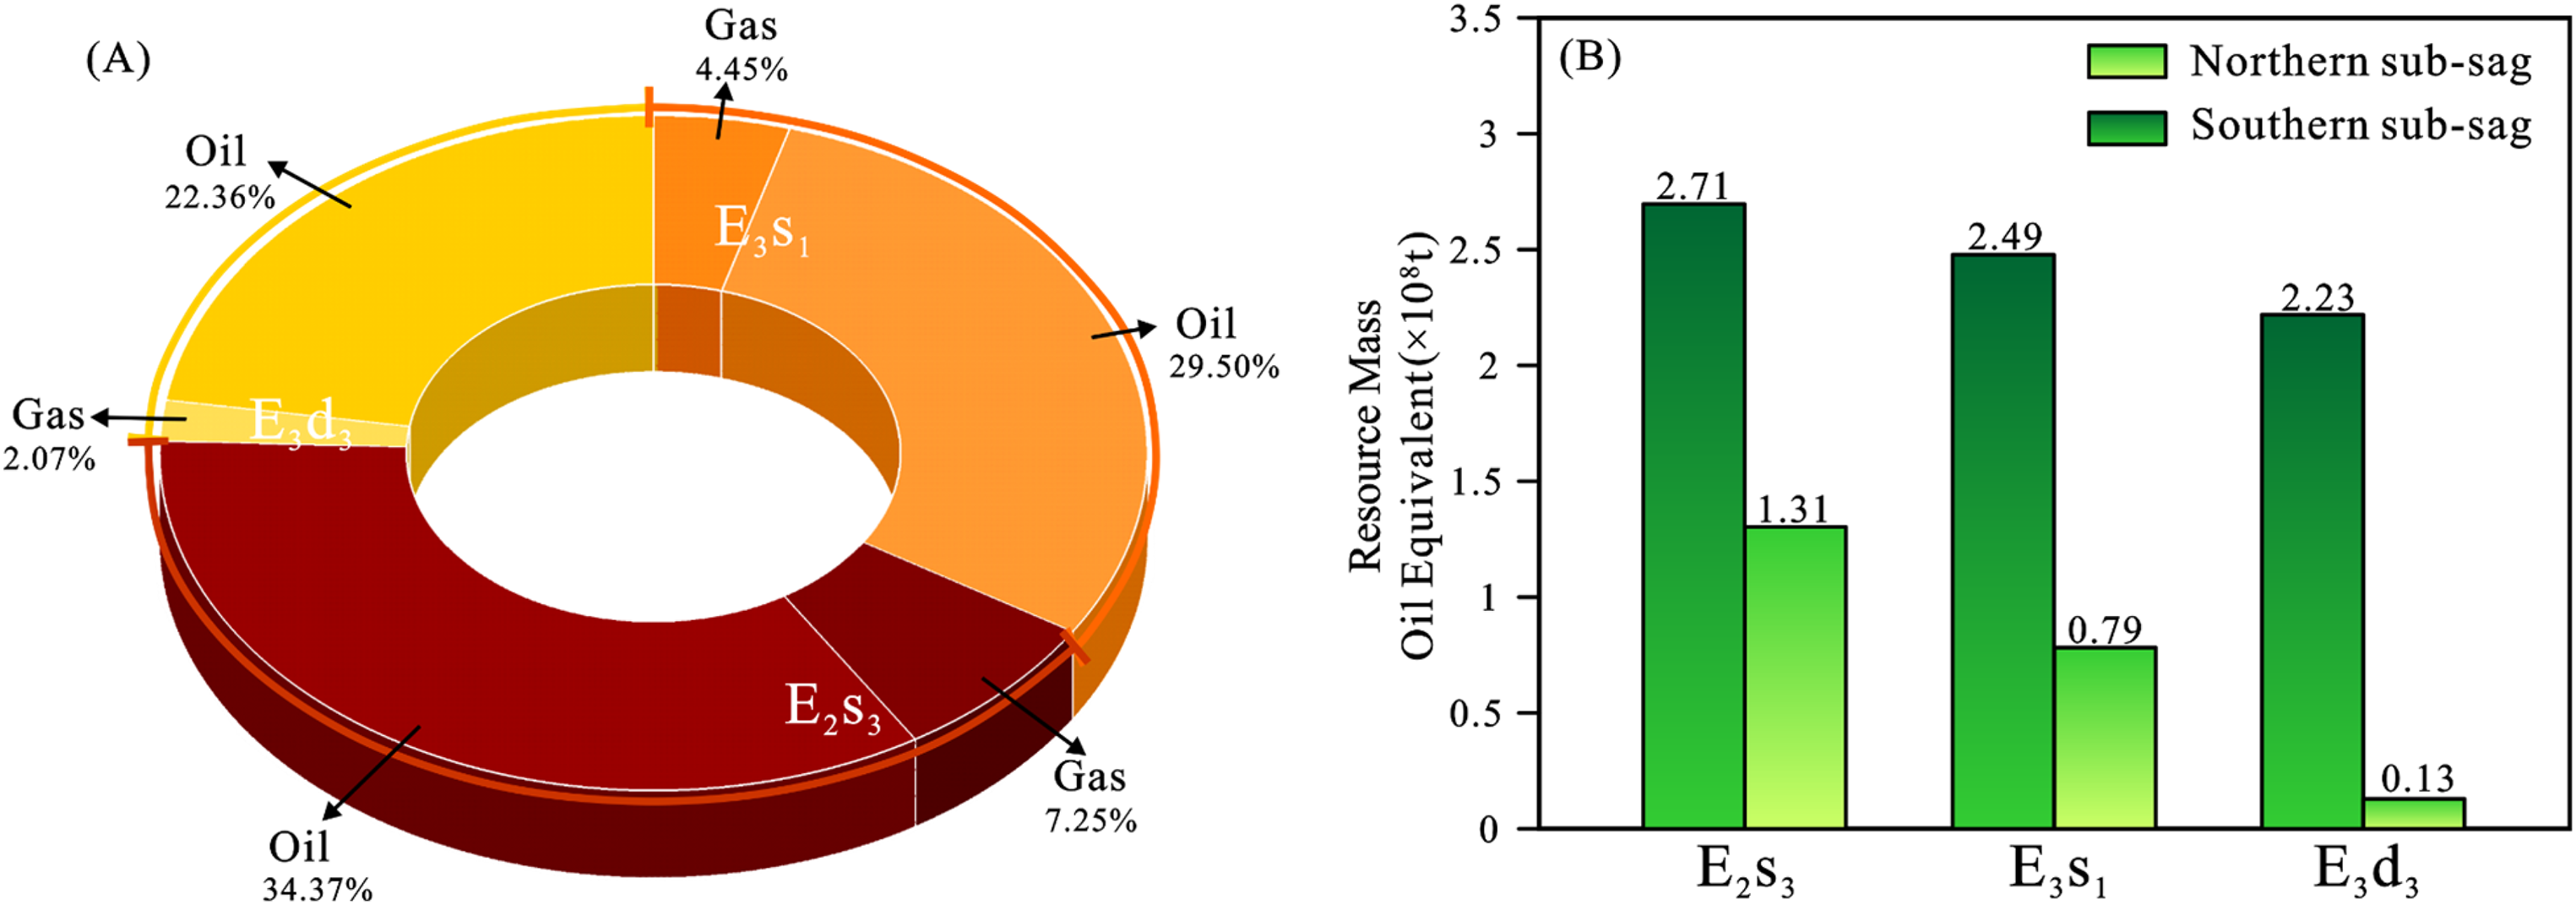
(a) Pie chart of the proportion of oil and gas resources contributed by the three sets of Paleogene source rocks in the Bodong Sag. (b) Bar chart of the resource mass of the three sets of Paleogene source rocks in the northern and southern subsags of the Bodong Sag.
Resource estimate updates and future exploration implications
This study represents the first comprehensive evaluation of the resource potential in the Bodong Sag using a kinetics-based 3D petroleum system modeling approach. The research has provided an advanced understanding of the hydrocarbon generation kinetics of the three sets of Paleogene source rocks in the Bodong Sag. The evaluation results show significant updates compared to the one conducted two decades ago (He et al., 2005). Overall, the resource estimate has increased by approximately 19% due to the increased number of wells available for source rock geochemical characterization over the past two decades. While the oil resources remain essentially the same as in the previous study, the gas resources have dramatically increased by 572% compared to the previous report due to the new hydrocarbon kinetic models incorporating crude oil cracking. The significant increase in estimated gas resources highlights the promising prospects for future natural gas exploration in the Bodong Sag and will further enhance confidence in the continued exploration and development of natural gas in the Bodong area.
Conclusions
The Paleogene lacustrine source rocks in the Bodong Sag are predominantly characterized by Type II1 organic matter, with good hydrocarbon generation potential. Controlled by sedimentary facies, E3d3 source rocks range in thickness from 100 to 600 m, with TOC 0.5–3.5 wt% and HI 100–400 mg/g TOC. E3s1 source rocks range in thickness from 50 to 300 m, with TOC 0.5–3.0 wt% and HI 100–600 mg/g TOC. E2s3 source rocks are unevenly distributed, with thicknesses generally ranging from 100 to 300 m, and up to 700 m in the southern subsag center. High TOC and HI areas are isolated, with TOC 0.5–3.5 wt% and HI 100–700 mg/g TOC.
Rifting subsidence during the Oligocene increased paleoheat flow to its peak, rapidly raising temperatures and promoting the maturity of the source rocks. Presently, the majority of source rocks within the sag have reached the oil window, with the exception of the margins, which remain in the immature to early mature stage. The maturity of the depocenter ranges from the late oil to wet gas and dry gas stages. The present-day maturity is highest for E2s3, followed by E3s1, and lowest for E3d3 due to differences in burial depth.
E2s3 and E3s1 source rocks achieved early hydrocarbon generation, reaching generation thresholds during the Early and Middle Oligocene, respectively, while E3d3 commenced generation at the end of the Oligocene. The kinetics of hydrocarbon generation, characterized by low activation energies for E2s3 and E3s1, led to higher generation rates. With the thermal maturity steadily increasing, the peak generation occurred in the Early Miocene for E2s3 and the Late Miocene for E3s1.
Total resources from the Paleogene source rocks in the Bodong Sag are 9.66 × 10⁸ t of oil equivalent, with 8.33 × 10⁸ t of oil and 1.68 × 10¹¹ m3 of gas. The E2s3, E3s1, and E3d3 source rocks contribute 41.62%, 33.95%, and 24.43%, respectively, with E2s3 being the major contributor. The southern subsag, accounting for 76.92% of the resource, is the primary hydrocarbon generation kitchen in the Bodong Sag. An updated resource estimate with a significant increase in the gas resources highlights the promising prospects for natural gas exploration in the Bodong area.
Footnotes
Acknowledgments
This study was supported by China National Offshore Oil Corporation Ltd (CNOOC Ltd) Tianjin Branch (CCL2021TJT0NST0338). The authors gratefully acknowledge the Tianjin Branch of CNOOC Ltd for providing the original data and giving permission for publication.
Authors’ contributions
Xinyu Yan and Zhenliang Wang served as lead for conceptualization.Xinyu Yan and Kuaile Zhang served as lead for methodology. Xinyu Yan and Xiangnan Yin served as lead for formal analysis and investigation. Xinyu Yan served as lead for writing–original draft preparation. Zhenliang Wang served as lead for writing–review and editing. Feilong Wang and Rongtao Chen served as lead for resources. Deying Wang served as lead for supervision.
Declaration of conflicting interests
The authors declared no potential conflicts of interest with respect to the research, authorship, and/or publication of this article.
Funding
The authors disclosed receipt of the following financial support for the research, authorship, and/or publication of this article: This work was supported by China National Offshore Oil Corporation Ltd Tianjin Branch (grant number CCL2021TJT0NST0338).