
Abstract
This study aims to reveal the influence of industrial progress and agricultural value addition on environmental harm and explores how the unique moderating role of institutional quality handles this association; using the panel ARDL approach on a panel of South and East Asian economies from 1980 to 2020. The baseline model proposes that for each 1% increase in agricultural added value and industrial progress, carbon dioxide emissions may fluctuate considerably positively by 0.563% and 0.758% respectively. In the long term, the plausibility of the upturned U-shaped association between economic growth and carbon dioxide emissions in South and East Asian economies has been confirmed in the analysis. The use of renewable energy considerably condenses long-term emission levels. Institutional quality is found to have a strong moderating effect on the link between the main model regressors (renewable energy use, industrial growth, GDP per capita, and agricultural value addition) and CO2 emissions. Institutional quality supports the enhancement of industrial and agricultural capabilities and the improvement of environmental worth. Finally, the threshold results indicate that the influence of the main regression variables of the model (renewable energy utilization, industrial growth, per capita GDP, and agricultural added value) on carbon dioxide emissions has fully penetrated the institutional quality level. Strong, high-quality institutions, rather than weak institutions, can improve the aptitude of industry and agriculture to mitigate environmental degradation. In this pursuit, it becomes increasingly important to develop policies that support renewable energy based on institutional values.
Introduction
The impressive production growth in Central and East Asia over the past two decades is thought to have been driven primarily by the industrial and agricultural sectors. Agriculture and industry are two huge sectors that are undoubtedly the foundation of many countries in the Asian continent, but are notorious for polluting the environment (Adegbeye et al., 2020). East and South Asian economies (Bangladesh, India, Sri Lanka, Mongolia, China, Japan, China, Taiwan, and South Korea) are in a transition phase to higher levels of industrial development, resulting in increased greenhouse gas (GHG) emissions and environmental hazards (EFSAS, 2021). South Korea, China, Taiwan, Mongolia and Japan in East Asia, and India, Sri Lanka and Bangladesh in South Asia, performers in these regions have humbly embraced a true industrial development model through improved liberalization to accelerate industrial productivity levels, but at the same time intensify Environmental degradation (ESCAP, 2020; Ali et al., 2023). The inevitable consequences of climate change, global warming, and environmental hazards are of an economic nature in East and South Asia, severely affecting the economic status of poor communities. Increased levels of economic productivity through industrial development and trade openness bring short-term benefits, exacerbating environmental degradation and related risks in East and South Asia (Kazemzadeh et al., 2024; EFSAS, 2021). Along the expansion route considered by the EKC, the environmental trends of East and South Asian economies have generally remained stable, and industrial development emissions have become one of the core ecological structures of East and South Asia (Hashmi et al., 2021). The industrial revolution in South Asia started later than in East and Southeast Asia, which means that South Asian economies are obliged to industrialize immediately to make up for the late start in the industrial development stage (Wade, 2018). The direct cause of the deterioration of environmental quality is the acceleration of rapid upgrading of industrialization (Chen et al., 2022). The structure of industrial progress in East and South Asian economies should rely on more sustainable strategies, such as the use of renewable energy, greater transparency, and stronger environmental agreements. Furthermore, these countries should adapt their industrial growth process to scale up in a more sustainable way in a resource-rich and environmentally friendly manner. Besides, more sustainable industrial energy production, distribution and use should be adopted through country-specific energy policies, while real estate development projects emphasize the use of renewable energy sources to compress CO2 emanations (Olabi et al., 2022).
Agriculture is an important targeted economic activity in East and South Asia and is a key factor embodying most economic sectors. Due to the isolated nature of agricultural productivity, East and South Asian economies find it difficult to closely integrate with environmental advantages. Besides mining, deforestation, chain sawing, irrigation, fertilization, and tillage are core agricultural activities in the region. As shown by Adekoya et al. (2022), these actions result in water, air, and land pollution and destruction of natural habitats. The impacts of climate change are particularly severe in South Asia (Bangladesh, Sri Lanka, and India) and East Asia (South Korea, Taiwan, Mongolia, China, and Japan) due to increases in greenhouse gas (GHG) emissions, primarily from the agricultural sector. Rice in agriculture is the main producer, but constituencies are the main cause of methane emissions. Moreover, in recent decades, specific countries panel have vigorously increased the use of energy and synthetic fertilizers in agricultural productivity cultivation in order to achieve food security goals amid rapid population growth. The use of nitrogen fertilizers for agricultural irrigation results in substantial escalations in nitrous oxide (N2O), while energy use in agriculture considerably augments carbon emission levels. Besides, the agricultural sector's aggressive expansion of dairy and meat production has raised environmental concerns, particularly increased methane emissions (Asian Development Bank, 2022). Agriculture, which emits greenhouse gases by converting non-agricultural land such as forestland into agricultural land, is a major cause of climate change (Sarkodie et al., 2019). Agricultural land and agroforestry sector use accounts for approximately 13% to 21% of global greenhouse gas emissions (Khatri-Chhetri et al., 2022). Likewise, more than half of total greenhouse gas emissions come from agricultural nitrous oxide and methane emissions (FAO, 2020). Key indicators related to local society, economy, and environment are the main determinants of agricultural sustainability curiosity. Adherence to national-level energy development strategies and local declarations should form the basis of energy policy. Specific Asian countries building agri-energy services should focus on non-fossil fuel alternatives. A variety of agricultural-mandated technologies based on renewable energy are being introduced in many regions around the world to compress fossil fuel carbon dioxide (CO2) emissions and reduce the impact of energy price fluctuations on the economy, thereby improving economic efficiency (Abbasi et al., 2022b). Expanding Asia's unique agricultural production and marketing capabilities through the use of renewable energy is critical to sustainable development.
From a global perspective, in the above-mentioned fields, the use of renewable energy has extraordinary benefits comparable to traditional energy, which has fascinated the consideration of governments around the world (Hashemizadeh et al., 2021). Protecting the environment from contamination caused by the aforementioned aspects and maintaining the competitiveness of investment and production requires the government to develop a well-organized renewable energy procurement portfolio (Wen et al., 2022). Financial instruments (guarantees) and customizable policies should be established in a well-structured manner and innovative proprietary digital platforms to enable governments to rationalize inclusive procurement processes. A one-stop elucidation of the transition from non-renewable energy dominated by fossil fuels to renewable energy, aiming to maximize social, environmental and economic advantages (Battisti et al., 2022).
The arguments as highlighted above can provide opportunities for empirical discovery of which indicators have a substantial influence on environmental deterioration in many regions of the globe. The verdict laid the way for future development and provides imaginable long-term implications for solving environmental problems. Intuitively, the conclusions are controversial in terms of the environmental impacts of agriculture, industrial growth, renewable energy, and economic growth. Such as Wang and Feng (2021) explored the gradual effect of China's national high-tech industrial development zones (NHIDZs) on growth while mitigating environmental degradation. However, Xi and Zhai (2023) pointed out that China's environmental risks are driven by the growth and upgrading of industrial structure. Similarly, the CCR, FMOLS, and DOLS procedures used in the study by Kahia and Ben Jebli (2021) show that CO2 emissions in Norway and Denmark can be significantly compressed as industrial growth accelerates, while CO2 emissions in France, Sweden, and Chile has increased. CO2 emissions fell in Australia, Austria, and Chile, but increased significantly in Denmark and the Netherlands as clean energy consumption expanded. Wu and Madni (2021); Li et al. (2019); Fang et al. (2022) empirically demonstrate that industrial growth has substantially opposite effects on carbon emissions. In contrast, studies by Anwar et al. (2020); Zafar et al. (2020); Sumaira and Siddique (2023); Byaro et al. (2022) show that industrialization leads to higher environmental risks. Hossain et al. (2022); Hafeez et al. (2020); Olanipekun et al. (2019); Usman et al. (2022a) support research on agriculture improving environmental quality. However, Uddin (2020); Alhassan (2021); Gurbuz et al. (2021); Warsame et al. (2023) revealed a strong negative impact of agriculture on environmental worth.
This study contributes to the mainstream literature for the first time, assisting in the development of a single framework for agricultural value addition, growth, industrial growth, renewable energy consumption, and CO2 emissions, and helping to expand a more inclusive sustainable policy framework. Bangladesh, Sri Lanka, and India in South Asia and China, Japan, Mongolia, Taiwan, and South Korea in East Asia were included in the panel for the first time, even though these regions are considered to be the most affected by environmental degradation and climate change. Adedoyin, Bein, Gyamfi and Bekun (2021) demonstrated that growth and value-added agriculture in E7 economies (Turkey, Indonesia, China, Russia, India, Brazil, and Mexico) are substantial driver of environmental pollution, while the increase in renewable energy leads to a reduction in ecological harm. Furthermore, Usman et al. (2021) argue that environmental quality severely deteriorates with expansion of growth and agricultural value added, explicitly acknowledging that these two dynamics (growth and agricultural value added) have significant progressive impacts on environmental harm in South Asian economies. In addition, research also shows that in specific areas, the best strategy to improve environmental quality is to use renewable energy within certain limits. Although there are many such studies, none simultaneously examine the link between agriculture, growth, industrial progress, renewable energy use, and carbon dioxide emissions in a specific panel of East and South Asian economies. Thus, the current study can be considered the only one that simultaneously reveals the influence of agriculture, industrial progress, growth, and renewable energy use on CO2 emissions in a specific countries panel. In addition, current regional-specific research also reveals that relevant specific economies in South Asia and East Asia are subject to weak institutional guidance, and the role of institutional quality and strategy execution in solving ecological problems is arbitrary. Institutional quality is not only economically autonomous but can interact with other economic dynamics to influence ecosystems through processes that may not be defined but ultimately require reality-based heuristics. Lastly, this study could reveal specific threshold levels (which may be stronger or weaker) associated with institutional quality to effect whether key indicators contribute to or harm environmental quality. The results of this analytical process lead to more accurate and robust decisions.
The rest of the research content is organized into a “Literature Review”, which mainly focuses on the relationship between industrial growth and the environment; between agriculture and the environment; between economic growth and the environment; and between renewable energy and the environment, which will be introduced in the next section. The “methods” used in the current study, such as description of data and variables, examination of unit roots and cross-sectional dependence, panel cointegration, and long-term coefficient estimation are elaborated in section ‘Methodology’. Section ‘Results and interpretations’ focuses on the interpretation of the results, and finally in section ‘Conclusion’, concluding remarks and policy implications are discussed.
Literature review
Environmental sustainability is considered the most prominent of the three pillars of sustainable development in contexts where lower ecosystems may be directly affected by climate change (Olabi et al., 2022). In the current milieu, climate and climate-related issues are largely the focus of global policy. This is because they bully the general affluence of the masses (Nielsen et al., 2023), this in turn lowers living standards and productivity levels, as this is said to be a key part of the economic norm. Hence, various environmental economic indicators that affect environmental quality have been extensively studied. Industrial growth, agriculture, and the use of renewable energy are rarely considered, while economic growth and fossil fuel dynamics are widely studied as major determinants of the environment.
Industrial growth and environmental hazards nexus
Evidence from recent literature suggests that the consequences of industrial progress protect economic sectors, primarily in terms of their effects on growth and other prosperity dynamics. Industrial development has had a major influence on the environment, fresh research illustrates. Various cross-national panel and case studies based on the association between industrial progress and environmental deterioration have reached controversial conclusions. Ahmad et al. (2023) empirically concluded that the interaction between industrial growth and technological innovation can effectively promote sustainable development, and proposed that China can promote economic growth through innovation without unfavorably affecting the environment. However, Xi and Zhai (2023) used a threshold model of panel data of 30 provinces in China during 2000–2019 to prove that industrial building and growth have a gradual influence on environmental deterioration. Ullah et al. (2022) used the ARDL method to legitimize the Vietnam U-type connection between industrial development and environmental hazards over the period 1975–2019. Yang and Khan (2022) consider the 30 member countries of the International Energy Agency (IEA) and empirically determine that capital accumulation and industrial value added can enhance environmental sustainability. Likewise, Leffel et al. (2022) determined that environmental pollution in the world's 96 largest metropolitan zones expanded with the growth of manufacturing and mining in industrial growth and worsened with the growth of environmental and health services in industrial growth. Muhammad et al. (2022) exposed the deterioration of environmental efficiency caused by major primary, secondary, and tertiary industry sectors in 64 countries along the “Belt and Road”. Likewise, Dehdar et al. (2022) concluded that industrialization is an important driver of environmental degradation in OECD economies. Mesagan et al. (2022) concluded that industrial performance had no significant effect on environmental quality improvement in 36 African countries, either in the short or long run, apparently reflecting the absence of a significant association between industrial upgrading and environmental harm.
The link between agricultural development and the environment
There are conflicting (inconsistent or synergistic) views in the literature regarding the association between agricultural progress and environmental degradation. The conflict between agricultural development and the environment is the result of environmental degradation caused by various forms of agriculture. More precisely, the conditions for agricultural development may deteriorate environmental sustainability. In the divergence, the interaction of agricultural production and environmental sustainability inherently strives to go hand in hand, replicating the same moment of agricultural and environmental sustainability (Zhang et al., 2021; Collins et al., 2022). As revealed by Shi and Chang (2023), carbon emissions may be detrimental to China's agricultural development. Conversely, Shan et al. (2022) unveiled the gradual influence of agricultural resource use on China carbon emissions. Karimi Alavijeh et al. (2023) empirically document that agricultural value added has a significant progressive impact on CO2 emissions for most densely populated countries. Olanipekun et al. (2019) reveal that environmental degradation is likely to increase in 11 Central and West African economies as agricultural development and income levels increase. Yurtkuran (2021) used a bootstrap ARDL approach to conclude that economic globalization, agriculture, and renewable energy production increase environmental hazards in Turkey. Abbasi et al. (2022a) infer that, in a specific panel of 22 most forested countries, undesirable shocks to forest area and agricultural value added have substantial long-run incremental effects on CO2 emissions, while progressive shocks have momentous adverse effects on environmental hazards. Ridzuan et al. (2020) used an ARDL model to examine the environmental impacts of Malaysia's agricultural subsectors (fisheries, livestock, and crops) from 1978 to 2016. The results displayed that in the long run, increasing planting area and fishing volume can improve environmental quality, while animal husbandry may worsen environmental quality, but the effect is not significant. Sharma et al. (2021) unaltered the U-shaped link between agricultural value added and GHG emissions using panel quantile regression for BIMSTEC countries. Qiao et al. (2019) claimed that greenhouse gas (GHG) is the second largest source of emissions globally due to the use of agricultural machinery, inorganic fertilizers, and burning biomass. Besides, the study shows that G20 developing economies CO2 emissions are likely to increase as agriculture grows, using the FMOLS approach.
Association between growth and environment
In the non-appearance of any ambiguity, literature proposals on the association between growth and environmental harm, particularly from the viewpoint of the Environmental Kuznett Curve (EKC), were carefully reviewed. The seminal work of Grossman and Krueger (1995) extensively illuminated the EKC phenomenon of a reversed U-typed association between environmental hazards and growth, both technically and theoretically. Although the literature on the growth-environment relationship is comprehensive, these two dynamics have not yet been empirically studied in the context of Bangladesh and India in South Asia and South Korea, China, Taiwan, and Japan in East Asia.
The latest substantive studies on the growth-environment nexus in Asian economies is briefly presented in the literature review. Ali et al. (2022) reveal the validity of PIMC country EKC assumptions for the period 1980–2019 using the AMG approach. The upward U-shaped EKC assumption for PIMC countries is confirmed in the results. Kazemzadeh et al. (2024) also used the AMG approach and approved the Environmental Kuznets Curve (EKC) assumptions of the N design for a panel of specific Asian emerging economies from 1975 to 2020. Neither Bangladesh nor India had approved EKC assumptions; Singapore and China have overturned U-design EKC hypothesis; South Korea and Japan had N-type EKC premise, which were clearly demonstrated in national-level AMG methods. The legitimacy of the reverse U-formed EKC hypothesis for Singapore, China, and India is endorsed by Luo et al. (2022). Likewise, Zhao et al. (2023) established the validity of the upturned U-designed EKC proposition in Japan, India, South Korea, and North Korea based on the substantial progressive effect of economic growth and the significant adverse influence of the square of growth on climate change. Similarly, Zhang et al. (2023) concluded that individual growth and growth cube have substantial progressive effects on environmental harm, while growth squared has a strong adverse effect on environmental damage, thus validating the hypothesis that emerging economies in Asia have N-type EKC. In addition, Japan and South Korea's N-type EKC and China and Singapore's reverse U-type EKC have all been proven through national-level AMG methods. Wang et al. (2023) also verified the legitimacy of the EKC assumption of the reverse U design using the AMG method for India, China, Japan, and South Korea. Likewise, the upturned U-formed EKC hypothesis of Japan, India, China, and Russia was recently endorsed in another study by Liu et al. (2023).
The association between renewable energy and the environment
Due to environmental concerns about non-renewable energy sources and their harmful effects on the environment, researchers’ considerations have moved strongly toward renewable energy sources. Using clean energy is the key to avoid thermal pollution from traditional energy power generation (Mujtaba et al., 2022; Hossain et al., 2022). Renewable energy can be used as a relative substitute for fossil fuels, thereby significantly reducing fossil fuel emissions (Gustavsson et al., 2017). As a result, resource extraction and mining activities can be concentrated, leading to environmental stress and pollution. As explored by Alharthi et al. (2022), using pooled mean group (PMG) approach, the use of renewable energy sources could effectively expand individual health and condense environmental risk in 20 Middle East and North African (MENA) economies from 2000 to 2019. Likewise, Rahman and Alam (2022) unveiled that renewable energy use is likely to harm CO2 emissions, while non-renewable energy use expands CO2 emissions in Australia. Banga et al. (2022) also used a GMM model for 38 OECD economies over the period 2008–2019, satisfying the scenario of a significant decline in greenhouse gas emissions as the use of green energy expands. Fuinhas, Marques and Koengkan (2017) also empirically demonstrated that fossil fuel energy considerably degrades environmental values, whereas clean energy can meaningfully improve short- and long-term environmental quality. Adebayo (2022a) established the same evidence for Canada. Likewise, Dagar et al. (2022) also verified the incremental impact of green energy on environmental values in 38 OECD economies; Ehigiamusoe and Dogan (2022) approves the evidence for countries with poor financial resources, while, Usman et al. (2022a) approve the evidence for countries with abundant financial resources; Adebayo (2022b) for Spain; Balsalobre-Lorente et al. (2022) for PIIGS countries.
Although the literature on the determinants of environmental sustainability in different regions and countries is extensive, there are still huge gaps that need to be filled. There are mixed views on the relationship between agricultural development and environmental degradation, and between industrial growth and environmental harm. Although the link between growth and environmental damage and between renewable energy use and environmental risks has been widely studied, this link has not yet been established in a panel that includes Bangladesh, Sri Lanka, and India in South Asia, and China, Japan, Mongolia, Taiwan, and South Korea in East Asia.
Methodology
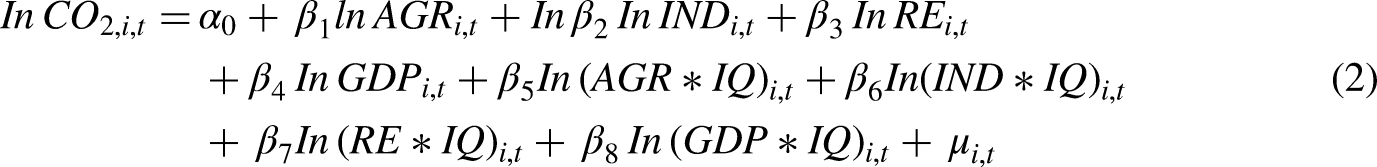
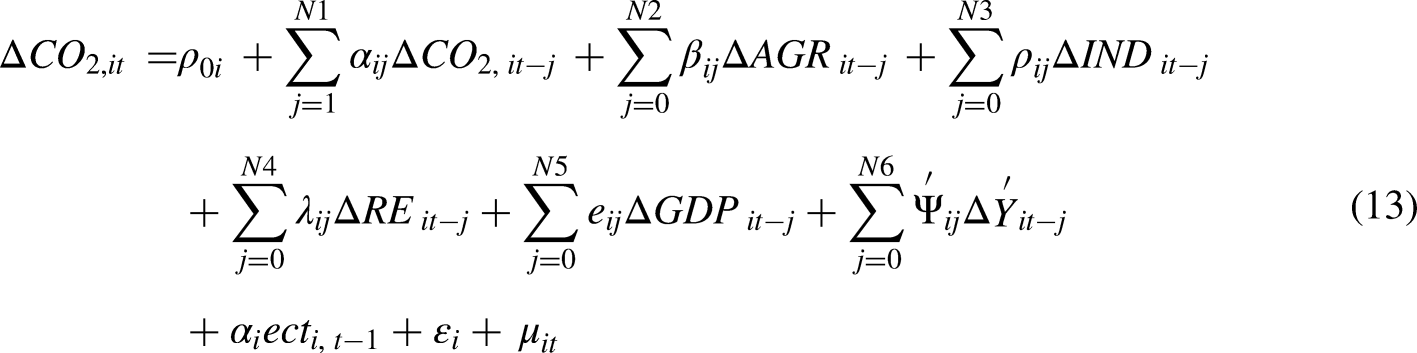
Theoretically, the association between carbon dioxide emissions and income suggests that in the early stages of a country's industrialization, economic progress may increase carbon dioxide emissions due to high consumption of carbon-intensive energy (Avenyo and Tregenna, 2022). However, as economic growth reaches a certain level in the second stage of industrialization, ecological hazards begin to decline (Dong et al., 2019). This phenomenon was first proposed and introduced by Grossman and Krueger (1995) and is known as the inverted U-shaped EKC hypothesis. In the association between environmental harm and growth, the expected sign coefficient of growth in the early stages of industrialization is positive. Higher productivity and economic growth are based on greater utilization of fossil fuels and energy, so there is a progressive correlation between energy use and environmental risk (Khan et al., 2020; Usman et al., 2022a). However, after economic growth reaches a certain level, environmental risks decline and the economic growth coefficient becomes negative, reflecting the negative correlation between environmental deterioration and economic growth (Balsalobre-Lorente et al., 2018; Sarkodie et al., 2019). This study predicts that economic growth or productivity in this stage is based on the use of renewable energy or the utilization of environmentally friendly technologies. Thus, there is a negative correlation between the utilization of renewable energy and environmental degradation. The energy growth-environmental degradation literature is integrated into the current study. However, the inclusion of industrial progress and agricultural value addition in our empirical model makes it different from existing studies in the literature. The current study extends the EKC framework to include agricultural value addition and industrial progress to explore the influence of agricultural value addition, industrial development, growth, and renewable energy use on environmental hazards. Hence, in order to detect this association, the following econometric model can be developed.

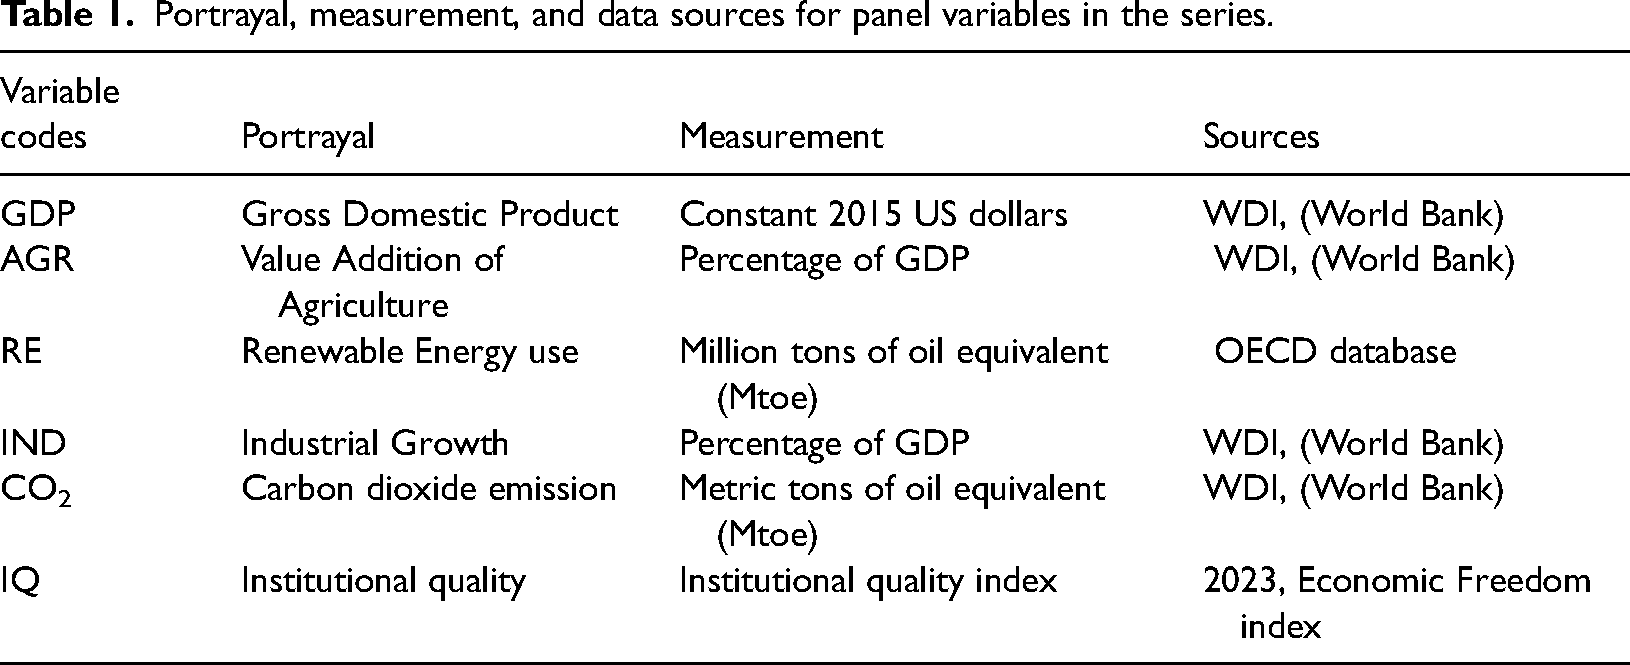
Panel variable data used for analysis purposes are collected annually from 1980 to 2020 for India, Sri Lanka, and Bangladesh in South Asia and South Korea, Taiwan, Japan, Mongolia, and China in East Asia. Data sources, descriptions, and measurements for the entire set of panel variables in the series are displayed in Table 1. The panel variables, industrial progress, and agricultural value added can be measured as a percentage of GDP, gross domestic product (GDP) in constant 2015 dollars and CO2 emissions in metric tons of oil equivalent (Mtoe). Data for these variables can be obtained from World Development Indicators (WDI). Data on renewable energy use in million tons of oil equivalent (Mtoe) can be collected from the OECD database, while data on institutional quality measured in the Institutional Quality Index can be retrieved from the 2023 Index of Economic Freedom.
Portrayal, measurement, and data sources for panel variables in the series.
Panel variable cross-sectional correlation test
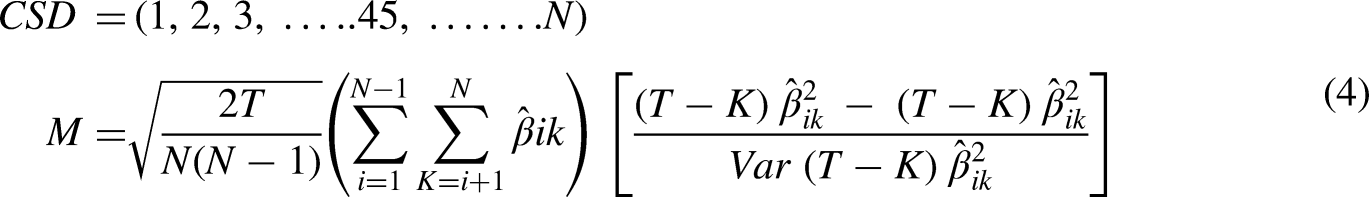
Countries in the panel are likely to have considerable cross-sectional correlations with addiction expansion, so using more rigorous tests is critical to examining cross-sectional dependence across countries. Hence, in order to solve the problem of cross-sectional dependence of panel data, this study can use more reliable, fair, and legitimate estimation techniques. To detect cross-sectional correlation in the panel data in the current study, Pesaran et al. (2008) cross-sectional correlation test, Pesaran (2004) scaled LM test, Baltagi et al. (2012) bias-corrected scaled LM test, and Breusch and Pagan (1980) LM test are used, and their expressions are displayed in the following equations (3) and (4).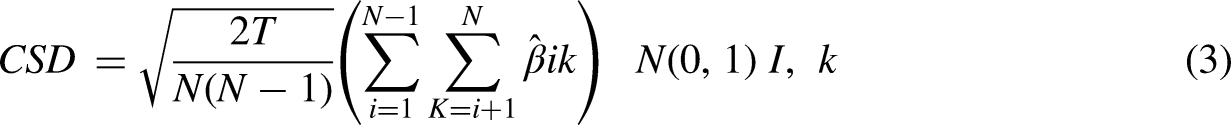
Panel unit root test
The conventional first-generation panel unit root tests ignore the rationalization of cross-sectional dependence issues in panel data sets, leading to erroneous estimation results. Thus, in order to solve this problem, this study can use the second generation cross-sectional augmented Dickey-Fuller (CADF) panel unit root test and the Im, Pesaran, and Shin (CIPS) test introduced by Pesaran (2007). Due to the asymptotic assumption, these tests do not require (N∼∞), so these tests are more dominant and influential. Panel unit root tests for both CADF and CIPS yield firm evidence for the order of integration of the variables in the series. The CADF panel unit root test can be expressed by the following equation (5).

The expression of the second-generation CIPS unit root test is displayed in equation (7).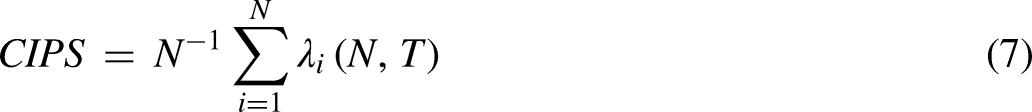

Panel ARDL method
This study is divided into three parts of strategy construction to explore the impact of baseline regression variables (industrial progress, agriculture value addition, renewable energy use, growth) on CO2 emissions is the first part called the standard arrangement. This relationship can be detected through panel estimators of large-scale panel autoregressive distributed lag (ARDL) models, which are dynamically heterogeneous. The panel ARDL method is well known for its potential to account for non-stationary and heterogeneous panel variables Eberhardt and Teal (2020). Estimation of short-term and long-term parameters is another key capability of panel ARDL methods. More prominently, another applicability of the method in panel studies is over time periods rather than number of sections (Wang, 2021; Boufateh and Saadaoui, 2020). The expression of the ARDL model containing the baseline regressors of the current study is shown in equation (9) below.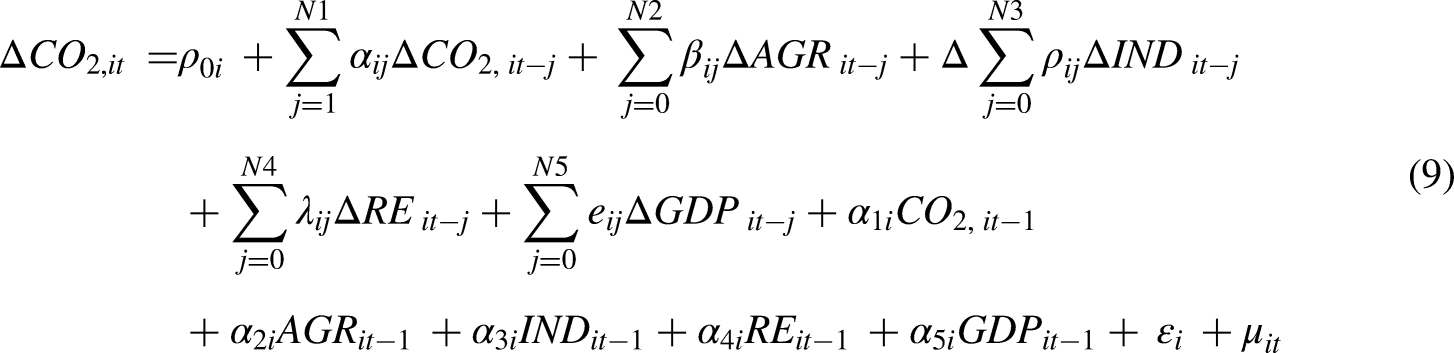
Then, the error correction mechanism (ECM) in the main model of equation (1) can be expressed by the following equation (10).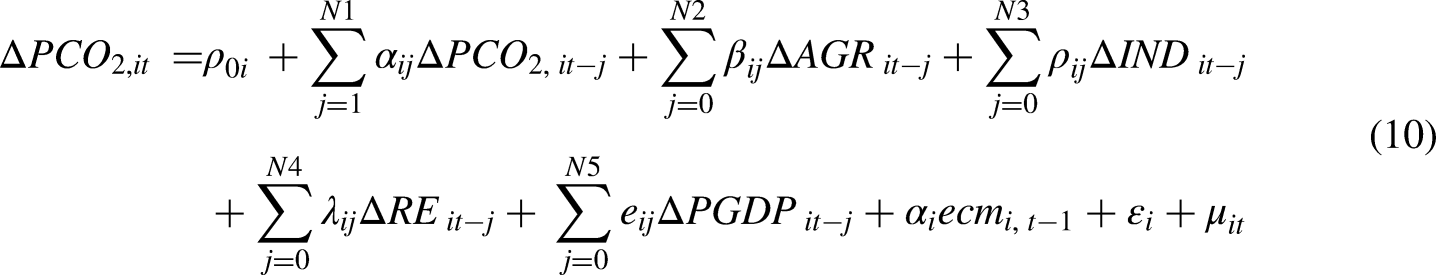

The proposition of long-term interaction term coefficient estimation can be
Another ECM (ecm) of the second model can be yielded as:

Results and interpretations
This study first adopts cross-sectional dependence test, emphasizing the discovery of cross-sectional dependence in panel data; descriptive statistics and correlation results are subsequently reported. Then the second-generation cross-sectional correlation CIPS, CADF unit root test, slope heterogeneity test, second-generation Westerlund cointegration test, Panel ARDL model and finally the second-generation AMG estimator are used for robustness testing.
Table 2 clearly reports the panel data cross-sectional dependence results of the Pesaran Scaled LM, Pesaran CSD, bias-corrected scaled LM and Breusch-Pagan LM tests, reflecting the presence of cross-sectional dependence in the panel dataset for the top five most populous countries. Thus, in order to obtain more reliable, dynamic, efficient, and stable results based on the availability of cross-sectional dependence in panel data sets, second generation procedures would be the best choice.
Detection of cross-sectional dependency in panel data variables.
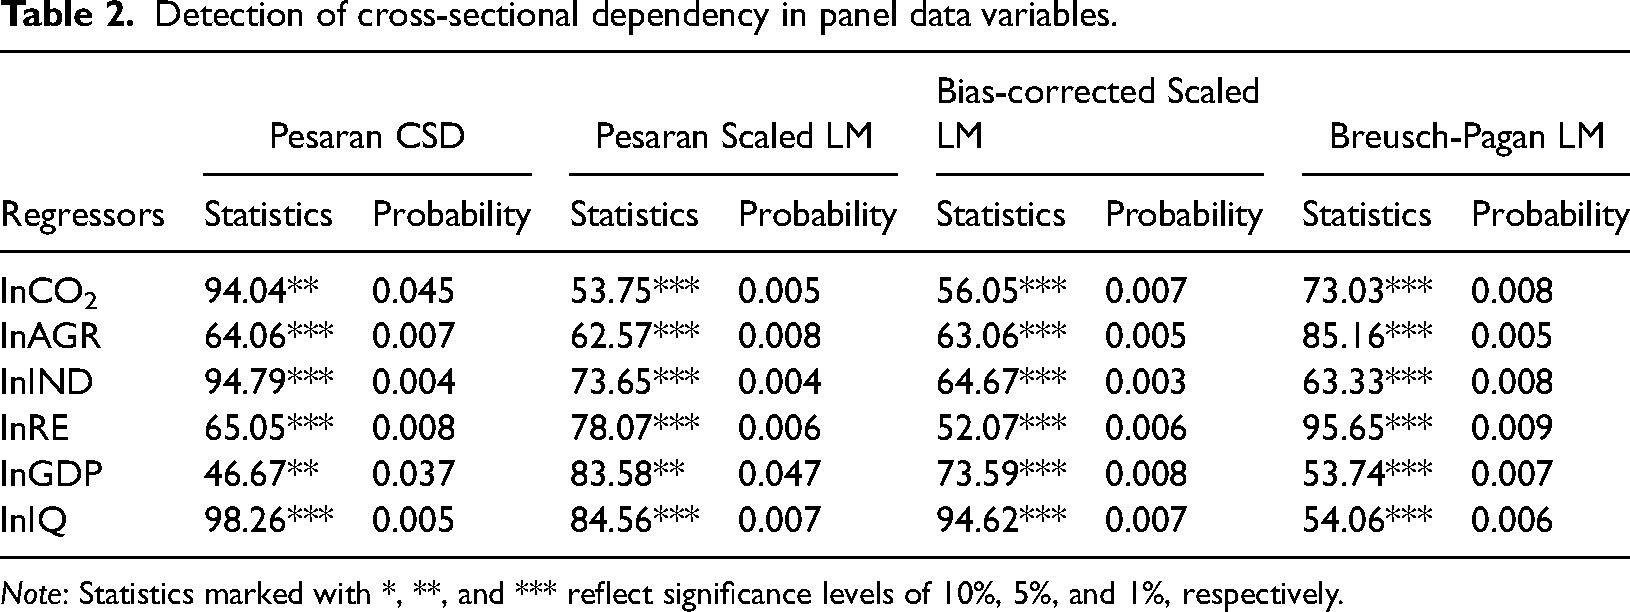
Note: Statistics marked with *, **, and *** reflect significance levels of 10%, 5%, and 1%, respectively.
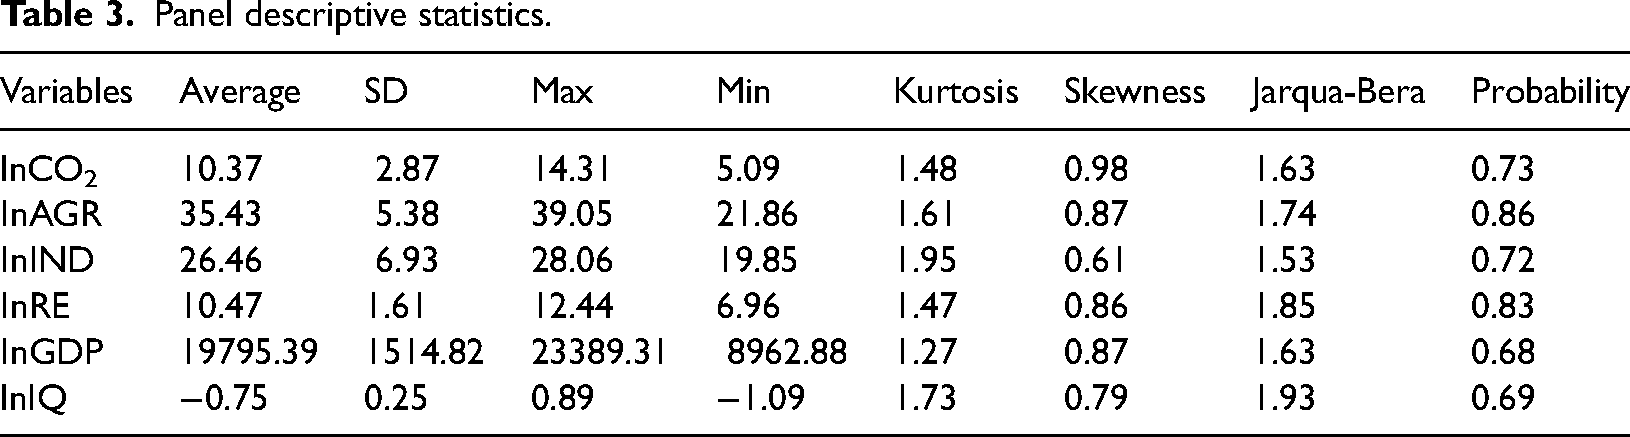
Table 3 lists descriptive statistics for a series of panel variables, reflecting that carbon dioxide emissions of the South and East Asian countries were 10.37 tons, a variation of 2.87 tons. The average GDP of US$19795.39 and the average renewable energy consumption of these countries at 10.47 metric tons of oil equivalent (Mtoe) remains low compared to the rest of the world. Even for specific countries that have experienced considerable growth in recent years, especially since 2000, the average agricultural value added and average industrial growth in South Asia and East Asia contribute 35.43% and 26.46% to GDP respectively. Another indicator used in the series, the Institutional Quality Index, has a negative mean value, reflecting that the Asian countries are weaker in ensuring good institutional quality to enhance economic and environmental sustainability.
Panel descriptive statistics.
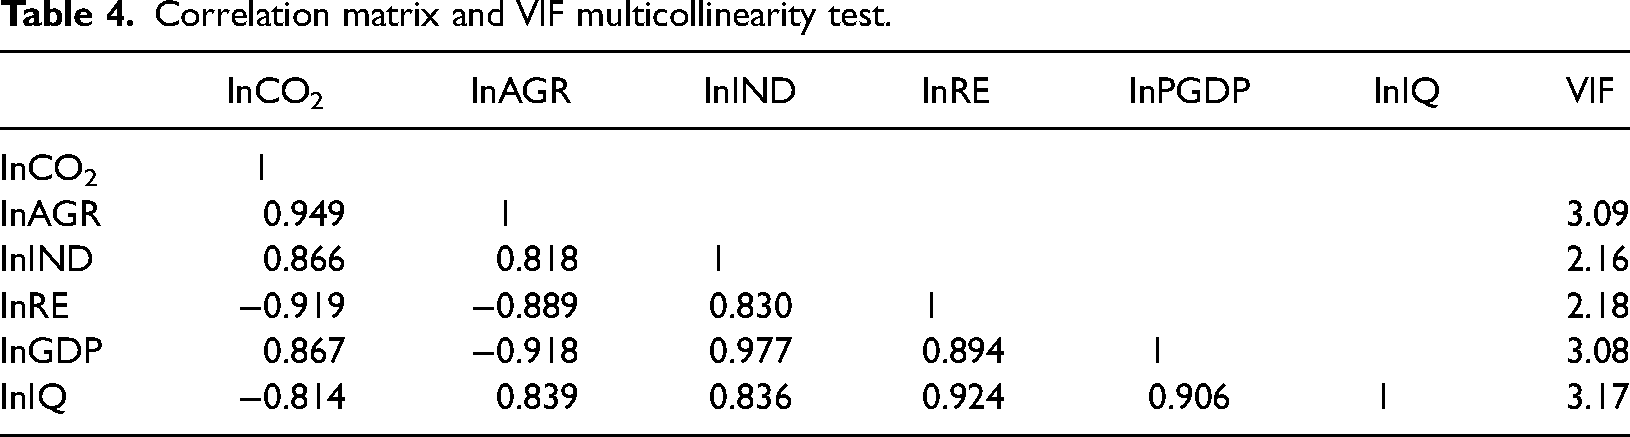
The specific panel variable correlation results are shown in Table 4, which reflects that carbon dioxide emissions are negatively related to institutional quality and renewable energy, but gradually related to industrial growth, GDP and agricultural added value. More specifically, CO2 emissions tend to weaken as renewable energy and institutional quality increase, and CO2 emissions change in similar ways to agricultural value added, industrial growth, and economic growth. VIF results based on statistics below 5 for each variable obviously indicate that there are no multicollinearity issues with the model panel variables
Correlation matrix and VIF multicollinearity test.
Moreover, the homogeneity test of Pesaran and Yamagata (2008) can be used to detect the slope heterogeneity problem in the model. The results are shown in Table 5. The null hypothesis of homogeneous association between the explained and explanatory variables for both proposed models was rejected. According to the statistical significance test statistics of the two models, there is heterogeneity in the correlations between the panel variables of the two models. Thus, the second generation CADF and CIPS unit root tests will be the best choices, and the findings are shown in Table 6. The stationarity outcomes of the CADF and CIPS unit root tests show that industrial growth, GDP and renewable energy utilization are integrated at the I(0) level, and agricultural added value, carbon dioxide emissions and institutional quality are stationary at the 1(1), showing mixed stationary, letting the use of Westerlund (2007) cointegration test.
Detecting slope heterogeneity using Pesaran and Yamagata tests.
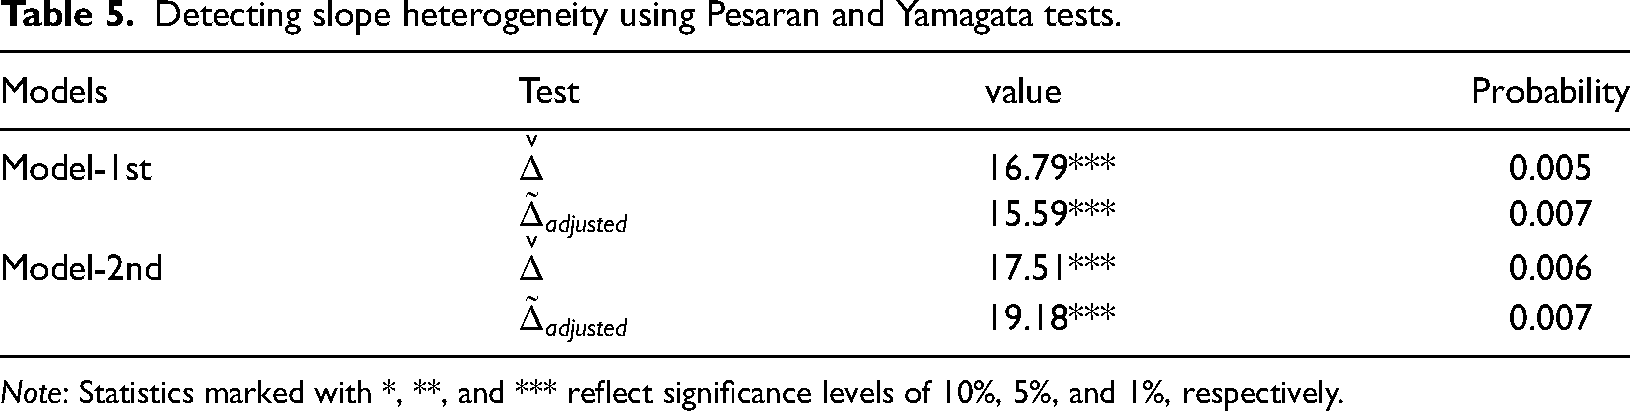
Note: Statistics marked with *, **, and *** reflect significance levels of 10%, 5%, and 1%, respectively.
Testing unit roots in panel variables with CIPS and CADF unit root tests.
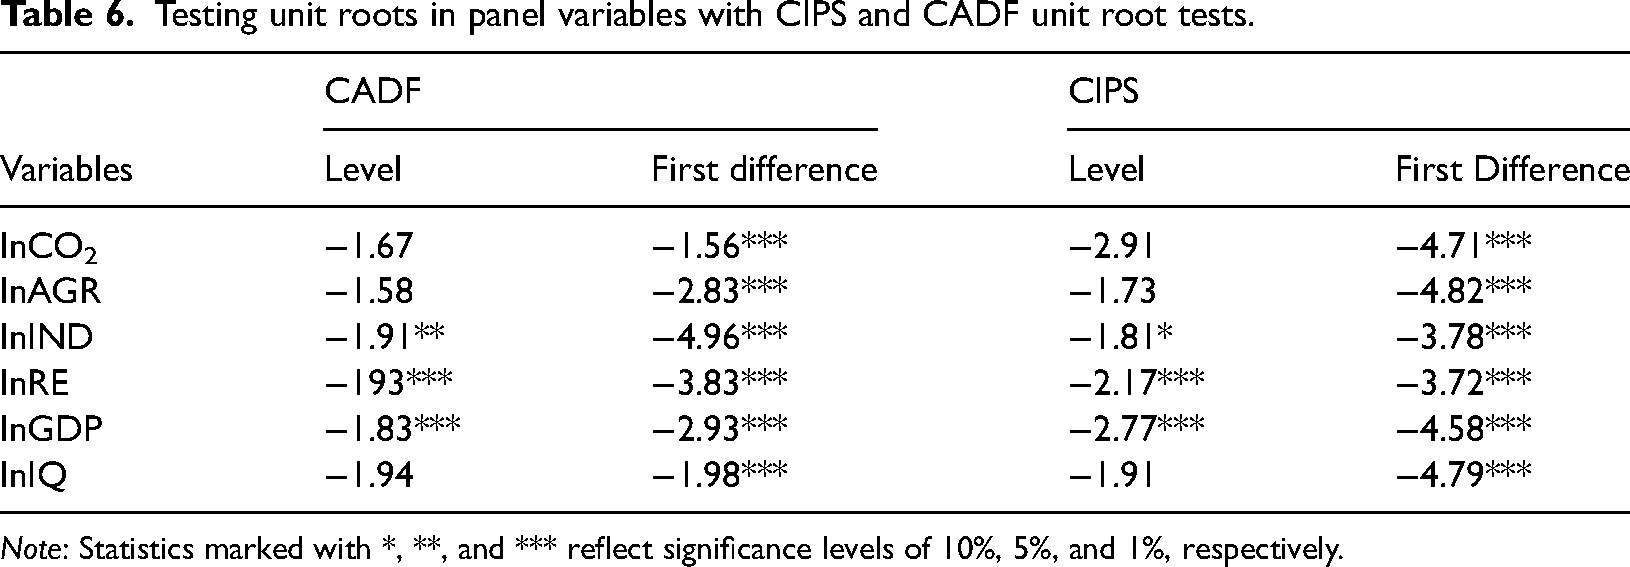
Note: Statistics marked with *, **, and *** reflect significance levels of 10%, 5%, and 1%, respectively.
After confirming the mixed results of CADF and CIPS unit root tests for specific panel variables, the second generation Westerlund (2007) cointegration test can be used for long-run cointegration among panel variables. This test is more efficient because it takes slope heterogeneity and cross-section dependence into account, and the results are shown in Table 7. The results show that there is a long-term cointegration relationship between the panel variables based on the 1% high significance level of the group statistics (Gt and Ga) and the panel statistics (Pt and Pa) of the Westerlund panel cointegration test.
Second generation Westerlund (2007) long-run cointegration test.
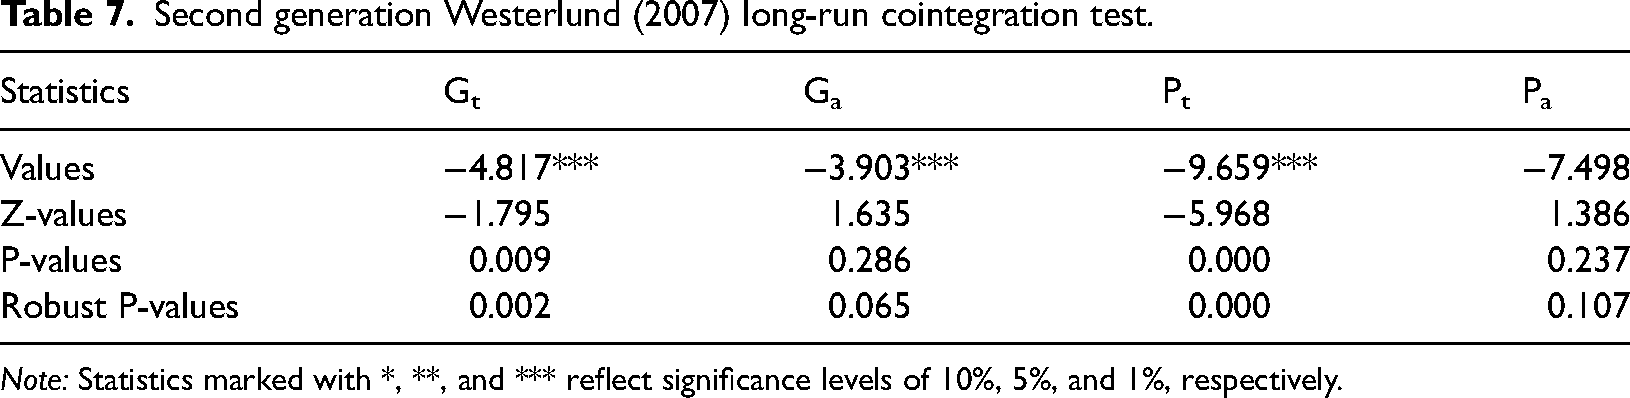
Note: Statistics marked with *, **, and *** reflect significance levels of 10%, 5%, and 1%, respectively.
At least three key accusations can be drawn from the above core empirical investigation. First, the substantial association between environmental hazards and baseline regressors (renewable energy use, growth, industrial progress, agricultural value addition) reflects the strong influence of explanatory factors on environmental risks. Secondly, based on the cross-sectional dependence and slope heterogeneity of panel variables, the second-generation CIPS and CADF unit root tests and the second-generation Westerlund cointegration can be used. Third, the selected panel ARDL technique is efficient and can produce more robust inferences, and the robustness of the results can be tested using a second-generation AMG estimator that accounts for cross-sectional dependence and heterogeneity in panel data.
DEF, MG, and PMG are dynamic heterogeneous panel estimators that can be effectively used in the current study because the entire variables in the series are heterogeneous and mixture stationary at I(0) and I(1). After the results for all estimators are obtained, the Hausman test can be used to determine the most powerful estimator. Comparison of PMG, MG, and DEF estimators through the Hausman test results in Table 8 shows that the MG estimator performs better than the PMG estimator, while the DEF approach outperforms all estimators, so, the DEF result can be considered for analysis purposes. DEF estimation results show that carbon dioxide emissions respond positively to agricultural value addition and industrial progress in the long term, but not in the short term. A significant expansion of 0.563% in carbon dioxide emission is the result to be yielded after an increase of 1% in agricultural value addition. This investigation is very consistent with Shan et al. (2022); Olanipekun et al. (2019); Yurtkuran (2021); Abbasi et al. (2022a), while opposing Shi and Chang (2023); Ridzuan et al. (2020); Qiao, Zheng, Jiang, Dong (2019). Similarly, long-term industrial growth of 1% results in a 0.758% increase in CO2 emissions. This outcome is steady with Xi and Zhai (2023); Leffel et al. (2022); Muhammad et al. (2022); Mesagan et al. (2022), but different from Ahmad et al. (2023); Ullah, Nadeem, Ali and Abbas (2022); Yang and Khan (2022). GDP growth is likely to significantly stimulate CO2 emissions in the long term, but decline in the short term. However, CO2 emissions decrease significantly with GDP2 growth in the long term, but increase in the short term. The association between CO2 emissions and GDP clearly shows a U-shaped EKC hypothesis in the short run, but an inverted U-shaped EKC hypothesis in the long run. The finding of reversed U-designed EKC assumption is very consistent with Luo et al. (2022); Zhong et al. (2024); Wang et al. (2023); Liu et al. (2023). In general, using renewable energy can significantly reduce short- and long-term environmental harm. A 1% expansion in the use of renewable energy can considerably decline carbon dioxide emissions by 0.779%. This consequence is in line with Wang et al. (2023); Usman et al. (2022b); Sun et al. (2023); Alharthi et al. (2022); Luo et al. (2022); Adebayo (2022); Balsalobre-Lorente et al. (2022); Zhu et al. (2024); Zhong, Ali and Zhang (2024); Dagar et al. (2022); Zhao et al. (2023); Ehigiamusoe and Dogan (2022). More prominently, the result of this study's analysis using the panel ARDL method is closely in line with the ECM, which adjusts for short-term shocks in the long run. According to the value of the ECM (−0.314), it reflects that in the long term, short-term shocks can be balanced out at a rate of 31.4% per year.
Estimation results of short-term and long-term panel variables.
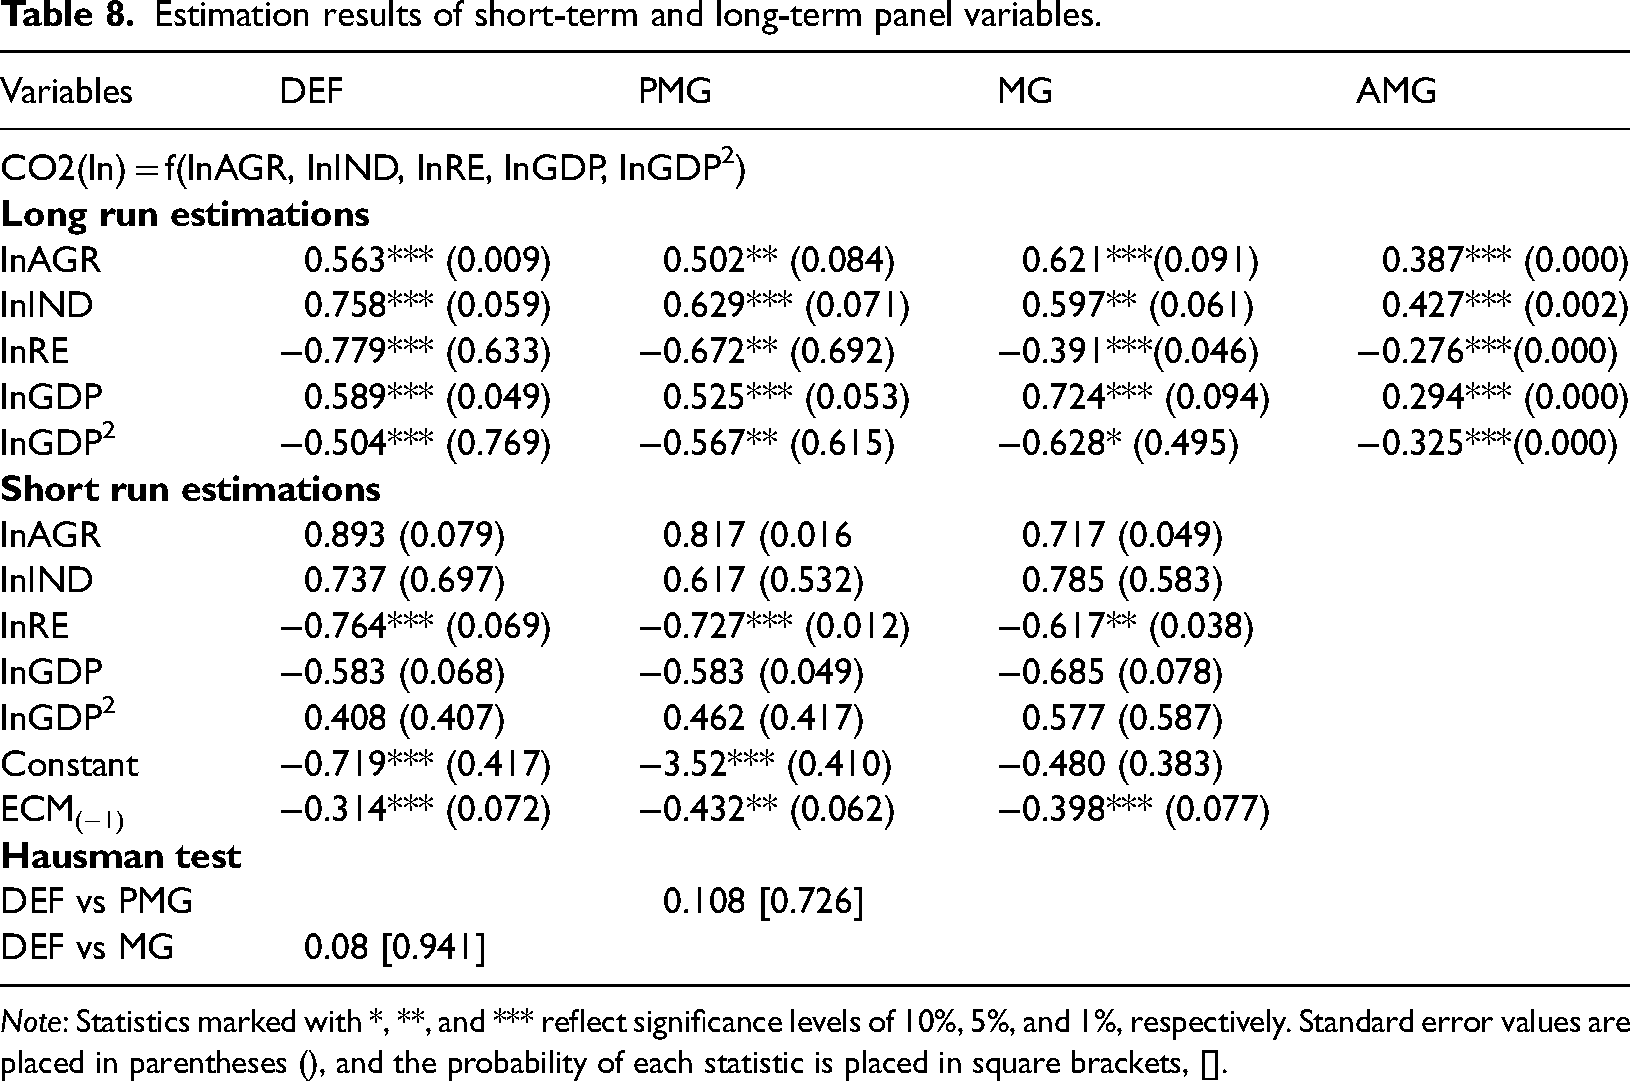
Note: Statistics marked with *, **, and *** reflect significance levels of 10%, 5%, and 1%, respectively. Standard error values are placed in parentheses (), and the probability of each statistic is placed in square brackets, [].
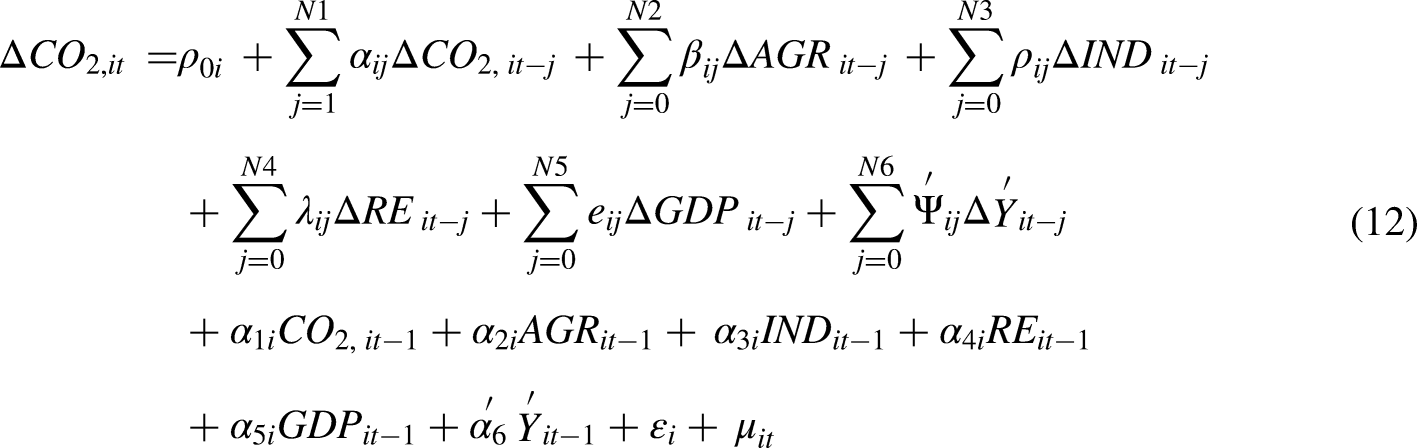
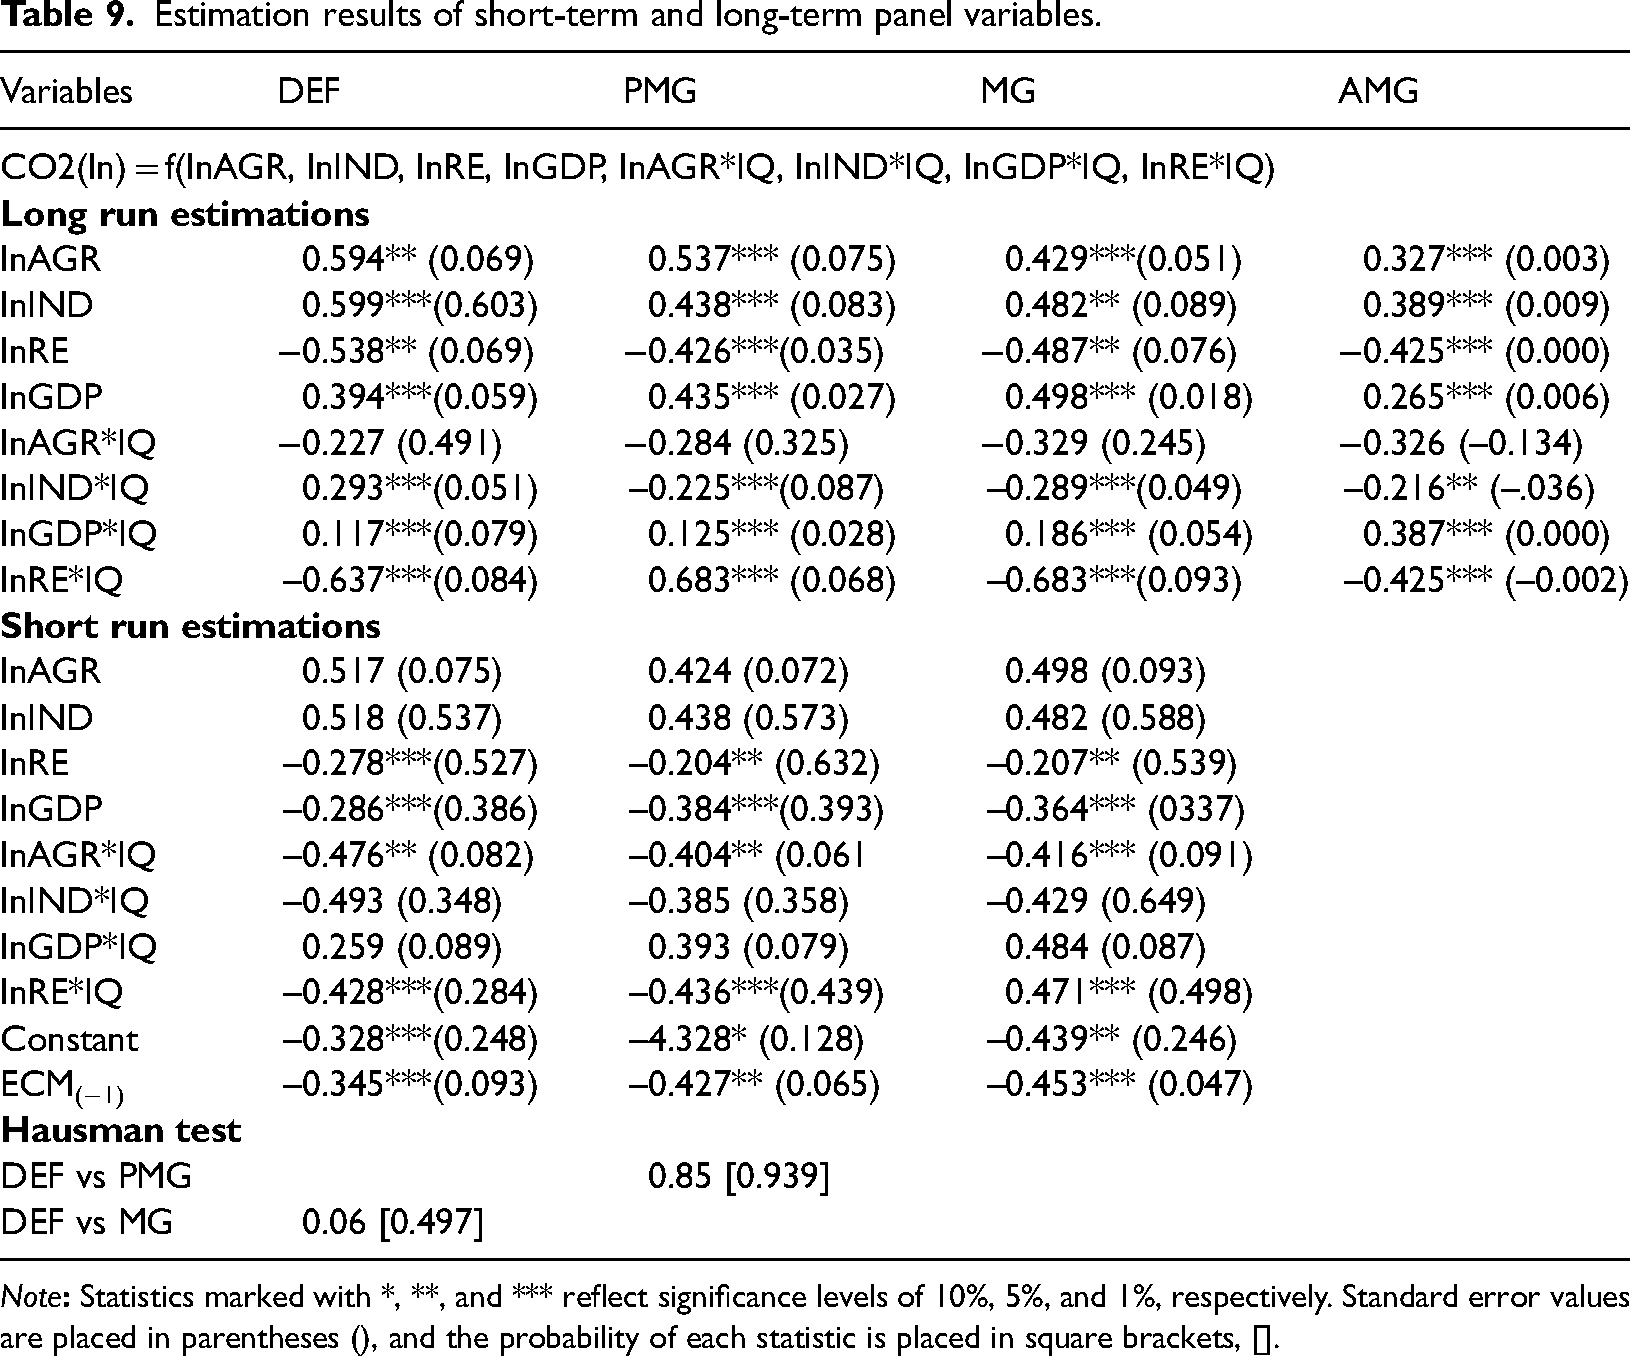
A country's economic and environmental problems, such as unsustainable development, climate change, environmental pollution, etc., can be significantly solved through institutional structures (Ferdous and Islam, 2021; Chowdhury, 2020). If there is no direct link between institutional quality and environmental sustainability, key economic indicators can play an important role in influencing environmental sustainability. Thus, the impact of the interaction between the institutional worth and the baseline regressors (renewable energy utilization, agricultural value addition, growth, industrial progress,) on ecological harm is the moderating effect of institutional quality and is the best policy to condense environmental risk. The results of the interaction terms affecting environmental risks are shown in Table 9. Here DEF is again the most powerful estimator based on the Hausman test results. When institutional quality interacts with economic growth and industrial growth, it has a strong long-term impact on environmental pollution; however, when institutional quality interacts with agricultural added value and renewable energy use, institutional quality has only a short-term impact on environmental harm. The interaction between institutional quality and industrial growth can augment environmental pollution, but the influence of industrial progress on environmental harm has been reduced to 0.293% under the interaction, while the influence of industrial development on ecological harm without interaction is 0.599%. Likewise, the interaction between institutional quality and economic growth has a significantly positive impact on CO2 emissions, but the impact of economic growth on CO2 emissions with interaction drops from 0.394% (no interaction) to 0.117%. Furthermore, the interaction between institutional quality and renewable energy use has a considerably adverse influence on CO2 emissions in both the short and long term. Although the interaction between institutional worth and agricultural value addition can significantly reduce environmental harm, it is only in the short term. From the above findings, it is obvious that renewable energy with institutional quality interaction has a higher beneficial effect on the environment than renewable energy without interaction.
Estimation results of short-term and long-term panel variables.
Note
In addition, this study can also detect the nonlinear association of the institutional quality index threshold effect between CO2 emissions and baseline regressors (renewable energy, agriculture, growth, industrial progress). The analysis should identify specific threshold levels at which institutional quality interacts with baseline regressors to affect the environment. Threshold regression shows that the specific institutional quality threshold level is −1.55, as shown in Table 10. Specific threshold levels of institutional quality do not have significant potential to promote renewable energy and economic growth, thereby significantly reducing CO2 emissions. However, specific threshold levels of institutional worth have strong potential to induce industrial progress and agricultural value addition, thereby reducing environmental pollution. The lower bound levels of institutional value (≤−1.55) for both the industrial and agricultural development are not significant, which clearly reflects poor institutional quality. Improving institutional quality from lower to higher threshold levels (>−1.55) can compress environmental pollution through industrial progress and agriculture development (–0.059, −0.078).
Estimation of threshold level regression.
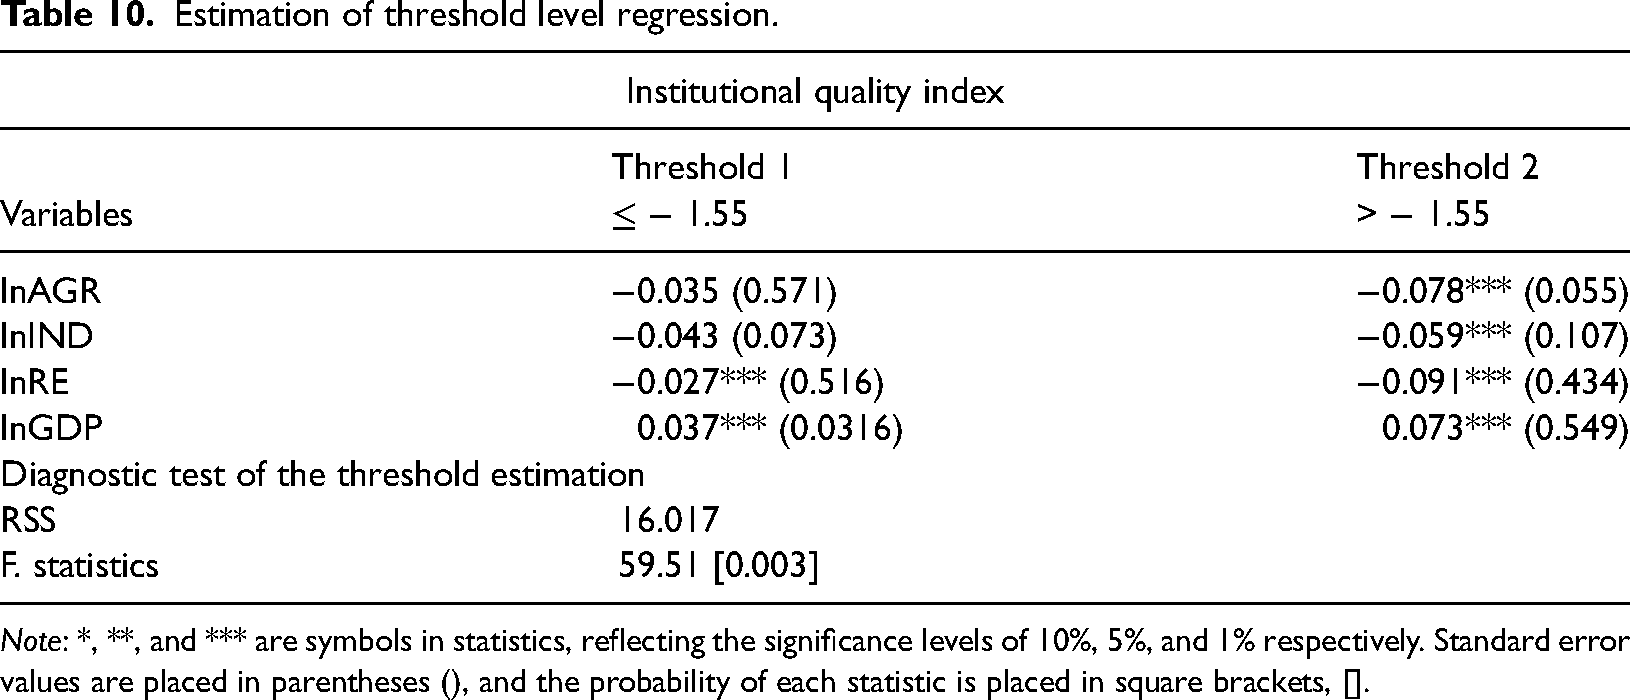
Note: *, **, and *** are symbols in statistics, reflecting the significance levels of 10%, 5%, and 1% respectively. Standard error values are placed in parentheses (), and the probability of each statistic is placed in square brackets, [].
In summary, the interaction of institutional quality with baseline regressors (renewable energy utilization, agricultural, economic progress, industrial development) has a strong impact on CO2 emissions in South and East Asian economies. Environmental quality can be improved by nurturing the quality of systems, ensuring more intensive and environmentally friendly agricultural and industrial structures through the use and production of renewable energy. In short, the strong moderating role of institutional quality in the link between baseline regressors (renewable energy, agriculture, growth, industrial progress) and environmental hazards can clearly confirm that the variables proposed in this series are heterogeneous and nonlinear.
Conclusion
The main objective of the current study is to reveal the influence of baseline regressors (renewable energy, agriculture, growth, and industrial progress) on environmental hazards in selected South and East Asian economies. This study predicts that due to the nature of agriculture, overreliance on industrial progress, and high levels of economic development over the past decade, prominent indicators (renewable energy utilization, agriculture value addition, growth, and industrial progress) may have a direct or indirect impact on the environment in specific Asian countries. More obviously, the impact of institutional quality on the environment can be observed through interactions with baseline regressors and estimates of their threshold levels. Thus, the panel estimators are linked to the panel ARDL framework, which accounts for cross-sectional and slope heterogeneity and threshold level regressions used in the current study. The main model estimates that do not consider institutional quality clearly show that CO2 emissions respond positively to the development of industrial and agricultural value added in the long run, but not in the short run. GDP growth is likely to significantly stimulate CO2 emissions in the long term, but decline in the short term. However, CO2 emissions decrease significantly with higher GDP2 in the long term, but increase in the short term. The association between CO2 emissions and GDP evidently shows a U-shaped EKC hypothesis in the short run, but legitimate an inverted U-shaped EKC hypothesis in the long term. Renewable energy use can significantly reduce short- and long-term environmental harm. Furthermore, the study finds a more sophisticated investigation of the moderating role of institutional quality in the association between baseline regressors and long-term CO2 emissions. Institutional quality promotes industrial progress and economic development capabilities, thereby reducing environmental harm, but the interaction between institutional quality and renewable energy may lead to poor compression of CO2 emissions in the long term. Nonetheless, the use of renewable energy and value addition in agriculture still has the ability to eliminate short-term environmental hazards and thereby achieve environmental sustainability. Finally, institutional quality threshold levels determine the sensitivity of well-considered indicators to impact environmental pollution.
The above empirical investigations can provide a strong strategic context for achieving environmental sustainability objectives. First, greater use of renewable energy in the energy mix can improve environmental quality in specific South and East Asian economies. By installing more renewable energy, the available fossil fuels in these specific Asian countries can be depleted, making the environment sustainable. The obvious fact that fossil fuel resources are key productive inputs that can be used to achieve higher growth, thereby putting greater pressure on the environment, clearly shows that environmental sustainability can be sacrificed in order to achieve higher sustainable growth. However, the sustainability of production technology and economic growth can be achieved by allocating funds for the use of renewable energy, which is a favorable alternative to fossil fuels. Second, this study's in-depth empirical research shows that bot the agriculture and industrial sectors are major drivers of long-term environmental harm due to environmentally unfriendly industrial structures and unsustainable agricultural practices adopted by North and East Asian countries. Thus, there is an urgent need to introduce and implement modern environmentally friendly strategies to increase agricultural and industrial production and ultimately improve environmental quality. The significance of the agricultural sector in specific countries of South and East Asia should not be underestimated in the context of environmental impact. Agriculture is a vital source of food, yet it simultaneously contributes to environmental stress through the utilization of pesticides and chemical fertilizers and deforestation for the expansion of agricultural land. Hence, there is an imperative need for a shift toward more sustainable farming practices, entailing a reduction in the use of hazardous chemicals and ecologically harmful practices.
Renewable energy assumes a crucial role as part of the solution to mitigate the environmental impact in these regions. Investments in renewable energy can significantly reduce greenhouse gas emissions and decrease dependence on environmentally harmful fossil fuels. Nevertheless, the transition to renewable energy necessitates the right investments, regulations, and social considerations such as workers’ rights within the energy sector. The role of institutional quality in crafting policies that support renewable energy becomes increasingly vital in this pursuit.
Evidence shows that good performance in agriculture and industry can be enhanced by institutional quality, and that the current institutions quality of specific countries can even interact with the use of renewable energy can improve the effectiveness of coalescing environmental harm. Institutional quality development is the best strategy to stimulate investments in renewable energy and strengthen agricultural systems, thereby significantly sustaining sustainable growth and reducing environmental damage. In addition to agriculture and industry as key indicators, urbanization, globalization, and transportation infrastructure are also major drivers of increasing environmental pollution. Hence, these indicators should be examined from the perspective of institutional quality as a future research direction.
Footnotes
Author contribution
G.L. (Luo), G.L (Luo), contributed to the conceptualization of the study, analysis, design, and conclusions; reviewed the manuscript; and approved the final submission.
Availability of data and material
The panel data used in the analysis of the current study can be obtained from the World Development Indicators (WDI) at https://databank.worldbank.org/source/world548 development-indicators. Renewable energy use data can be retrieved from https://data.oecd.org/energy/renewable-energy.htm, and Institutional Quality Index data can be obtained from ![]() .
.
Consent to participate
Not applicable.
Consent for publication
The authors have provided consent to publish this work.
Declaration of conflicting interests
The authors declared no potential conflicts of interest with respect to the research, authorship, and/or publication of this article.
Ethical approval
The study obtained ethical approval from School of economics, Hunan Agricultural University, Changsha, China.
Funding
The authors received no financial support for the research, authorship, and/or publication of this article.