
Abstract
In this article, the behaviors of both flow and generated output of photovoltaic pump, the characteristics of both water pumping efficiency and output frequency, and the feature of charge capacity in accumulators have been tested through experiments, based on the integrated application system for water pumping, energy storage and illumination by photovoltaic pump, and in combination with composition and operation performance of photovoltaic water pumping system. According to the experimental results and under a constant delivery head, the photovoltaic pump and accumulator energy storage system with a total measured power of 1.8375 kWp in a photovoltaic array produces a daily water output of 13.1 m3 and an average water output of 1.93 m3/h; the maximum water pumping efficiency of the system is 12.7% and the average water pumping efficiency is 11.1%; meanwhile, the energy storage capacity of accumulators by charging in three time periods throughout a day is 1.01 kWh, which accounts for about 9.72% of the photovoltaic array's all-day generated energy, namely 10.3 kWh. Those conclusions have certain practical implications for the optimal configuration of photovoltaic water pumping system.
Keywords
Introduction
Photovoltaic pump system refers to a kind of system that draws water from deep wells, rivers, or lakes through a motor driven by electricity directly converted from solar energy via a semiconductor P–N junction (Raja et al., 2023; Tan et al., 2013). Due to a series of technical and economic advantages over traditionally powered pump system, the photovoltaic pump system displays obvious socio-economic, ecological, and environmental significance in solving problems of the drinking water shortage for human beings and livestock and the irrigation water scarcity for farming land in remote areas with insufficient water reserve or no electricity (Abdeen, 2001; Gao et al., 2015; Ikram et al., 2022). This technology has been rapidly developed and entered a stage of industrialization and large-scale promotion and application (Hicham et al., 2022; Zha et al., 2007). At present, the research on photovoltaic pump system concentrates on systematic configuration, performance prediction and systematic evaluation and optimization, etc. (Liu et al., 2016; Rizwan et al., 2000; Sasa et al., 2020). Most of those researches attaches importance to analysis under a single system supply. As for systematic configuration, some work as a direct-current (DC) water pump system with a small capacity of photovoltaic array (10 – 500 W) while others work as a three-phase alternating-current (AC) water pump system for farm irrigation with a large capacity of photovoltaic array (≥ 100 kW). However, the photovoltaic array adopts a form of fixed installation, covers a large area of land, takes a high cost, and demonstrates a low annual utilization rate as a whole, thus rendering its economic benefit poor and ineffective. Furthermore, most of the existing power generation and supply systems for farmland pumping, irrigation, field illumination, crop monitoring, etc., are erected independently and repetitively and operated dispersely, with overlapped working intervals and single functions. Therefore, its economy, reliability, and practicability cannot meet the comprehensive energy demands for field management.
Therefore, this research has proposed an application technology that integrates mobile photovoltaic power generation, and energy storage via water pumping, illumination, and monitoring together, and conducted an experiment in areas in Henan. The system serves as mobile energy-storing backup power in water pumping via the photovoltaic pump, illumination, crop growth information acquisition, communication, etc., and is applicable to demands for field irrigation, garden planting, illumination, and information monitoring.
System principles and composition
This integrated application system for water pumping, energy storage, monitoring, and illumination powered by photovoltaic cells comprises a photovoltaic array, combiner box, maximum power point tracker (MPPT) controller, DC–AC inverter, motor-driven pump, charge/discharge controller and accumulator pack. Among them, the photovoltaic array absorbs solar radiation energy, converts it into electricity, and thus supplies power for the whole system; the photovoltaic pump inverter converts the DC output from the photovoltaic array into AC, drives the motor-driven pump, and adjusts the output voltage and frequency in real-time according to changes in sunlight intensity so as to trace the maximum power point. When the sunlight is intense, the system can automatically drive the motor and the water pump to pump water by power output from a photovoltaic array. When the sun is weak, the system will automatically shift to charge the accumulator pack for illumination and communication system purposes. Its system principles and composition have been displayed in Figure 1.
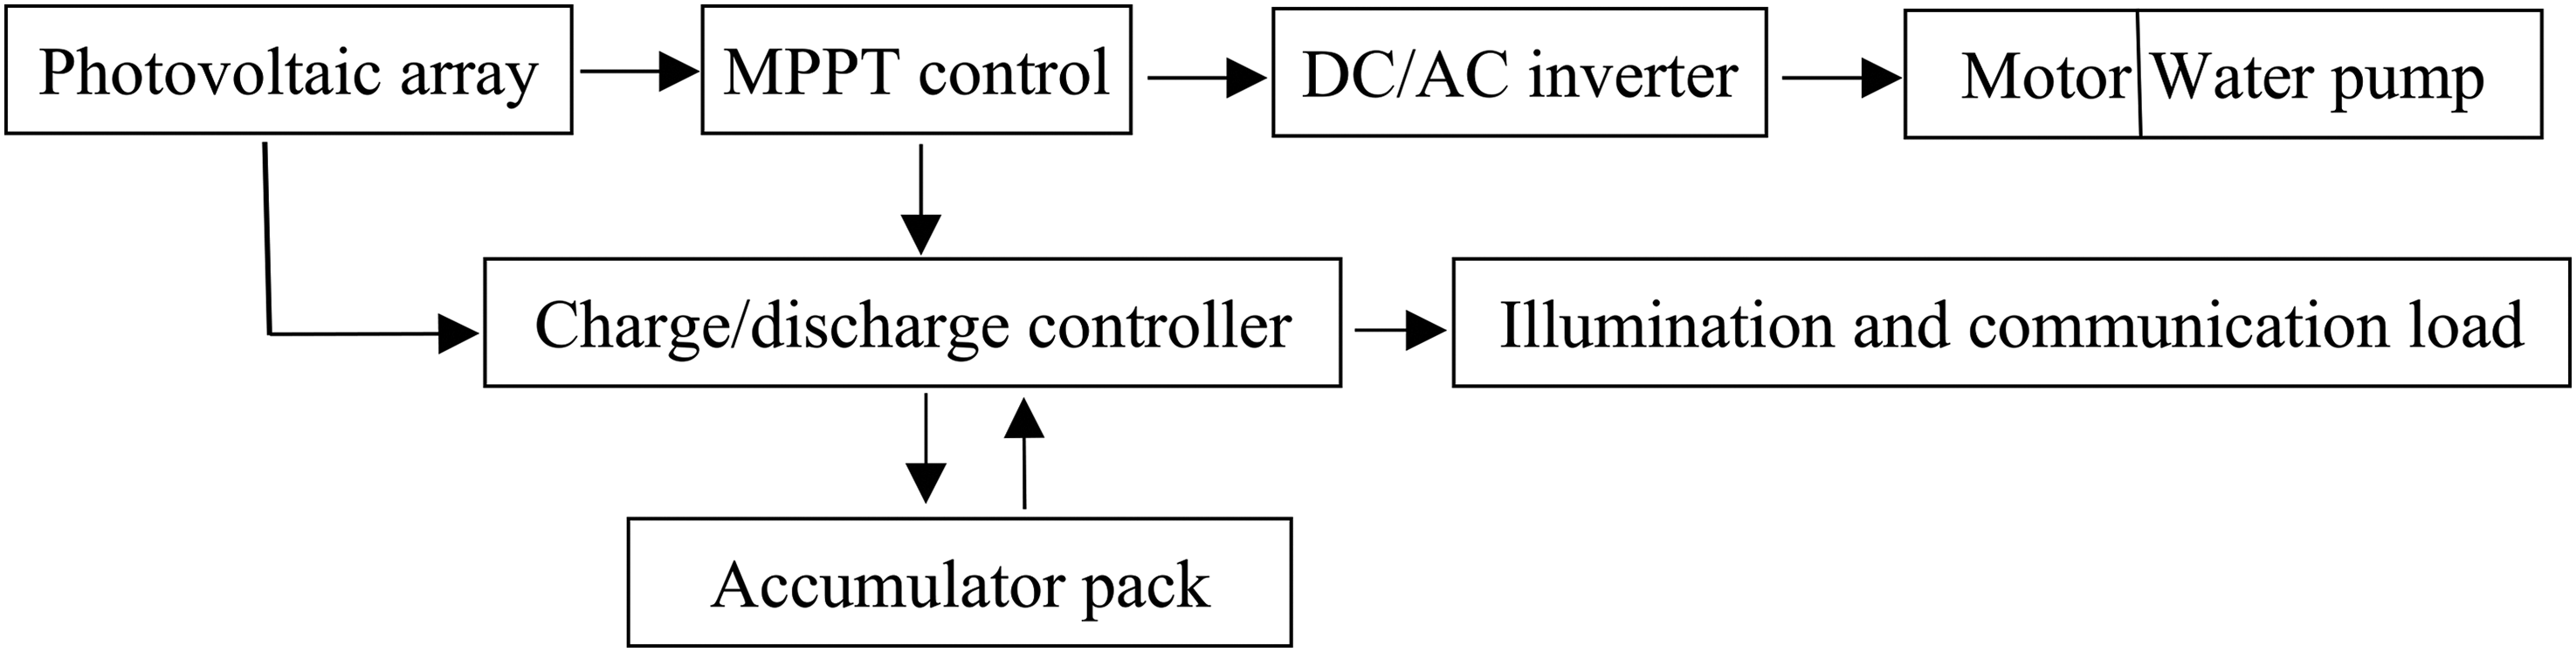
Schematic diagram of a system for photovoltaic power generation, water pumping, energy storage, illumination, and monitoring.
The photovoltaic array comprises solar cell modules in series and parallel. As the output volt-ampere characteristic curve of a photovoltaic array has the same non-linearity as that of a single solar cell, its output presents the DC power that varies upon sunlight, which further concerns sunlight intensity, ambient temperature, and other meteorological conditions (Benyounes et al., 2023; Jiang et al., 2012). The driving motor of a photovoltaic pump, a photovoltaic array load, can be a DC motor, an AC motor, and even a motor with other new models, which is also non-linear (Chen et al., 2023). A maximum power tracking control, namely the MPPT, must be introduced in order to guarantee that the array will provide the corresponding possible maximum power output under each sunlight and ambient temperature condition (Yang, 2013). The main tasks of MPPT are to detect the current and the voltage at the DC side of the main circuit, calculate the output power of the solar cell array, and send a control signal to complete tracking the maximum power output from the array during the process of frequency conversion and speed control (Betka and Moussi, 2004; Kaldellis et al., 2009; Viorel, 2003). MPPT often achieves the inversion and MPPT functions in combination with DC/AC inverter so as to control the pump rotation rate and to realize some special protection functions, such as the protection under over-voltage, overload, low load, low voltage, and dry well, the self-reboot under various conditions after shutdown, etc. (Narvarte et al., 2000; Raju et al., 2008; Thierry et al., 2008). The motor and water pump work as two core components to convert electrical energy into mechanical energy and then into water potential energy. Currently, both components mainly adopt the three-phase AC asynchronous transmission (Zuo et al., 2011). The choice of pump model is of great importance for photovoltaic pump system. Generally, a positive displacement pump will usually be chosen under a situation with a small flow and high delivery head while a centrifugal pump will usually be chosen under a situation with a larger flow and high delivery head (Sweta et al., 2011). When it comes to motor design, it must be fully considered that there are large changes in the frequency-converted operation and the morning and evening load rates of the photovoltaic pump system, so as to strive to achieve the highest total average efficiency of the motor throughout a day and a year (Daud and Mahmoud, 2005; Ghoneim, 2006).
The energy storage system comprises a charge/discharge controller and accumulator pack. When the solar energy illumination intensity reduces to a certain degree, the maximum power output from the photovoltaic array can no longer drive the pump to pump water. Then, the main controller will transmit the detected control signal to the charge/discharge controller so as to charge the accumulator pack (Gao et al., 2019). Two energy management strategies, namely the pumping first or the charging first, have been adopted by solar photovoltaic arrays (Gao et al., 2020).
Research on water pumping and energy storage experiments by photovoltaic pump system
Systematic configuration and structural parameters of experimental devices
In this study, the non-booster photovoltaic water pump system is selected as the research object. The structure of the AC photovoltaic water pump system is shown in Figure 2.
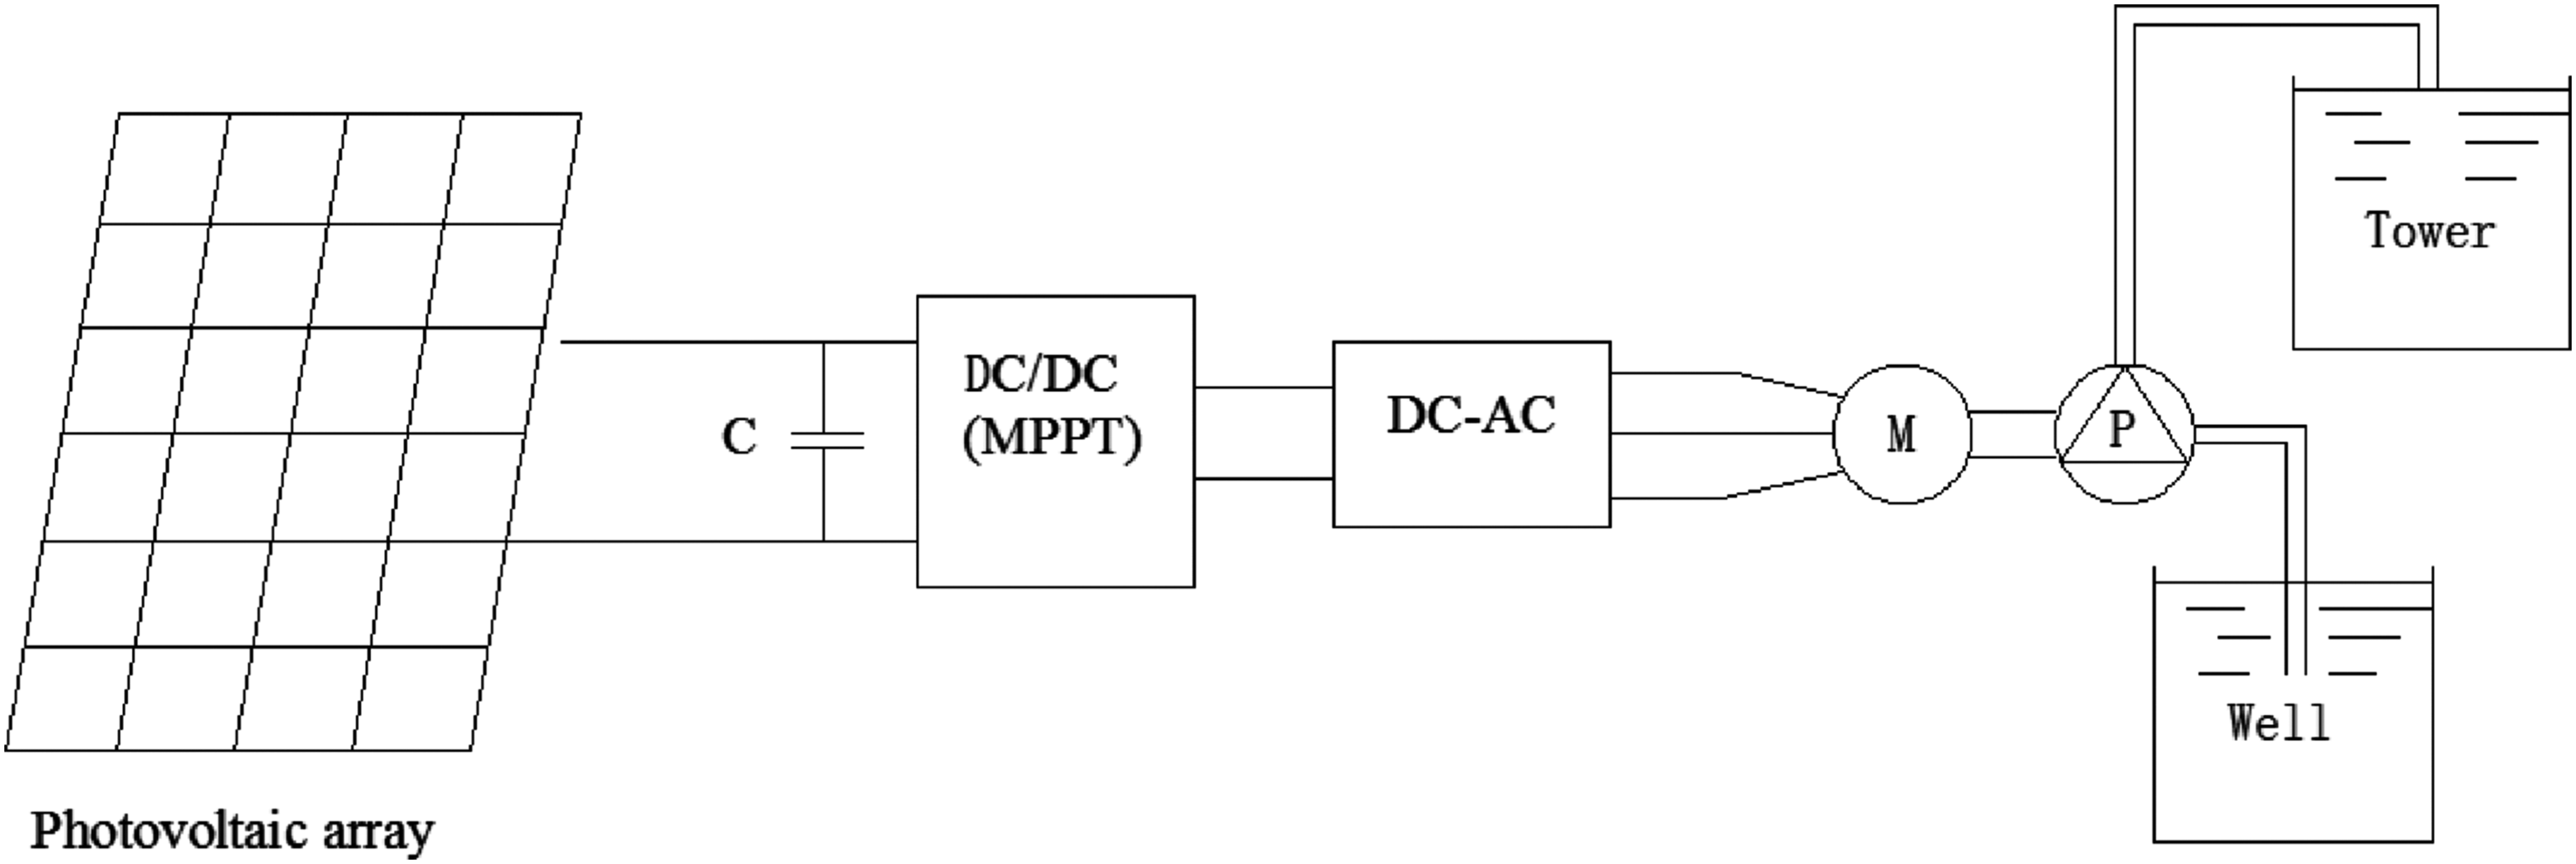
Test diagram of photovoltaic (PV) pumping system.
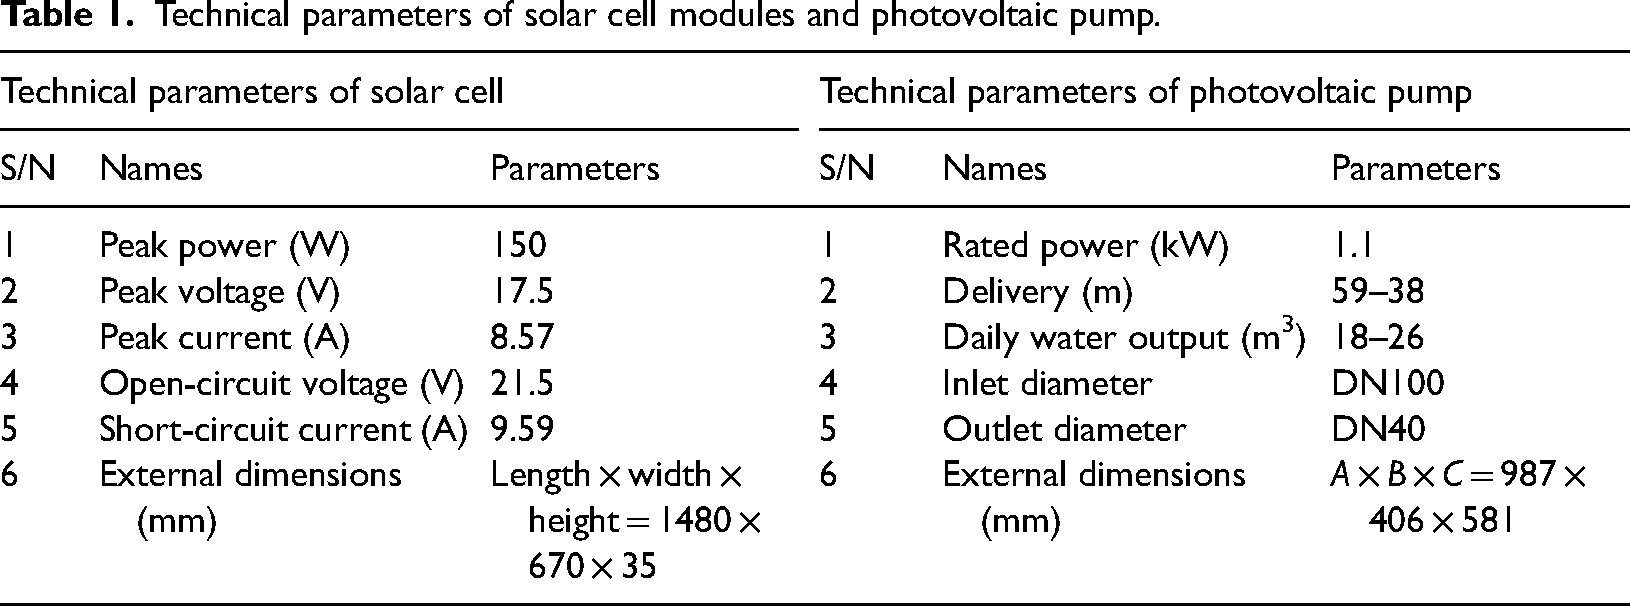
The specific configuration parameters of the system are as follows. The photovoltaic array selects 14 pieces of 150 W/17.5 V polycrystalline silicon photovoltaic modules with a total nominal power of 2.1 kWp. The array should be erected towards the due south with a dip angle of 37°. The photovoltaic pump adopts SJ5-12 stainless steel high-efficiency three-phase submersible type with a motor power of 1.1 kW, an automatic frequency conversion, a three-phase current of 220 V, and a water output range from 3 to 5 m3/h. The actual measured head height is 24.8 m; the inverter adopts JNP1K1L; the maximum motor output power is 1.1 kW; the three-phase voltage at the output terminal is 220 V; the maximum inversion efficiency is 97%; the output frequency ranges from 0 to 50 Hz; the MPPT voltage ranges from 150 to 400 Vdc. The impounding reservoir is equipped with a thermal-insulating water tank made of stainless steel with an external dimension of 1700 mm (external diameter) × 2600 mm (height) and a total volume of 5 m3, which serves for storing the water supply during the experiment. The high cistern has a volume of 200 L and has been placed at the set delivery head of 24.8 m. The technical parameters of solar cell modules and photovoltaic pumps are shown in Table 1.
Technical parameters of solar cell modules and photovoltaic pump.
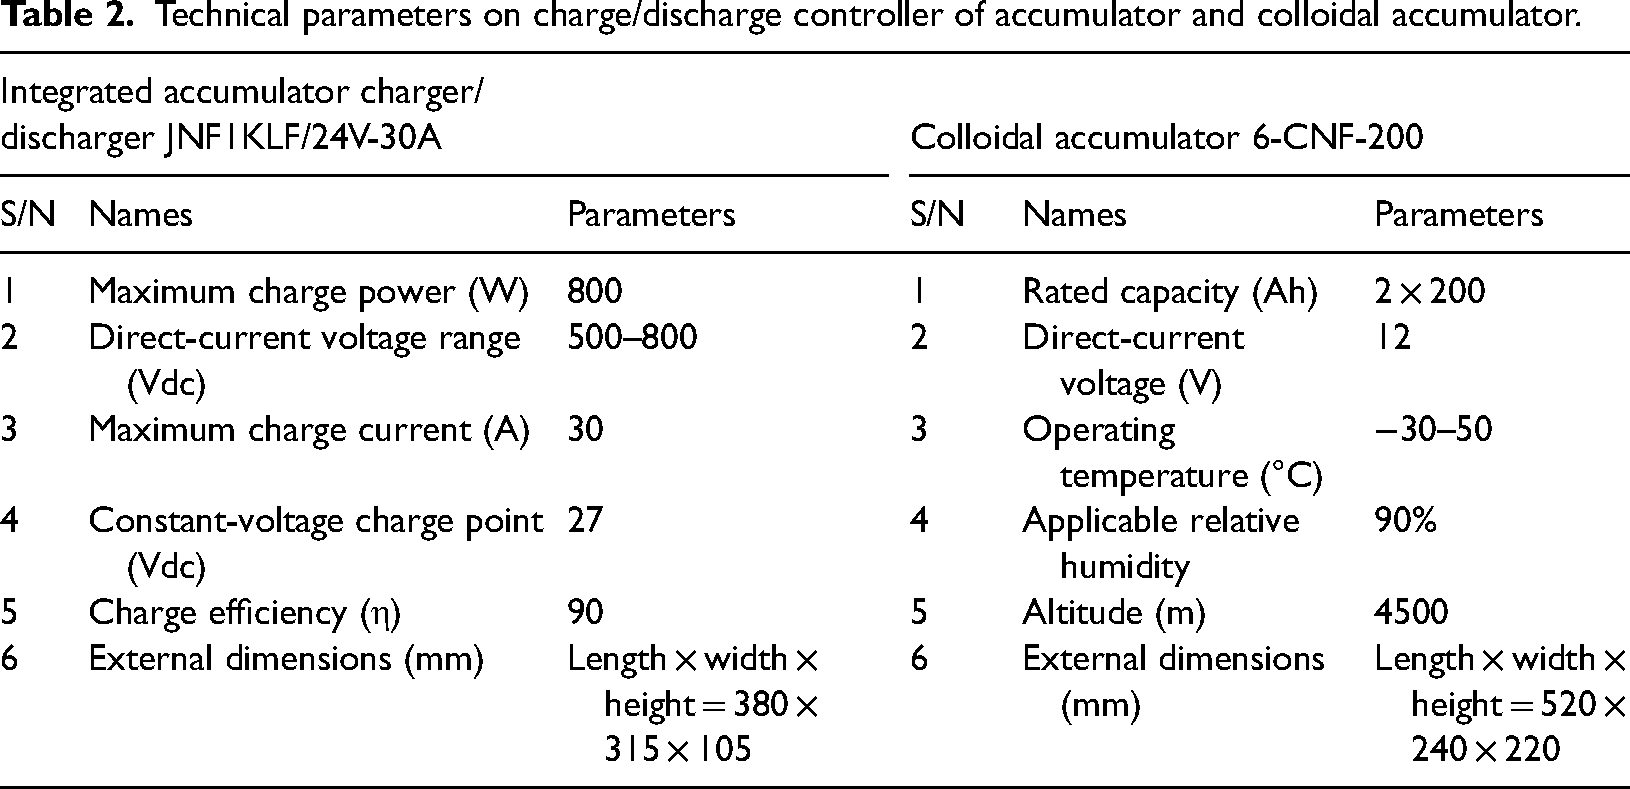
The energy storage system is composed of a charge/discharge controller and battery pack. When the solar radiation intensity decreases to a certain level, the maximum output power of the photovoltaic array can no longer drive the water pump, and the master controller will transmit the detected control signal to the charge/discharge controller, thus charging the battery pack (Gao et al., 2019). The energy generated by the solar photovoltaic array adopts two energy management strategies: water pumping priority and charging priority (Gao et al., 2020). After comparative analysis, according to the changing trend of battery terminal voltage and communication lighting load, the main technical parameters of the high-voltage charge and discharge controller are configured as follows: maximum charging power of 850 W, DC operating range from 500 to 800 Vdc, rated voltage of 24 Vdc, maximum charging current of 30 A, constant voltage charging point of 27 Vdc, and maximum charging efficiency of ≥ 90%. In this study, the model 6-CNF-200 Ah sealed lead-acid colloidal accumulator produced by Changshu Wanlong Power Technology Co., Ltd was selected, and its structural dimensions and technical indicators are shown in Table 2.
Technical parameters on charge/discharge controller of accumulator and colloidal accumulator.
Experimental instruments
Solar radiation measurement TMR-ZS1A meteorological ecological and environmental monitor; the measurement accuracy of solar radiation value is ± 5% and the resolution is 1 W/m2; the temperature measurement accuracy is ± 0.1 and the display indexing value is 0.1 °C. The ultrasonic flow meter TUF-2000E-TS-2-HT-PT100; size is 45 mm × 25 mm × 32 mm; the measuring pipe diameter ranges from DN15 to DN100; the measuring accuracy is ± 0.1%; the measuring scope ranges from 0 to ± 10 m/s. The clip probe is placed outside the full pipe section with steady flow at the pump outlet by V-shaped method; the horizontal installation distance is > 10 D. The power attenuation of the photovoltaic module should be measured by PV900 portable solar energy I–V tester with a maximum power test range from 50 W to 10 kW, a maximum power test repeatability of ± 1% and ± 5 W; the maximum power accuracy should be ± 5% and ± 1 W after being converted to STC. The test accuracy of voltage should be 0.1 V; the test accuracy of current should be 0.001 A; the test accuracy of temperature should be ± 1 °C; the test scope of irradiance ranges from 0 to 1800 W/m2 and the test accuracy is > ± 3%. HT304 hand-held laser ranger. UT243 clamp harmonic power meter. UT204 digital clamp multimeter.
Experimental method
The test time period was from May 2019 to June 2020 and the test place was Zhengzhou. During the test, the operating parameters of the inverter, integrated accumulator charger/discharger, and photovoltaic pump were monitored; generated output, daily generated energy, instantaneous flow rate, flow rate, daily water pumping volume, and each voltage, current, and frequency input and output were recorded. The system was switched on and off through manual adjustment each day. All solar radiation values, ambient temperature, and wind speed values were automatically recorded and stored every 10 min. The power, voltage, current, frequency, and other operating parameters of the inverter and integrated charge/discharge controller were manually read and recorded every 10 min. The flow rate of the photovoltaic pump was automatically recorded and stored via a flow meter every 10 min. Test methods referred to Solar Home System Specifications and Test Procedure (GB/T19064-2003) and Solar Photovoltaic Pump System (NB/T32017-2013). The test method for power attenuation of a photovoltaic module refers to Crystalline Silicon Photovoltaic (PV) Array—On-Site Measurement of I–V Characteristics (GB/T18210-2000) and Guideline of Performance Testing and Quality Assessment for Grid-connected PV Power Plants (CNCA/CTS0016-2015).
Result and analysis
As the experimental platform erected has adopted the photovoltaic cell modules installed and used in 2015, the actual power shall be verified for attenuation. According to the literature published in this study (Gao et al., 2020), the measured total power of 14 series of nominal 150 W photovoltaic modules is only 1.8375 kWp after the test.
Characteristic curve of photovoltaic pump flow—Generated output under constant delivery head
The measured results of the whole-day operation status on 29 October 2019 have been selected. The sampling period is 10 min. The solar radiation intensity and the output power are the instantaneous values at sampling points. The flow is the average value between sampling points. Curves for the measured pump flow and the photovoltaic array's generated output have been displayed in Figure 3. On the testing day, it was sunny; the ambient temperature was 9 °C to 24 °C; the air quality was pm 2.5/56; the average wind speed was 0.77 m/s; the time period from sunrise and sunset was from 06:43 to 17:35.
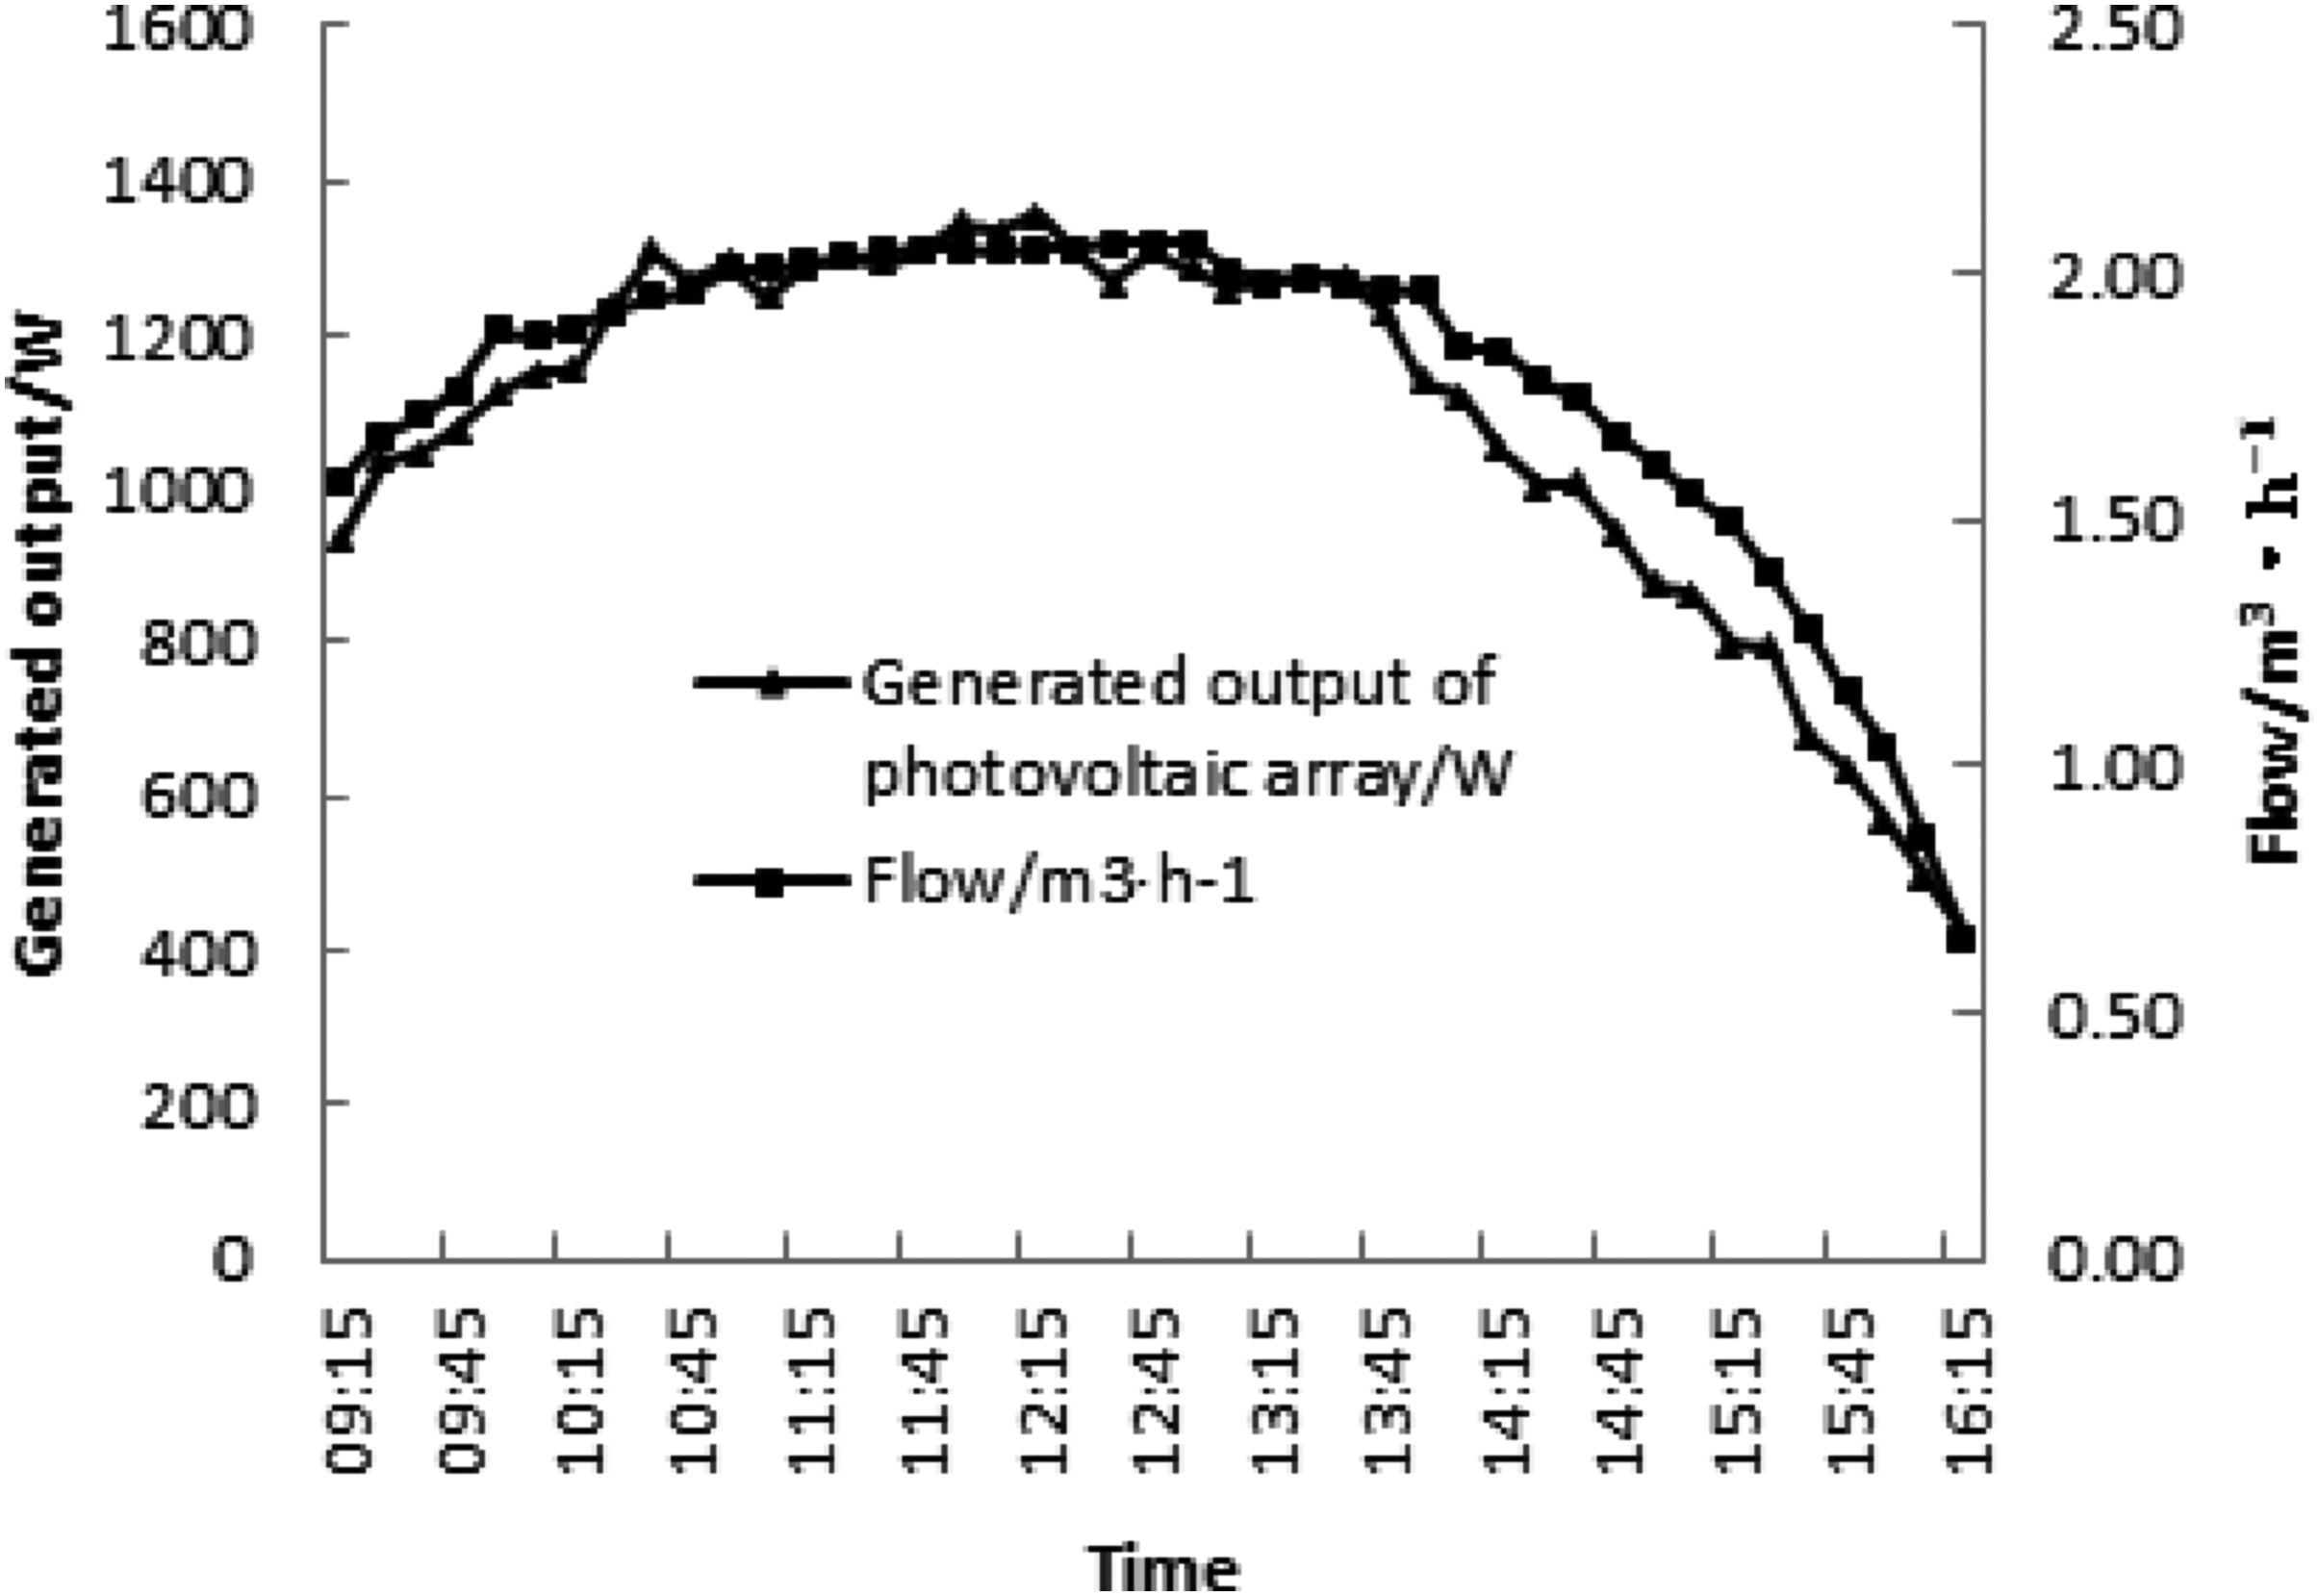
Curves on system flow—power characteristics of the photovoltaic pump.
According to Figure 3, at the beginning and the end of the day, the generated output of the photovoltaic array was small, and so was the flow of the photovoltaic pump. During the stable operation period from 10:25 to 13:45, the generated output of the photovoltaic array saw a few changes (with a maximum power of 1356 W and an average power at noon of 1287.5 W) and the pump flow saw few fluctuations, indicating that the photovoltaic pump reached its largest performance under this fixed delivery head. Under the fixed delivery head of 24.8 m, the variation trend of water pumping flow by the photovoltaic pump is in good alignment with the distribution curve of generated output from the photovoltaic array. The total daily water output increased as sunshine duration extended, the total daily water output was 13.1 m3 and the average water output per hour was 1.93 m3. If one wants to raise the water pumping yield, a reduced delivery head can be considered accordingly.
Curves on DC input current, three-phase output current, and output frequency
The test results on DC input current, three-phase output current, and output frequency of the photovoltaic pump inverter on the test day are shown in Figure 4.
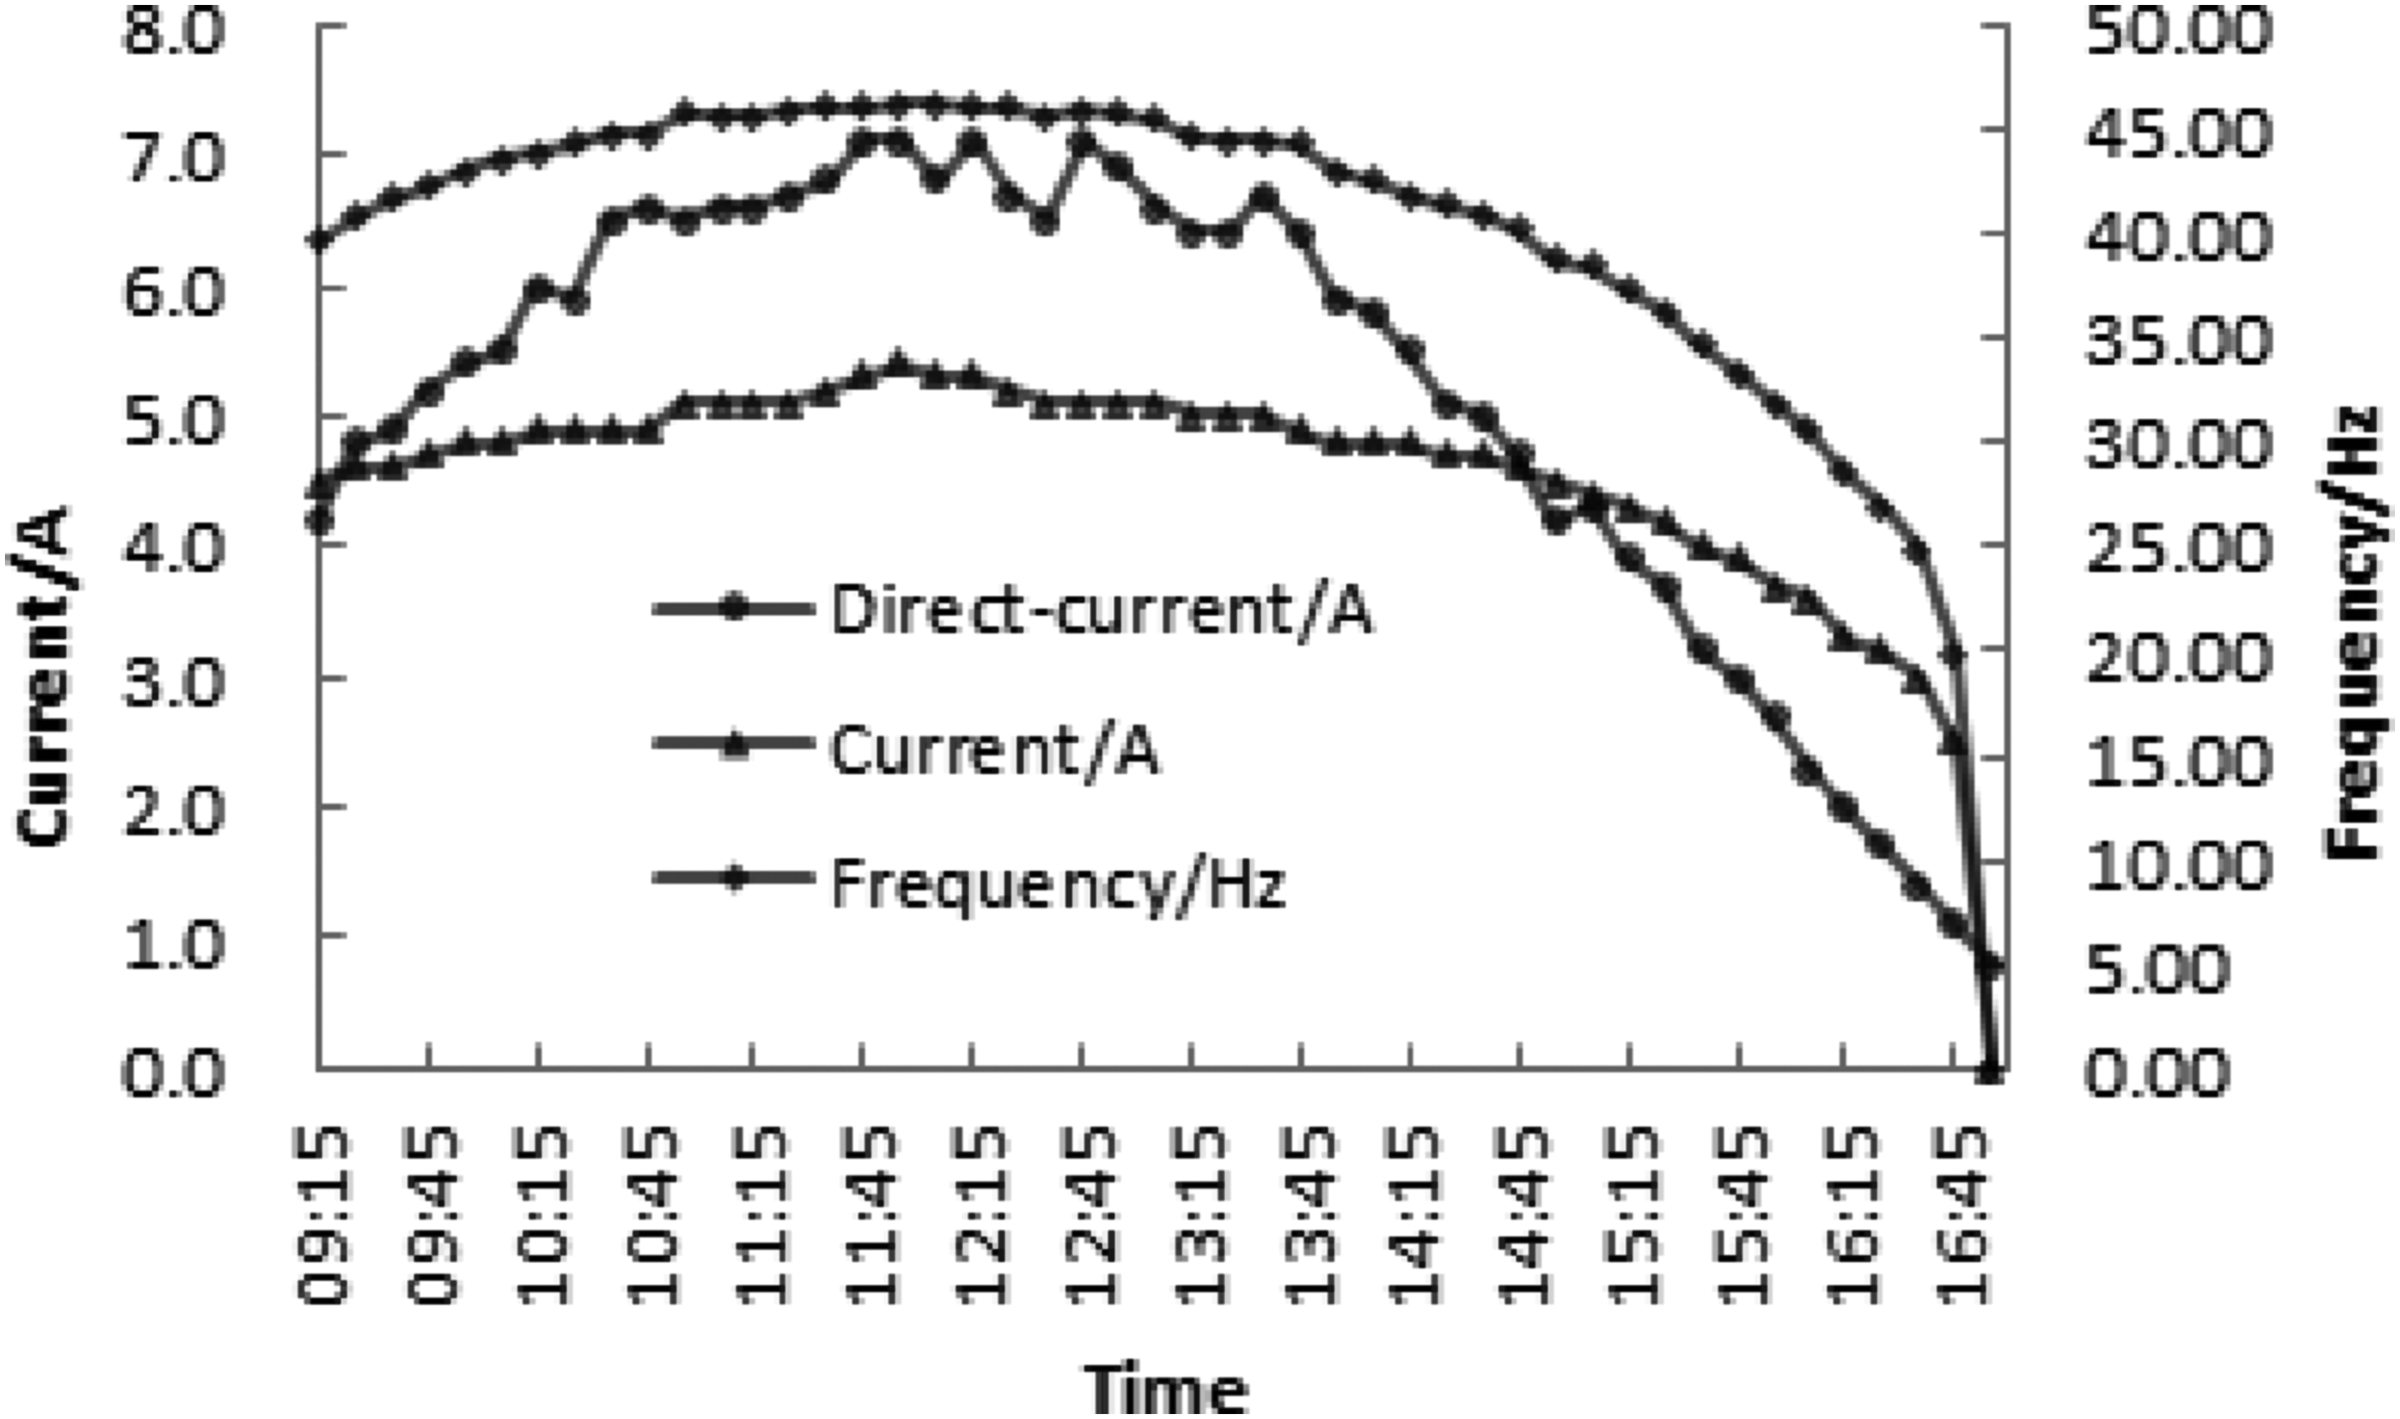
Curves on direct-current input current, three-phase output current, and output frequency.
According to Figure 4, the distribution characteristics of curves on three-phase output current and output frequency remained consistent and indicate that the inverter is under normal working conditions; the curve on DC input current was basically consistent with the solar irradiation power distribution curve on the cell panel bevel on the test day, presenting a roughly sinusoidal distribution. According to the I–V characteristics of solar cells, the current generated by photovoltaic cells depends on the change in solar radiation intensity. That is, the greater the solar irradiation is, the greater the current by the photovoltaic cell will be. In other words, the generation power of photovoltaic cells increases upon sunlight intensity.
Variation of water pumping efficiency upon frequency
In the photovoltaic water pumping system, as the solar radiation intensity changes, the pump inverter adjusts the output voltage and frequency in real-time based upon changes in sunlight intensity, and the pump is always in the operation state under speed regulation. The output frequency decides the pump rotation rate and serves as the main influencing factor for the input power of a motor-driven pump.
The water pumping efficiency of a photovoltaic pump system can be expressed as η (Qu, 2016; Xu et al., 2013). The ratio of the increment of fluid potential energy per unit time to the output power of the photovoltaic array, regardless of the kinetic energy of the velocity head, can be expressed as equation (1):
The characteristic curves on photovoltaic power and water pumping efficiency under a fixed delivery head on the test day are shown in Figure 5.
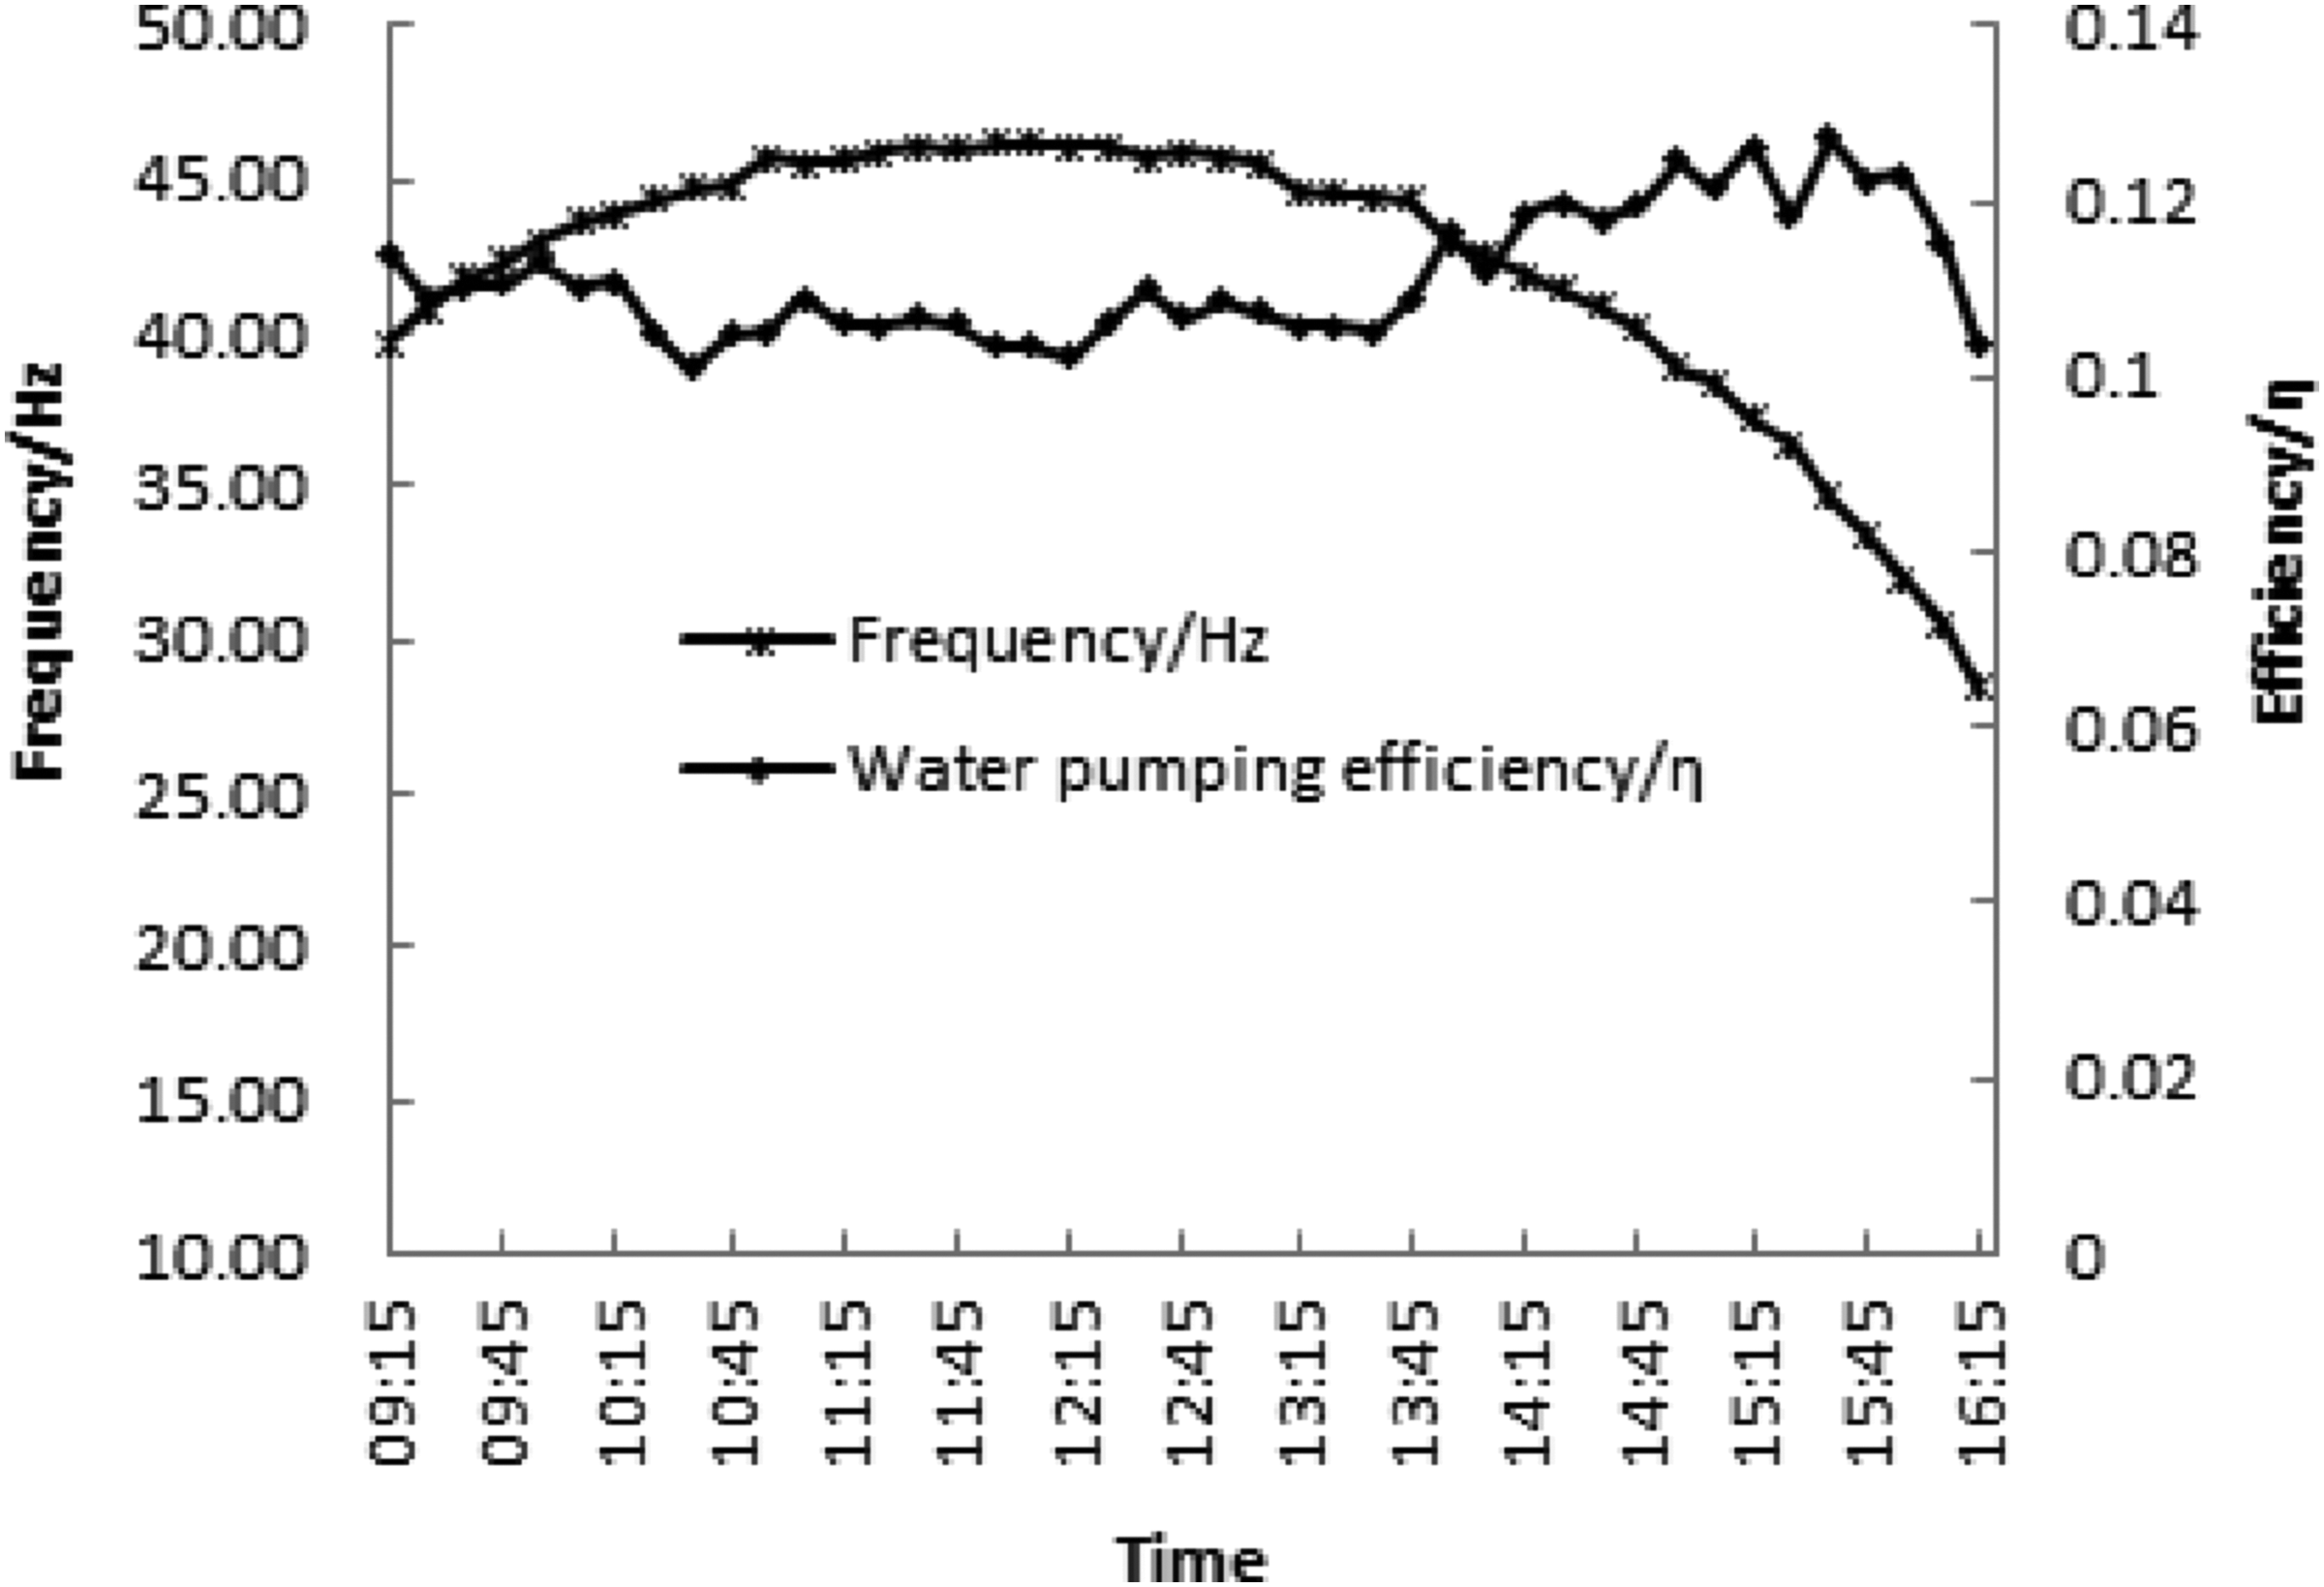
Characteristic curves on output frequency—water pumping efficiency.
According to Figure 5, water pumping efficiency varies upon output frequency. In the initial and at final periods, the output frequency was small while the water pumping efficiency was large, and the maximum water pumping efficiency was up to 12.7%; during the period of the high output value of the photovoltaic array from 10:25 to 13:45, the water pumping efficiency decreased as the output frequency increased but it basically remained unchanged. These indicate that the photovoltaic pump reaches its largest performance under this fixed delivery head and the average pumping efficiency of the whole day reaches 11.1%. That is, the highest water pumping efficiency corresponds to a different frequency under different delivery heads.
Curves on energy storage by accumulator and generated energy by photovoltaic array
A certain photovoltaic pump system has a corresponding water pumping threshold. When the generated output is lower than the water pumping threshold, the photovoltaic pump will not start working but the photovoltaic array will still output a certain amount of electricity. However, when the generation power exceeds the rated power of the pump, there will be a surplus generation power while the pump is operating. It thus results in energy waste in photovoltaic modules during the morning, noon, and evening when sunlight intensity is good. The integrated system of photovoltaic pump and energy storage in accumulators can effectively make use of the output energy or surplus water pumping energy to charge those accumulators as sunlight intensity is weak, which not only solves the problem of illumination on the one hand but also saves energy on the other hand (Liu et al., 2003; Shen and Zeng, 2005; Yang et al., 2009; Zhao et al., 2000). The one-day energy storage test is shown in Figure 6, which shows the curves on the generated energy, the power consumption by pump operation, and the energy storage in accumulators on the test day. The shaded part in the figure refers to the electricity stored in accumulators by the photovoltaic high-voltage charge/discharge controller, and the rest is the electricity consumed by pump operation. A total of 10.3 kWh of electricity was generated by the photovoltaic array on the day. It is stored in a battery and then discharged through a controller for DC loads such as field lighting, crop growth monitoring, and communication, greatly improving the energy utilization efficiency of photovoltaic modules.
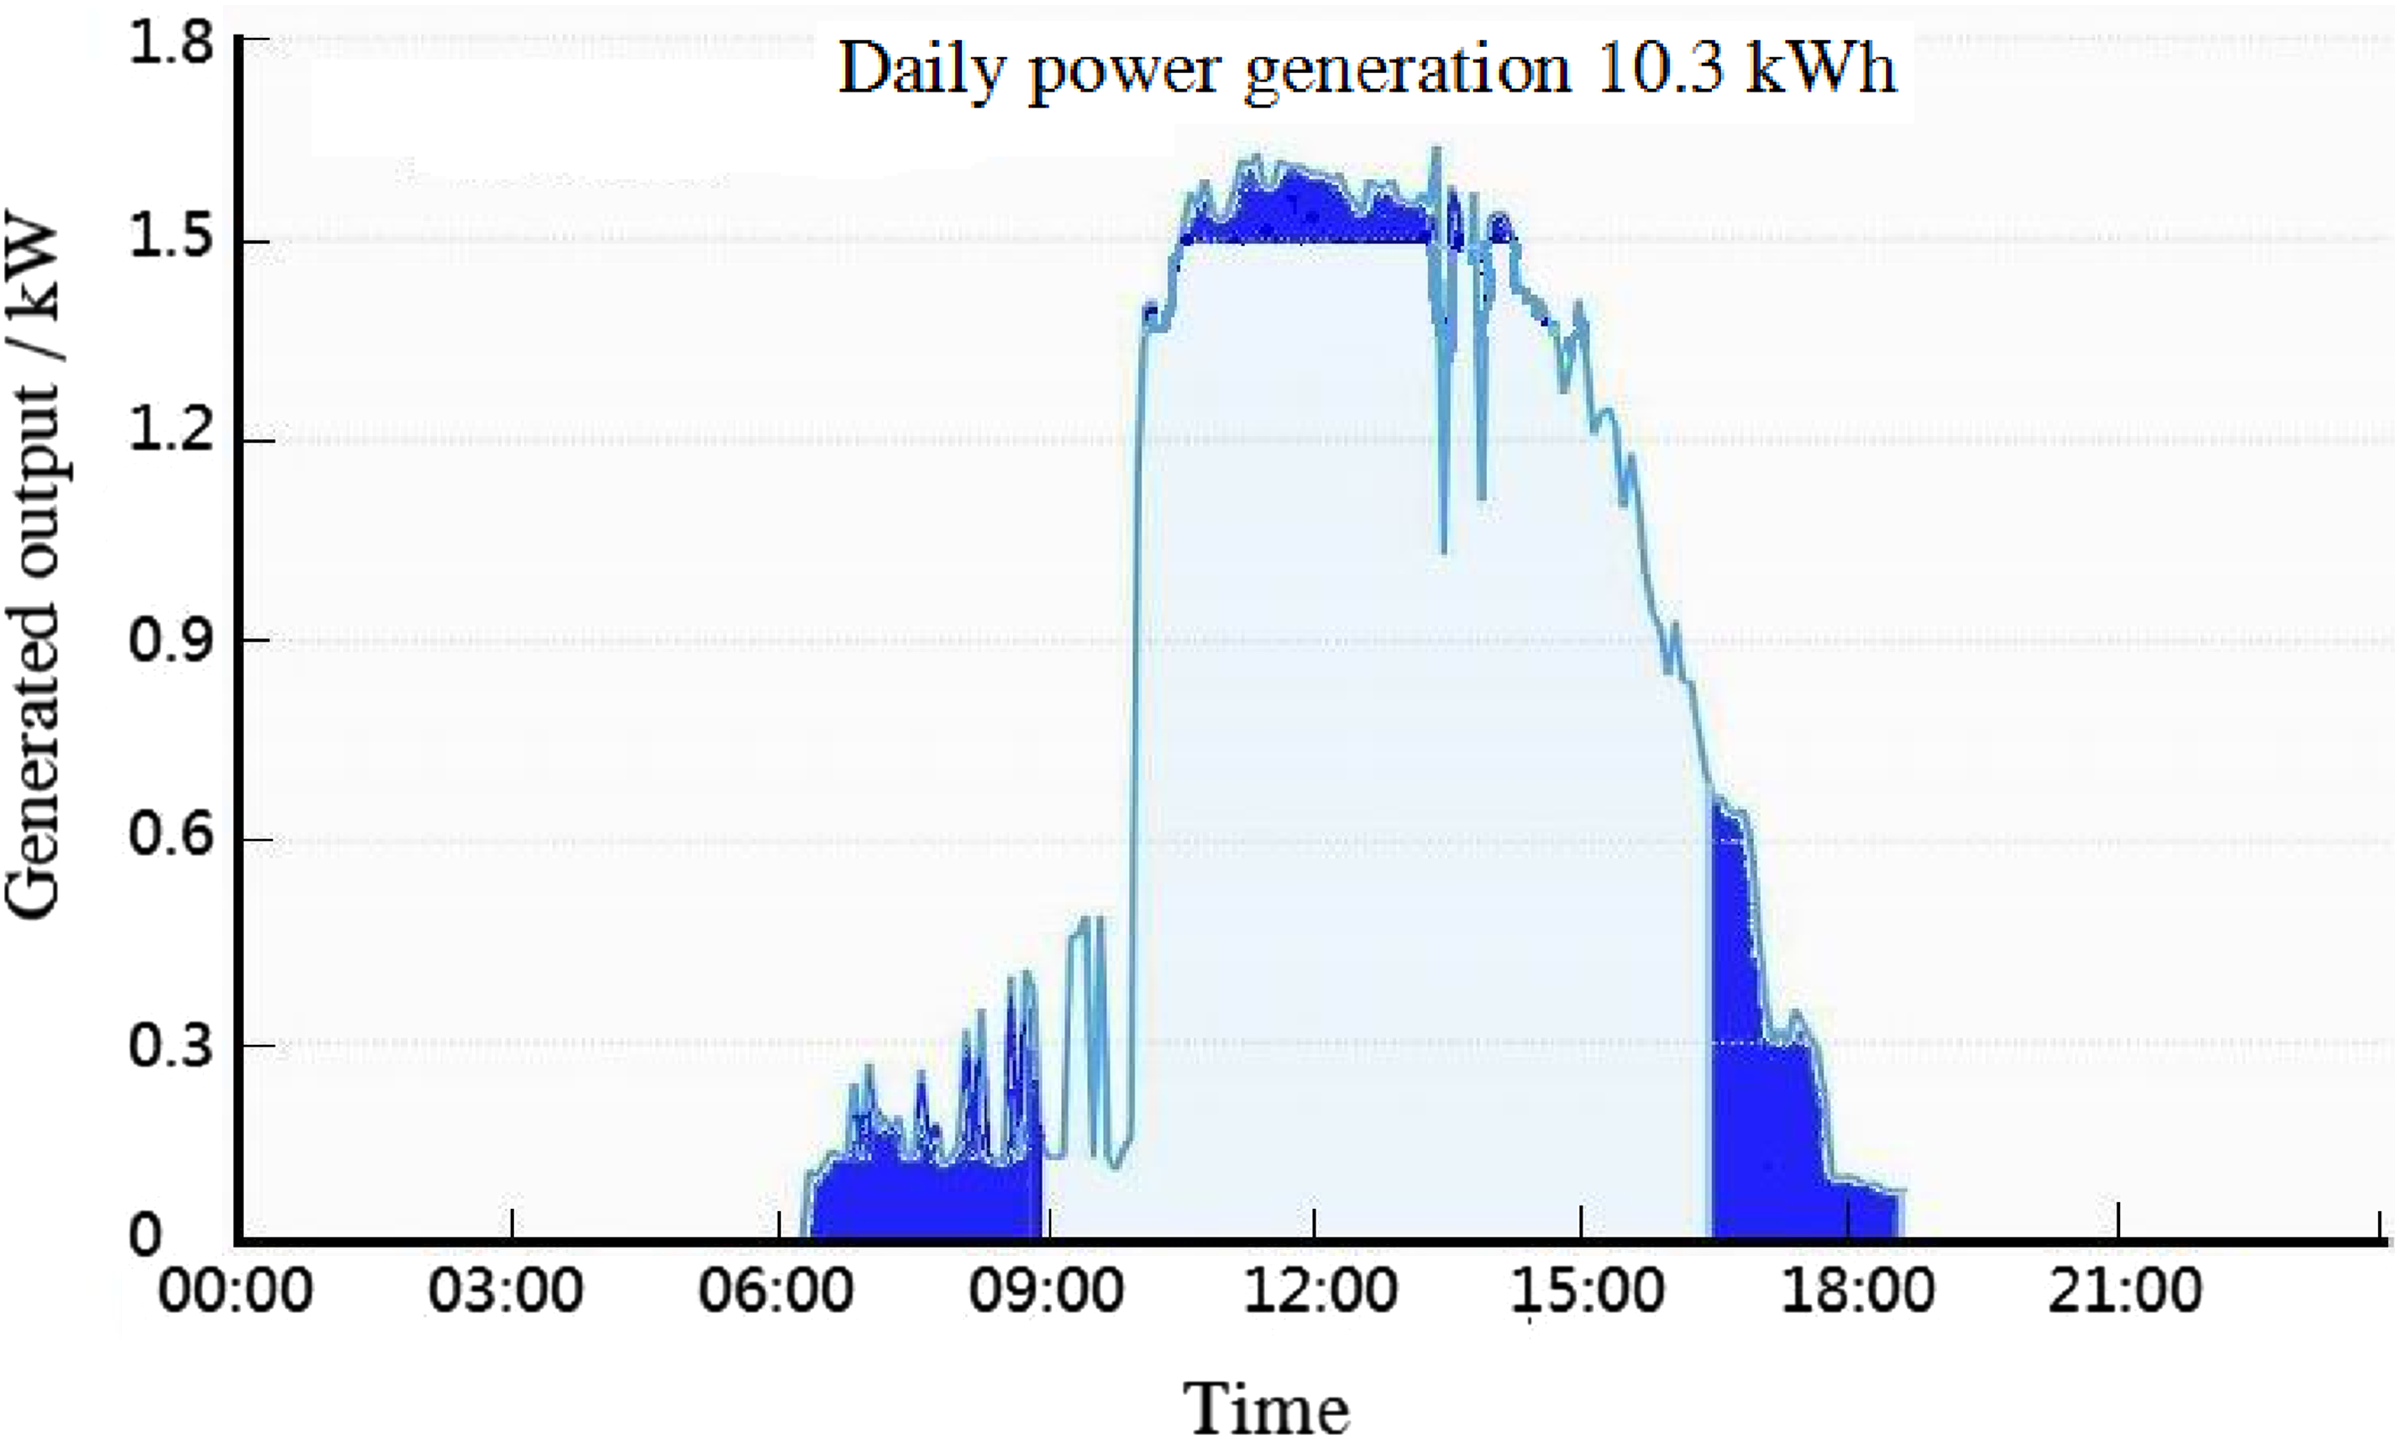
Curves on daily generated energy and energy stored.
According to Figure 6, as buildings blocked the sunlight on the test day, the generated energy was compromised to some extent during the shading period from 06:55 to 10:04; at 10:04 in the morning, the generated energy increased and the curve on generated energy changed suddenly because there was no shade blocking the sunlight. During the accumulator charging period from 06:55 to 08:40, the photovoltaic pump wasn’t in operation; at 08:40, the photovoltaic pump started operation on its own. At 16:20, the photovoltaic pump stopped operating and accumulators were being charged from 16:20 to 17:20 in the afternoon. The peak period of solar irradiation at noon from 11:04 to 13:14 was the operation time for both pump pumping and accumulator charging. That is to say, the power required for stable operation of pump pumping under a fixed delivery head ranges from 1200 to 1300 W. When the generated output by the photovoltaic array reaches 1300 W, the extra part is the surplus. The surplus power ranged from 1300 to 1356 W during peak hours of the day. The total energy storage in accumulators during three periods was 1.01 kWh, accounting for around 9.72% of the total generated energy by the photovoltaic array on the day, namely 10.3 kWh around. The electricity stored in accumulators can be re-used for DC loads, such as field illumination, crop growth monitoring, and communication, under the regulation of the discharge controller, so as to improve the utilization rate of generated energy by the photovoltaic array (Gao et al., 2021, 2024).
Conclusions
The following conclusions have been drawn herein according to the structural analysis of photovoltaic water pumping and energy storage system and the experimental research on the system's input and output characteristics.
The behaviors of both flow and generated output of photovoltaic pump system, the characteristics of both water pumping efficiency and output frequency, and the feature of charge capacity in accumulators have been analyzed through tests, based on the structure parameters on integrated experimental photovoltaic pump device for water pumping, energy storage and illumination, the solar irradiation and the temperature conditions. Under a constant delivery head of 24.8 m, the photovoltaic pump system with a total measured power of 1.8375 kWp in a photovoltaic array produces a daily water output of 13.1 m3 and an average water output of 1.93 m3/h; the maximum water pumping efficiency of the system is 12.7% and the average water pumping efficiency is 11.1%; the energy storage capacity of accumulators by charging in three time periods throughout a day is 1.01 kWh, which accounts for about 9.72% of the photovoltaic array's all-day generated energy, namely 10.3 kWh, and basically meets the demand for the water pumping and the energy storage via accumulator charging under this delivery head. The experimental results from this research can be applied to optimizing the configuration of photovoltaic water pumping and energy storage systems. Furthermore, the system has low requirements on local meteorological data and a simplified engineering calculation process and thus produces certain practical implications for solving problems concerning the drinking water shortage for both farmers and herdsmen and livestock as well as the farm irrigation water scarcity in areas without electricity by solar photovoltaic pump system.
Footnotes
Acknowledgements
The authors thank all researchers for their achievements and all the materials that have been referred to in this study. Meanwhile, we are grateful for the critical comments and suggestions from the anonymous reviewers for improving the manuscript.
Author contributions
Yanjin Wang contributed to the data curation and writing–original draft. Linchao Gao contributed to the conceptualization and resources. Yi Xie contributed to testing and writing–review and editing. Fuping Shen contributed to the software and project administration. Qingying Hao contributed to the data acquisition and formal analysis. Bing Jia contributed to the supervision and visualization.
Declaration of conflicting interests
The author(s) declared no potential conflicts of interest with respect to the research, authorship, and/or publication of this article.
Funding
The author(s) disclosed receipt of the following financial support for the research, authorship, and/or publication of this article: This work was supported by the Key Science and Technology Project of Henan Province (182102210075), Research and Development Special Project of Henan Academy of Sciences (230606059 and 230606060) and the Research Initiation Fund of Henan Finance University.