
Abstract
In the restructured power system, where uncertainties are common, managing congestion becomes a crucial aspect of power system operation and control. Congestion management aims to alleviate the power system transmission line congestion while meeting the system constraints at minimal cost. This research introduces a generation rescheduling method for congestion management in the electricity market, leveraging an innovative nutcracker optimizer algorithm. The nutcracker optimizer algorithm, inspired by nutcrackers’ food accumulation mechanisms, is a recently developed nature-inspired algorithm. The efficacy of this proposed approach is assessed across modified IEEE 30-bus, and IEEE 118-bus test systems, considering the system parameters. The effectiveness of the proposed congestion management with the nutcracker optimizer algorithm is analyzed by comparing its results with those generated by other recent optimization techniques. Results demonstrated that the nutcracker optimizer algorithm surpasses other comparative methods, requiring fewer fitness function evaluations, avoiding local optima, and displaying encouraging convergence traits. Implementing this approach can assist the system operators in swiftly addressing contingencies, ensuring secure and reliable power system operation within a deregulated environment.
Introduction
The ability of transmission lines to carry electrical power is limited by various factors, including voltage, heat, and stability. When any of these limits is reached, the power system is considered congested. Congestion can have significant implications on the power dispatch, potentially impacting the overall performance of the system. Managing power system congestion is a critical task undertaken by independent system operators (ISOs) and grid operators (Bouhouras et al., 2024). They play a crucial role in coordinating and overseeing the functioning of the power market, ensuring efficient power flow, and maintaining system stability. With the increasing demand for electricity, aging infrastructure, and limitations on new transmission line construction, congestion has become a prevalent issue in power systems worldwide (Alavijeh et al., 2024).
Several factors contribute to congestion. These include an upsurge in power demand beyond the infrastructure's capacity, unexpected generation outages, limitations on building new transmission lines due to environmental or logistical constraints, unscheduled power flow, transmission line tripping, or equipment failures. The resulting congestion can lead to reduced reliability, increased energy costs, and potential disruptions in power supply to consumers (Dehnavi et al., 2024). To address congestion effectively, various congestion management (CM) strategies are employed. These strategies aim to alleviate constraints, optimize power flow, and maintain system stability. Some common approaches include reactive power support, generation rescheduling, demand response programs, transmission line reconfiguration, and dispatching of power resources (Ansari et al., 2020; Shaikh et al., 2020; Zhou et al., 2023). These methods help balance the power system and mitigate congestion-related issues, ensuring reliable and uninterrupted electricity supply to consumers.
Literature survey
In recent years, advancements in technology, such as smart grid technologies, advanced metering infrastructure, and real-time monitoring systems, have provided enhanced capabilities for CM. These tools enable grid operators to gather precise data, monitor system conditions, and implement timely control actions to alleviate congestion and optimize power flow. Zaidan and Toos proposed an emergency CM method for power systems using a static synchronous series compensator (SSSC). The authors focused on alleviating congestion during emergency situations and introduced the SSSC as a device to enhance the power transfer capability of transmission lines (Majeed Rashid Zaidan, 2022). The research focuses on optimizing transmission line parameters using an enhanced moth flame optimization technique, demonstrating its superiority over other methods through simulations on various test cases. Results indicate that the proposed method achieves rapid convergence to optimal values for capacitance and inductance, showcasing its effectiveness and competence in managing transmission and distribution networks (Shaikh et al., 2022c). Wang et al. introduced the concept of virtual storage plants (VSPs) for frequency regulation and CM in power systems. They proposed a framework where distributed energy resources are aggregated into VSPs to provide ancillary services for frequency regulation and CM. The study evaluates the performance of the VSP and its potential for improving the stability and efficiency of power systems (Wang et al., 2022). Managing the transmission line flows with the influence of optimization algorithm for transmission line parameter optimization can be found in (Shaikh et al., 2021a, 2022a, 2022b, 2023). Mahajan et al. provided a review of CM in deregulated power systems. The review associated with the CM summarized the existing literature on CM techniques, including market-based approaches, generation rescheduling, load shedding, and demand response programs. The review also provided insights into the challenges and opportunities in managing congestion in deregulated power systems (Mahajan et al., 2022). Hobbie et al. investigated the effect of model parametrization of the transmission channels during the congested environment of the power system. The authors compare different existing models used for CM in electricity networks and analyze the influence of model parameters on CM (Hobbie et al., 2022). Zakaryaseraji and Ghasemi-Marzbali evaluated CM in power systems considering demand response programs and distributed generation (DG). They incorporated demand response and DG as flexible resources for managing congestion (Zakaryaseraji and Ghasemi-Marzbali, 2022). Shaikh et al. conducted their research to select the optimal transmission-line parameters that would assist efficient power flows (Shaikh et al., 2021b). Roustaei et al. formulated a voltage security-constrained CM methodology for improving the controlling of transmission systems. They addressed the challenges of voltage security and CM and proposed an approach that optimizes generation rescheduling to alleviate congestion while considering voltage security constraints (Roustaei et al., 2022). In another research, Mishra et al. provided a review of the utilization of AI-based methods in alleviating the congestion of transmission channels considering the electricity market constraints. The review mainly highlighted the application of artificial intelligence techniques, such as neural networks, fuzzy logic, and evolutionary algorithms, for CM in restructured power systems (Mishra et al., 2022). Paul formulated an enhanced framework of a grey wolf optimization algorithm that controls the congestion considering the impact of renewable sources. The CM focused on optimizing the operation of transmission lines to alleviate congestion and incorporates the impact of solar photovoltaic systems in the optimization process (Paul, 2022a). Dehnavi et al. proposed a novel CM method through power system partitioning. In the CM approach, they considered the power system into multiple partitions and applied a decentralized control strategy to manage congestion (Dehnavi et al., 2022). Sarwar et al. developed an effective transmission CM approach for contemporary power system operations using optimal DG capacity and hybrid swarm optimization. The authors focused on determining the optimal capacity of DG units at specific locations in the power system to mitigate congestion (Sarwar et al., 2022).
In the CM, generator rescheduling (GR) plays a crucial role by optimizing the generation dispatch to alleviate congestion. It allows for the efficient utilization of existing transmission infrastructure, reducing the need for costly grid expansion. By strategically adjusting generator schedules, congestion can be alleviated, ensuring reliable and secure power system operation. GR also enables the integration of renewable energy sources and promotes the economic dispatch of generation resources, leading to enhanced system efficiency and cost-effectiveness. Subramaniyan and Gomathi presented a soft computing-based analysis of CM in transmission systems with the application of generator rescheduling. The CM approach explored the application of soft computing techniques, such as fuzzy logic and genetic algorithms, for managing congestion (Subramaniyan and Gomathi, 2023). Agrawal et al. proposed a cascaded deep neural network-based approach for customer participation in CM, considering renewable energy sources and GR in deregulated power markets. Their research focused on optimizing the participation of customers with distributed energy resources to alleviate congestion (Agrawal et al., 2022). Chakravarthi et al. investigated real-time CM using generation redispatch. They designed controllers for efficient generation rescheduling to mitigate congestion in power systems (Chakravarthi et al., 2022). Srivastava and Yadav proposed a rescheduling-based CM approach using a hybrid algorithm that combines lion and moth search models. The authors optimized generator schedules to alleviate congestion and enhance the operational efficiency of power systems (Srivastava and Yadav, 2021). Ogunwole and Krishnamurthy developed a transmission CM approach using generator sensitivity factors and particle swarm optimization. The authors focus on optimizing active and reactive power rescheduling to alleviate congestion and enhance system performance (Ogunwole and Krishnamurthy, 2022). Prajapati et al. proposed a GR-based CM approach considering the demand response characteristic for power systems and uncertainty of the renewable resources (Thiruvel et al., 2023) and presented a modern power system operations approach for effective transmission CM using optimal distributed generation (DG) capacity and GR. The authors determined the optimal capacity of DG units and real power deliveries by the generators to alleviate congestion (Thiruvel et al., 2023). Balaraman and Kamaraj managed congestion for a deregulated electricity market with the application of GR methodology. They implemented particle swarm optimization (PSO) to alleviate overloads and minimize deviations from the initial market settlement. The PSO application for CM addressed system constraints security constraints, using a penalty-based approach (Kamaraj, 2011). Saravanan and Anbalagan proposed an intelligent hybrid technique for optimal GR in deregulated power markets. They combined genetic algorithms (GA) and PSO to optimize generator schedules and alleviate congestion (Saravanan and Anbalagan, 2022). Sharma and Walde proposed a novel optimization technique based on swarm intelligence for CM in transmission lines. They applied a hybrid algorithm combining PSO and GSA to optimize power flow and alleviate congestion (Sharma and Walde, 2022). Haq et al. proposed a game-theoretic approach using plug-in electric vehicles (PEVs) and GR for real-time CM. Their work investigated the participation of PEVs and GR in alleviating congestion by adjusting their charging and discharging patterns (Haq et al., 2022). Verma and Mukherjee implemented real power GR rescheduling using a novel ant lion optimizer for CM. The CM approach aimed at optimizing generator schedules to alleviate congestion and enhance power system performance (Verma and Mukherjee, 2016b). Paul et al. reduced rescheduling costs and efficiently alleviated line overloads with minimal deviations in active power generation. The developed CM strategy involved prioritizing generators based on their sensitivity values. The GSA is then employed to minimize rescheduling costs while simultaneously reducing total active power output and system losses (Paul et al., 2019).
The emergence of competitive energy markets has driven the advancement of optimization algorithms that effectively tackle mathematical problems related to power system challenges, resulting in precise and improved outcomes. The classical optimization methods have been widely used and effective in certain scenarios but have some limitations that make metaheuristic optimization methods more preferable in many cases. Classical optimization methods have limitations such as getting entombed in local optima, sensitivity to initial conditions, lack of flexibility, high computational cost, and difficulty in handling uncertainties and noisy environments. In contrast, metaheuristic algorithms overcome these limitations by exploring the entire solution space, being less sensitive to initial conditions, offering flexibility in problem domains, providing computational efficiency, and accommodating uncertainties and noisy environments through robust and adaptive mechanisms. The metaheuristic algorithms strike a balance between exploration (diversification) and exploitation (intensification) of the search space. They avoid getting stuck in local optima by exploring different regions while also exploiting promising areas. This ability to balance exploration and exploitation enhances their capability to find better solutions. Various approaches such as grey wolf optimization (Paul, 2022b), Fennec Fox optimization (Verma and Mukherjee, 2016a), flower pollination algorithm (FPA; Gupta et al., 2023), cuckoo search algorithm (CSA; Wangunyu et al., 2022), and an enhanced version of crow search algorithm (CSA) (Paul et al., 2022) have been implemented to oversee the efficient operation of power systems. The selection and adjustment of control parameters associated with these meta-heuristic techniques greatly influence the achieved solution. This has motivated the development of an efficient CM strategy with the application of the evolutionary algorithm that will deliver optimal outcomes for the optimization problem.
The novelty can be stated as the minimization of the congestion cost/rescheduling cost always creates a scope for implementation of new efficient optimization approaches that would deliver appreciable outcomes w.r.t previously adopted approaches. The integral novelty of this paper lies in the mathematical model formulation of the congestion cost minimization with the incorporation of the new nutcracker optimization algorithm (NOA).
In this research work, NOA which is a new metaheuristic optimization technique has been considered for the CM problem. The NOA has been designed by Basset et al. in the year 2023 (Abdel-Basset et al., 2023). The framework of NOA is inspired by the intelligent behaviors of nutcrackers to search for and store food. It draws inspiration from the hunting behavior of antlions. According to Abdel-Basset et al. (2023), the NOA has been validated on standard mathematical functions (CEC-2014, CEC-2017, and CEC-2020) and classical engineering problems. The findings presented by Abdel-Basset et al. (2023) demonstrated the advantages of the NOA in terms of improved exploration capabilities.
Motivation
The primary motivation behind this endeavor is to devise a proficient approach for CM aimed at enhancing the efficiency of power system operations. The competitive dynamics and trading behavior within the electricity market have heightened the vulnerability of the power network to congestion, prompting researchers in the field to investigate various CM strategies for their applicability and effectiveness. Given the extensive scale of the power network, any implemented CM strategy must possess qualities of robustness, effectiveness, and cost-efficiency, and must not disrupt the network's existing topology. Thus, in light of these considerations, the implementation of the generators rescheduling (GR) approach emerges as a fitting solution for CM. Furthermore, in power system operations, it's imperative to mitigate congestion at minimal cost, necessitating the utilization of efficient optimization techniques that yield optimal cost solutions. While many optimization techniques exhibit commendable performance, they often become ensnared in local optima, unable to navigate the search space effectively to identify the optimal solution. Consequently, there's a strong impetus to enhance the performance of optimization techniques by refining their operational stages. This drive has spurred advancements in the efficiency of exploration and exploitation stages within the NOA.
Research contribution
Development of a CM model to minimize the congestion cost based on the optimal rescheduling of the generators’ real power.
Implementation of NOA to achieve the optimal power rescheduling patterns for generators for congestion cost minimization.
Application of the CM strategies on power stream standard test system; IEEE 30-bus and IEEE 118-bus to validate the efficiency of the proposed CM model.
Establish comparative performance analysis based on the congestion cost, bus voltage profile, and system losses achieved with NOA with the recent optimization techniques.
Problem formulation
The primary goal of CM is to reduce the expenses caused by congestion while adhering to the limitations of the network. This study addresses the CM problem by adjusting the actual power output of generators, either increasing or decreasing it. However, modifying the real power output incurs costs that are decided based on the price offers provided by the generating companies. This can be represented as.

Inequality constraints
These constraints are expressed through the following equations:


Equality constraints


Here, in equations (7) and (8),
Nutcracker optimizer algorithm
This section presents a bio-inspired optimization algorithm (NOA) that draws inspiration from the intelligent behaviors of nutcrackers. The NOA has been designed by Basset et al. in the year 2023 (Abdel-Basset et al., 2023). The nutcracker's behavior can be segregated and portrayed into two sections. The first part involves collecting and storing pine seeds as food. The second part involves searching for and retrieving the stored seeds.
Foraging stage: Exploration phase 1
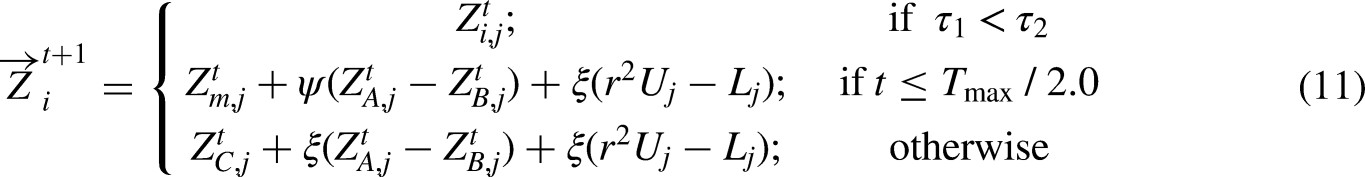
In the starting position, each nutcracker examines the cone holding seeds; if good seeds are found, they are taken to the storage area for burial. If no good seeds are found, the nutcracker seeks another cone among pine/trees. The mathematical representation of this behavior representing the position update can be stated as
Top of form
Storage stage: Exploitation phase 1
Initially, nutcrackers traverse with the gathered foodstuff in the prior exploration phase, called phase 1, to interim stowing in the storage area. This phase is termed “exploitation phase 1” as it involves both exploiting and storing pine seed crops. This behavior can be mathematically represented as:
Throughout the optimization process, a consistent equilibrium between exploration and exploitation operators is upheld by applying the following formula to regulate the interaction between the foraging stage and the cache:

Cache-search and recovery strategy
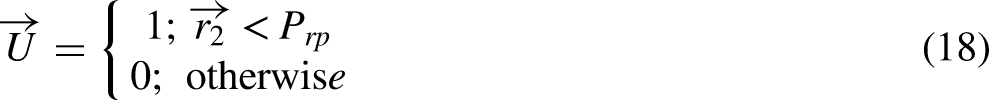
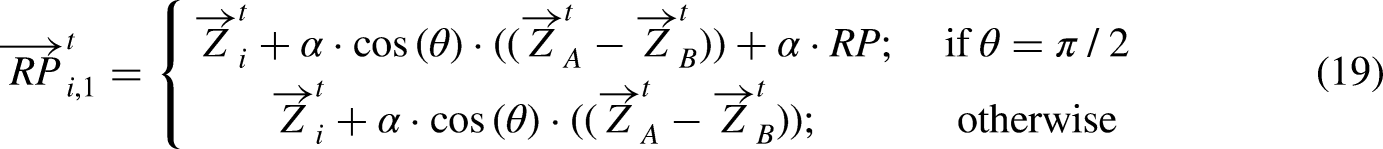
Cache-search stage: Exploration phase 2: Nutcrackers employ spatial memory tactics to uncover their caches, where multiple objects might signify a single cache. Each cache corresponds to just two markers or objects, known as reference points (RPs). Within the NOA, two RPs are established for each population's cache/nutcracker using the following matrix:
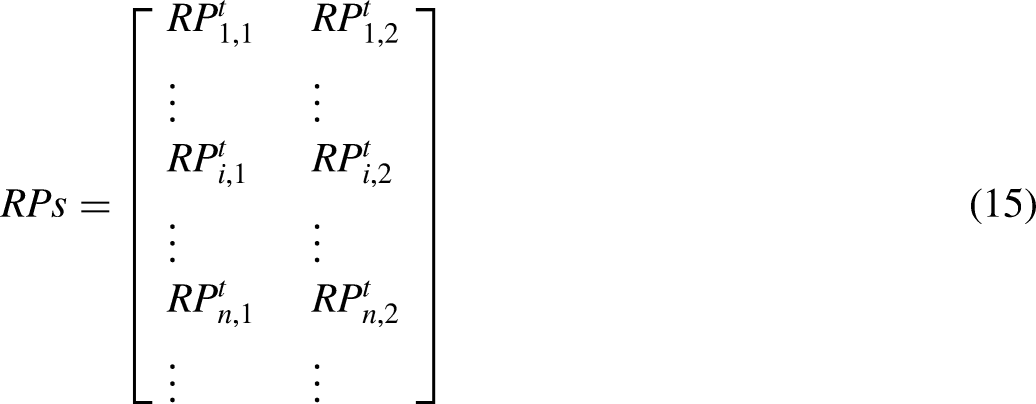
In this equation,
Nutcrackers find caches accurately, but about 20% of attempts fail initially. If they cannot locate the food with the first RP, they try the second RP. Failing that, they turn to the third reference. Two equations boost nutcrackers’ exploration for caches. The first


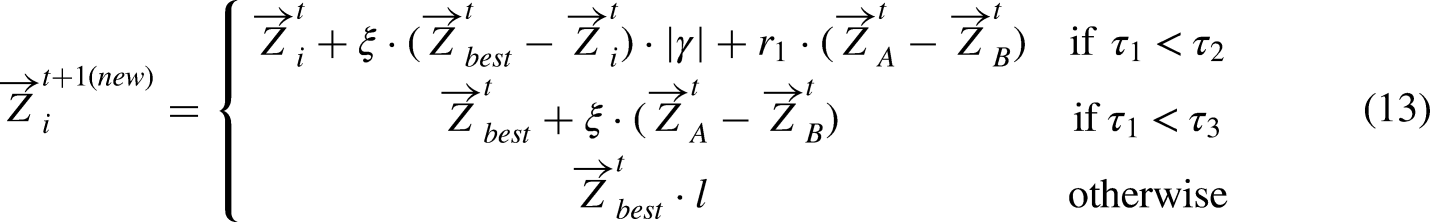
During optimization, nutcrackers gain expertise in Recovery stage: Exploitation phase 2: The main scenario: a nutcracker recalls the cache with the first RP. Figure 8 shows two options: food present or absent. Mathematically, it's expressed as follows:
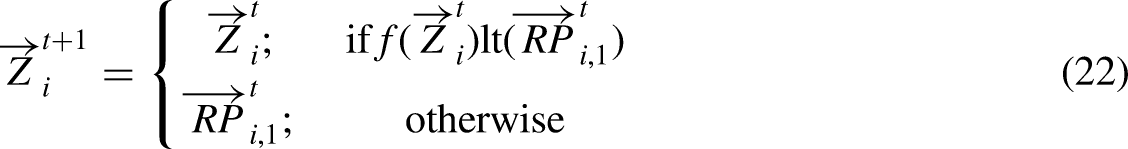
Let
Equation’s (23) first condition assumes food is present, passing certain dimensions to the consecutive generation. The second condition in equation (23) assumes no food, signaling an unpromising solution; an escape mechanism avoids local lows. Food loss in the cache could be due to theft or natural elements. The first part of equation (23) helps the nutcracker exploit promising areas locally. The second part allows exploration globally in the search space.
If the nutcracker cannot find food with the first


Performance analysis of NOA
The NOA's performance has been evaluated across 23 standard benchmark functions, including seven unimodal and 13 multimodal functions. The details of these functions can be found by Dolatabadi et al. (2020). Comparisons with GTO, AHA, and the original NOA are conducted. In this study, search agents and maximum iterations are set at 40 and 500, respectively, with findings gathered from 30 separate runs. Results show that NOA exhibits significant performance during both the exploration and exploitation stages. Table 1 provides the average (Avg), standard deviation (SD), median (Med), and worst (worst of the best-so-far solution) values obtained for GTO, AHA, and NOA the original MRFO in the final repetition. The test results with 23 benchmark functions are given in Table 1. Convergence profiles of the 23 benchmark functions using NOA, AHA, and GTO are depicted in Figure 1, while Figure 2 illustrates the flowchart for NOA in addressing the proposed CM problem.
Benchmark function representation and convergence profile of NOA, GTO, and AHA.
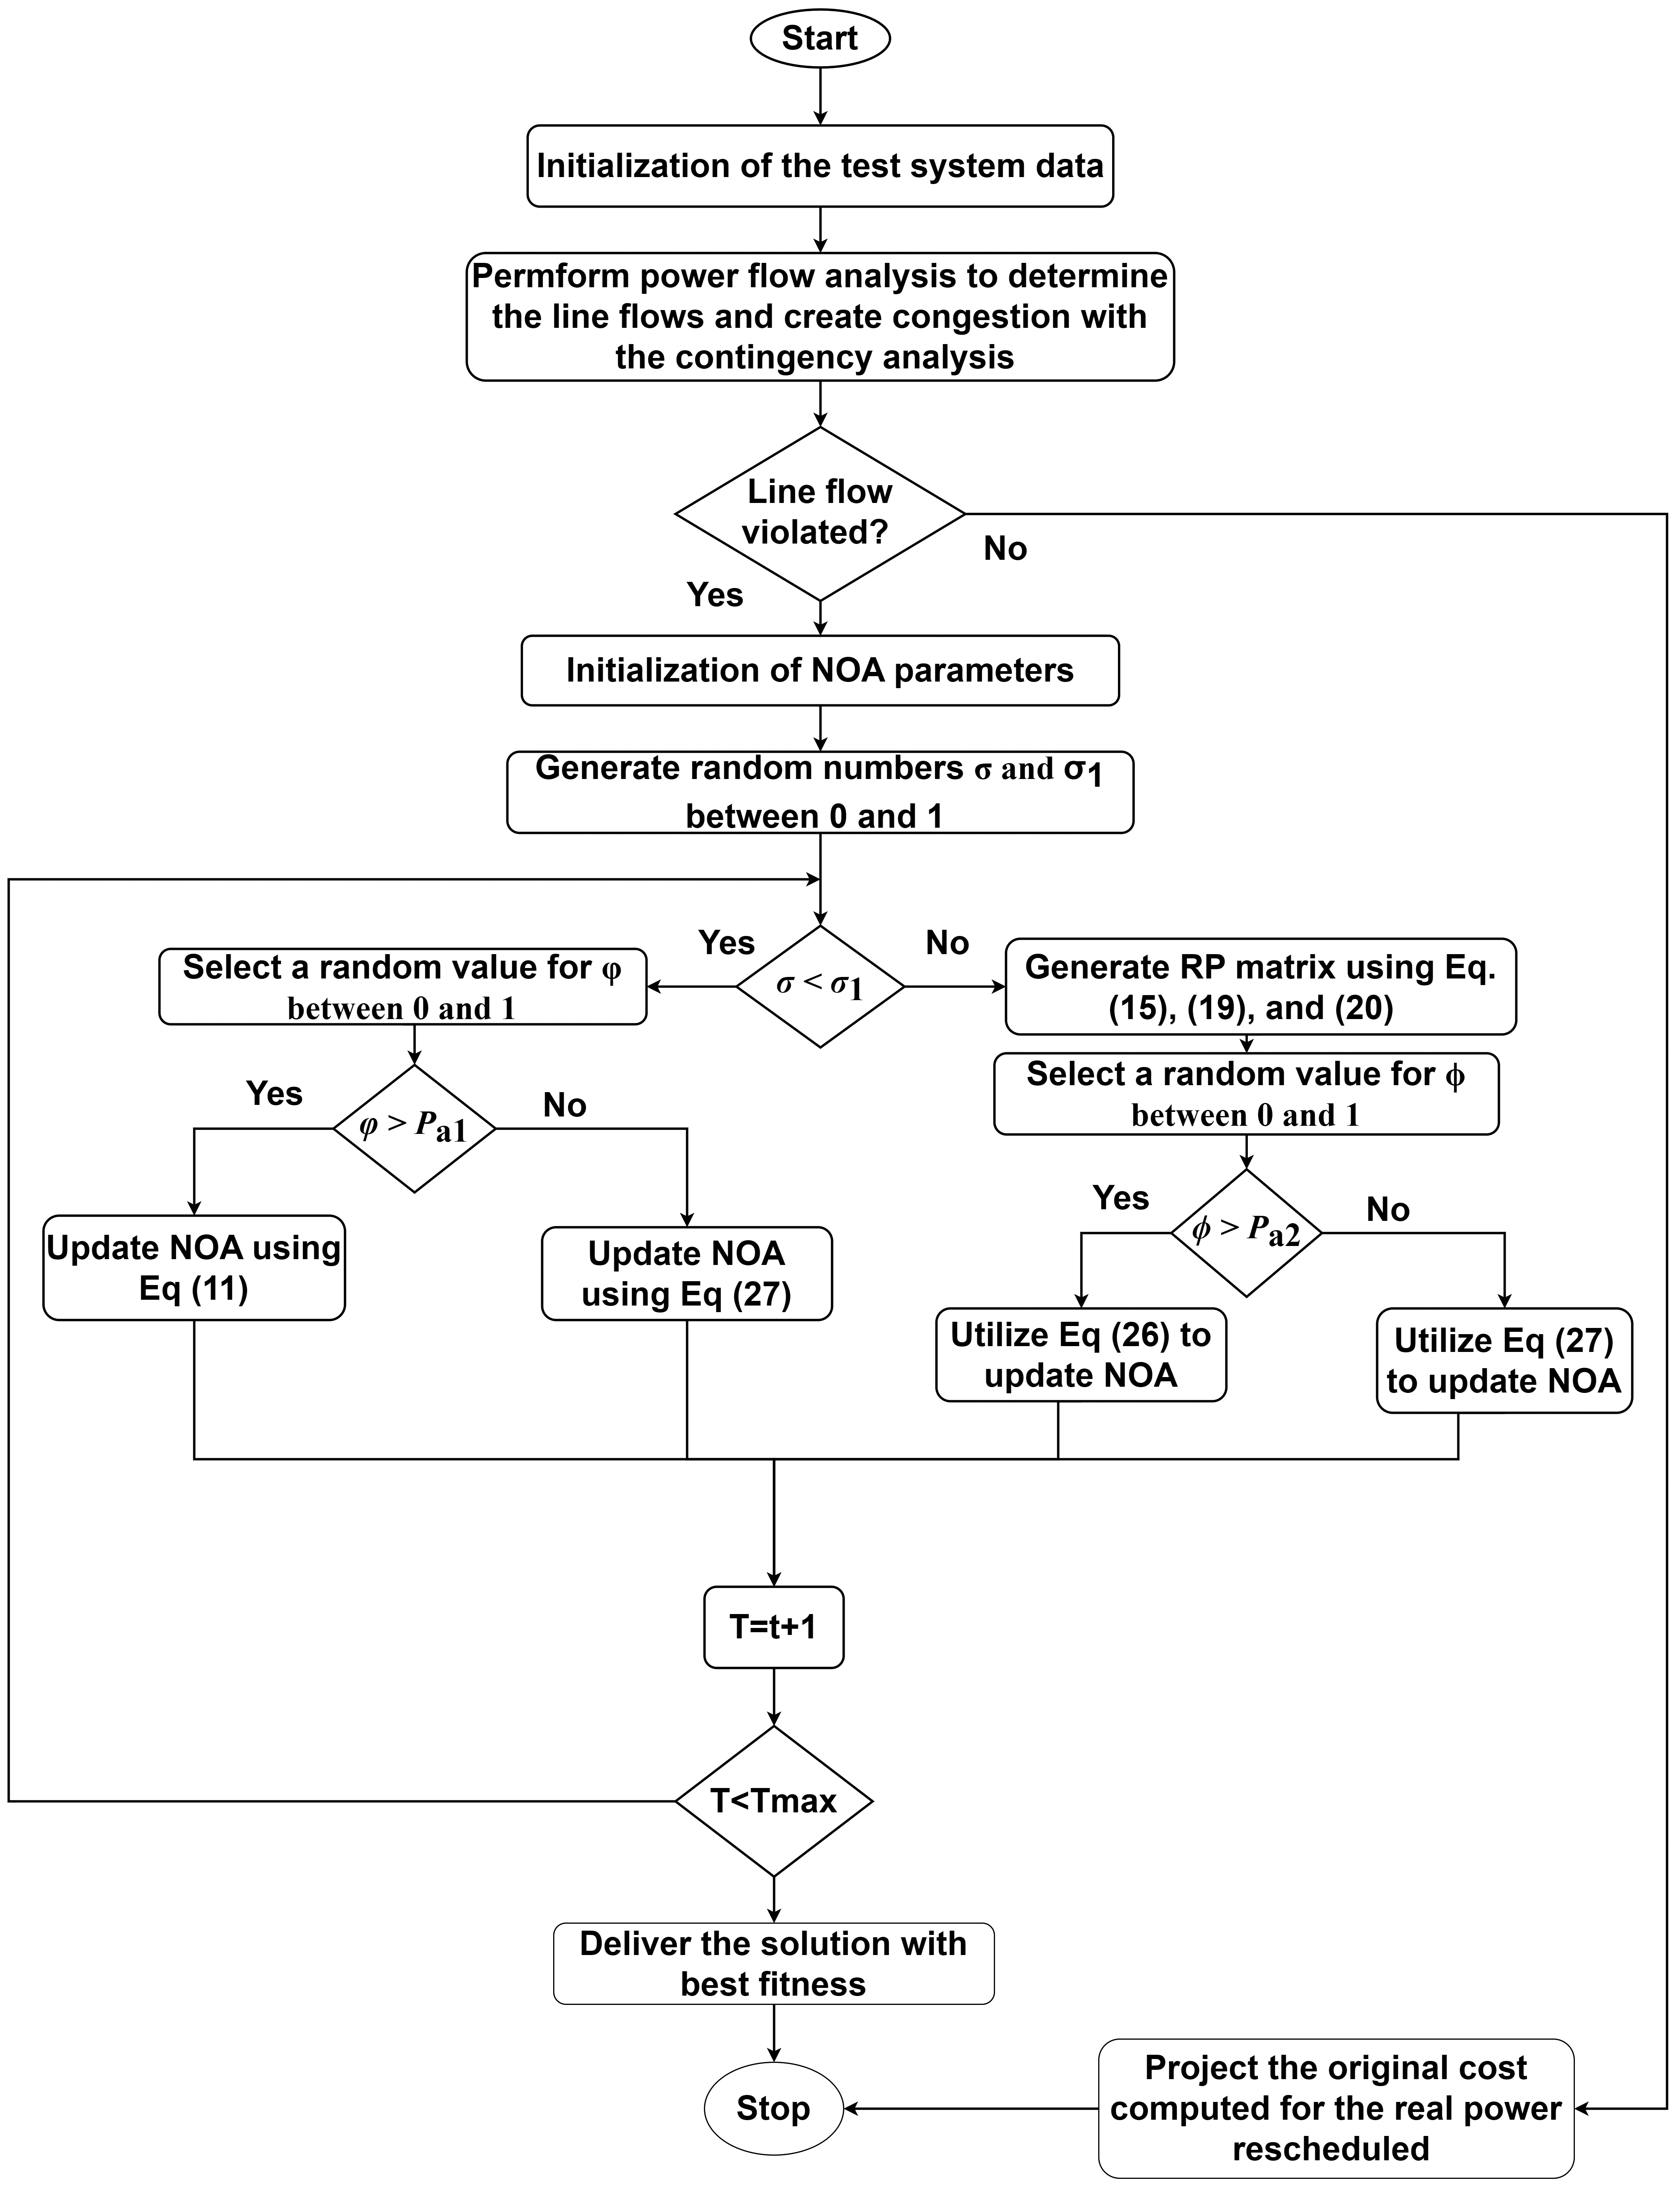
Flowchart for CM with NOA.
Performance of NOA, GTO, and AHA on 23 benchmark functions.
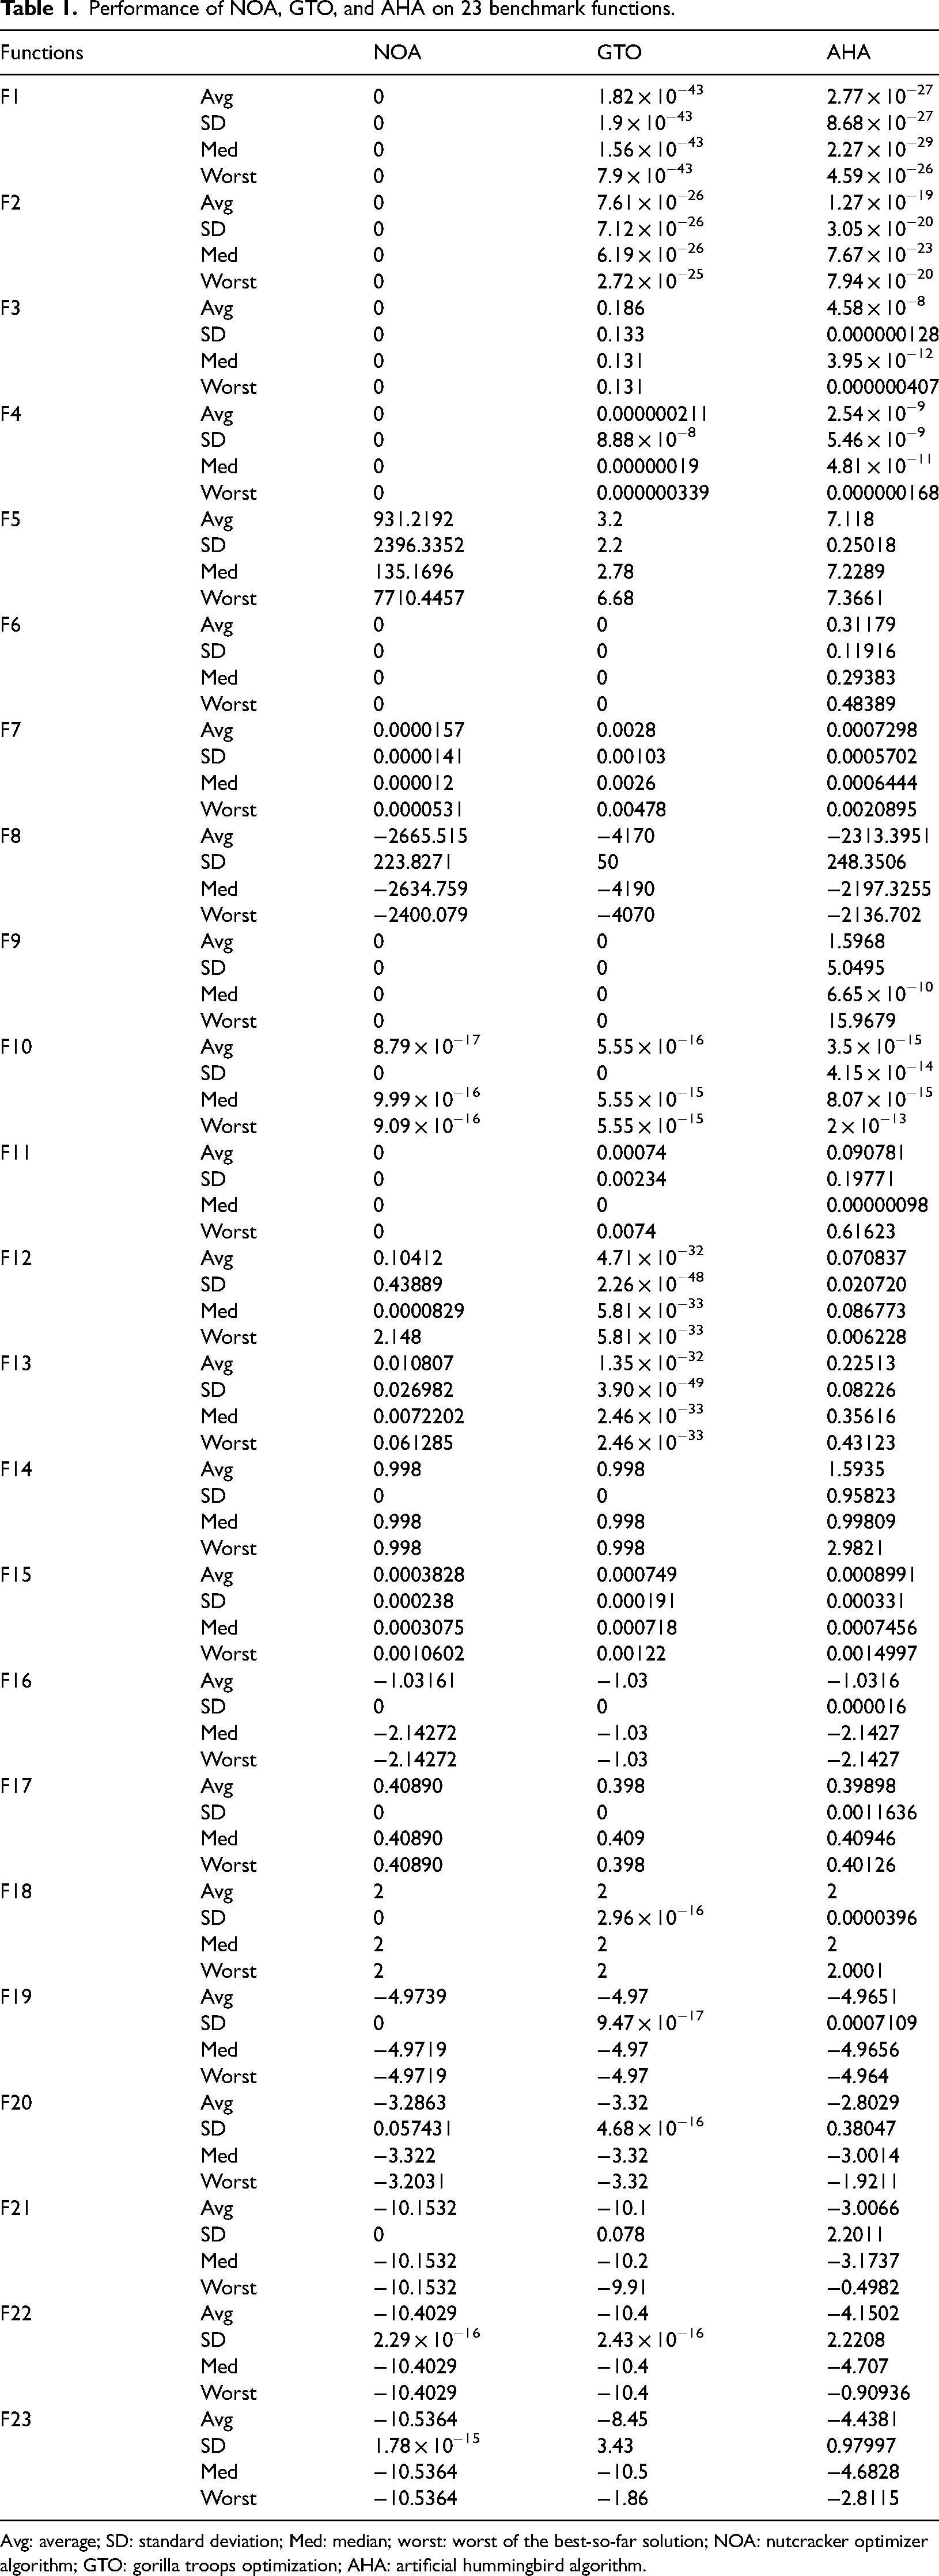
Avg: average; SD: standard deviation; Med: median; worst: worst of the best-so-far solution; NOA: nutcracker optimizer algorithm; GTO: gorilla troops optimization; AHA: artificial hummingbird algorithm.
Computational complexity of NOA
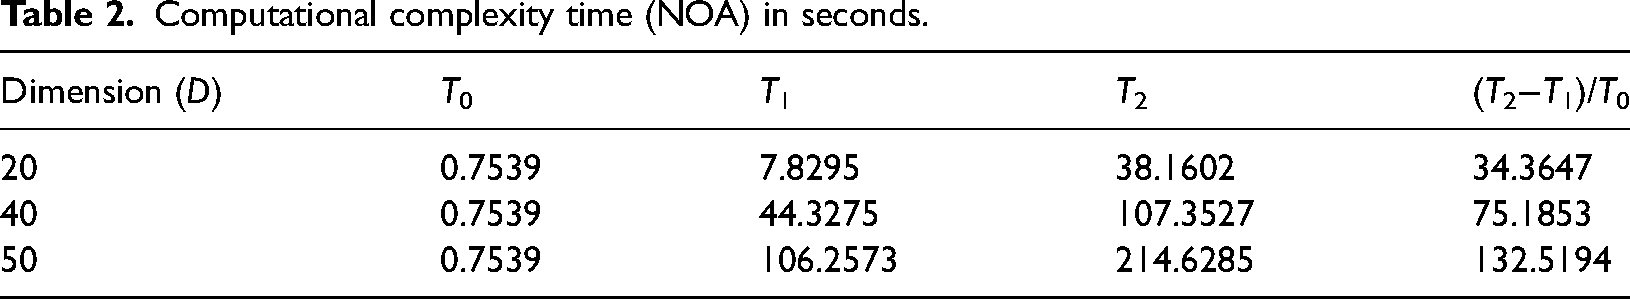
The evaluation of algorithm complexity in dimensions 20, 40, and 50 is conducted according to the guidelines outlined by Liang et al. (2013) and the results are illustrated in Table 2. The runtime is determined through the assessment of the CEC 2014 benchmark function FCEC18. The determination of T0 is accomplished resulting in a computed execution time of T0 = 0.7539 s. T1 signifies the duration required for executing 2.00 × 10⁵ evaluations of the benchmark function FCEC18 individually across dimensions of 20, 40, and 50. Meanwhile, T2 denotes the time taken for executing an algorithm encompassing 2.00 × 10⁵ evaluations of FCEC18 in 20, 40, and 50 dimensions.
Computational complexity time (NOA) in seconds.
Results
The proposed NOA is tested on three different power systems: the modified IEEE 30-bus (Sharma et al., 2018) and IEEE 118-bus test systems (Dash and Mohanty, 2015). The necessary data for these systems is obtained from Paul (2022b) and Paul et al. (2022). In addition to applying the NOA to solve the CM problem, the same problem has also been solved with other recent well-known optimization techniques such as gorilla troops optimization (GTO), and artificial hummingbird algorithm (AHA). These techniques are applied in the same environment, enabling a fair comparison among different optimization methods for solving the CM problem.
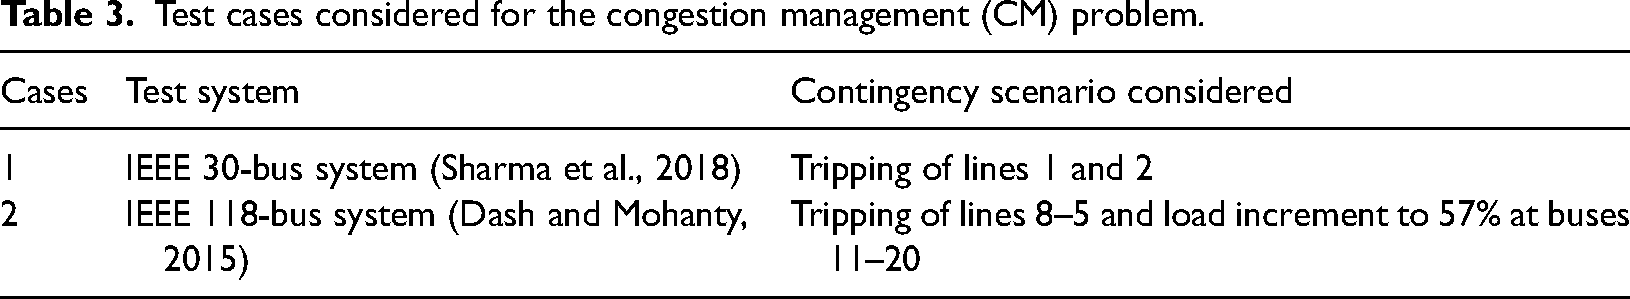
The software used in this study is MATLAB 2016a and implemented on a system with an Intel Core i7 processor running at a clock speed of 2.4 GHz and equipped with 8 GB of RAM. Table 3 provides specific information about the simulated cases conducted on the test systems. In this research, line overloads have been created considering two cases, firstly, by decreasing the power flow capacity of the capacity of the lines, and secondly, by simulating line outage(s) for contingency purposes.
Test cases considered for the congestion management (CM) problem.
To find the optimal parameter values, multiple trial runs have been conducted for solving the CM problem on all three test systems under study. The best results obtained from these trials are presented. Through these trial runs, the population size of 40 has been considered to be sufficient for the CM problem in this particular study.
IEEE 30-bus system
The modified IEEE 30-bus test system has been considered for the evaluation of the CM problem. It consists of 41 transmission channels with six generator buses and 24 load buses. The configuration of this system is depicted in Figure 2. The test case that has been considered for the IEEE 30-bus system is listed in Table 3. The details of the congested power flow scenario are given in Table 4.
Line power flow details for the congested line.
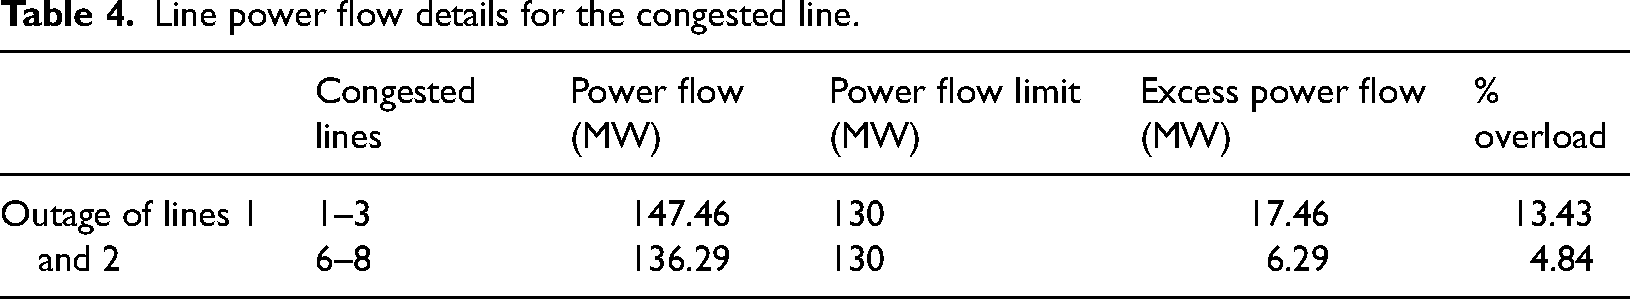
In this case, the congestion has been created by an outage of line 1, between buses 1 and 2 (Figure 3). This leads to congestion in line 2 (connecting buses 1 and 3) and line 4 (connecting buses 6 and 8) and is represented in Table 4. To ensure secure functioning, counteractive measures are necessary to relieve these overloaded lines. The NOA has been employed to minimize the congestion cost, with the optimal generator output. The congestion costs obtained using the NOA are presented in Table 5. These values are then compared with results from literature, such as PSO (Kamaraj, 2011), RSM (Kamaraj, 2011), SA (Kamaraj, 2011), FPA (Verma and Mukherjee, 2016b), CBA (Verma and Mukherjee, 2016b), ALO (Verma and Mukherjee, 2016b), TLBO (Verma et al., 2018) as well as recent algorithms like GTO, AHA. The optimal total congestion cost obtained through the NOA-based approach is determined to be 476.84 $/h.
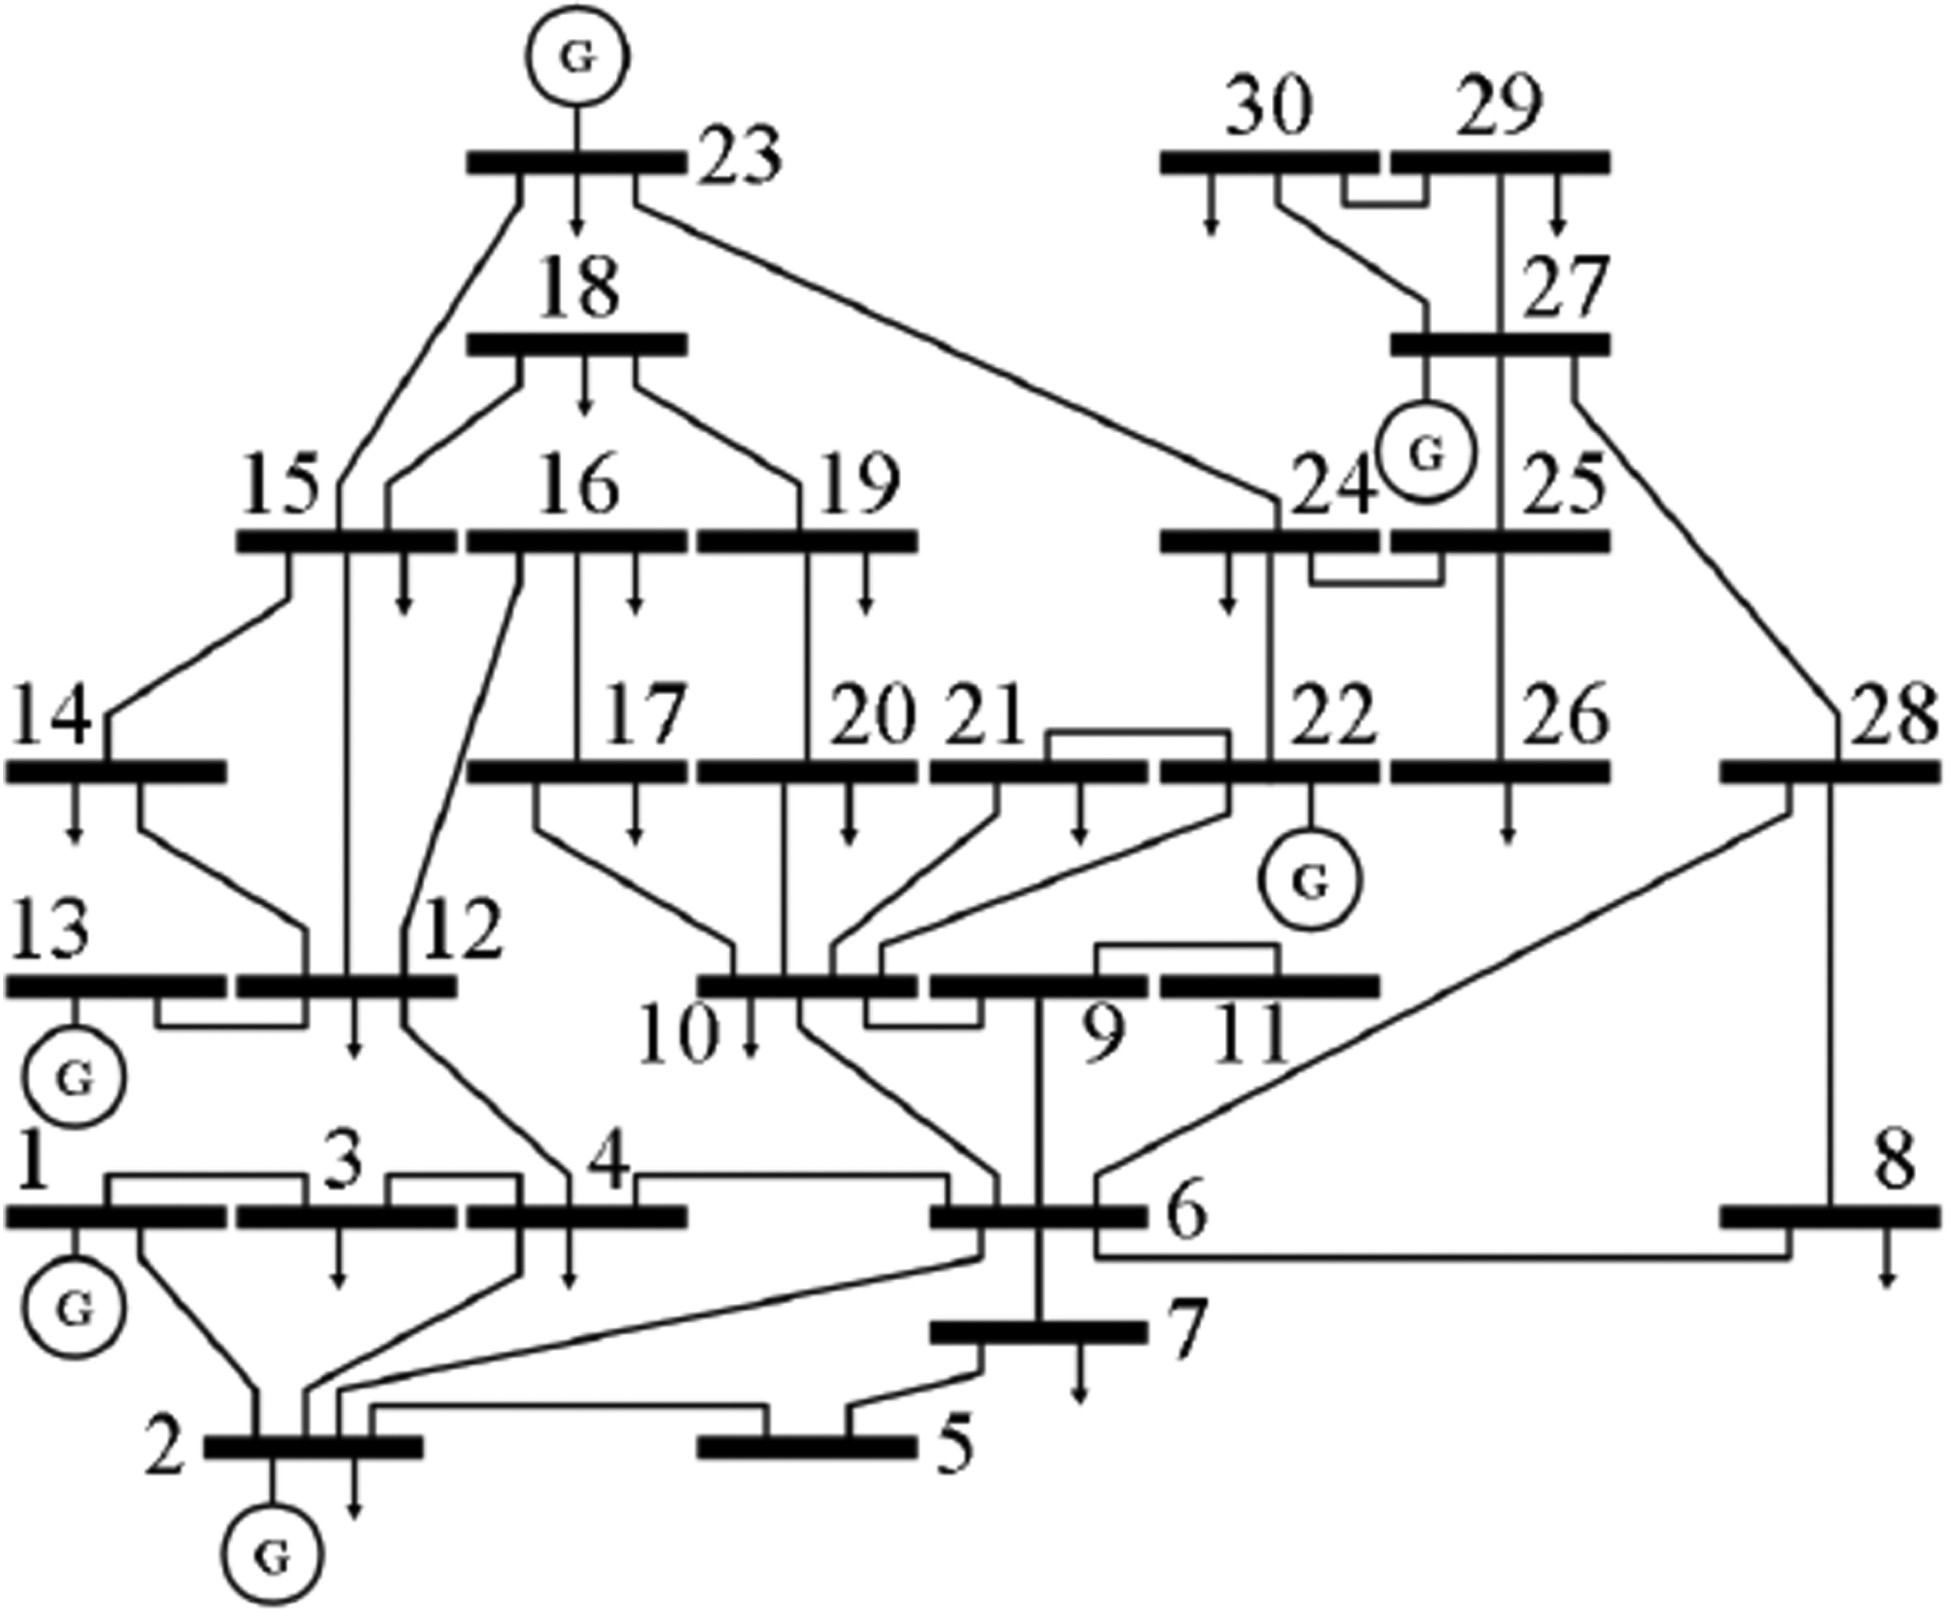
Single line representation of IEEE 30-bus system (Verma et al., 2018).
Comparative outcomes for IEEE 30 bus system with NOA.
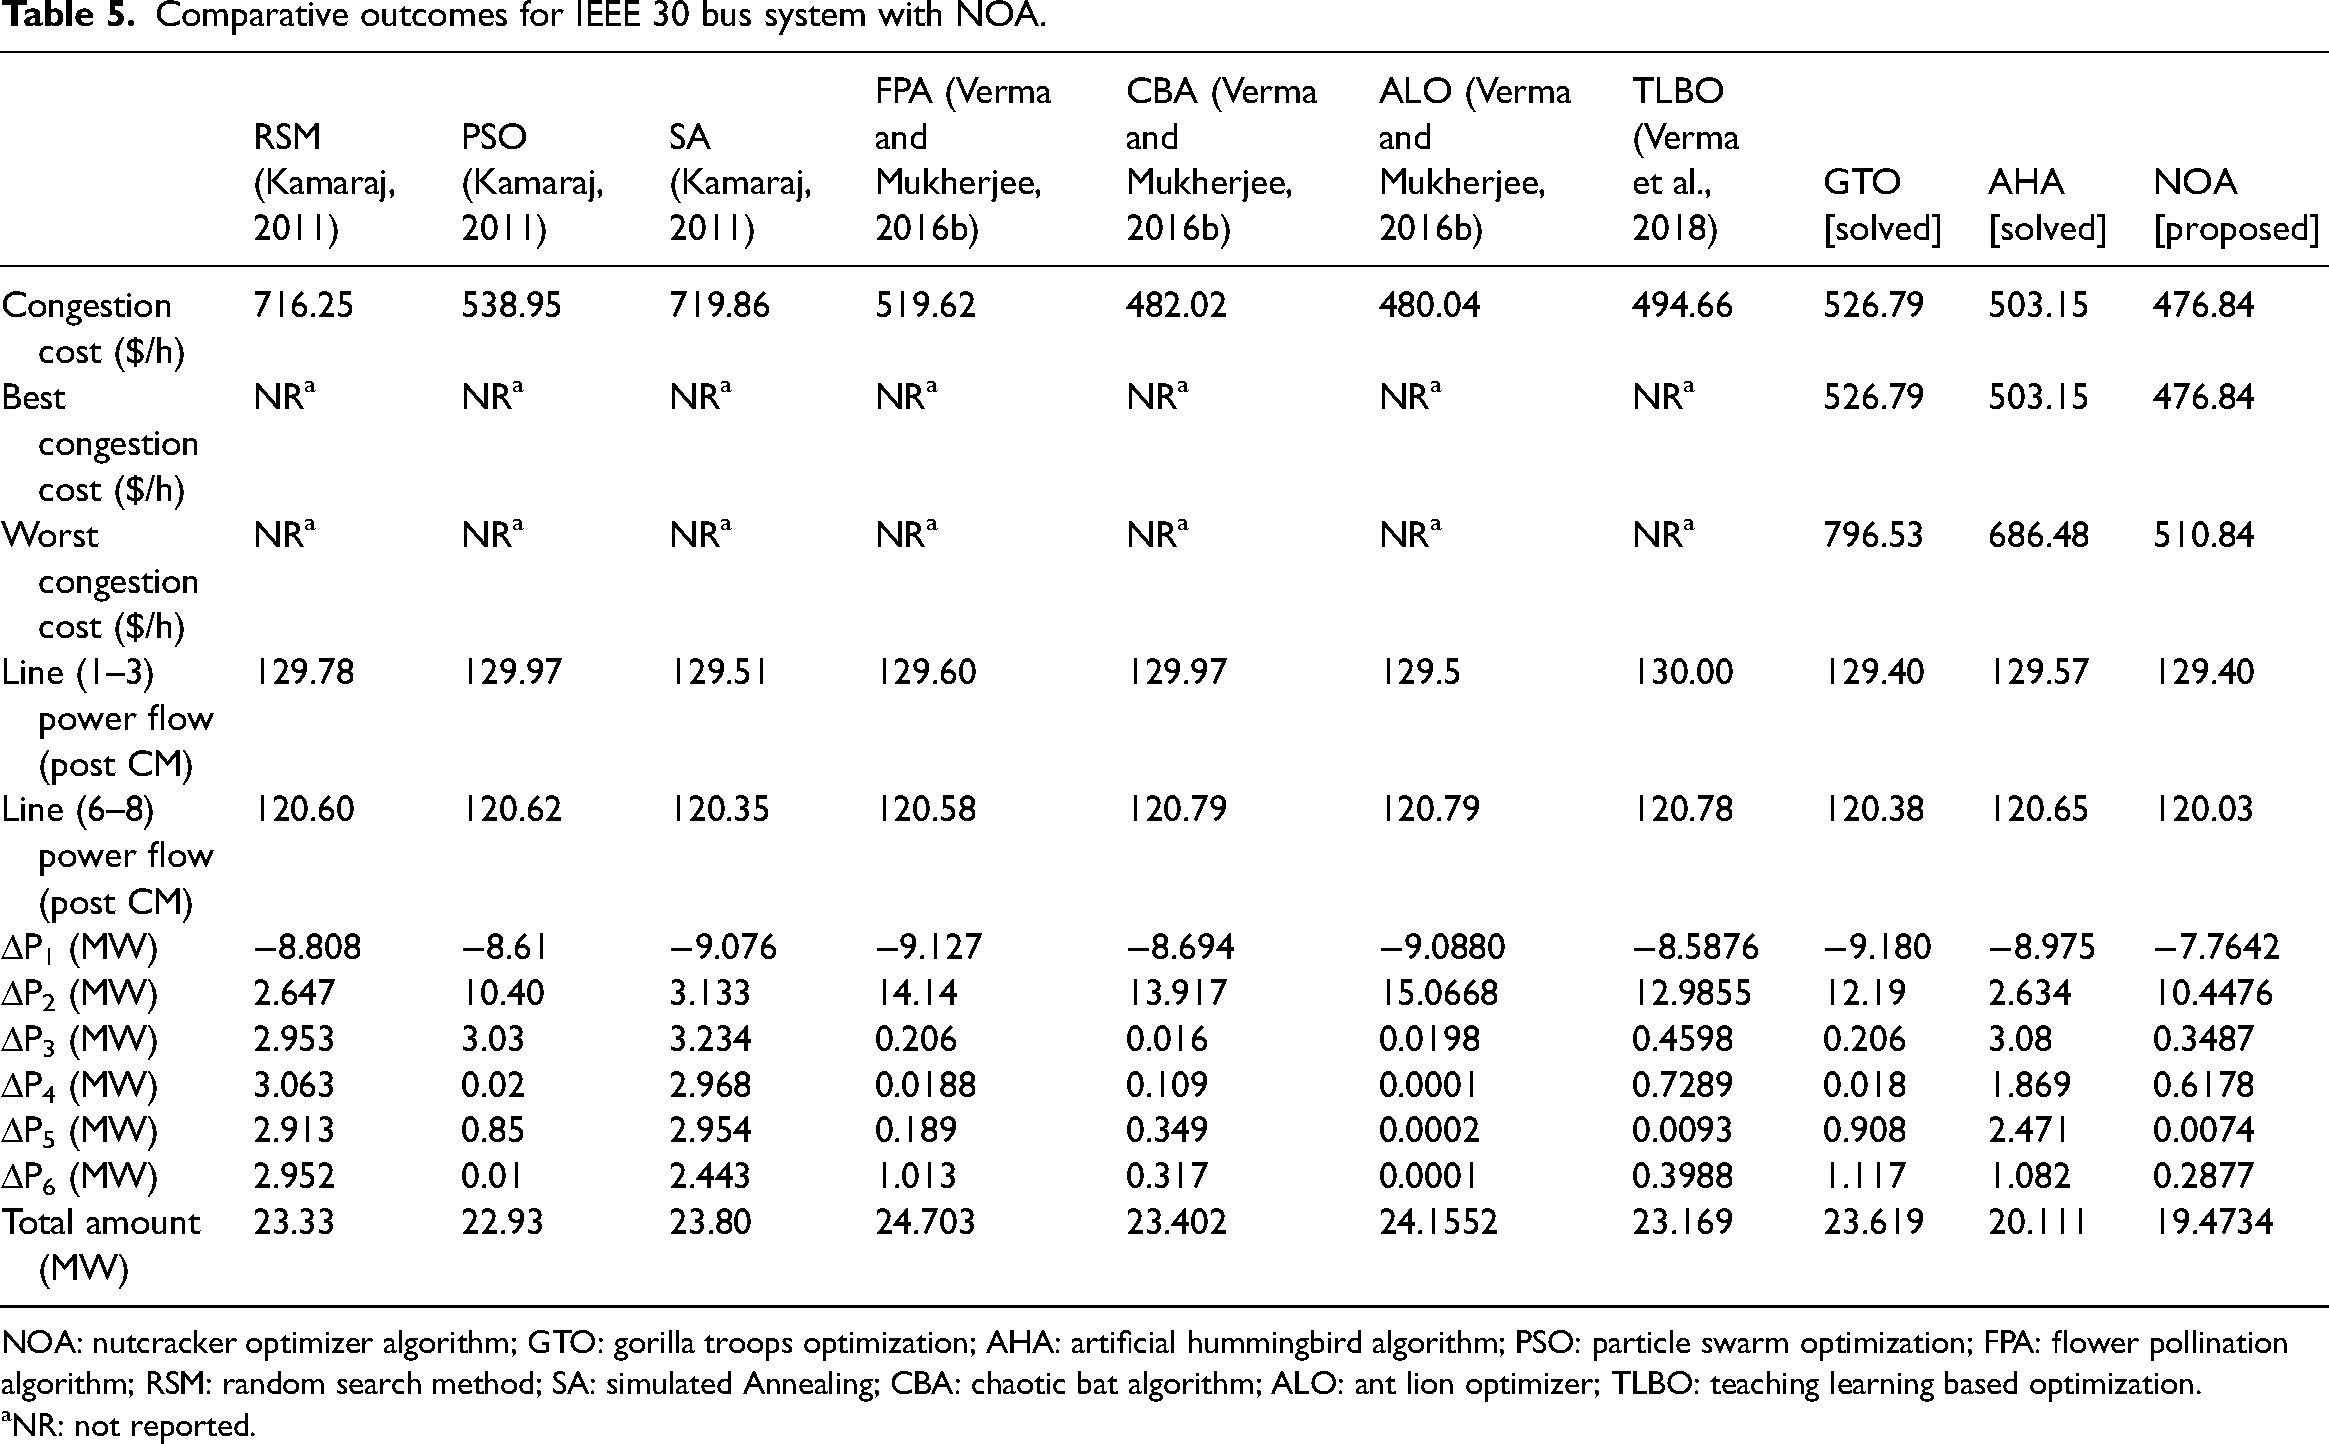
NOA: nutcracker optimizer algorithm; GTO: gorilla troops optimization; AHA: artificial hummingbird algorithm; PSO: particle swarm optimization; FPA: flower pollination algorithm; RSM: random search method; SA: simulated Annealing; CBA: chaotic bat algorithm; ALO: ant lion optimizer; TLBO: teaching learning based optimization.
NR: not reported.
Representation of the comparative congestion costs is depicted in Figure 4. Figure 5 illustrates the real power rescheduling for different generators achieved by the comparative algorithms. The convergence profiles of GTO, AHA, and NOA, are presented in Figure 6. The iterative values for 30 runs with 500 iterations and the box plot are given in Figures 7 and 8.
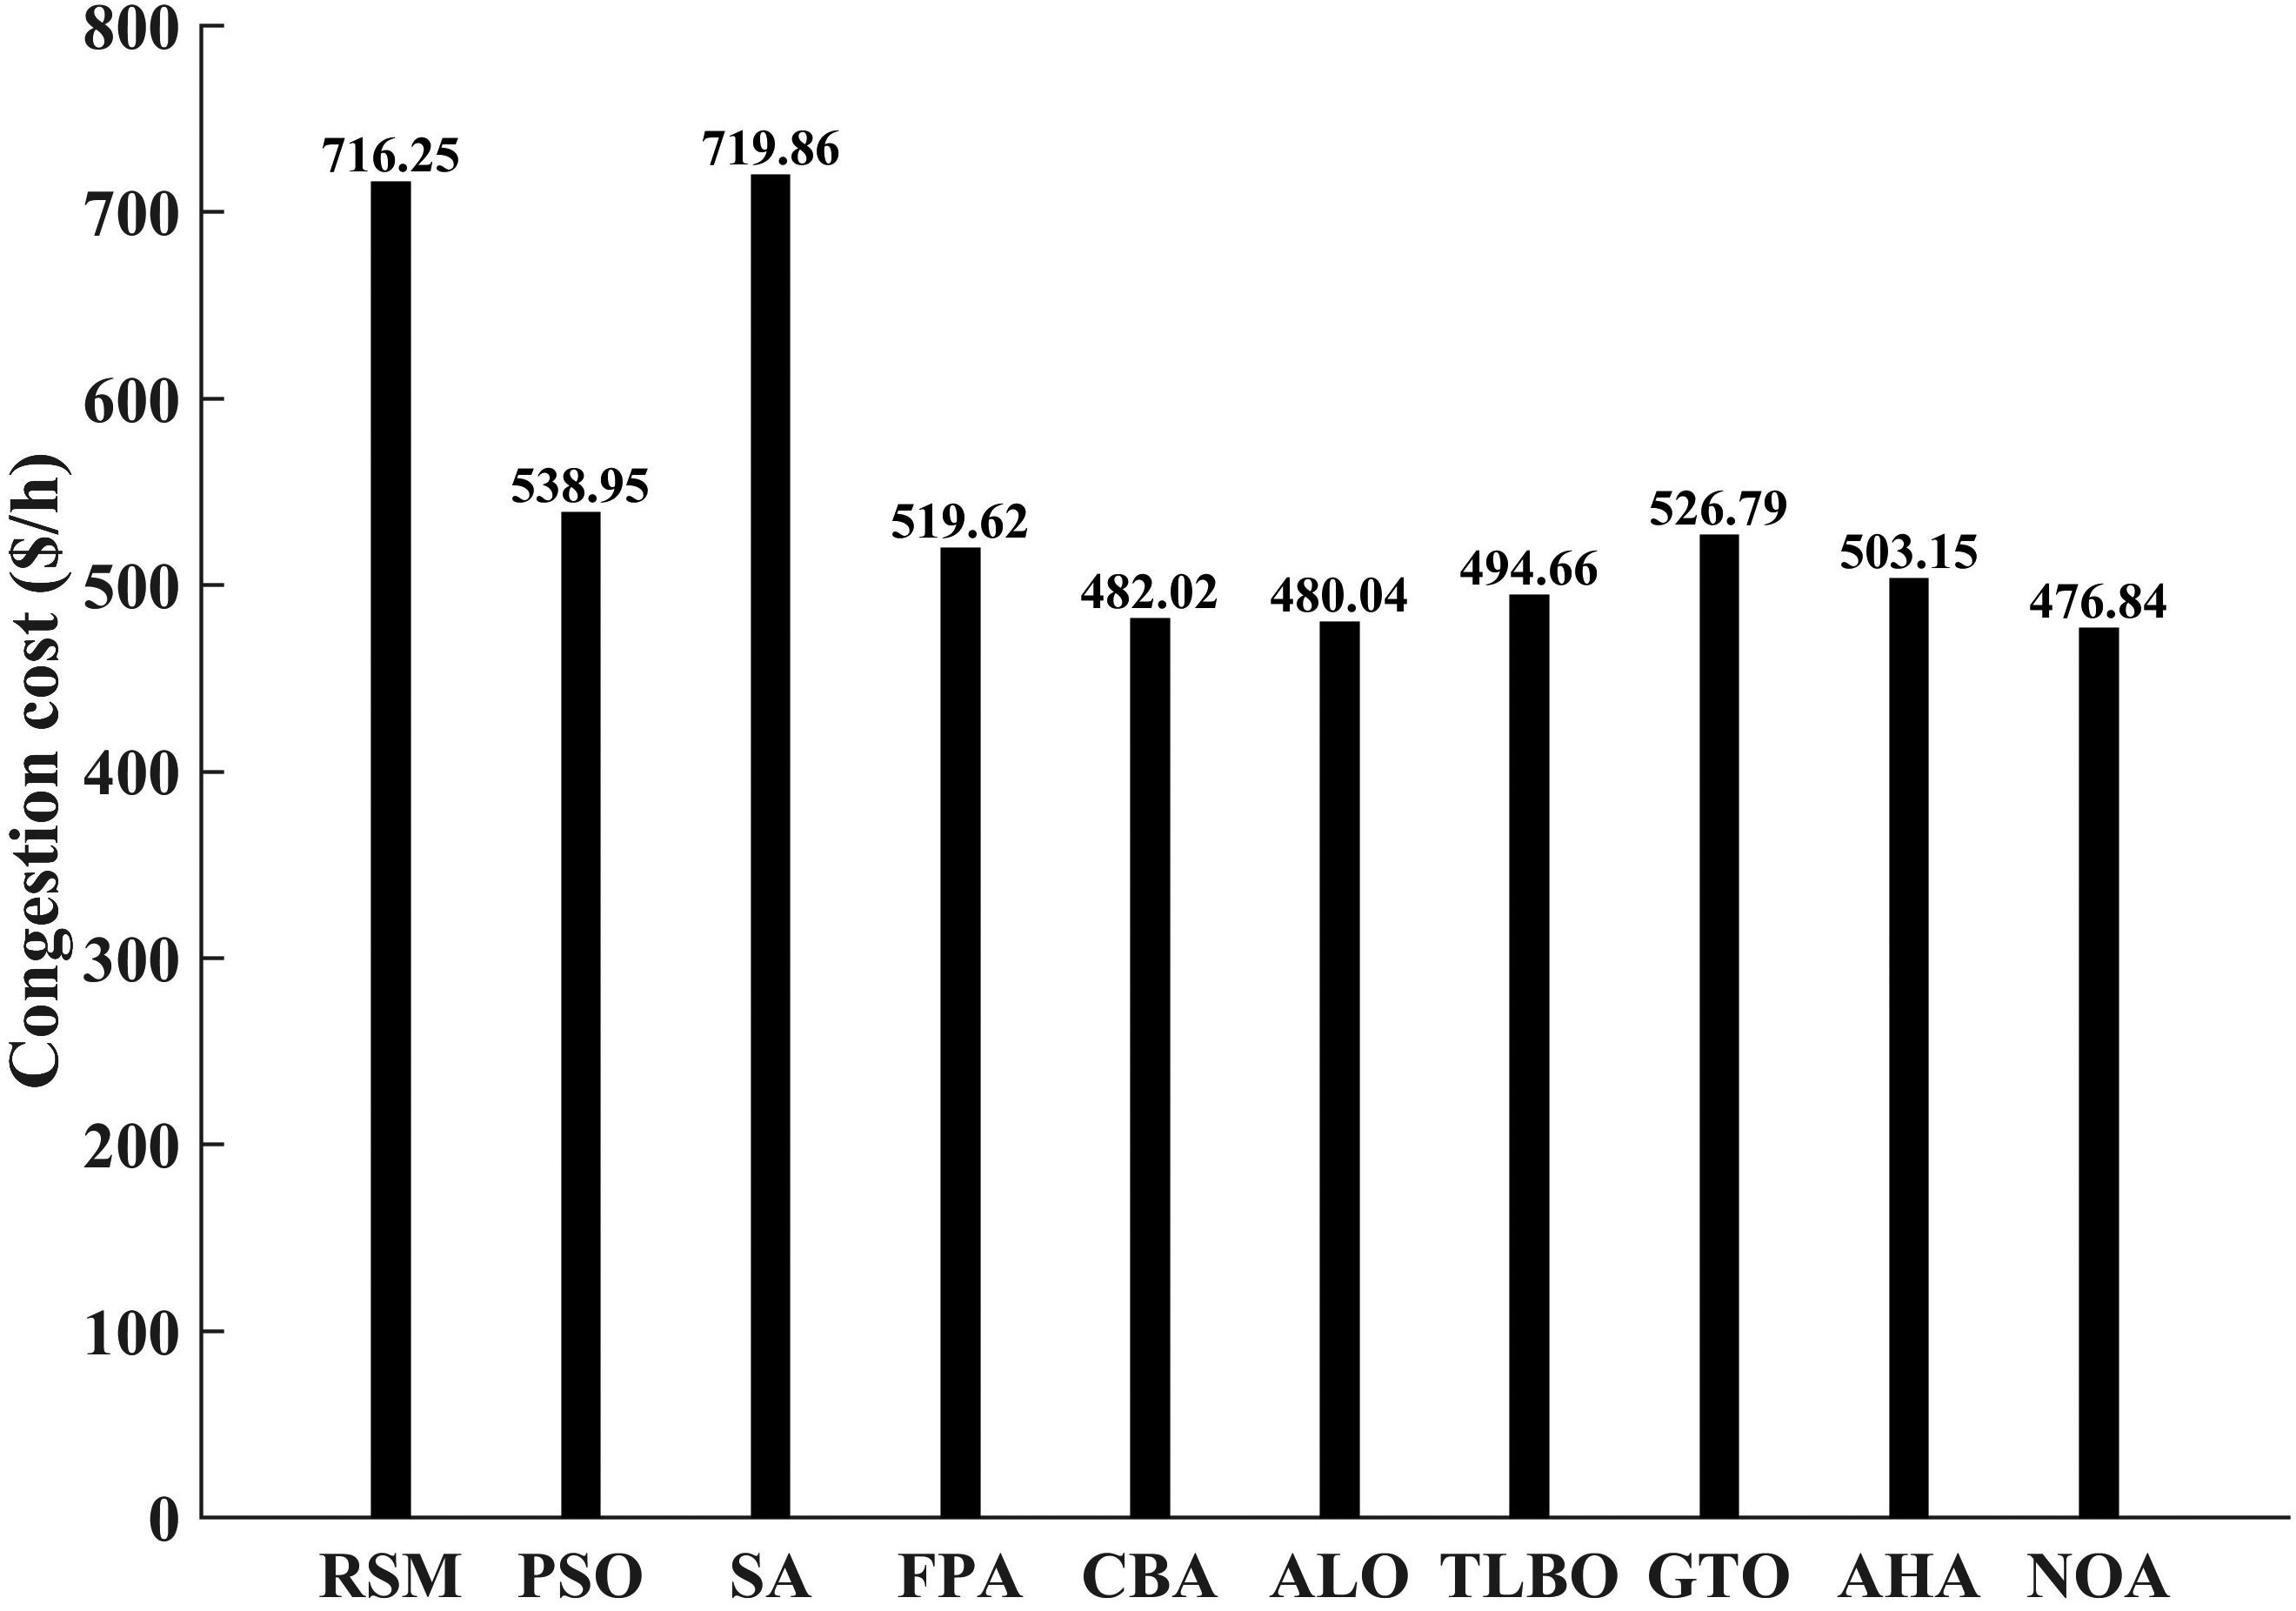
Comparative congestion cost with nutcracker optimizer algorithm (NOA) and other optimization algorithms.
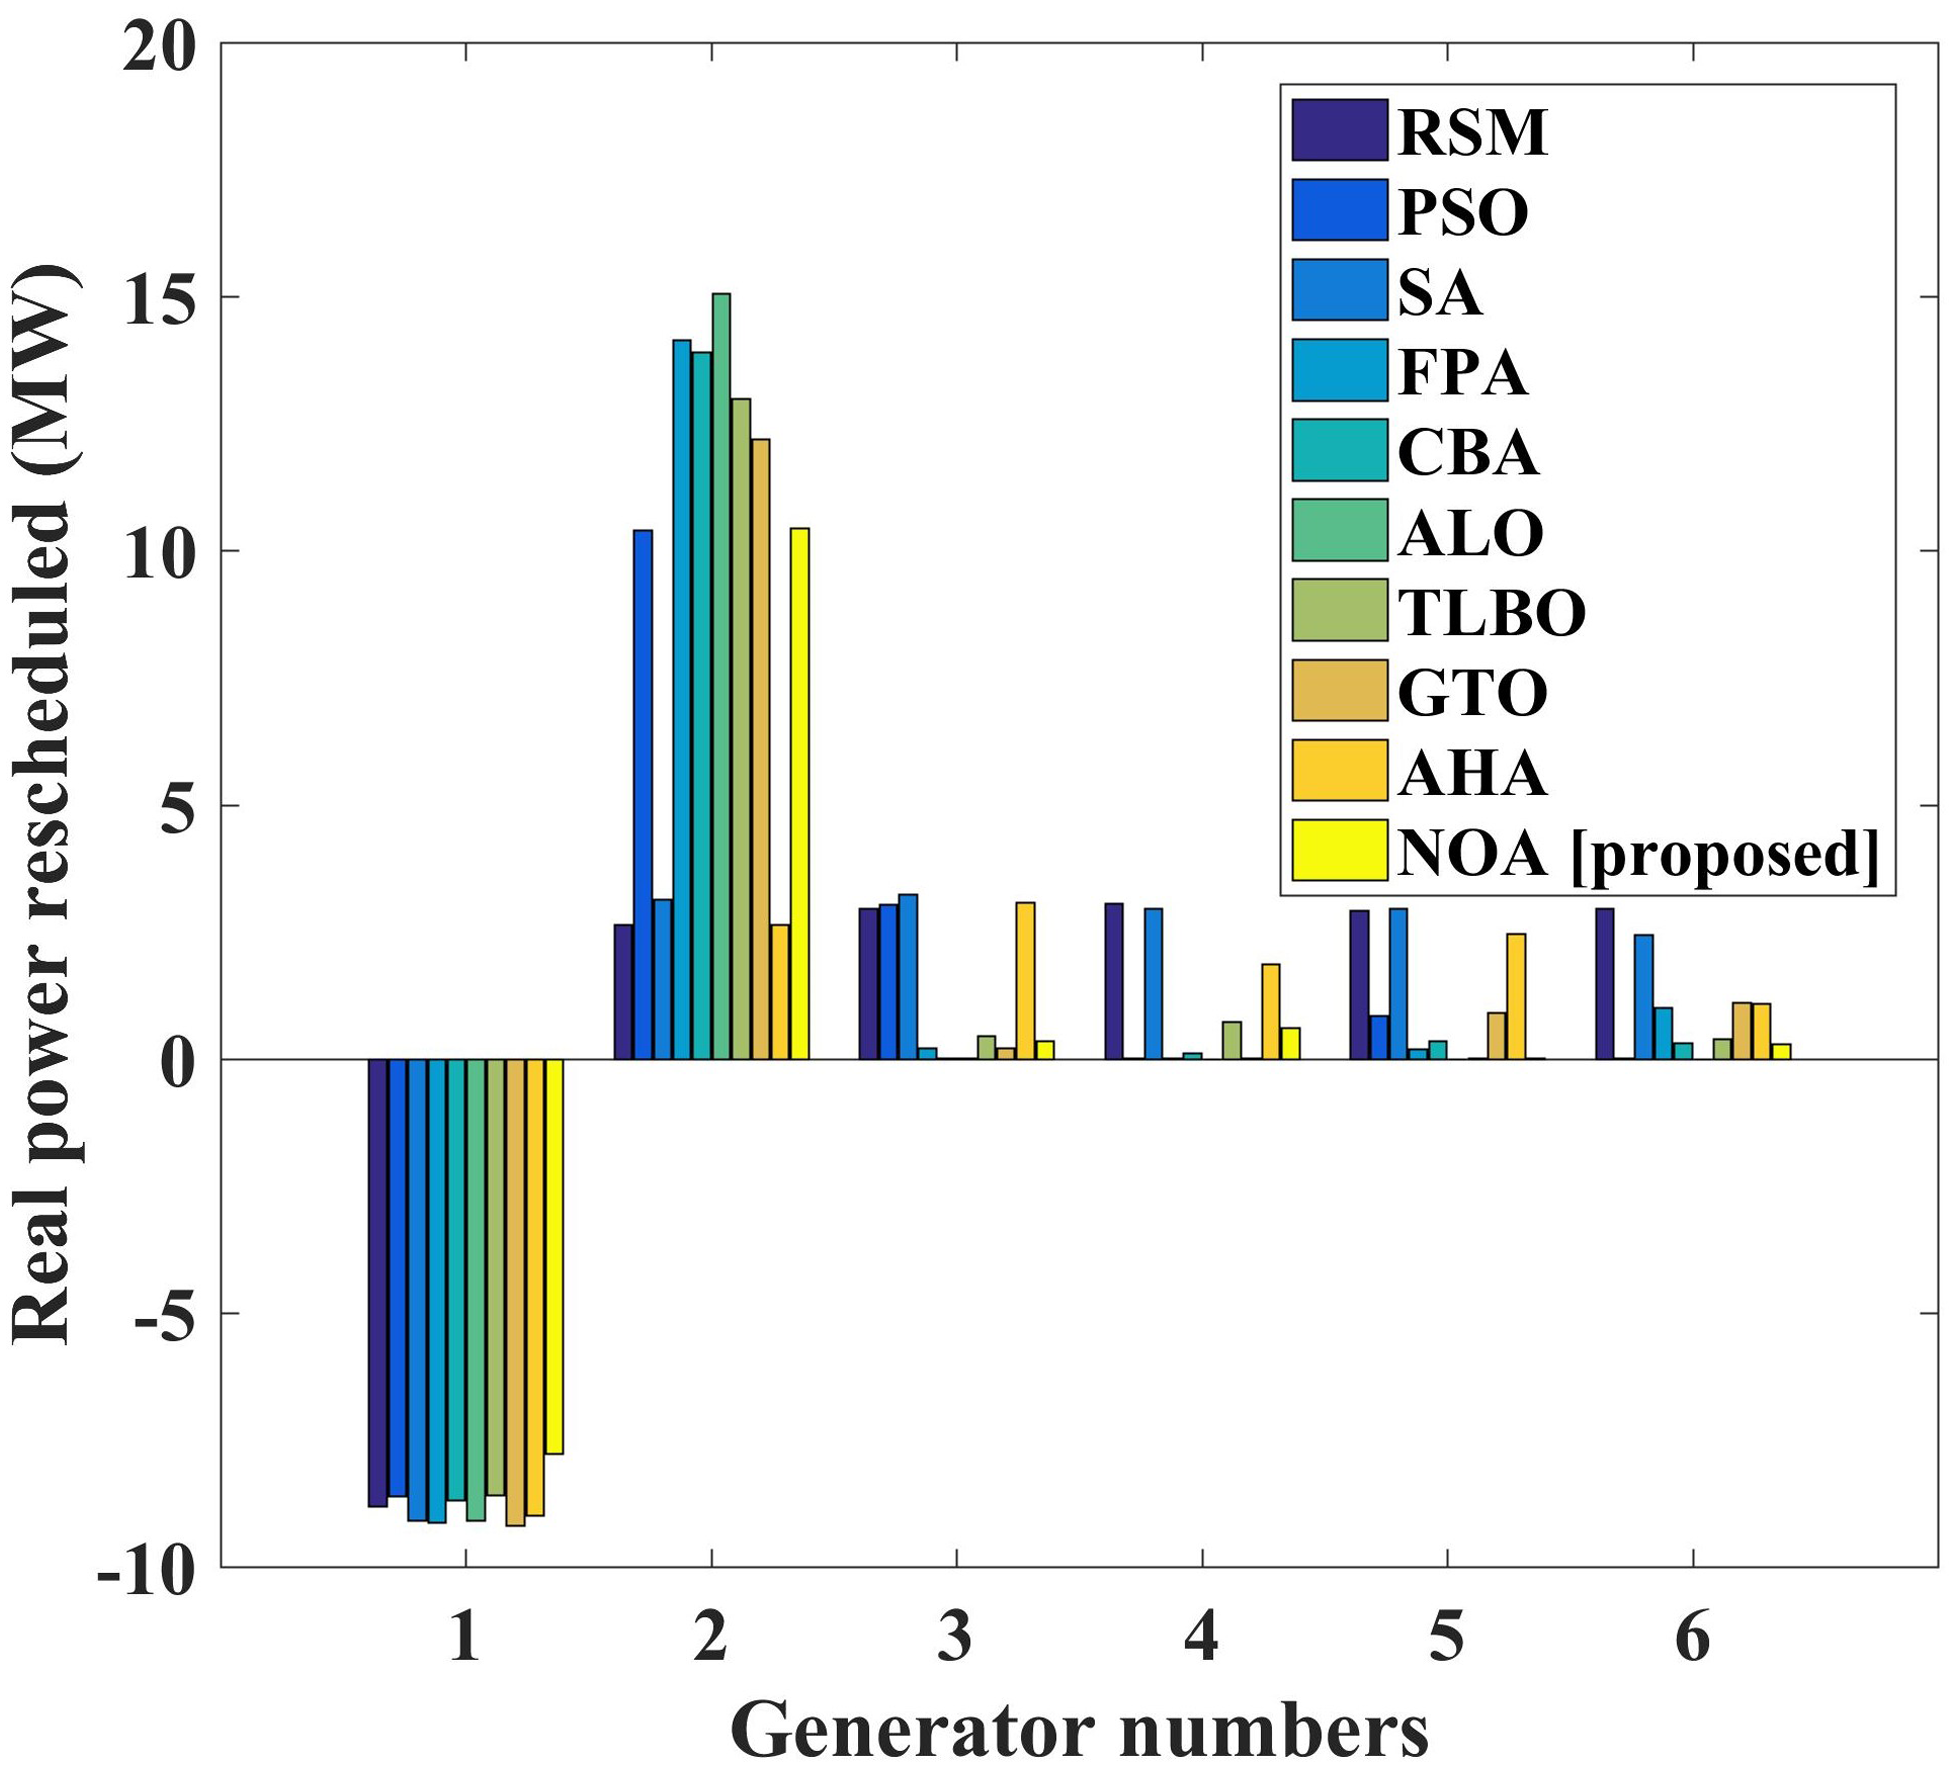
Comparative representation of the real power rescheduled with the optimization algorithms.
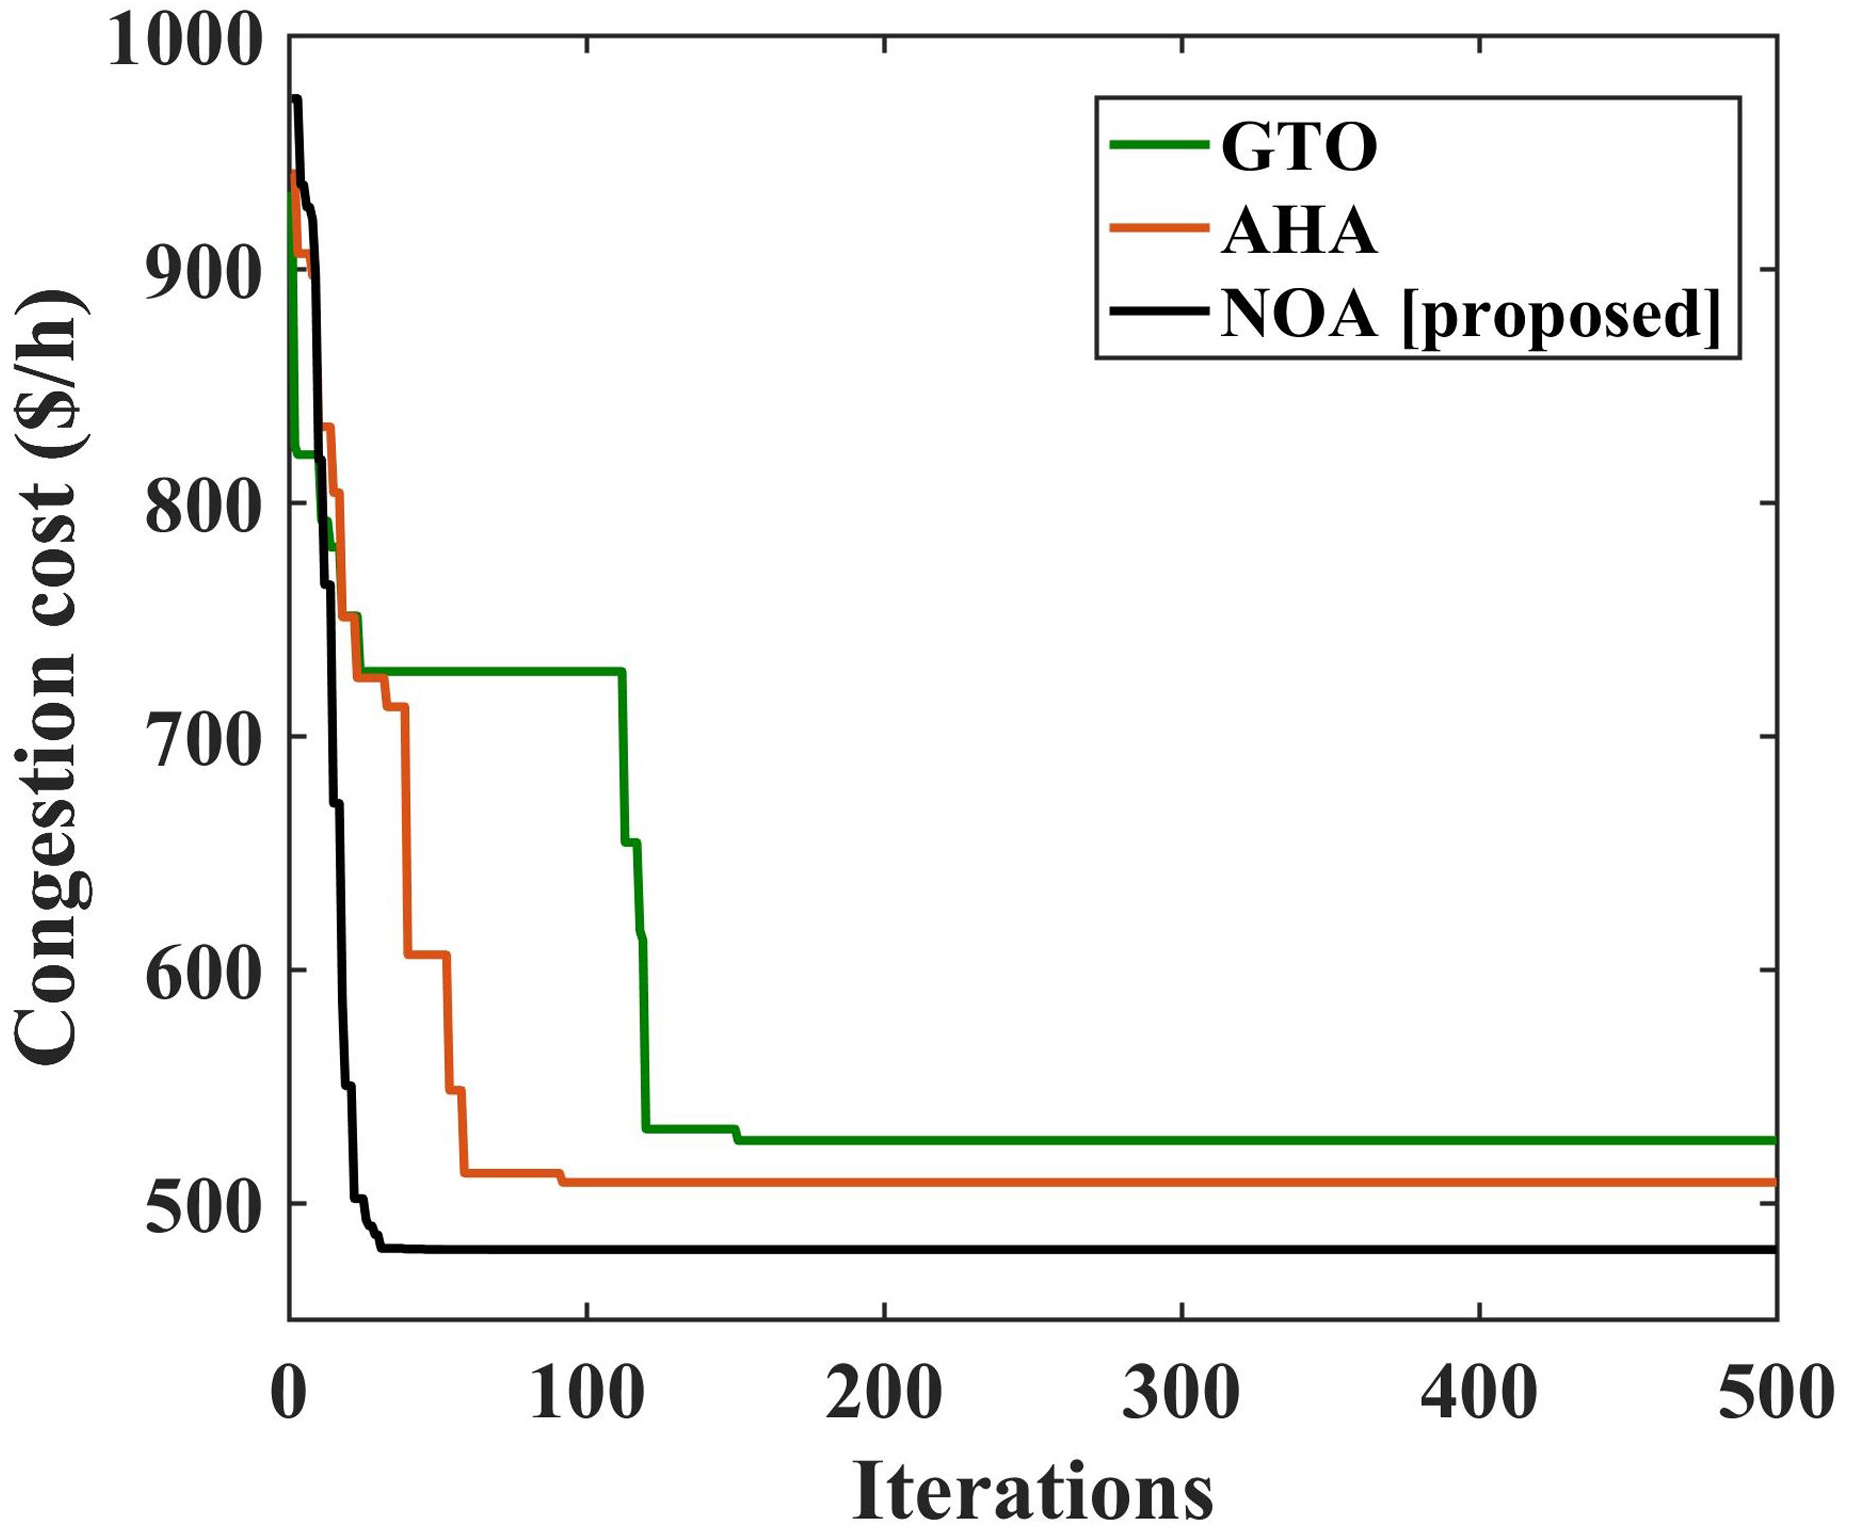
Convergence characteristics of nutcracker optimizer algorithm (NOA) and other optimization algorithms.
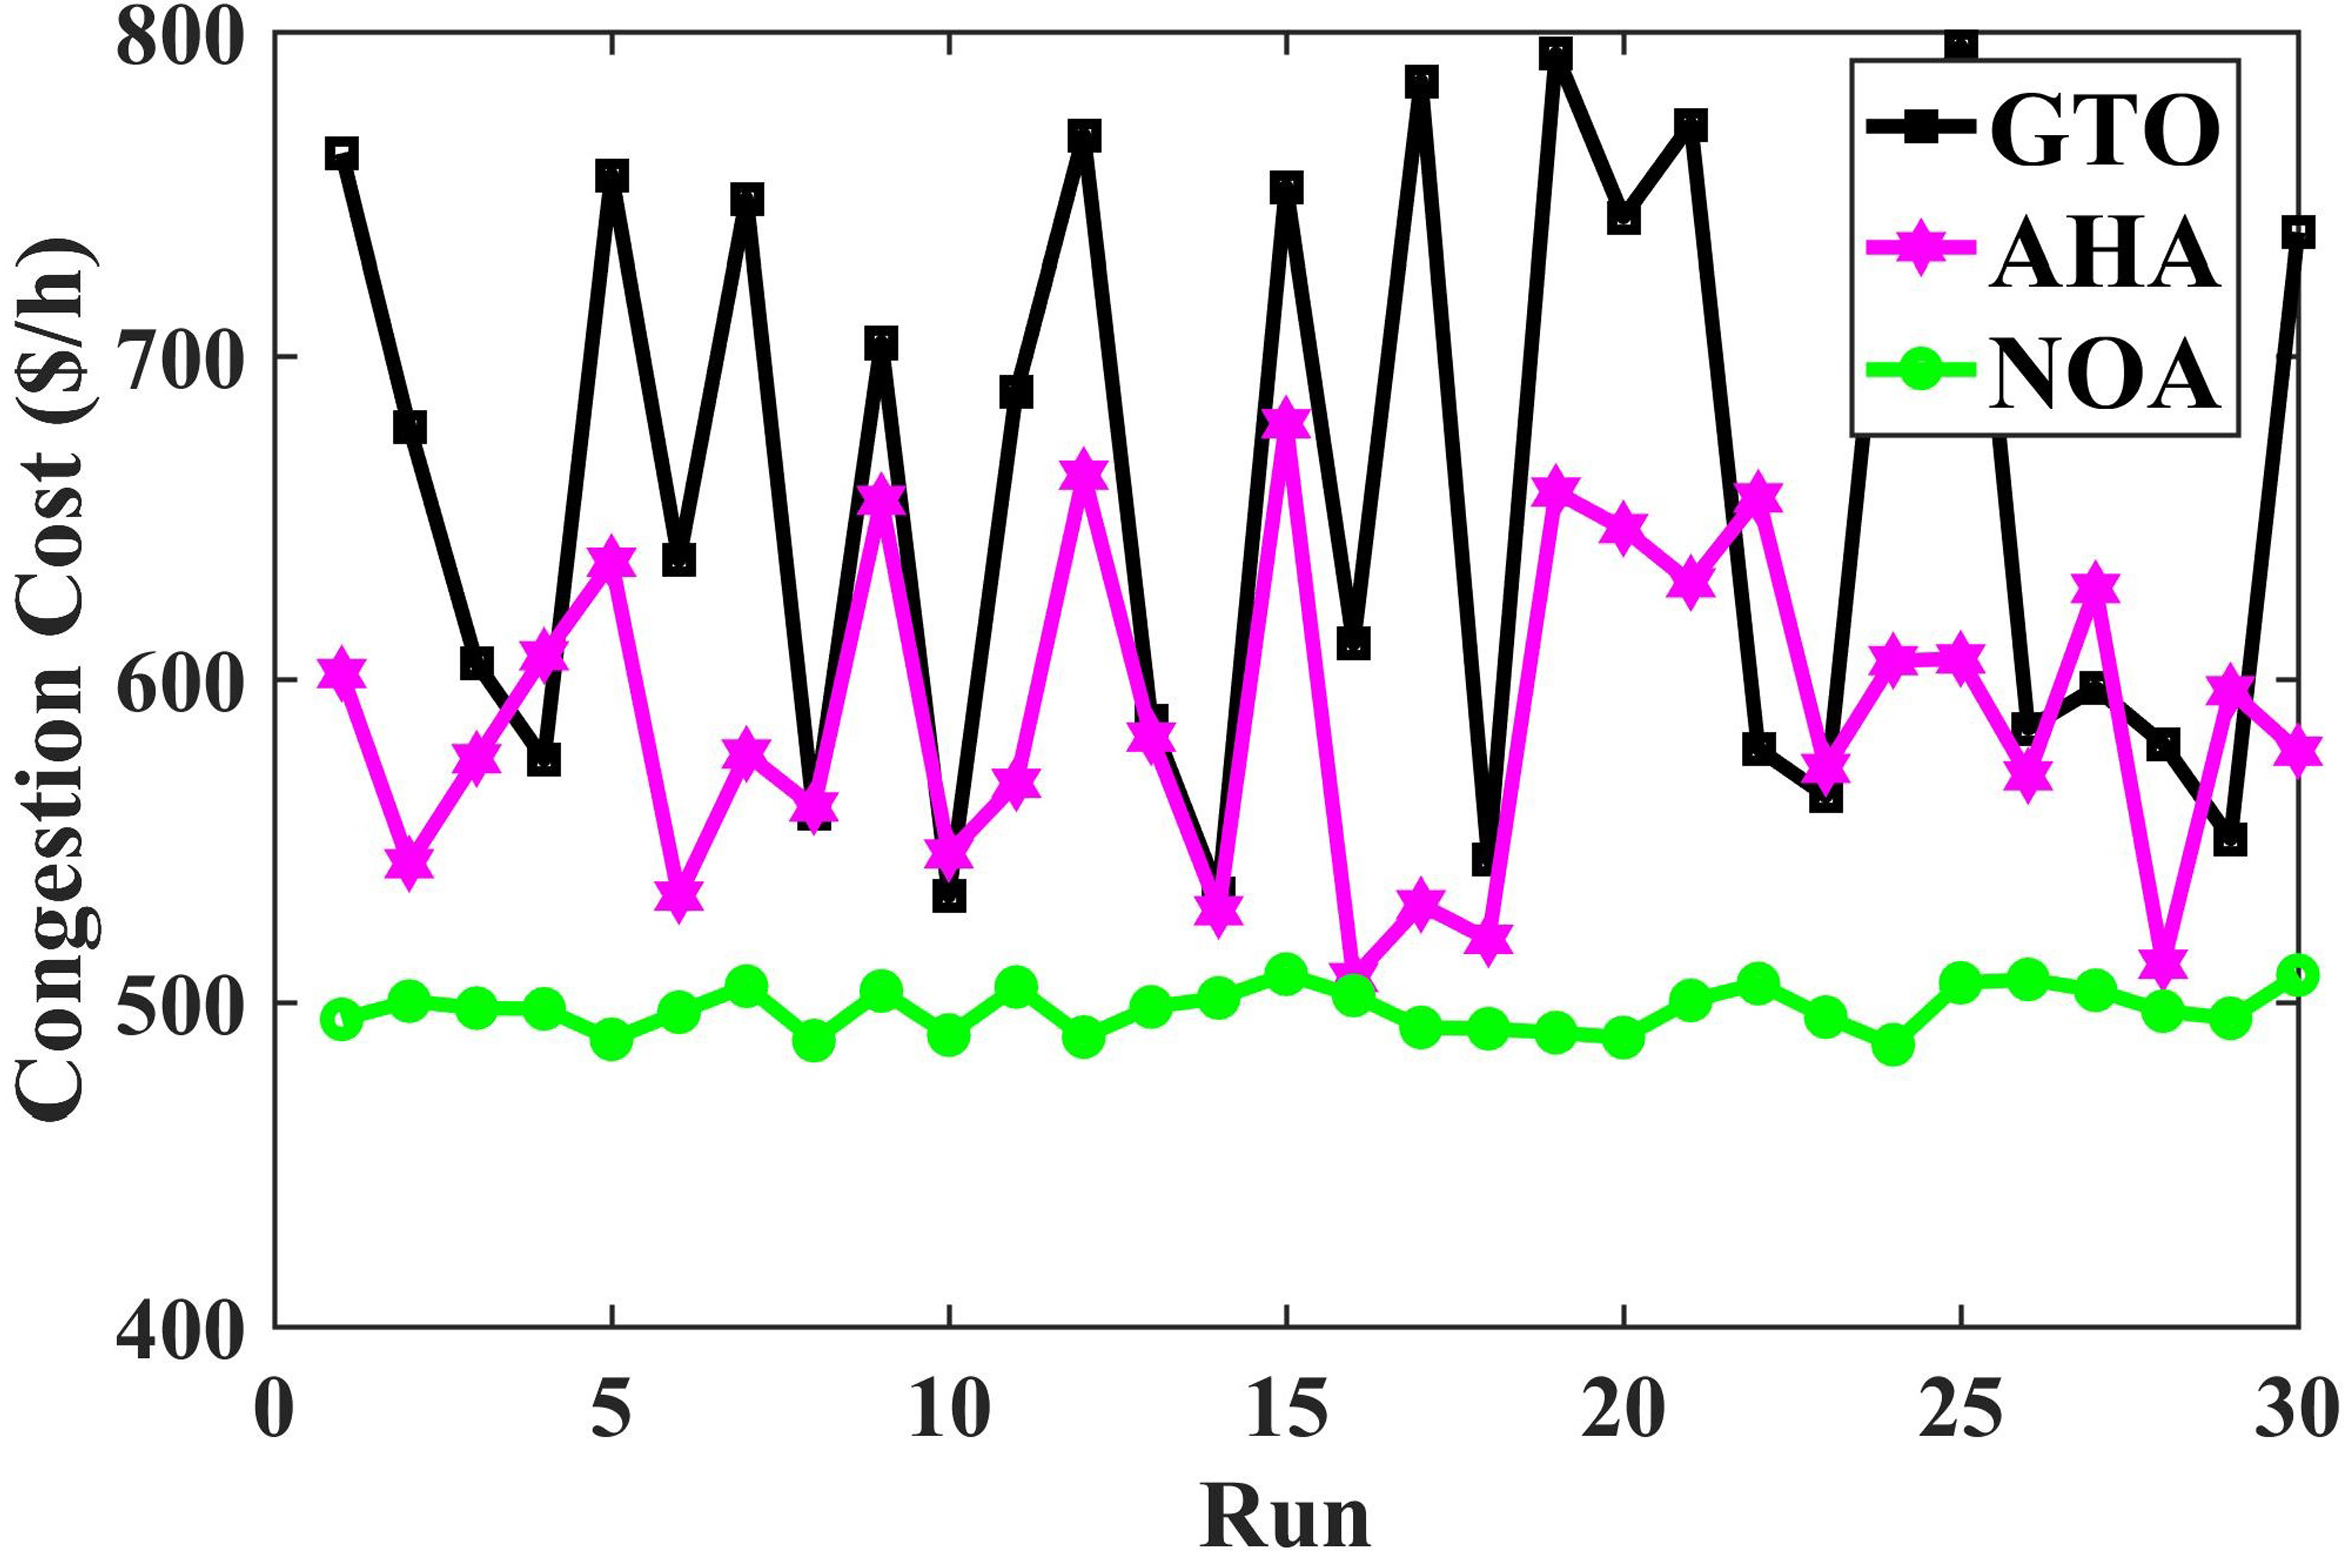
Fitness function values for 30 runs with 500 iterations (IEEE 30 bus).
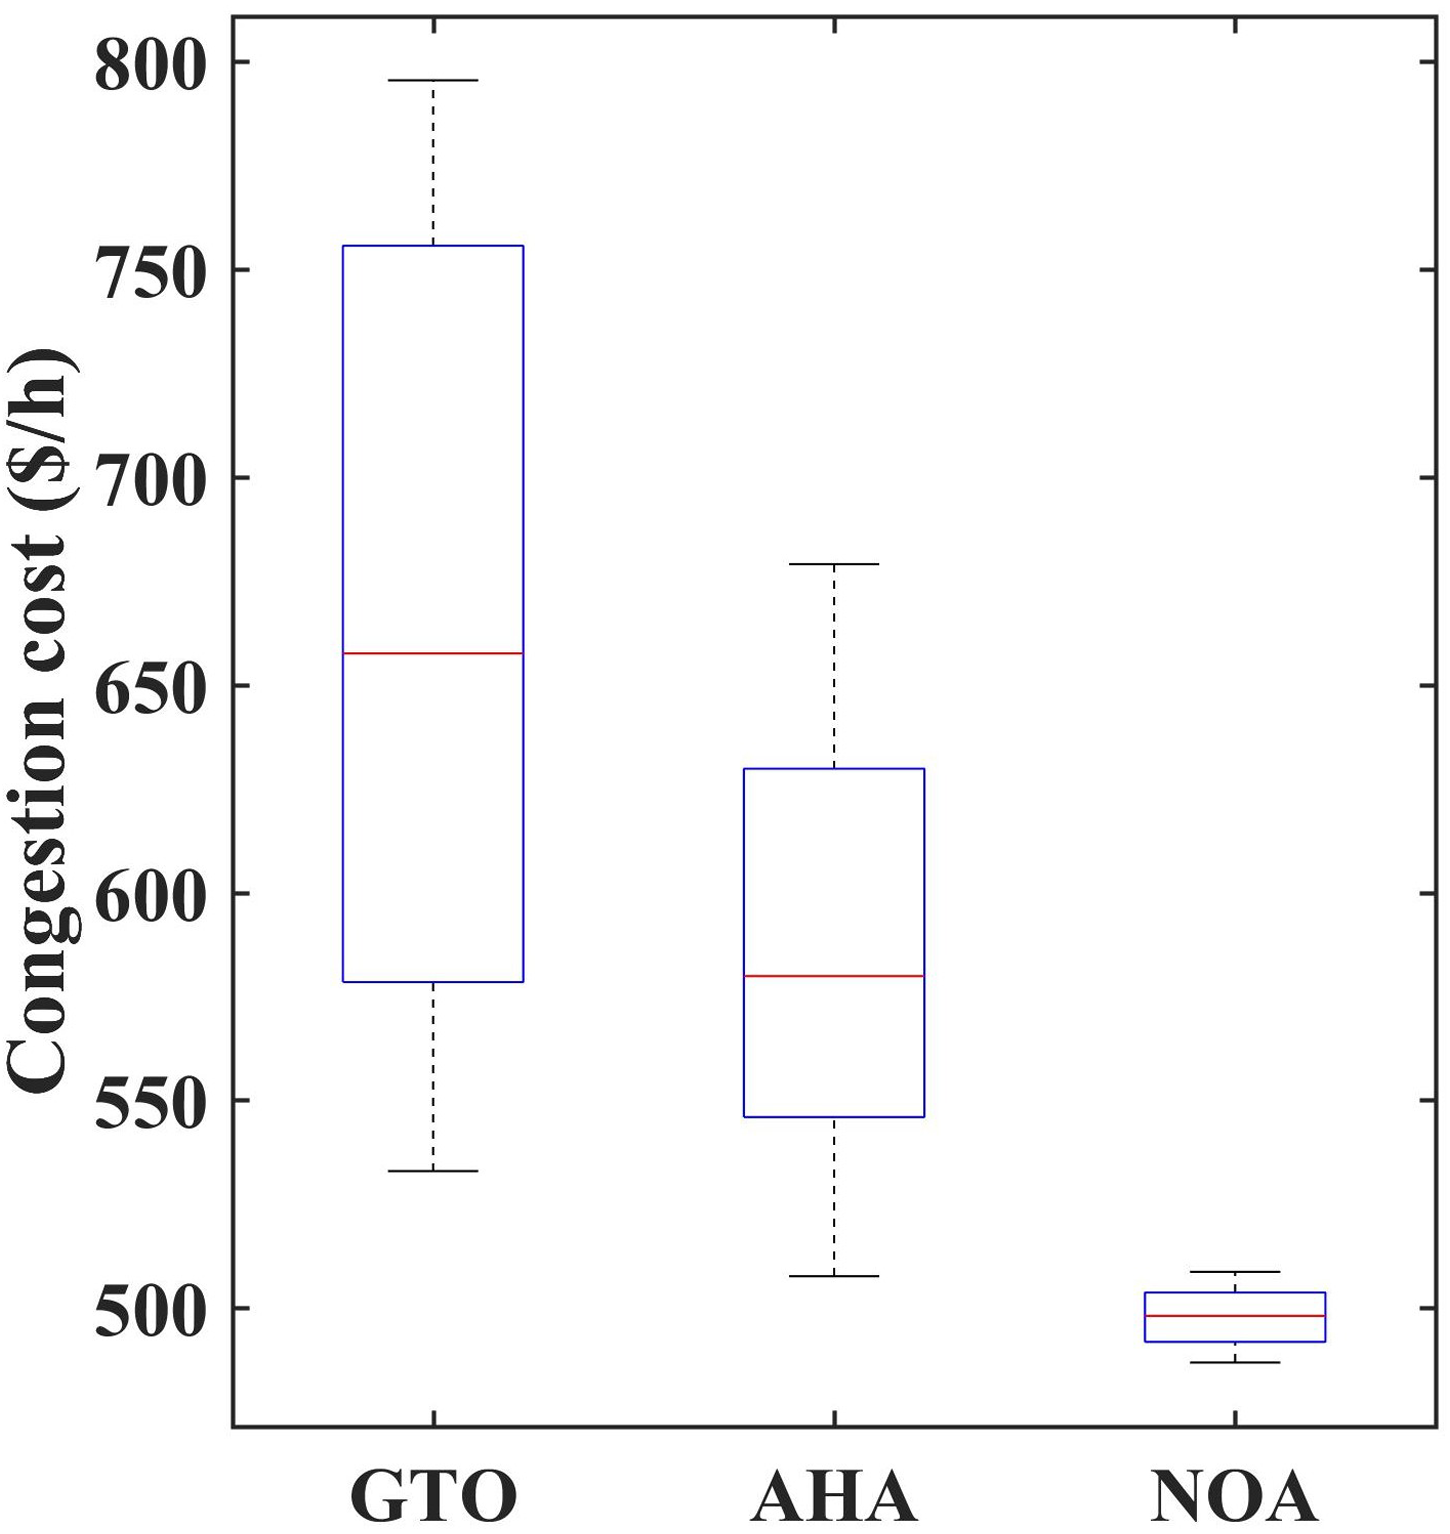
Box plot for 30 trail runs (IEEE 30 bus).
Additionally, the total system loss is reduced to 12.047 MW after CM, compared to the initial value of 16.023 MW during congestion. The bus voltages after CM using the NOA approach are shown in Figure 9, where it is evident that all bus voltages remain within acceptable limits.
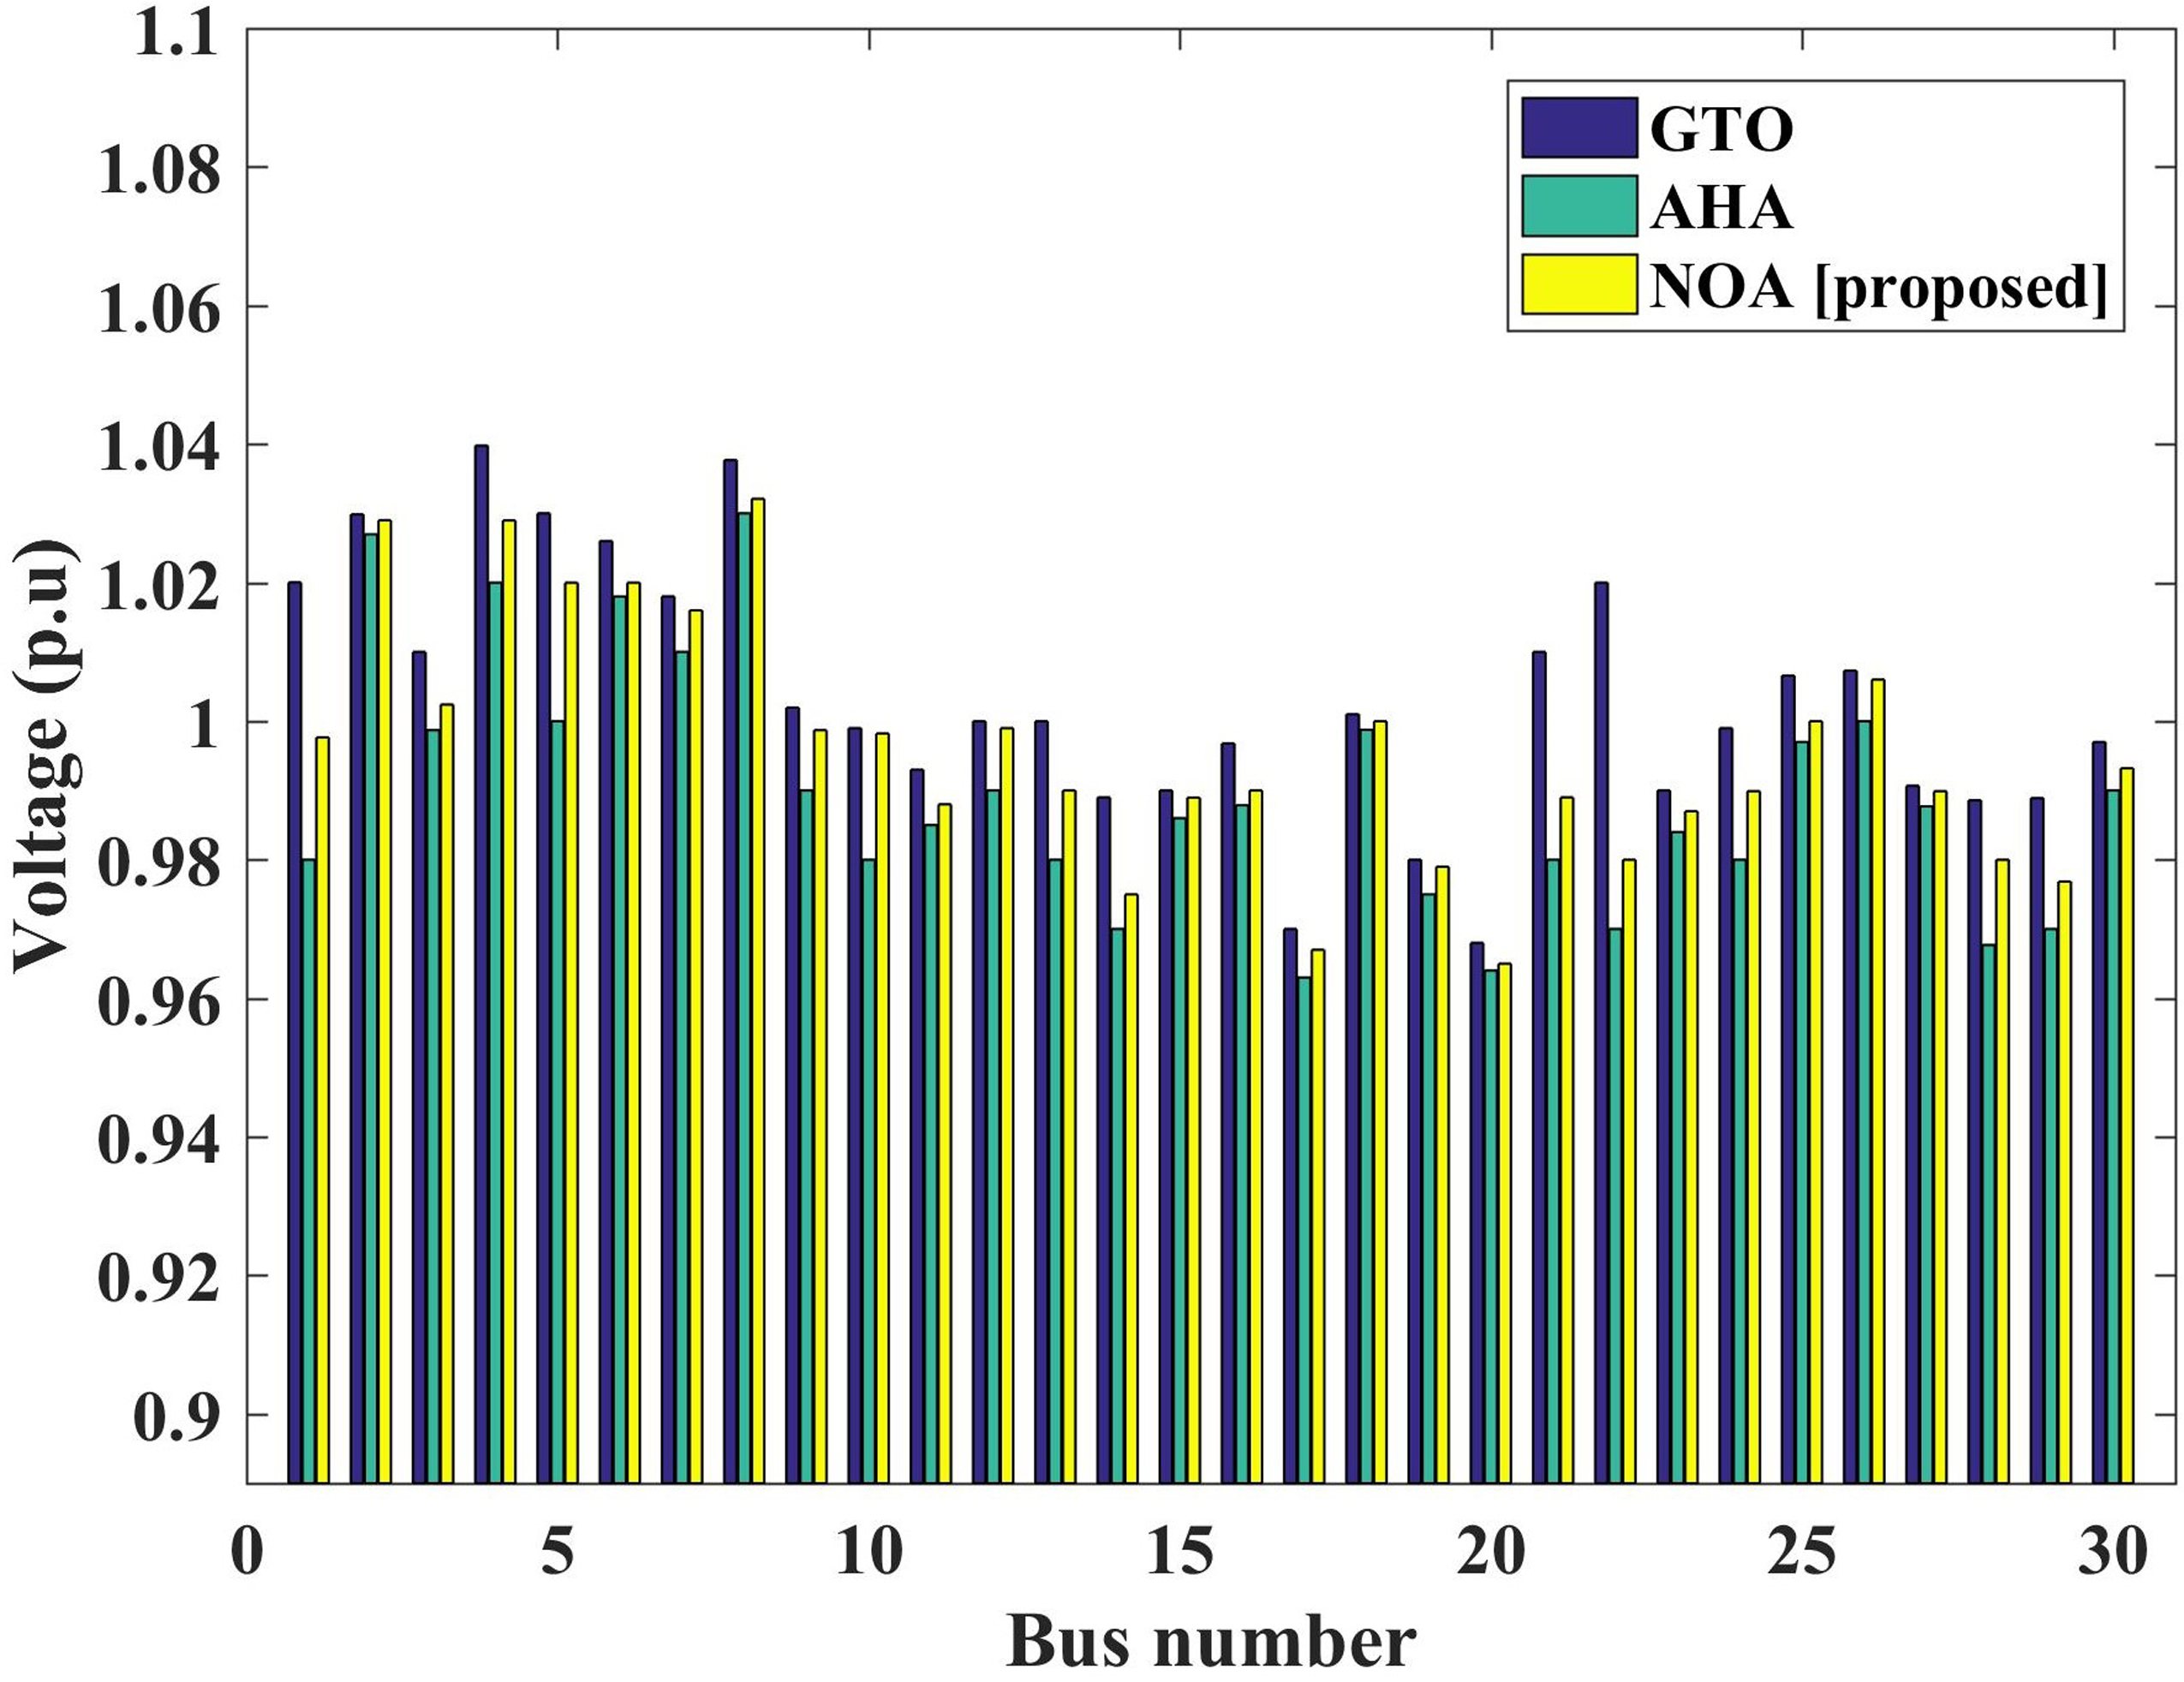
Comparative bus voltage with nutcracker optimizer algorithm (NOA) and other optimization techniques.
Statistical test for NOA on IEEE 30-bus system
To assess the effectiveness and resilience of the proposed NOA, an extensive examination has been conducted on the obtained results. This involved running all three optimization algorithms 30 times across various population sizes (number of search agents). According to Derrac et al. (2011), the authors recommended employing several nonparametric statistical tests within the realm of computational intelligence. Table 6 shows the cases with the best fitness function values. Notably, the NOA yielded the best result when utilizing 40 search agents. Table 7 presents the minimum, maximum, mean, and standard deviations of fitness function values obtained with GTO, AHA, and NOA when using 40 search agents. Furthermore, statistical analyses including Friedman, and Quade tests have been conducted to validate the optimization algorithms. Let H0 denote the hypothesis stating no difference among the three methods, while H1 represents the alternative hypothesis suggesting differences (Sheskin, 2003). A significance level of α = 0.05 has been chosen. Table 8 presents the recorded p-values from Wilcoxon's paired sign rank test. The symbols +/−/∼ indicate whether the proposed NOA outperforms, underperforms, or is approximately equal to the compared algorithm, respectively. A p-value < 0.05 for all test cases refutes the null hypothesis, affirming the validity of Wilcoxon's signed-rank test for the proposed algorithm (Sheskin, 2003).
The fitness function value is delivered by the optimization algorithm for different search agents.
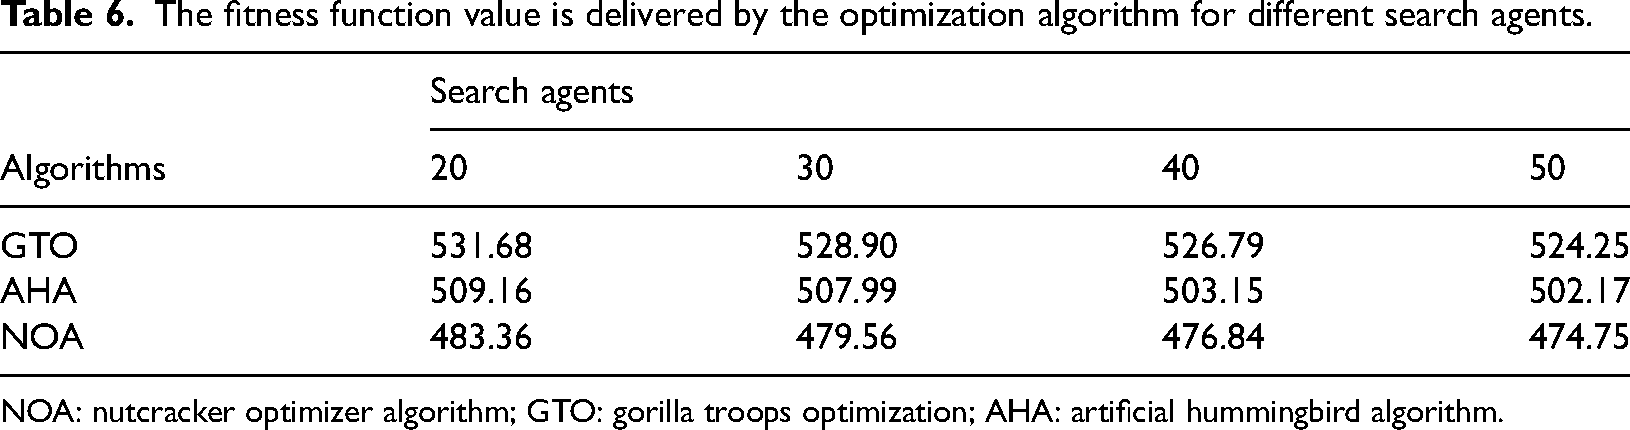
NOA: nutcracker optimizer algorithm; GTO: gorilla troops optimization; AHA: artificial hummingbird algorithm.
Fitness function values delivered by GTO, AHA, and NOA for 40 search agents
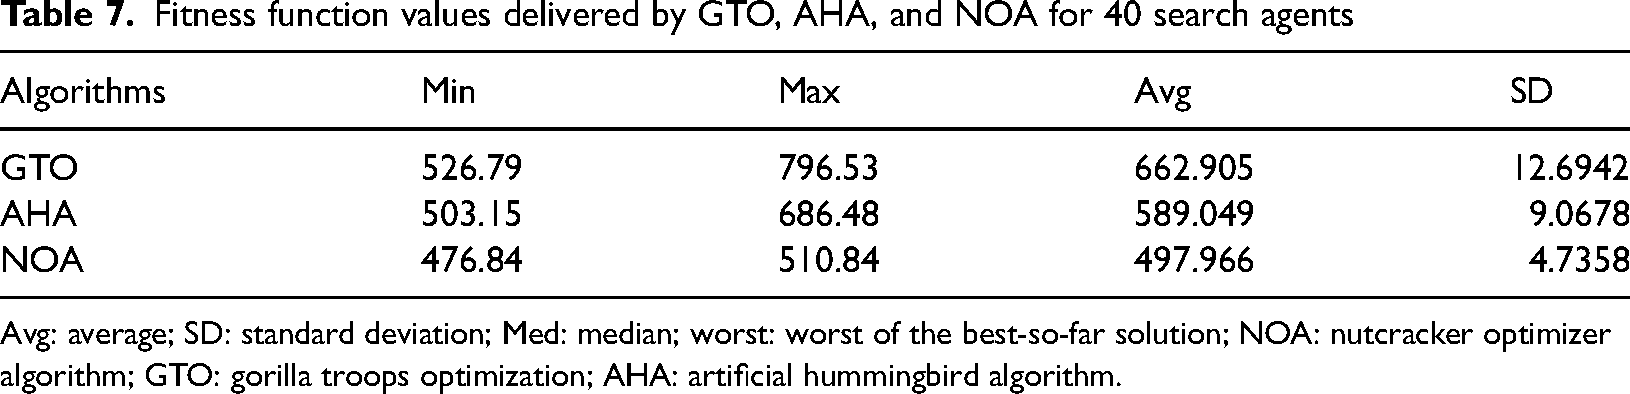
Avg: average; SD: standard deviation; Med: median; worst: worst of the best-so-far solution; NOA: nutcracker optimizer algorithm; GTO: gorilla troops optimization; AHA: artificial hummingbird algorithm.
p-values for the optimization algorithm.
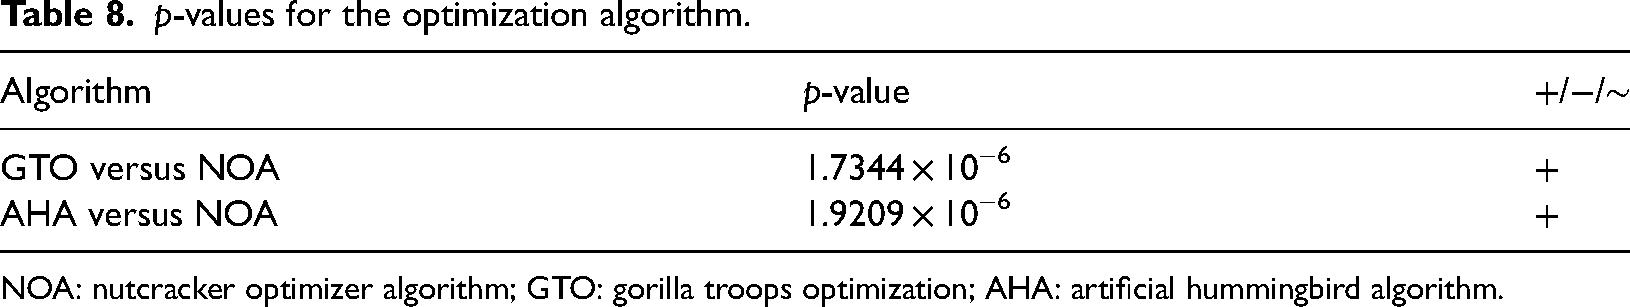
NOA: nutcracker optimizer algorithm; GTO: gorilla troops optimization; AHA: artificial hummingbird algorithm.
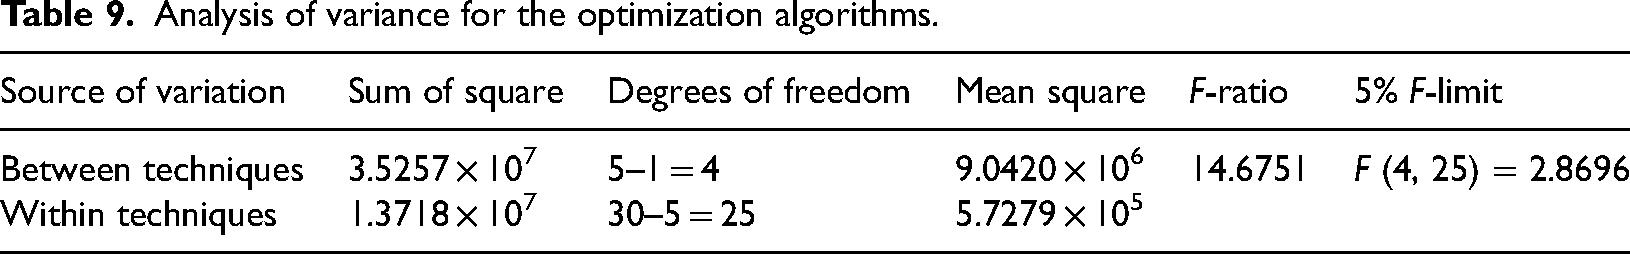
Analysis of variance relies on the principle of total variance. This approach involves breaking down the observed variance in a specific variable into segments attributed to various sources of variation. The critical F-value is determined with the chosen significance level (α = 0.05). If the calculated F-ratio exceeds the critical F-limit, the null hypothesis is rejected. Additionally, Table 9 indicates that the computed F-value falls below the tabulated F-value at a 5% significance level, where the degrees of freedom are specified as 4 and 25.
Analysis of variance for the optimization algorithms.
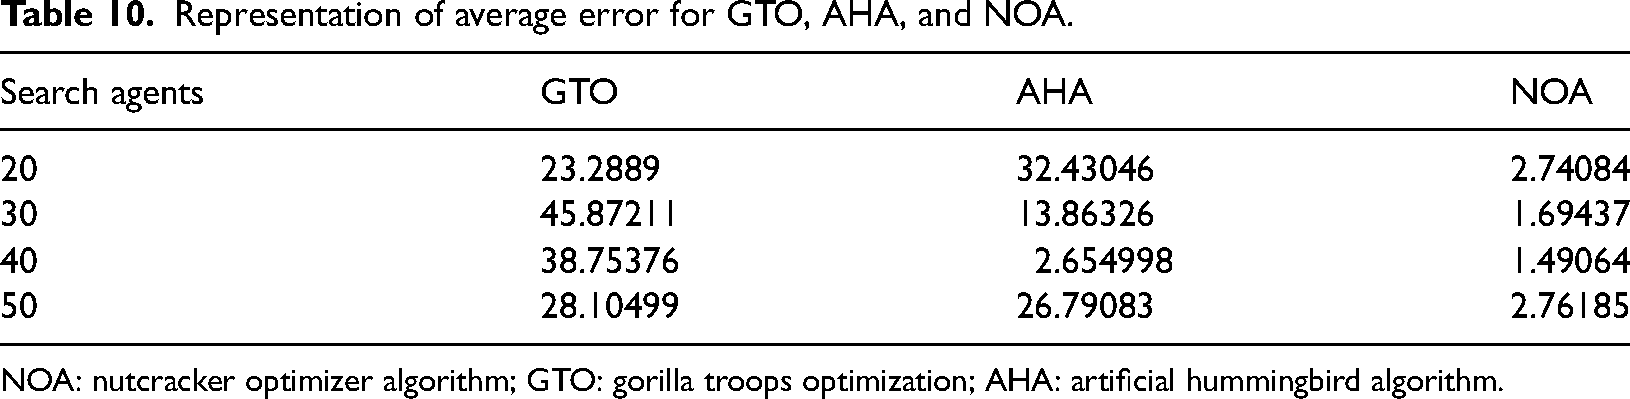
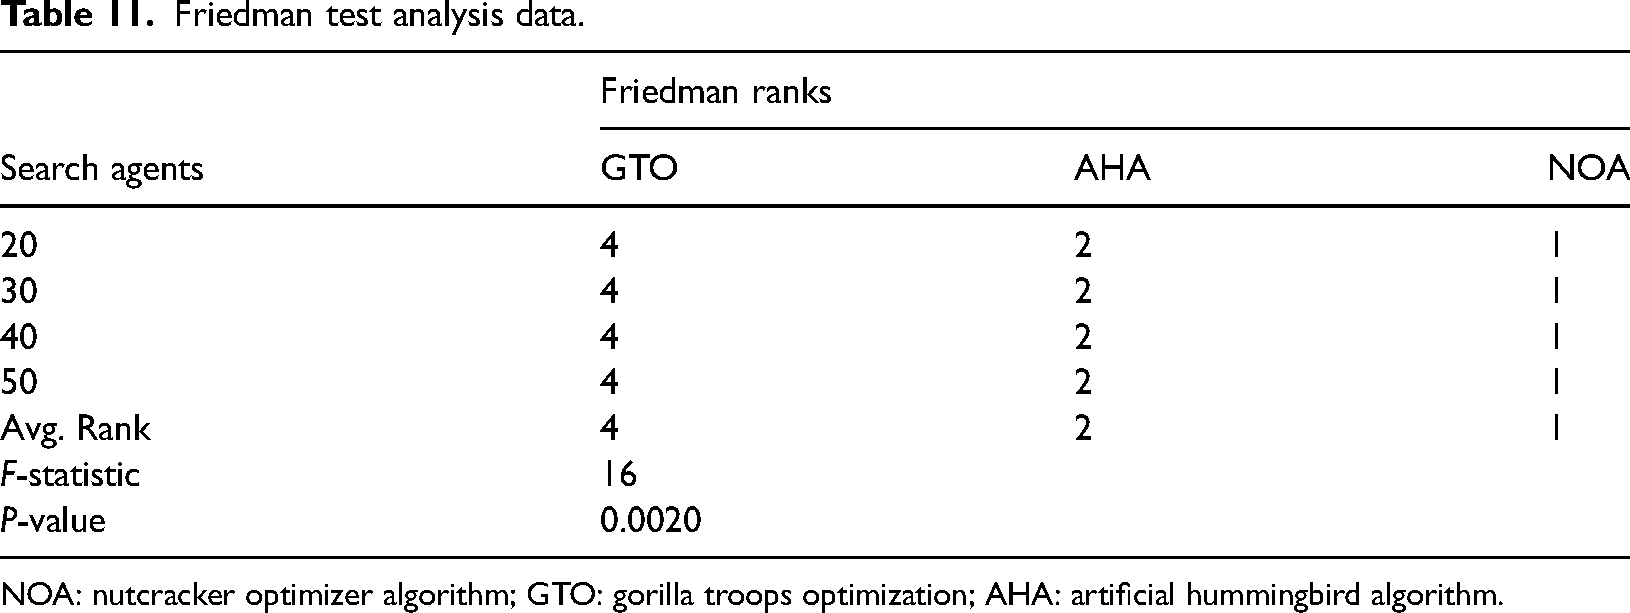
To conduct the Friedman and Quade tests, initially, an average error table is highlighted in Table 10. Subsequently, Friedman ranks and the F-statistic (also known as the χ2 value) are computed and presented in Table 11. The method with the lowest rank is deemed superior, clearly indicating the efficacy of NOA. The computed χ2 value of 16 from Table 11 exceeds the critical value, and the resulting p-value of 0.0030, being < 0.05, leads to the rejection of the null hypothesis. This confirms the presence of significant disparities among the methods employed.
Representation of average error for GTO, AHA, and NOA.
NOA: nutcracker optimizer algorithm; GTO: gorilla troops optimization; AHA: artificial hummingbird algorithm.
Friedman test analysis data.
NOA: nutcracker optimizer algorithm; GTO: gorilla troops optimization; AHA: artificial hummingbird algorithm.
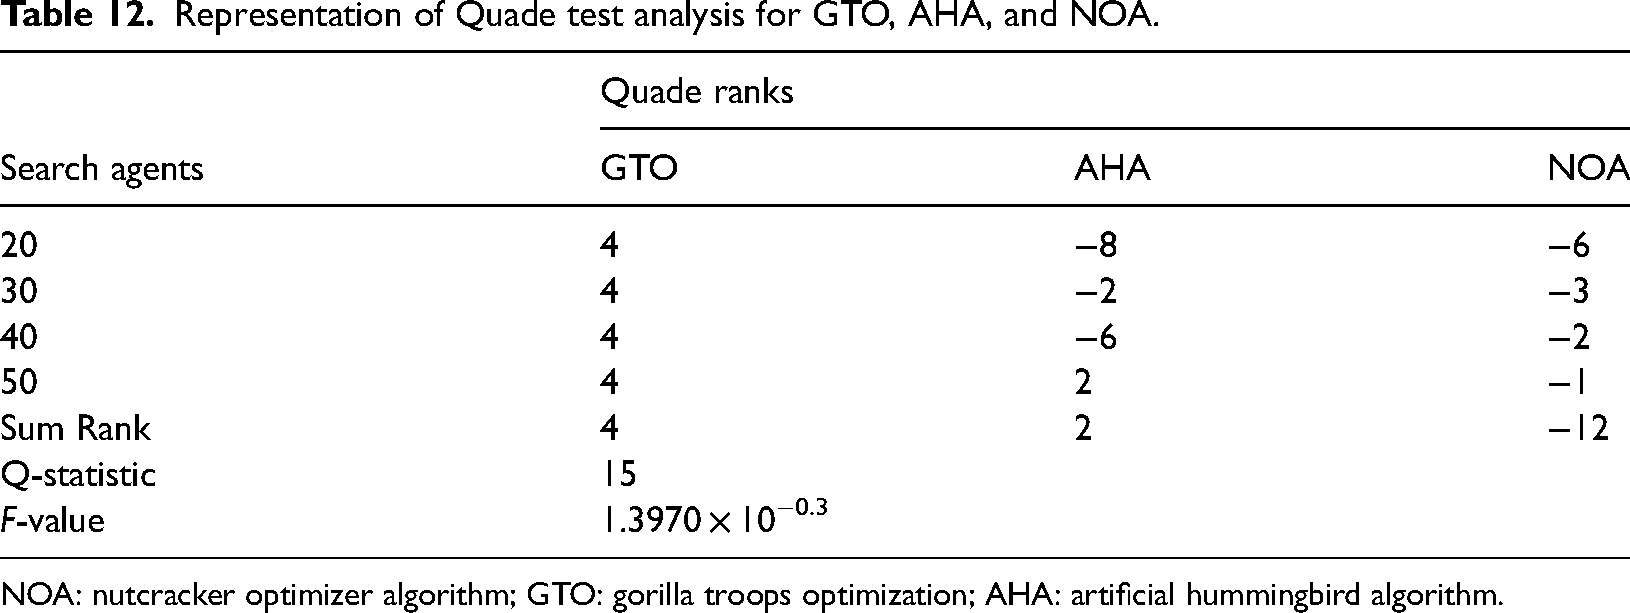
Similar trends are evident in the Quade test results presented in Table 12, where NOA achieved the lowest rank. The calculated Q-statistic value of 15 surpasses the critical value referenced by Sheskin (2003), and the resulting p-value of 1.9209 × 10⁻⁶, being < 0.05, supports the rejection of the null hypothesis H0. This reinforces the effectiveness of NOA.
Representation of Quade test analysis for GTO, AHA, and NOA.
NOA: nutcracker optimizer algorithm; GTO: gorilla troops optimization; AHA: artificial hummingbird algorithm.
IEEE 118-bus system
This test framework consists of 54 buses as generator buses, 186 transmission lines, and 64 load buses. The network topology for this test system can be found in Figure 10.
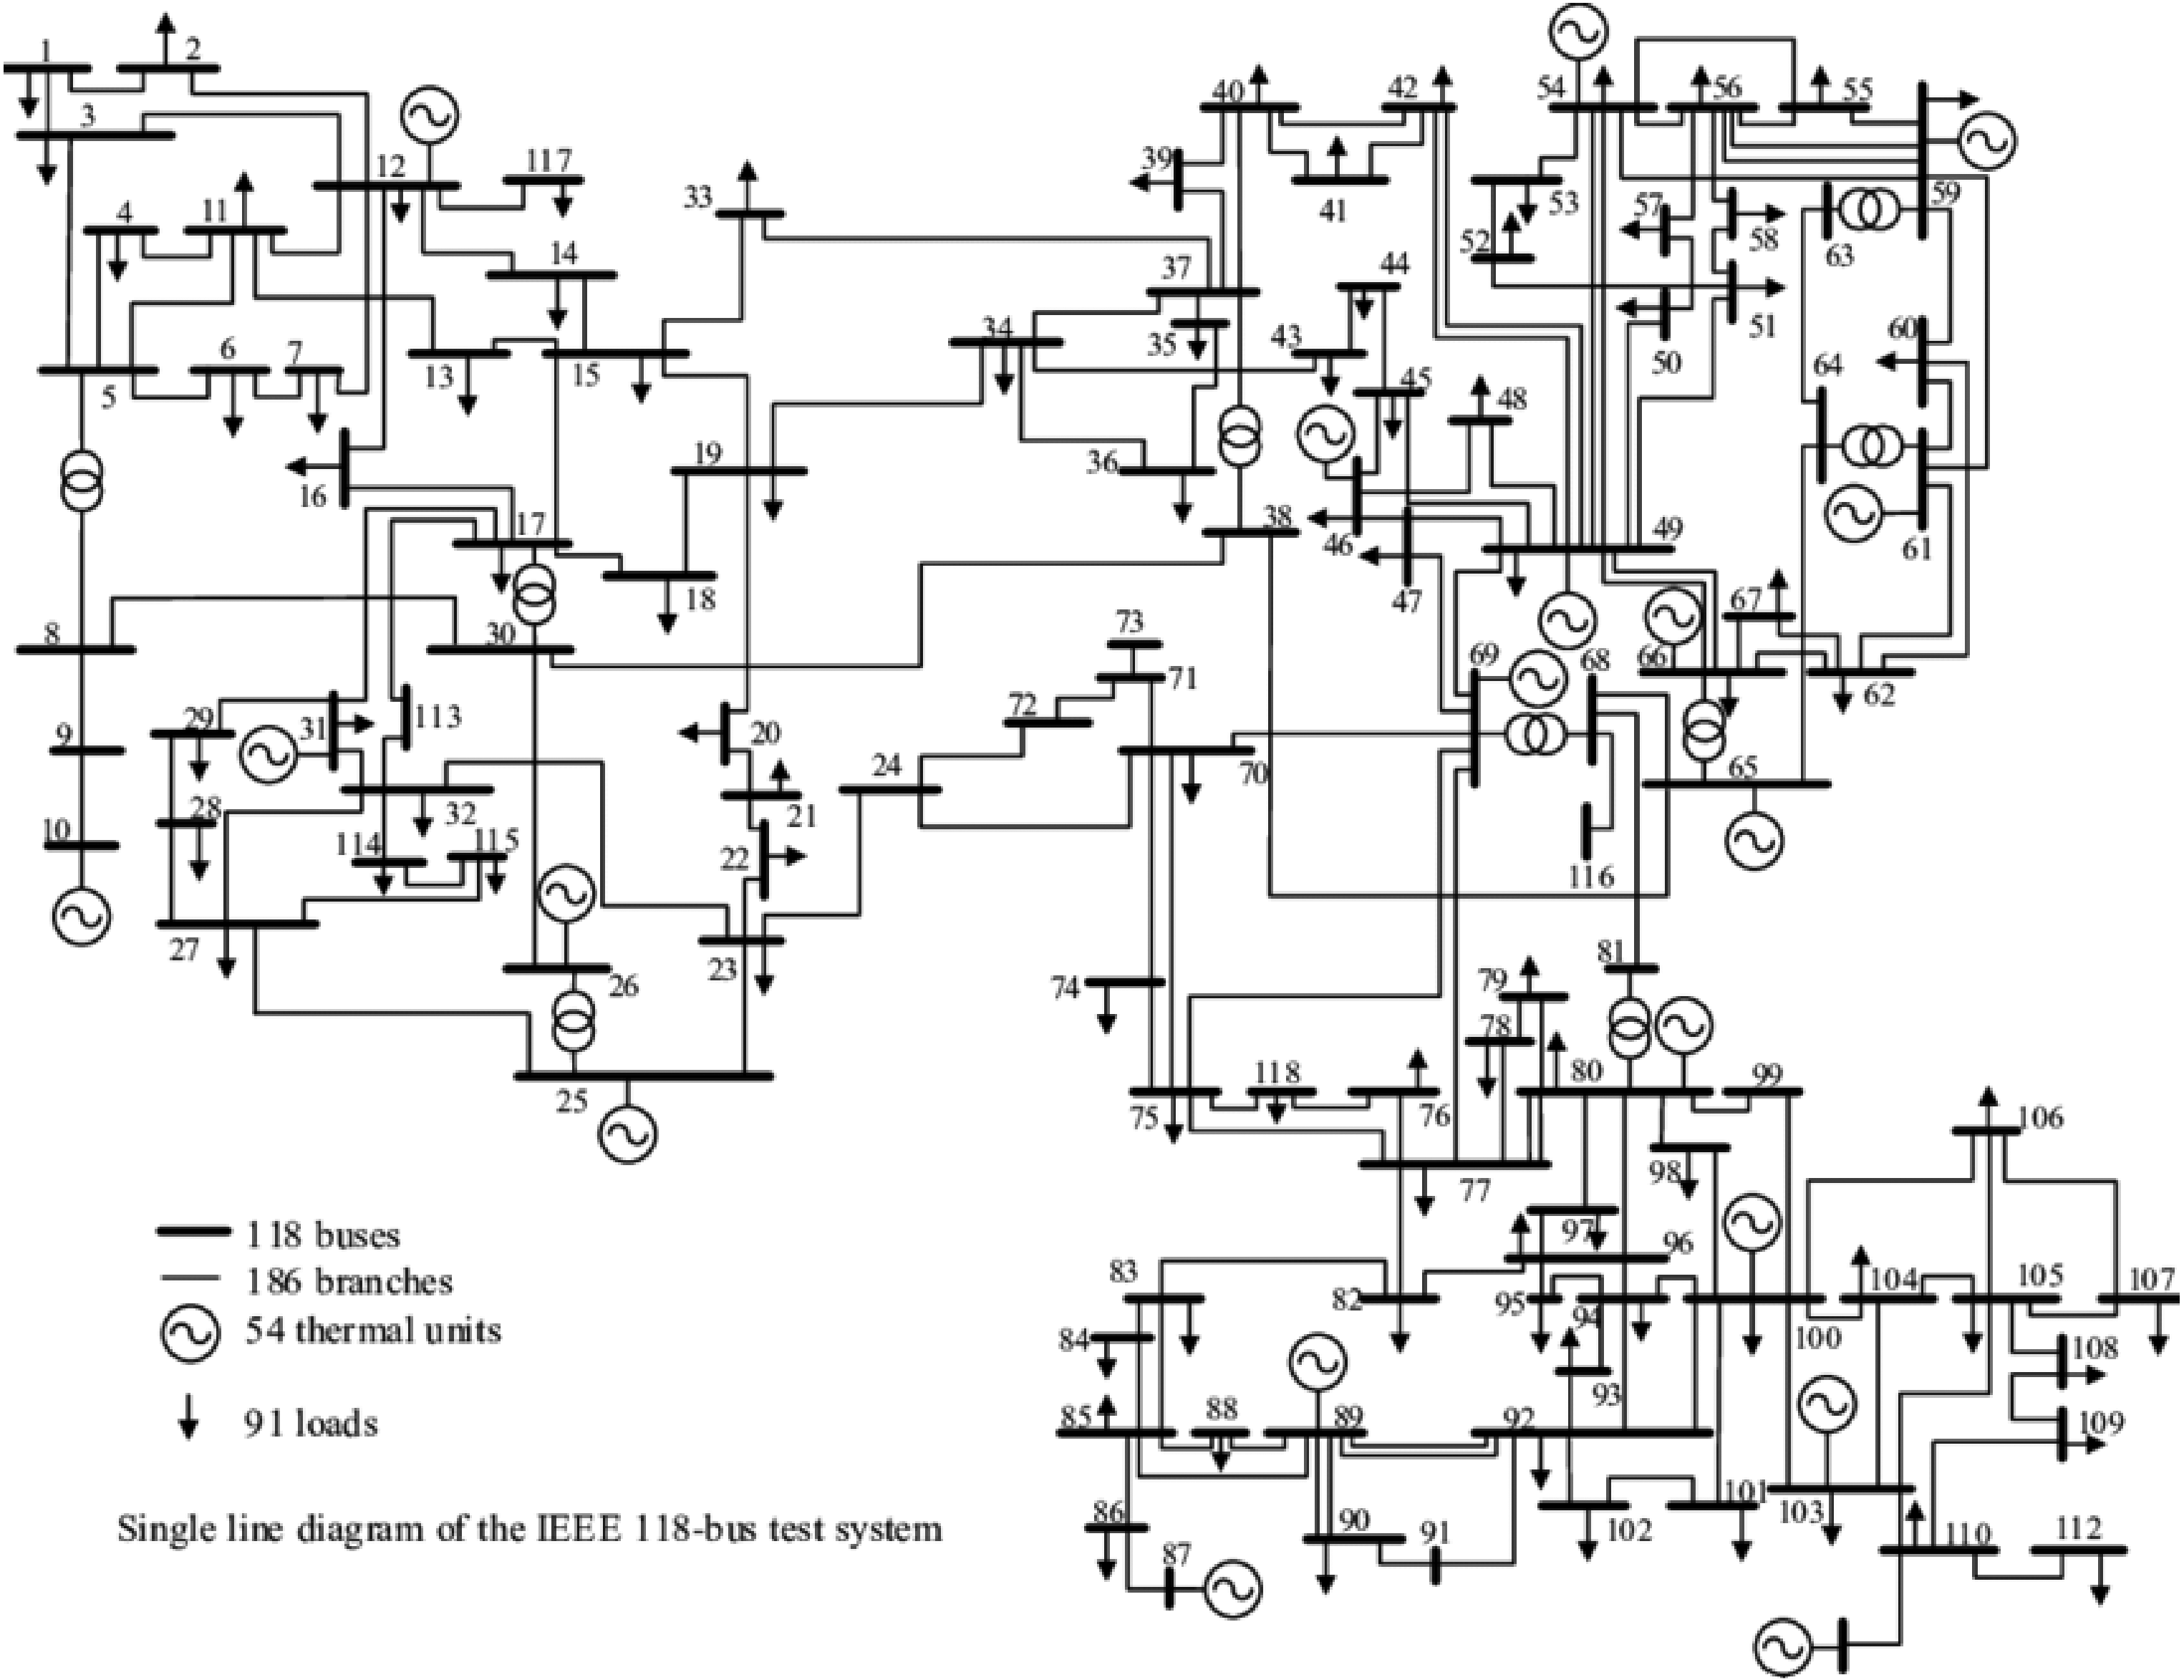
Single line diagram of 118-bus system (Wang et al., 2022).
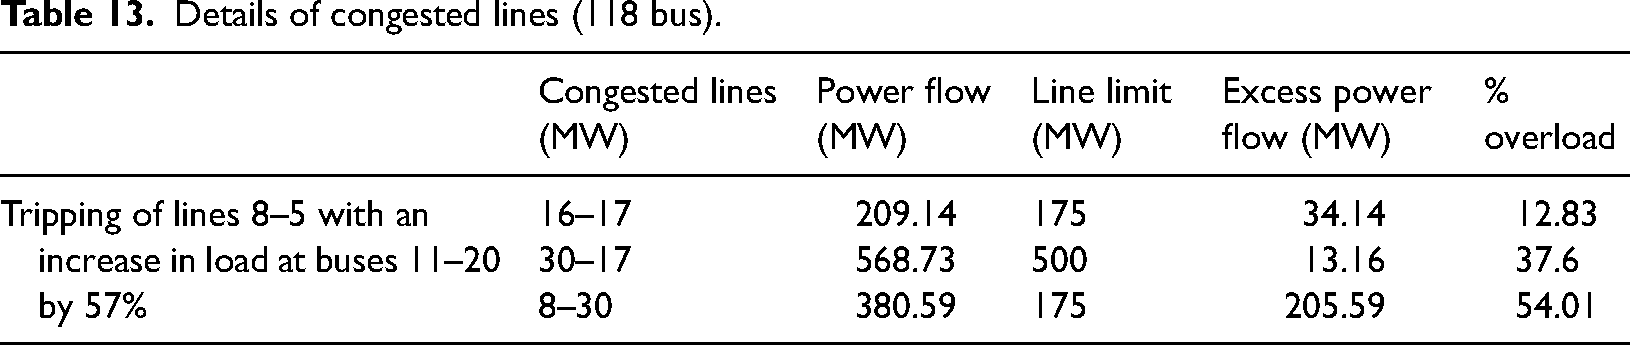
In this test system, contingency is established with the tripping of lines 8–5 and increasing the load demand by 1.57 times. Congested lines detail have been represented in Table 13. The NOA has been employed to settle the CM problem and obtain the solution. The detail of the solutions achieved with the NOA has been highlighted in Table 14. It can be seen that the line flows have been reduced below the maximum limits with the NOA and other competitive optimization algorithms. The congestion cost and the real power rescheduled by the NOA, and other recent algorithms are summarized in Table 14. It is observed that the application of NOA and generator rescheduling have relieved the overloaded lines achieving a congestion cost of 1389.56 $/h, which is comparatively lower than the cost achieved with other techniques.
Details of congested lines (118 bus).
Comparative outcomes for IEEE 118-bus system with NOA.
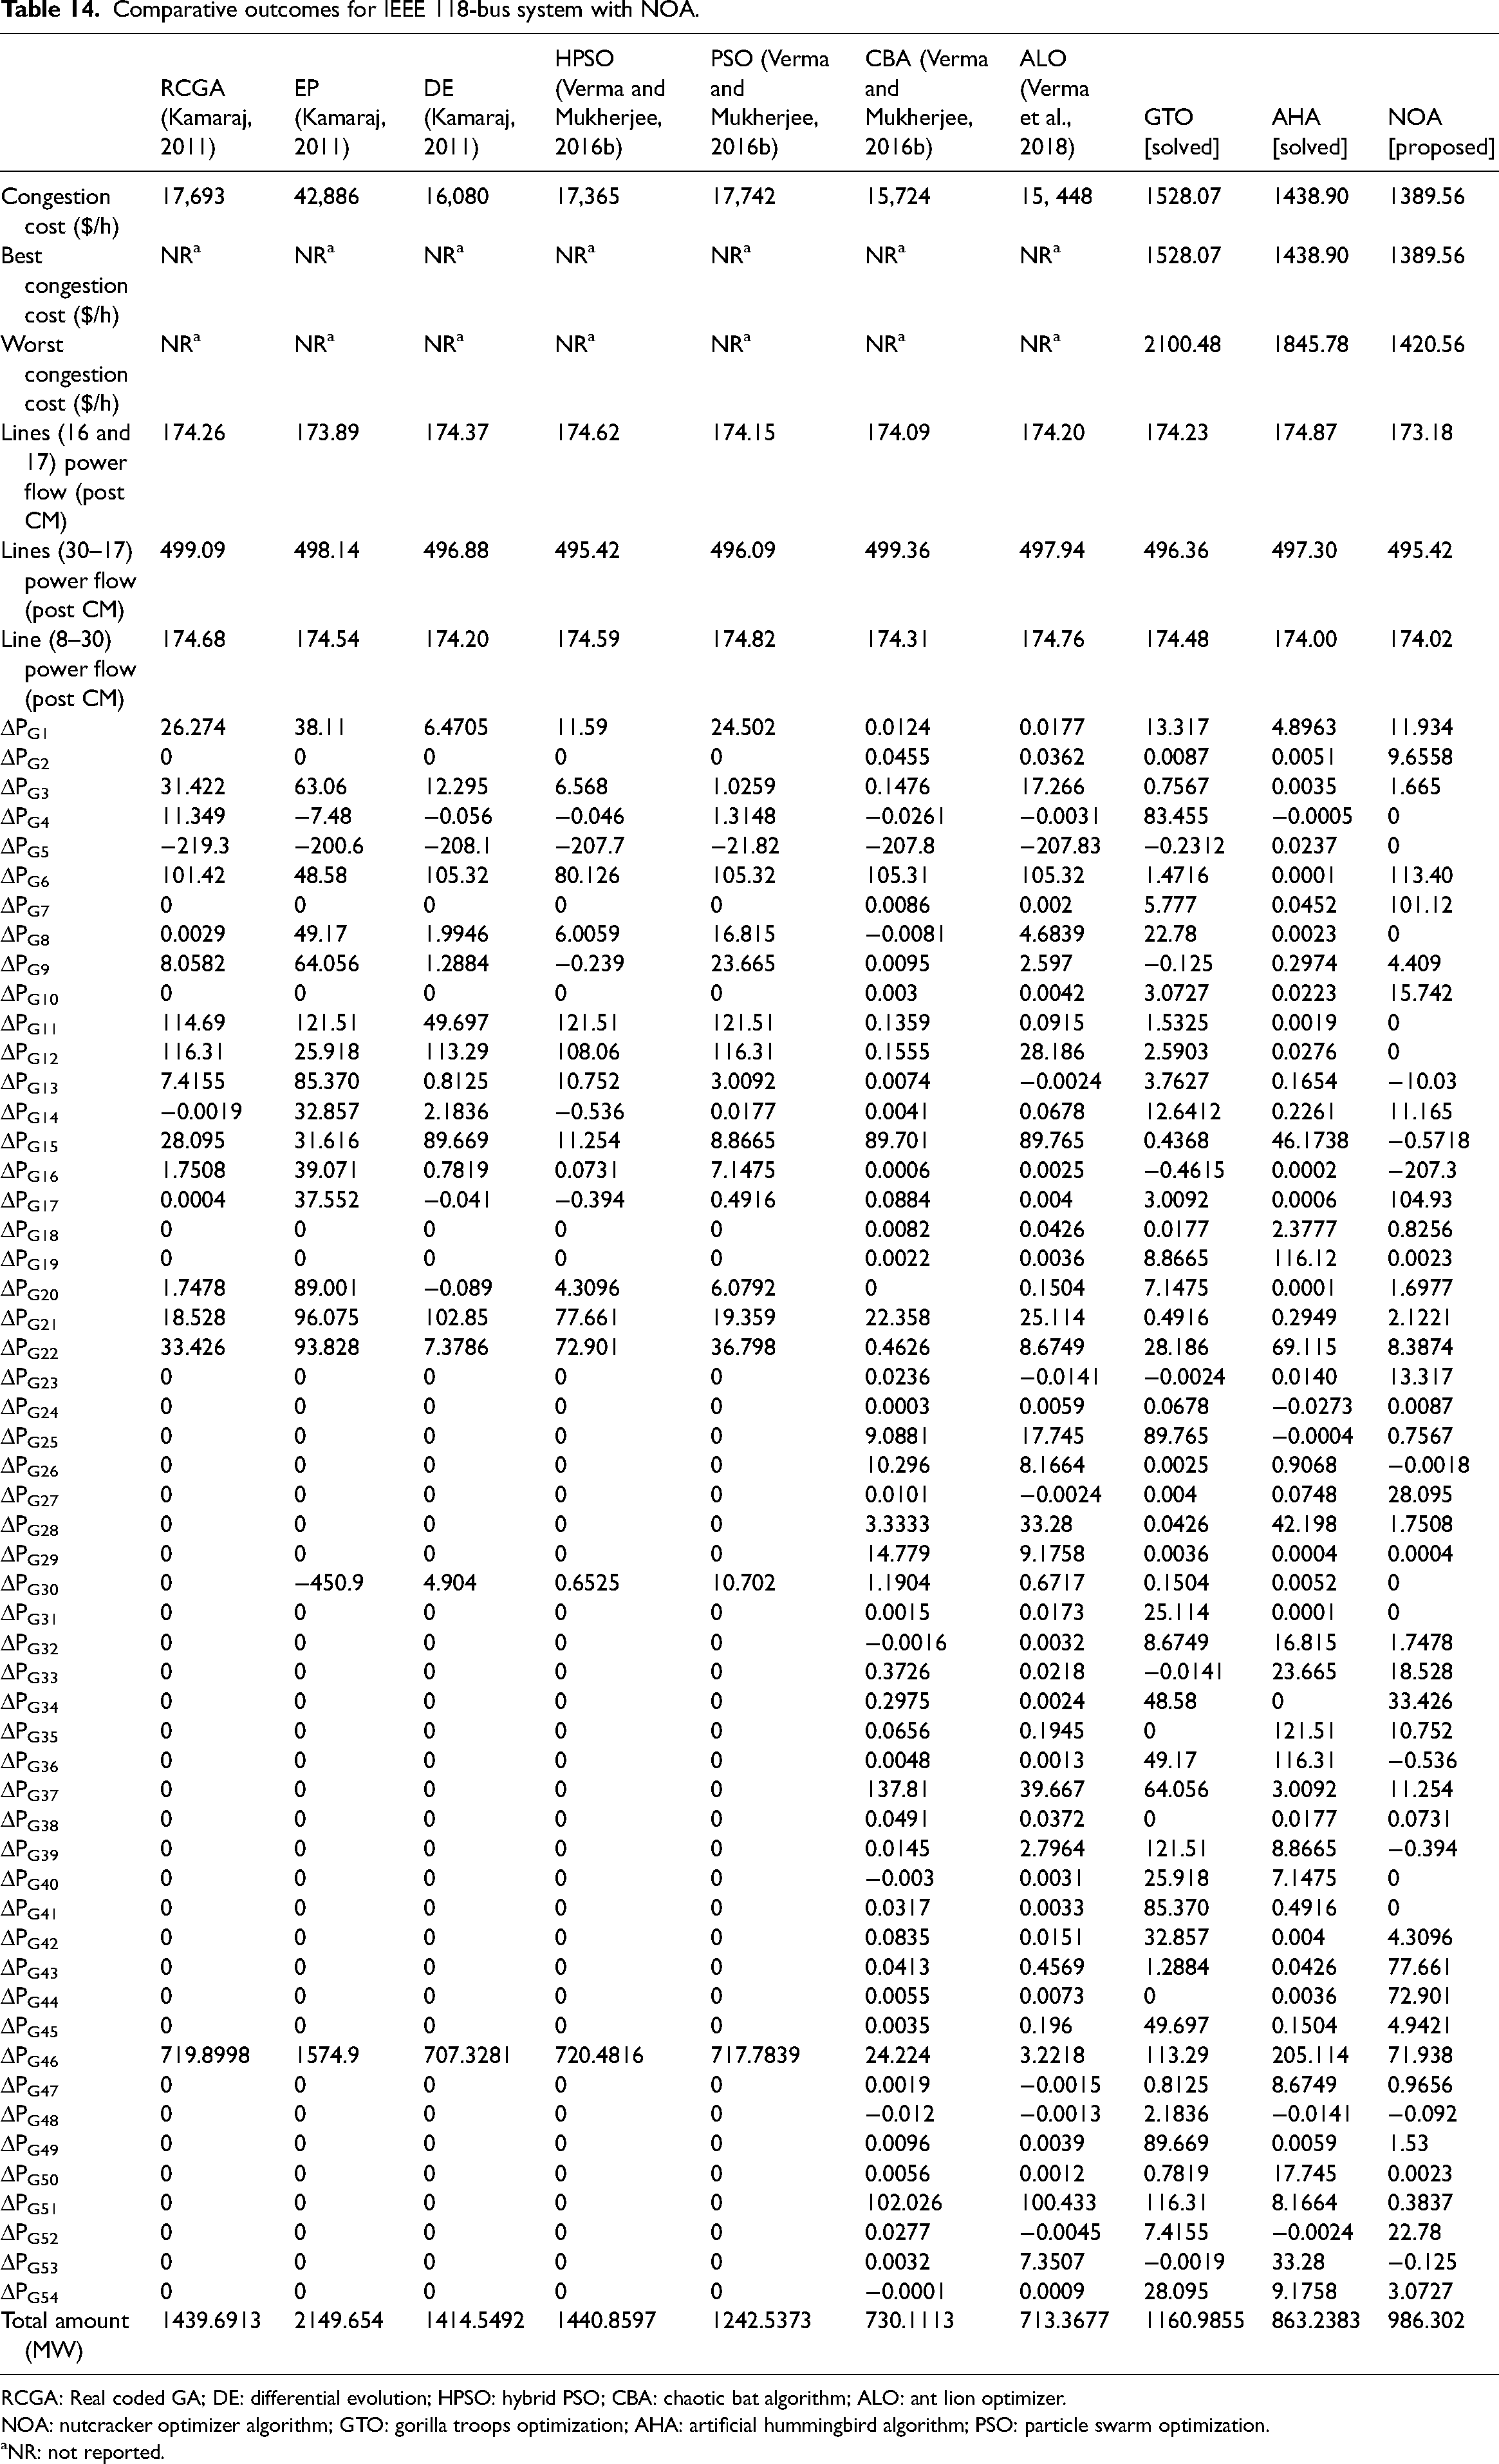
RCGA: Real coded GA; DE: differential evolution; HPSO: hybrid PSO; CBA: chaotic bat algorithm; ALO: ant lion optimizer.
NOA: nutcracker optimizer algorithm; GTO: gorilla troops optimization; AHA: artificial hummingbird algorithm; PSO: particle swarm optimization.
NR: not reported.
The congestion cost is represented in Figure 11. Convergence of the fitness function based on the NOA for this case is depicted in Figure 12. System loss before CM was 247.968 MW, whereas post CM it has been reduced to 168.539 MW. Furthermore, tests have shown that NOA consistently provides the best optimal solution even for large systems. The iterative values for 30 runs with 500 iterations and the box plot are given in Figures 13 and 14. The bus voltages obtained post-CM are represented in Figure 15, demonstrating that the voltages are within normal specified limits.
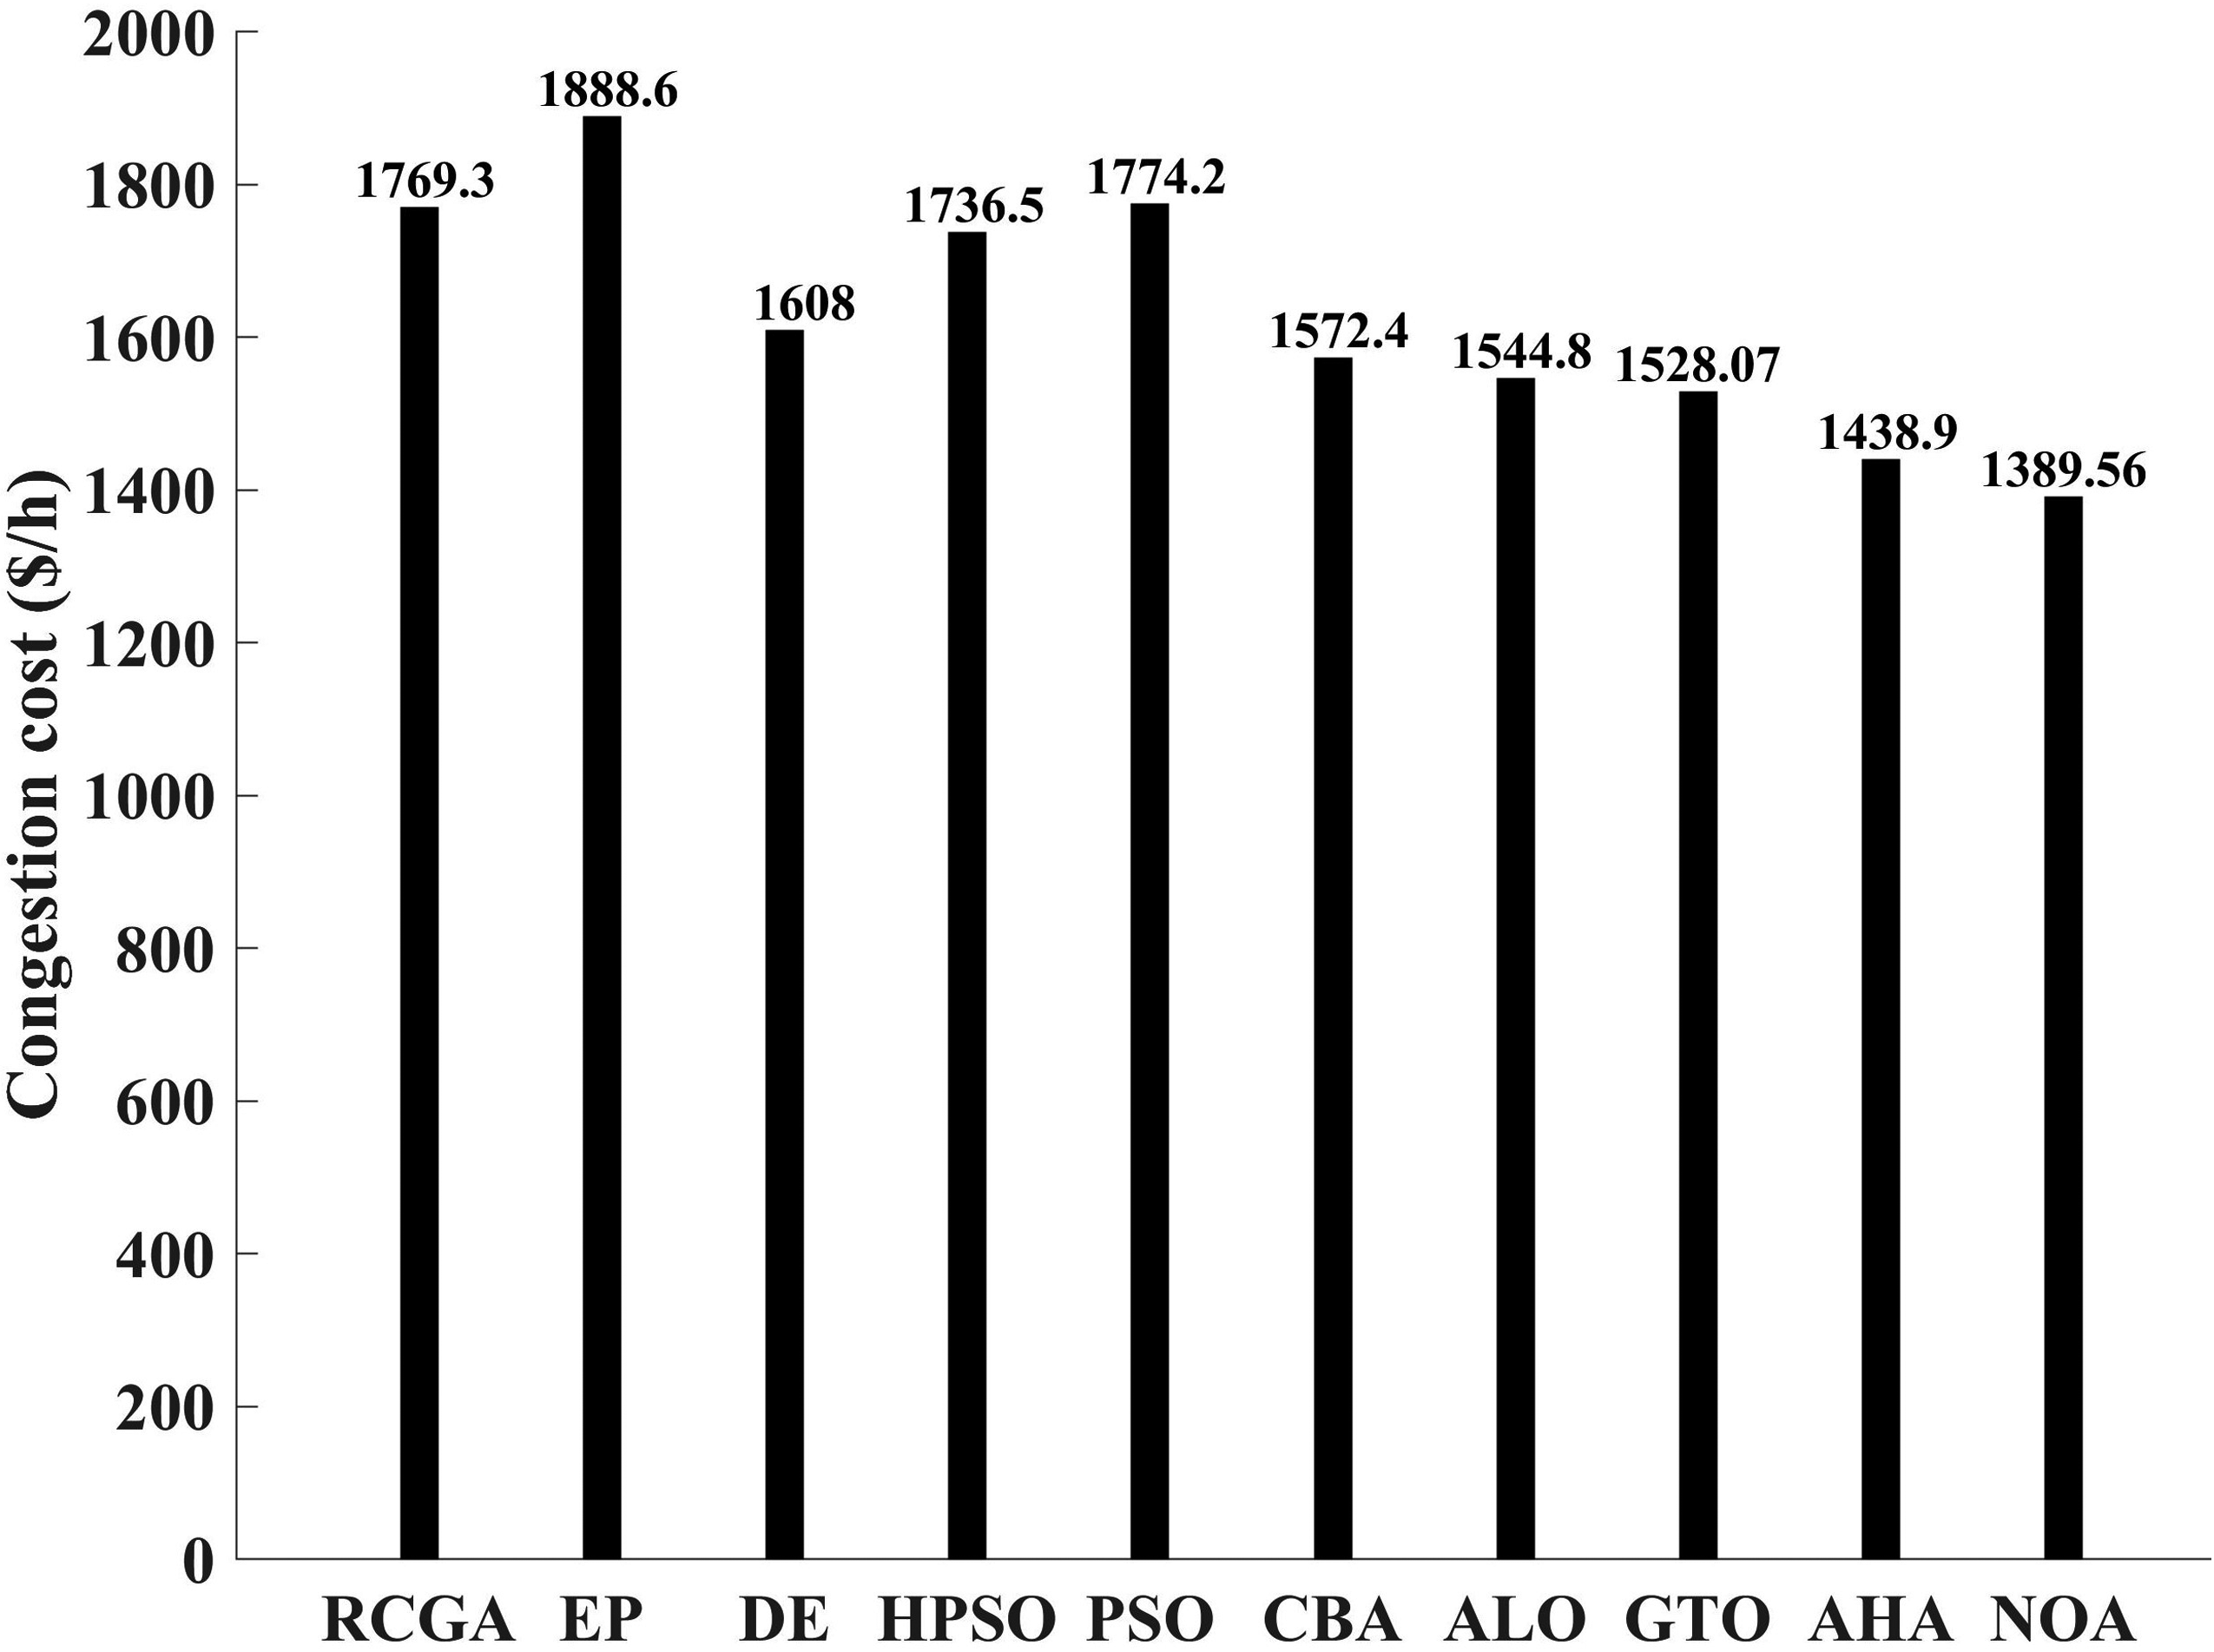
Comparative congestion cost with nutcracker optimizer algorithm (NOA) and other optimization algorithms.
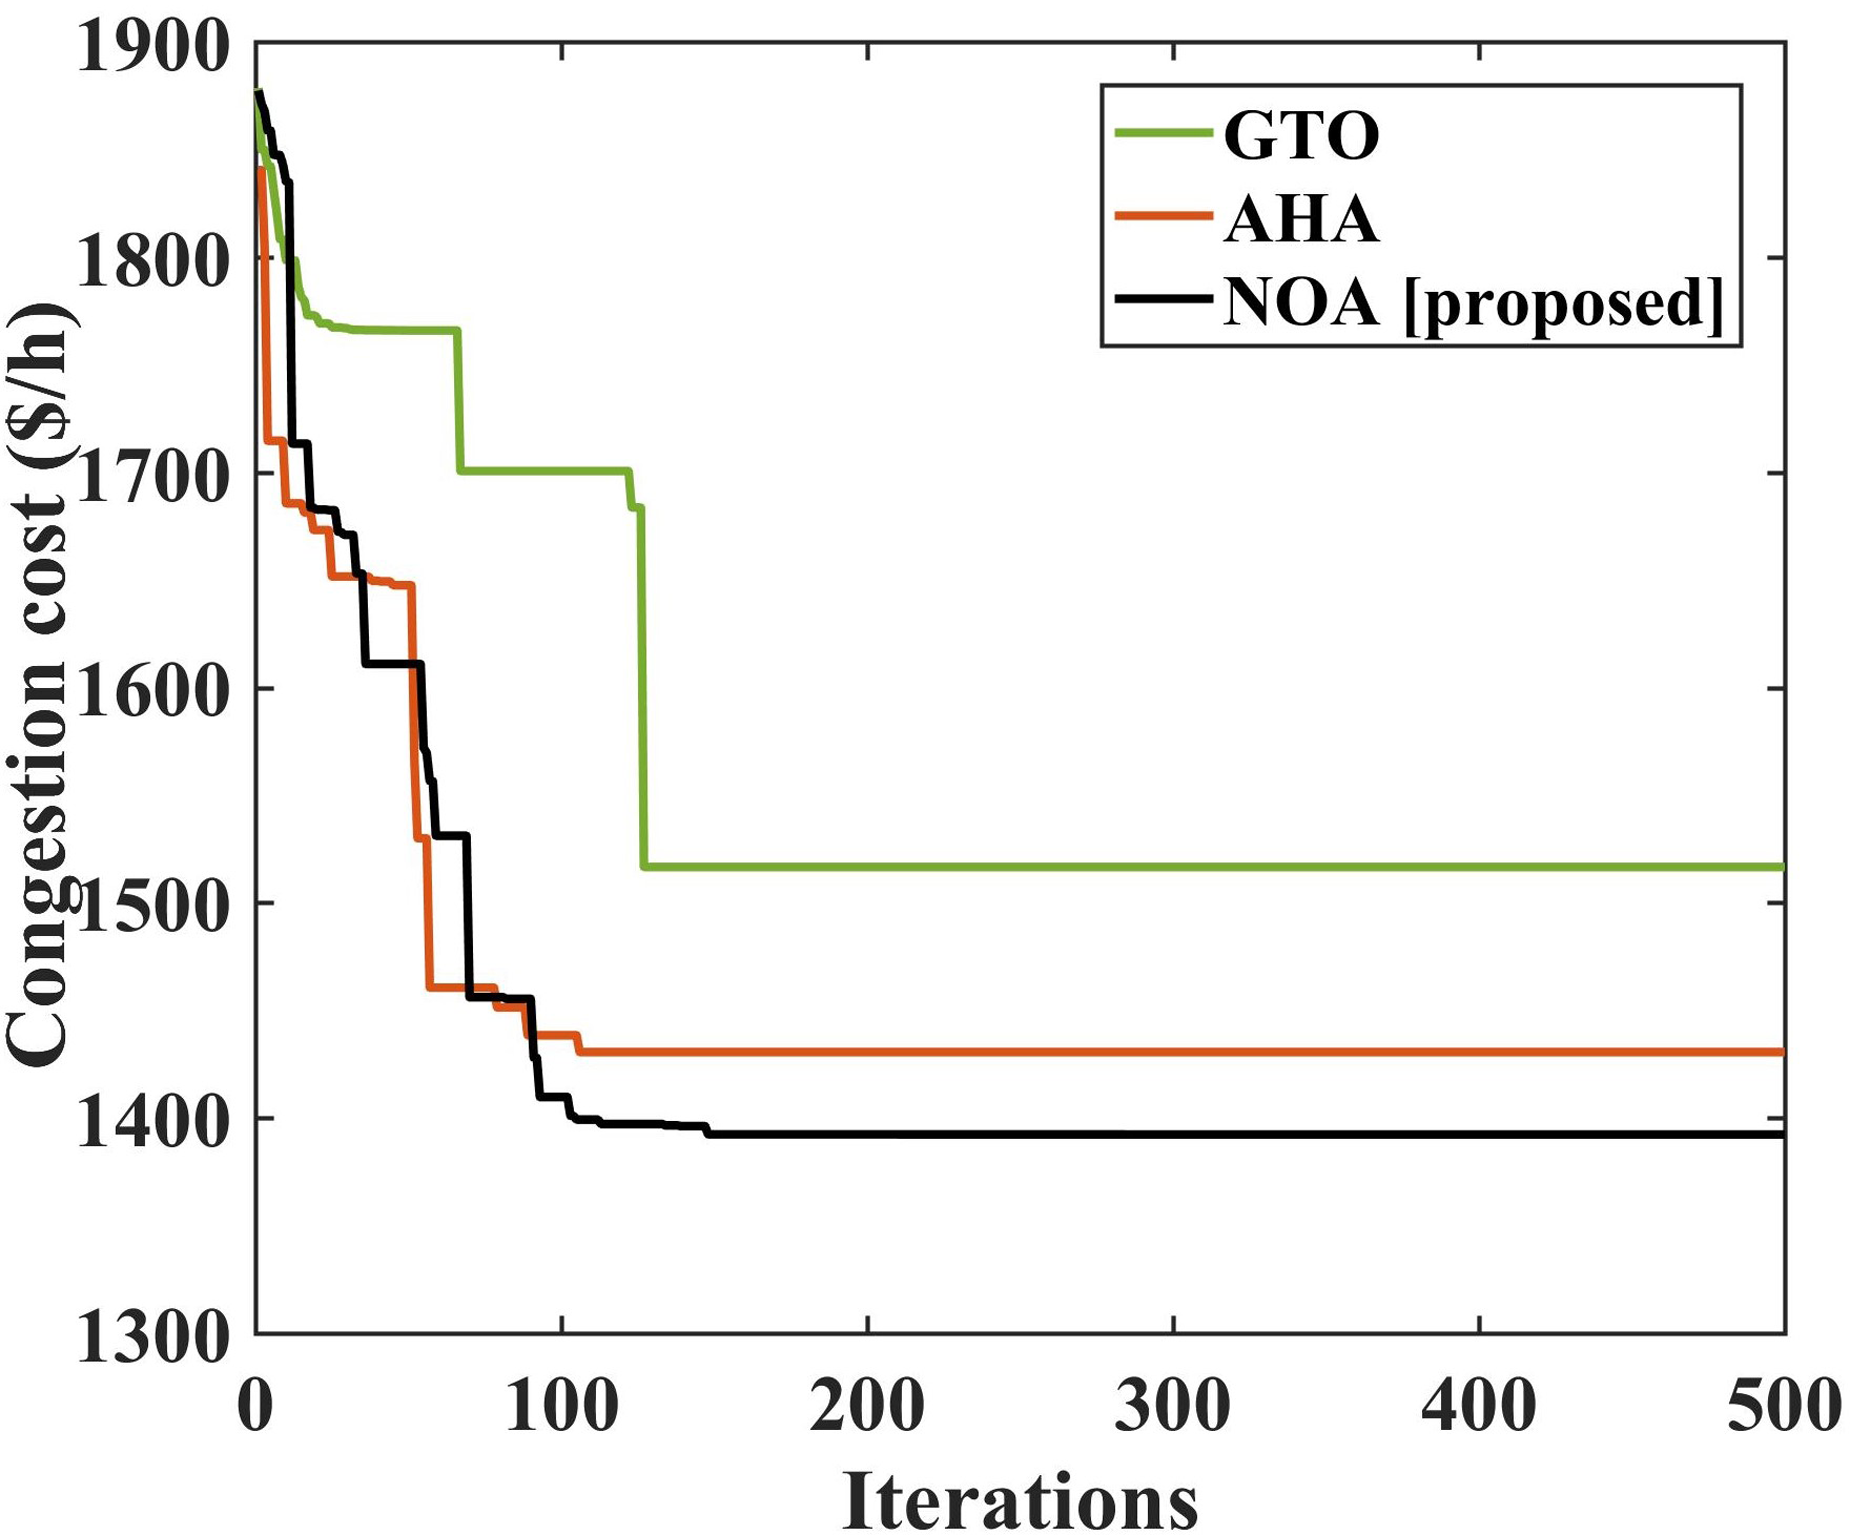
Convergence characteristics of nutcracker optimizer algorithm (NOA) and other optimization algorithms.
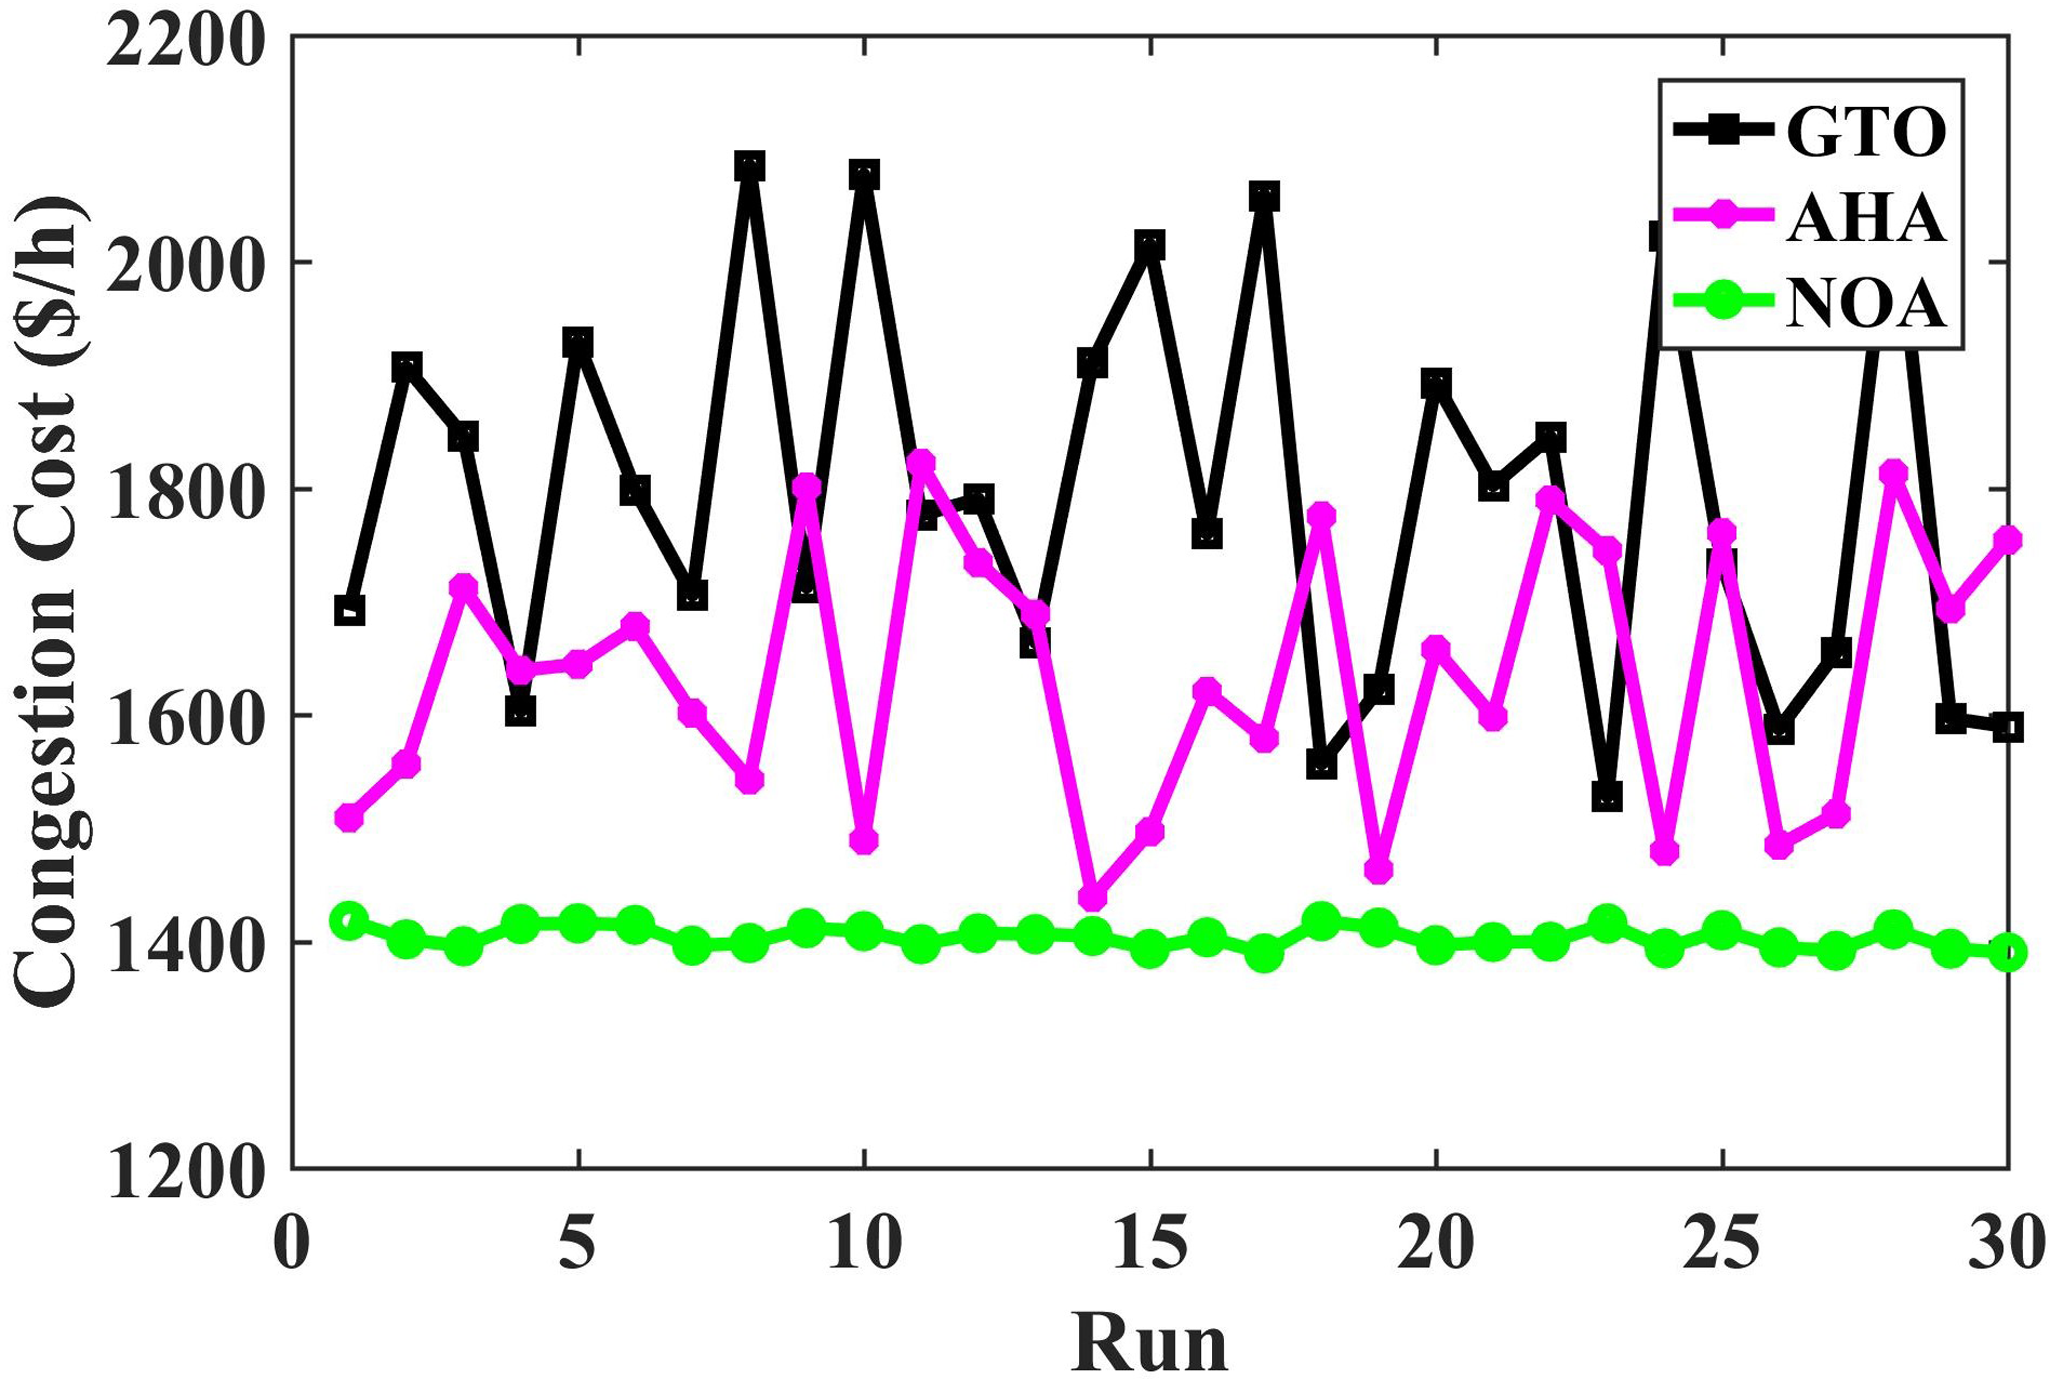
Fitness function values for 30 runs with 500 iterations (IEEE 118 bus).
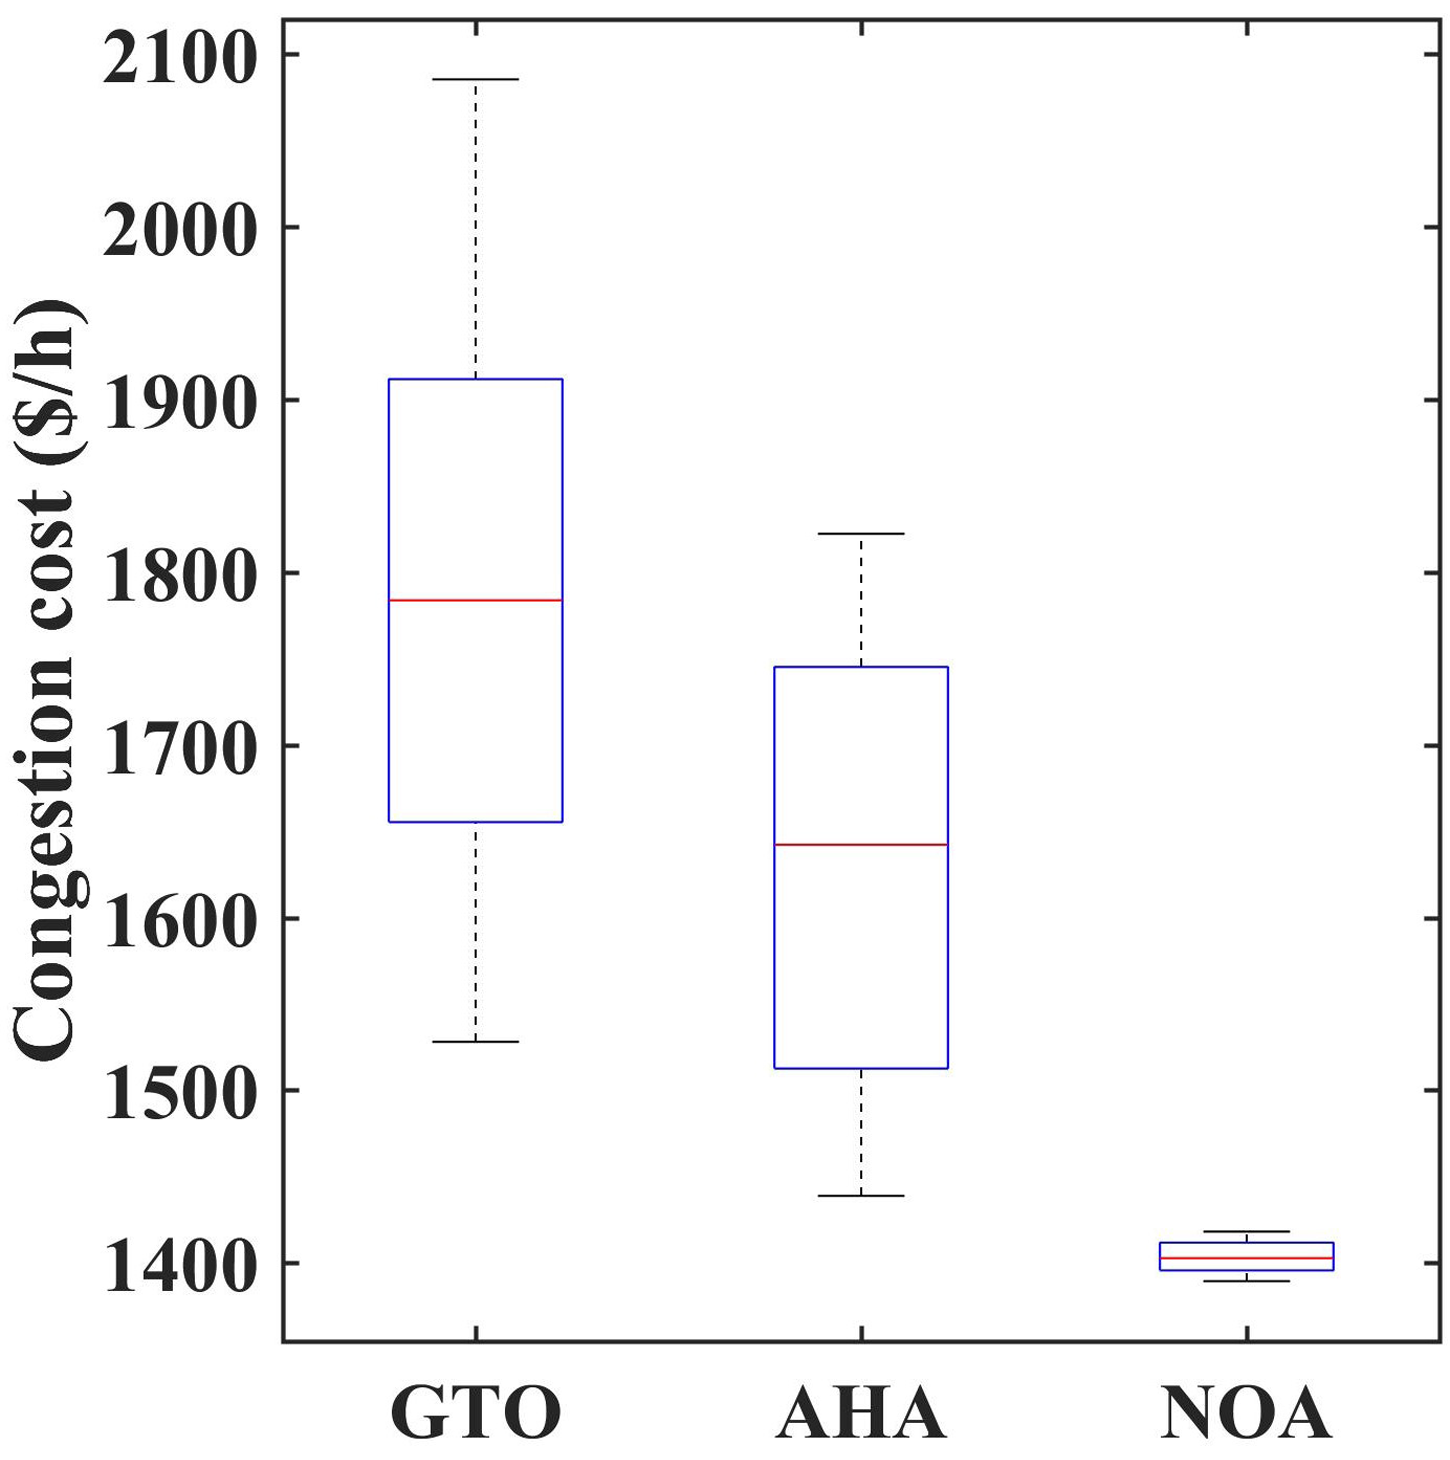
Figure 8 box plot for 30 trail runs (IEEE 118 bus).
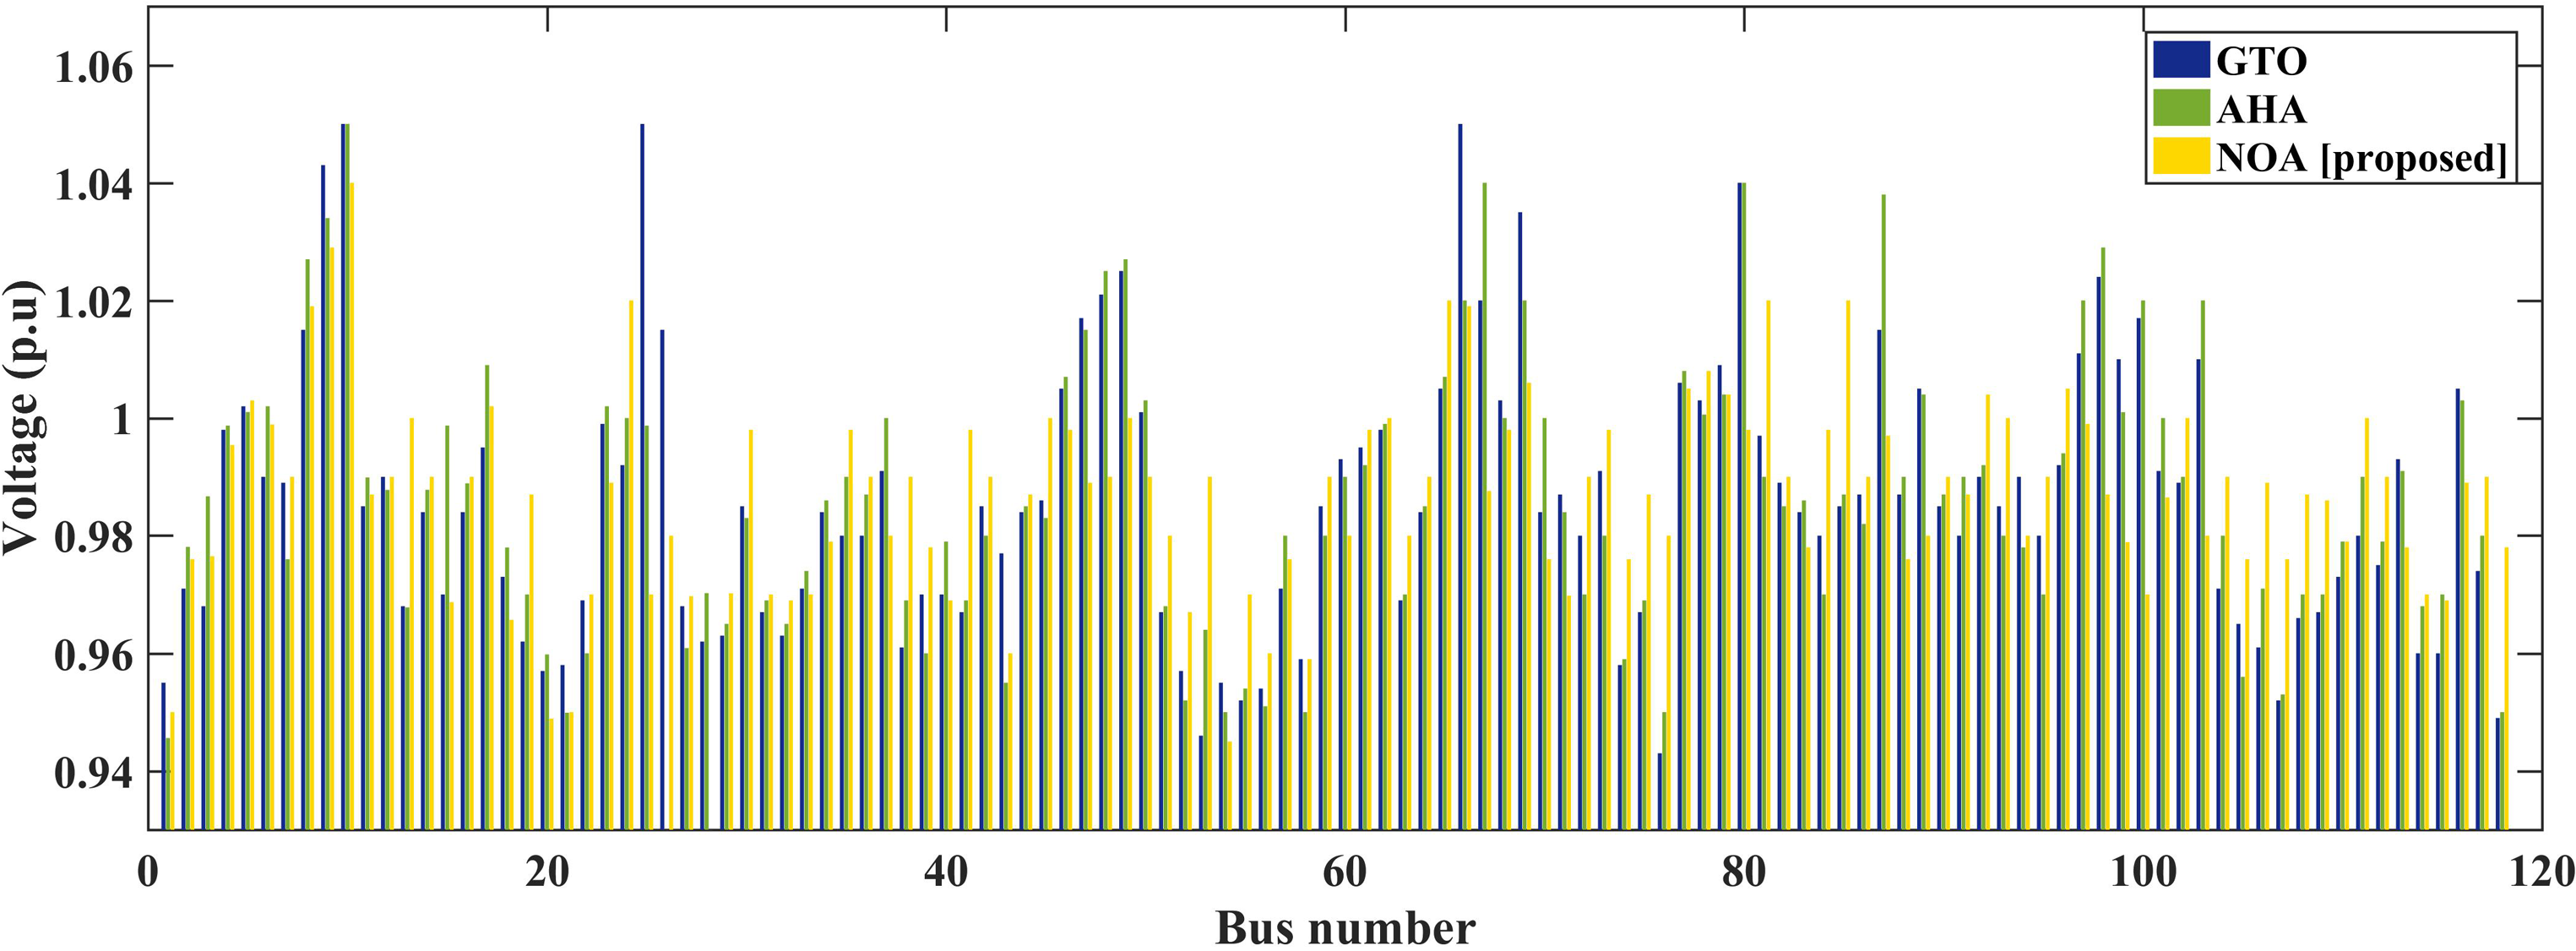
Comparative bus voltage with nutcracker optimizer algorithm (NOA) and other optimization techniques.
Statistical test for NOA on IEEE 118-bus system
The fitness obtained with GTO, AHA, and NOA is highlighted in Table 15. Notably, the NOA yielded the best result when utilizing 40 search agents. Table 16 presents the minimum, maximum, mean, and standard deviations of fitness function values. Various statistical analyses, including Wilcoxon's signed-rank test, Friedman, and Quade tests, were undertaken to assess the algorithms. H0 represents the hypothesis asserting no distinctions among the three methods, while H1 suggests otherwise (Verma and Mukherjee, 2016a). A significance level of α = 0.05 was selected for the analyses. The p-values obtained from Wilcoxon's paired sign rank test are presented in Table 17. The symbols +/−/∼ indicate whether the proposed NOA performs better, worse, or comparably to the compared algorithm, respectively. A p-value < 0.05 across all test cases negates the null hypothesis, confirming the credibility of Wilcoxon's signed-rank test for the proposed algorithm (Verma and Mukherjee, 2016a).
Fitness function value delivered by the optimization algorithm for different search agents (118 bus).
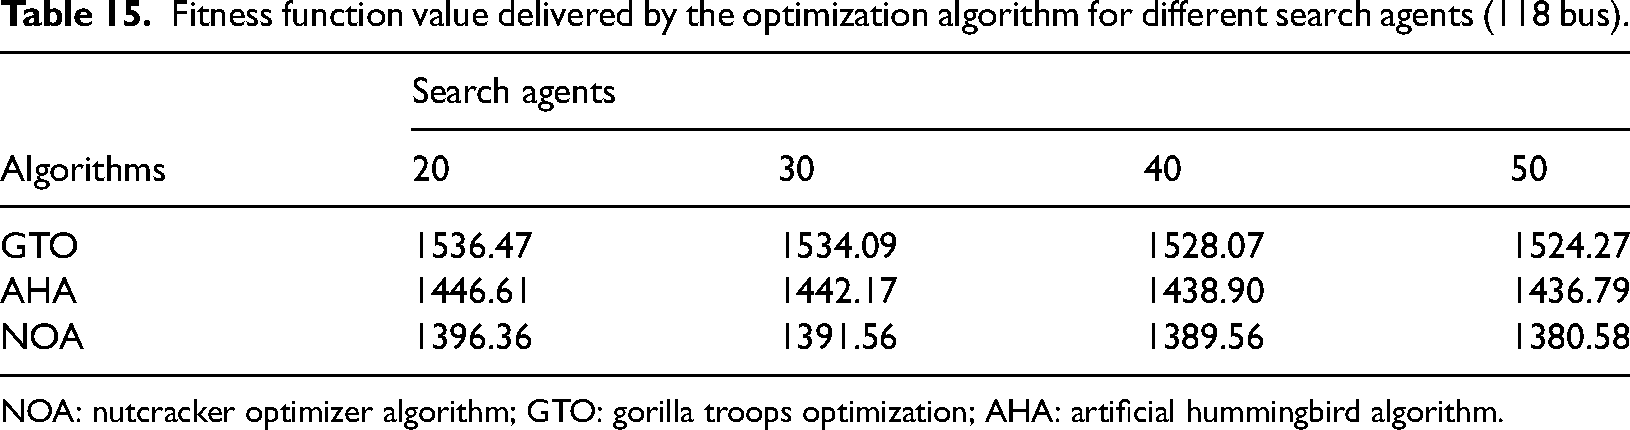
NOA: nutcracker optimizer algorithm; GTO: gorilla troops optimization; AHA: artificial hummingbird algorithm.
Fitness function values delivered by GTO, AHA, and NOA for 40 search agents (118 bus).
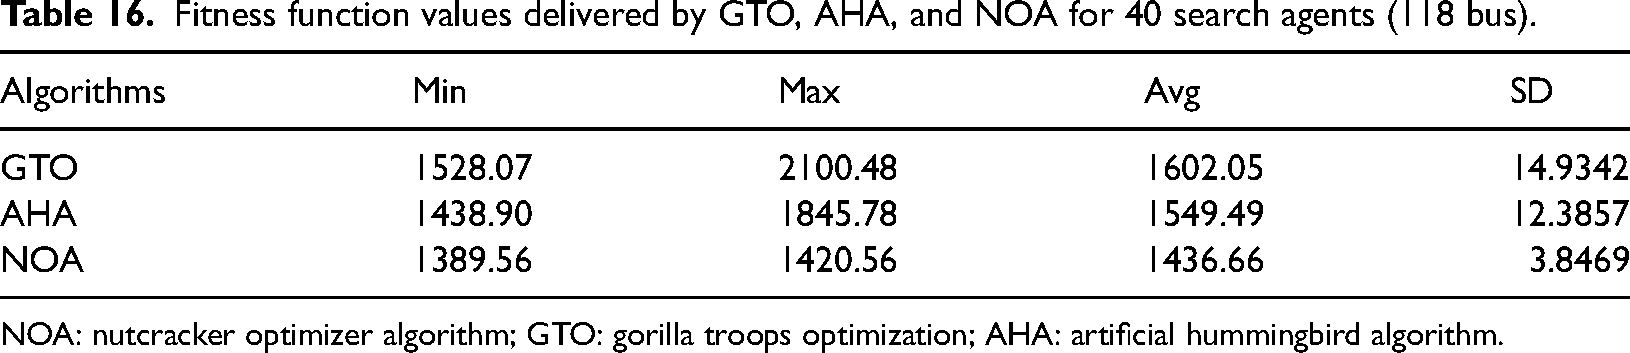
NOA: nutcracker optimizer algorithm; GTO: gorilla troops optimization; AHA: artificial hummingbird algorithm.
P-values for the optimization algorithm (118 bus).
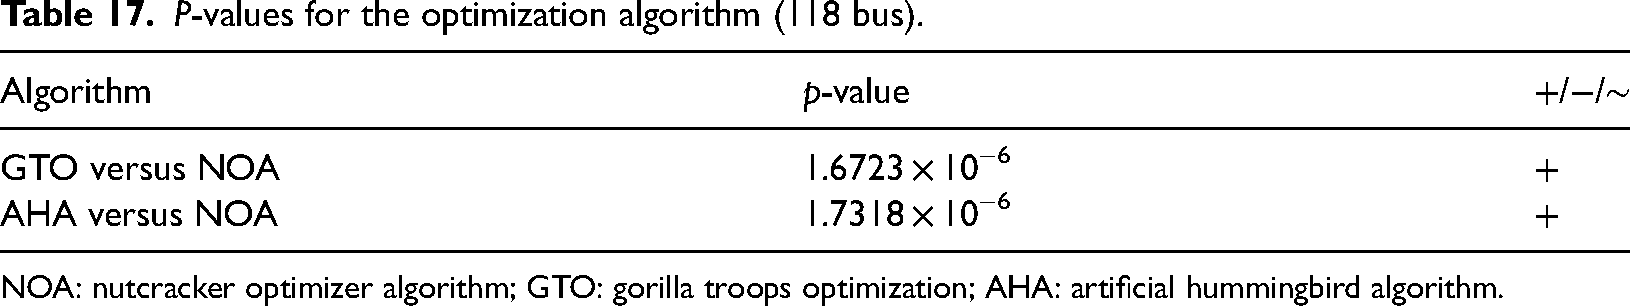
NOA: nutcracker optimizer algorithm; GTO: gorilla troops optimization; AHA: artificial hummingbird algorithm.
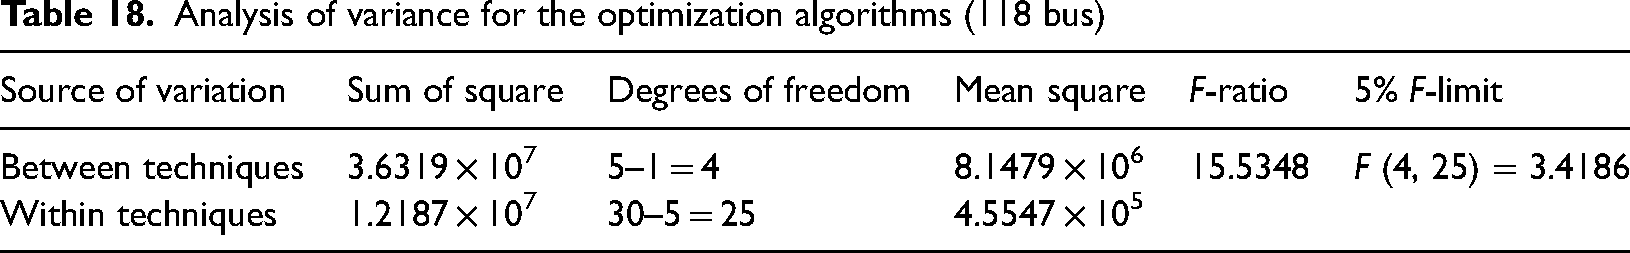
Additionally, as depicted in Table 18, the computed F-value for both systems falls below the tabulated F-value at a 5% significance level, with degrees of freedom specified as 4 and 25. In conducting the Friedman and Quade tests, an average error table is established in resembling Table 19. Subsequently, Friedman ranks, and the F-statistic (also referred to as the χ2 value) are computed and presented in Table 20. The method achieving the lowest rank is deemed superior, thereby highlighting the effectiveness of NOA. The calculated χ2 value of 16 from Table 20 surpasses the critical value, and the resulting p-value of 0.0030, falling below 0.05, leads to the rejection of the null hypothesis, indicating significant disparities among the employed methods. Similar patterns are observable in the Quade test outcomes showcased in Table 21, where NOA secures the lowest rank. The calculated Q-statistic value of 15 exceeds the referenced critical value by Verma and Mukherjee (2016a), and the resulting p-value of 1.9209 × 10⁻⁶, being below 0.05, supports the rejection of null hypothesis H0, thus reinforcing the efficacy of NOA.
Analysis of variance for the optimization algorithms (118 bus)
Representation of average error for GTO, AHA, and NOA (118 bus).
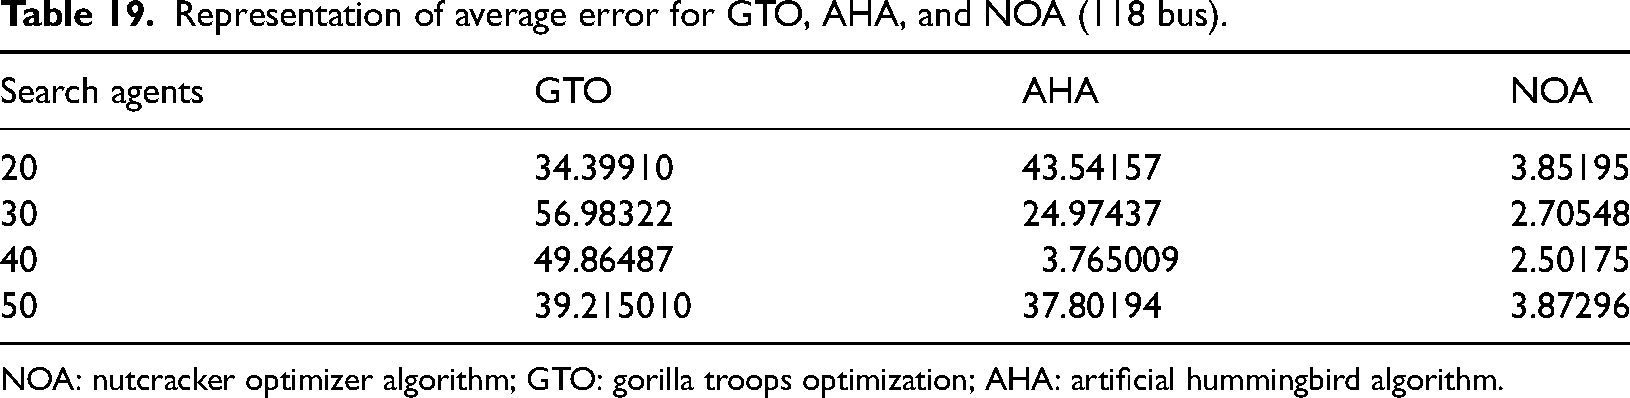
NOA: nutcracker optimizer algorithm; GTO: gorilla troops optimization; AHA: artificial hummingbird algorithm.
Representation of FRIEDMAN test analysis for GTO, AHA, and NOA (118 bus).
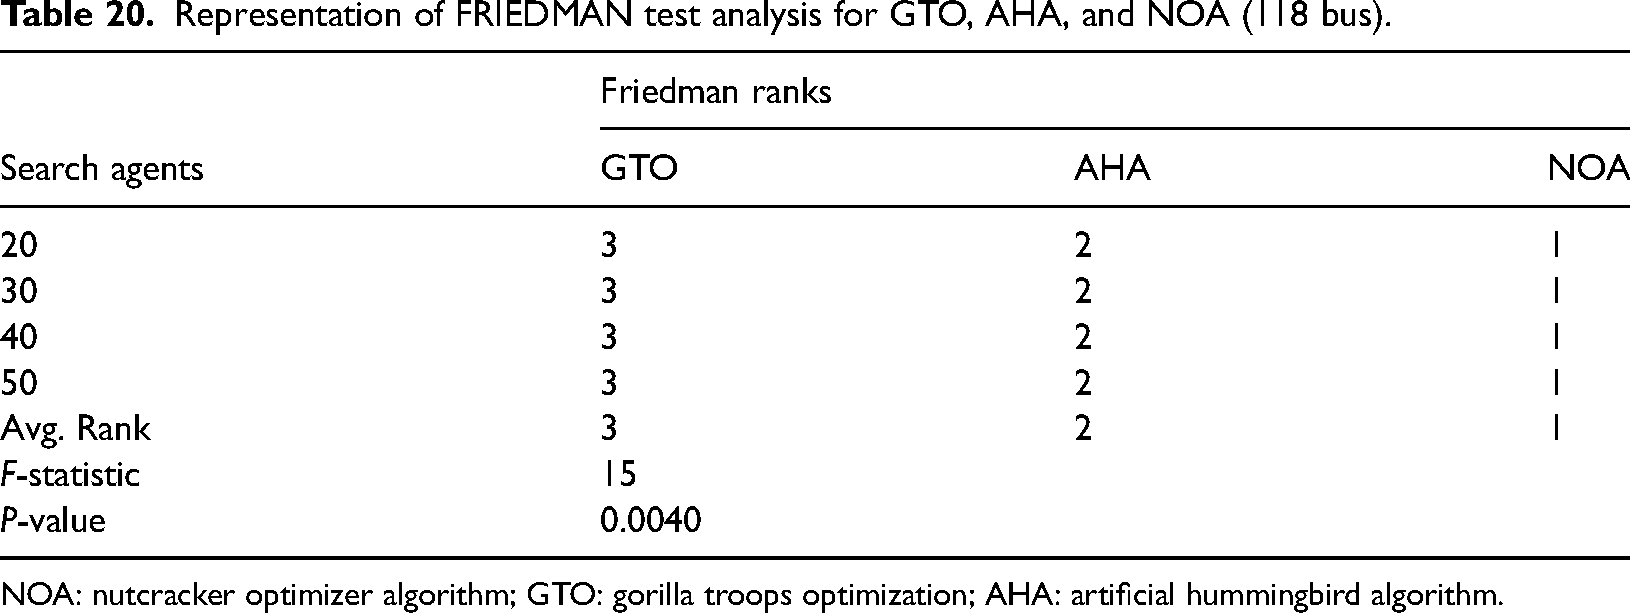
NOA: nutcracker optimizer algorithm; GTO: gorilla troops optimization; AHA: artificial hummingbird algorithm.
Representation of Quade test analysis for GTO, AHA, and NOA (118 bus).
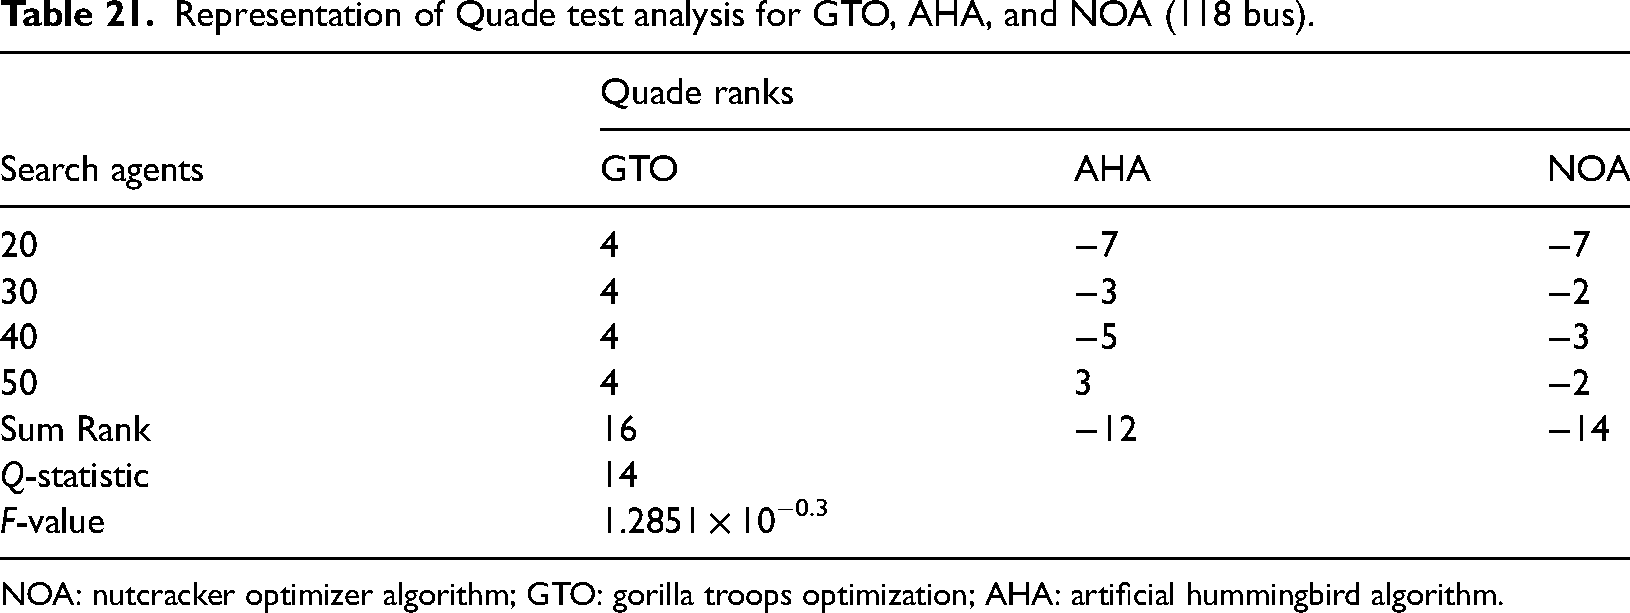
NOA: nutcracker optimizer algorithm; GTO: gorilla troops optimization; AHA: artificial hummingbird algorithm.
Conclusions
This research introduces a novel approach for power system CM within the power market, utilizing a generation rescheduling method. The contribution can be stated as the formulation of a novel CM model to minimize congestion costs through optimal rescheduling of generators’ real power, utilizing NOA for determining optimal power rescheduling patterns. This model's efficacy is validated on power system standard test systems, IEEE 30 bus, and IEEE 118 bus. Comparative performance analysis is conducted, assessing congestion cost reduction, bus voltage profile improvement, and system losses, demonstrating the superiority of the proposed CM model with NOA over contemporary optimization techniques. The method employs a unique NOA and accounts for contingencies like line outages and sudden load variations. It aims to alleviate congestion in overloaded lines by adjusting the power generation schedules while minimizing the congestion cost. The NOA technique has been successfully applied to IEEE 30- and IEEE 118-bus systems for CM purposes. Comparisons are made between the outcomes generated by the proposed NOA and various established algorithms documented in recent literature. Results indicate that the power rescheduled with NOA incurs lower congestion costs as compared to other similar techniques. Furthermore, applying CM reduces the overall system loss.
Consequently, the NOA offers a fresh and efficient approach to resolving power system CM challenges within a deregulated framework. Considering future approaches, the suggested approach for power system congestion management, employing NOA, has the potential for expansion towards optimizing power system operations, encompassing power dispatch and load scheduling strategies. It can also be utilized to examine the optimal positioning and control of power delivery from renewable energy systems and distributed generation, offering a comprehensive analysis of the proposed methodology.
Further, researchers dealing with large-scale power system issues might find the NOA a valuable optimization tool based on its demonstrated effectiveness. Research on power system transmission line congestion management using optimization techniques encounters several challenges. These include the complexity of power networks, data availability and accuracy issues, long computational times, the need for adaptable algorithms, and the integration of renewable energy sources. Overcoming these limitations is essential for enhancing the effectiveness and practicality of optimization approaches in real-world applications. Further, the researchers dealing with large-scale power system issues might find the NOA a valuable optimization tool based on its demonstrated effectiveness.
Footnotes
Declaration of conflicting interests
The author(s) declared no potential conflicts of interest with respect to the research, authorship, and/or publication of this article.
Funding
The author(s) received no financial support for the research, authorship, and/or publication of this article.
Appendix
Notation list.
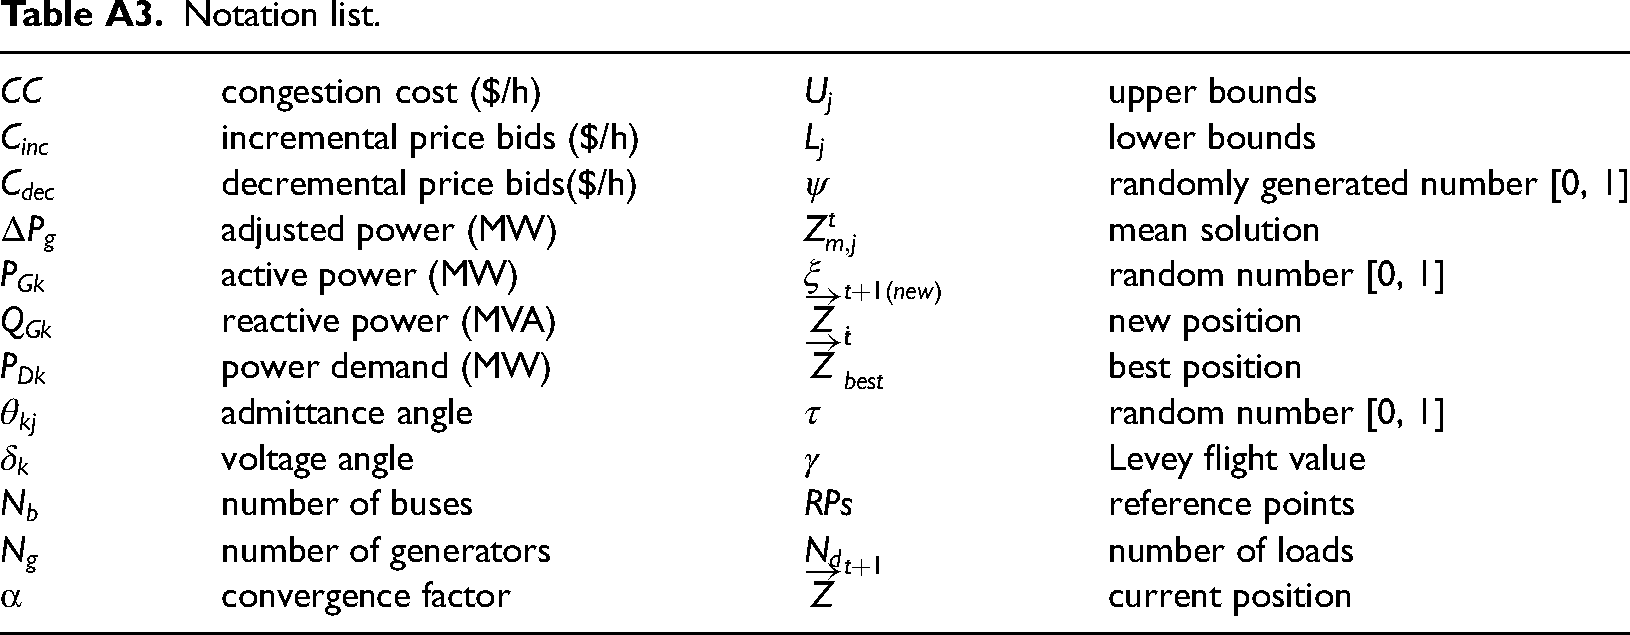
| congestion cost ($/h) | upper bounds | ||
| incremental price bids ($/h) | lower bounds | ||
| decremental price bids($/h) | ψ | randomly generated number [0, 1] | |
| adjusted power (MW) | mean solution | ||
| active power (MW) | ξ | random number [0, 1] | |
| reactive power (MVA) | new position | ||
| power demand (MW) | best position | ||
| admittance angle | τ | random number [0, 1] | |
| voltage angle | Levey flight value | ||
| number of buses | RPs | reference points | |
| number of generators | number of loads | ||
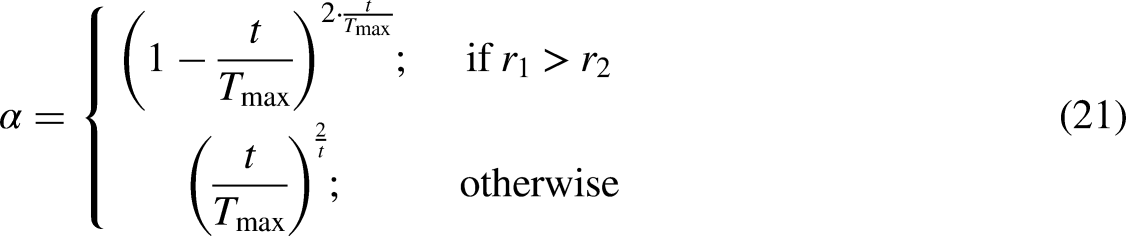
| α | convergence factor | current position |