
Abstract
It is crucial to understand the conditions and influencing mechanisms of shale gas slip effect for predicting the productivity of shale gas reservoirs. This study focuses on the Carboniferous Hurleg Formation shales in the eastern Qaidam Basin and conducts gas permeability tests using different gases (He/N2), as well as geochemical and pore-structure tests. The slip behavior of different gases in micro- and nanopores as well as the anisotropy of gas permeability were analyzed and discussed. The results show that helium permeability is 1.81–3.56 times higher than nitrogen permeability, with a greater difference at lower pore pressures. These permeability differences are attributed to variations in gas molecule size and slip effects. Specifically, the slip effect of helium gas has a greater contribution to permeability at lower pore pressures, with a helium slip factor averaging 2.79 times that of nitrogen. The effective pore size of shale, calculated based on the helium slip factor, is 0.74 to 1.51 times larger than when nitrogen is used, with an average of 1.67 times. Helium molecules have smaller diameters and longer average molecular free paths, resulting in a more pronounced slip effect compared to nitrogen. While helium does not adsorb, nitrogen exhibits some adsorption, causing radial expansion during gas penetration. Furthermore, when testing with different gases, the horizontal permeability (S043∥; S052∥) is higher than the vertical permeability (S043⊥; S052⊥). The anisotropy of permeability is controlled by the pore system formed by the arrangement and combination of minerals. Calcium-rich samples (S052) tend to exhibit higher anisotropy compared to calcite-rich samples (S043). The effective pore size in the vertical sample is larger than that in the parallel sample, and the gas slip effect is significantly greater in the vertical sample. These findings provide valuable data for future studies on shale gas slip effects and productivity prediction.
Introduction
The presence of numerous micro–nanopores results in highly complex flow behavior in shale reservoirs (Ghanizadeh et al., 2014; Nelson, 2009). The flow mechanism of shale gas mainly includes gas desorption and diffusion in the micropores of kerogen/clay, Darcy’s flow in macropores and microfractures (Amann-Hildenbrand et al., 2012; Chalmers et al., 2012; Javadpour, 2009; Javadpour et al., 2007). In micropores and mesopores, the pore size approaches the mean free path of gas molecules, gas molecules do not have close contact with the pore surface, resulting in a nonzero velocity on the reservoir surface (Civan, 2010; Javadpour et al., 2007). Gas molecules tend to “slip” on the pore surface (Fathi et al., 2012; Firouzi et al., 2014; Li et al., 2016). This gas slip phenomenon can be described by Klinkenberg's (1941) Equation (1):
According to the capillary bundle hypothesis and thermodynamics theory, the relationship between the slip factor b and relevant parameters can be expressed by Equation (2) (Ghanizadeh et al., 2014):
Various researchers have conducted gas flow tests to determine Klinkenberg's slip factor (Civan, 2010; Heid et al., 1950; Jones and Owens, 1980; Letham and Bustin, 2016; Ren et al., 2016; Wang et al., 2016). For instance, Heid et al. (1950) measured the air permeability of rock samples and applied Klinkenberg correction to obtain the slip factor. Jones and Owens (1980) proposed an empirical formula for the slip factor in low-permeability rocks. Letham and Bustin (2016) determined the slip factor of helium through pressure pulse attenuation experiments and analyzed pore characteristics in shale relative to the size-dependent slippage factor. Wang et al. (2016) tested the argon permeability of tight rock samples and analyzed the correlation between slip coefficient and absolute permeability. Ren et al. (2016) measured gas permeability using nitrogen gas as the pore fluid and investigated gas flow behavior in fractured cores. However, these studies predominantly calculate the slip factor for a specific gas based on sample permeability measured with that gas. Limited published literature exists on measuring the permeability of rock samples using different gas types, especially in the context of shale, where different gases exhibit diverse transport mechanisms within the complex pore structure (Ren et al., 2016). The slip effects of different gases in shale are yet to be addressed in published research.
The reservoir structure is complex and compact, with low permeability, diverse gas transport mechanisms, and difficult-to-accurately measure seepage-related parameters. Permeability is one of the key factors determining shale gas recovery. The study of the flow law of shale gas in micro–nano cracks must consider the influence of the slippage effect. Understanding the existing conditions and influencing mechanism of the shale gas slippage effect is of great significance for shale gas reservoir capacity prediction. In this study, the focus is on analyzing the effects of different test media on permeability and measuring the gas permeability (He/N2) of six shale samples from the Carboniferous Hurleg Group Formation in the eastern part of the Qaidam Basin, China. The measurements were conducted at pore pressures up to 4.0 MPa and 25°C. The slip of different gases in micro- and nanopores, as well as the gas slip factor, were analyzed and discussed. Additionally, the effective pore diameter of the shale was calculated for different gases, and the anisotropy of gas permeability was further investigated.
Geological background
The eastern Qaidam Basin, China is one of China's significant oil-bearing basins and consists of four primary tectonic units: the Yanya depression, the northern block fault zone, the Sanhu depression, and the Delingha depression. The Delingha depression, located in the eastern part of the Qaidam Basin, is divided into four secondary structural units: the Delingha sag, the Olongbrook bulge, the Erbei sag, and the Emnick bulge (Figure 1). In this area, the Carboniferous strata are well-developed and widely distributed. These strata formed in a lacustrine sedimentary environment under warm and humid climates, resulting in the presence of dark mudstone, hydrochlorite, coal, and carbonaceous mudstone. These conditions are favorable for oil and gas enrichment. The carboniferous system in eastern Qaidam has high organic matter abundance, strong hydrocarbon generation capacity and at least two stages of the oil and gas agglomeration process, and the Carboniferous oil and gas exploration potential is large (Wang, 2022; Yang, 2021). In 2021, the Qingde Shen 1 well in the Ounan sag of the Qaidam Basin was drilled at a depth of 4002.5 m, and after the oil-bearing fracturing test of the mud shale of the Hurleg Formation, a stable oil flow of the carboniferous system was obtained, and the maximum flow rate was obtained for 105.77 m3/h, with an average of 90.5 m3/h, which was converted to a daily gas output of 2172 m3/d, and the carboniferous system was established as the fourth oil-bearing system in the Qaidam Basin. The eastern part of the Qaidam Basin is a new area for carboniferous oil and gas exploration (Ma et al., 2022).
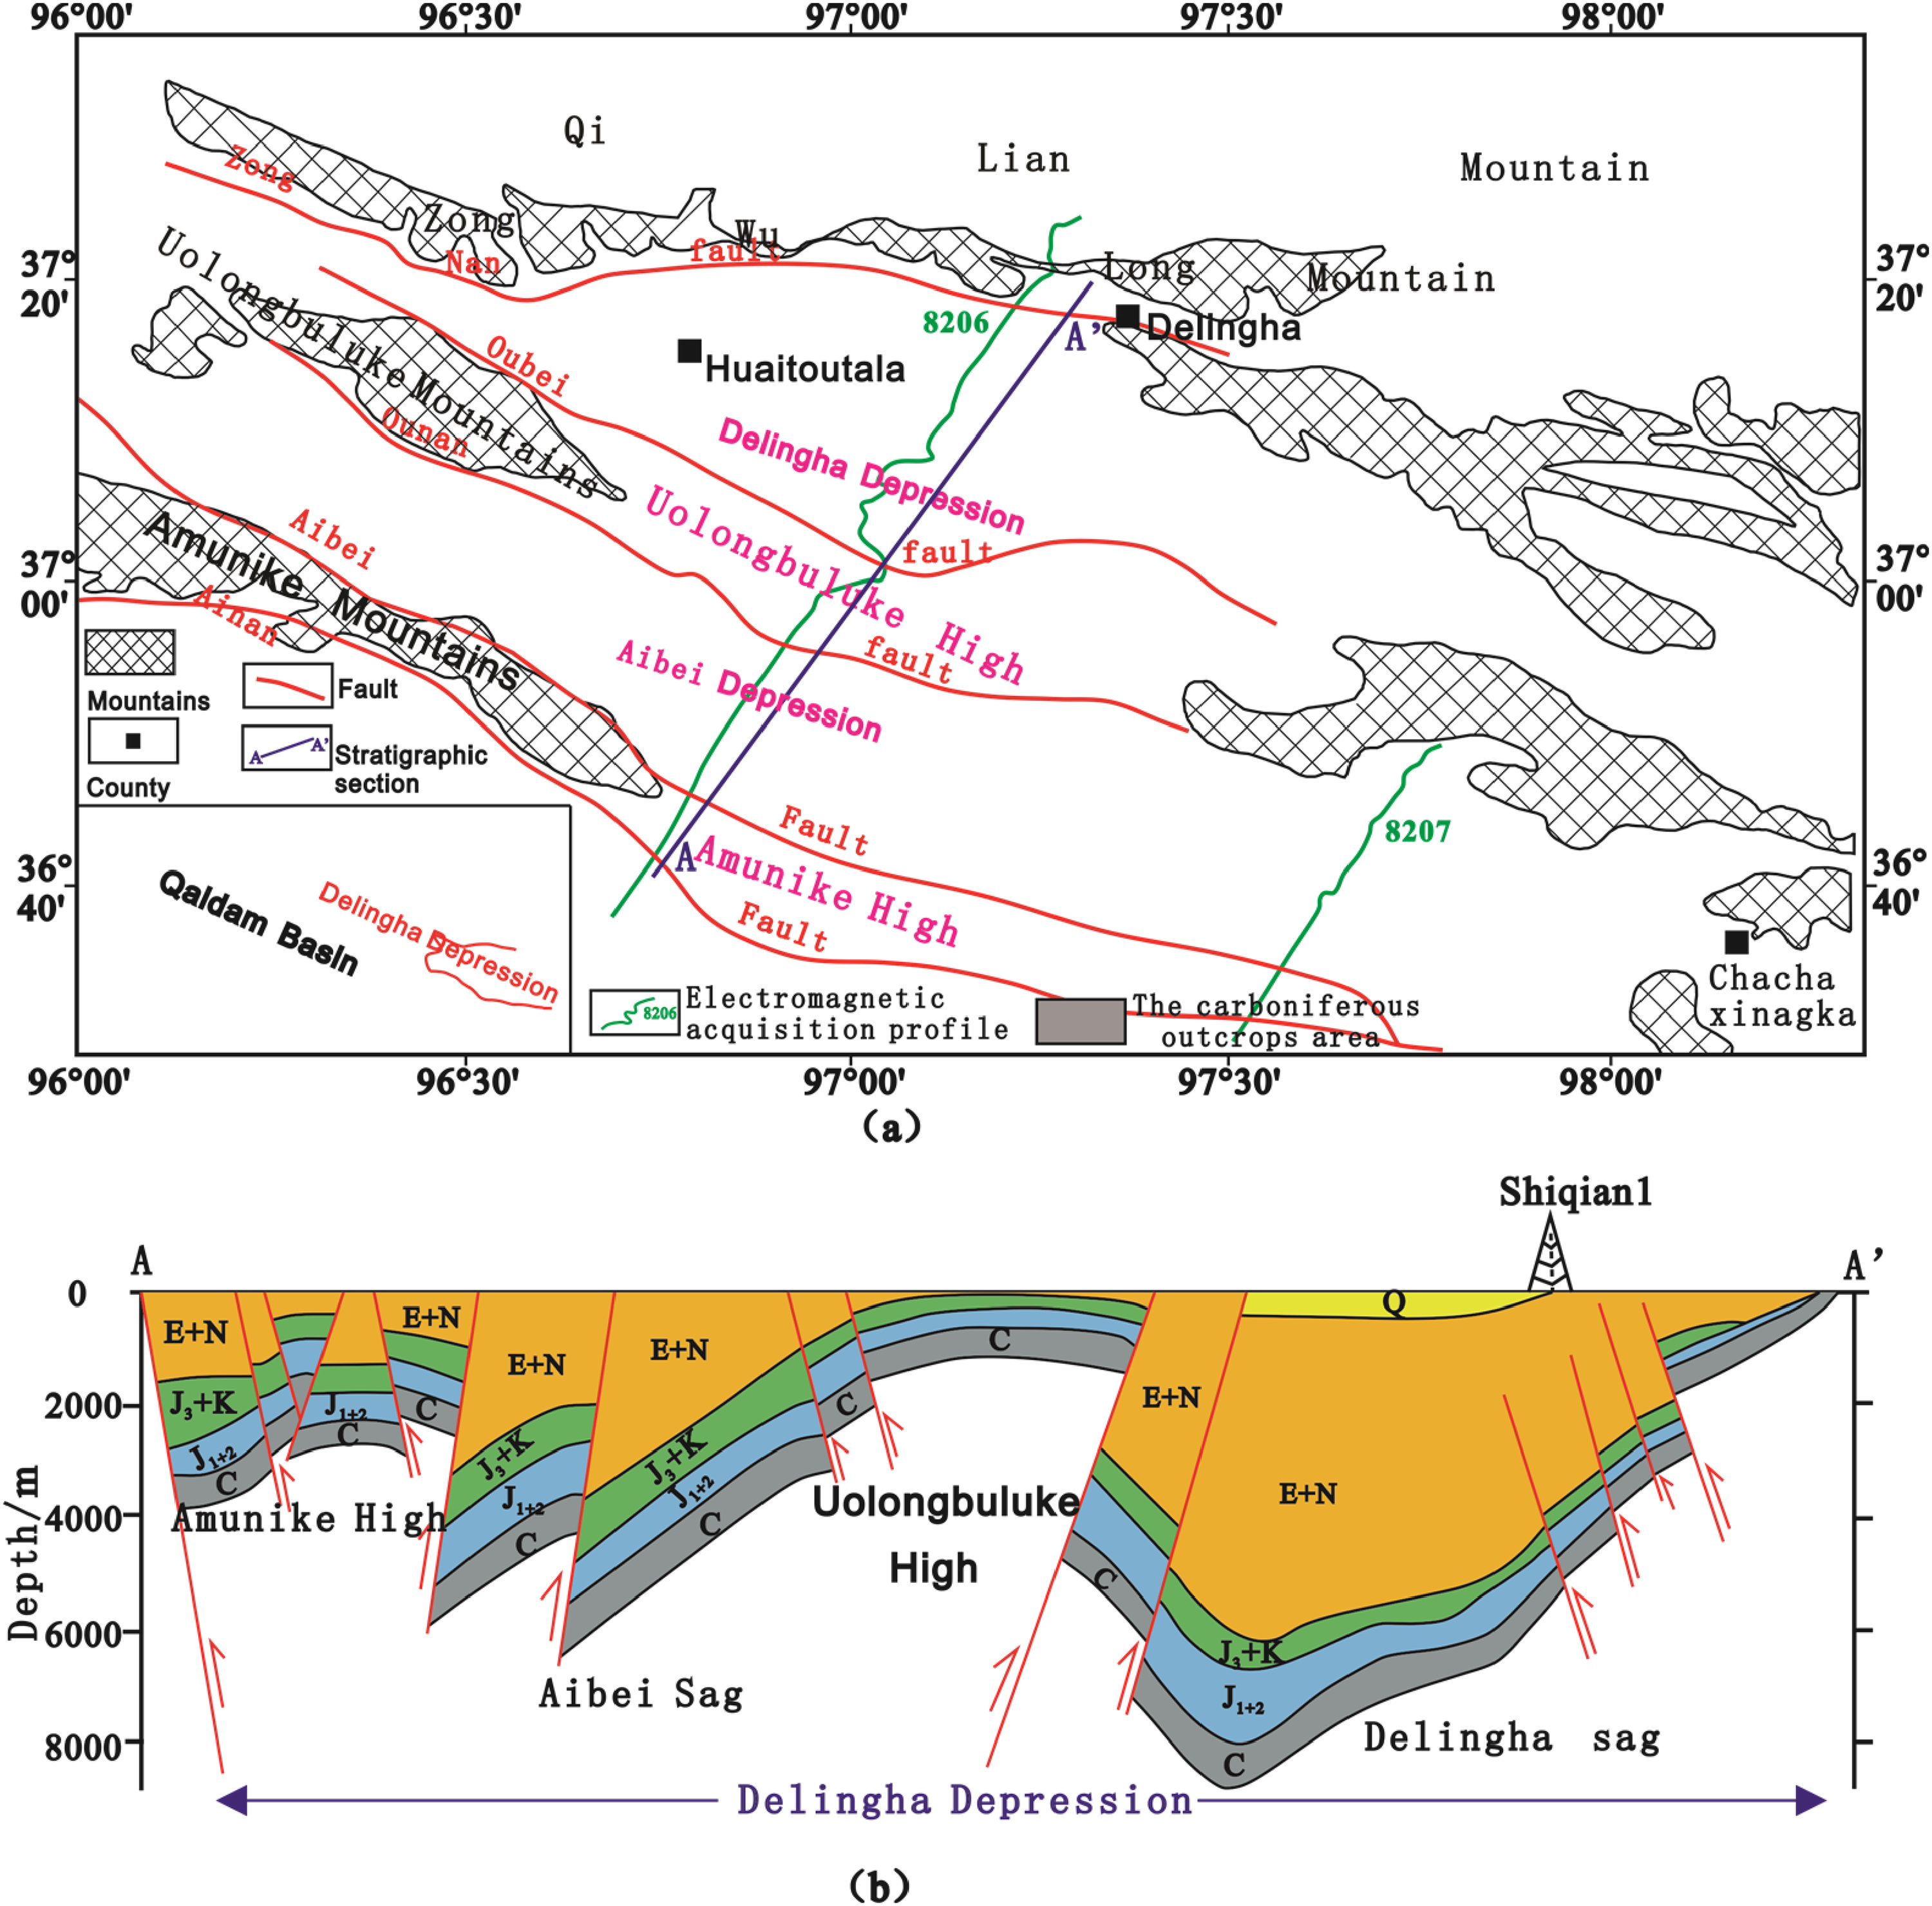
Comprehensive geological introduction of the Delingha depression in the Qiadam Basin (a) the tectonic division and profile position; (b) stratigraphic profile.
Samples and experiments
Selection of shale sample
Sampling locations and lithologic logs within the 800–1000 m range of the borehole formation are shown in Figure 2. The samples were collected from the Shiqian-1 core drilling well of Shihui Trough of the Carboniferous Hurleg Formation, with samples S025, S043, S052, and S065 obtained from depths of 833 m and 894 m. All samples were trimmed to dimensions of Ф25 × 10 mm (Table 1). Samples S025 and S065 were collected perpendicular to the bedding layer, while samples S043 and S052 were taken perpendicular and parallel to the bedding layer, respectively. Figure 3 shows a schematic diagram of the sample preparation process.
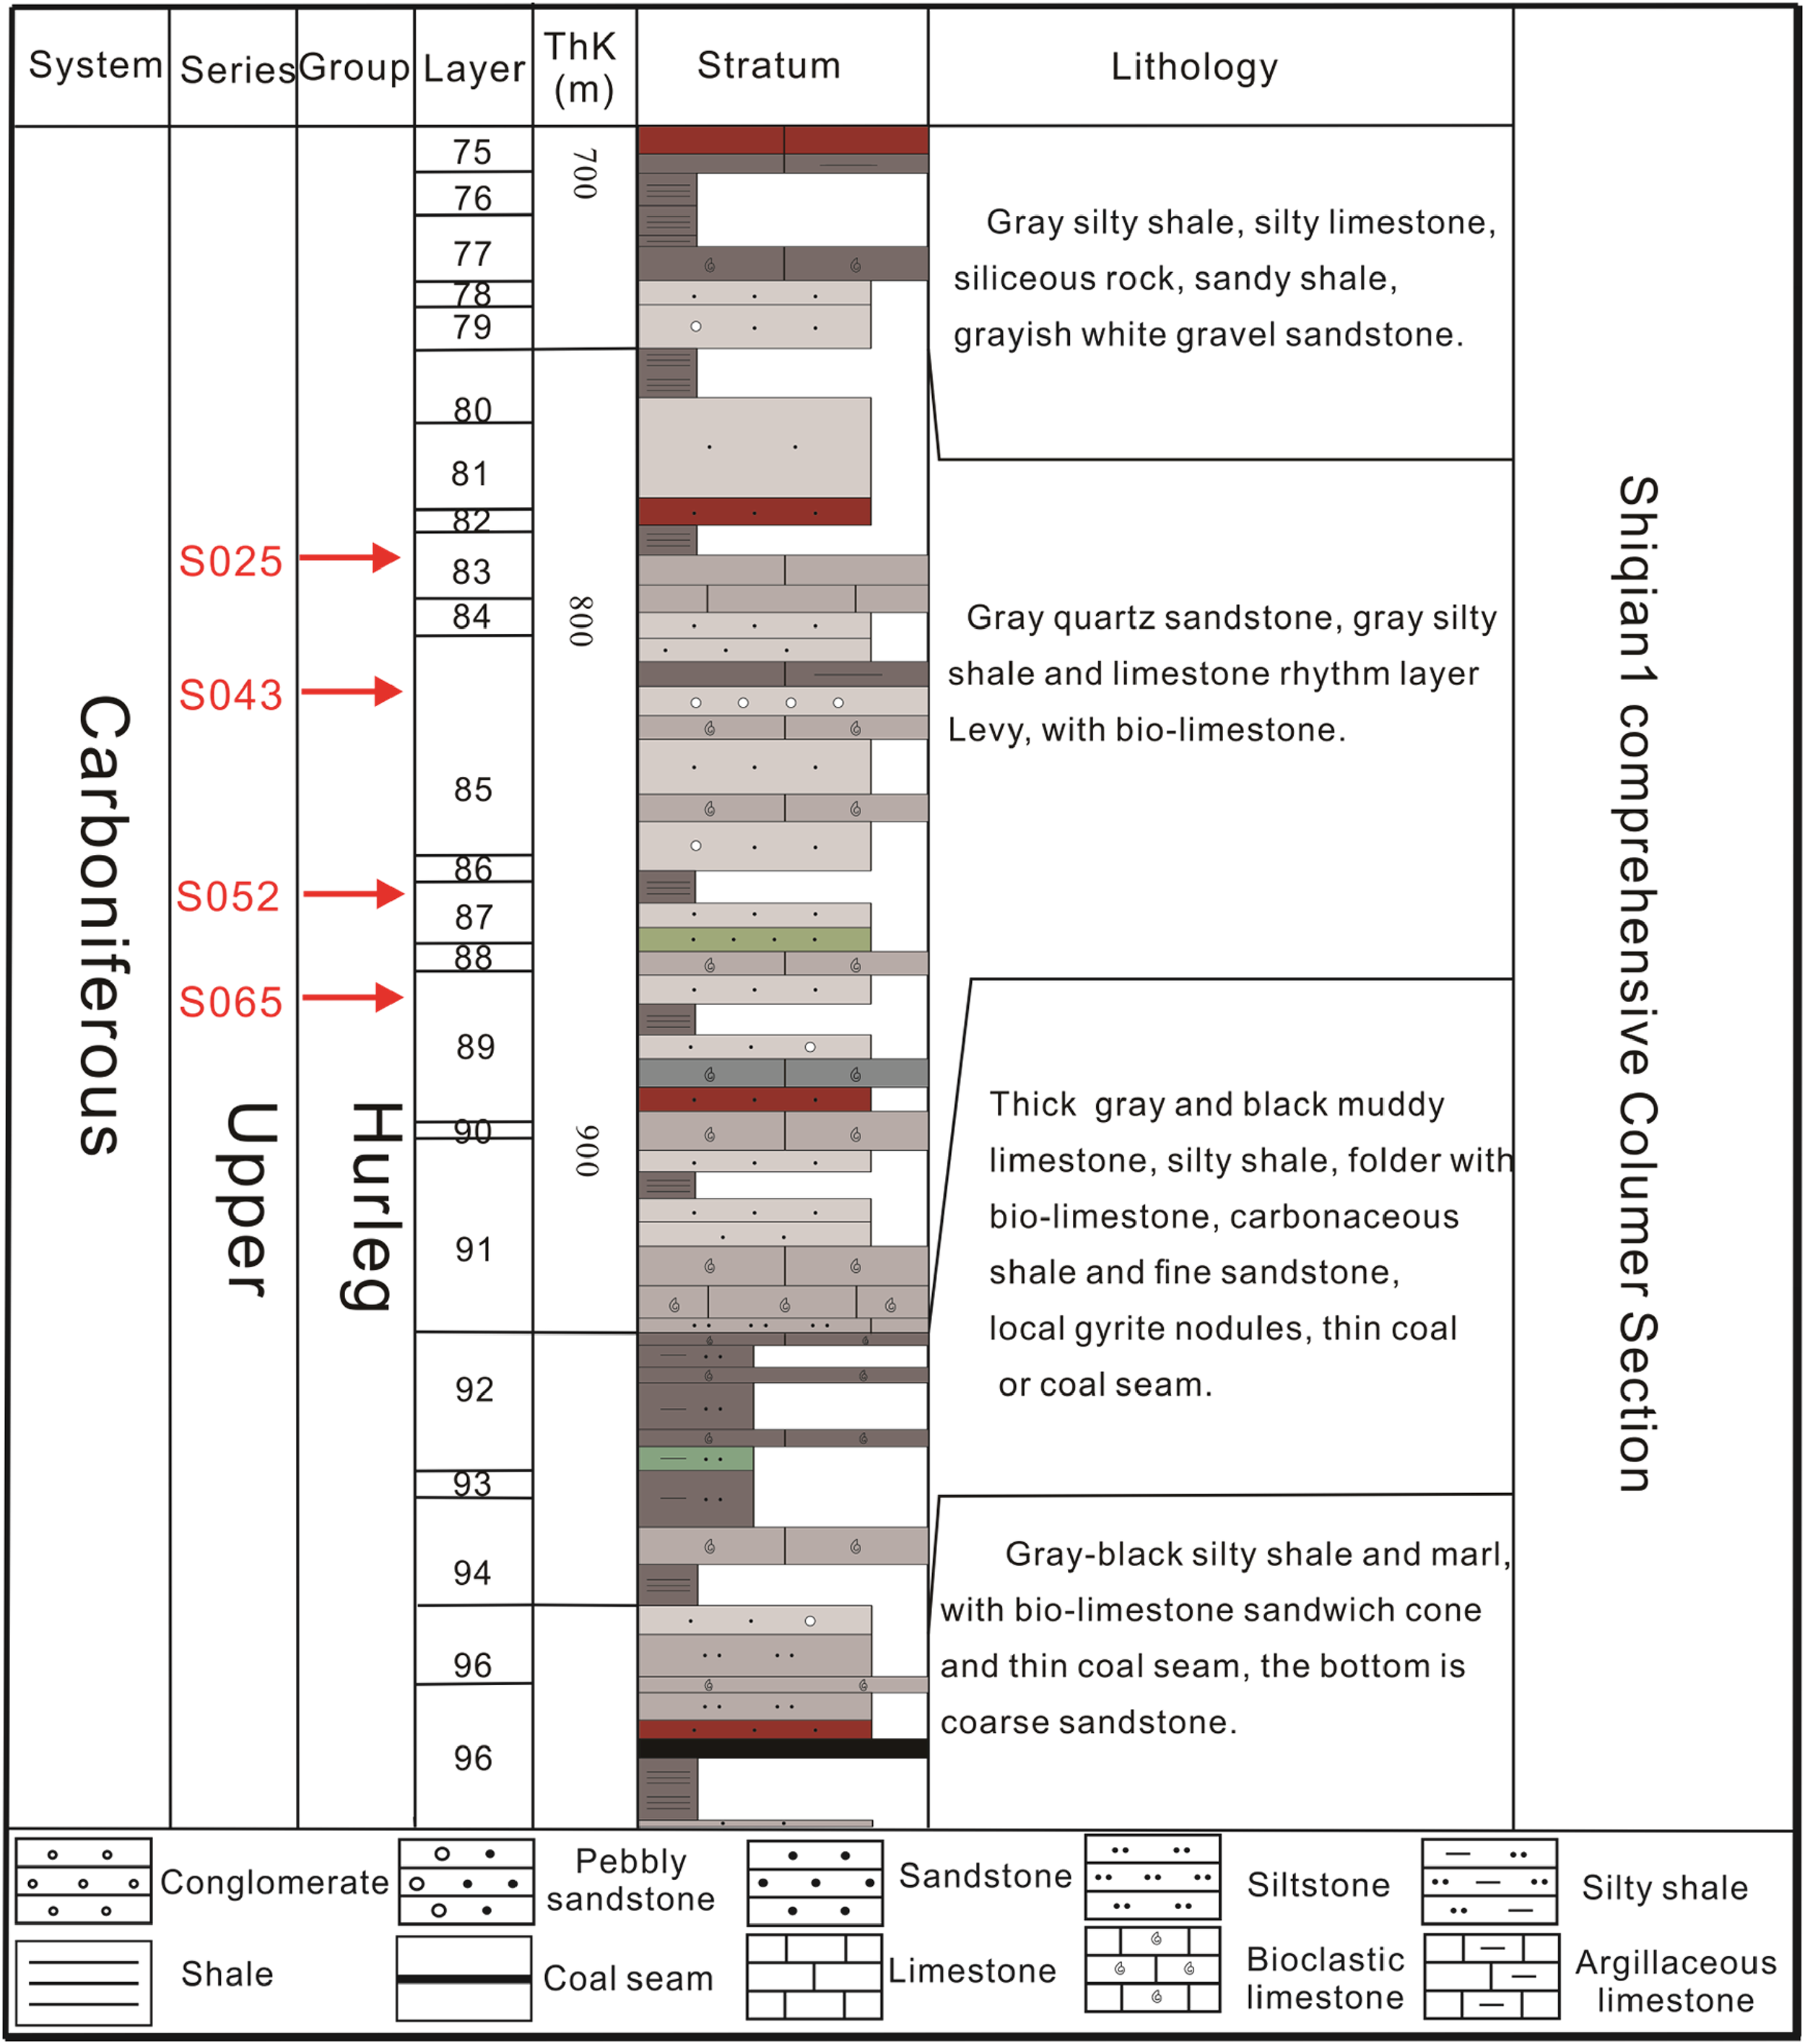
Sampling locations and stratigraphic column of Shiqian1 drilling.
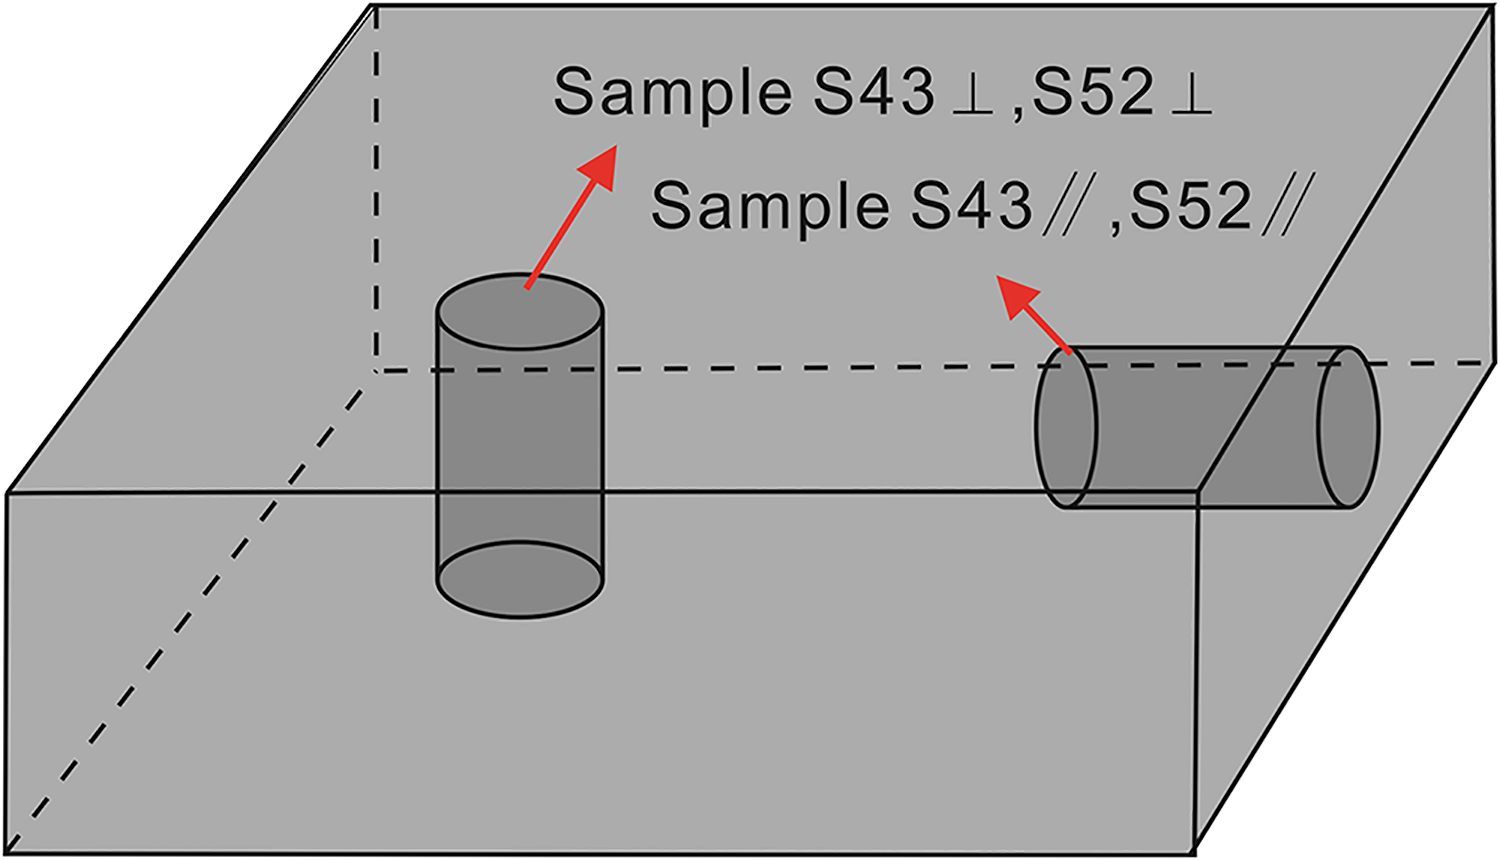
Schematic diagram illustrating the sample preparation process.
Basic data of the shale samples analyzed in this study.
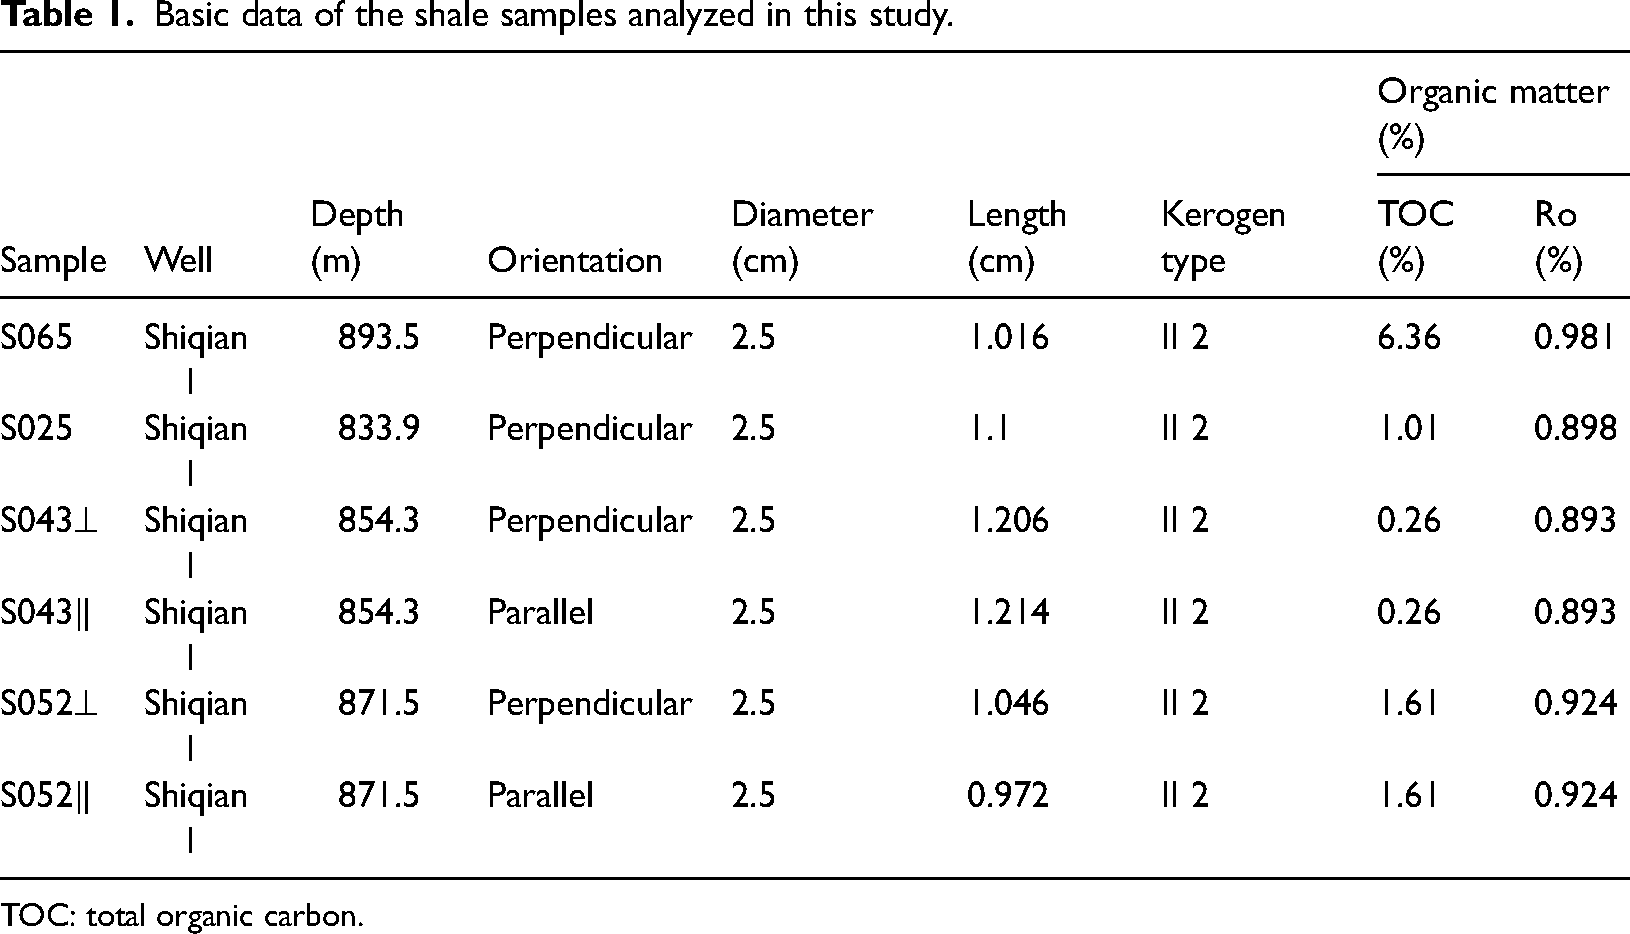
TOC: total organic carbon.
Apparatus for steady-state permeability measurements
A schematic diagram depicting the steady-state permeability measuring instrument used in this study is presented in Figure 4. The device consists of several components, including the gas pressure control system, gas injection system, liquid injection system, vacuum control system, core clamping system, detection system, data collection and processing unit, and constant temperature control system, among others. The gas pressure control system ensures continuous gas injection at constant pressure with a pressure control range of 0–50 MPa (accurate to 0.01 MPa), allowing continuous gas injection at a constant pressure. The maximum injection pressure is 20 MPa, and the injection flow rate ranges from 0.1 to 20 ml/min. The vacuum control system, composed of a vacuum pump and a vacuum valve, achieves a vacuum degree of up to −0.1 MPa. The core clamping system, a crucial part of the instrument, accommodates cores with a diameter of 25 mm and lengths ranging from 5 mm to 100 mm. The internal rubber sleeve resists high temperatures, alkalis, and acids, withstanding a maximum hoop pressure of 50 MPa and a displacement pressure of 40 MPa. The detection system records the gas flow at the outlet. A thermostat controls the internal temperature of the entire device, preventing errors due to temperature variations. The thermostatic control system maintains a constant temperature within the device, with a temperature control range of up to 120°C. The data acquisition system is connected to a computer system for automated data collection.
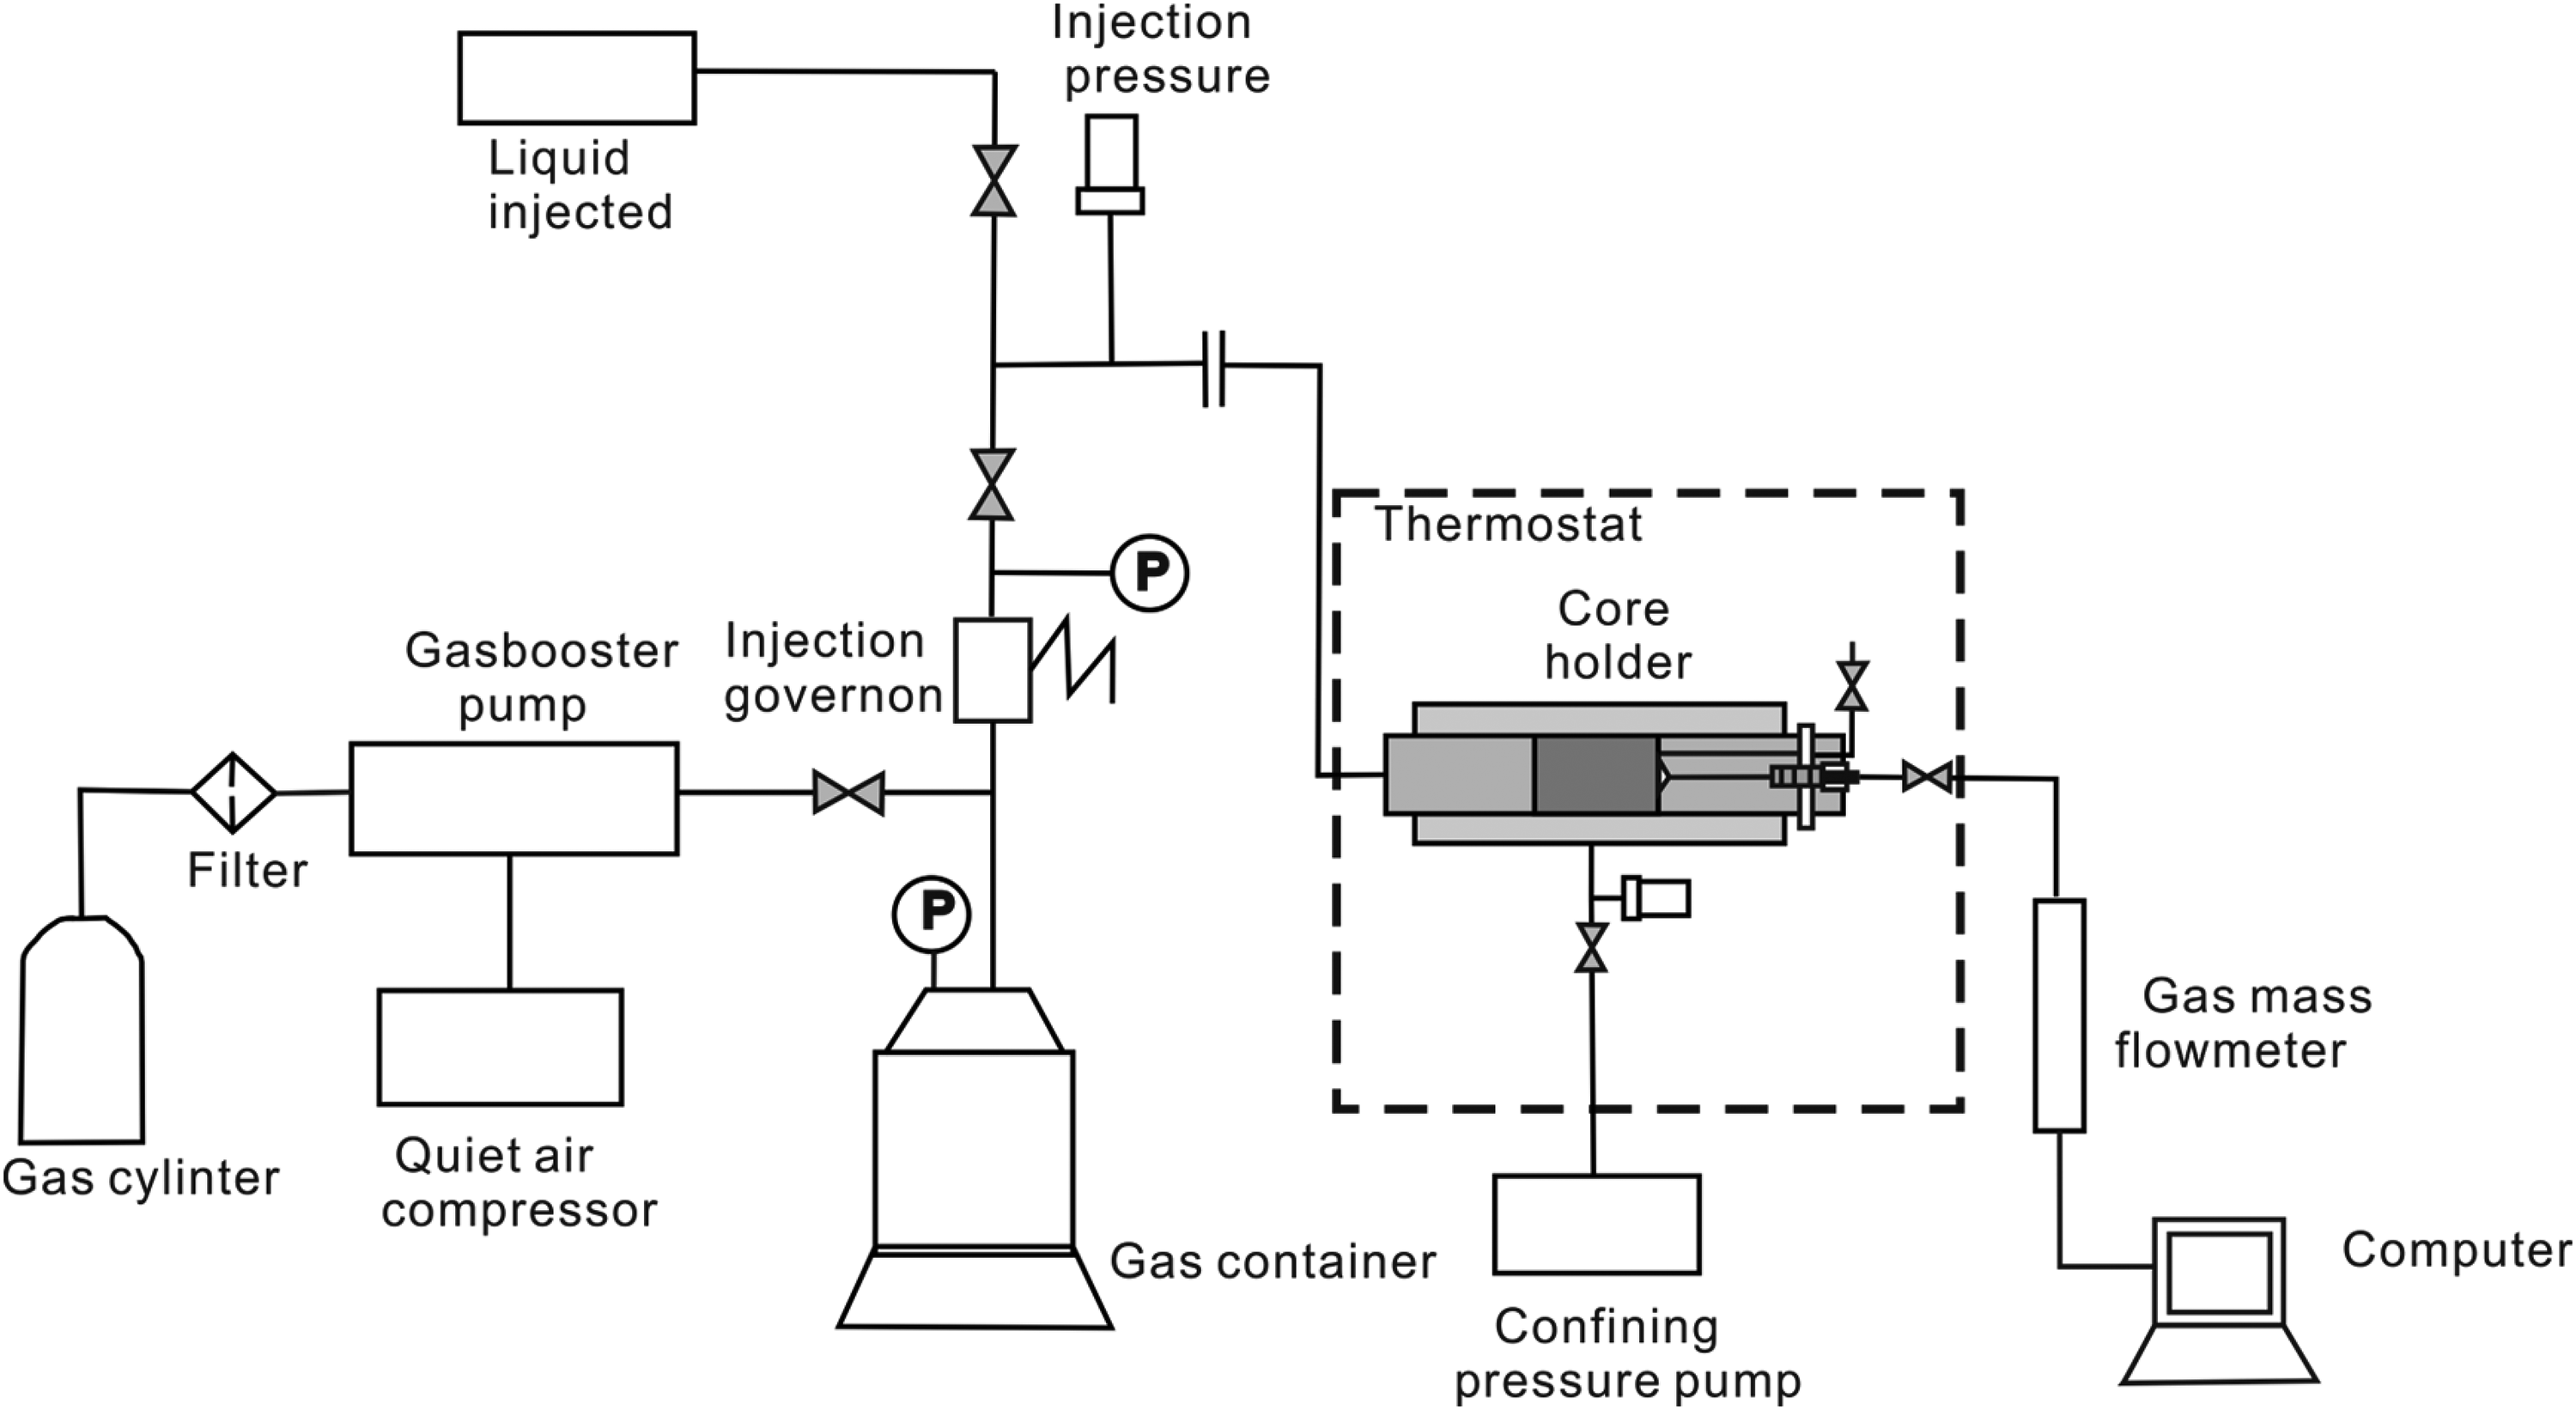
Schematic diagram of the steady-state permeability measuring instrument.
Experimental methods
Geochemical analyses
X-ray diffraction (XRD) was used to analyze the mineral composition of shale samples. The procedure includes grinding the sample into particles with a diameter of 75μm, drying at 105°C for 12 h, cooling in a dry environment, and X-ray diffractometer scanning at 25°C for a range of 0 to 70°. The diffraction pattern was used to determine the mineral composition and content.
The content of organic content (total organic carbon [TOC]) determines the intensity of hydrocarbon generation, so it determines the amount of hydrocarbon generation and is a necessary index for evaluating shale gas reservoirs. The process involved removing inorganic carbon by treating the sample with dilute hydrochloric acid. Then, the powdered samples (<200 mesh, 0.074 mm) were burned in an oxygen flow at 900∼1000°C, converting the organic carbon into CO2. The production of CO2 was measured using a carbon/sulfur analysis (Leco SC-144DR)r, and the TOC content was calculated based on the CO2 production.
Vitrinite reflectance (Ro) is a commonly used parameter to assess rock maturity. In this study, the experiment utilized the MPV-SP microphotometer (Hitachi F7000). The power supply voltage was controlled at 220V ± 10%, with a frequency range of 50∼60 Hz. The test temperature was maintained at 20∼26°C, and the relative humidity was kept below 70%. The wavelength used was 546 nm, with a magnification of 125 times. The reflectance range spanned from 0.1% to 10.0%, with a resolution of 0.01%. The Axioskop 2-plus biological microscope was used to determine the Kerogen type.
Microstructural characteristics
To comprehensively characterize the pore distribution of shale samples, low-pressure CO2 adsorption, low-pressure N2 adsorption, and Mercury intrusion porosimetry experiments were performed to examine their pore structures. The pore structure analysis covered micropores (0.3–1.47 nm), mesopores (1.2–77 nm), and macropores (≥ 50 nm).
The Autosorb-IQ-MP micropore analyzer produced by Quantachrome was used to determine the low-pressure N2 adsorption isotherm. The instrument aperture ranged from 0.35 to 500.00 nm. The experimental conditions consisted of a low temperature of −195.8 °C and a pressure range of 97.3 to 127.0 kPa. The powder size used was 0.28 to 0.18 mm (60 to 80 mesh).
The Autosorb-IQ-MP micropore analyzer was used to determine the low-pressure CO2 adsorption isotherm. The low-temperature CO2 adsorption test is performed using the principle of physical adsorption and capillary condensation of CO2 on a solid surface under saturation and temperature conditions. The test was carried out at liquid CO2 saturation temperature (273 K), and the relative pressure was 0.05–0.99. The density functional theory model was employed to analyze the CO2 adsorption data to obtain the pore size distribution, Barrett–Joynere–Halenda (BJH) model was employed to analyze the N2 adsorption data to obtain the pore size distribution, and Brunauer–Emmett–Teller (BET) model was used to calculate the specific surface area of shale samples.
The macropore size distribution was determined through high-pressure mercury injection using the Pore Master GT 60 instrument by Quantachrome Corporation, Florida, America. The instrument pressure range spanned from 0.1 MPa to 448.0 MPa. The specific test conditions were as follows: mercury contact angle of 140°, surface tension of 0.48 N/m, dilatometer volume of 0.5 mL, and scanning mode (Scan Mode) employed. The mercury intrusion curve reflects the connected pore structure characteristics of the sample, while the mercury injection curve reveals the structural characteristics of the sample's connectivity pore (Li et al., 2015).
Steady-state permeability measurements
The experiment was conducted at a temperature of 25°. Prior to the experiment, the sample was dried for 6 h in an oven set at 105°C. The dry core is then placed into the core holder. The inlet is connected to the air pump, and the outlet is connected to the exhaust pipe. A suitable pressure difference was established between the inlet and outlet using a gas booster pump. The values of inlet and outlet pressures were recorded, and the flow rate through the sample was measured. During the experiment, the confining pressure was controlled by a QUIZIX pump to maintain constant pressure, set at more than twice the inlet pressure to prevent gas channeling around the rock sample. Eighteen sets of experiments were performed at different inlet pressures ranging from 0.5 to 4 MPa. The gas at the core outlet was released to atmospheric pressure, resulting in a constant outlet pressure of 0.101 MPa. Once the outlet gas flow rate stabilized, the average pore pressure (p) was determined by taking the average of the inlet and outlet gas pressure, represented as p = (pi + po)/2, where pi and po denote the inlet pressure and outlet pressure, respectively. The apparent gas permeability of shale samples was calculated using the stable pressure difference and gas flow rate.
The conventional calculation of gas permeability is given by Equation (4):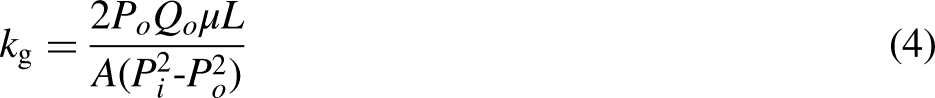
The Klinkenberg slip factor can be determined by the slope of the straight line on the Klinkenberg plot, as shown in Equation (5) (Letham and Bustin, 2016):
Results
Results of organic geochemical tests and XRD analysis
The organic matter carbon content of shale samples ranges from 0.26 wt.% to 6.36 wt.% (Table 1). This demonstrates significant variation in organic matter content among the four shale samples. Sample S065 exhibits the highest TOC content of 6.36%, whereas sample S043 has the lowest TOC content of 0.26%. The Ro value ranges from 0.893% to 0.981%. The organic matter type of source rock is mainly type II; the source rocks are in the stage of the low mature-mature thermal evolution, and have good hydrocarbon generation potential.
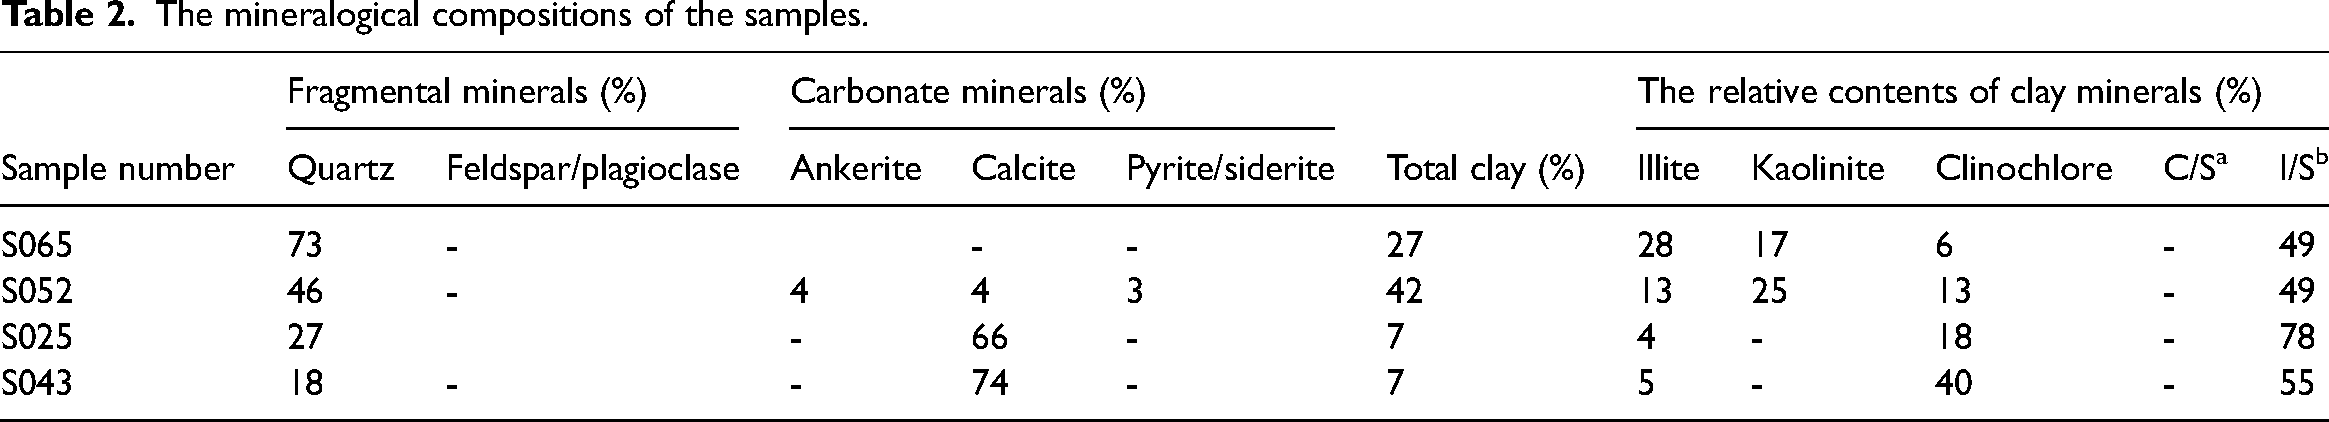
Table 2 presents the mineralogical compositions of the samples. The XRD results indicate that this carboniferous shale formation has a wide range of inorganic fraction composition. The main mineral components are quartz, calcite, and clay. Sample S065 has the highest quartz content (73%), while sample S043 and S025 have the higher calcite content (74% and 66%), and sample S052 has a relatively high clay content (42%). It is noteworthy that the predominant clay minerals are a mixed layer of illite and smectite, but also contain kaolinite, albite, and clinochlore.
The mineralogical compositions of the samples.
Pore-structure parameters
Table 3 presents the microstructure characteristic parameters of samples S065, S052, S043, and S025. The results indicate that the shale samples exhibit low porosity, ranging from 2.07% to 4.68%. Figure 5 provides an overview of the specific surface area and pore volume of mesopores and micropores, measured through nitrogen adsorption and carbon dioxide adsorption respectively. The specific surface area and pore volume showed a similar trend among all four samples. There is also a wide variation in the BET surface area of mesopores and micropores (Figure 5(a), (c). Sample S025 displays the highest surface area, while sample S043 exhibits the least. The pore surface areas of S065 and S052 are similar. Applying the BJH theory, sample S025 demonstrates the largest mesopore volume (0.0208 m3/g), while sample S043 has the smallest (0.002925 m3/g) (Figure 5(b)). Significant differences in micropore volume determined by CO2 adsorption analysis are also observed (Figure 5(d)). Sample S025 possesses the largest micropore volume (0.00314 m3/g), whereas sample S043 exhibits the smallest (0.00009 m3/g).
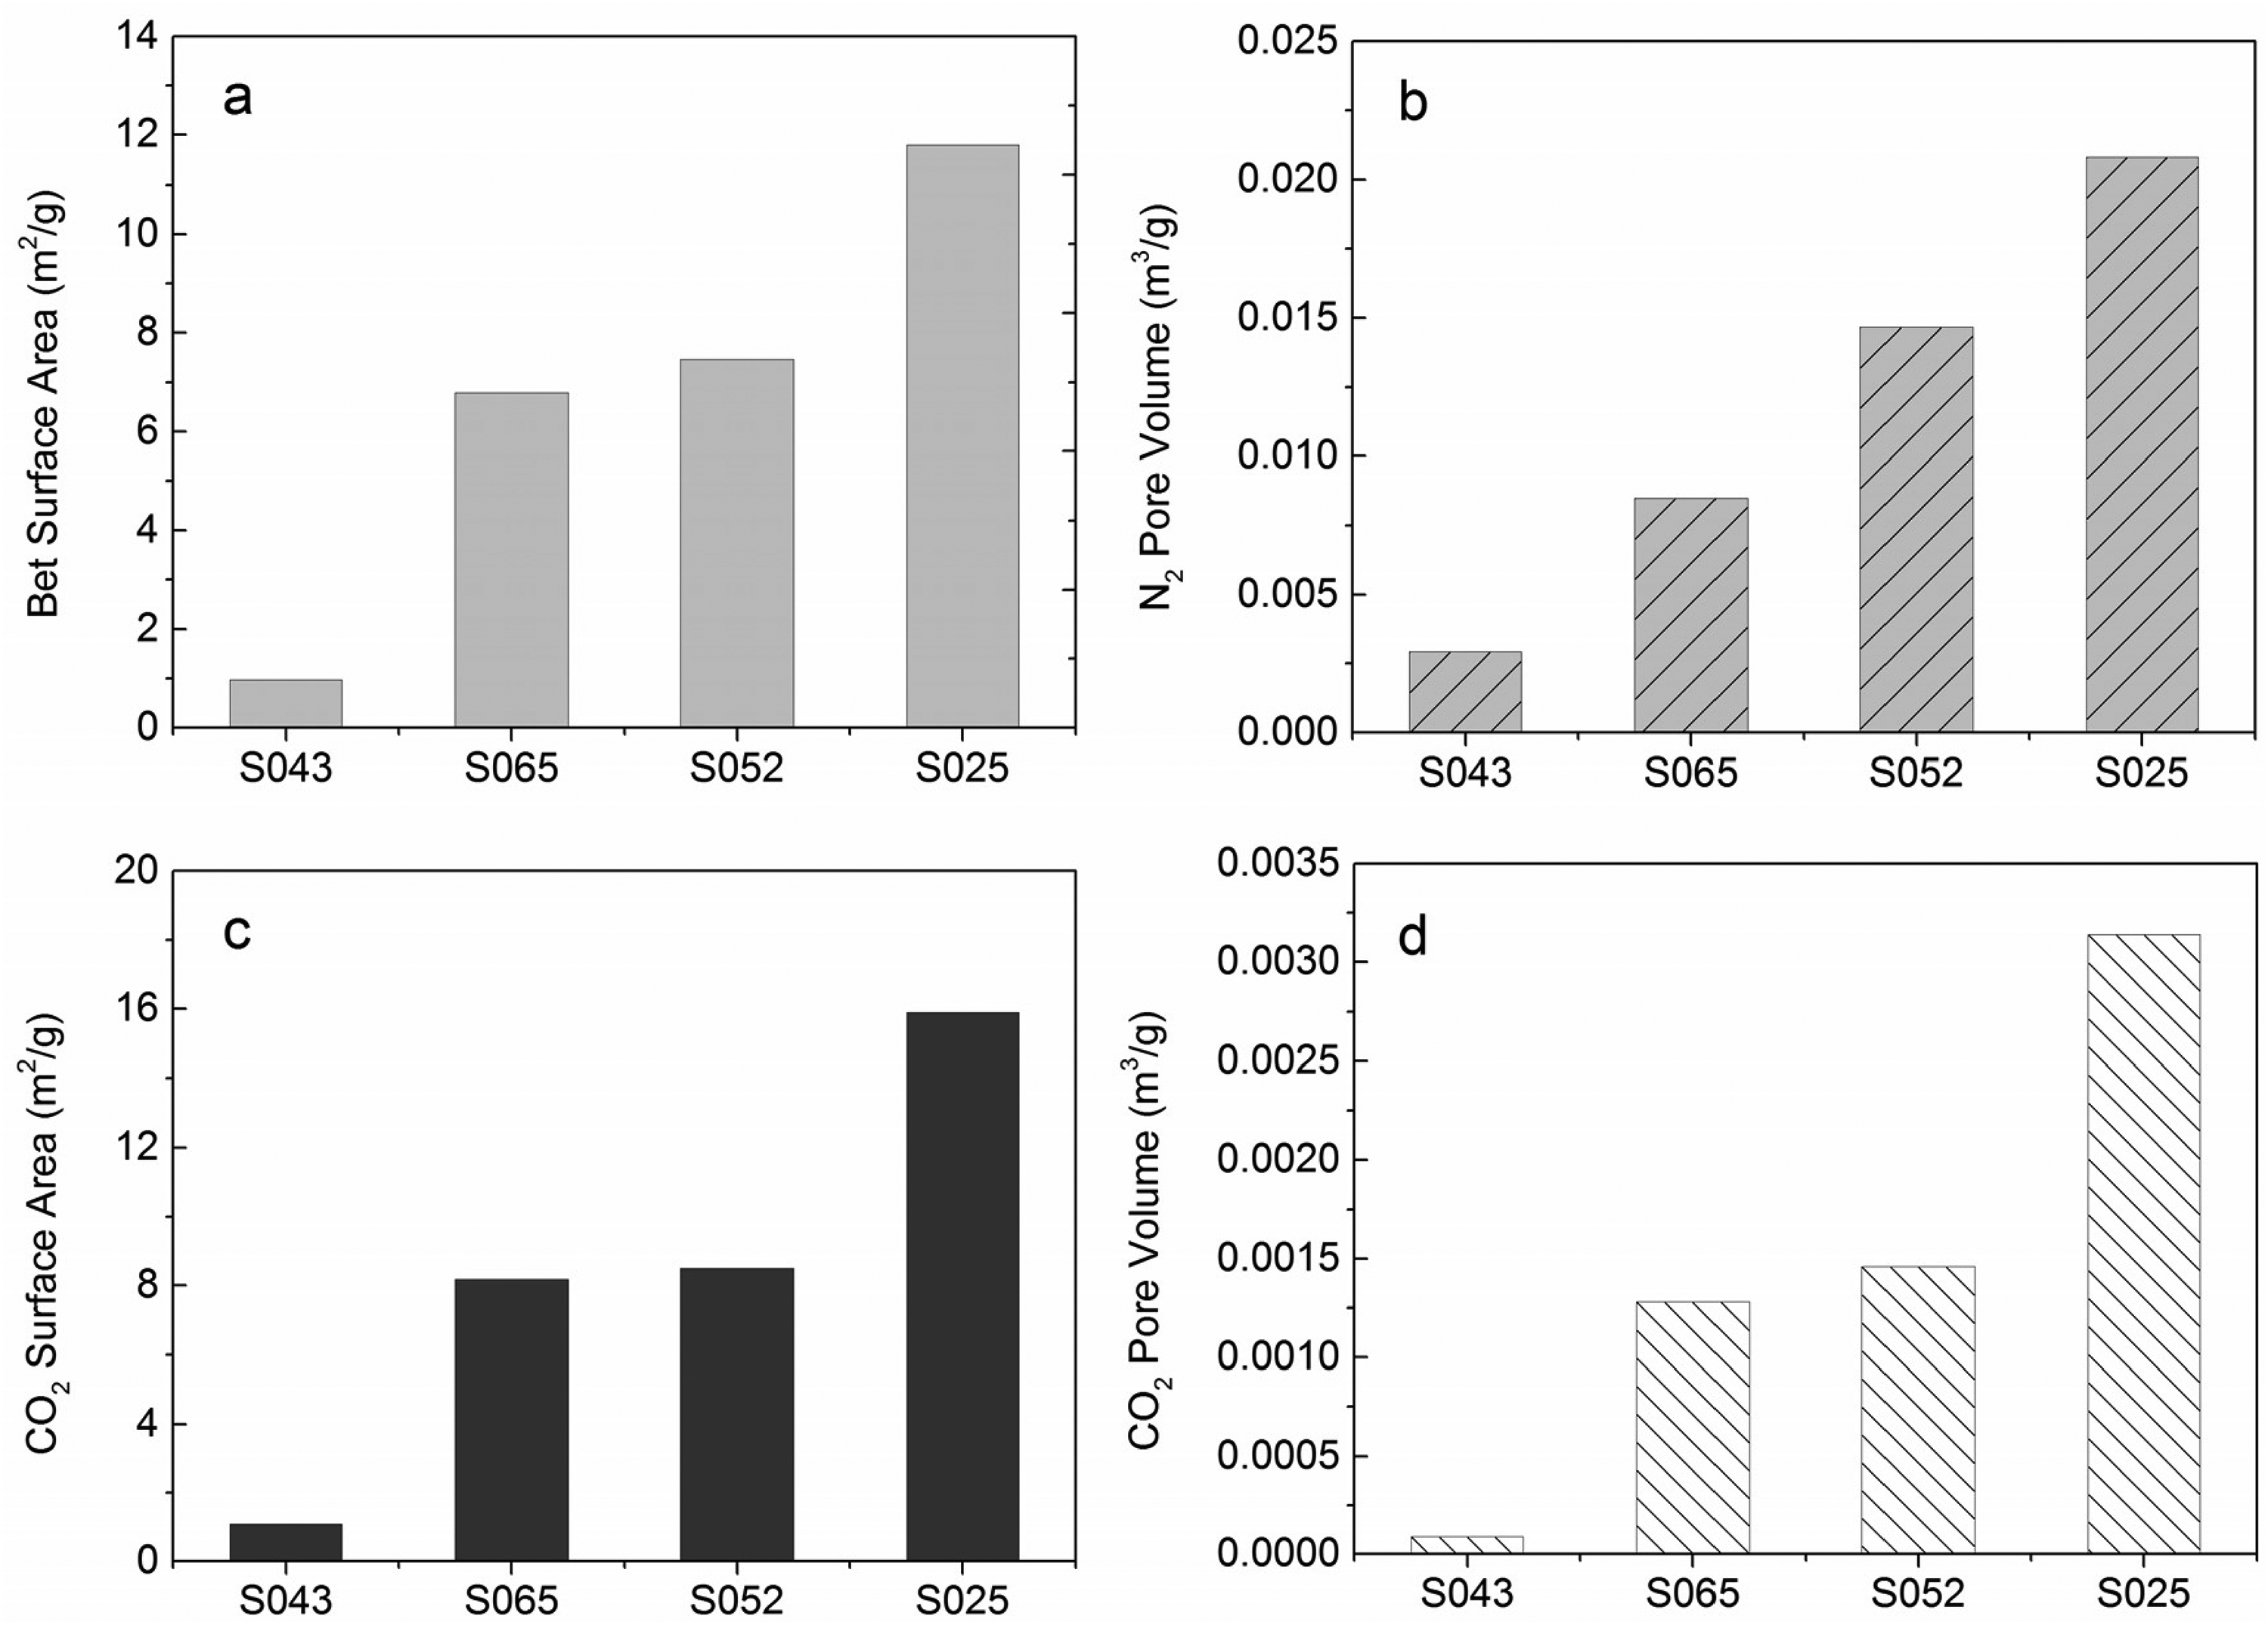
The BET surface areas (a) and pore volume (b) of the shale samples determined through nitrogen adsorption, as well as the surface areas (c) and micropore volume (d) determined by carbon dioxide adsorption. Among the samples, S025 exhibits the highest surface area while S043 has the least, whereas S065 and S052 have similar pore surface areas.
The pore volume and distribution of the shale samples, including pore volume (cm3/g), specific surface area (m2/g), and pore size measured using gas adsorption methods and MICP.
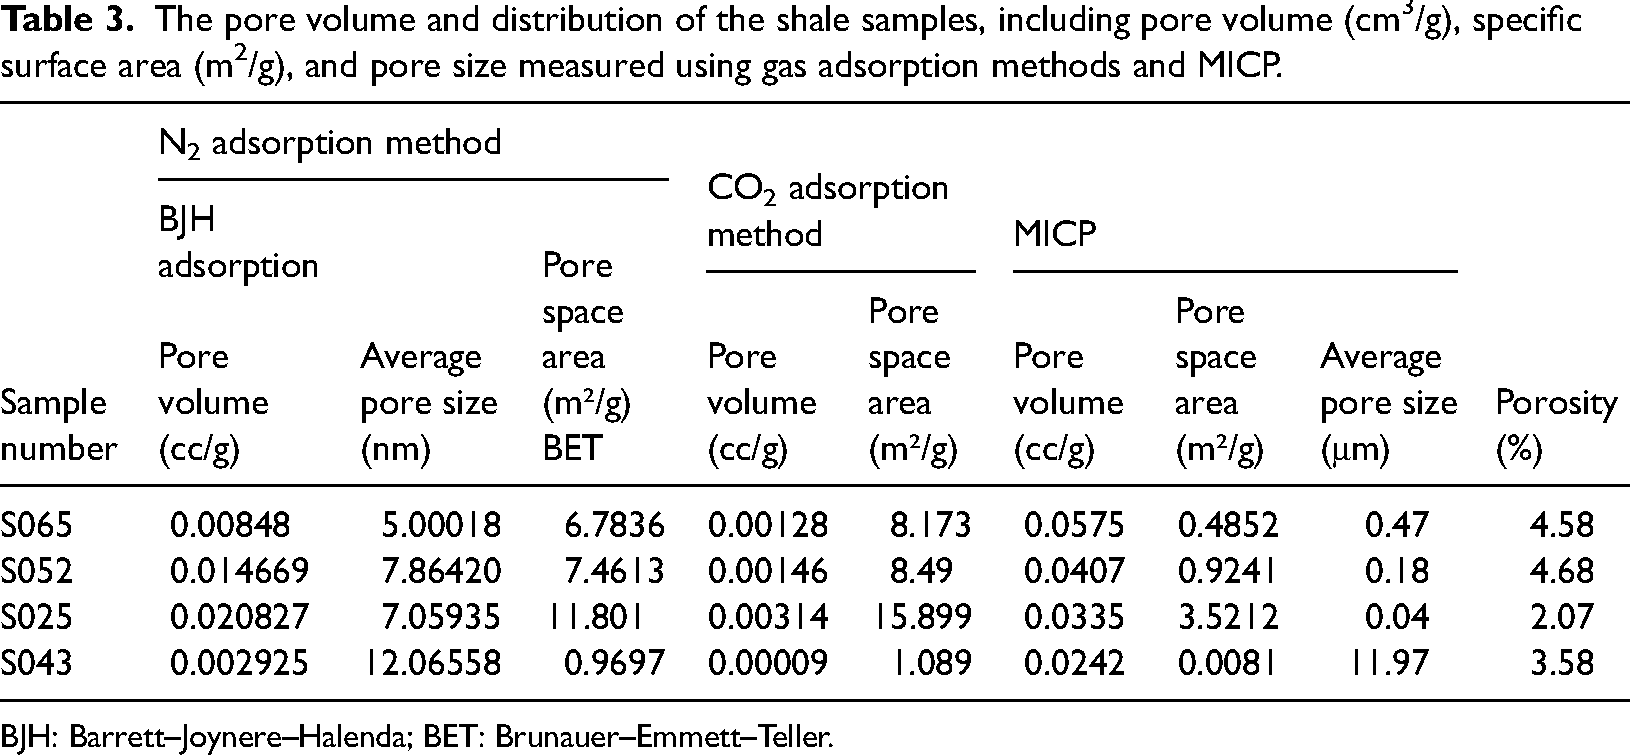
BJH: Barrett–Joynere–Halenda; BET: Brunauer–Emmett–Teller.
The proportion of macropore volume in the total pore volume of the samples is the largest, exceeding 60%. Conversely, the proportion of micropore volume in the total pore volume is the lowest, less than 5% (Figure 6(a)). The distribution patterns of the proportion of mesopore and micropore surface area in the total pore surface area are similar (Figure 6(b)). The percentage of micropore surface area is slightly larger than that of mesopores, accounting for about 50%, while the surface area percentage of macroporous pores is very small, less than 16%. This indicates that micropores and nanopores possess a large specific surface area, while macropores have a higher pore volume.
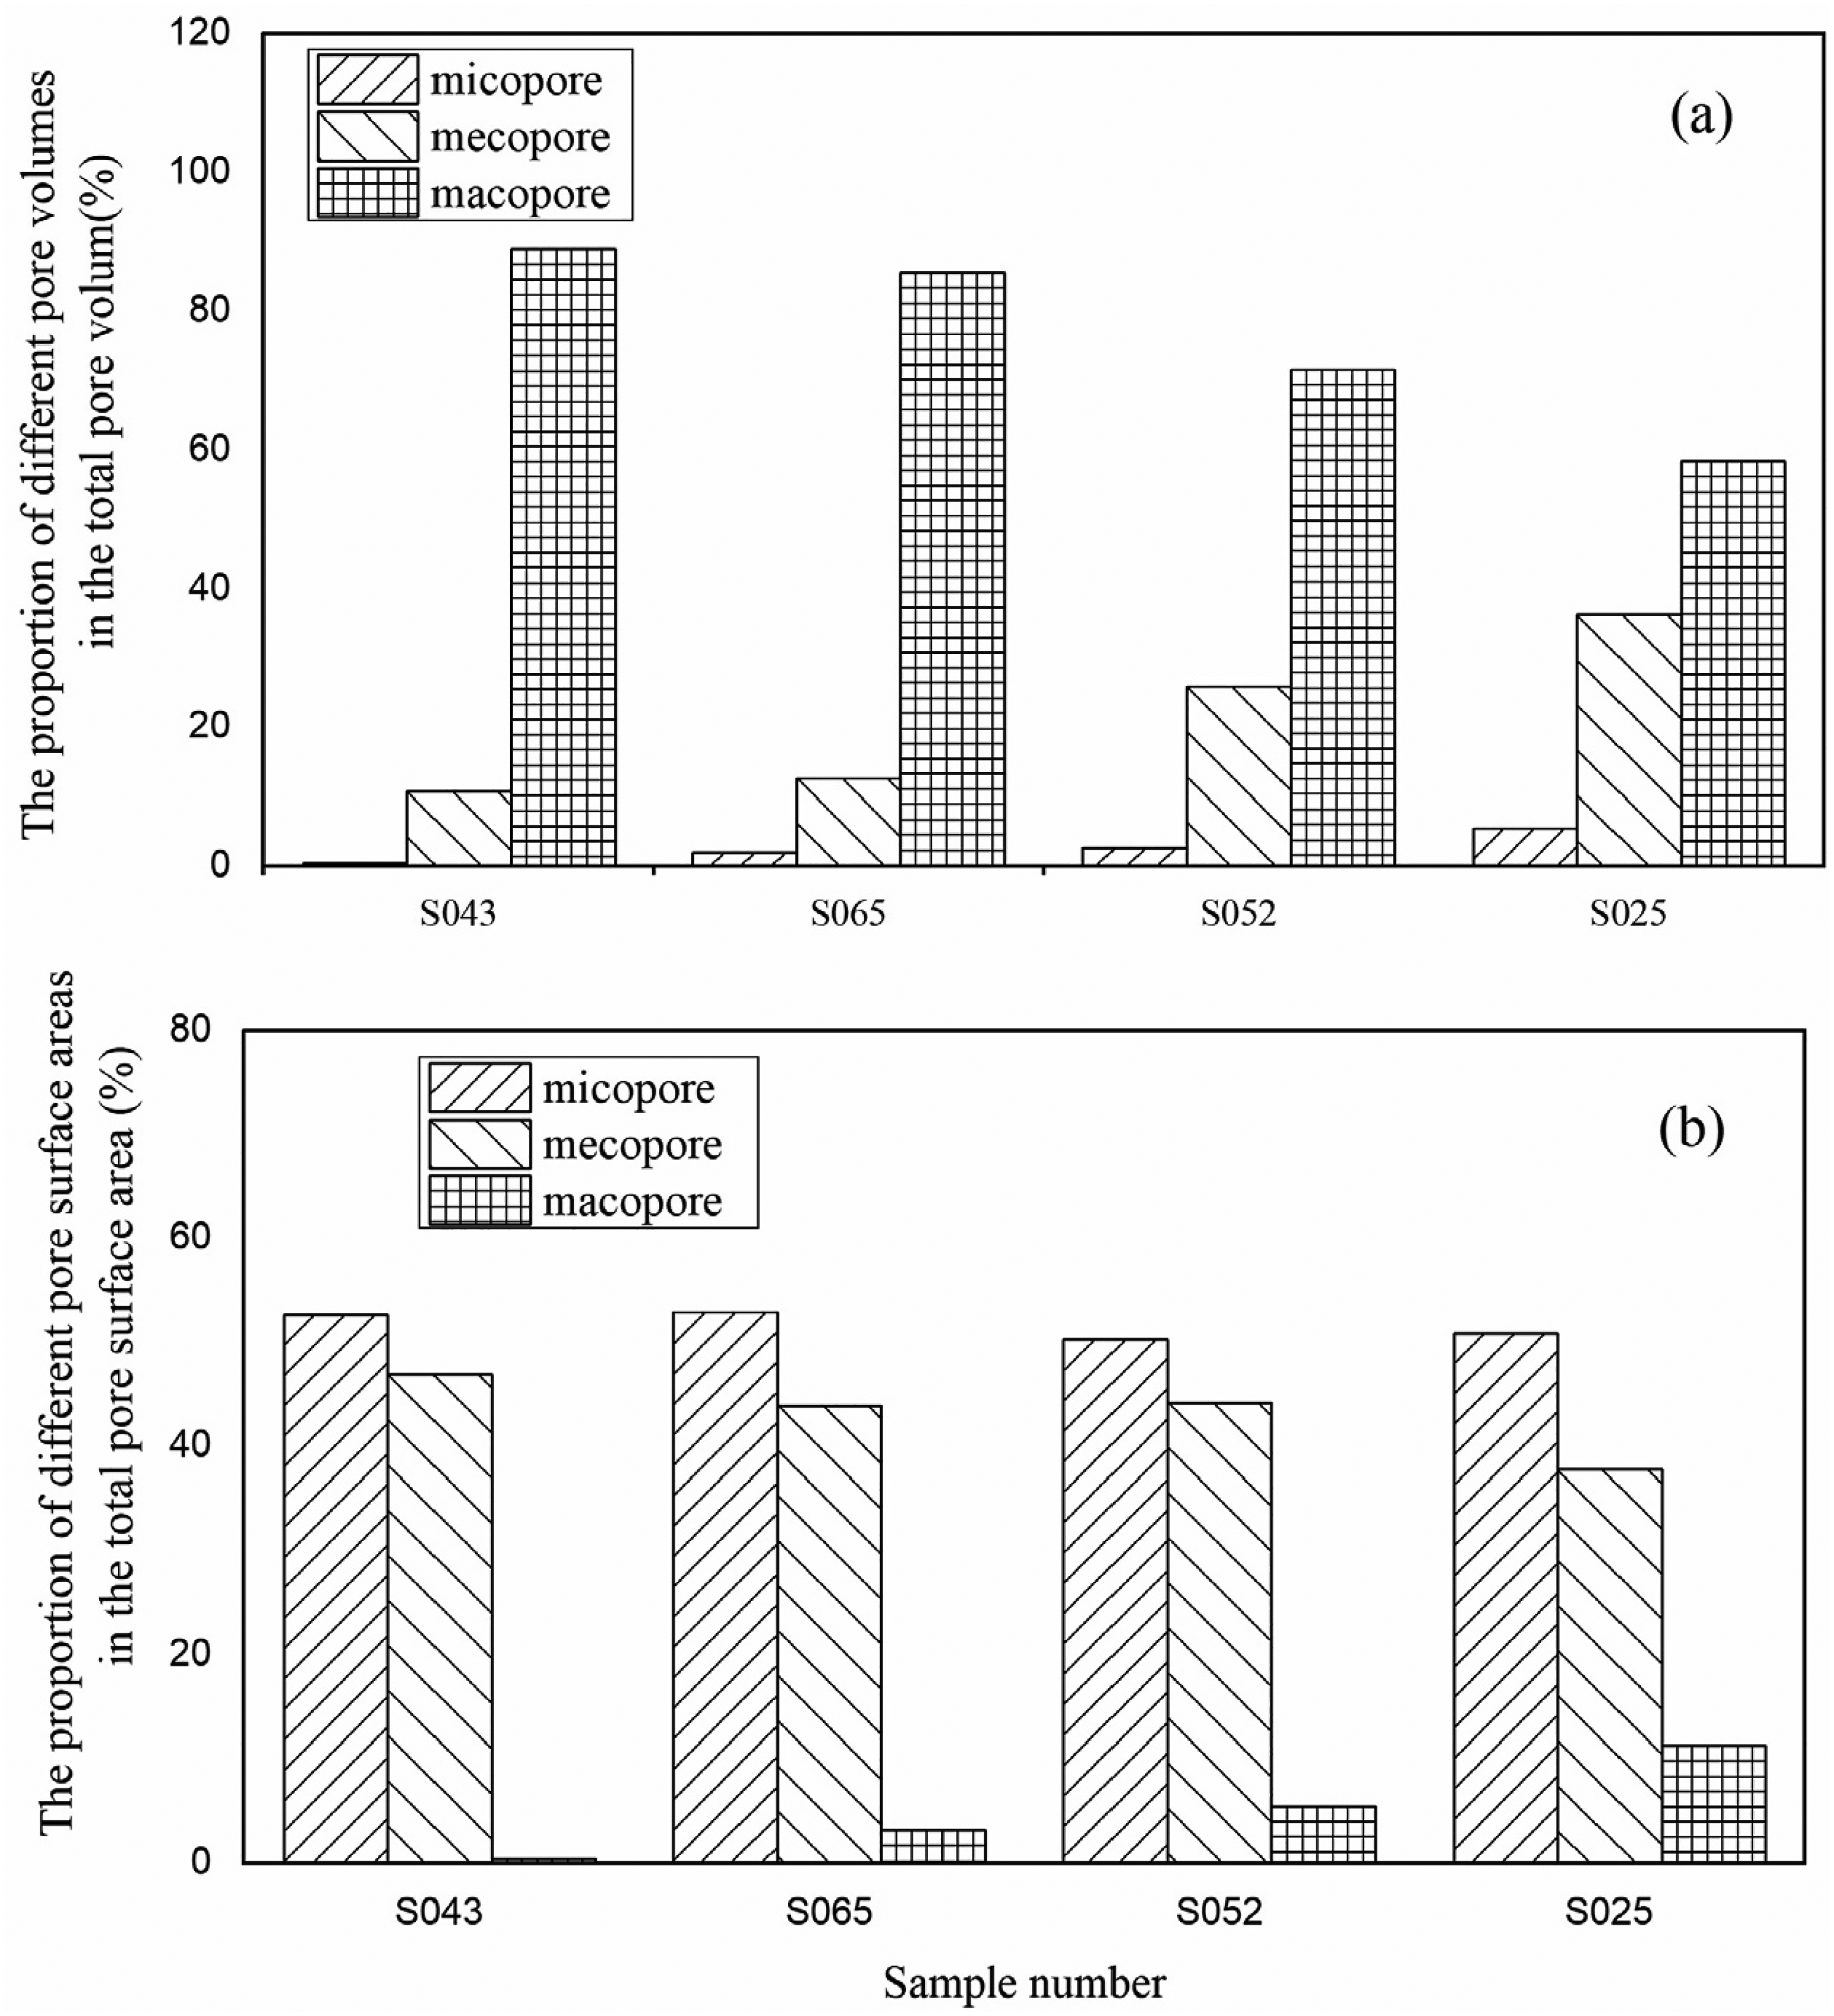
The proportion of different pore volumes in the total pore volume (a) and the proportion of different pore surface areas in the total pore surface area (b) of the shale samples. It demonstrates that micro–nanopores possess a large specific surface area, whereas macropores have a larger pore volume.
The pore-diameter distributions of the four samples are shown in Figure 7. The micropore size distribution, calculated from CO2 adsorption data, reveals multiple peaks, with the two largest diameter peaks occurring at approximately 0.5 nm and 0.9 nm (Figure 7(a)). In comparison to the other samples, S025 has larger micropore volumes. The mesoporous size distribution, calculated from N2 adsorption data, shows similar distribution patterns across all samples, with the maximum diameter peak at approximately 4.5 nm (Figure 7(b)). Upon zooming in on the overlapping area (gray box area in Figure 7(b)), it can be observed that mesopores are primarily distributed within the range of 5–16 nm. Figure 8(c) illustrates two peaks in the macropore distribution, with the largest peak concentrated at 150 μm. Furthermore, S065 has larger macropore volumes compared to the other three samples. Compared with the other three samples, S065 has the highest quartz content and the highest TOC content. The study of source rocks in the Qaidam Basin shows that TOC and siliceous content have a good positive correlation (Liu et al., 2020). Quartz minerals in shale can be divided into two types: clastic quartz and authigenic quartz (Dowey and Taylor, 2017; Milliken et al., 2016). The opal skeleton of plankton is not only the main source of clastic quartz in the Qaidam Carboniferous Hurleg Formation shale, but also the main contributor of organic matter in the shale. Therefore, a high content of clastic quartz in the basin can effectively represent a high plankton yield and form a high TOC value (Chen et al., 2023).
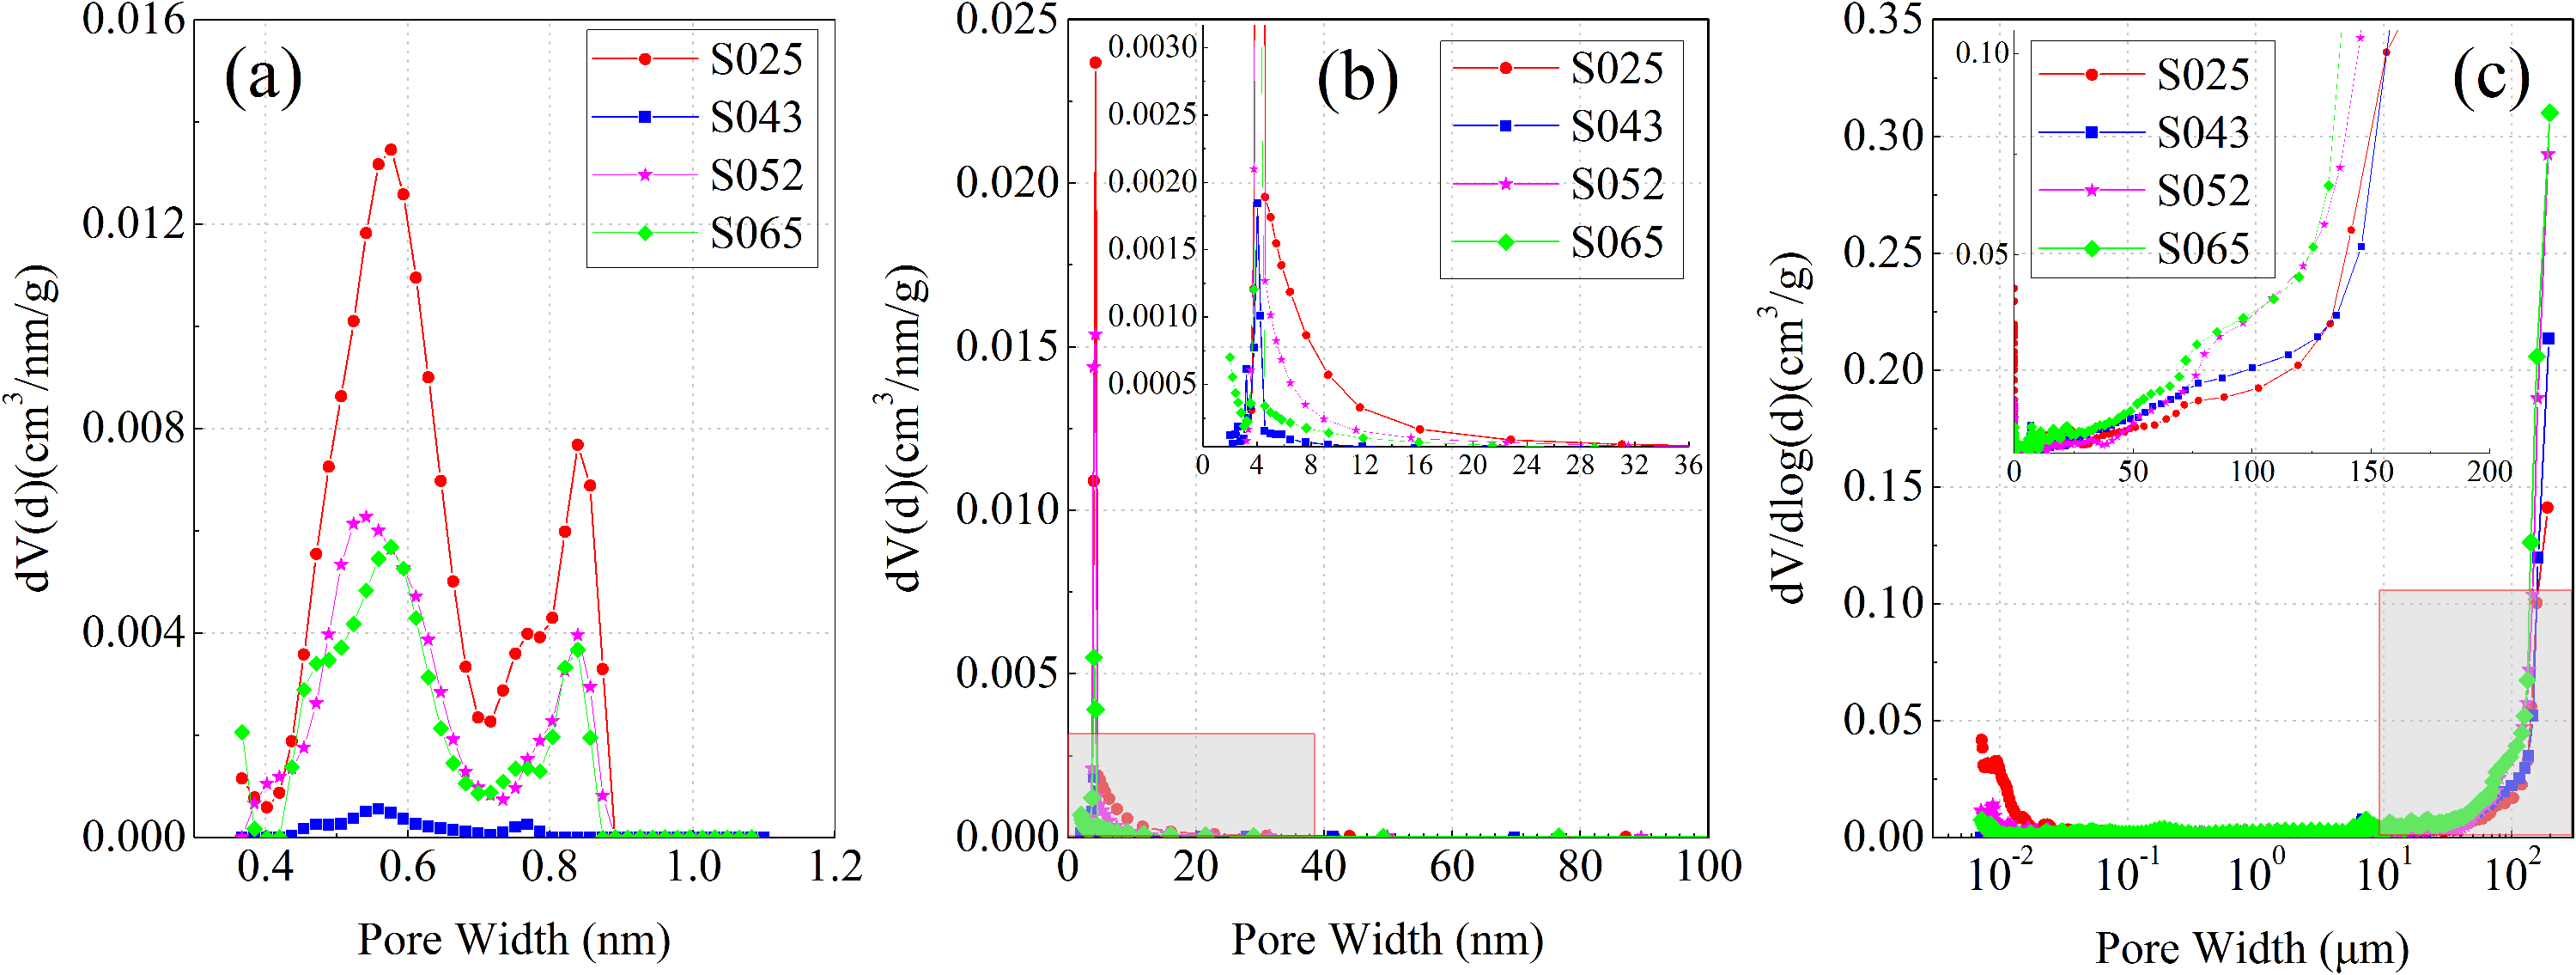
The pore size distributions of the samples: (a) depicts the low-pressure CO2 adsorption, with the micropore size distributions displaying multiple peaks, particularly at approximately 0.5 nm and 0.9 nm (b) portrays the low-pressure N2 adsorption, demonstrating similar mesopore size distributions across all samples, with the maximum pore size around 4.5 nm. (c) represents high-pressure Hg data, and among all the samples, S065 exhibits the largest macropore volume.
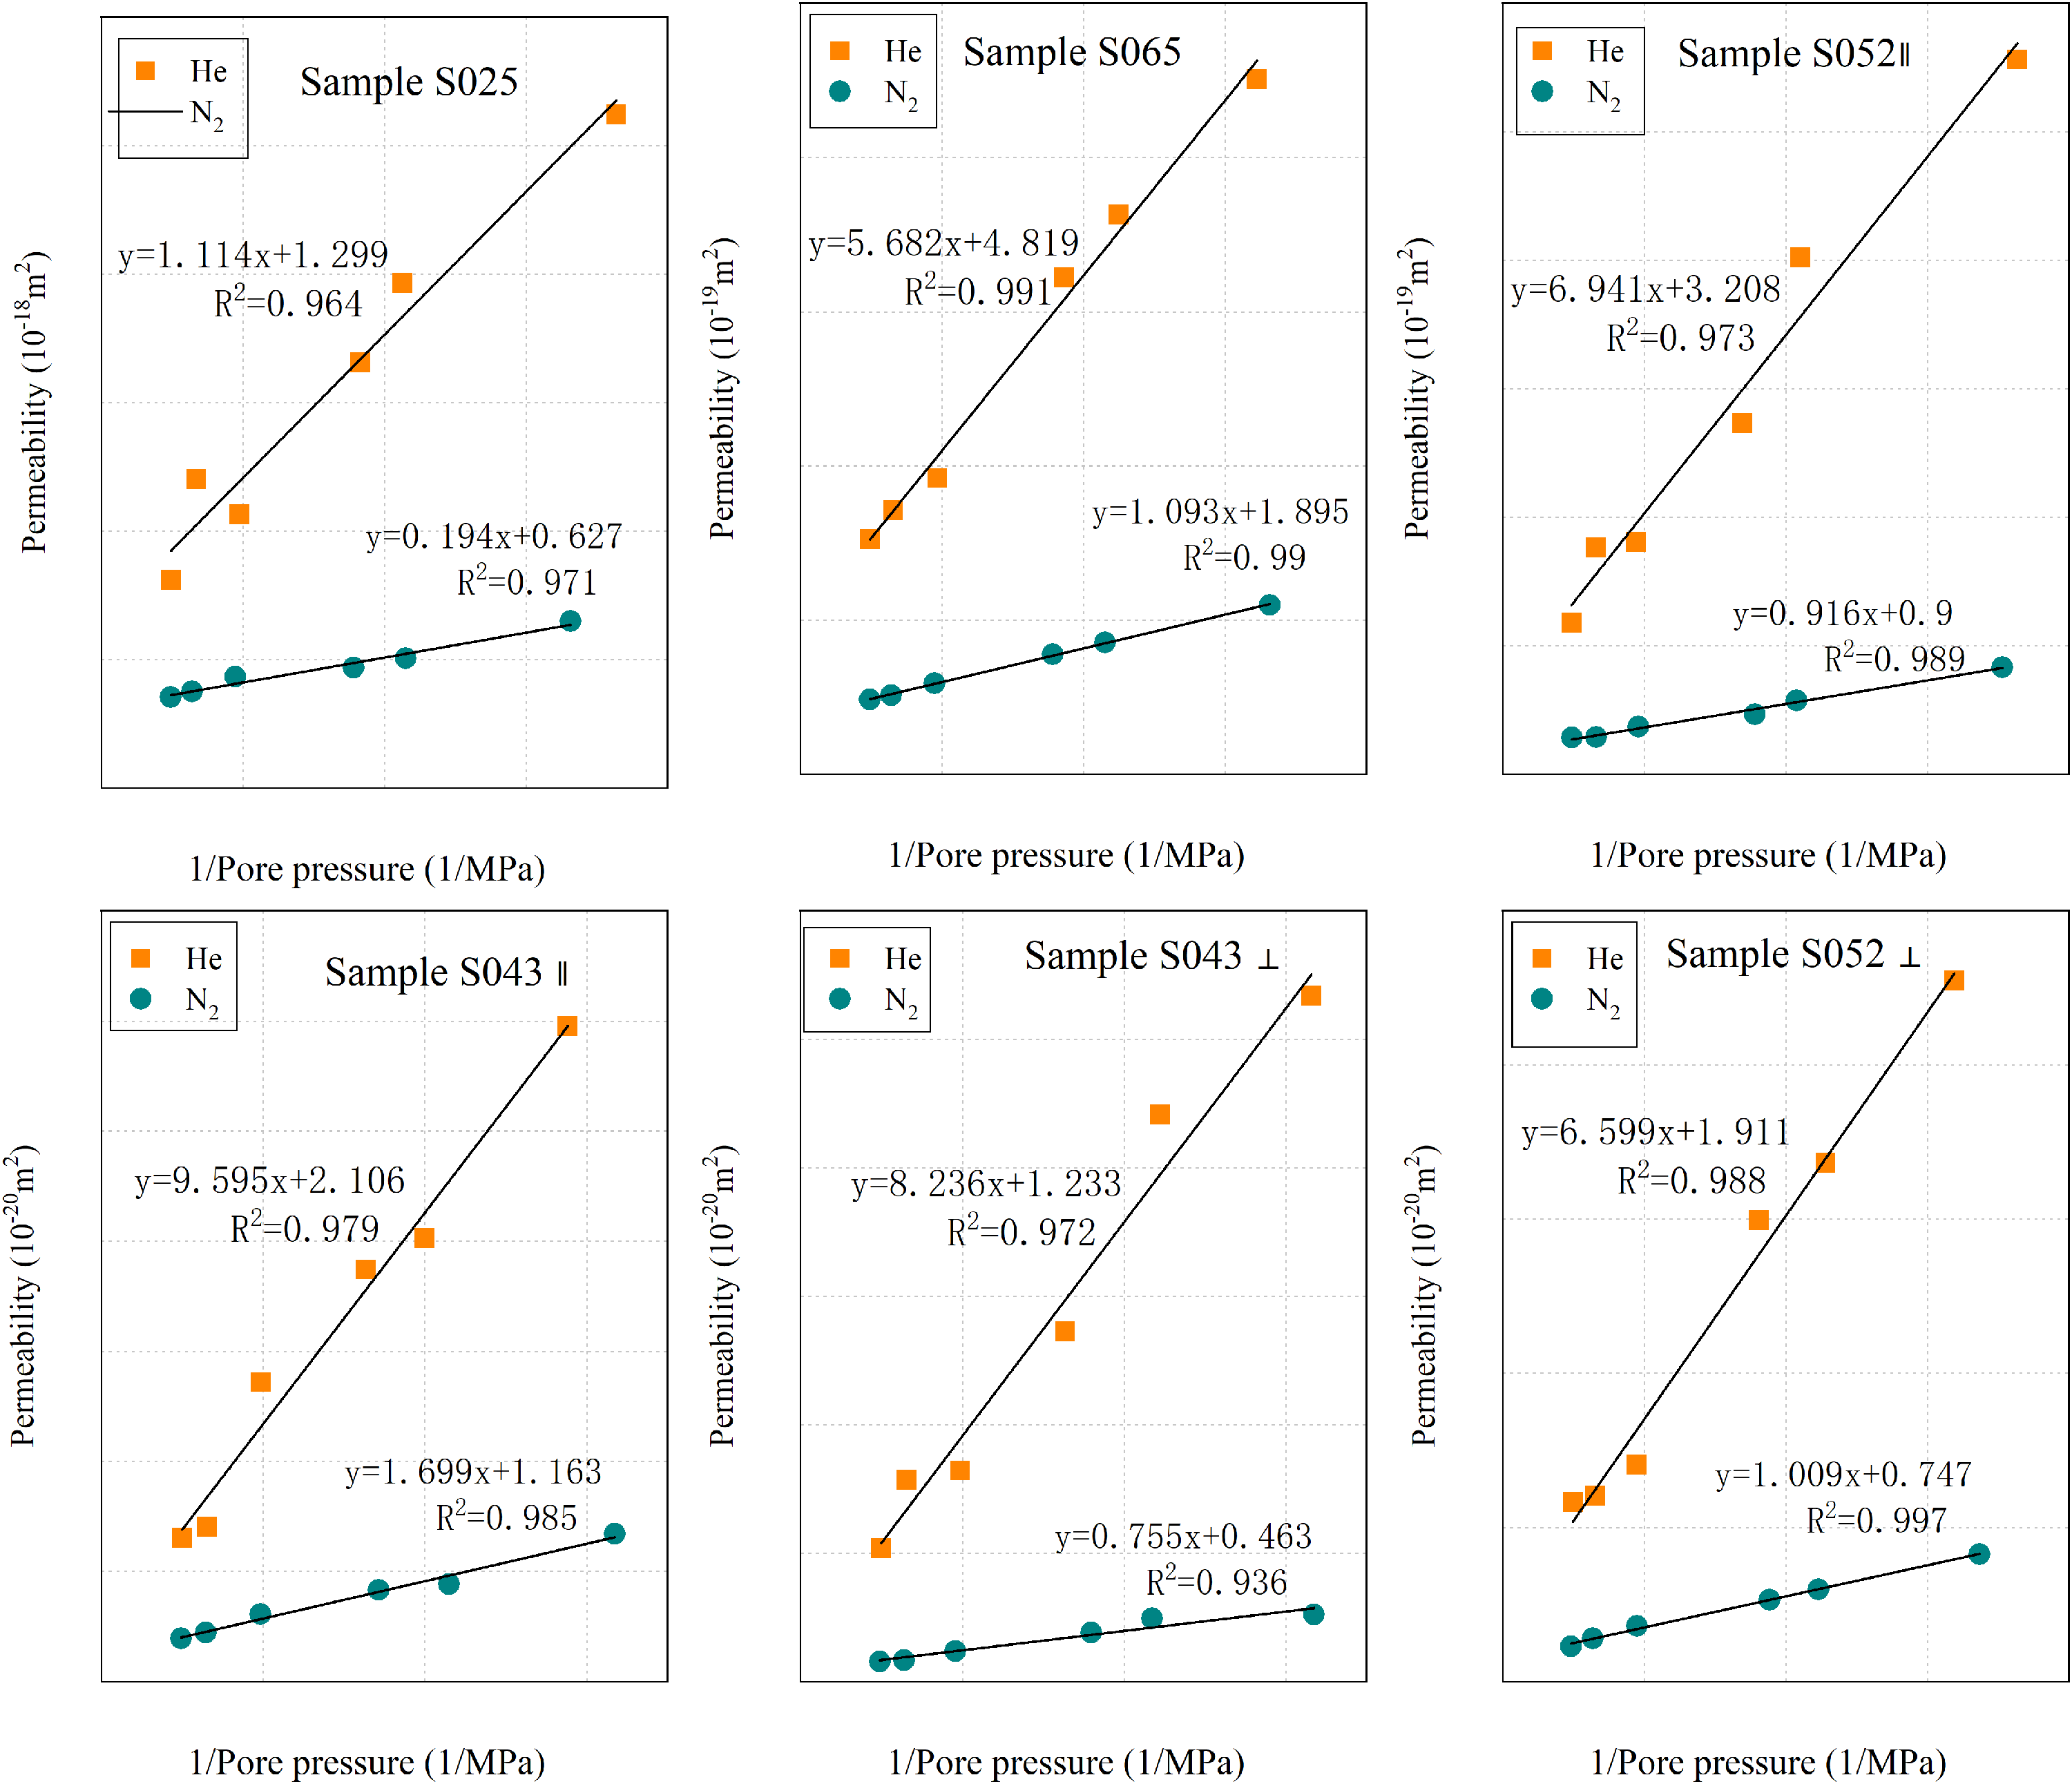
Relationship between gas permeability and the inverse of the average pore pressure. The different gas permeability increases linearly the reciprocal of average pore pressure (R2 > 0.93), which fits the Klinkenberg equation.
Sample S065 exhibits larger macropore volumes because the test method for macropores is the high-pressure mercury pressing method. High-pressure intrusion of mercury can cause deformation or fragmentation of rock skeletons and shielding of large pores connecting micropores, and high-pressure mercury pressure may reduce the ratio of micropores (Xu et al., 2022).
Gas permeability measurements
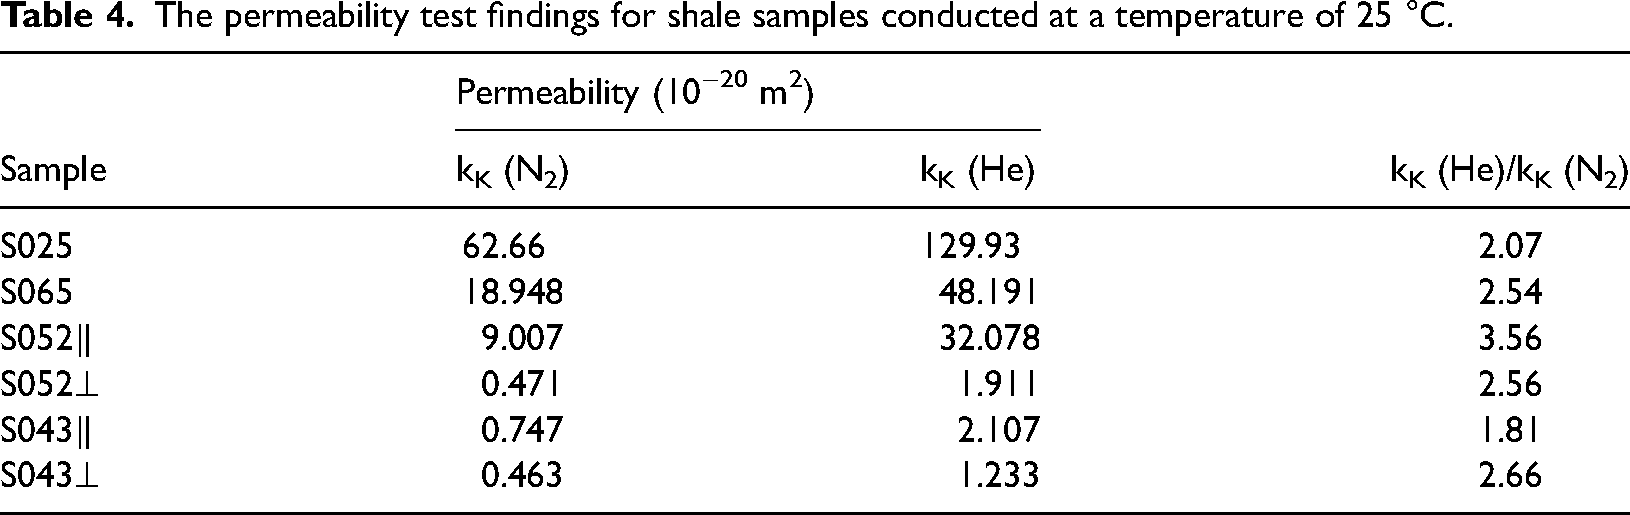
Gas permeability measurements were conducted on each sample at six different pore pressures (0.5–4 MPa) using helium (He) and nitrogen (N2) gases. The measured gas permeability (kgas) for shale samples varied between 5.24 × 10⁻¹⁸ m2 and 7.73 × 10⁻²¹ m2. Figure 8 presents the relationship between gas permeability (He, N2) and the inverse of average pore pressure, showing a linear increase (R2 > 0.93), which aligns with the Klinkenberg equation. Table 4 provides the values for Klinkenberg permeability and slip factor. Analysis of Table 4 and Figure 8 reveals that, at the same pressure, helium exhibits higher permeability compared to nitrogen, and the slip factor is also larger for helium than for nitrogen. Additionally, shale permeability demonstrates significant anisotropy, with the parallel permeability being considerably higher than the perpendicular permeability. Specifically, the permeability of S043∥ is one order of magnitude greater than S043⊥, while the permeability of S052∥ is about 20 times higher than S052⊥.
The permeability test findings for shale samples conducted at a temperature of 25 °C.
Discussion
The effect of permeating fluid on gas permeability
Figure 8 illustrates that helium has a higher permeability than nitrogen within the displacement pressure range. The difference between them becomes more pronounced as the displacement pressure decreases. Under the same experimental conditions (refer to Table 4), helium permeability is 1.8–3.6 times that of nitrogen. This discrepancy can be attributed primarily to the different molecule sizes and slip flow effects between helium and nitrogen. Helium, with its smaller molecular diameter (Javadpour et al., 2007; Shieh and Chung, 1999), can flow through permeability paths that are inaccessible to nitrogen due to molecular sieving (Adeboye and Bustin, 2013).
Comparison of gas slip effect of different permeating fluid
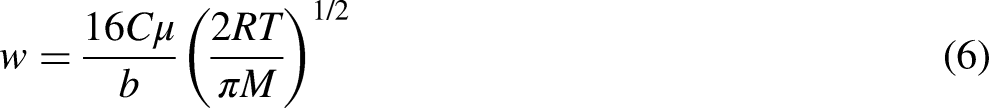
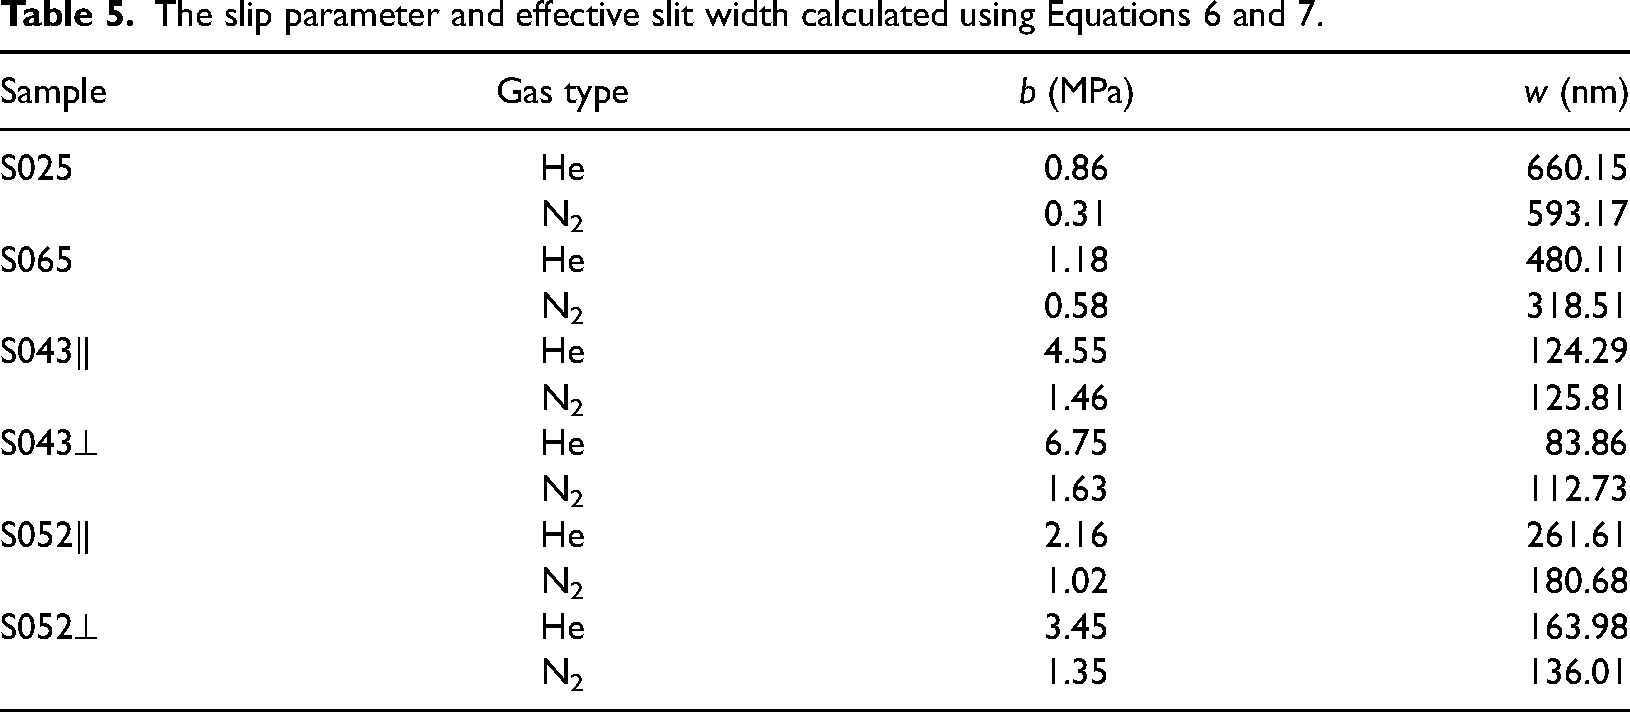
Figure 8 shows that there is not much difference in permeability between helium and nitrogen at high displacement pressure, but the difference increases as the displacement pressure decreases. Particularly, helium has a much higher permeability than nitrogen. This indicates that at lower pore pressures, the gas molecules’ mean free path increases as the pore pressure decreases, resulting in a greater impact of slip effect on gas permeability. Due to the smaller diameter of helium molecules, the slip effect has a more significant influence on helium permeability. The Klinkenberg plot reveals that the order of the slope of permeability is helium > nitrogen. As the pore pressure increases, the permeability of helium decreases more compared to the permeability of nitrogen. According to Equation 6, we calculated the slip factor of helium and nitrogen, respectively (Table 5). The slip factor of helium is significantly greater than the slip factor of nitrogen. According to the experimental data, it is 2.03–4.14 times higher than the nitrogen, averaging 2.79.
The slip parameter and effective slit width calculated using Equations 6 and 7.
The Knudsen number (Kn) is a metric used to distinguish different gas flow regimes in shale matrix systems. It is a quantifier for the extent of slip flow and diffusion in total gas flow, as highlighted by various studies (Firouzi et al., 2014; Ghanizadeh et al., 2014; Javadpour et al., 2007; Landry et al., 2016). The Knudsen number (Kn) can be expressed mathematically as follows (Kaviany, 1995):
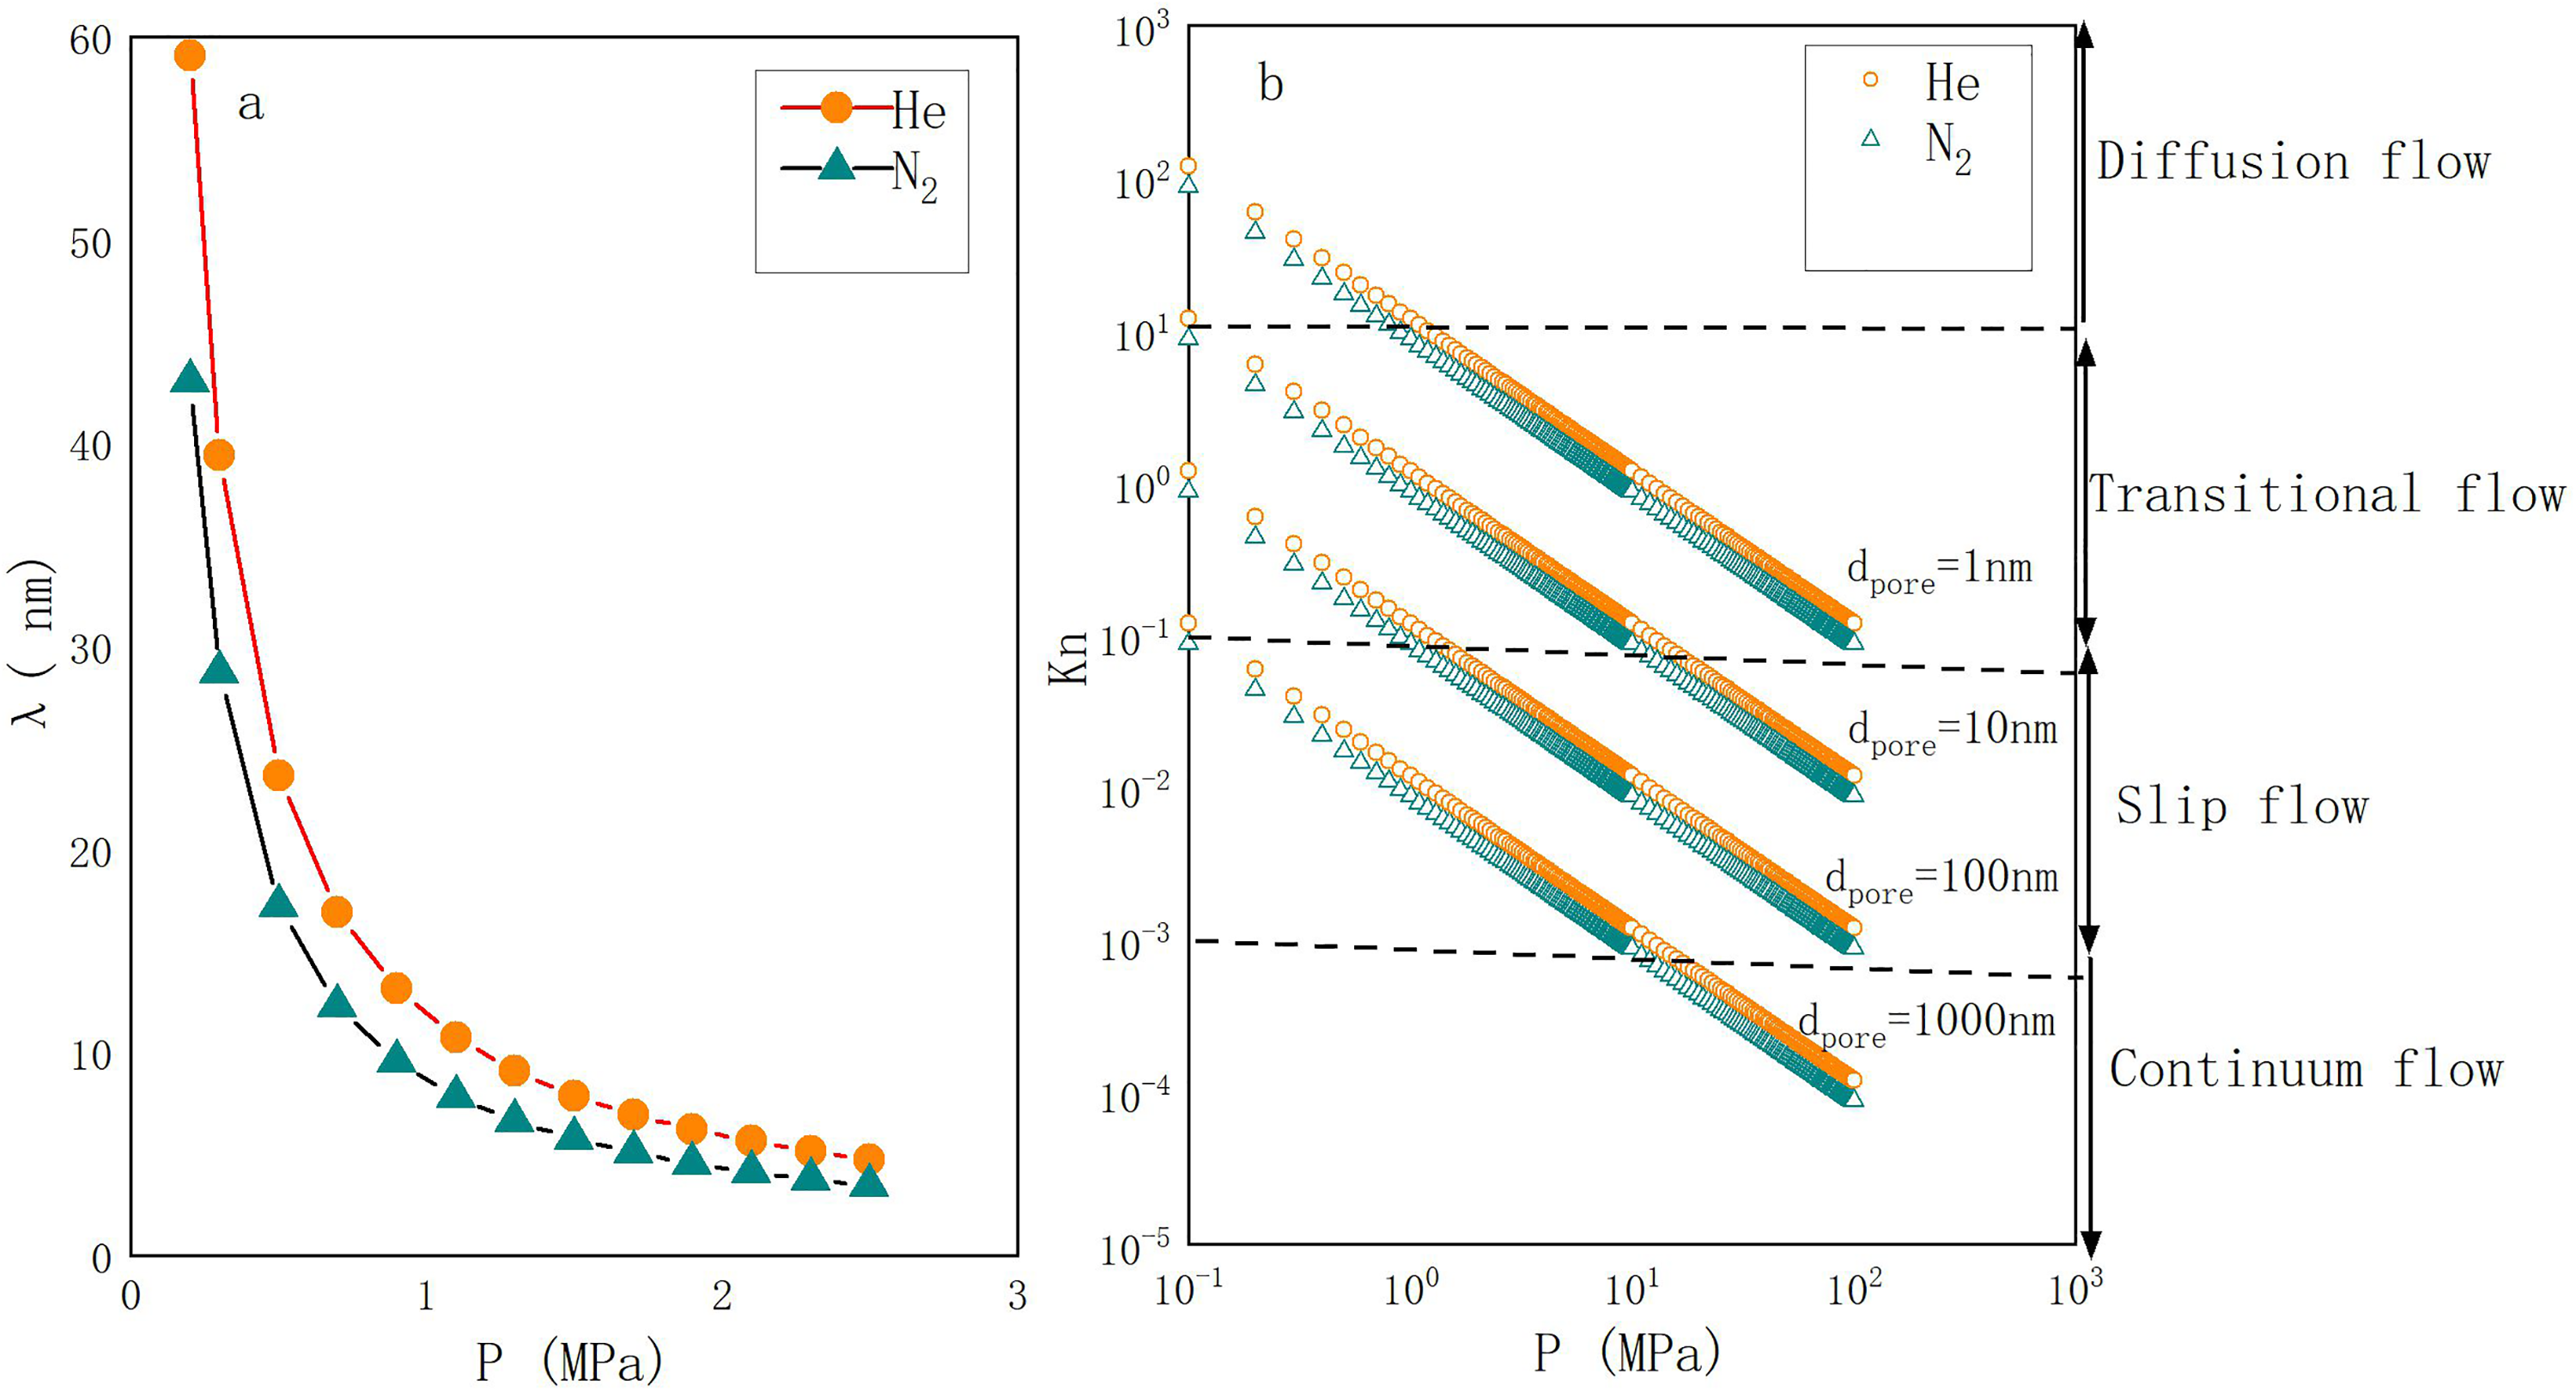
(a) The average molecular free path of helium and nitrogen at different pressures (0–3 MPa) is shown. At a given pressure, the molecular free path increases in the order of N2 < He. (b) The Knudsen numbers for permeating gases (He, N2) are plotted as a function of pressure and pore throat size at 25°C. At a given pressure and pore throat diameter, the Knudsen number increases in the order of N2 < He.
The ratio of slip flow to Darcy flow can be expressed by Equation (8):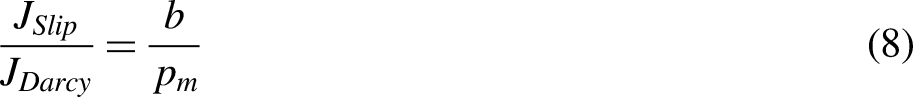
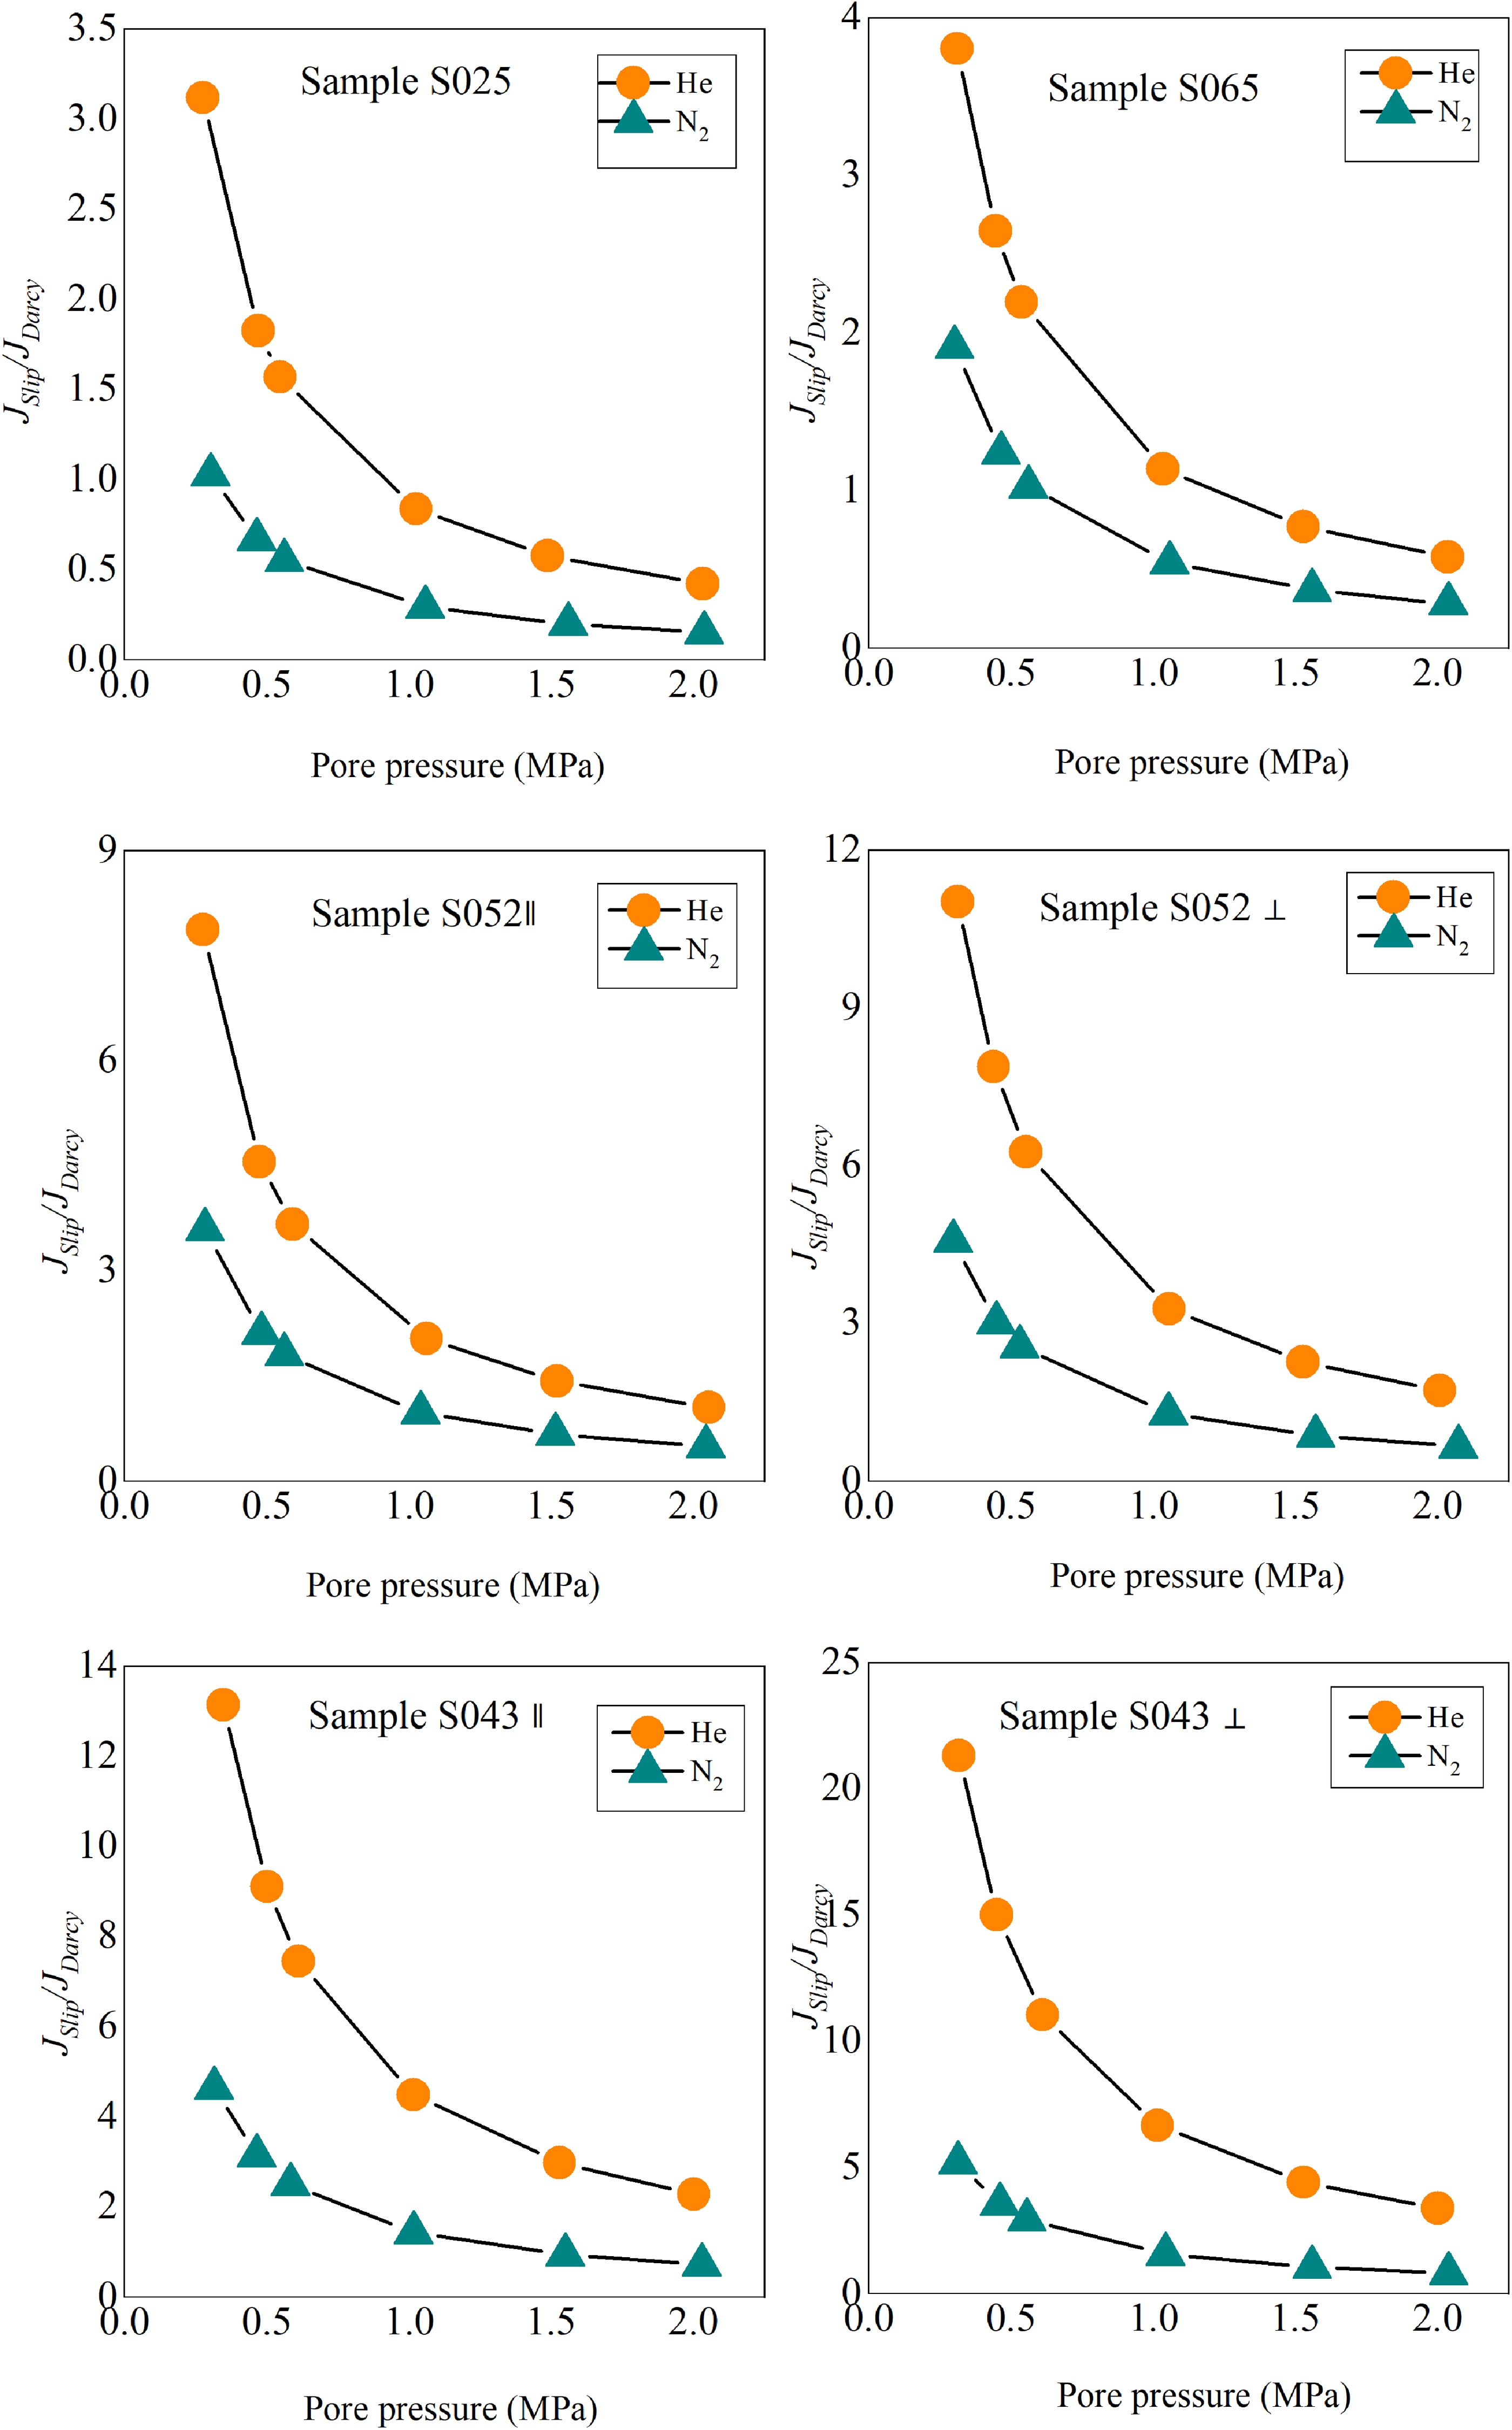
The contribution of slip flow relative to Darcy flow as a function of pore pressure. For all samples, the contribution of slip flow to Darcy flow increases in the order of N2 < He.
The evaluation of effective pore size of shale samples using different gas slip factor
Klinkenberg gas slip analysis can be utilized to evaluate the pore structure in shales (Letham and Bustin, 2016). In this study, the effective slit widths of samples with different gases were calculated using Equation 7 (Table 5). Figure 11 presents the effective slit widths obtained for all samples. It is observed that the calculated effective slit widths do not align with those measured by MICP and N2 adsorption methods. Sample S043 exhibited the largest average pore size, while ample S025 had the smallest, but the effective slit widths calculated from the slip coefficients were reversed.
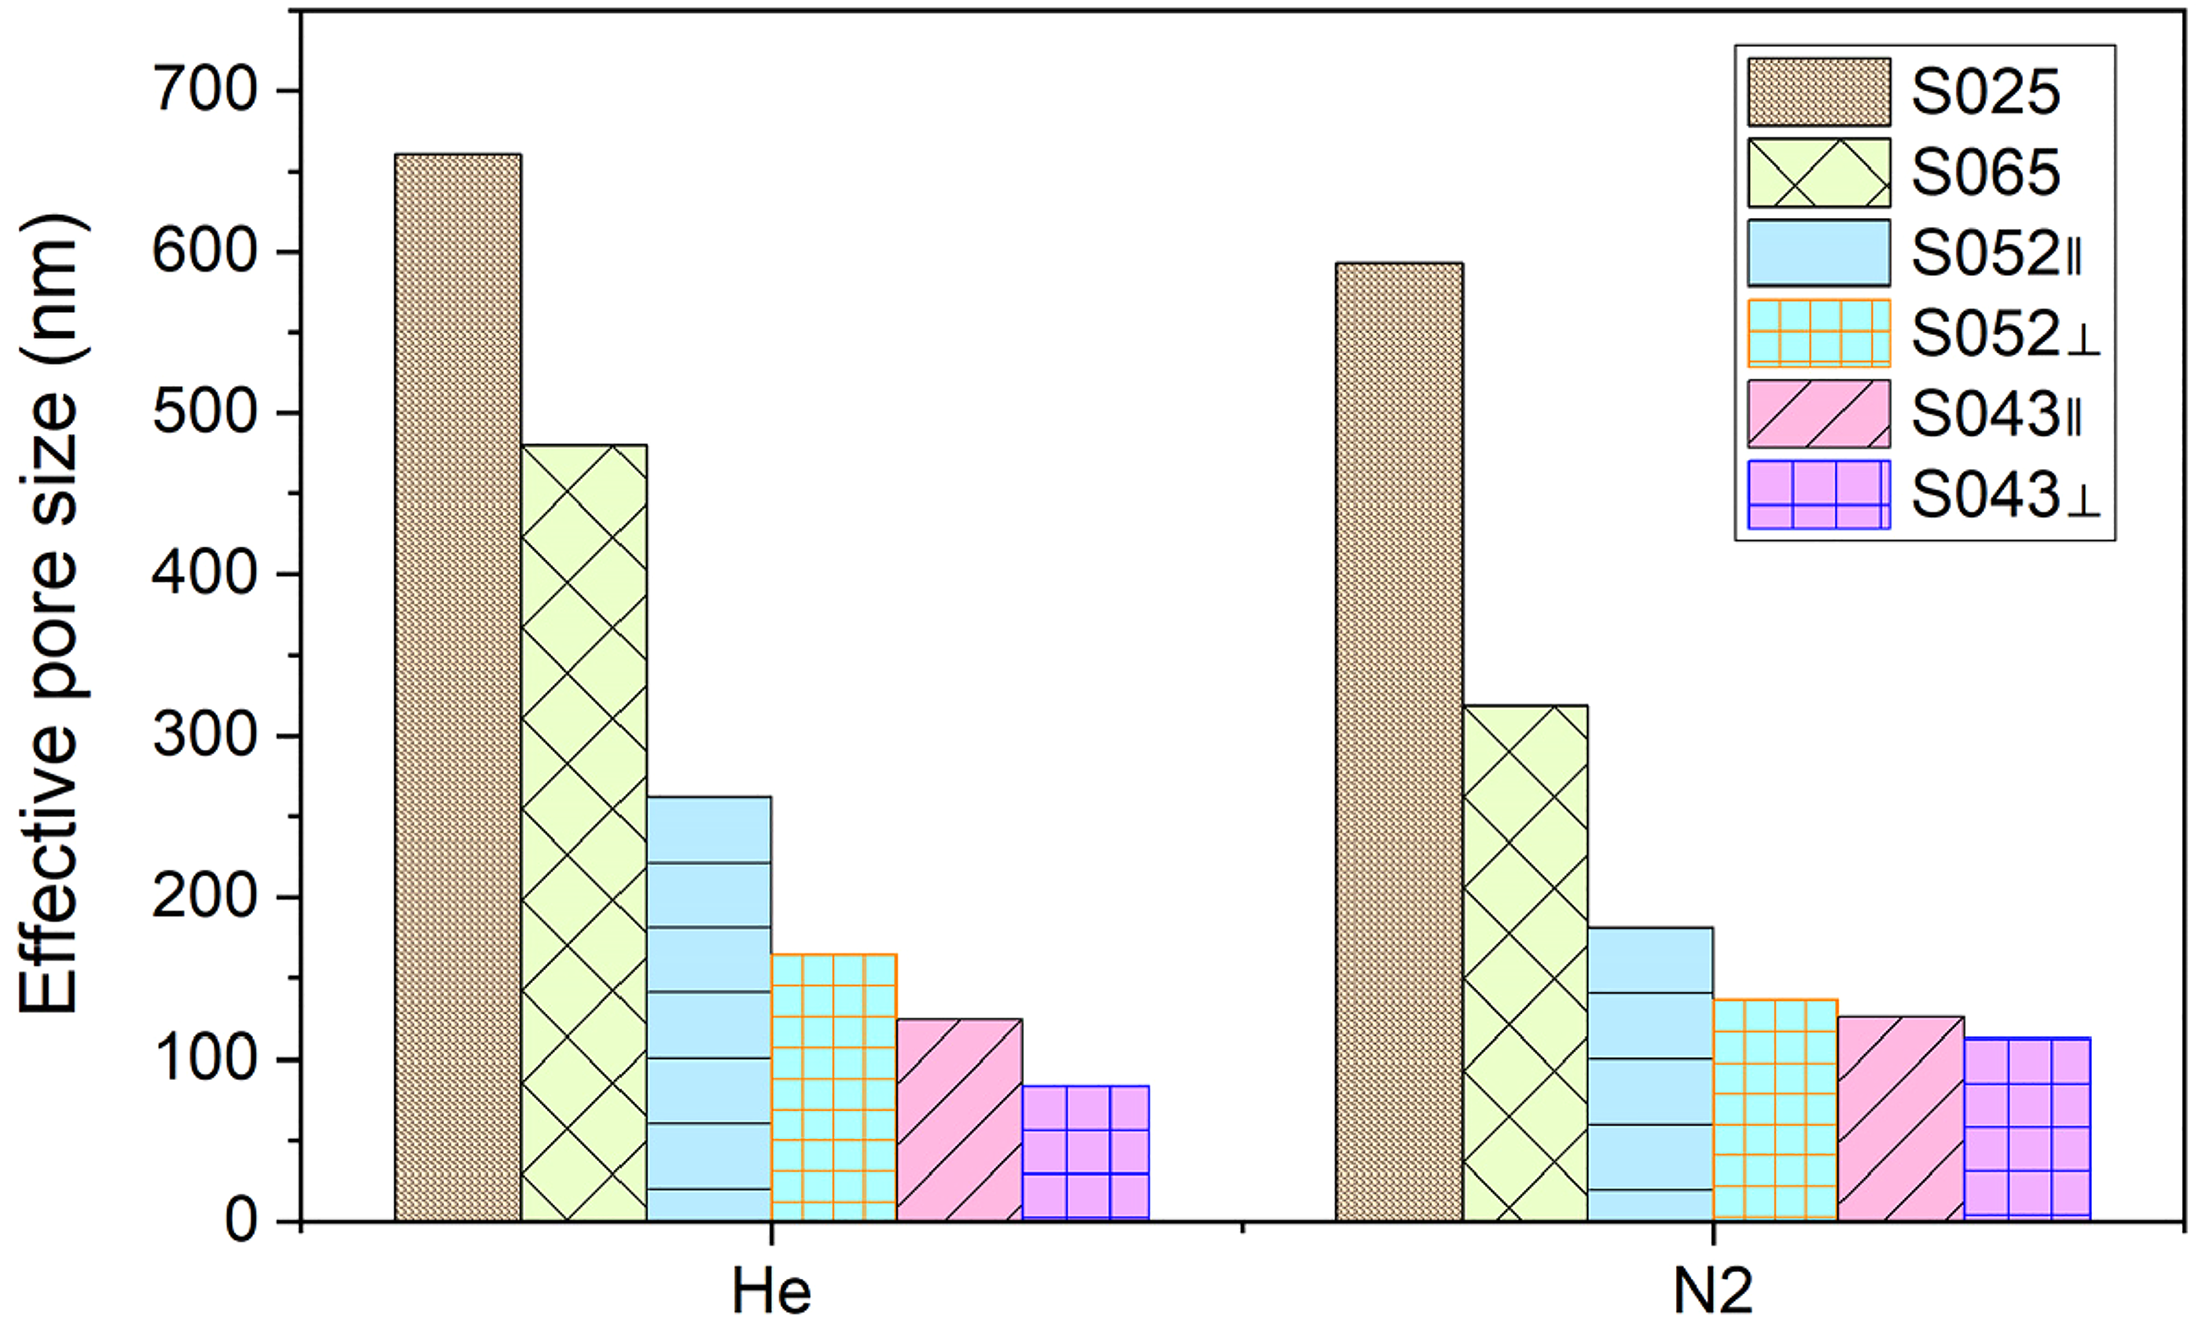
Comparison of effective pore size of shale samples calculated using different gases. For the same sample, the effective pore size measured by helium is greater than that measured by nitrogen. When comparing effective pore sizes calculated with different gases, the parallel samples (S052⊥, S043⊥) have larger sizes than the vertical samples (S052∥, S043∥).
S025 contains more quartz, while S043 contains more calcite, and more pores are developed in carbonate. Moreover, the test method is high-pressure mercury injection. High-pressure intrusion of mercury can cause deformation or fragmentation of rock skeletons and shielding of large pores connecting micropores, which will cause the destruction of micropores (Xu et al., 2022). Therefore, the average pore size of the S043 sample is larger. Sample S043 has the smallest micropore surface area and pore volume, whereas sample S025 has the largest micropore volume (Figure 5). This implies that sample S025 contains a higher proportion of micropores and nanopores with slit-like pores, while sample S043 contains a larger proportion of large pores and fewer slit-like pores. The effective pore diameter calculated using helium gas is larger than that calculated using nitrogen. Helium molecules have a small diameter and a long average molecular free path, resulting in a more pronounced slip effect. Unlike helium, nitrogen undergoes some adsorption and causes radial expansion during gas penetration (Cui et al., 2004), thereby leading to a smaller effective pore size calculation compared to helium.
Anisotropy of different gas permeability
According to Ghanizadeh et al. (2014), shale has a layered structure that results in larger parallel permeability compared to the perpendicular permeability, which is known as “permeability anisotropy.” For samples S043 and S052, it was observed that their parallel permeability (S043∥; S052∥) measured with different gases was higher than their perpendicular permeability (S043⊥; S052⊥) (Table 4, Figure 12). The parallel permeability of sample S043 was found to be 2.51 times higher than its vertical permeability, while the parallel permeability of sample S052 was 16.78 times higher than the vertical permeability. Sample S052 had significantly higher clay content compared to sample S043, which was rich in calcite (Table 2). Particle orientation in shales can be attributed to sedimentation, compaction, and/or diagenetic processes (Borja et al., 2019; Ortega et al., 2010; Valcke et al., 2006). Anisotropy is a prominent feature of shale and is related to the parallel arrangement of clay platelets toward bedding planes (Bennett et al., 2015; Chalmers et al., 2012; Lonardelli et al., 2007; Pathi, 2008; Wenk et al., 2008).
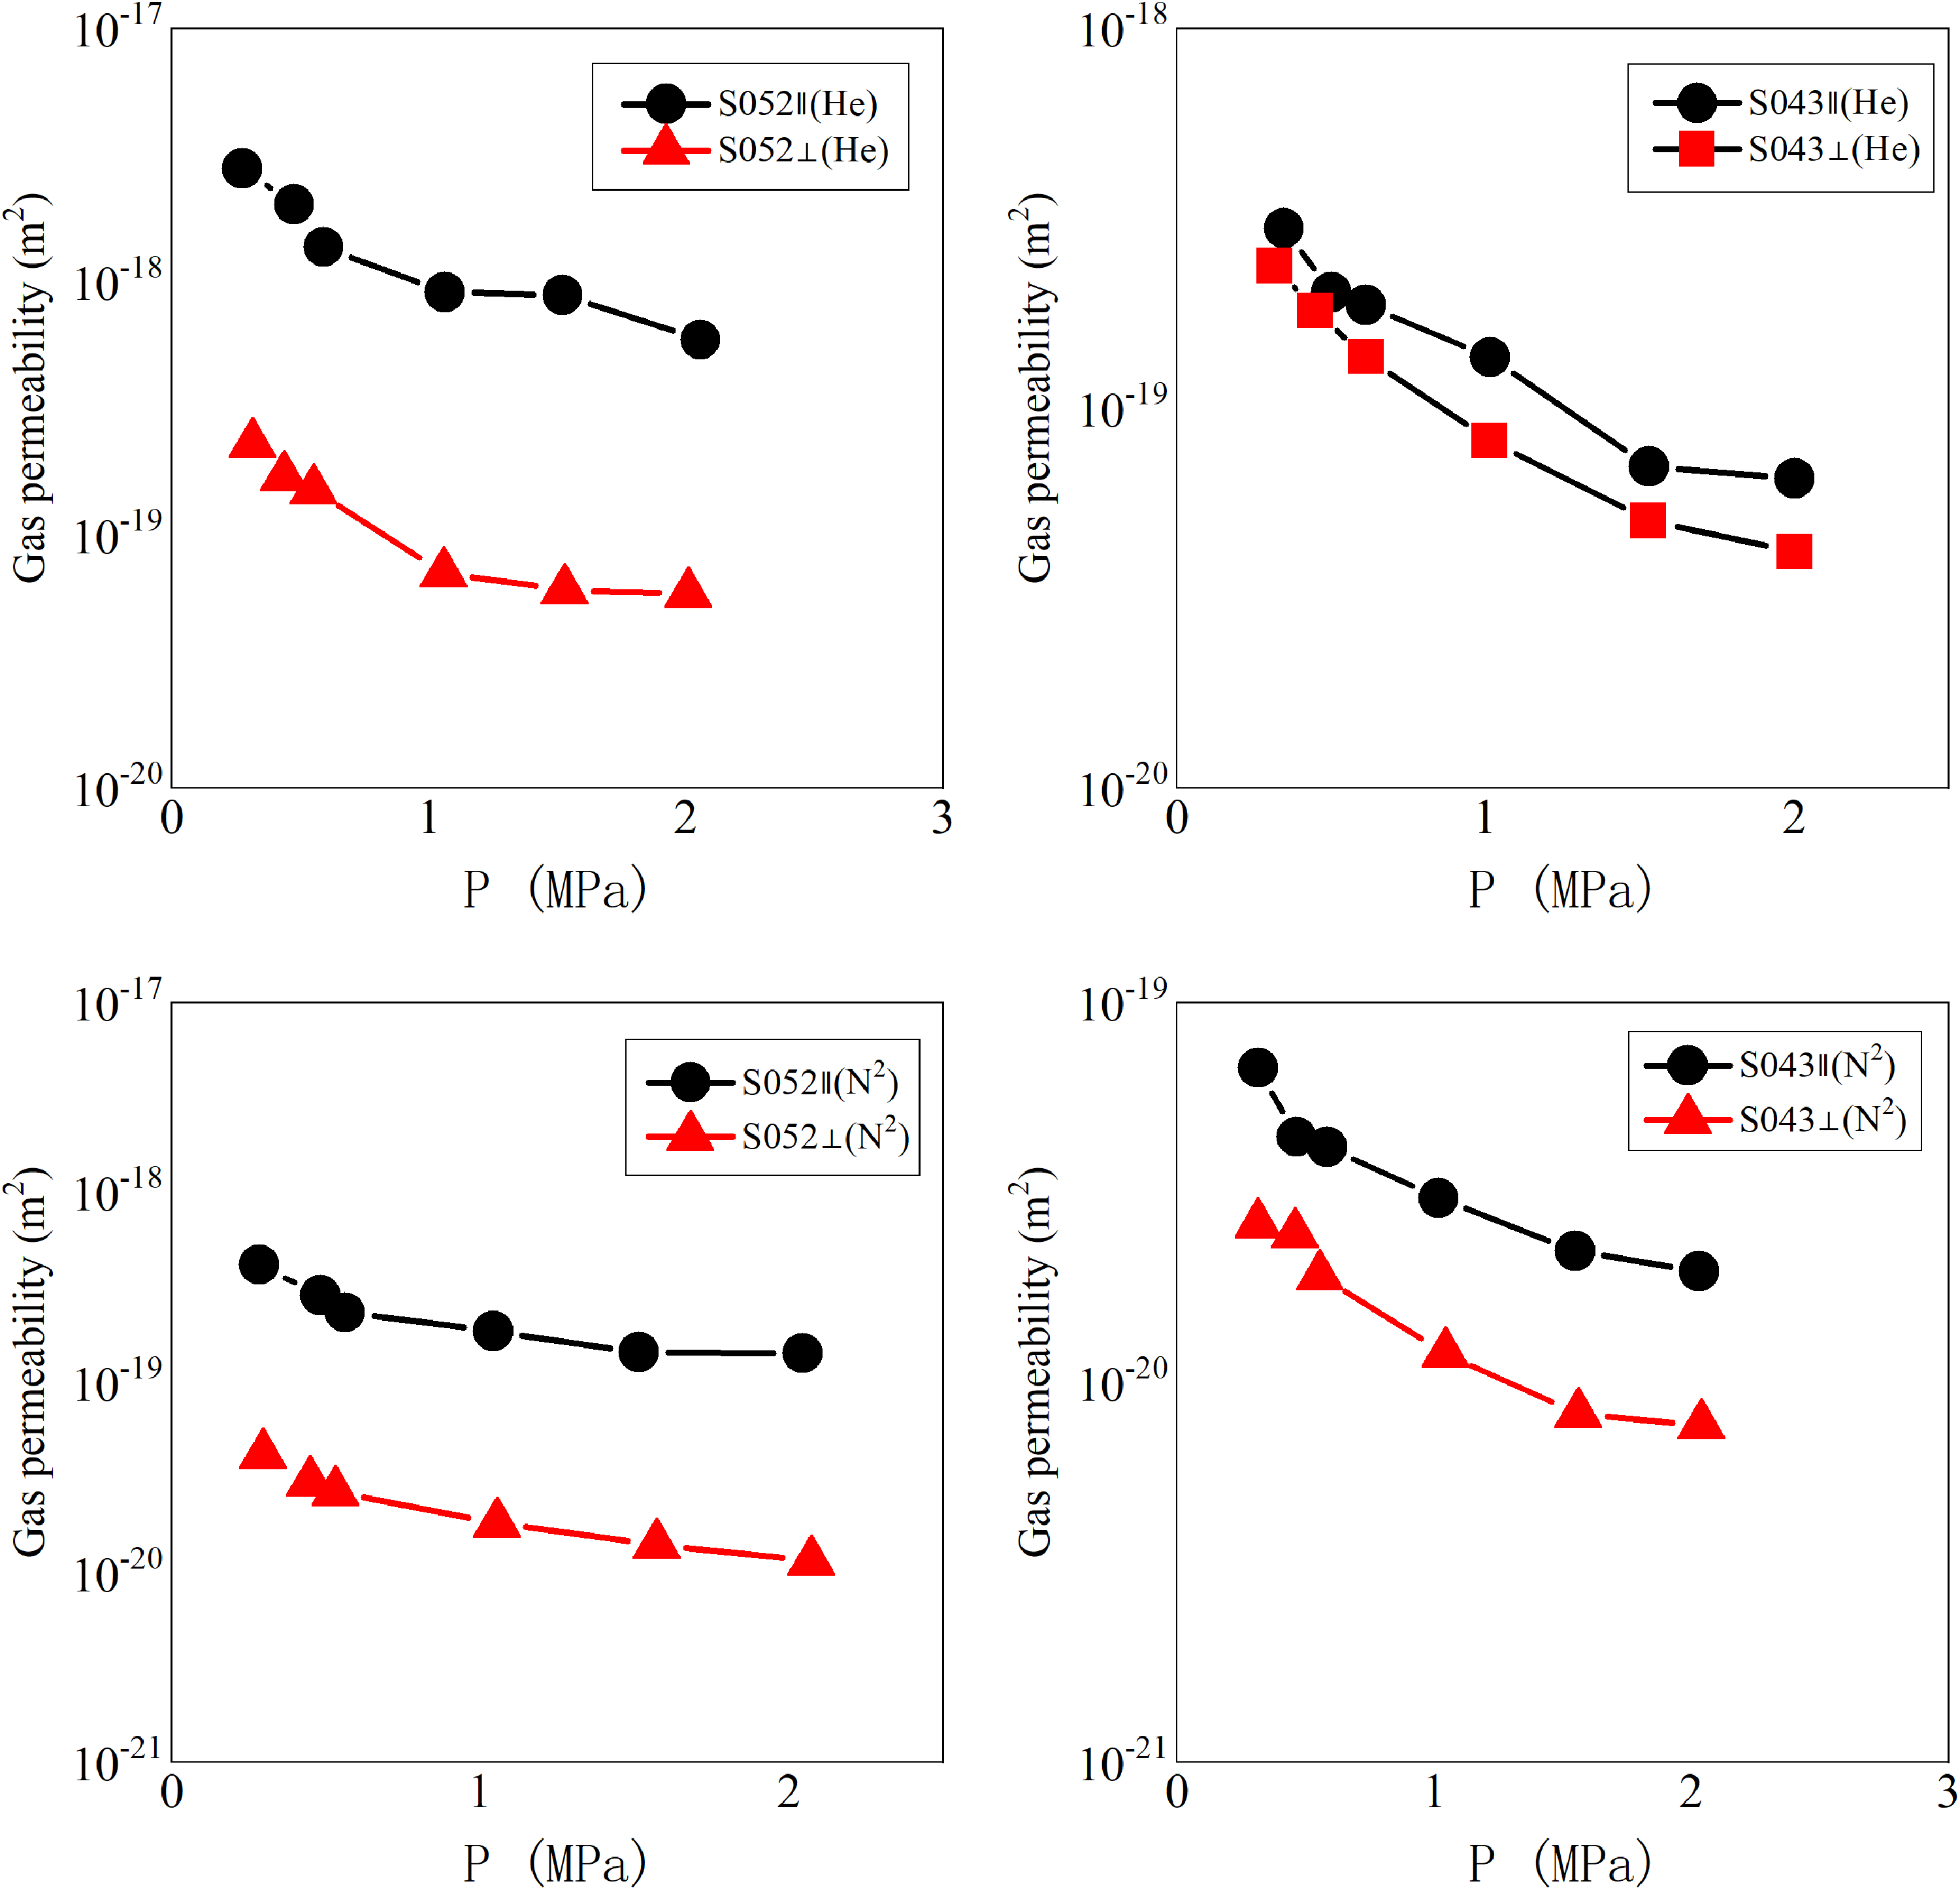
Vertical permeability and horizontal permeability measured with different gases at different pressures for samples S052 and S043. The parallel permeability of sample S043 was 2.51 times higher than the vertical permeability, while the parallel permeability of sample S052 was 16.78 times higher than the vertical permeability.
Additionally, the effective pore size of parallel samples calculated with different gases was found to be one to two times larger than that of vertical samples (Figure 12). That's because the effective pore size is calculated on the basis of the gas slip coefficients, the gas slip coefficients also showed anisotropy characteristics. The gas slip coefficients of the parallel sample were only 0.6 to 0.9 times those of the vertical sample (Table 4; Figure 13).
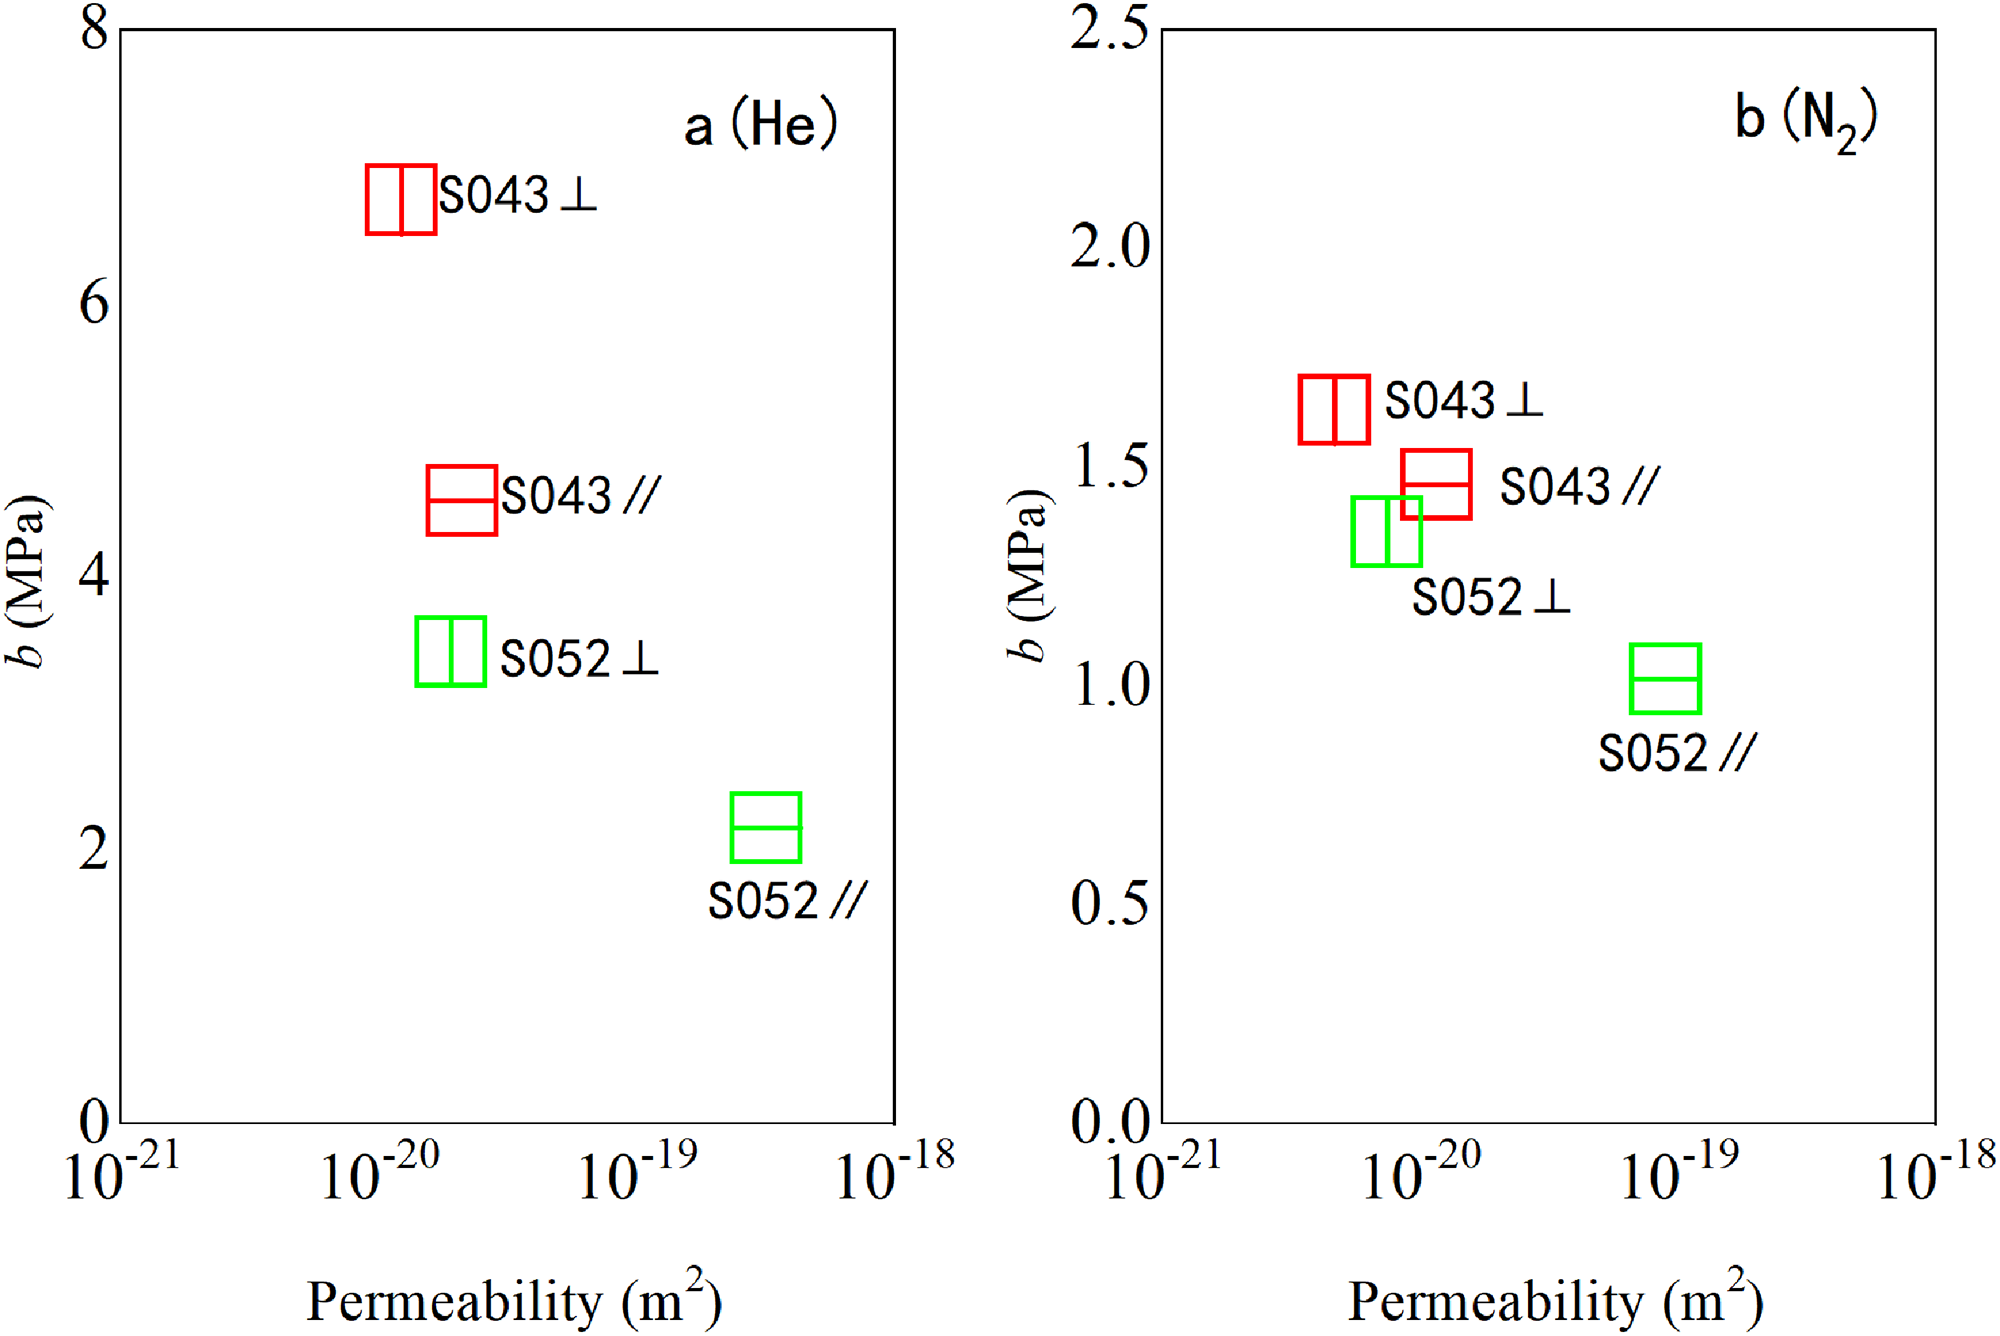
Comparison of permeability and slip anisotropy between S052 and S043 (a) He; (b) CH4; (c) N2. The gas slip factor of the parallel sample was only 0.6 to 0.9 times that of the vertical sample.
Conclusions
This article analyzed and discussed the gas slip effect, the influence of permeating fluid on gas permeability, and the anisotropy of permeability. The conclusions are as follows:
Under the same experimental pressure and temperature conditions, helium permeability is four times higher than nitrogen permeability. The slip factor of helium is on average 2.79 times that of nitrogen, ranging from 2.03 to 4.14 times. The calculated effective pore size of shale using the helium slip factor is, on average, 1.67 times larger than that of nitrogen, with a range of 0.74 to 1.51 times. The small diameter and long molecular free path of helium lead to a more pronounced slip effect. Nitrogen exhibits adsorption, which causes radial expansion during gas penetration. As a result, the effective pore size calculated using helium is larger than that calculated using nitrogen.
Samples S043 and S052 showed higher values when measured with gases parallel to the bedding (S043∥and S052∥), compared to measurements taken perpendicular to the bedding (S043⊥ and S052⊥). The permeability anisotropy is influenced by the arrangement of minerals, forming distinct pore systems. The clay-rich sample (S052) with the preferred orientation exhibits more significant permeability anisotropy compared to the calcite-rich sample (S043) with a random fabric orientation.
Footnotes
Declaration of conflicting interests
The author(s) declared no potential conflicts of interest with respect to the research, authorship, and/or publication of this article.
Funding
The author(s) disclosed receipt of the following financial support for the research, authorship, and/or publication of this article: This work was supported by the Project of China Geological Survey, Qinghai Dewu Oil and Gas Field Development Co. LTD, Key Laboratory of Shallow Geothermal Energy, Ministry of Natural Resources, National Natural Science Foundation of China (Grant Nos. DD20190094, HX2023-1, KLSGE202302-04, and 42102289).