
Abstract
To achieve the carbon neutralization plan by 2060, China implemented the “Dual Control” (Neng Hao Shuang Kong in Chinese) policy in 2015 by limiting the energy intensity and consumption, leading to forced slowdown of energy-related production and consumptions, which in turn hampered China's economic growth. The economic impact of energy shortage has been discussed in such studies as Cheng et al., the economic consequences of the new policy remain unanswered. In this article, we select China's provincial GDP and electricity generation data from 2001 to 2021 to perform causality tests and a double log model which delineates the nexus between GDP growth and electricity generation. We find that (a) electricity generation growth Granger causes GDP growth but not vice versa, and (b) a 1% increase in electricity generation growth will lead to 0.17% increase in GDP growth. The significance of the finding is: as coal still primarily fuels electricity generation, dual control will further hinder China's economic development sans significant enhancement of electric system or expansion of renewable energy, our findings thus support an upgrade of current grid network by China Power International Development; an expansion of renewable capacity such as a proposal of 400 GW new energy project; and construction of energy storage devices such as the CGD Group thermal storage System and Yingcheng Compressed Air Energy Storage System.
Introduction
In the past two decades, China has performed extraordinary economic growth and stepped to the second largest economy in the world with an average GDP growth rate of around 8.6%. The electric power sector primarily fuels China's rapid economic expansion, where thermal power, especially coal-fired generation capacity (Chen and Xu, 2010), comprises over 60% of China's electricity generation. 1 To curb rapid growth of carbon emission from power generation, Chinese government implemented a “Dual Control” policy for energy consumption in 2015, with an aim of cooling down the gross volume growth and lowering energy intensity in all provinces’ economic stakeholders. Later the “Dual Control” policy became one of the key performance indicator of local governors in 2021, which incentivizes them with possible reckless decarbonization behaviors. On top of the policy, growing fuel costs has stopped manufacturers in more than 10 provinces from operation due to forced power outage 2 : some manufacturers are only allowed to operate in the nighttime while some are permitted to operate 4 days every week. 3 In 2022 August, the average forced outage in Sichuan province reached five working days, firms thus had to keep a minimum service to sustain their business (Chen et al., 2022). The policy is likely to continue, exemplified by the 2022 Davos agenda where president Xi announced that China's carbon neutrality objective by 2060. To comply with the commitment, therefore local governors may actively and more heavily decarbonize the economic agents.
Meanwhile, China's GDP growth since 2015 has slowed down: from 7% to merely 3% in 2022. The only exception is 2021 because its successful Covid-19 suppression which enabled China to be a major supplier in the global consuming good market (Deng, 2022). However, the economic growth dropped again in 2022, partially because electricity shortage as is discussed in Yang et al. (2007), Yuan et al. (2008), Sun et al. (2009), and Cheng et al. (2013). We therefore reasonably postulate that Dual Control has significantly hampered China's economic growth. The next question is: to what extent?
To answer this question, one should firstly recognize the economic growth and electricity nexus which has been widely investigated in: (a) Chen et al. (2007) where a one-directional short-run causality from economic growth to electricity consumption and bi-directional long-run causality between them for 10 Asian countries are explored and empirically validated; (b) Shiu and Lam (2004), Yuan et al. (2007), and Yuan et al. (2008) which reveal a uni-directional Granger causality from electricity consumption to GDP in China's inner provinces and Hong Kong S.A.R.; and (c) Ho and Siu (2007) that demonstrates a long-run uni-directional causality and equilibrium between electricity and economic performance. More specifically, electricity generation is estimated to drive China's GDP by 0.6% (Cheng et al., 2013). Such nexus is echoed by a gray incidence analysis for the relationship between coal-fired energy consumption and GDP (Yuan et al., 2010).
With causality being identified, we estimate the quantitative relationship between electricity and economic growth by employing a double log regression, with the aid of annual aggregate economic data. By doing so, we can portray the percentage loss (gain) of economic growth due to one percentage reduction (increase) in electricity generation. Therefore, we follow the methodology in Cheng et al. (2013) and affirm a one-way causal relationship between the electricity generation and GDP for China; we then evaluate the possible GDP losses by estimating GDP elasticity with respect to electricity generation.
We find that electricity generation growth Granger causes GDP growth but not vice versa, and that China's GDP elasticity of electricity generation is around 0.17, showing that a 1% increase in electricity generation growth will drive GDP growth by 0.17%. These findings contribute to the debate over coal reliance and whether the Dual Control policy should sustain. In particular, we argue that Dual Control significantly hinders China's economic development sans enhancement of electric network or expansion of renewable energy, our findings meanwhile support ongoing major renewable and network constructions, for example: a 4*660 MW renewable generation by CHN Energy, and a newly proposed 400 GW new energy project announced in the United Nations Biodiversity Conference in Kunming. 4
The rest of this paper follows: Literature review summarizes and reviews literatures, Data description describes data sources and key statistics, Methodology discusses the methodology, Modeling results presents results with discussions, and Conclusion concludes.
Literature review
Accounting for 28% of global carbon emission, China's decarbonization progress has received extensive research interest (Liu et al., 2021). In compliance with the decarbonization objective, it is estimated that China must realize a share of 70% to 85% of renewable energy by 2050 (Liu et al., 2021). Empirical studies have revealed the paradox of decarbonization and economic growth (Qin et al., 2021). The causal effect using either China or rest of the world as the object of study has been widely discussed in studies such as Yang et al. (2007), Yuan et al. (2008), Sun et al. (2009), Cheng et al. (2013), and Huong et al. (2021). Meanwhile, implementing such a Dual Control policy further complicates the operation and management of power network (Meraj et al., 2023). These challenges give rise to green generation (or green finance) which replaces conventional fossil fuel resources (Hu and Cheng, 2017; Lee et al., 2023). Estimating such an impact quantitatively can be diversified: studies may adopt operations research such as robust possibilistic programming proposed by Goli et al. (2023b) to optimize real-time system load; or a meta-heuristic algorithm (see for example: Goli et al., 2021, 2022, 2023a) to predict system load for grid management purpose; or a harmony search algorithm that best help allocate the resources to the load center (Alinaghian and Goli, 2017). Besides, artificial intelligence for scheduling problem may also be employed to identify the best potential decarbonization policy that helps China to achieve its decarbonization goal (Goli and Keshavarz, 2022; Goli and Mohammadi, 2022; Goli et al., 2019).
Equally noticeable is the strand using empirical regression approaches. Studies like Shiu and Lam (2004), Yang et al. (2007), Yuan et al. (2008), Sun et al. (2009), and Cheng et al. (2013) examined the causality and co-integration between energy and economic development. To further quantify the energy-economy nexus, widely used methodology ranges from an error correction model (Shiu and Lam, 2004), a Double Log model (Cheng et al., 2013), a logarithmic mean divisia index method (Xie et al., 2019), to a hierarchical model (De Souza et al., 2020). These studies suggest a significantly positive impact of energy consumption on GDP and/or CO2 emission (for example, De Souza et al., 2020). To compensate for the potential economic development decline, Fan and Hao (2020) suggest expanding renewable generation in China. The advantage is obvious: renewable energy can satisfy the policy objective on the one hand and meet the ever-growing demand for electricity on the other. However, renewable generation is unstable and intermittent, thanks to the “whims of mother nature” (Liu et al., 2016), understanding and optimizing renewable energy supply and demand become increasingly crucial. This challenge can be well addressed by modeling locational choice for renewables like wind and solar (Lotfi et al., 2021a; Lotfi et al., 2021b; Lotfi et al., 2022b), or latest technological developments in AI and blockchain algorithms (see Lotfi et al., 2022a).
To sum up, the Dual Control policy, once implemented, will slowdown China's GDP growth. To the best of our knowledge, extant studies have not explored this question using the most updated provincial level data, leaving the potential GDP losses under Dual Control unanswered.
Data description
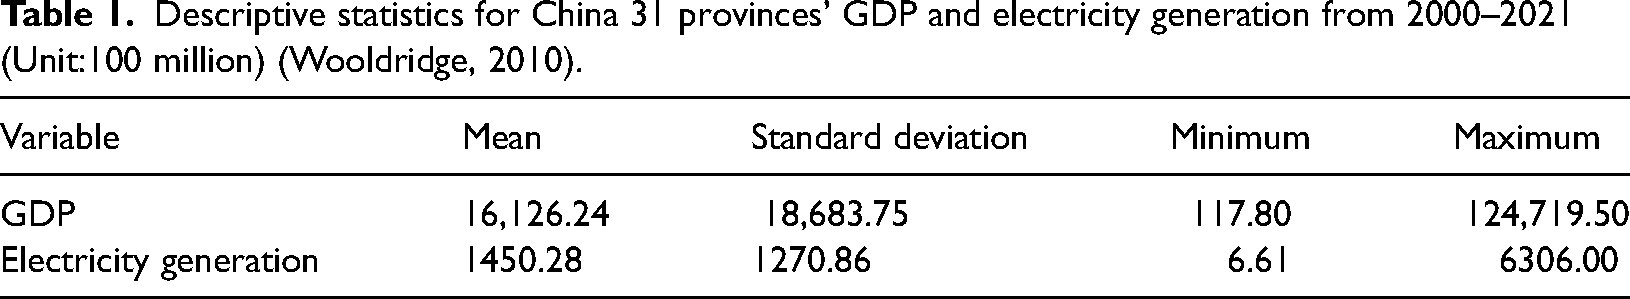
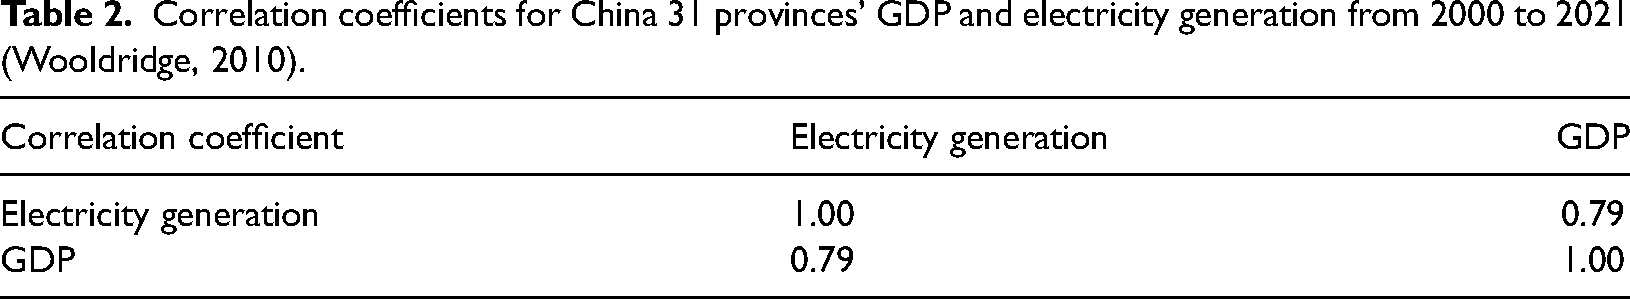
We choose a panel dataset which covers 22 years’ timespan from 2000 to 2021 of China's inner 31 provinces (Hong Kong, Macau, and Taiwan are not considered in this study due to institutional difference) compromising 682 observations, all the data are available from CSMAR database. 5 A glance at the descriptive statistics (Table 1) reveals variations in our data sample: for GDP series, the maximum is 124,719 while the minimum is only 117.8 and the standard deviation is 18683.75. For electricity generation, overall values are smaller than the GDP level: the maximum is around 6306 while the minimum is 6.61. The mean is around 1450 and standard deviation is 1270.86. Electricity generation and GDP are highly correlated with a correlation coefficient approach 0.80 (see Table 2). All the statistics, tests, and model regression results hereinafter are produced by STATA 18 (StataCorp, 1985). 6
Descriptive statistics for China 31 provinces’ GDP and electricity generation from 2000–2021 (Unit:100 million) (Wooldridge, 2010).
Correlation coefficients for China 31 provinces’ GDP and electricity generation from 2000 to 2021 (Wooldridge, 2010).
Methodology
To proceed with analyses, we firstly test the data series stationarity, this is to eliminate a spurious regression problem pointed out in Granger and Newbold (1974). The basic test model for detecting unit root is given by
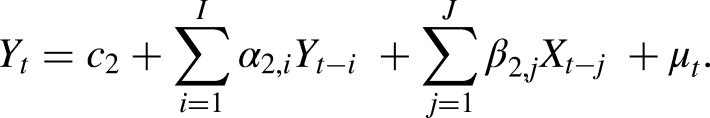
Once data series is tested to be stationary, we then test the causality between the electricity generation and GDP. Otherwise, we take first difference
7
for the data series and test stationarity and proceed with the causality test and regression model using first differenced data series. The Granger causality test states that a variable X evolving over time Granger causes another evolving variable Y if predictions of the value of Y based on its own past values and on the past values of X are better than predictions of Y based only on its own past values (Granger, 1969):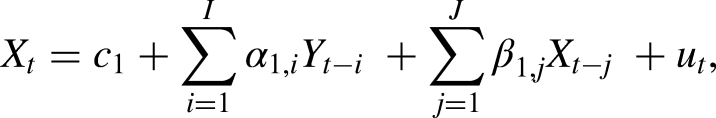
When the causal relationship between electricity generation and GDP is affirmed, we continue quantifying the electricity-GDP nexus. We follow Cheng et al. (2013) to examine the influence of Dual Control on China's GDP and construct the baseline logarithm model below. We also specify a break, Year, to capture the pattern of GDP showing the year of implementation of the policy:

We will firstly perform unit root tests in forms of: Fisher-type (DF) test, IPS test and LLC test (Wooldridge, 2010), by doing so we eliminate any possibility of spurious regressions that give unreliable statistical inferences (Granger and Newbold, 1974). Then, a Granger causality test will be applied to see if electricity generation statistically causes economic growth, or the other way around (Granger, 1969). Once the direction of causality is confirmed, we run panel data regressions for equation (1) and equation (2) (Wooldridge, 2010). This step provides us with the elasticity estimates for electricity generation with respect to GDP.
In practice, we employ unit root test and Granger causality test packages as an analysis tool in STATA 18 (StataCorp, 1985). Our estimation technique is panel fixed effect (FE) estimation, which is due to a Hausman test that denies any opportunity of random effect (Wooldridge, 2010). The panel FE estimation package is available in STATA 18 (StataCorp, 1985).
Modeling results
Unit root test
To see if data series are stationary or not (Granger and Newbold, 1974), we use Fisher-type (DF) test, IPS test and LLC test (Wooldridge, 2010) by STATA 18. Table 3 indicates that the level form can pass one or two tests while their first difference forms pass all three tests at 1% statistical significance level. As simply taking natural log cannot fully pass all stationary tests, therefore, we take first differences and choose equation (2) as our baseline and use level form for robustness checks.
Unit root test results for China 31 provinces’ GDP and electricity generation from 2000 to 2021 (Granger and Newbold, 1974).
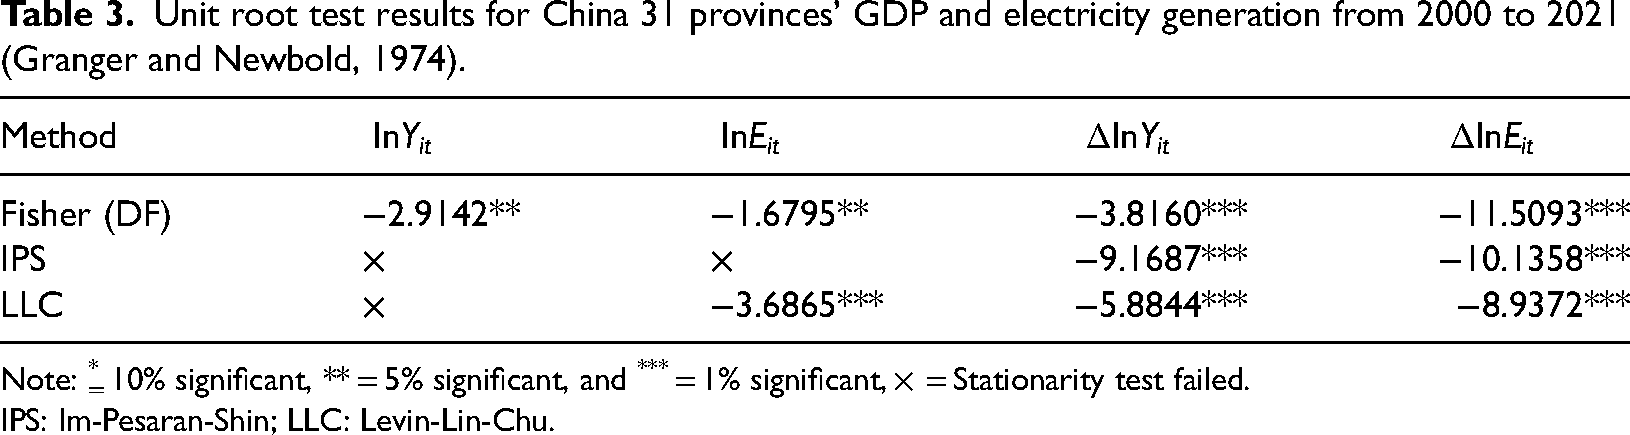
Note: * = 10% significant, ** = 5% significant, and *** = 1% significant, × = Stationarity test failed.
IPS: Im-Pesaran-Shin; LLC: Levin-Lin-Chu.
Causality test
Given that first difference data series are stationary, we report the Granger causality (Granger, 1969) test result based on the first differenced data in Table 4. The Z-bar in the first column rejects the null hypothesis at the 5% significance level, indicating that electricity generation growth Granger causes GDP growth. However, in the second column, both Z-bar and Z-bar tilde cannot reject the null hypothesis, even at a 10% level. Therefore, the growth of electricity generation Granger causes GDP growth, but not the other way around. This causality result is consistent with findings from other studies based on time series data from 1953 to 2010 (Cheng et al., 2013), suggesting a regime remaining unchanged.
Causality test results (lag order =1) for China 31 provinces’ GDP and electricity generation from 2000 to 2021 (Granger, 1969).
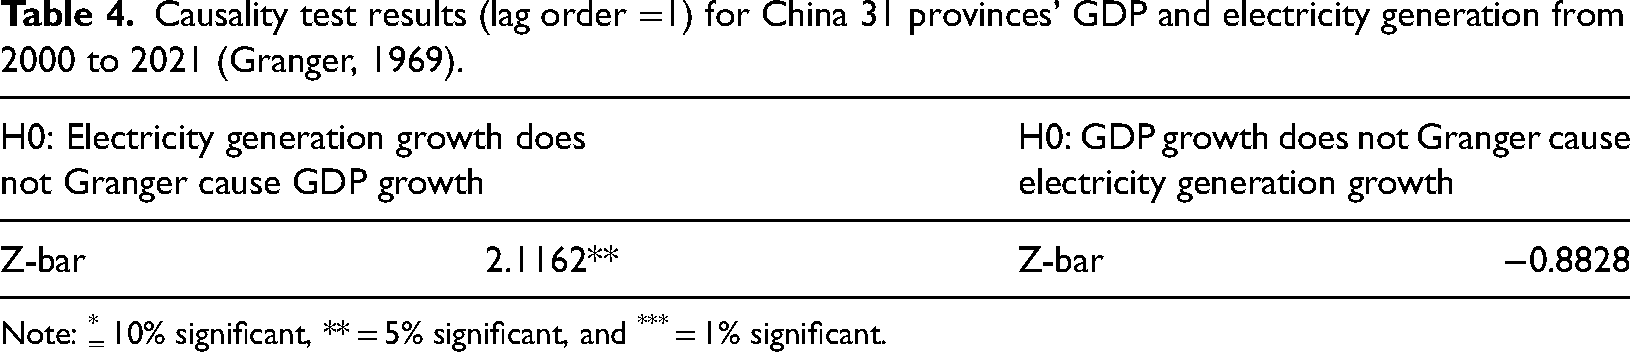
Note: * = 10% significant, ** = 5% significant, and *** = 1% significant.
Regression result
We estimate equations (1) and (2) with cross-sectional FE (Wooldridge, 2010) by STATA18 and report the software outputs in Table 5. By the equation specification, the introduced break variable (Year) for year of implementation of the policy is significantly negative at 5% or 1% level, implying that the binding policy reduces China's economic development (GDP). The double log setup yields consistently positive elasticity estimates (i.e. the coefficient estimates for
Panel FE estimation of China 31 provinces’ GDP and electricity generation from 2000 to 2021; n.a. = not applicable (Wooldridge, 2010).
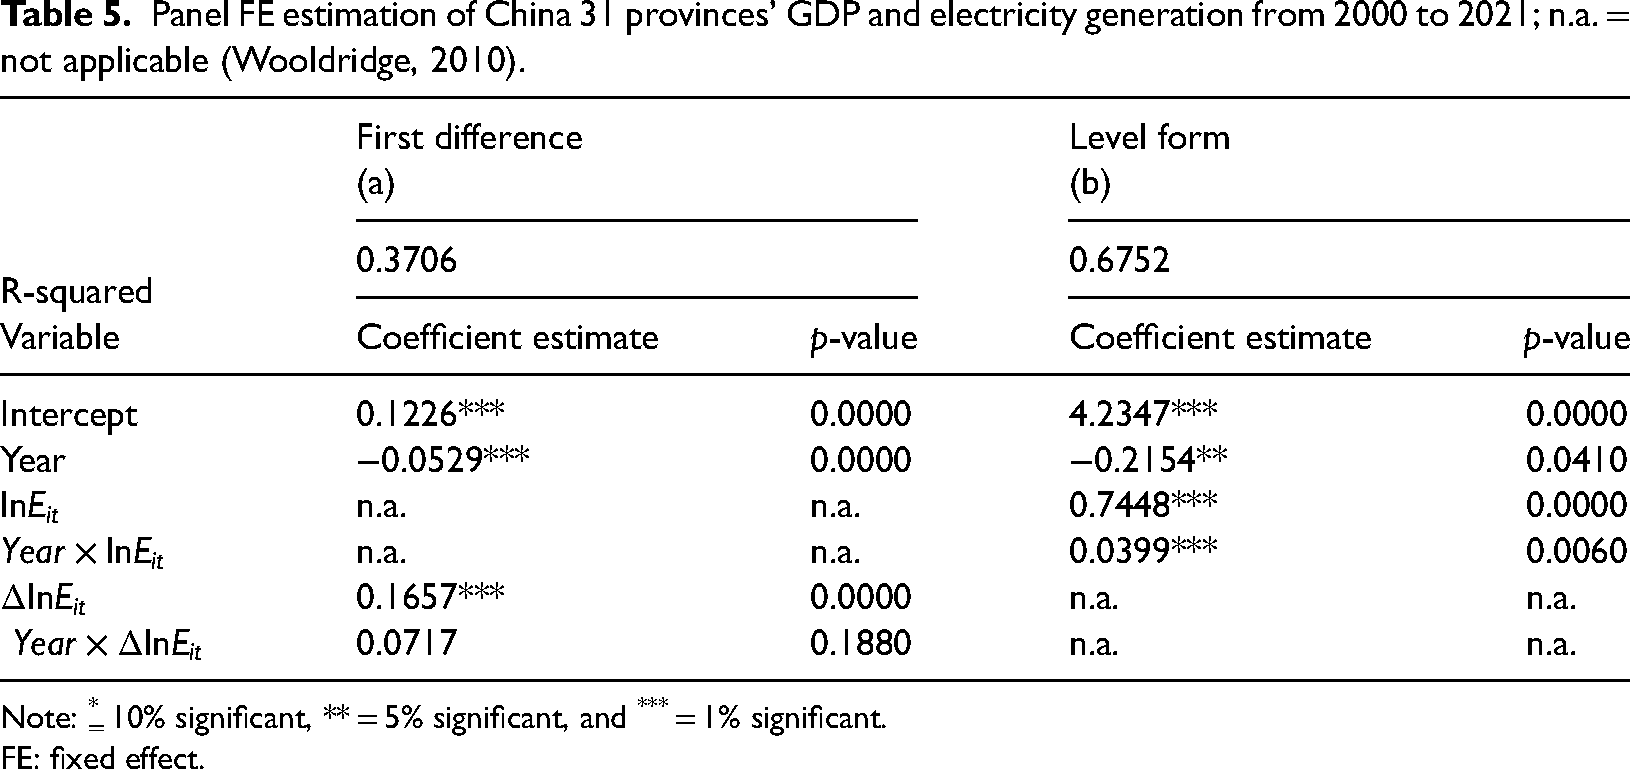
Note: * = 10% significant, ** = 5% significant, and *** = 1% significant.
FE: fixed effect.
Table 5 indicates the following findings. (a) The coefficient estimates of
Implications for practitioners
Our findings shade light on industrial practitioners. As China uses coal as primary fuel (accounting for over 70% of total generation) 8 , with the binding Dual Control policy, a rational profit-maximizing market practitioner should actively participate in the following areas to circumvent any possible forced outages: first, upgrading current grid network to attain higher power transmission efficiency, this is exemplified by a recent nationwide ambitious project to upgrade power grid by China Power International Development. 9 Second, expanding renewable energy capacity, this is best explained by a latest proposal of 400 GW new energy project announced by President Xi. 10 Last, constructing energy storage devices will comply with the policy while enhancing a capacity owner's profitability by storing (buying) at low prices and generating (selling) at high prices (Liu et al., 2017). A case in point is the ongoing CGD Group thermal storage System and Yingcheng Compressed Air Energy Storage System. 11
Conclusion
In this paper, we firstly affirm a directional causality relationship running from electricity generation growth to GDP growth, a piece of empirical evidence documented in Shiu and Lam (2004) and Cheng et al. (2013). We find that electricity generation growth significantly causes GDP growth but not vice versa, and that a 1% increase in electricity generation growth will lead to 0.17% increase in GDP growth, a positive and significant electricity-GDP growth nexus corroborating findings in extant studies, for example, Yuan et al. (2010) and Cheng et al. (2013). With reference to the estimation results, policy factor such as Dual Control plays an equivalently crucial role in GPD growth. Considering the continuing and foreseeable commitment to carbon neutrality, Dual Control may further compromise Chinese economic development. Because dirty coal currently remains to be the primary fuel of China's electricity generation, integrating renewable energy resources like wind and solar would be a silver-bullet in balancing the objective of decarbonization and economic prosperity. However, the challenges in integrating renewable energy will be another separate topic for a serious evaluation and investigation.
Based on our findings, we suggest that managers of a power company should consider upgrading current grid network to attain higher power transmission efficiency, for instance, a recent bulk upgrade project initiated by China Power International Development. An equally desirable suggestion is to expand renewable energy capacity, explained by a latest proposal of 400 GW new energy project announced. Alternatively, a power company may construct energy storage devices in compliance with the policy while enhancing its profitability by arbitrage. This is witnessed by an ongoing System and Yingcheng Compressed Air Energy Storage System project.
There are limitations to the proposed methodology. First, it does not help depict a parallel trend if one is to perform an international (cross-sectional) comparison (Wooldridge, 2010). One may consider a difference-in-difference (DID) model if international data are available. Second, when sampling frequency enhances, one may need to model volatility of the variable of interest. To do so, the state-of-art studies may suggest using machine learning approach (Vrontos et al., 2021). Finally, one should recognize that the macroeconomic data suffer from a small sample size. Thus, analyzing firm data and stock market responses might deserve further exploration in the future.
Footnotes
Declaration of conflicting interests
The author(s) declared no potential conflicts of interest with respect to the research, authorship, and/or publication of this article.
Funding
The author(s) received no financial support for the research, authorship, and/or publication of this article.