
Abstract
The interpretation model for gas saturation in deep clastic reservoirs subject to intensive extrusion stress relies predominantly on experimental petrophysical data and the expanded Archie equation. Nonetheless, these methodologies may not consistently yield optimum results. Specifically, when subsurface pressure impacts formation resistivity, the resulting curve values exhibit substantial elevations, leading to significant inaccuracies in the precise estimation of gas saturation from resistivity logging data. Consequently, the evaluation of logging interpretations becomes a complex undertaking. This paper aims to comprehensively assess gas saturation in deep clastic reservoirs from both electrical and mechanical perspectives. To achieve this goal, we employ a multifaceted approach encompassing the Archie formula, the stress-corrected variable cementation index saturation model, and the resistivity-corrected saturation model. Through rigorous theoretical analysis and the utilization of simulated experimental data, a quantitative relationship equation between resistivity and stress difference has been established. Building upon this fundamental groundwork, an innovative resistivity-corrected saturation calculation model has been proposed. In comparison to the two alternative models, the new model exhibits enhanced accuracy in calculating gas saturation, as it is less influenced by extrusion stress and gravitational compaction. Furthermore, it demonstrates better consistency with core mercury injection capillary pressure data in determining gas saturation. The findings of this research provide valuable insights for the effective evaluation of deep clastic reservoirs, offering a robust framework for advancing the understanding of gas saturation in the face of complex geological and geophysical challenges.
Keywords
Introduction
Deep-seated reservoirs represent a promising frontier in the realm of global hydrocarbon exploration, commanding considerable scholarly attention (Bloch et al., 2002; Jia and Pang, 2015; Zhang and Li, 1980). These reservoirs epitomize distinctive traits, marked by the presence of formidable tectonic extrusion stress, gravitational compaction, and conspicuous heterogeneity, all culminating in diminutive pore dimensions and remarkably scant permeability. Furthermore, the resistivity of these profound reservoirs falls prey to a medley of influences, encompassing stress, fluid composition, and heterogeneity, thereby giving rise to substantial discrepancies in the estimation of gas saturation within individual boreholes and presenting formidable impediments to fluid characterization (Li et al., 2019; Qi et al., 2009).
The development of efficacious methodologies for the assessment of deep clastic reservoirs has emerged as a prominent research focus within the realm of petroleum geology. Gas saturation (Sg) stands as a pivotal parameter in the evaluation of petrophysical attributes of deep clastic reservoirs (Cook et al., 2015; Dutton and Loucks, 2010; Farrell et al., 2014; Li et al., 2020; Yin et al., 2018). Precise elucidation of gas saturation logs assumes a foundational role in the exploration of effective gas permeability, the delineation of gas and water formations, the estimation of reserves, and the execution of petrophysical simulations (Amie et al., 2011; Morteza et al., 2012).
Prior researchers have undertaken a multitude of successful investigations into the interpretation of reservoir logs, encompassing a diverse array of facets (Ali and Ziarani, 2012; Archie, 1942; Li, 2022; Liu et al., 2017; Qiu et al., 2015; Stow et al., 2020; Wang and Wang, 2021; Yang et al., 2020). These inquiries have chiefly concentrated on three principal domains: electrical, acoustic, and mechanical methodologies. Among these, electrical and acoustic approaches have ascended to notable prominence, demonstrating remarkable efficacy (Wang et al., 2020; Worthington, 1985). Rock resistivity parameters assume a pivotal role in the appraisal of hydrocarbon presence, the quantification of hydrocarbon content, and the demarcation of the oil–water interface, functioning as essential metrics for reservoir assessment (Qu et al., 2001). In the early twentieth century, substantial scholarly endeavors were dedicated to the examination of rock resistivity. Brace and Orange (1968a, 1968b) undertook an exhaustive scrutiny of the resistive properties of rocks under diverse circumstances, encompassing sustained pressure, fracture water pressure, and deformation impacts. They discerned a robust interrelation between rock resistivity and varying saturation levels. Marcela (1991) documented a logarithmic decline in the resistivity of desiccated rocks as pressure and temperature escalated. This phenomenon was ascribed to alterations in the structure and dimensions of rock cavities, increased pressure, and the piezoelectric effect, which augments electrical conductivity while diminishing rock resistivity. All of this research predominantly illustrates the behavior of rock electrical properties in controlled laboratory conditions, encompassing variations in parameters such as pressure, temperature, and saturation. Nevertheless, in real-world scenarios, when multiple factors converge, these investigations fall short in encapsulating the idiosyncrasies of rock electrical parameters and the evaluation of gas-bearing formations.
Concerning the impact of stratigraphic stress on rock resistivity, Jiang and Liu (2009) scrutinized the alterations in the resistivity of sandstone and limestone under diverse uniaxial stress conditions, particularly in both low and high-stress domains. Hao et al. (2002) ascertained that the existence of fractures and fluids possessing distinct properties within rocks before fracture initiation constitutes the pivotal factors influencing shifts in rock resistivity. This research encompasses extensive experimental core data. However, studies focusing on the configuration of stress-induced resistivity variations within authentic stratigraphic settings are sparse, and quantitative assessments thereof are even scarcer. Consequently, the precise anticipation of reservoir gas saturation remains challenging. Accurate prediction of gas saturation is imperative to avert misinterpretation of effective reservoirs and provides indispensable insights for gas-water distribution studies (Huang et al., 2019; Kukal, 1984; Rosepiler, 1981; Yuan et al., 2017).
In light of these considerations, this study embarks upon a rigorous exploration of the resistivity correction methodology under the impact of increased extrusion stress. This endeavor encompasses the utilization of logging data, simulated experimental data, and theoretical mechanism analysis. Specifically, we introduce a pioneering model for the computation of resistivity-corrected saturation, with resistivity serving as the foundational parameter. To assess the feasibility and effectiveness of this resistivity-corrected saturation model, we conduct a comprehensive comparative analysis, juxtaposing it with two alternative saturation models. The methodologies employed in this inquiry encompass Archie's formula, the stress-corrected variable cementation index saturation formula, and the resistivity-corrected saturation model. It is worth noting that these approaches exhibit certain limitations, particularly in terms of the determination of undefined constants, thereby yielding an inconsistent resolution to the challenge of elucidating gas saturation in deep clastic reservoirs. To address this concern, we propose an exhaustive comparative analysis that delves into the principles and applicability of various gas saturation models within deep-clastic reservoirs. Through a series of case studies and iterative algorithmic refinements, the predictive accuracy of these models is progressively enhanced, resulting in a more precise depiction of the formation's electrical properties. Such an approach holds the potential to elevate the coherence of log interpretation within the deep clastic reservoirs of the study area.
Geologic background
The Kuche Depression, located in Baicheng County, Aksu Region, Xinjiang, lies to the north of the Tarim Basin. Geographically, it is tethered to the Tianshan fault fold zone in the southern expanse, characterized by retrograde faults in the northern vicinity. This depression is flanked by the Tabei uplift to the south, the Yangxia depression to the east, and the Ush depression to the west. This particular foreland basin primarily bears the imprint of Middle and Early Neozoic sedimentation, as delineated in Figure 1(a). The Kucha depression can be demarcated into three distinct regions from north to south: the Klasu alluvial zone, the Baicheng depression, and the Quritag alluvial zone.
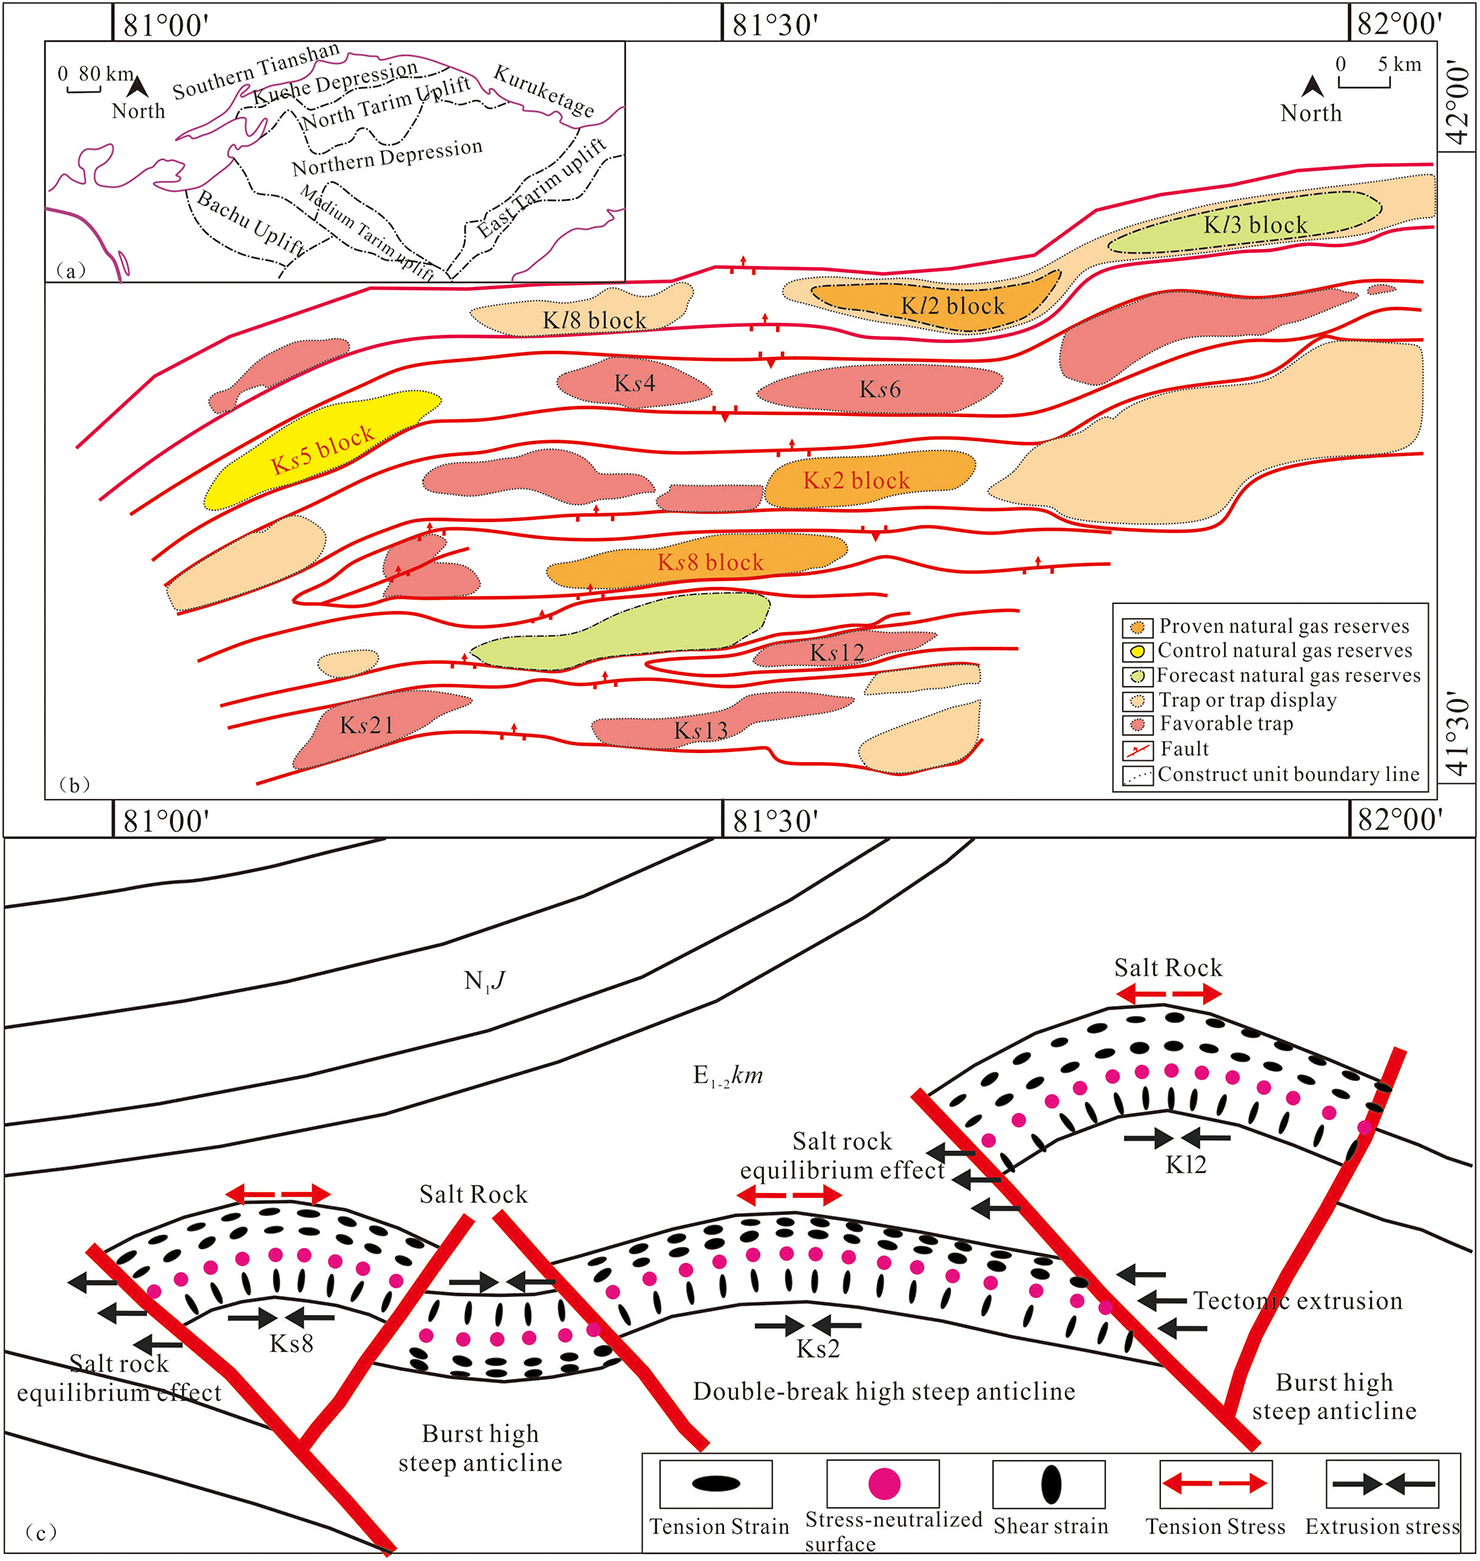
Structural position of the Keshen area in the Kuche depression.
The Klasu Alluvial Zone comprises an integral facet of the Tianshan Mountain Alluvial Plateau, embracing two sub-tectonic units: the North Monoclinic Zone and the Klasu Alluvial Zone. Further stratification is discernible within the Klasu Alluvial Zone, notably the Kela Zone and the Keshen Zone. The Klasu fracture serves as the demarcation line between the northern and southern sectors, with predominant research efforts directed towards the Ks2 and Ks8 gas reservoirs situated atop the Ks2 structure, as elucidated in Figure 1(b).
Multiple scholarly investigations have substantiated that the Kuche foreland alluvial expanse is subject to a myriad of geological processes. These encompass the formidable extrusion stress imposed by the South Tianshan tectonics, the initiation and equalization of the underlying salt strata, and the flexing and tautening of the substantial mudstone within the Shushanhe Formation (Li et al., 2001, 2004; Tang et al., 2011). These intricate processes have assumed a pivotal role in fashioning a triple-layer structure, characterized by variations in vertical stress, culminating in a back-sloping configuration. The employment of the Ramsay fold neutral surface model, upon which the foundation of this study, unveils that the upper portion of the back-slope undergoes deformation, whereas the lower segment contends with compressive stress. In marked contrast, the central region remains relatively unaffected, thereby constituting a neutral surface that remains virtually unaffected by deformation, as depicted in Figure 1(c).
Reservoir characteristics and classification
The gas reservoir within the investigated region primarily encompasses the first, second, and third lithological sections of the Cretaceous Bashkichik Formation. The prevailing constitution of the reservoir is a feldspathic rockchip sandstone. This reservoir epitomizes a dense sandstone characterized by notably low porosity and permeability. Porosity, on average, predominantly gravitates around 5.0%, while permeability, on average, predominantly distributes at approximately 0.05 mD. The substantial sandstone reservoir in the study area manifests reduced porosity and permeability attributes due to the conspicuous compressive stress exacted within the tectonic domain. Consequently, the formation of high-caliber oil and gas reservoirs is frequently a formidable endeavor (Li, 2023; Yuan et al., 2020).
The stratification of the Cretaceous Bashkichik Formation reservoir within the Kucha depression is discerned via the stress-neutralization surface. By employing the method of stress-neutralization surface division, in tandem with the assessment of logging curves, reservoir macroscopic and microscopic characteristics, reservoir typology, fracture development, and variations in stress differentials, the reservoir can be classified into three distinct vertical strata: the extensional stratum, transitional stratum, and compressive-torsional stratum, as depicted in Figure 2.
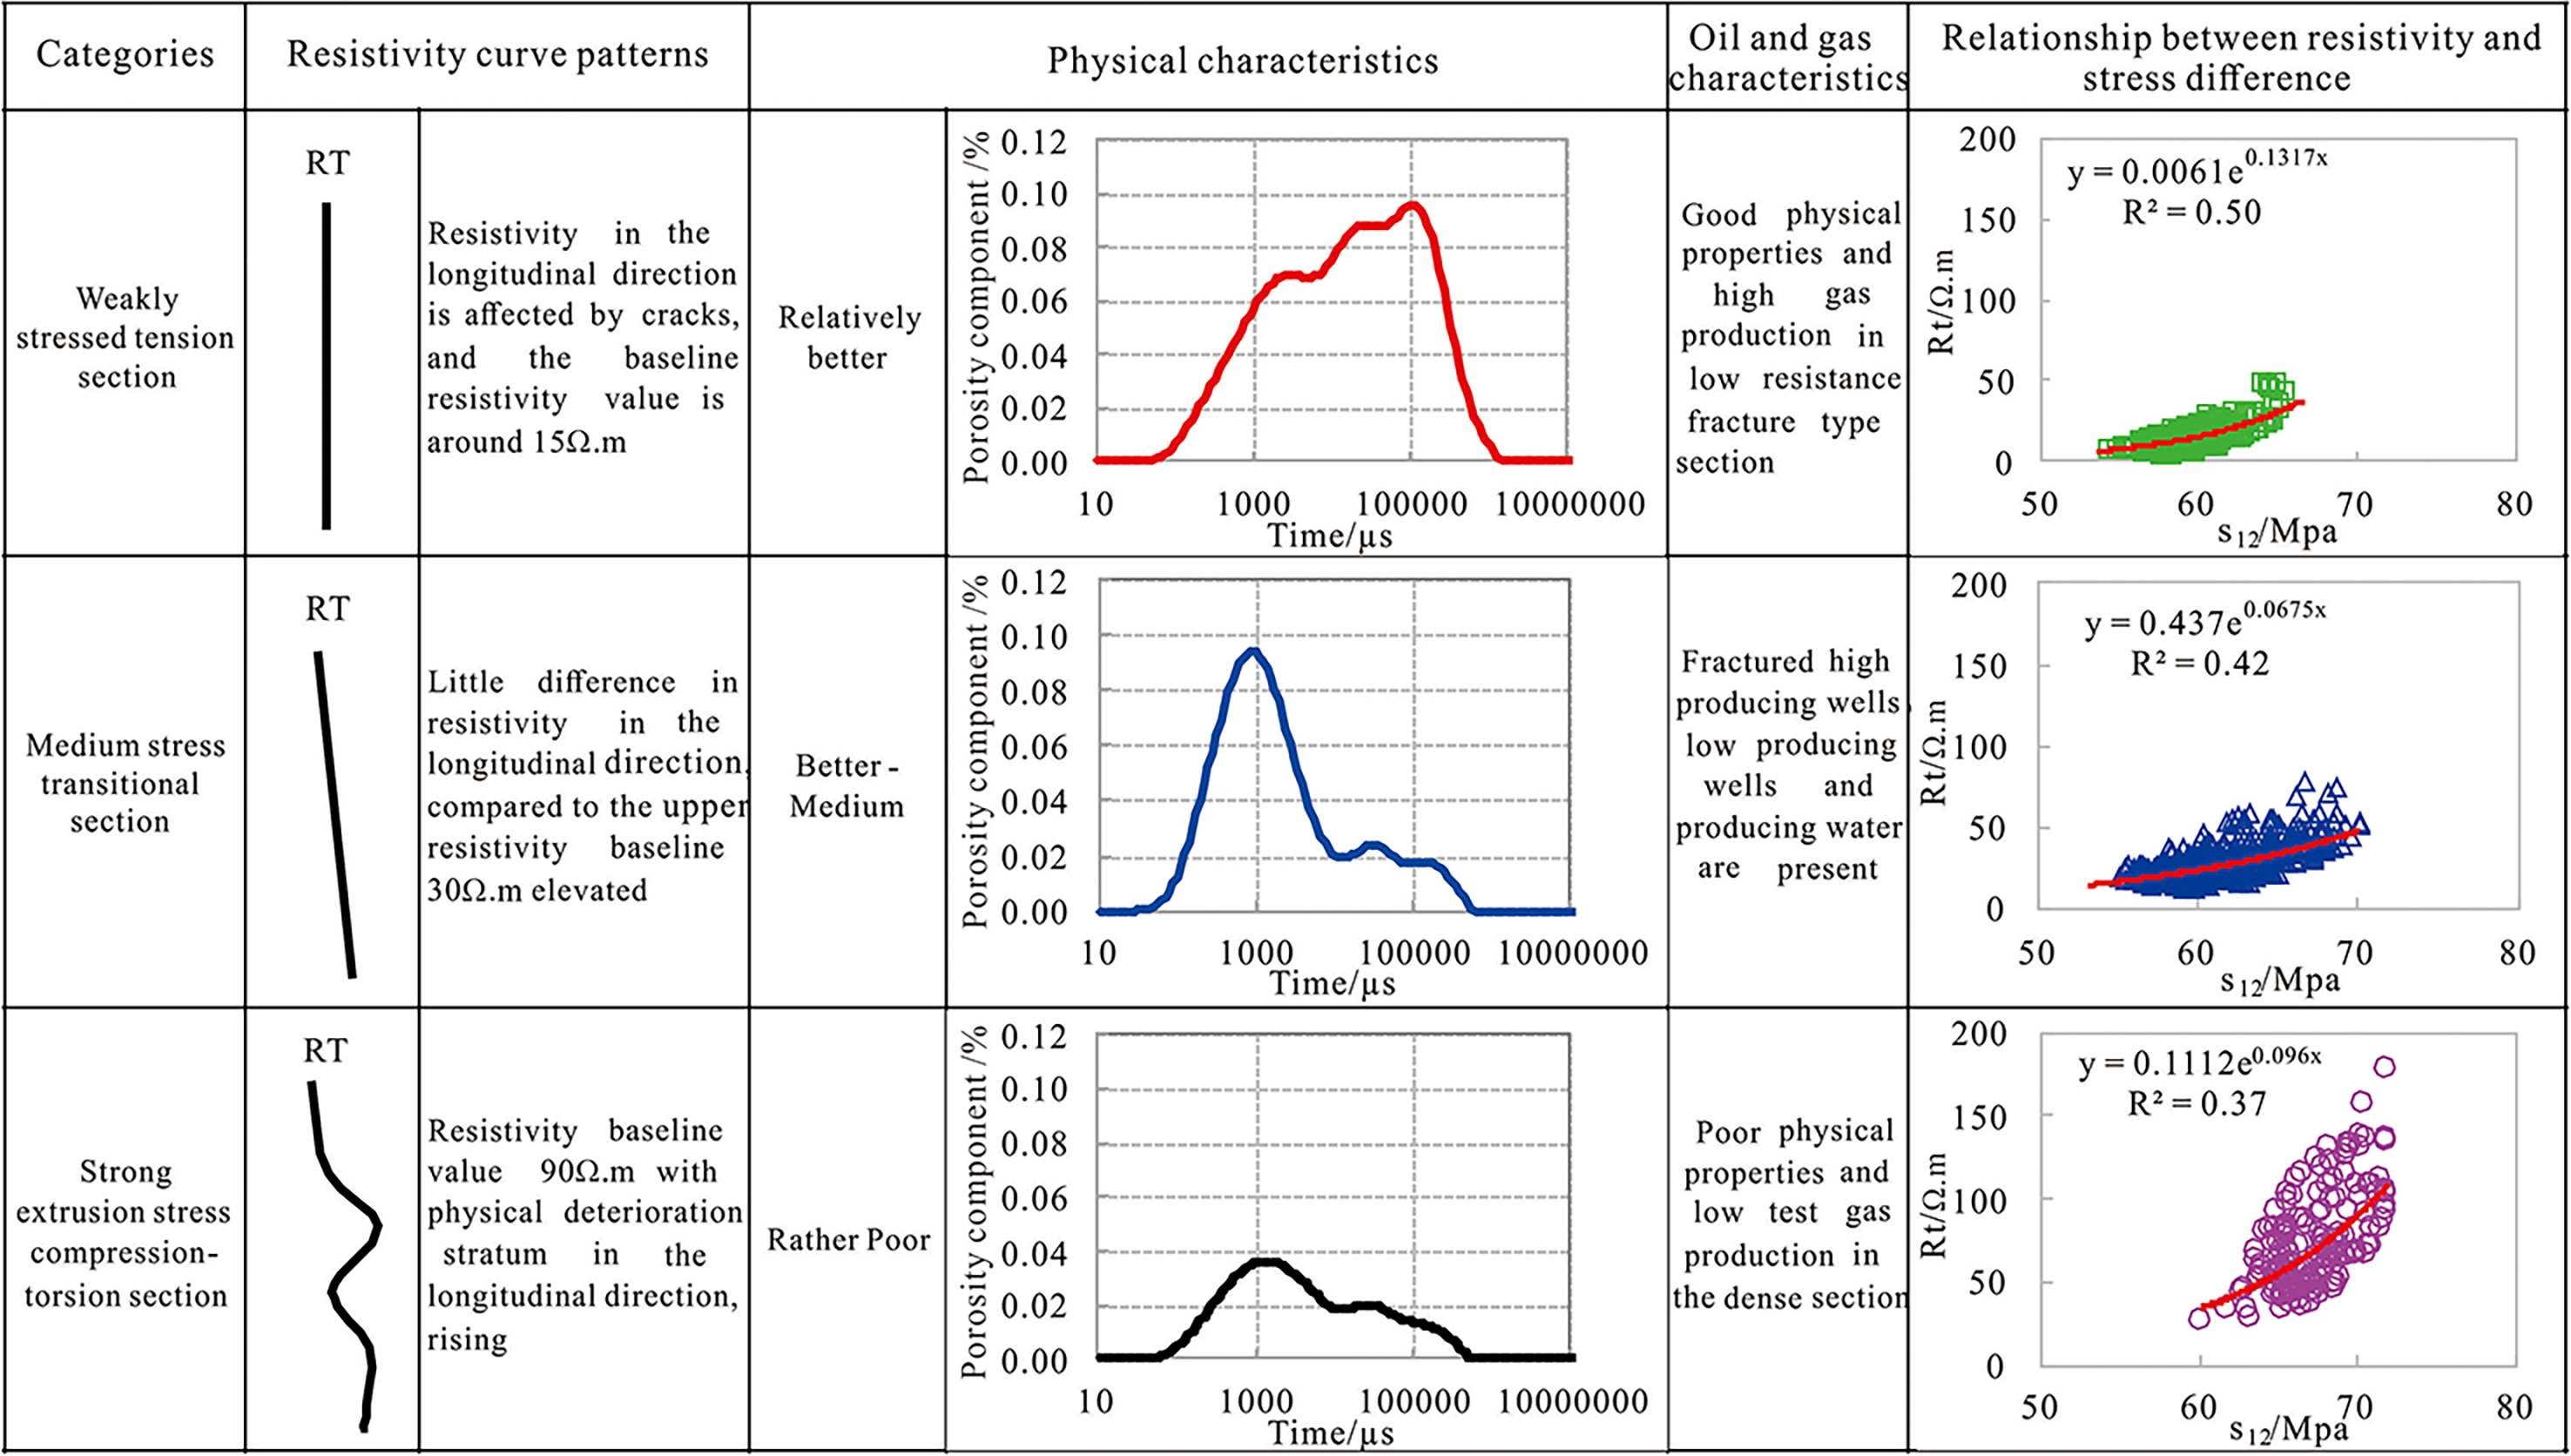
Comprehensive chart of characteristics of different extrusion stress types.
Extensional stratum: This stratum primarily showcases the influence of tensile stress, mainly stemming from extrusion forces. The reservoir composition predominantly comprises porous formations, distinguished by well-developed primary intergranular pores, intragranular solution pores, and intergranular solution pores. Tensile fractures are notably observed, displaying favorable physical characteristics. Nuclear magnetic resonance (NMR) analysis reveals a distinct dual-peak pattern, while the bound water saturation is measured at 26.9%. The resistivity in the longitudinal direction is influenced by the presence of fractures, with the baseline resistivity value approximating 15 Ω.m. The estimated maximum principal stress is approximately 210 MPa, while the minimum principal stress is around 150 MPa.
Transitional stratum: Within this section, there is a shift from tensile to compressive stress, resulting in a gradual increase in stress values, as observed in the stress curve. The reservoir pores continue to evolve, displaying a bimodal NMR response and a bound water saturation of 33.89%. The resistivity demonstrates minimal longitudinal variation, maintaining a baseline value of approximately 30 Ω.m. The maximum principal stress is estimated to be approximately 215 MPa, while the minimum principal stress is around 152 MPa. Within this transitional interval, the reservoir consists predominantly of fracture-pore and pore types, with porosity gradually declining while locally retaining high porosity.
Compressive-torsional stratum: Within this stratum, one observes prevailing compression stresses characterized by elevated stress magnitudes. The stress curve delineates a localized increase in the lower segment of the transition region as it converges towards the stress state typifying the compression-torsion section. Nonetheless, the overall stress value displays minimal fluctuations. NMR analysis portrays a singular peak response, accompanied by a bound water saturation of 42.39% and an average porosity of approximately 3.5%. The baseline resistivity value fluctuates around 90 Ω.m, aligning with the physical attributes along the longitudinal axis. The maximum principal stress is estimated to approximate 222 MPa, while the minimum principal stress is approximately 155 MPa. The microstructure of the reservoir particles reveals distinct extrusion deformation, particle mosaic patterns, and seldom witnessed dissolution effects along the suture network.
A meticulous cartographic representation delineating the attributes of diverse extrusion stresses within the Ks zone of the Kuche Basin tectonic region unveils profound insights (Figure 2): As we descend from the tension stratum to the transition stratum and progress further into the compression-torsion stratum, there ensues a corresponding escalation in both the maximal and minimal horizontal principal stress magnitudes. Simultaneously, the formation's resistivity value exhibits a stepwise augmentation. This phenomenon can be ascribed to the burgeoning horizontal principal stress value within the formation, engendering a reduction in formation porosity attributed to the impact of stress differentials. Moreover, fluid migration transpires from zones of heightened stress to those of diminished stress along the interstitial spaces, culminating in an elevation of the formation's resistivity value. This tendency of increasing formation resistivity with higher maximum and minimum principal stresses demonstrates a general pattern observed within the study block characterized by strong tectonic extrusion stresses.
Gas saturation model and analyze results
Sg model based on Archie's formula
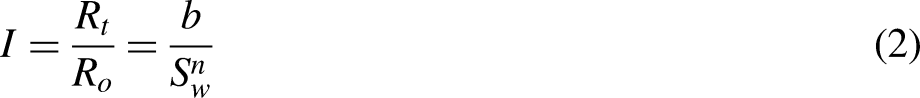
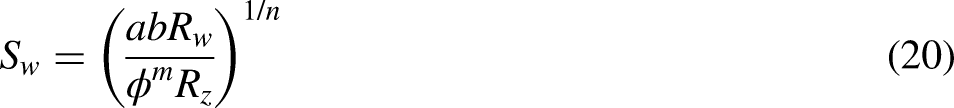
Archie's classical formula stands as the inaugural method for elucidating water saturation (Sw) in rock formations. Since its inception, this approach has garnered widespread adoption and has evolved across multifarious scientific domains. Even in contemporary times, Archie's formula persists as the preeminent and extensively embraced technique for interpreting water saturation in rock formations. In conformity with Archie's formula, the formulation of the formation factor (F) can be articulated thusly.
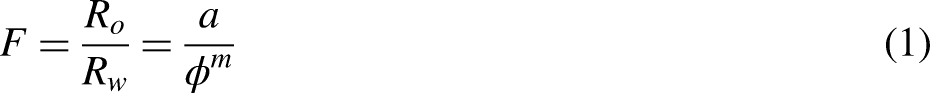
The resistance index I can be expressed as follows.
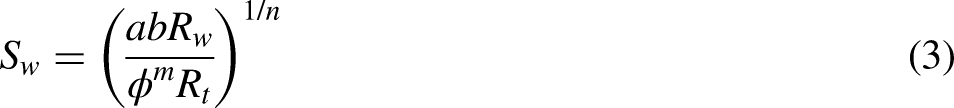
Substituting equation (1) for equation (2), the expression for the water saturation of the rock (Sw) can be obtained as.
The celebrated Archie formula, commonly referred to as the “classical Archie formula,” incorporates the variable Rw, which is subject to fluctuations induced by the temperature and salinity gradients of the formation water across diverse geographical regions. Conventionally, Rw values oscillate within a spectrum extending from 0.05 to 0.5 Ω.m. In this study, considering the outcomes of temperature analysis and the mineralization characteristics of the formation water, a Rw value of 0.15 Ω.m is embraced.
Sg model based on variable cementation index corrected for stress
First and foremost, a scrutiny of the data portrayal in Figure 2 unveils an empirical correlation between the primary horizontal stress differential and both the formation resistivity, as well as porosity.


By substituting equations (4) and (5) into equation (3) and subsequently applying logarithms to both sides, the expression for the cementation index, m, can be derived.


Based on the supporting experimental data, the variation of the cementation index with the horizontal principal stress difference can be established as follows.

The implementation of equation (10) in lieu of the traditional Archie formula (3) and its use in calculating gas saturation throughout the entire wellbore section have conferred superior results, thereby laying a substantial groundwork for fluid identification within the study region.
Sg model based on stress-corrected resistivity
Experiment
During the course of our research, we meticulously selected 19 exemplary core plug samples from five wellbores characterized by well-established cementation and the absence of discernible fissures. The mean porosity and permeability of the experimental core were determined to be 10.04% and 3.18 mD, respectively. Initially, the geological bedding orientation guided the division of rock specimens, with scrupulous fashioning of cores into cubic configurations measuring 5 cm × 5 cm × 5 cm. In order to ensure precise measurement of diverse core parameters, it became imperative to maintain verticality deviation within the confines of ±0.2° across all three facets (X, Y, and Z) of the core samples, complemented by a surface flatness discrepancy of no more than ±0.1 mm at corresponding terminations, and a side length variance contained within ±0.3 mm. This level of precision was crucial for the accurate measurement of electrical resistivity in all three dimensions (as illustrated in Figure 3). The electrical resistivity values of the core were determined in accordance with the industry-standard SY/T 5536-2006 (NDRC 2006). The testing instrument employed was the UDZL-2 high-temperature and high-pressure core electrical frequency spectrum experimental system. To accurately depict the core's resistivity under reservoir conditions, a high-temperature and high-pressure triaxial apparatus was employed to emulate the typical temperature and pressure conditions of the reservoir. The cores underwent a meticulous procedure involving low-temperature desiccation, surface refinement, and burnishing. Subsequently, following pressurization with a saturated saline solution, they were introduced into the high-temperature and high-pressure triaxial apparatus. The electrical resistivity of the rock samples was measured through the use of a digital bridge within the LCR resistance measuring instrument.
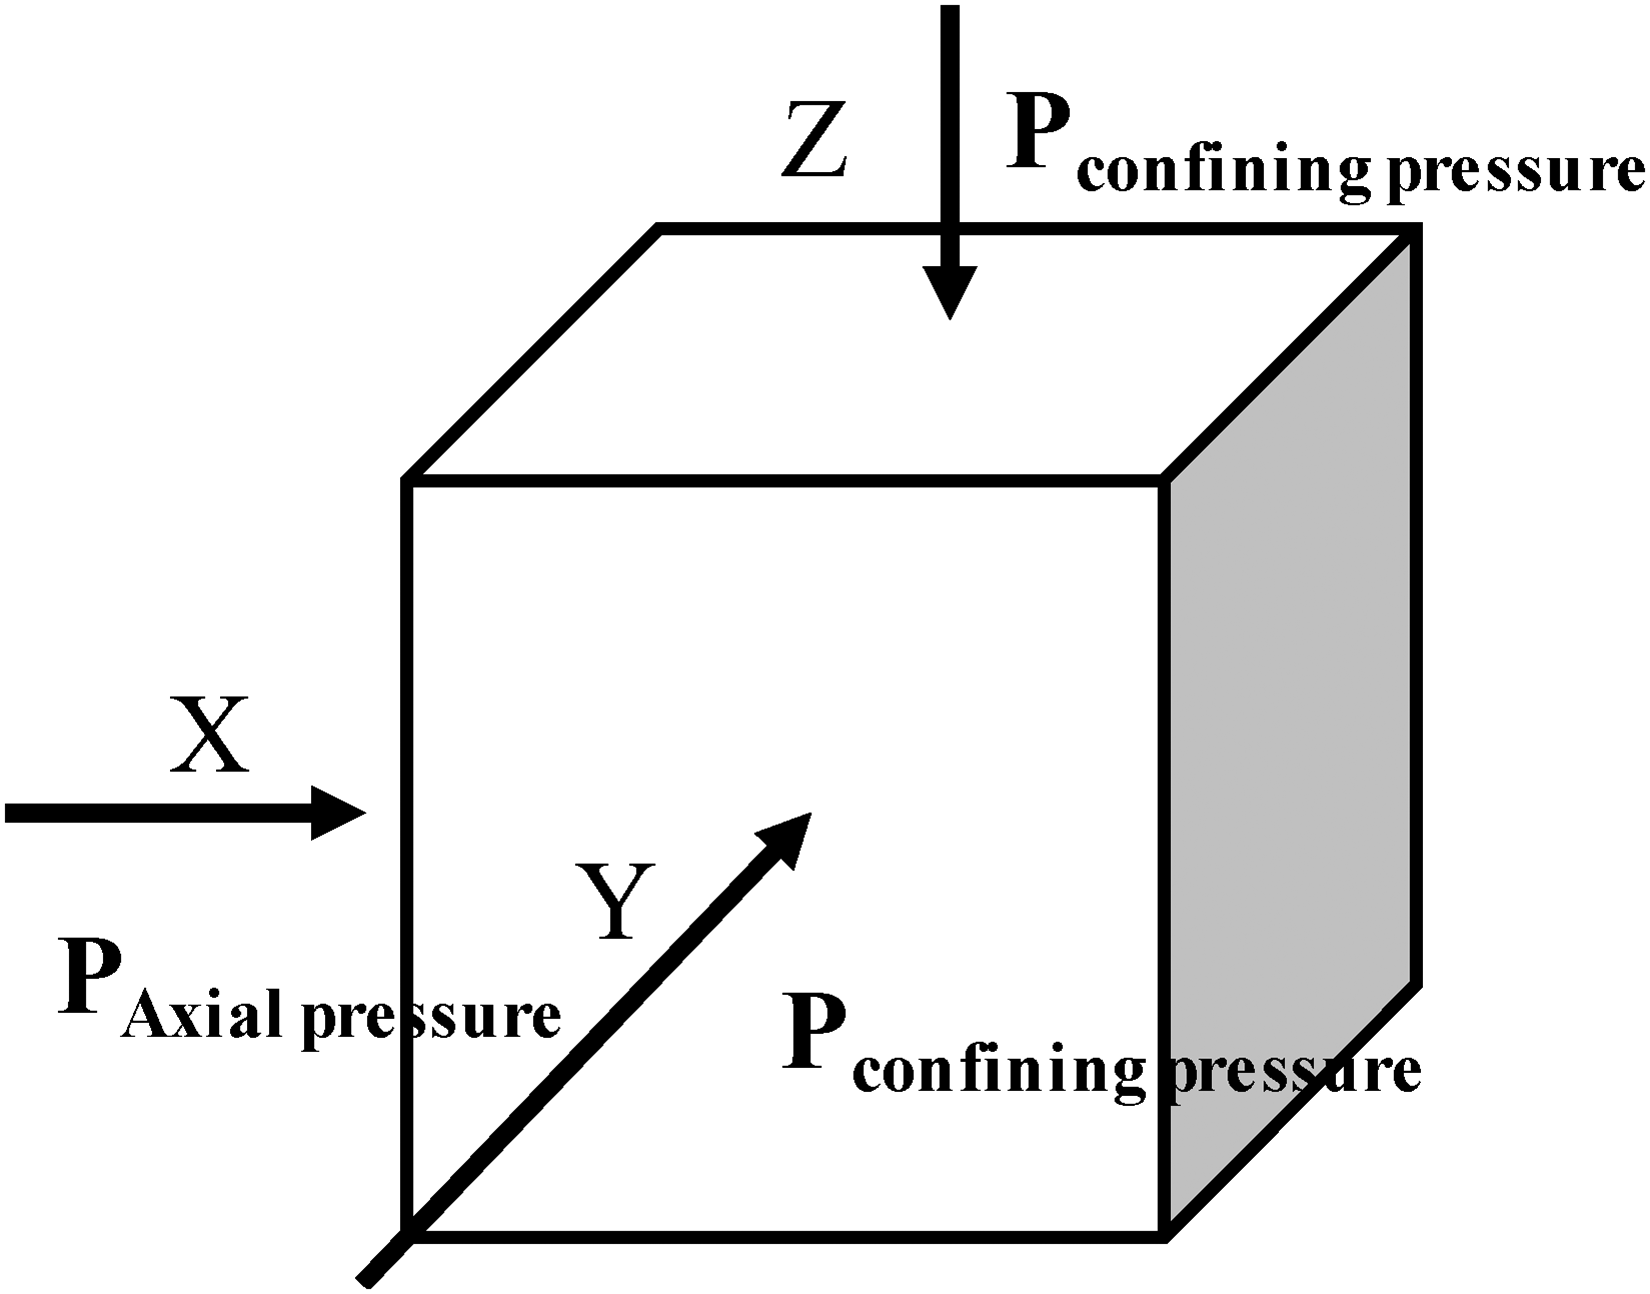
Schematic depiction of testing orientation, axial stress, and confining pressure for square core samples.
Given the formidable tectonic stress prevailing in the study area, defined by a strike-slip stress regime (with the maximum principal stress exceeding the overburden stress and minimum horizontal stress), coupled with the substantial structural compaction influenced by both the regional tectonic stress field and local structural interplay, the heterogeneity stands as conspicuously pronounced. Consequently, a test design was meticulously devised, entailing an axial stress (maximum horizontal stress) surpassing the confining pressure (comprising overburden stress and minimum horizontal stress). Operating at a steadfast temperature of 90°C and confining pressures of 10, 20, 30, and 40 MPa, rock resistivity values (Rt) were meticulously gauged under varying pressures along the X-direction, all the while maintaining the prerequisite of axial stress eclipsing the confining pressure. This methodological approach facilitated the delineation of the correlation between rock resistivity values and variations in horizontal stress disparities.
Analysis of experimental results
Under diverse experimental conditions of ambient pressure, the rock's resistivity is denominated as Ro prior to the imposition of axial pressure, and as Rt post-pressurization. The experimental findings underwent scrutiny to establish a correlation curve illustrating the alteration in rock resistivity in response to changes in horizontal stress disparity (maximum principal stress − minimum principal stress) (Figure 4). The ratio of Rt to Ro adeptly discerns variations in rock resistivity. In order to precisely encapsulate the nexus between resistivity and horizontal stress difference, while factoring in the extent of sample fracturing during experimentation, a subset of exemplary samples was meticulously culled from a collection of 19 samples. These representative samples were chosen to exemplify the consistent relationship. The test curves under various confinement pressure conditions can be expressed mathematically through a regression equation.
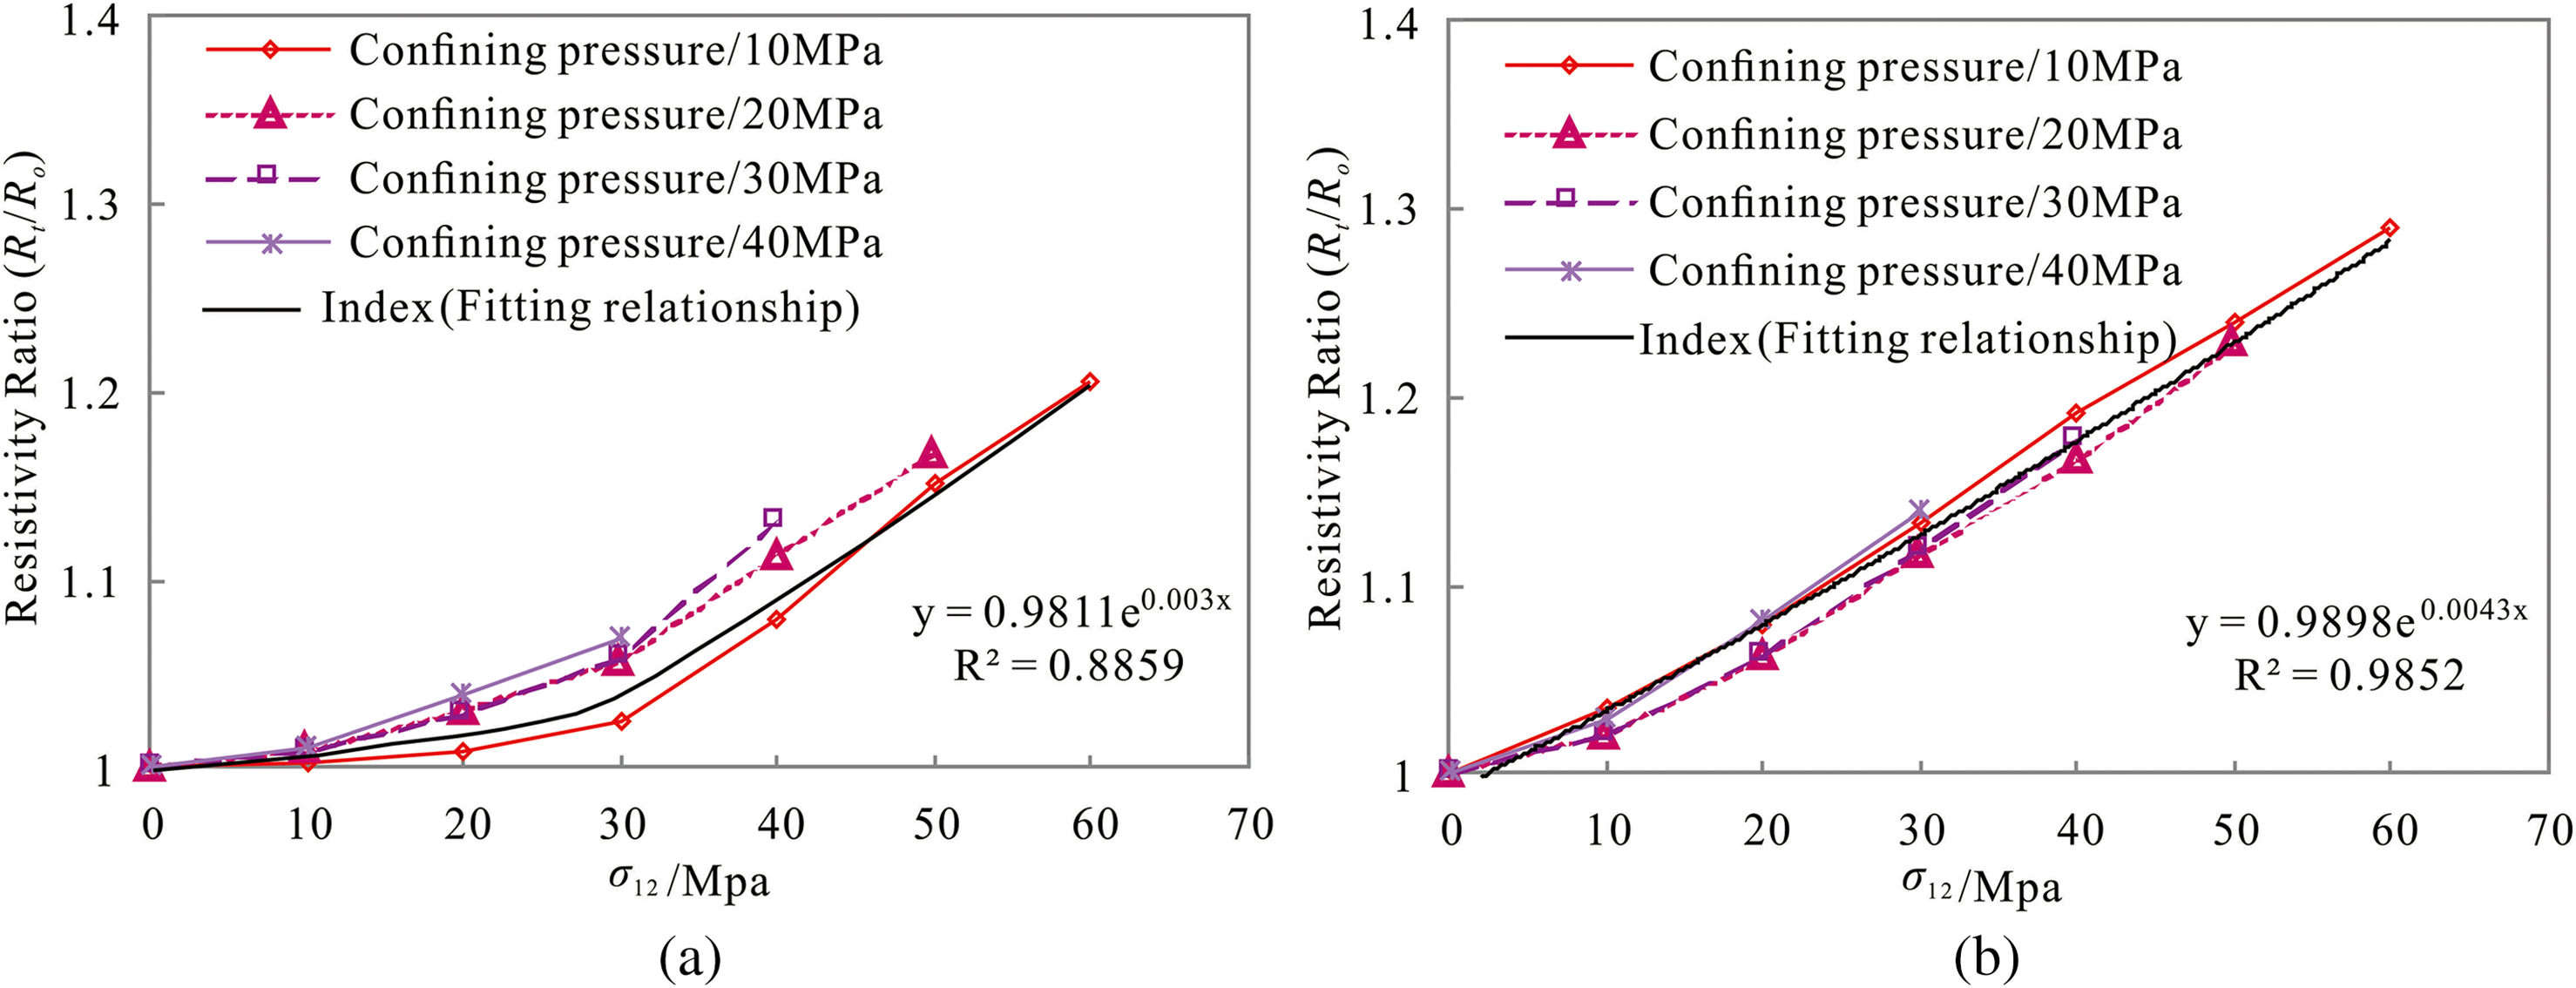
Relationship between horizontal stress difference and resistivity in deep sandstone at different environmental pressures. (a) Sample 1. (b) Sample 3.

where Rt is the resistivity value of the rock after application of axial pressure, Ω.m; Ro is the resistivity value of the rock before application of axial pressure, Ω.m; σ12 is the horizontal stress difference, Mpa; and α, β are regional empirical coefficients.
Improved saturation model
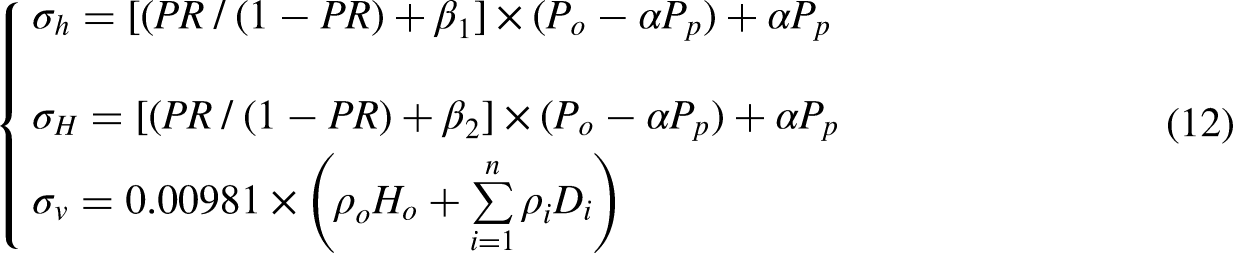
In the initial phase, the evaluation of the maximum and minimum principal stresses encompasses the contemplation of the genuine circumstances characterized by heightened pressures and formidable stresses within the Kucha region's geological formation. Geometric spatial triangular functions are deployed to delineate stress distribution interconnections, augmented by stress experimentation and quantified fracture data, functioning as the benchmark for measurement. Additionally, the Huang RZ σh-σH model (1997) is consulted. The vertical pressure is chiefly appraised through the amalgamation of segmented density log curves.
Moreover, the aforesaid analysis unveils an exponential correspondence between the horizontal stress differential and resistivity. As the horizontal stress differential varies, the ratio of resistivity augmentation experiences a conspicuously substantial alteration, spanning from 1 to 1.4. Conversely, with the ascent of ambient pressure (10, 20, 30, 40 MPa), the augmentation in resistivity becomes relatively minor, as delineated in Figure 3. Subsequently, through a meticulous examination of the correlation characteristics between the actual formation resistivity and horizontal stress difference within the designated sections of the study area, it was discerned that the formation resistivity encounters varying degrees of influence in the tension, transition, and compression sections from uppermost to nethermost, as exemplified in Figure 5. Notably, the compression-torsion strata exhibit the most pronounced susceptibility to the horizontal stress difference.

Relationship between actual formation resistivity and horizontal stress difference.
In contemplation of the scrutiny of the veritable geological conditions, it becomes apparent that the elevation in subsurface stress wields a discernible sway over the resistivity in rocks characterized by identical lithology, physical attributes, pore structure, fluid characteristics, and saturation. To quantify this influence, we introduce the stress resistivity augmentation factor (KI), signifying the ratio of Rt to Rz. In formations subjected to both tensile and compressional stresses, the stress resistivity augmentation factor evolves into a function reliant on the horizontal stress disparity and effective stress, intensifying as these variables ascend.


Taking the logarithms of both sides of the above equation simultaneously gives


The Bashkichik formation reservoir in the Ks region can be stratified into three distinct sections, proceeding from top to bottom: the tensile stratum, the transitional stratum, and the compression-torsion stratum. The formation's resistivity is subject to the influence of both tectonic stress and vertical stress, culminating in an elevation of resistivity. It is noteworthy to emphasize that within the target section, the horizontal stress differential exerts a more conspicuous impact on the formation's resistivity compared to the effective stress. Through the application of this model for stress correction, a relatively precise in-situ formation resistivity value can be ascertained.
Finally, substituting equation (19) into equation (3), the expression for rock water saturation (Sg) can be obtained as:
Impact assessment
To assess the efficiency and appropriateness of the gas saturation interpretation model for deep clastic reservoirs subjected to intense extrusion stress conditions, the KS5-1 well is chosen as the reference point in this study. By amalgamating geological data and core piezometric data, we evaluate the gas saturation and its influence on the deep clastic reservoir within the second lithological interval of the Bashkichik formation in the KS5-1 well. Three methodologies are employed: Archie's formula, the stress-corrected variable cementation index saturation model, and the resistivity-corrected saturation model.
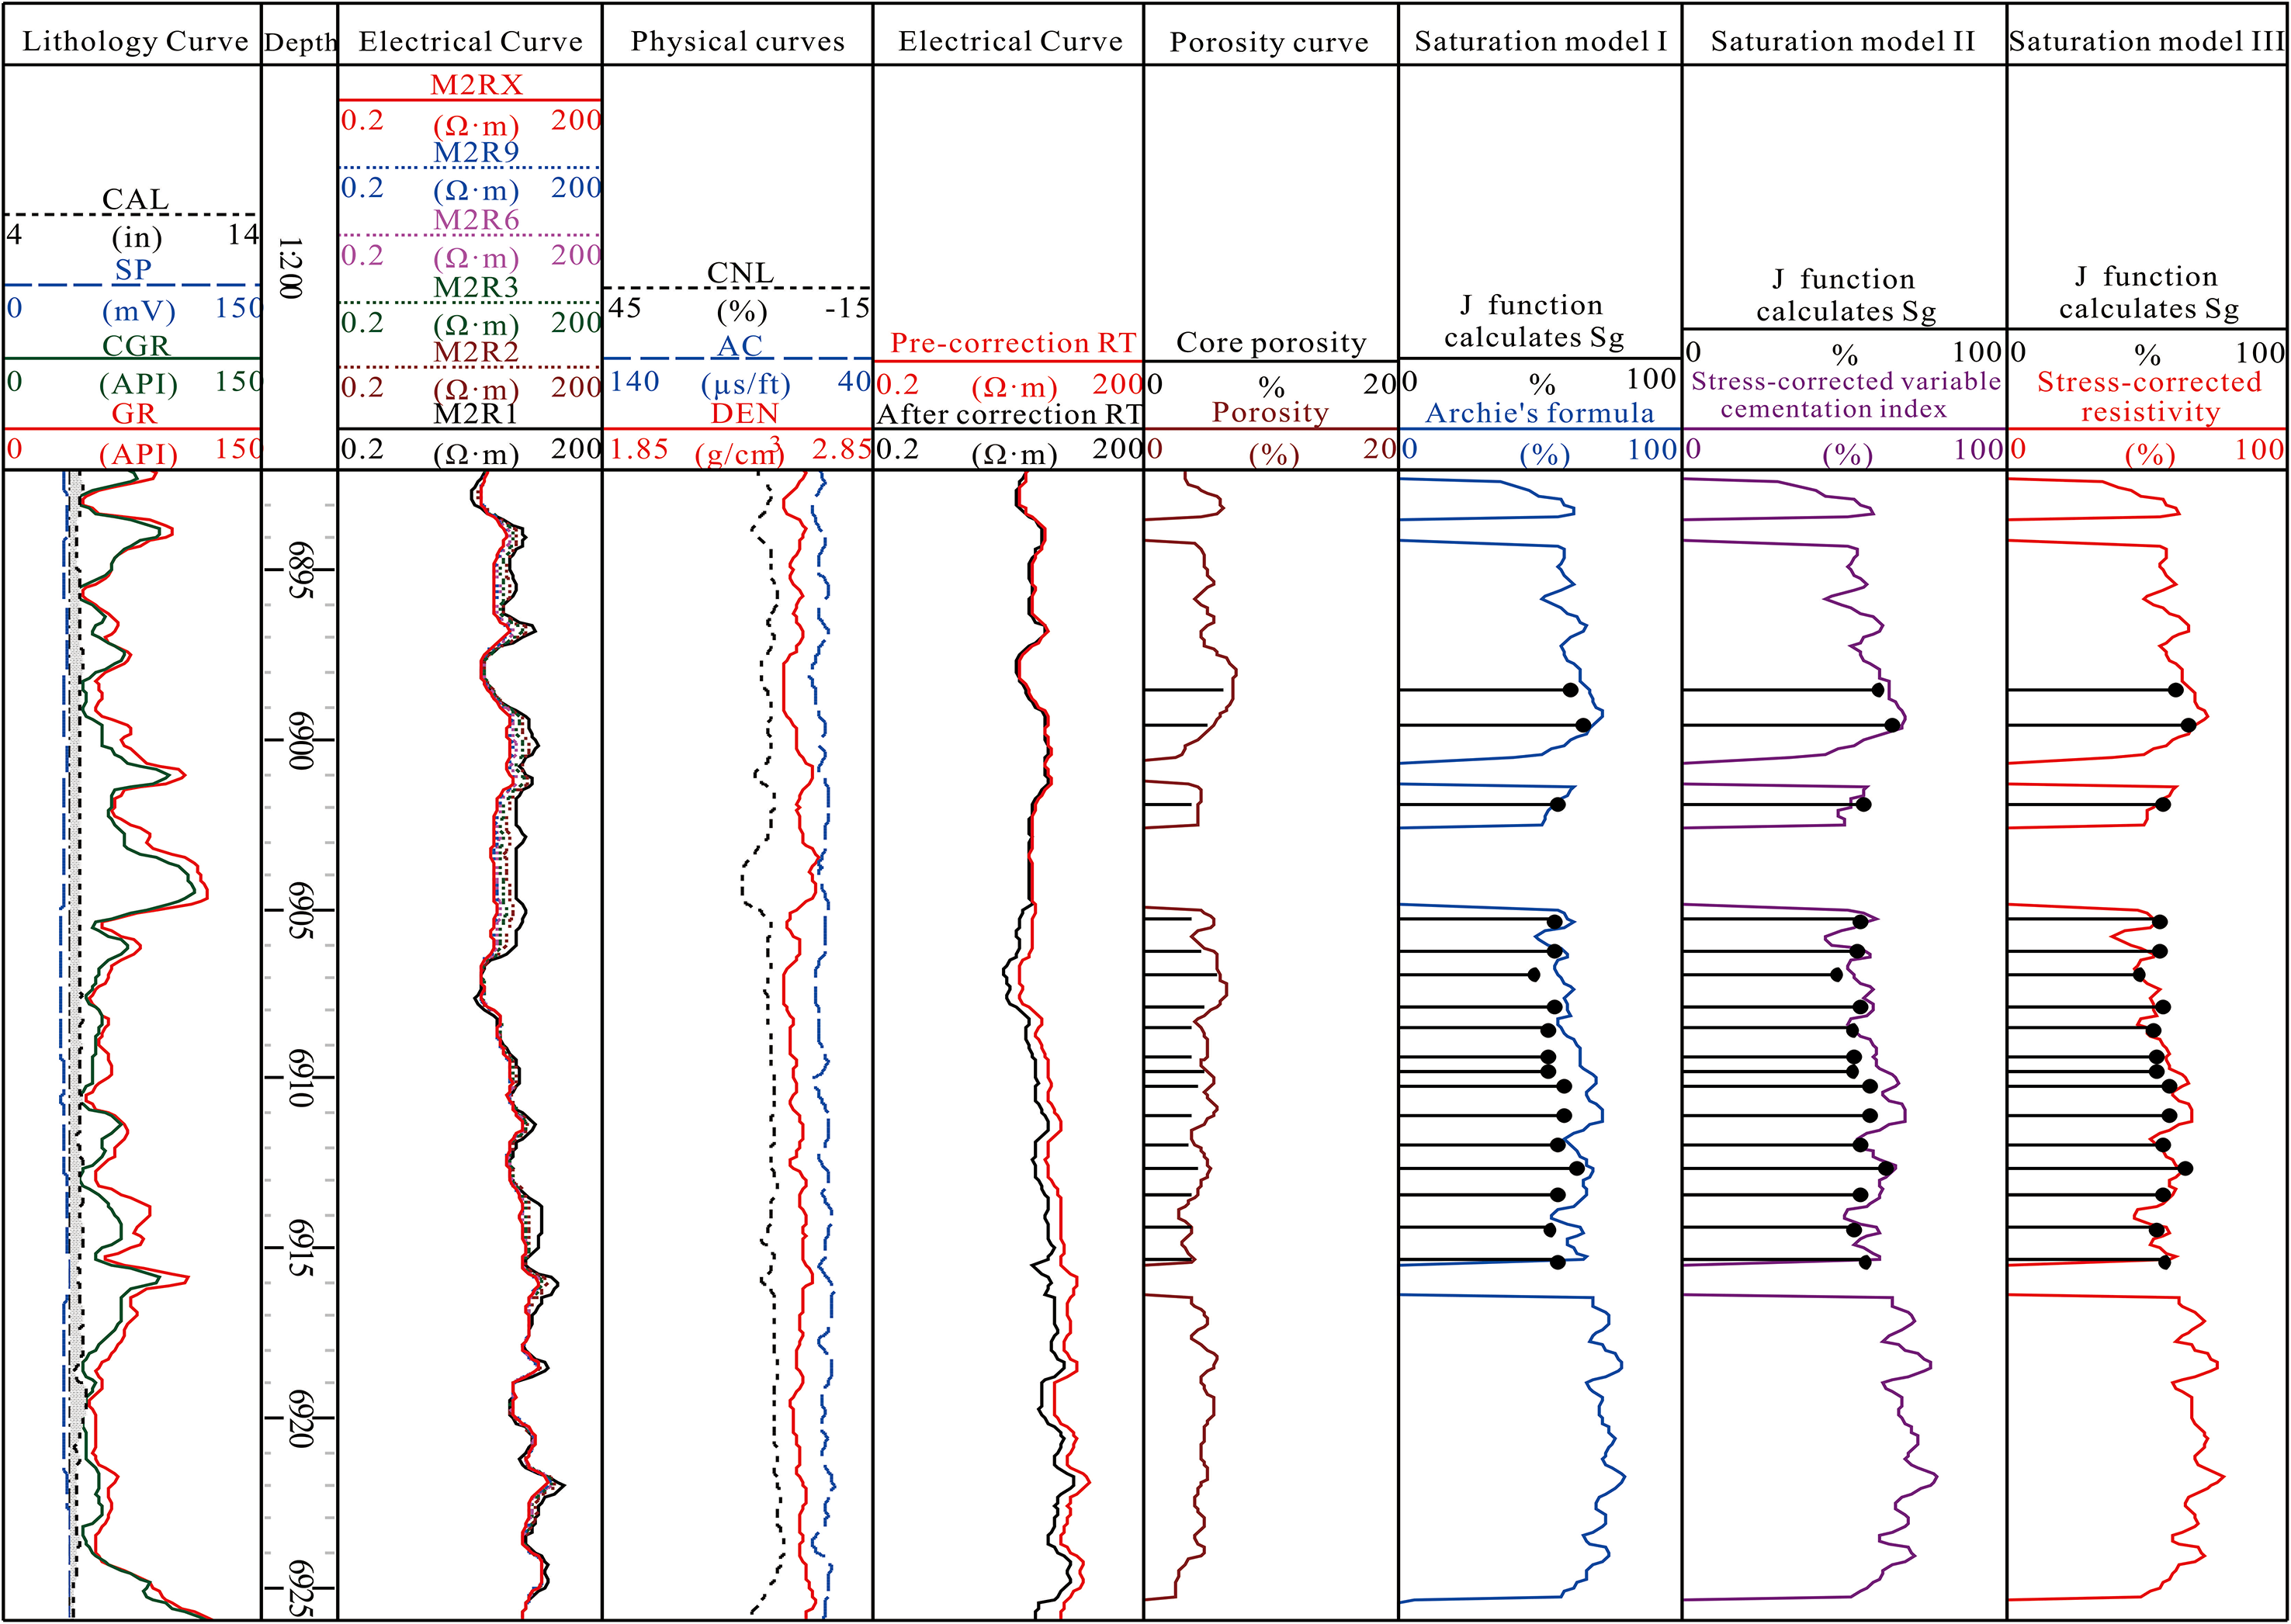
By integrating the comprehensive diagram illustrating various extrusion stress characteristics and performing a comparative analysis using the stress neutralization zone division in the KS5-1 well, it is evident that the interval ranging from 6895 to 6925 m in the KS5-1 well corresponds to the lower segment of the transition section. This section displays an elevated resistivity curve in comparison to the upper resistivity baseline. Figure 6 depicts the interpreted outcomes of gas saturation logging in deep clastic reservoirs for the KS5-1 well. It includes nine curve paths representing different parameters. The first path comprises the diameter curve along with lithology-related curves: CAL, SP (natural potential), CGR (uranium gamma), and GR (natural gamma). The second path represents the depth channel. The third path consists of the electrical curve channel, which incorporates seven array induction resistivity logging curves at different probing depths (10, 20, 30, 60, 90, and 120 inches). The fourth path features the physical curve channel, encompassing three curves: CNL (compensated neutron), AC (acoustic time difference), and DEN (compensated density). The fifth path pertains to the resistivity correction channel, which includes pre- and post-correction deep and shallow resistivity values. The sixth path corresponds to the porosity curve for comparison with core porosity values. Lastly, the seventh, eighth, and ninth paths present gas saturation values obtained using Archie's formula, stress-corrected variable cementation index, and resistivity correction methods, respectively. These values are compared to the gas saturation values calculated using the J function.
Comparison of resistivity correction and core saturation of KS5-1 well.
Derived from Figure 7, a noteworthy correlation becomes manifest between the gas saturation determined through resistivity correction and the gas saturation computed via the J function, displaying an average relative error of 5.3%. The relative errors for saturation prior to correction, gas saturation predicated on the stress-corrected variable cementation index, and saturation evaluation utilizing the J function amount to 13.4% and 8.4%, respectively. These discoveries underscore the viability and practicability of employing the stress-corrected resistivity model for gas saturation calculations.
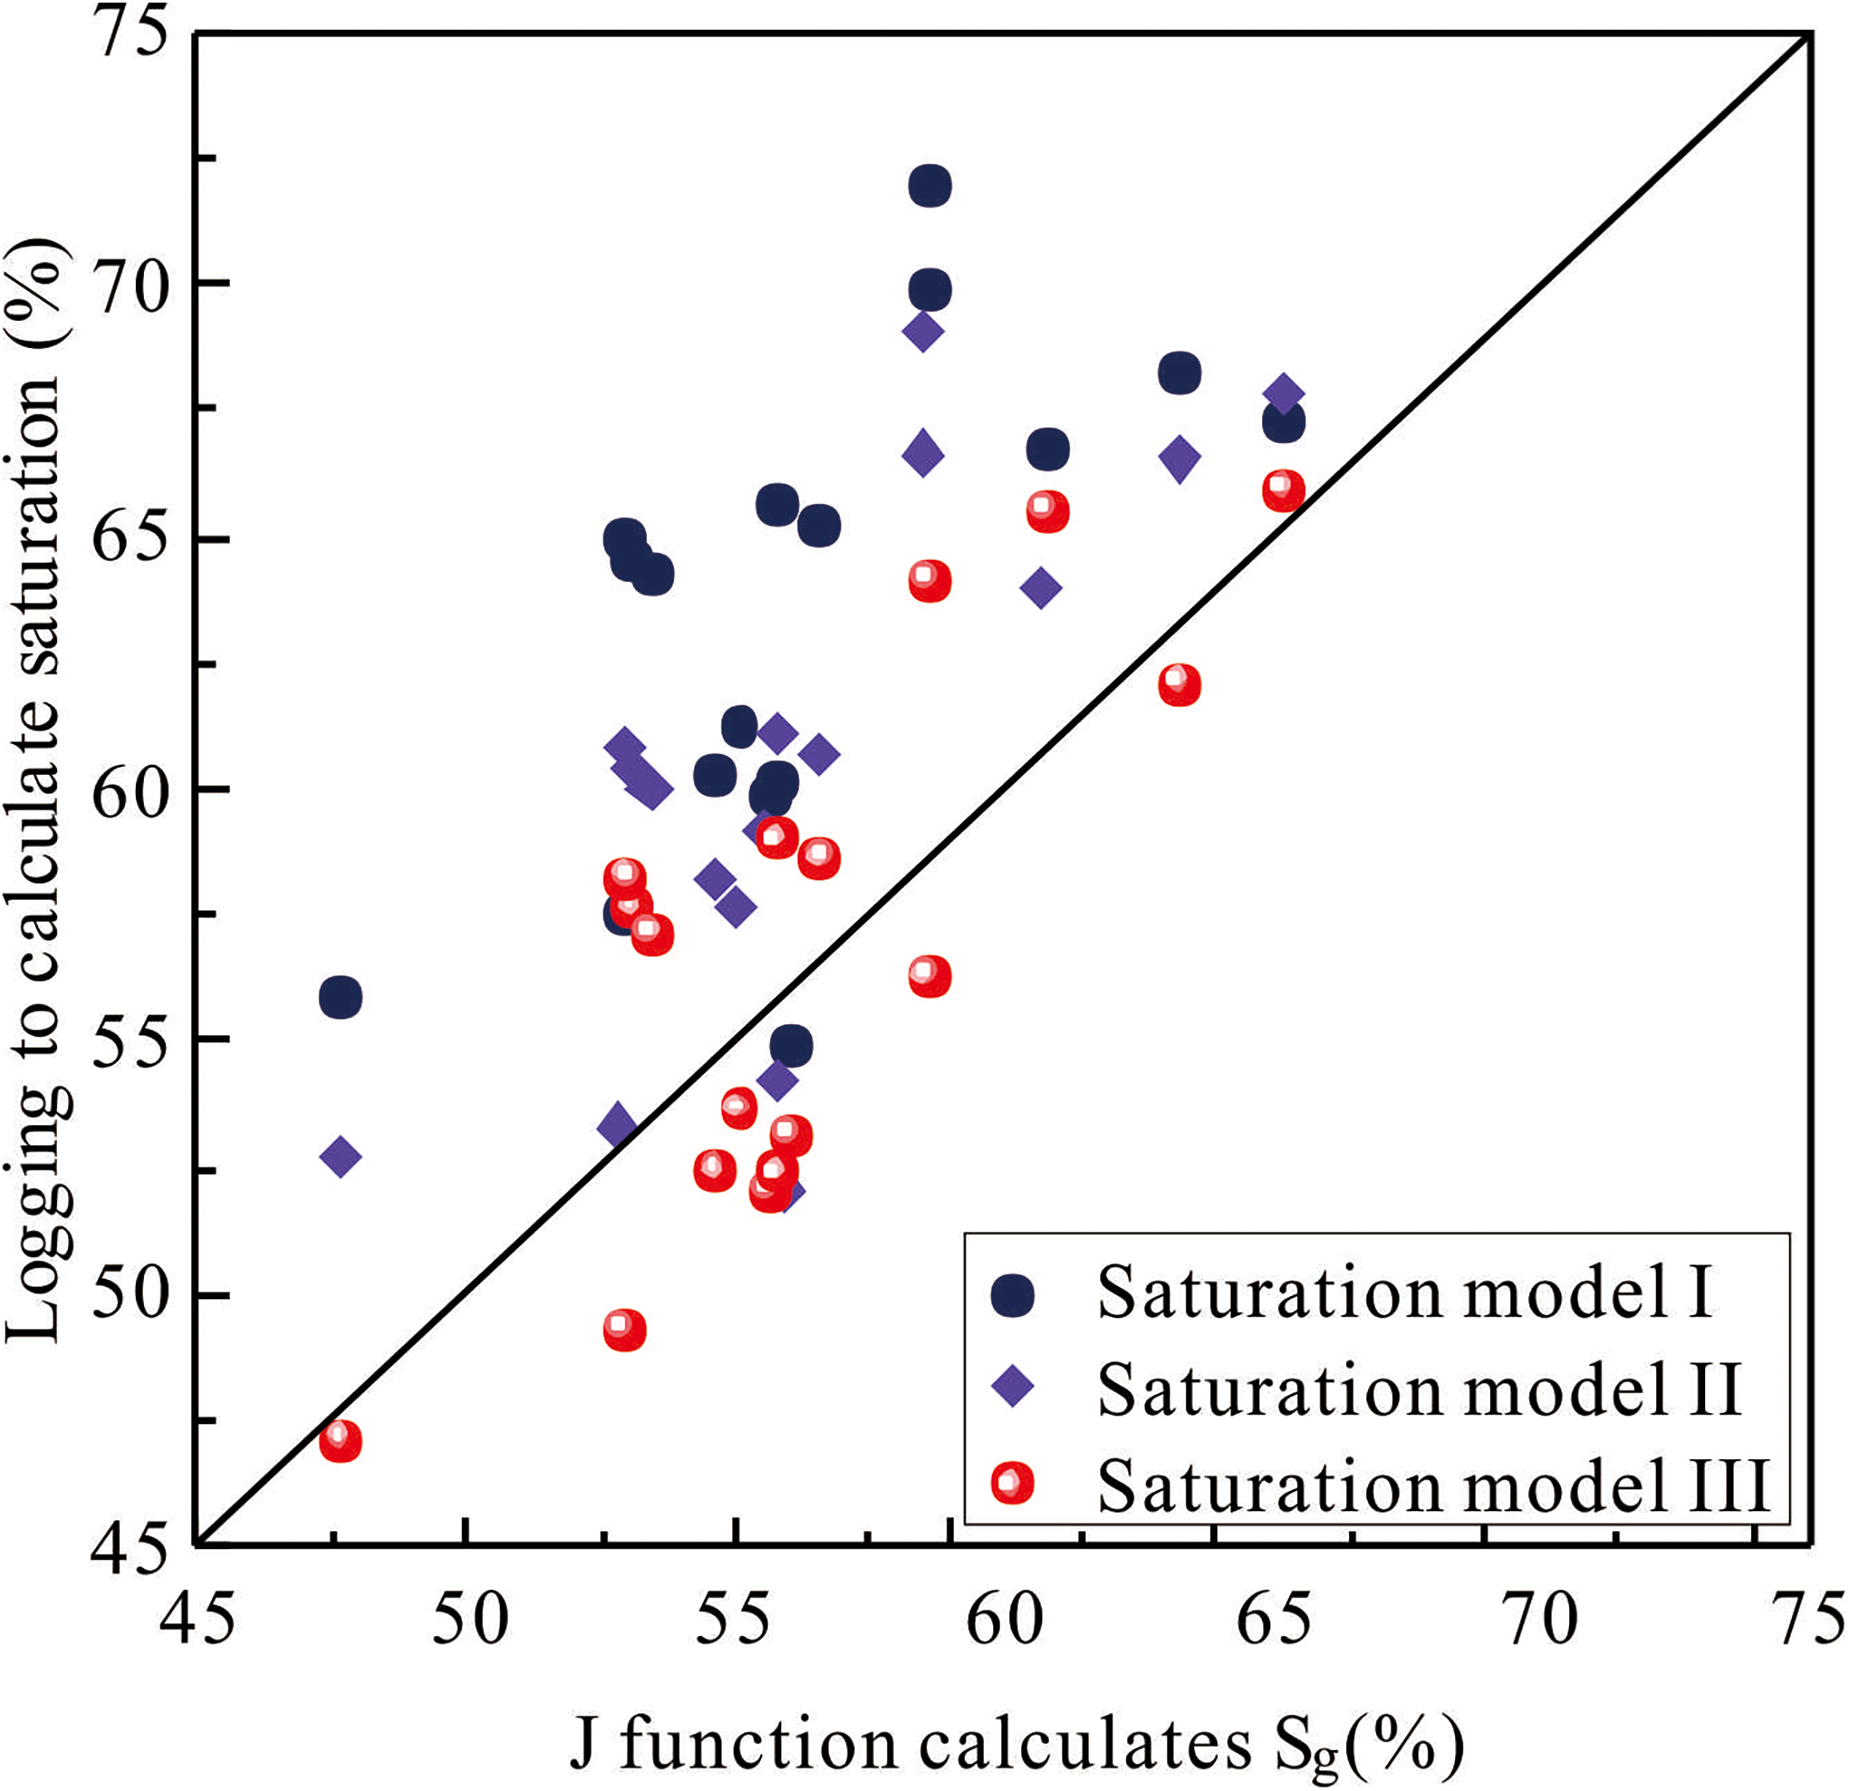
Comparison of logging-based saturation and the saturation calculated from the core J-function.
Discussion and future work
The suggested methodology employs sonic logging data to ascertain rock mechanical parameters. Nonetheless, the precision of this method may be undermined in scenarios where drilling mud intrusion and borehole conditions substantially influence sonic logging measurements. To surmount this constraint, a pioneering model is introduced in this study, meticulously crafted for reservoirs distinguished by low porosity, low permeability, compacted sandstone, or deep clastic rock formations. Such reservoirs are especially vulnerable to potent extrusion stress, rendering them less susceptible to mud infiltration intrusion.
Moving forward, research pursuits in the realm of gauging gas saturation in deep clastic reservoirs may be channeled toward the subsequent avenues and themes:
Delving into the realm of data fusion methodologies, amalgamating an array of logging data categories and sophisticated data processing algorithms, with the aim of elevating the precision and dependability of gas saturation evaluation. Deep clastic reservoirs characterized by significant mud content display a wide range of mud compositions and pore structures. Enhancing the precision of gas saturation calculations hinges on the proficient utilization of the effective medium-symmetric conductivity model. The appropriateness of diverse gas saturation interpretation models varies and is intricately interwoven with a multitude of factors, encompassing the mineral composition of the subterranean reservoir, the microscopic particle-to-particle interconnection mode, the internal pore-microfracture structure of the rock matrix, and the character of the fluid phase. The gas saturation model introduced in this study offers a novel and distinct application. In forthcoming investigations, it is imperative to assimilate the inherent conductivity characteristics of mudstone. This objective can be achieved by fashioning a bespoke effective medium symmetric conductivity model tailored expressly for elevated mudstone content, as demonstrated by the work of Song and Tang (2008). Subsequently, a comparative assessment can be made with the Sg model, as derived from stress-corrected resistivity. Such analyses shall markedly propel the evolution of methodologies for gas saturation evaluation within deep clastic reservoirs.
These avenues of research are directed towards augmenting the comprehension and prognostication of gas saturation in deep clastic reservoirs, with the ultimate goal of elevating the efficacy of reservoir characterization and production optimization strategies.
Conclusion
This paper amalgamates Archie's equation, the stress-corrected variable cementation index saturation equation, and the resistivity-corrected saturation model to evaluate gas saturation within deep clastic reservoirs, considering electrical and acoustic viewpoints. The outcomes of this study establish the foundation for fluid identification within deep clastic gas reservoirs.
Through the execution of resistivity experiments employing the exponential function of horizontal stress difference, the derivation of theoretical equations, and the execution of numerical simulations, the analysis elucidates that the reservoir within the study vicinity is subject to the exponential variation of resistivity across the tension section, the transition section, and the compression-torsion section to varying degrees. Consequently, a stress-corrected resistivity-centric Sg model is formulated.
Through the execution of a comparative examination involving core capillary pressure data and three saturation models, it becomes evident that the Sg model founded upon stress-corrected resistivity displays a diminished susceptibility to the impact of the extrusion stress and gravitational compaction. It exhibits heightened congruity with core mercury compression in the calculation of gas saturation, leading to a reduction in the mean relative error from 13.4% to 5.3%. Subsequent processing and scrutiny of representative wells corroborate that gas saturation parameters calculated via stress-corrected resistivity are more precise and pertinent for estimating Sg within the study locale.
Footnotes
Acknowledgements
Sincere gratitude should go to professor Haining Zhang who helped me in the revision of my paper. We are grateful to editor in chief professor Yuzhuang Sun, associate editor Jian Cao and reviewers for their effort reviewing our paper and their positive suggestion.
Declaration of conflicting interests
The authors declared no potential conflicts of interest with respect to the research, authorship, and/or publication of this article.
Funding
The authors disclosed receipt of the following financial support for the research, authorship, and/or publication of this article: Financial support of this study by the National Major Science and Technology Project (No. 2011ZX05046-03).