
Abstract
A stable power system is a desirable state for the optimal performance and delivery of electricity to the end-users. This study evaluates the effectiveness of grid contingency support devices in power system stability enhancement. The new voltage stability pointer (NVSP) was employed to optimally infer the flexible alternating current transmission systems devices through N − 1 contingency ranking. In this research, the static synchronous compensator (STATCOM) was considered as a grid support device. The effectiveness of this technique was validated in R2018a MATLAB with the IEEE 30-bus system using different combinable contingency cases to ascertain the critical lines and vulnerable buses to outages. Based on the results obtained through the NVSP, buses 30, 26, and 29 were cited as STATCOM candidate buses for overall optimal grid performance. The results obtained from the simulation revealed that the total real power loss was reduced by 90.21%. Similarly, the voltage magnitude of the buses was significantly improved to a minimum of 1.00 p.u. after placement of STATCOMs. Further investigation on single STATCOM placement in the IEEE 30-bus system revealed that the highest level of voltage improvement, minimum level of voltage deviation and maximum active power loss reduction was achieved when the STATCOM was placed at bus 30. The overall assessment of the proposed technique yielded better results compared with other methods on the same test system.
Introduction
Power stability support systems are of paramount importance in ensuring the resilience and efficiency of power systems. By addressing voltage instability and minimizing power losses during contingencies, the quality of power supply is enhanced, the stability of the grid is maintained, and the energy transmission is optimized. The quest for such a research is imperative for meeting the growing demands for electricity while fostering sustainable and resilient energy infrastructures going forward. In particular, strategies concerning effective management of contingencies are noteworthy because they avert the possible negative effect of component failure in power grid, which we study herein.
The drive toward maintaining a reliable power system has become a matter of utmost significance in the world today, because, electricity plays a crucial role in our daily and economic activities (Badrudeen et al., 2023). The inadequate power supply to meet the daily power demand and the complexity of the power network has led to the occurrence of contingencies such as abrupt load changes, transmission line failure, and malfunctioning power equipment which could pose a notable risk to the grid stability (Patel et al., 2022). Contingency analysis is an essential tool for ensuring the reliability and security of power networks in the presence of load perturbation (Badrudeen et al., 2022b). Thus, identification and management of potential contingencies have become critical for preventing power outages and minimizing their impact (Tiwari et al., 2022). Conversely, inadequate contingency planning could result in prolonged power outages which could have severe economic and social consequences (Wang and Zhai, 2022). Therefore, enhancing power system stability through effective grid contingency support has emerged as a panacea to these uncertainties. It is noteworthy to mention that the conventional methods for power system stability enhancement, such as the use of synchronous condensers, tap changing transformers, etc. have limitations in handling contingencies efficiently (Marrazai et al., 2018).
Aside that, there has been a handful of qualitative research that proposes solutions to various challenges associated with power systems such as stability problems, contingencies, and optimization of power flow for efficient and sustainable energy delivery. Such solutions include integration of renewable energy scheme (Badrudeen et al., 2024; Nwulu and Xia, 2017), optimum siting of reactive power compensative devices (Badrudeen et al., 2022a) amongst others. However, limitations of renewable energy injection for grid stability are the inherent variability of renewable sources leading to challenges in maintaining a balance between electricity supply and demand. In addition, sudden changes in weather conditions can result in fluctuations in renewable generation, requiring advanced energy storage solutions or backup systems to ensure a consistent power supply (Gbadegesin et al., 2023).
Therefore, contingency analysis is considered as one of the efficient ways of managing uncertainties in the power grid (Al-Shaalan 2020) and several strategies have been proposed by various researchers. For example, Brown and Moreno-Centeno (2023) proposed a heuristic approach that utilizes logistic regression and guided undersampling strategies to effectively manage the postcontingency violation through transmission switching pattern. The proposed method was implemented on a real-world power system for the identification of optimum transmission switching effects. Similarly, Weigert-Dalagnol et al. (2023) proposed a critical eigenvalue trajectory approach for contingency ranking in power network through a linear extrapolation eigenvalue of the Jacobian matrix. From the assessment, two equilibrium set points were determined for each contingency case and their corresponding critical eigenvalue. The results from the test system show that the technique was accurate in determining critical ranking of the power network. Likewise, Gacitua et al. (2023) investigated the impact of energy storage systems in planning of transmission expansion. Special consideration was given to the capability of the storage system to offer N − 1 contingency support during overloading. The proposed technique was designed to address the transmission expansion problem via a computational tool. In the same manner, Hussian et al. (2021) presented a line stability index through contingency ranking and voltage stability evaluation to voltage collapse. The aim was to prevent blackout as a result of voltage collapse resulting from contingencies. Similarly, Salim et al. (2023) reported various contingency scenarios and their severity in power stability. It was revealed that the clearing time of each contingency condition varies.
In recent times, there has been growing research on meta-heuristic-based optimization algorithms for the optimum siting of flexible alternating current transmission systems (FACTS) devices for an enhanced power network. For example, Ahmed et al. (2020) proposed a genetic algorithm-based optimization strategy for the placement of STATCOM in the power grid for the compensation of reactive power deficit occasioned by transmission line overloading. A comparative assessment was carried out on IEEE 30-bus system in order to ascertain the level of grid improvement as a result of STATCOM application. Similarly, Rana and Srivastava (2016) proposed hybridization of particle swarm optimization and fuzzy logic technique for the optimum siting and sizing of STATCOM for minimization of voltage deviation in power grid. In the same vein, Ladumor et al. (2017) proposed gray wolf optimization for the optimum settings of STATCOM and SVC. The results from the simulation were validated with IEEE 30 test system showing STATCOM possess a relatively better result with the proposed technique. Research by Liu et al. (2020) formulated a multi-objective optimization algorithm for STATCOM allocation with a view to mitigating voltage sags in power systems. The voltage sag performance was evaluated analytically using X-index. In order to solve issues related to contingencies, Wang and Zhai (2022) proposed a new optimization technique for FACTS device settings in power system to prevent possible disturbances that may be posed by contingencies. The effectiveness of the proposed technique was compared with the numerical simulation on IEEE 9-bus test data.
From available literature, it was discovered that the assessment of voltage stability is an essential ritual practice in the performance analysis of power systems, basically, to prevent the network against unprecedented uncertainties that may lead to voltage collapse. There are quite a several indices that are currently available for the prediction of voltage collapse resulting from contingency in a power system. However, there is a need to improve on the existing techniques, especially, in the aspect of effectiveness of these techniques in the reduction of active power loss. Therefore, this research aims to investigate the potential of FACTS in providing grid contingency support and stabilizing the power system during load dynamic events. The study employed the new voltage stability pointer (NVSP) to identify the optimal placement of FACTS devices through the contingency ranking, and evaluate the effectiveness of different contingency support strategy in enhancing power system stability. This research considered the use of static synchronous compensator (STATCOM) as a contingency supportive device in the presence of load growth and perturbation. The performance metrics for the evaluation are the voltage profile and line power loss with a view to mitigating the effect of contingency and their impact in power systems.
In summary, the benefits of utilizing contingency assessment to offer grid support in this study are to (a) identify potential issues that could affect the stability of the power system, such as line outages or sudden changes in load, (b) assess the impact of line fault or outage on voltage levels, and (c) provide insights into the dynamic behavior of the power system for the selection of optimum FACTS locations that offer the greatest operational flexibility in responding to contingencies.
The major contributions of this research include (a) assessment of first-order contingency events due to load perturbation resulting from high energy demand, (b) evaluation of critical lines ranking in the power grid as a result of load growth, (c) provision of valuable insight into the optimum siting of STATCOM as a contingency support system within the power grid, utilizing the novel analytical NVSP approach, thereby, improving the stability of the grid, and (d) offering a practical analysis of integrating STATCOM as an important grid support device in the management of high-energy demand.
Methodology
Optimal location of grid contingency support through NVSP
In this research, the NVSP proposed in Badrudeen et al. (2022b) was employed to suggest the optimal location of STATCOM placement through contingency ranking analysis. This method was employed as the optimization technique for the placement of the contingency support devices for voltage profile improvement and transmission line losses minimization in the power grid. The analytical line stability index, NVSP, was formulated from two-bus-reduced power network grid as shown in Figure 1.
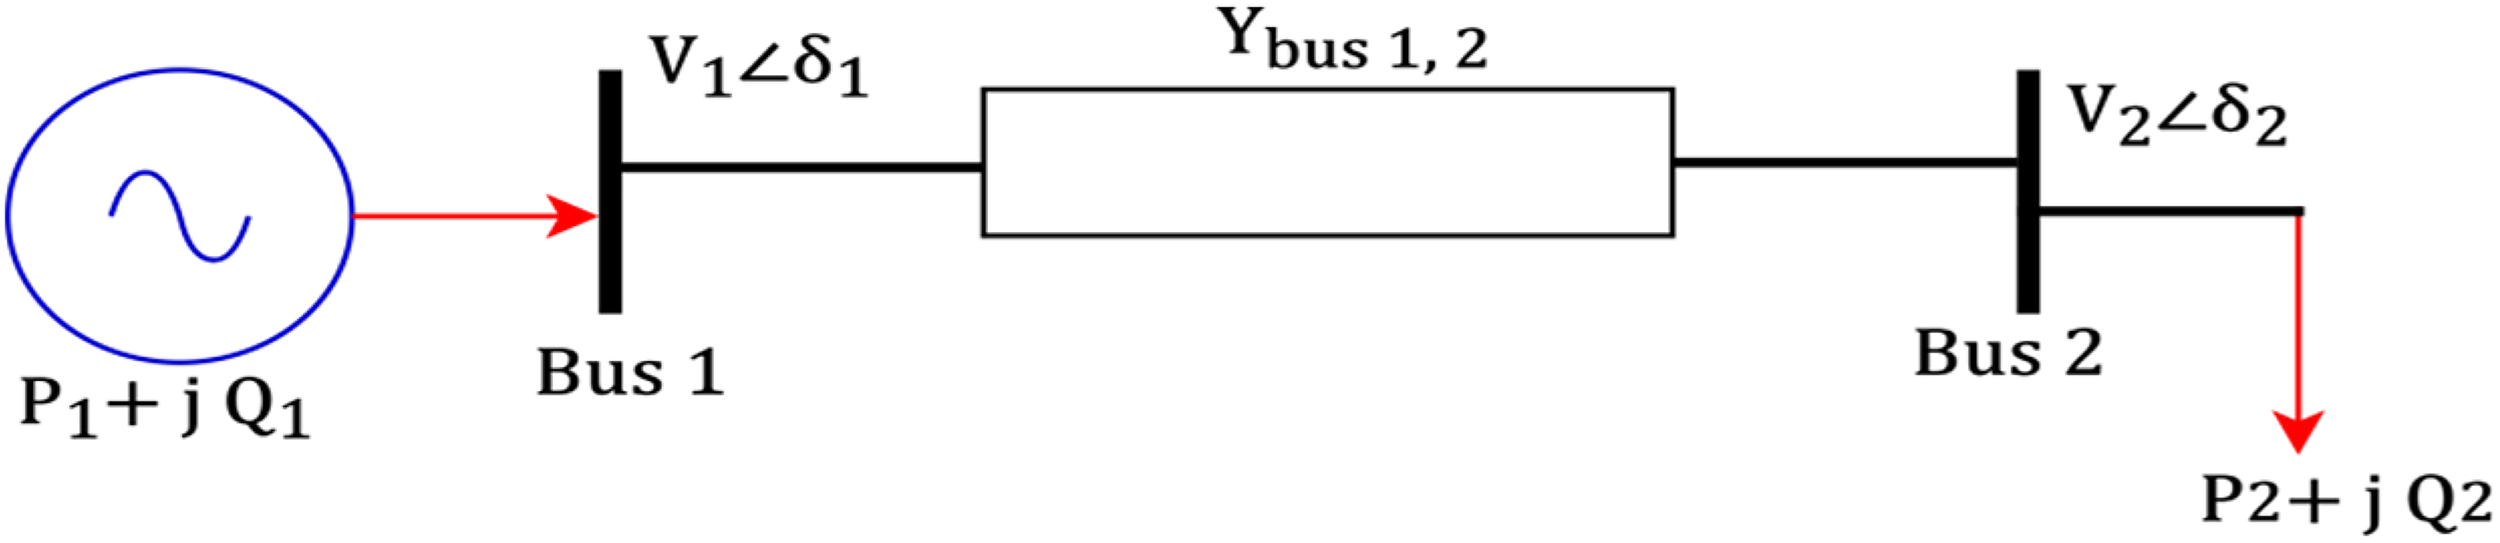
A reduced one-line diagram.
The current (I) from the PV bus 1 can be calculated as:


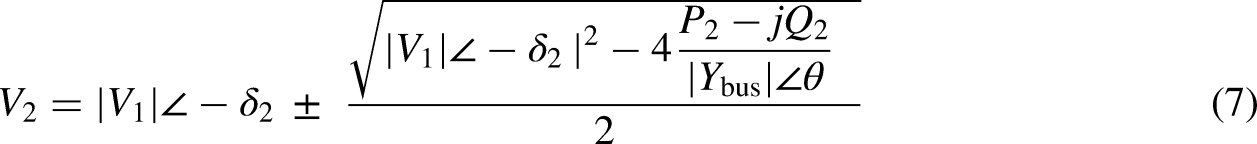


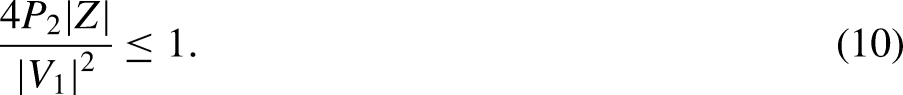
Similarly, the imaginary part of equation (8) will subsequently reduce to the line stability index,

The NVSP is a transmission line stability factor that its value needs to be between zero (0) and one (1) to depict the closeness of the transmission lines to failure or safety. The transmission line becomes stable if the NVSP is close to zero and become unstable as it approaches one. The transmission line becomes critical to failure when the NVSP is either one or above one.
The contingency ranking process begins with the modeling of the power network using line data and bus data. Subsequently, the power flow solution is computed for this modeled network, and notable information is extracted from the power flow solution for the numerical computation of the network vulnerability and security performance via the computational tool-NVSP. The network security status is then assessed by analyzing the NVSP indexing value in relation to voltage instability. To further enhance the evaluation, the voltage margin is assessed based on different combinable contingency scenarios. In cases where bus and line weaknesses are identified, corrective measures are implemented through the activation of compensative devices at weak lines and buses. Following these corrective actions, a reevaluation of the stability status for each line and bus is conducted. The system then categorizes lines as stable or quasi-stable based on the indexing value, designating them as below one or above one, respectively. This comprehensive sequence ensures a thorough analysis and optimization of the power network's stability and security. The flow chart representation is depicted in Figure 2.
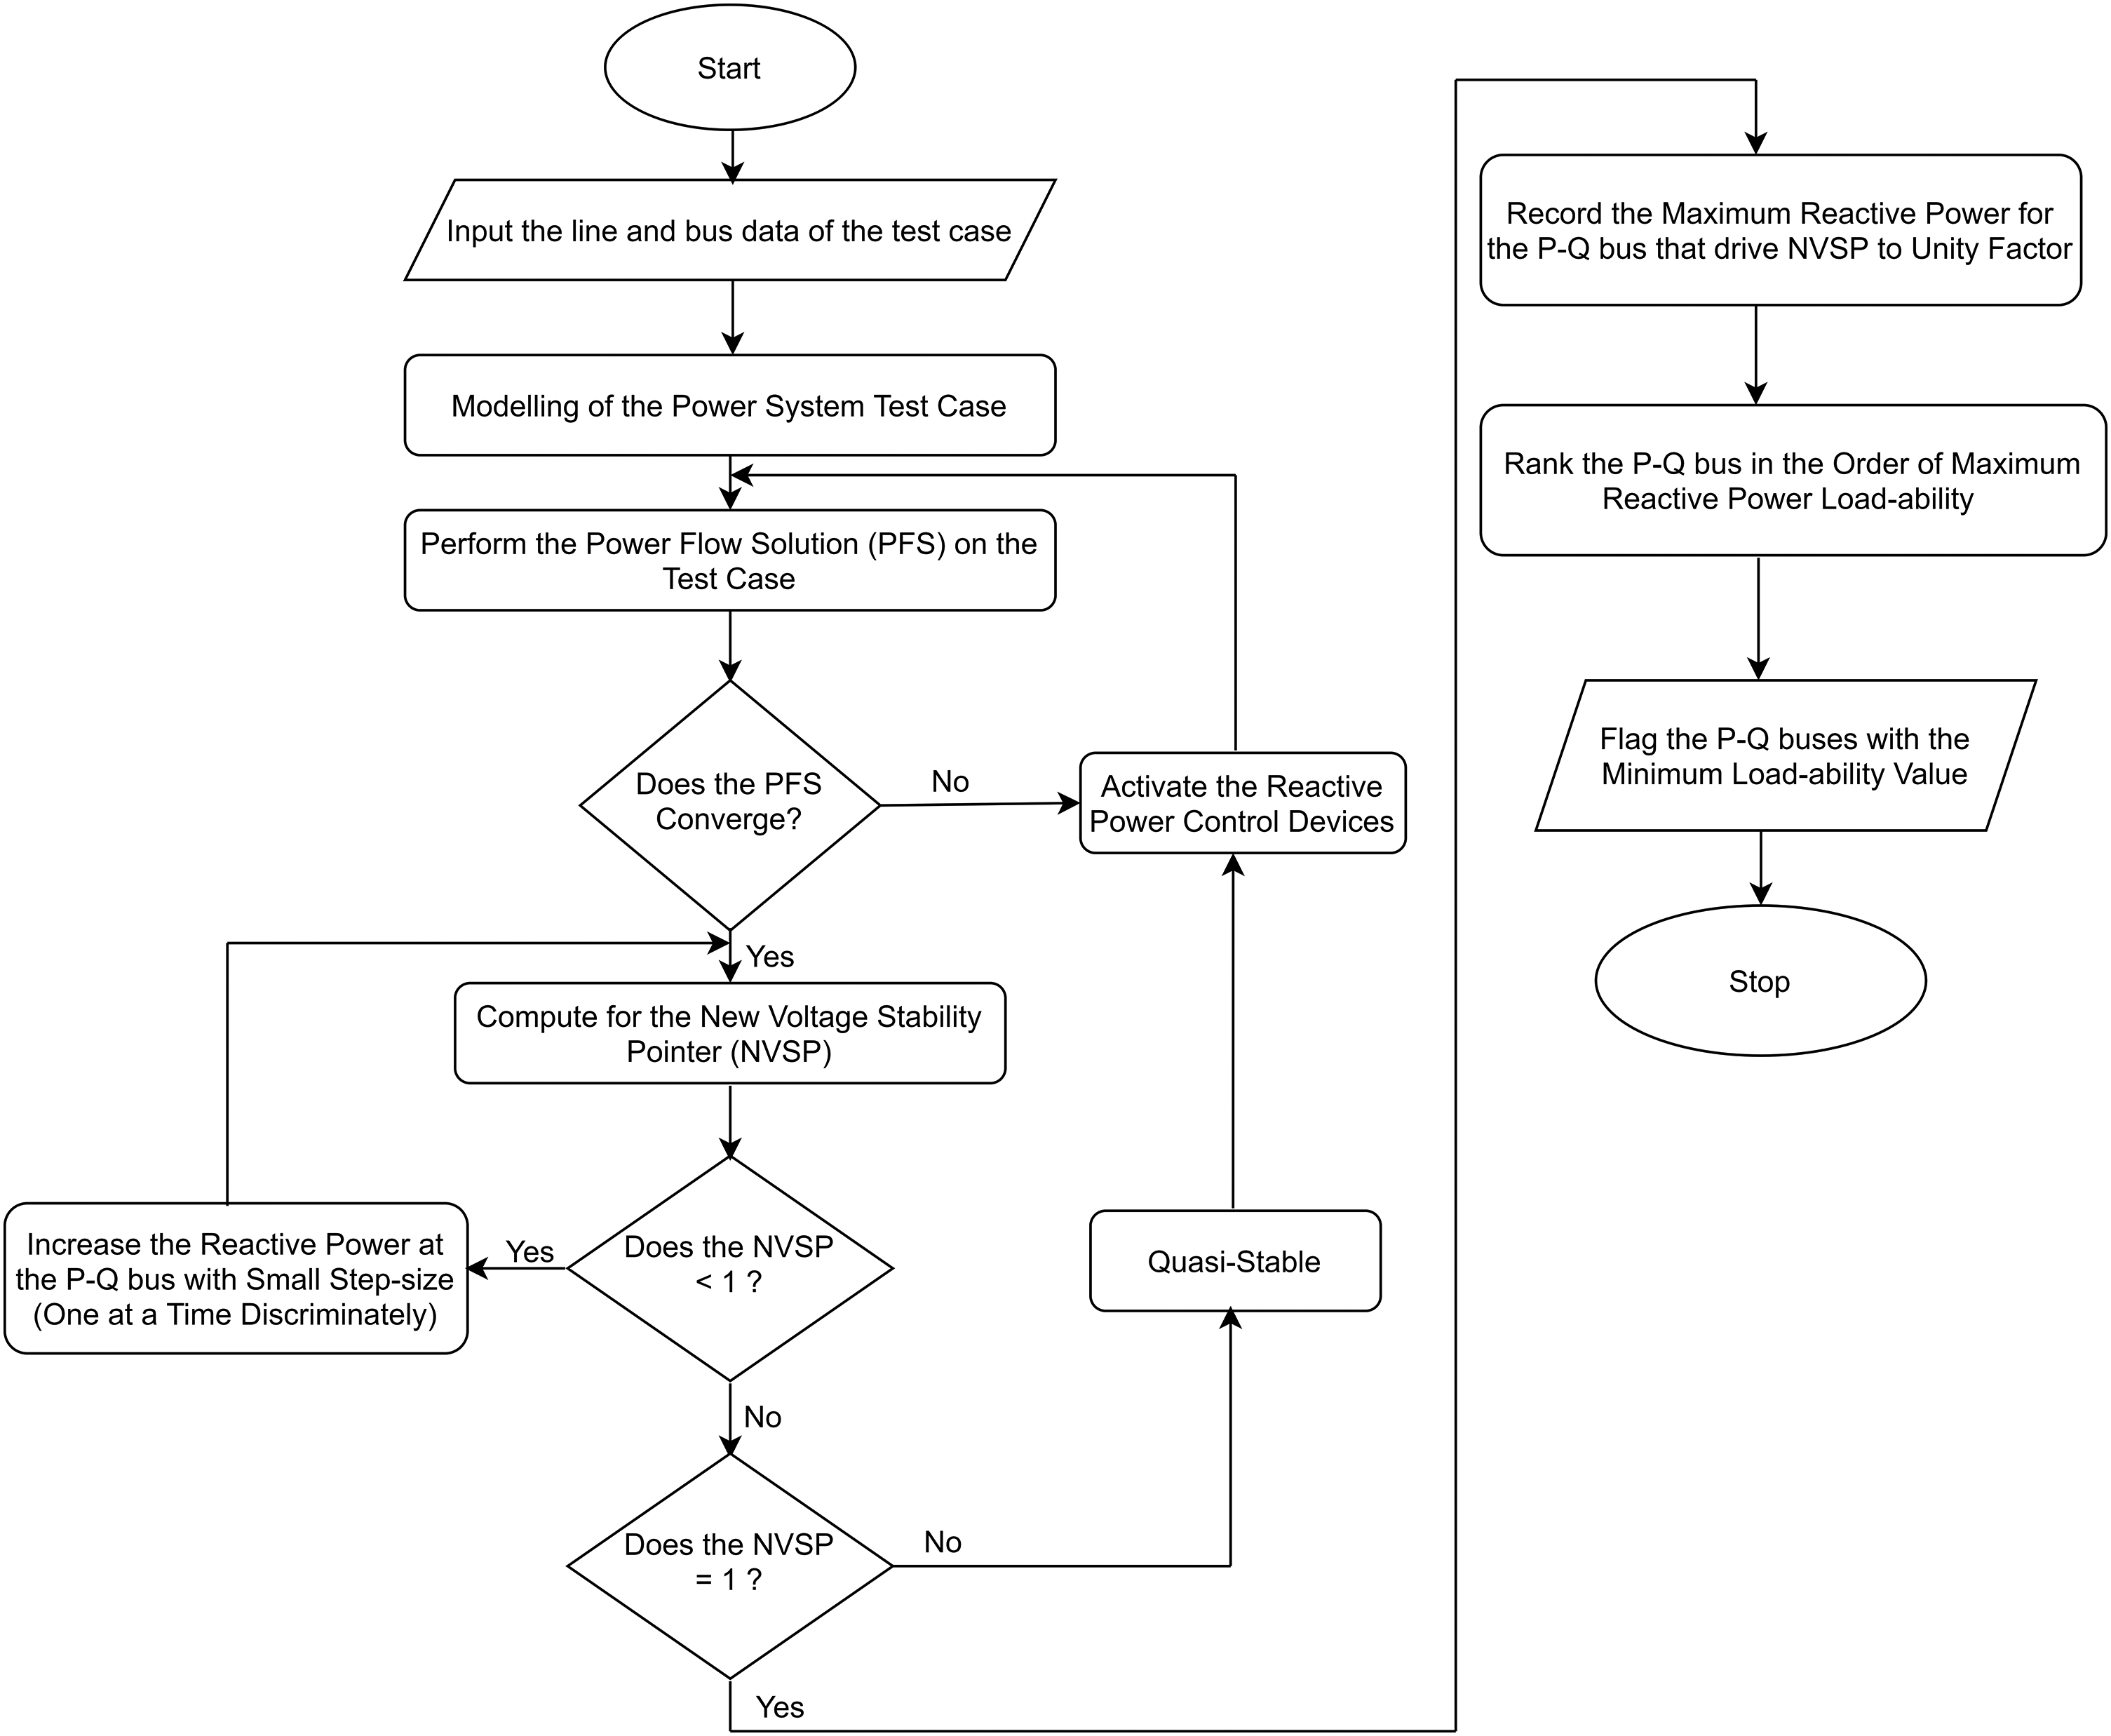
The framework of the model for vulnerable lines identification and contingency ranking.
Mathematical modeling of STATCOM as contingency support system
The mathematical modeling of the proposed STATCOM is designed with an interfaced step-down transformer in series with a leakage reactance. The STATCOM which is a voltage source converter was connected with a shunt direct current (dc) capacitor. The controllable AC output voltage,

The system works for active power control in such a way that when the source voltage,


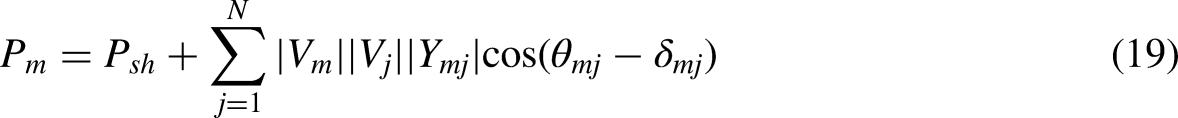
Equations (17) and (18) depict the nonlinear dynamic nature of the power system from Figure 3. The power flow mathematical expressions with an installed STATCOM are given by equations (19)–(22).
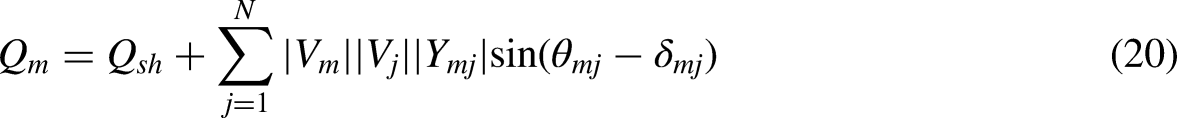


STATCOM configuration of a single source infinite bus.
Problem formulation
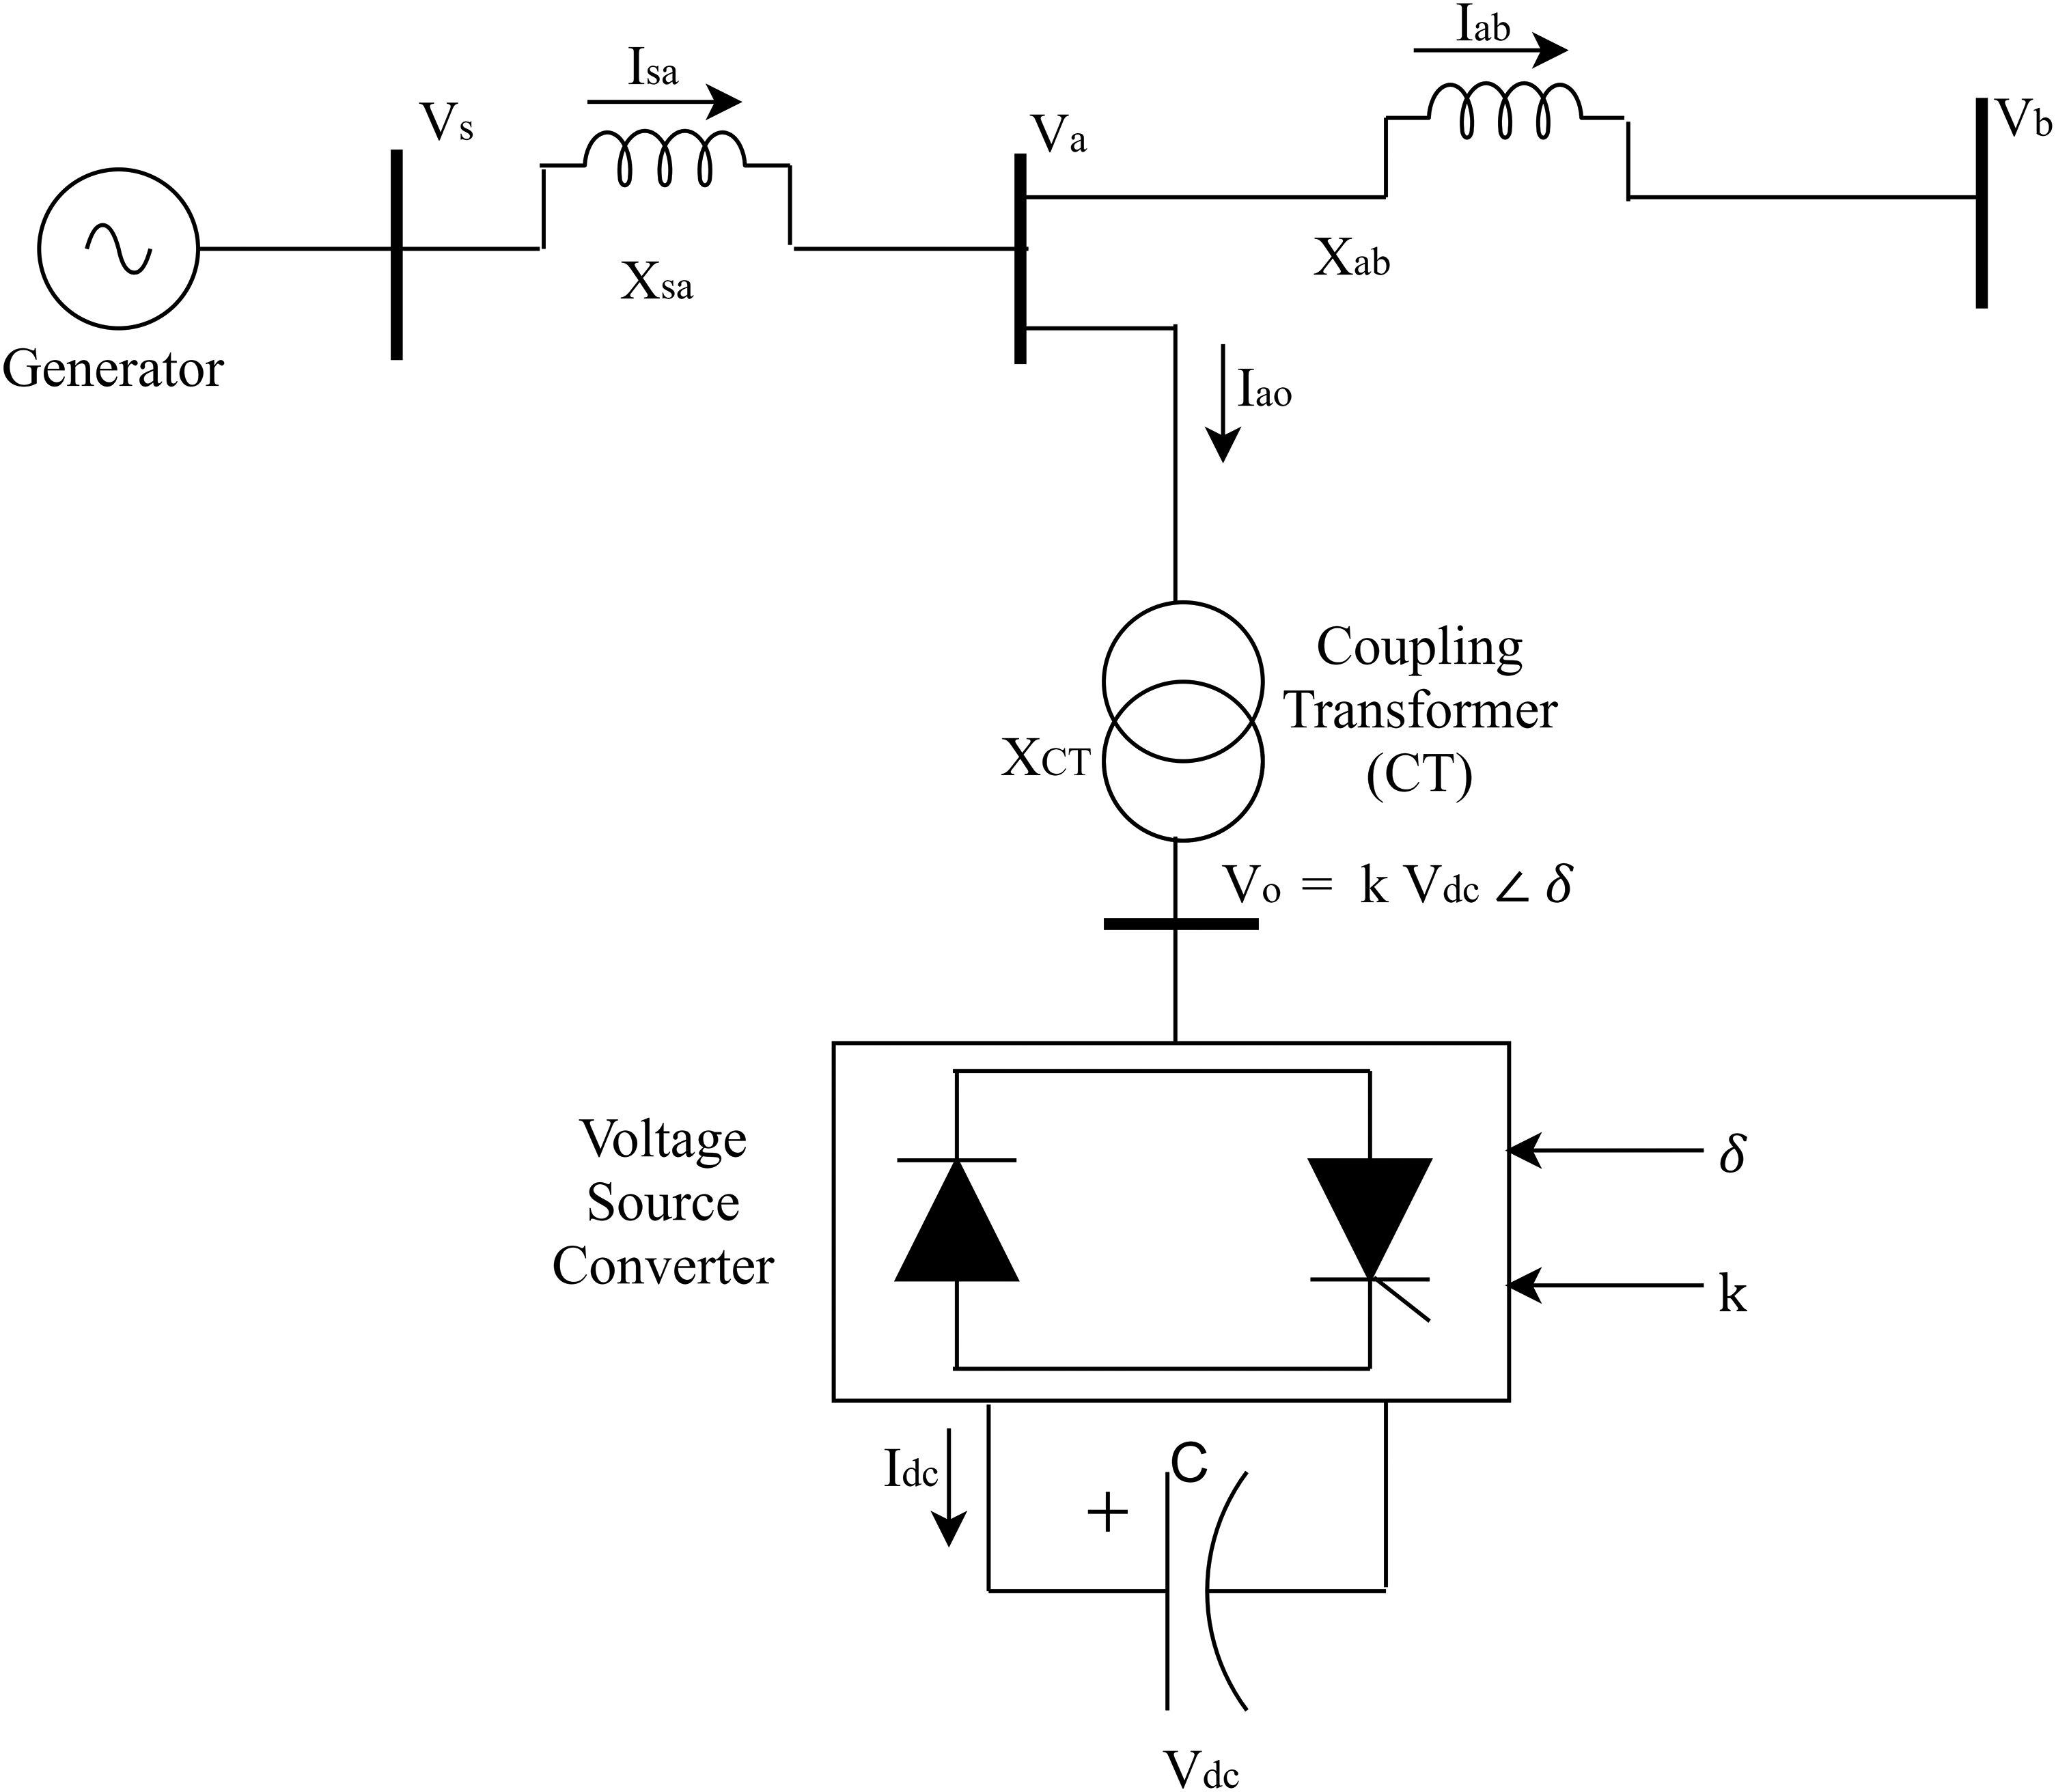
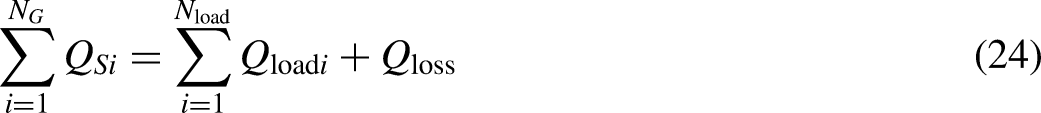
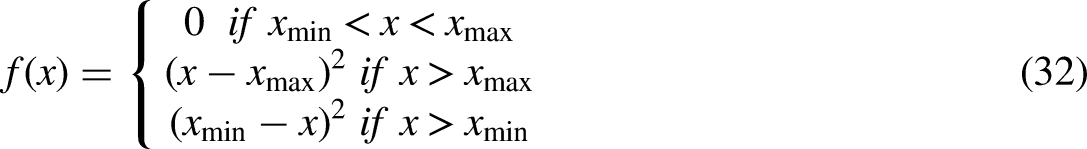
In this settings, the reactive power ( Power equality constraints: The power equality constraints is Power limit constraints: This contains introducing operating range—i.e. minimum and maximum—on active and reactive powers, line flows and each candidate bus voltages as given as Fitness function constraints: The fitness function


Test system
In this research, the IEEE 30-bus test system presented in Badrudeen et al. (2023) was adopted. The single line diagram comprises six (6) generator (PV) buses, twenty-one (21) load (PQ) buses and forty-one (41) transmission (branch) lines. The bus 1 was taken as the slack.
Results and discussion
Determination of critical lines to outage (N − 1 contingency)
Power systems are designed to experience load dynamics as a result of load growth and perhaps, adequate planning must be made to accommodate such variation in load pattern. However, the network becomes unstable when the power grid feed much more load than its maximum line loading and voltage capabilities. This occurrence may result in voltage collapse or transmission line failure if inadequately managed. In this study, the analytical evaluation of determining the most severe transmission line to outages was achieved through the line loading capabilities. The critical lines were evaluated by assessing the severity of each transmission line failure in an interconnected bus during load-ability analysis. These critical lines are susceptible to suffer highest risk of severity in the occasion of different contingencies in the grid due to their threshold voltage violation and line overloads. In other words, in a bus with multiple transmission lines, each line will possess an individual NVSP value; however, the transmission line with the highest NVSP value will be recorded as the most critical line for the considered bus as presented in Table 1. The overloading assessment was restricted to reactive power because the voltage stability is very sensitive to reactive power flow. Meanwhile, the critical line ranking was based on the maximum level of voltage deviation as depicted in Figure 4.

Critical line ranking of the IEEE 30-bus system based on the maximum voltage deviation.
Identification of critical lines in IEEE 30-bus test system.
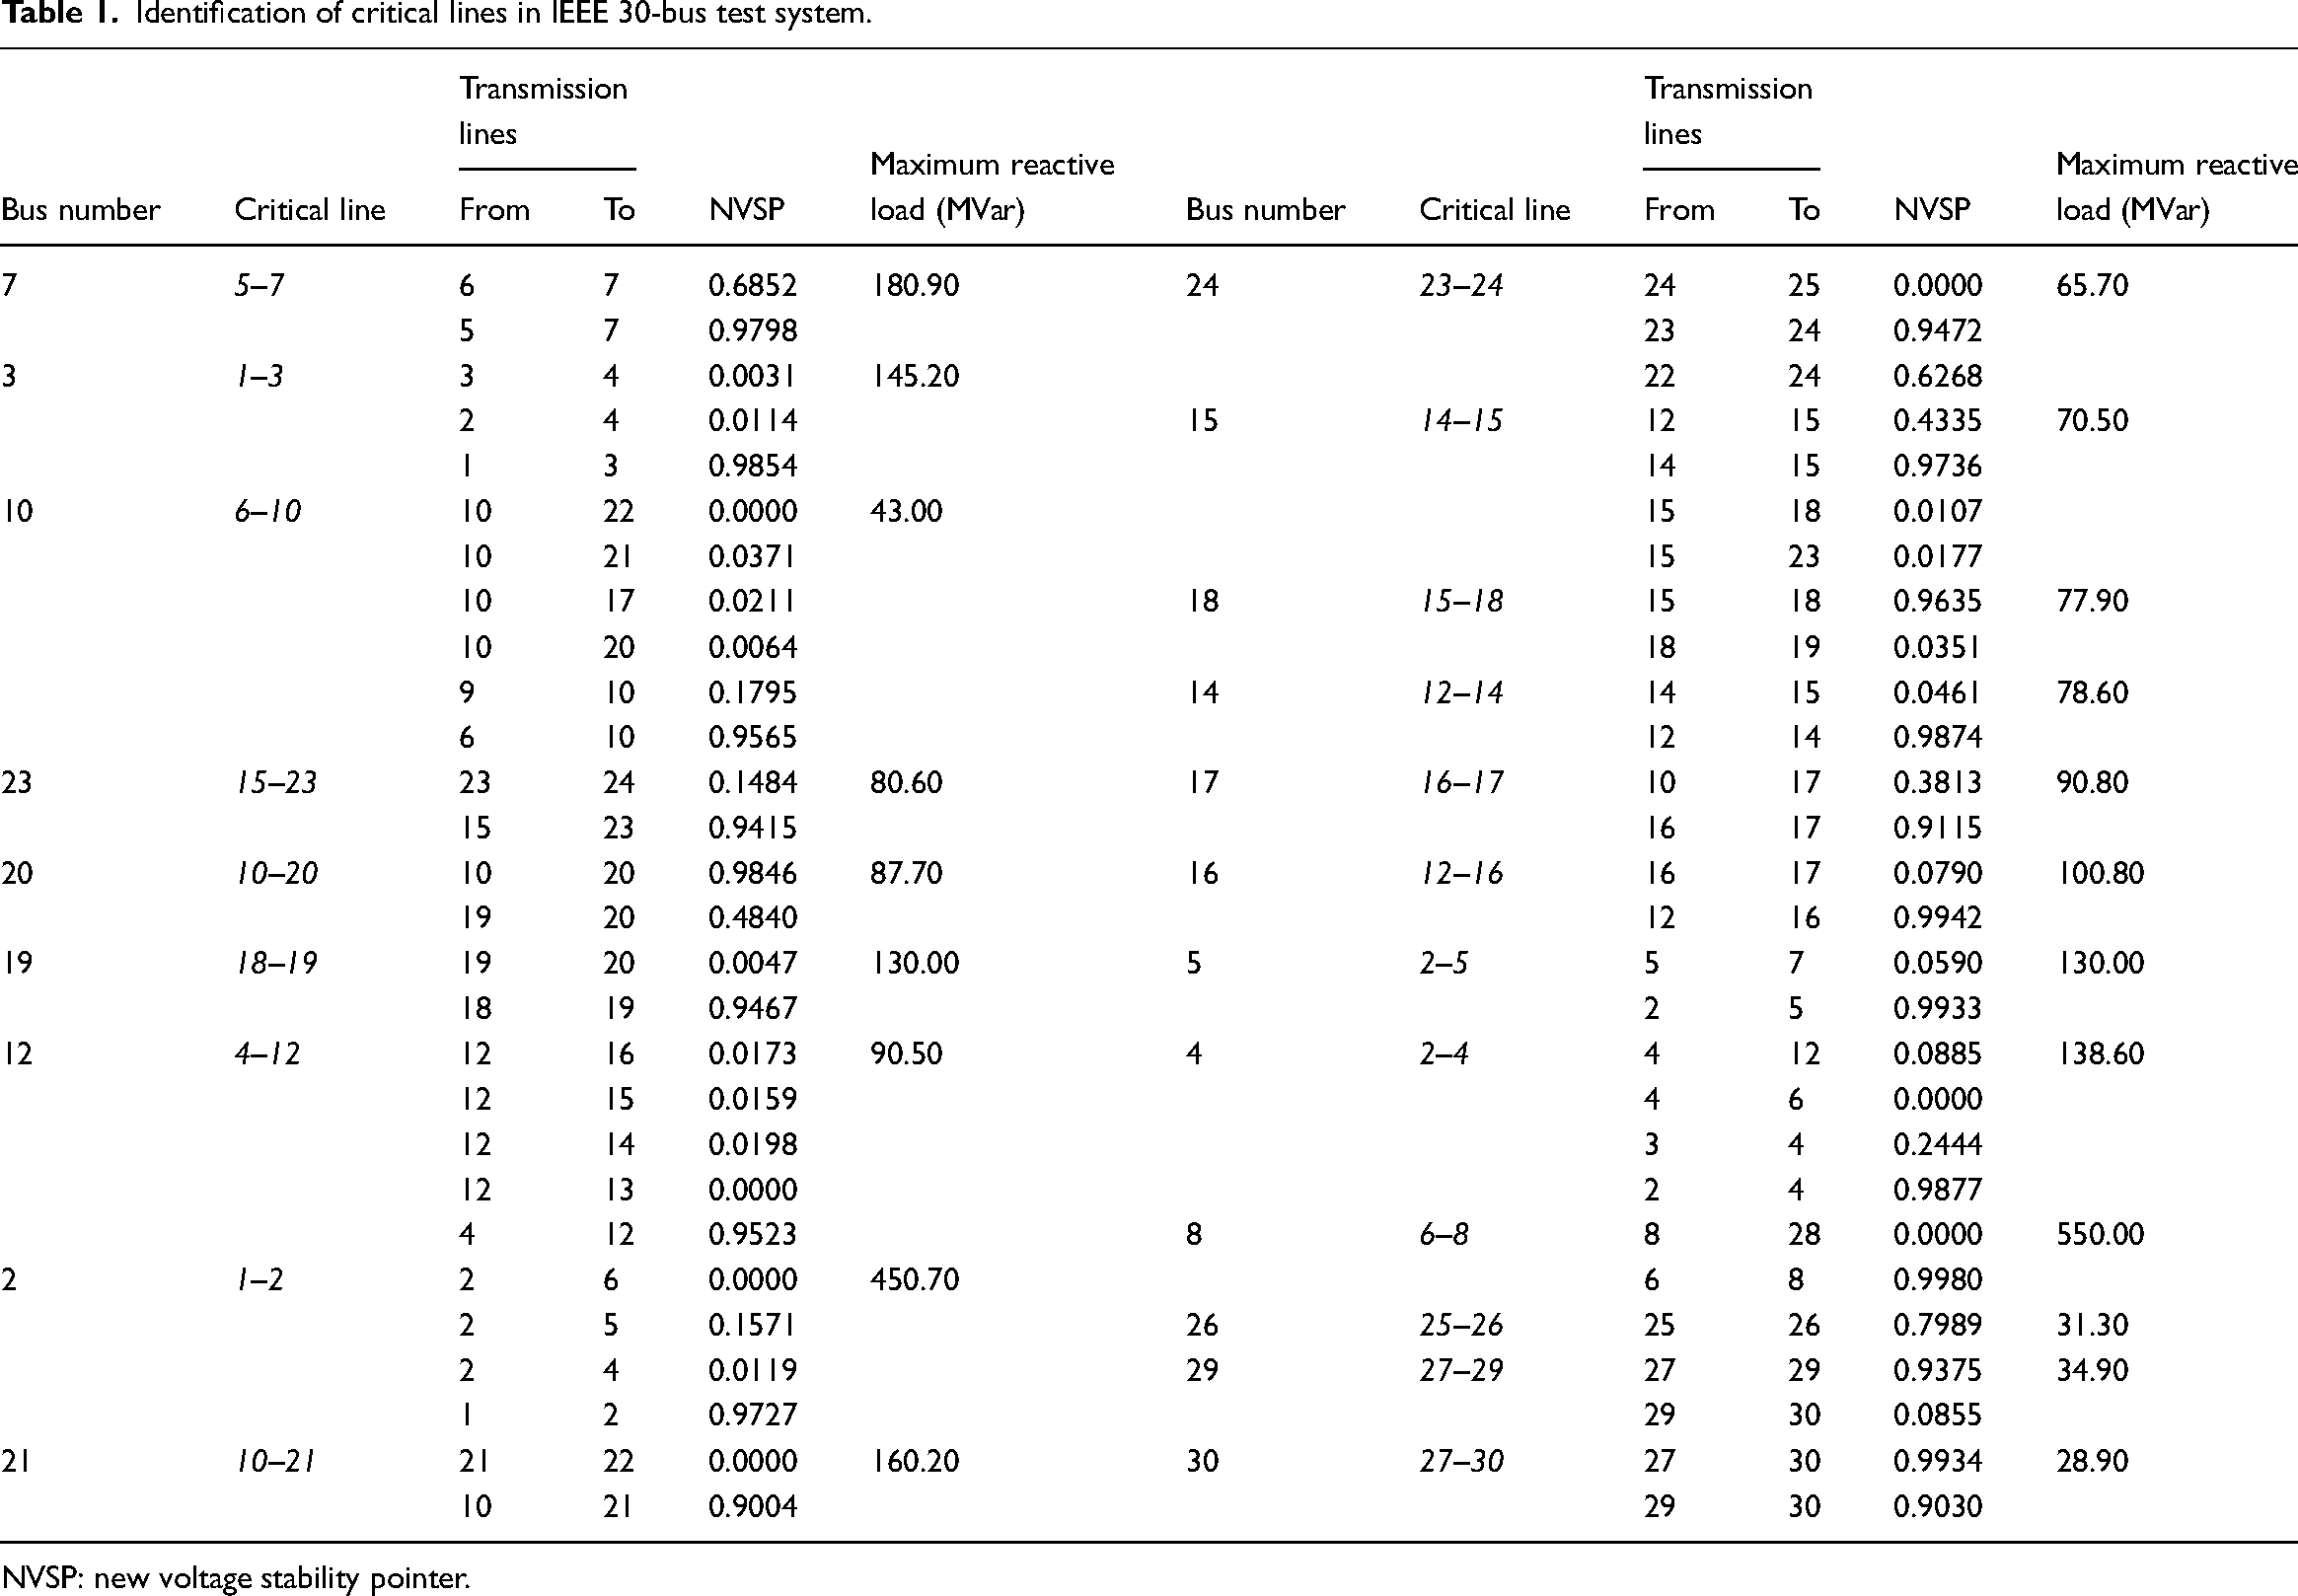
NVSP: new voltage stability pointer.
In power systems, each transmission lines in the grid have a moderate voltage stability limit and loading capabilities before it fails. The consequences of such transmission line failure may have severe effect on the stability of the network, which often times, are the causes of cascading blackout. The effect of critical line outages of the IEEE 30-bus system on the voltage stability is presented in Table 2. From Figure 4, it was observed that lines 10–21, 27–29, 18–19, 10–20, and 27–30 are the topmost ranked severe lines in IEEE 30-bus test system based on the degree of voltage deviation. It indicates that these lines have potential to contribute to the system instability and could drive the grid to operate in an uncontrolled manner that may lead to voltage collapse.
N − 1 contingency ranking of the critical lines and vulnerable buses of the IEEE 30-bus data.
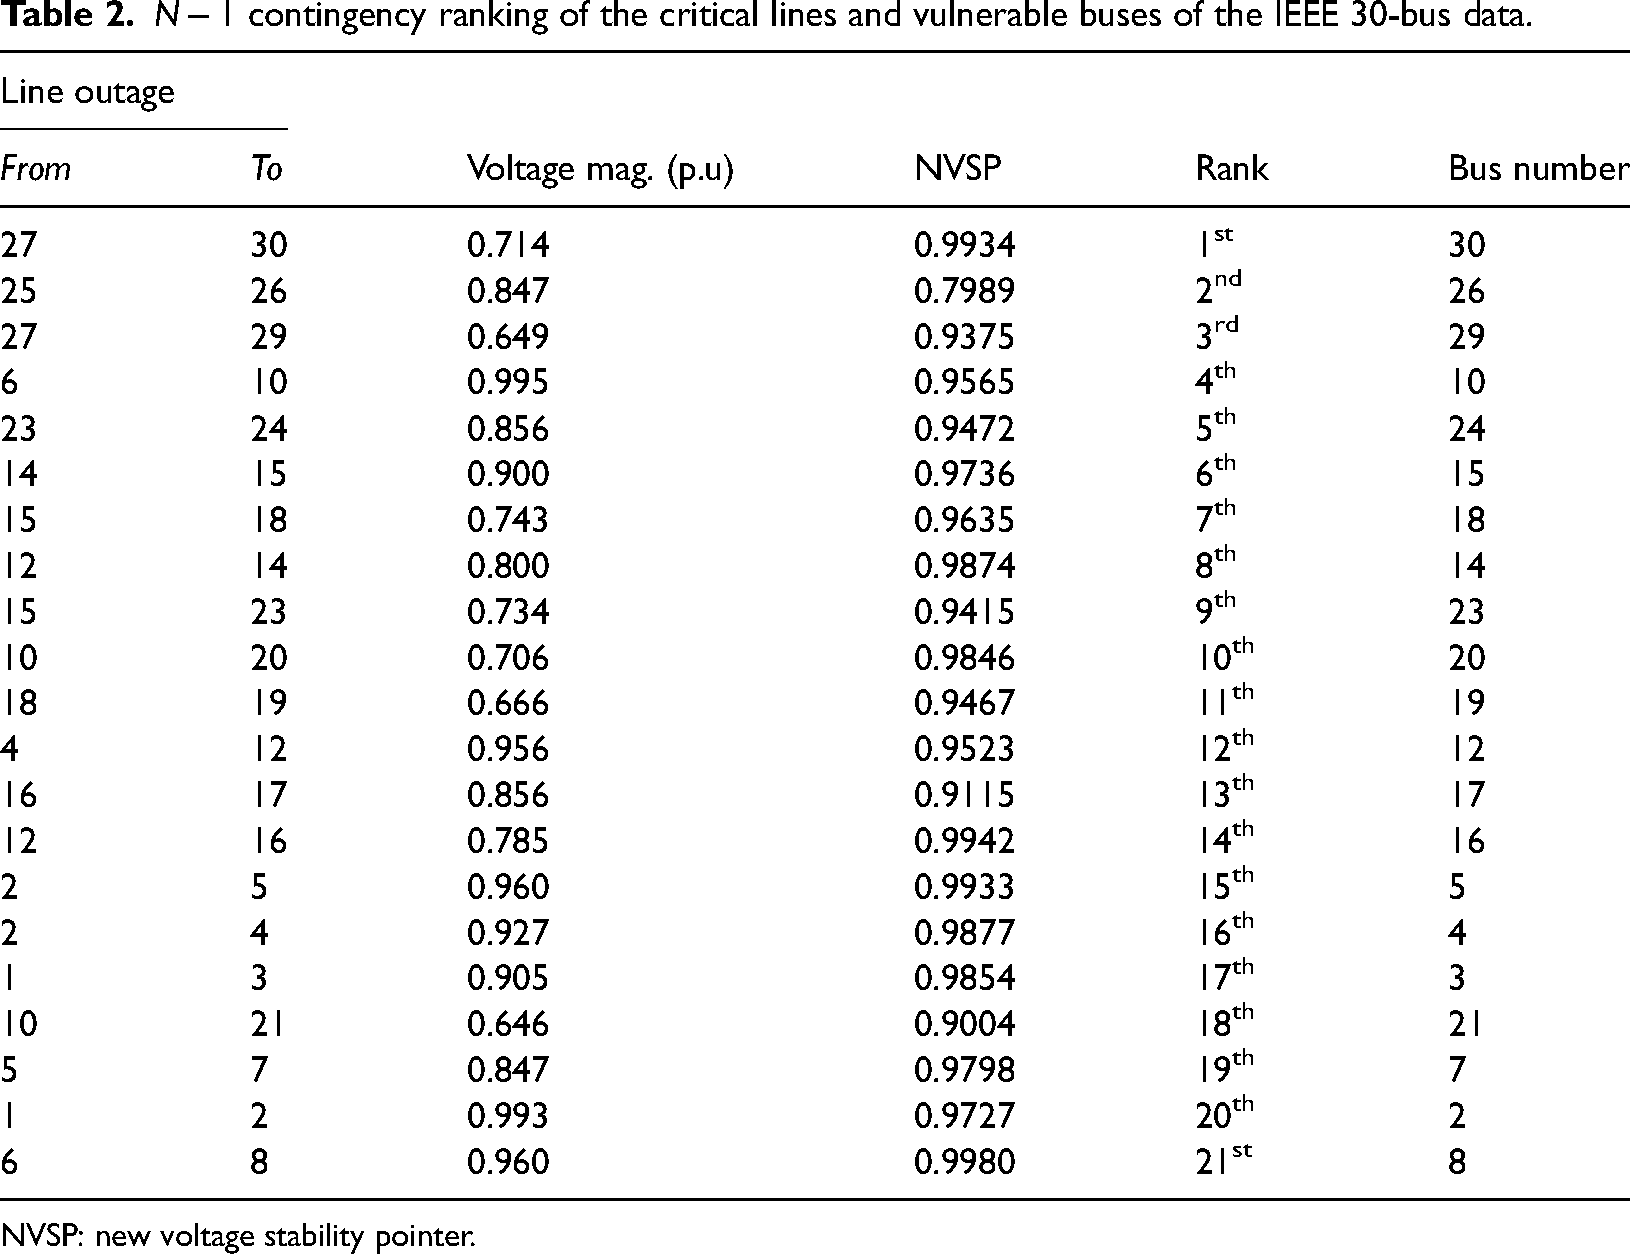
NVSP: new voltage stability pointer.
Evaluation of N − 1 contingency ranking and selection of candidate bus
The N − 1 line contingency evaluation of the IEEE 30-bus data without the contingency support system using NVSP is presented in Table 2. The contingency evaluation was carried out to determine the maximum reactive load-ability of the PQ buses in the presence of load dynamics and growth. Similarly, this assessment was used to determine the best location to place the contingency support system to improve the performance of the grid optimally. The critical lines are described as the most vulnerable transmission lines to failure in a candidate bus. The ranking was achieved by the maximum reactive power capability of the load bus and the voltage magnitude of the same bus. The order of ranking is in the degree of least loading capability of each candidate bus. This implies that the top ranked buses are the most vulnerable to disturbances due to contingency events. Hence, these are the suggested locations for the placement of STATCOM for grid security support.
At each load-ability point, each candidate bus experiences a new voltage magnitude which often times damps out of the threshold due to the contingency events as a result of critical line failure. Figures 5 and 6 describe the voltage magnitude of each load bus at maximum loading point and maximum load-ability, respectively.
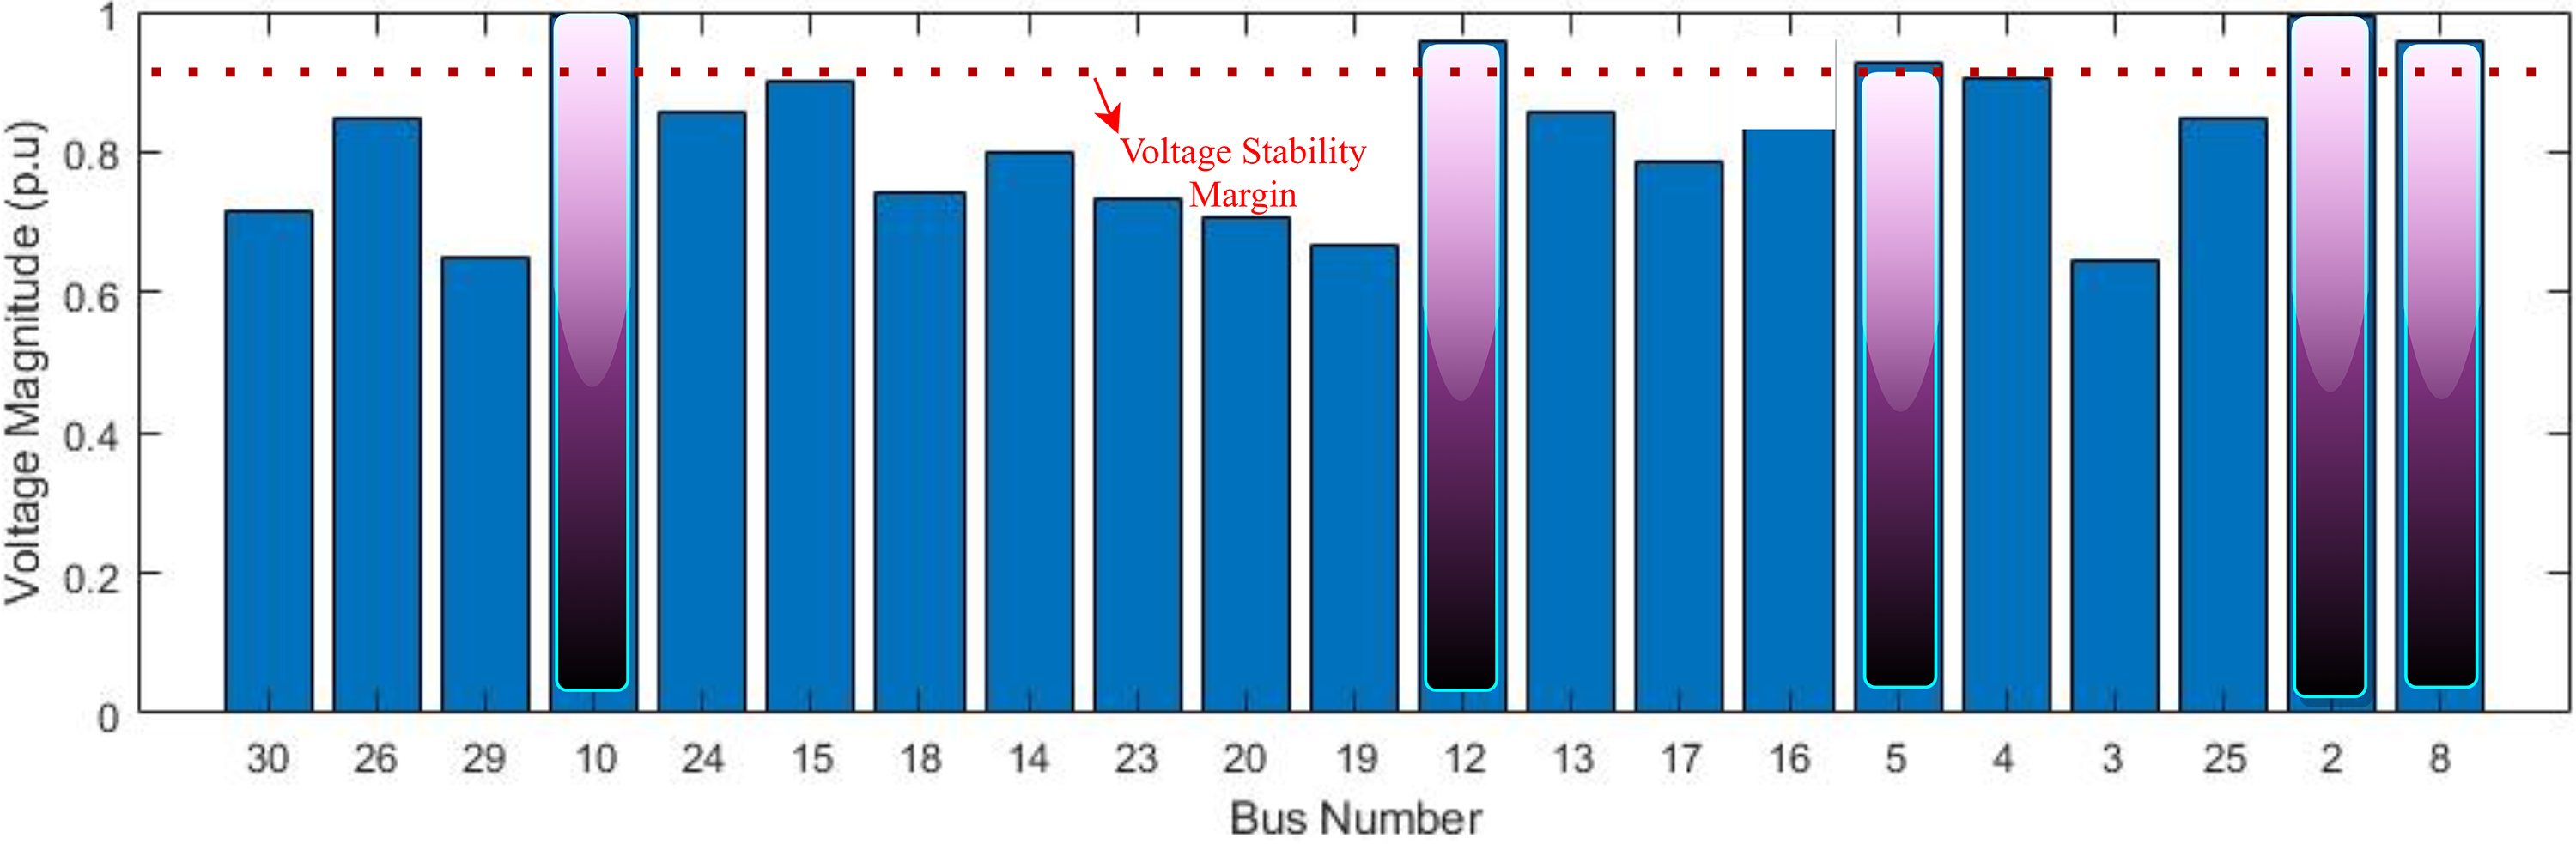
Voltage magnitude of each candidate bus at maximum load-ability.
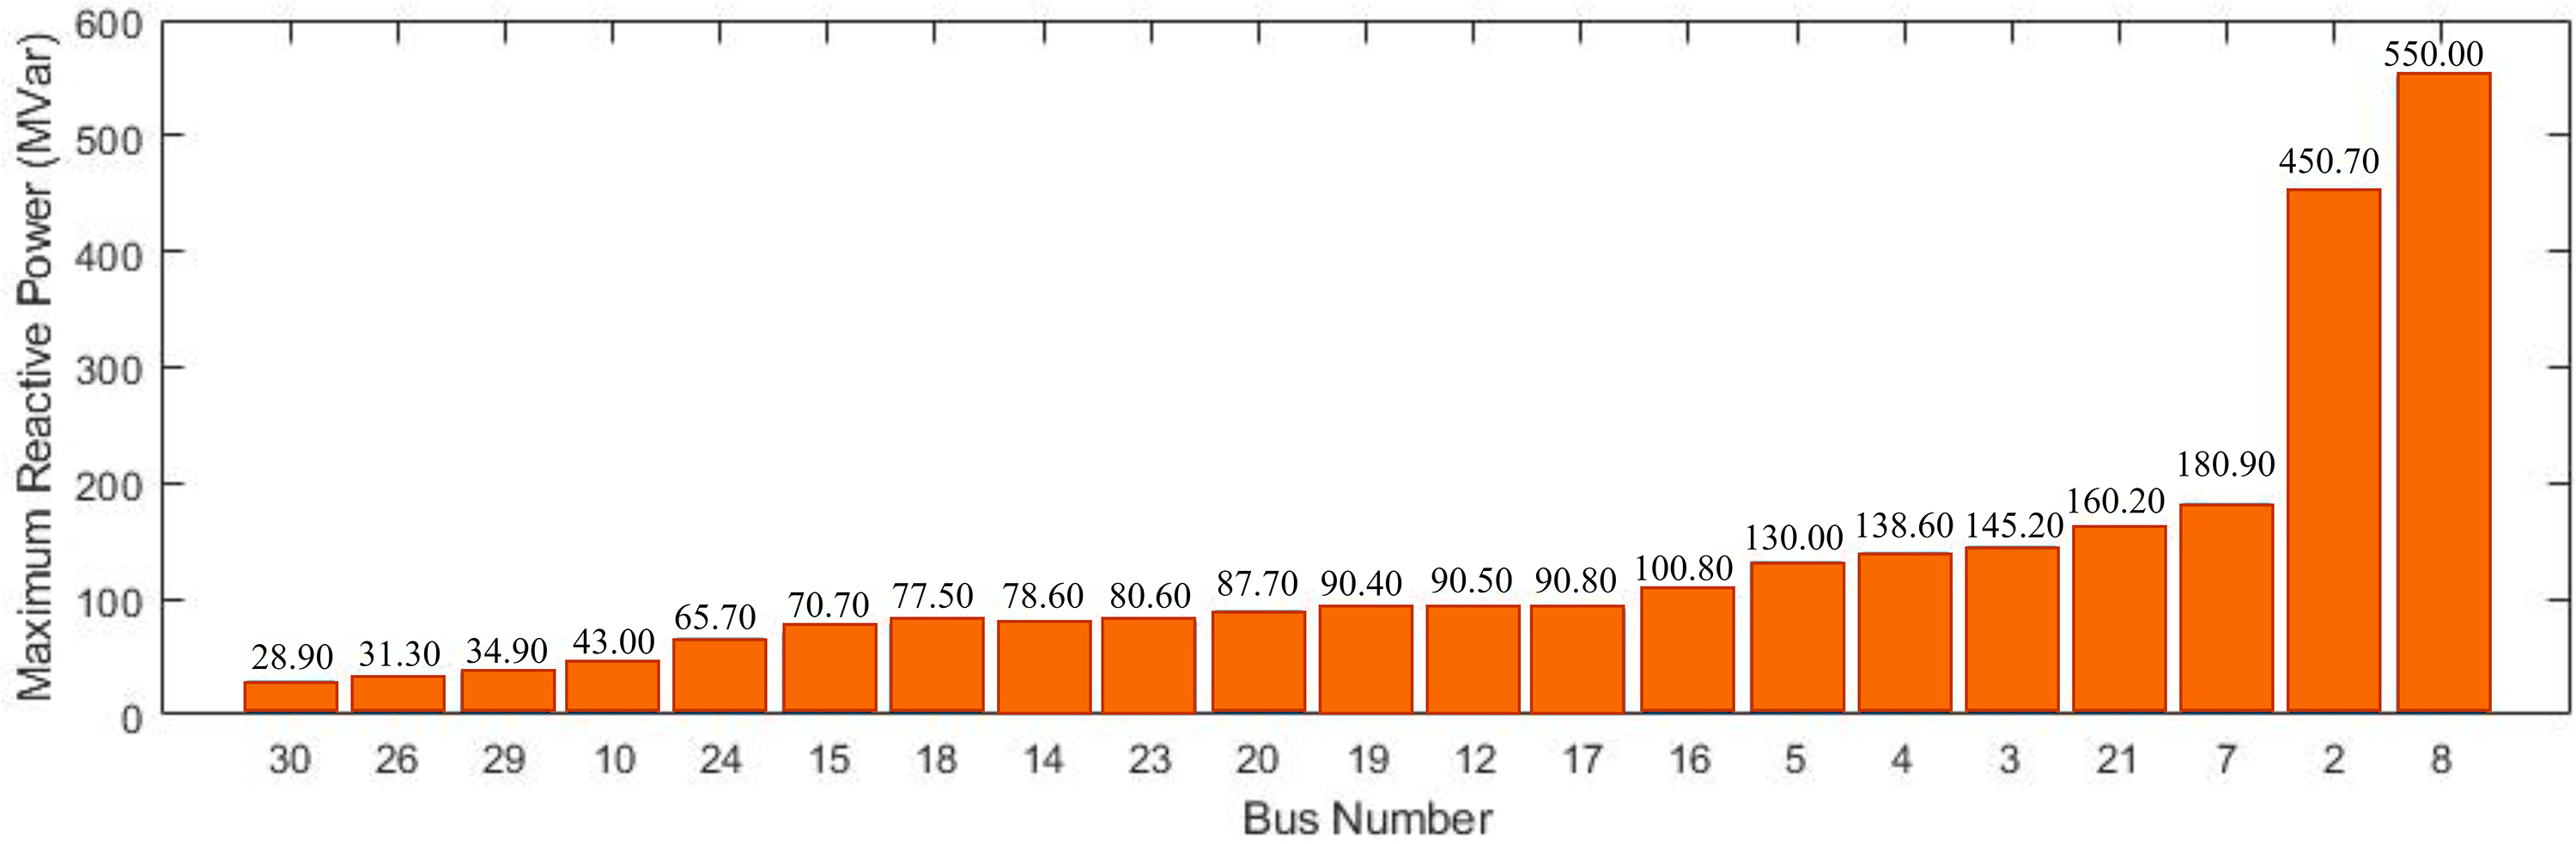
Maximum reactive power loading limit on IEEE 30-bus system.
It was observed from Figure 5 that only five (5) buses are operating within the safe tolerable voltage margin under N − 1 contingency assessment after the critical lines outage. The buses are 10, 12, 5, 2, and 8 with the voltage magnitude of 0.995 (p.u), 0.956 (p.u), 0.956 (p.u), 0.960 (p.u), and 0.960 (p.u), respectively. The majority of the PQ buses fail to maintain voltage stability at their maximum load-ability. In the same vein, the maximum reactive power loading capability assessment of the IEEE 30-bus PQ buses from Figure 6 shows that buses 30, 26, 29, 10, and 24 possess the least loading strength. From the results presented in Figure 6, buses 30, 26, and 29 are the top-ranked buses with the maximum load-ability of 28.90 MVar, 31.30 MVar, and 34.90 MVar, respectively. These buses are considered as the most unstable buses; hence, to ensure firm grid reliability, it is important to support these buses with STATCOM for the compensation of reactive power in assurance to maintain the grid stability.
Assessment of grid contingency support system
Based on the presented cases, and the need to substantially sustain the stability of the grid, buses 30, 29, and 26 are considered to be strengthened by STATCOM. This is with a view to reducing the power loss significantly and improves the voltage profile, thus, enhancing the overall power stability of the grid. The modified IEEE 30 bus line diagram with STATCOM is presented in Figure 7.
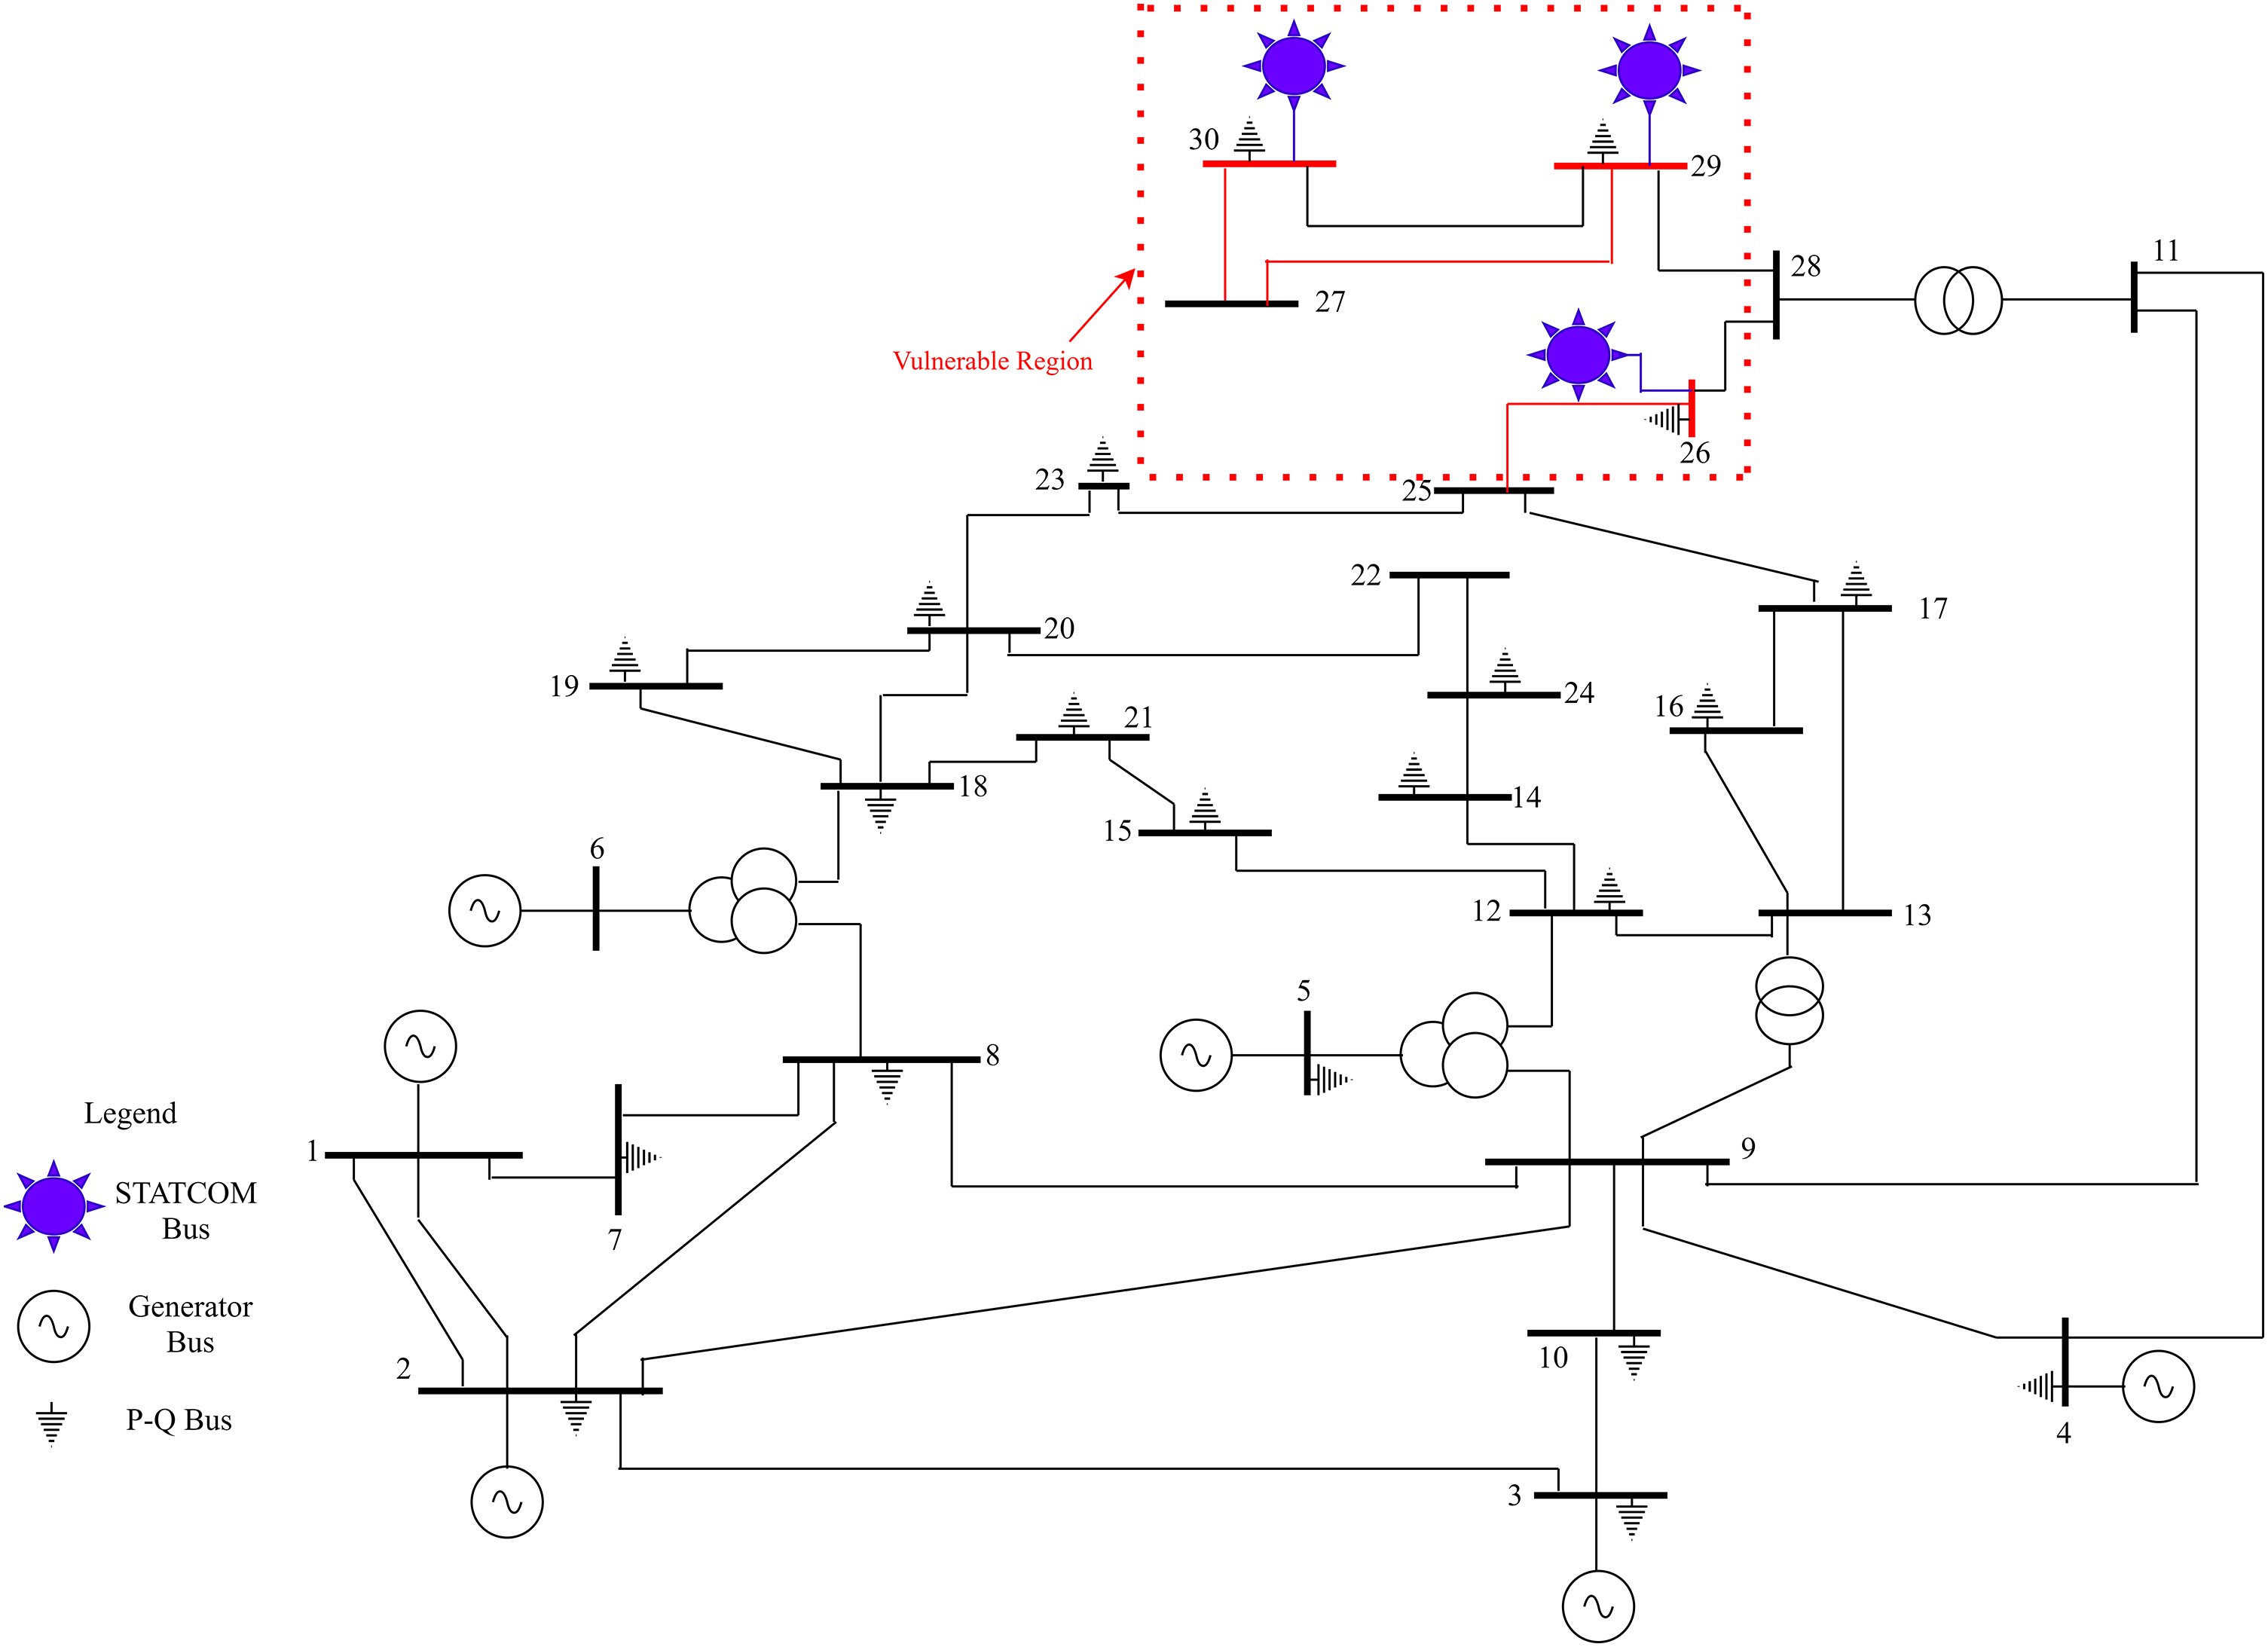
Modified IEEE 30-bus line diagram with STATCOMs.
As revealed from Figure 7, the dotted circle area encompasses the vulnerable buses and weak lines; thus, it is regarded as the weakest region. The voltage magnitude of the IEEE 30 bus without and with STATCOM is shown in Figure 8. Figure 9 depicts the IEEE 30 bus voltage magnitude at contingency and with STATCOM. Similarly, Figure 10 presents the voltage magnitude of the base case, contingency, and STATCOM.
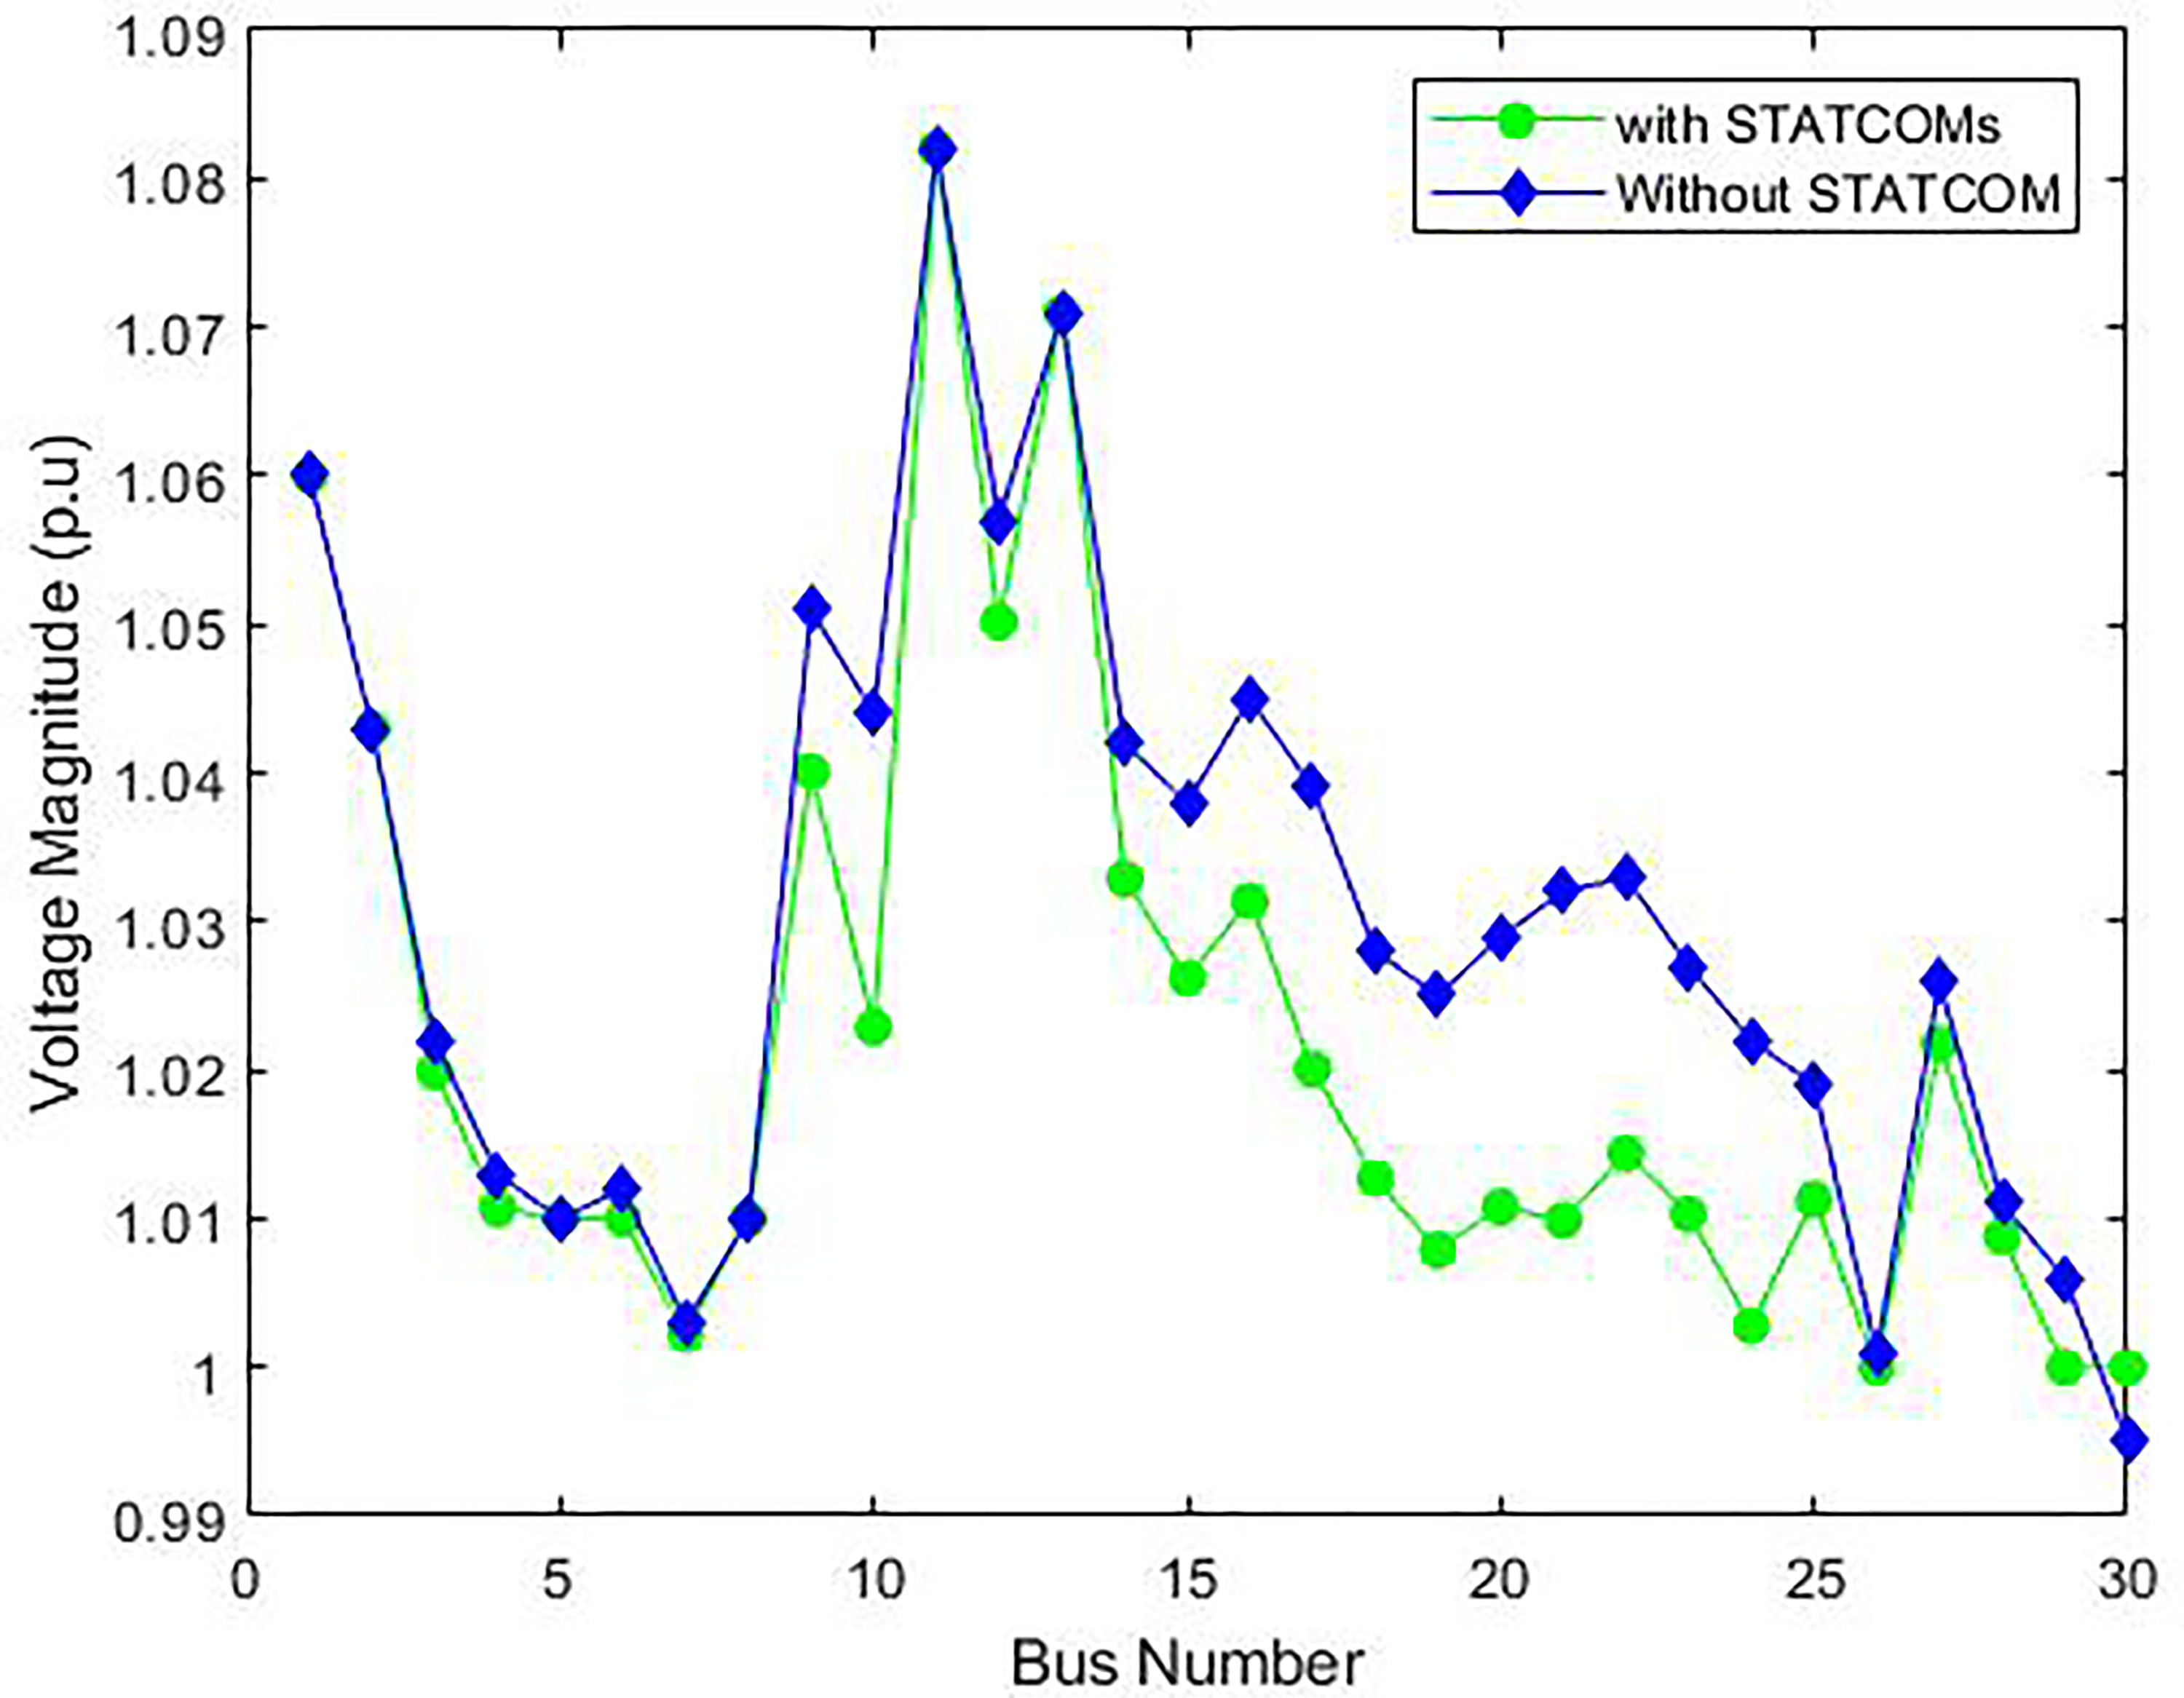
Voltage magnitude with STATCOM and without STATCOM.
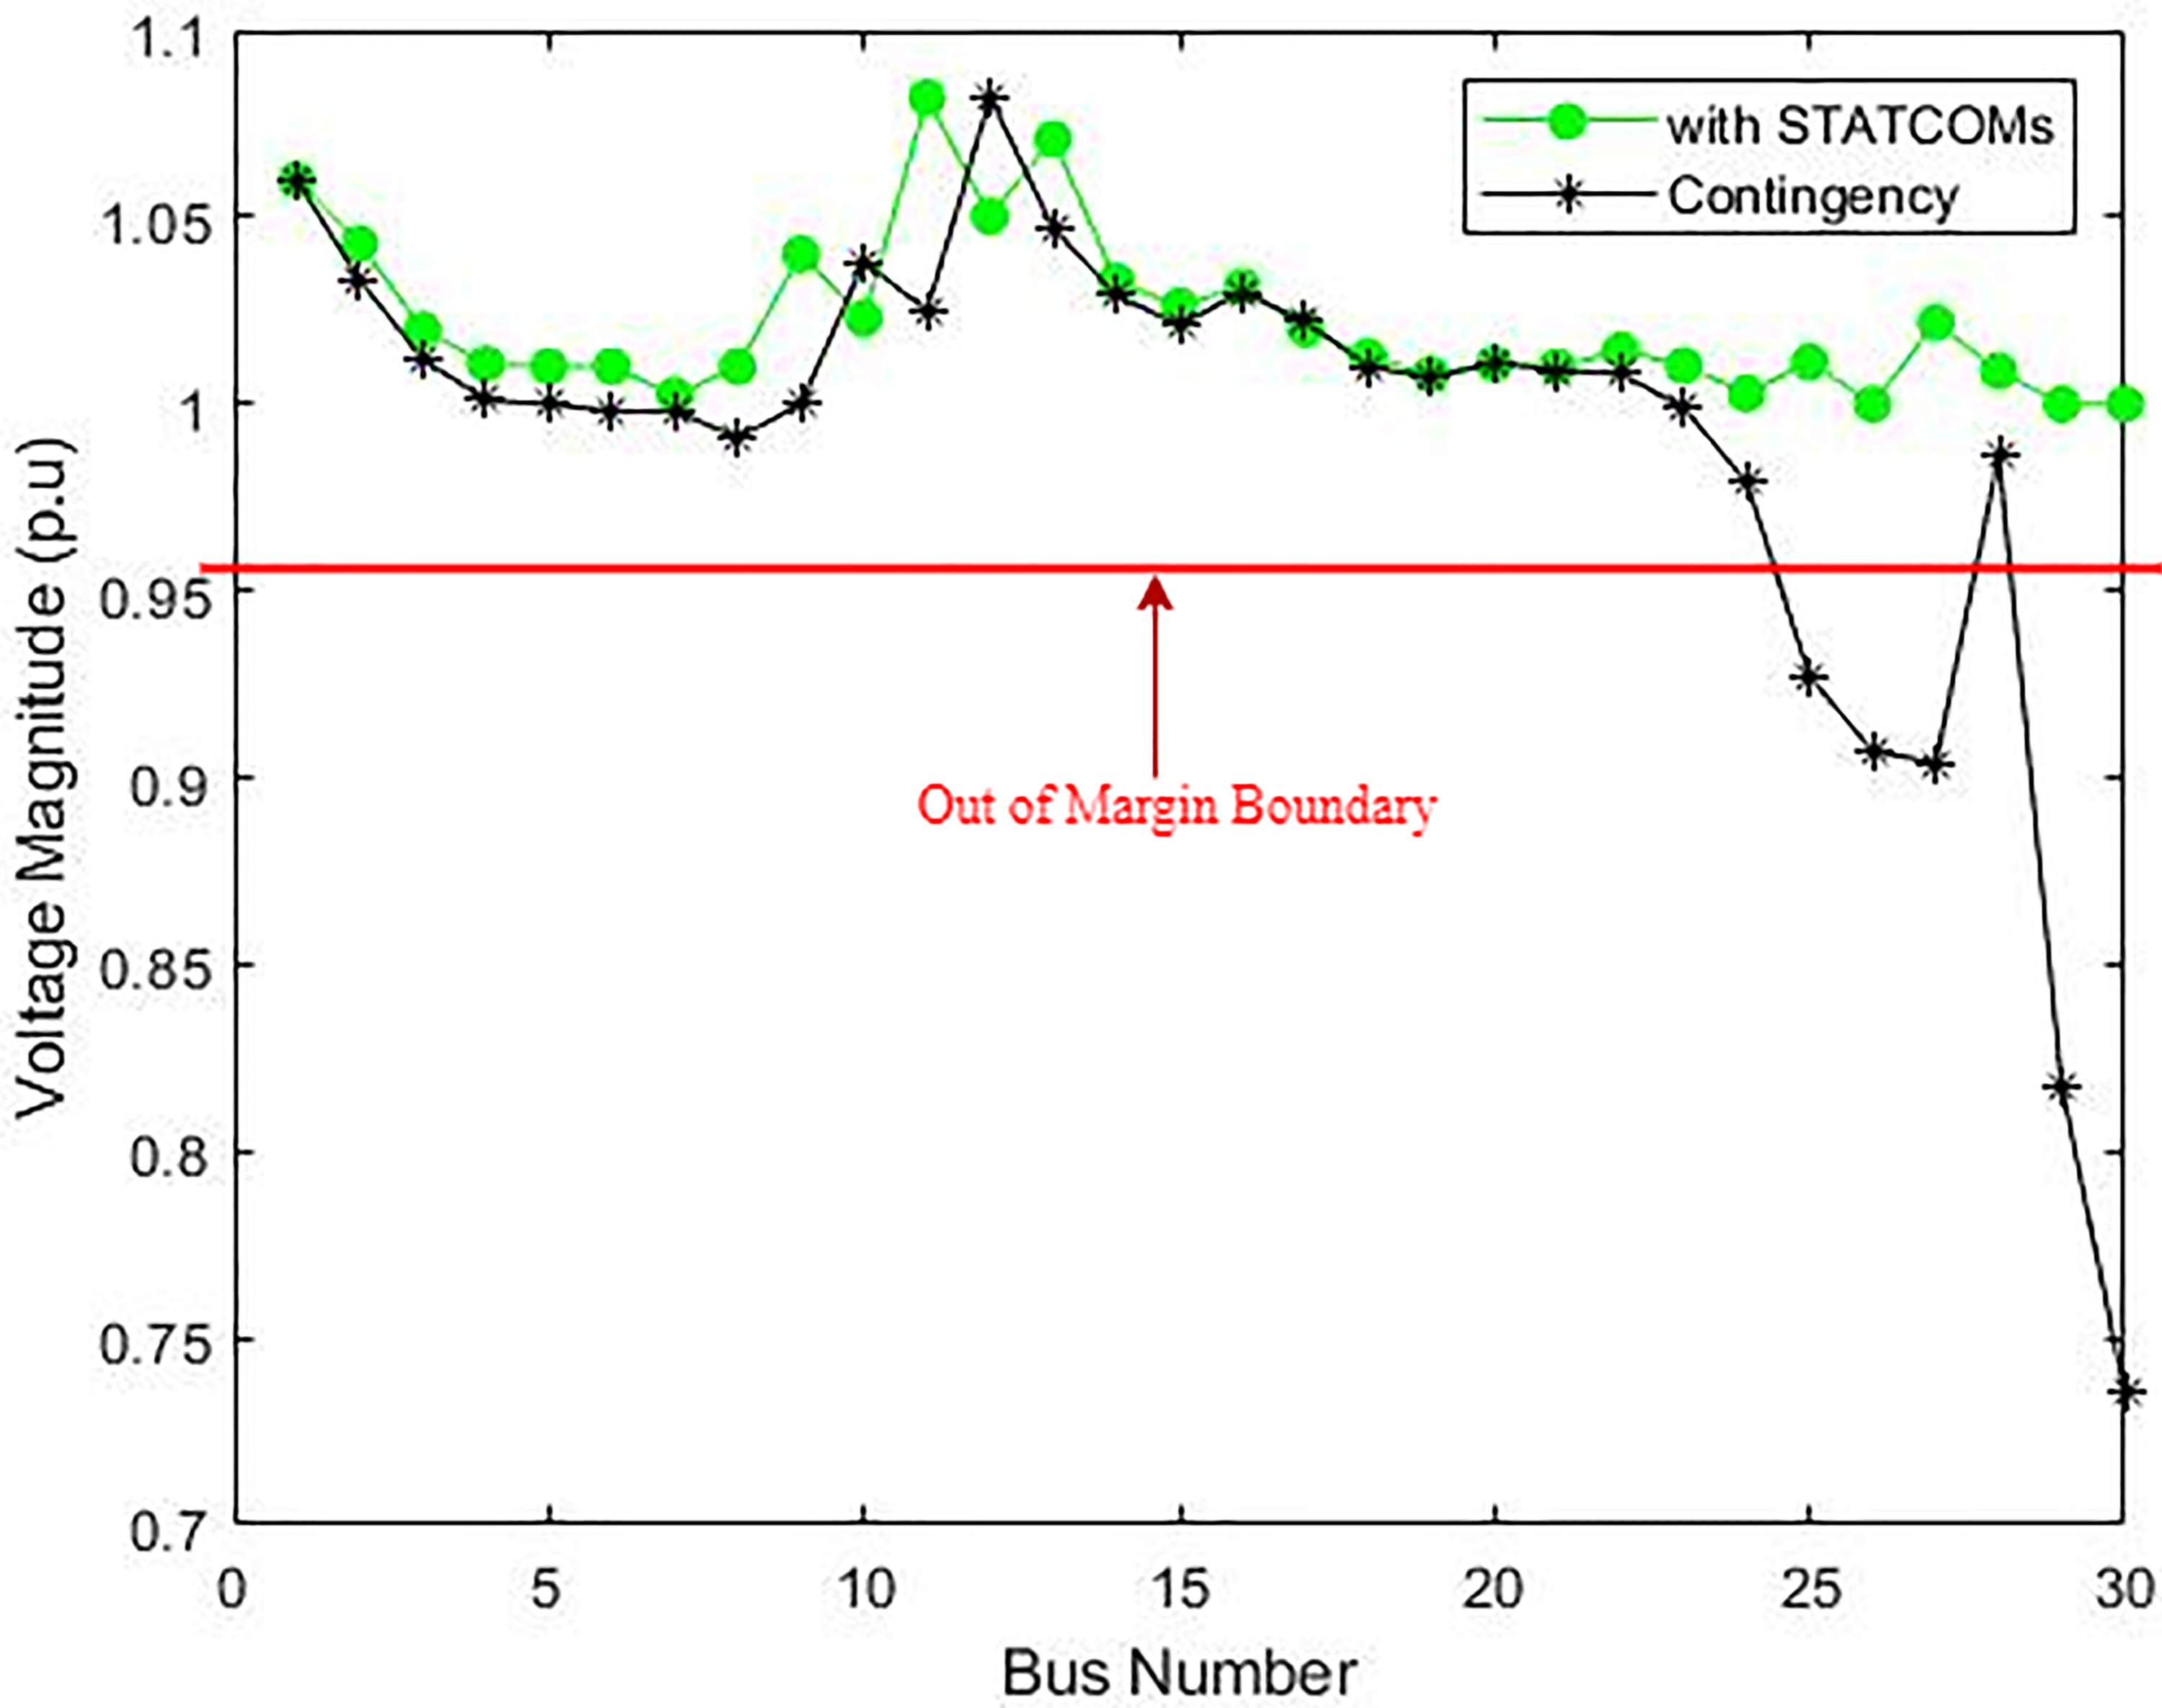
Voltage magnitude during contingency and STATCOM.
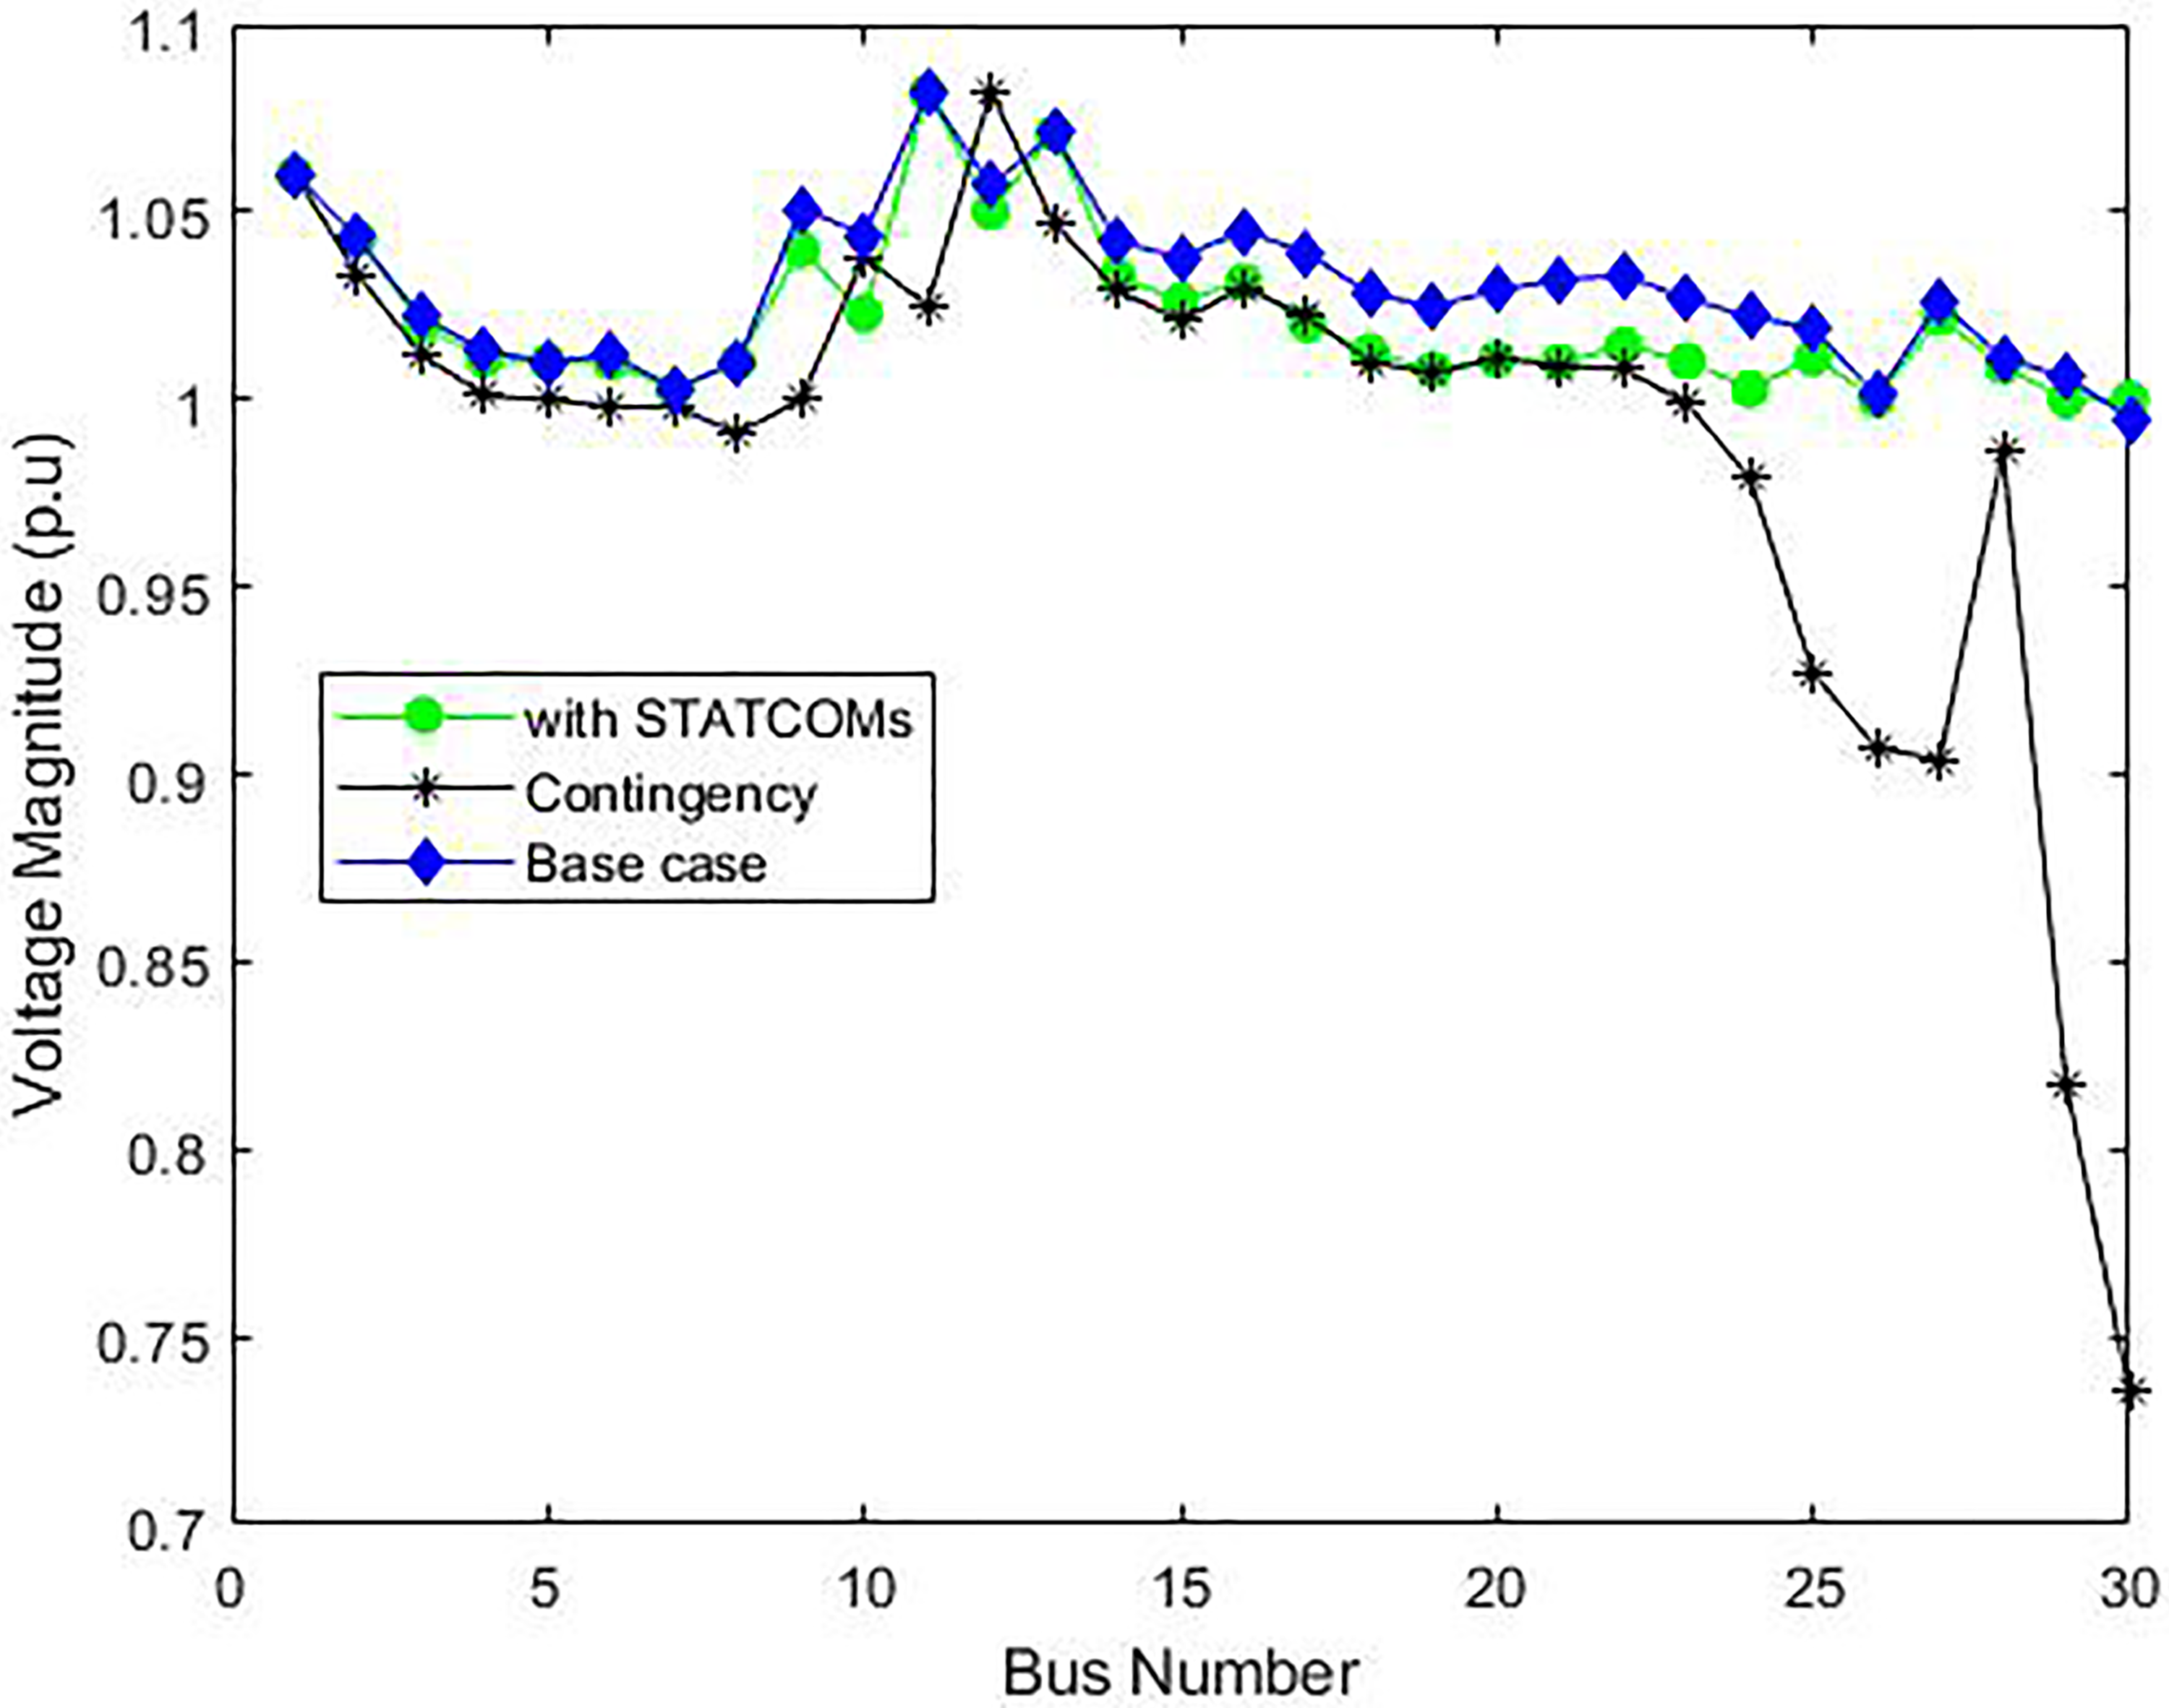
Voltage magnitude with STATCOM, contingency and base case.
It was observed from Figure 8 that at base case, the IEEE 30-bus was stable as the voltage magnitude of all buses fall within the acceptable operating voltage range (i.e.
At the same time, it was observed that the transmission line losses increase from 17. 60 MW and 68.92 MVar to 27. 70 MW and 93.98 MVar for active and reactive power line losses, respectively at contingency. The introduction of multiple STATCOMs significantly reduced these line losses to 1.72 MW, and 6.82 MVar for active and reactive power line losses, respectively (i.e. a reduction of 90%) as shown in Figure 11. The breakdown of the transmission line losses is presented in Appendix Table A and the corresponding buses’ voltage magnitude is presented in Appendix Table B. It was deduced that contingency increases the transmission line losses and reduce the voltage profile. Thereby, it is recommended to employ STATCOM as a contingency support device to prevent major disturbances that may result from contingency leading to transmission line failure or cascading blackout.
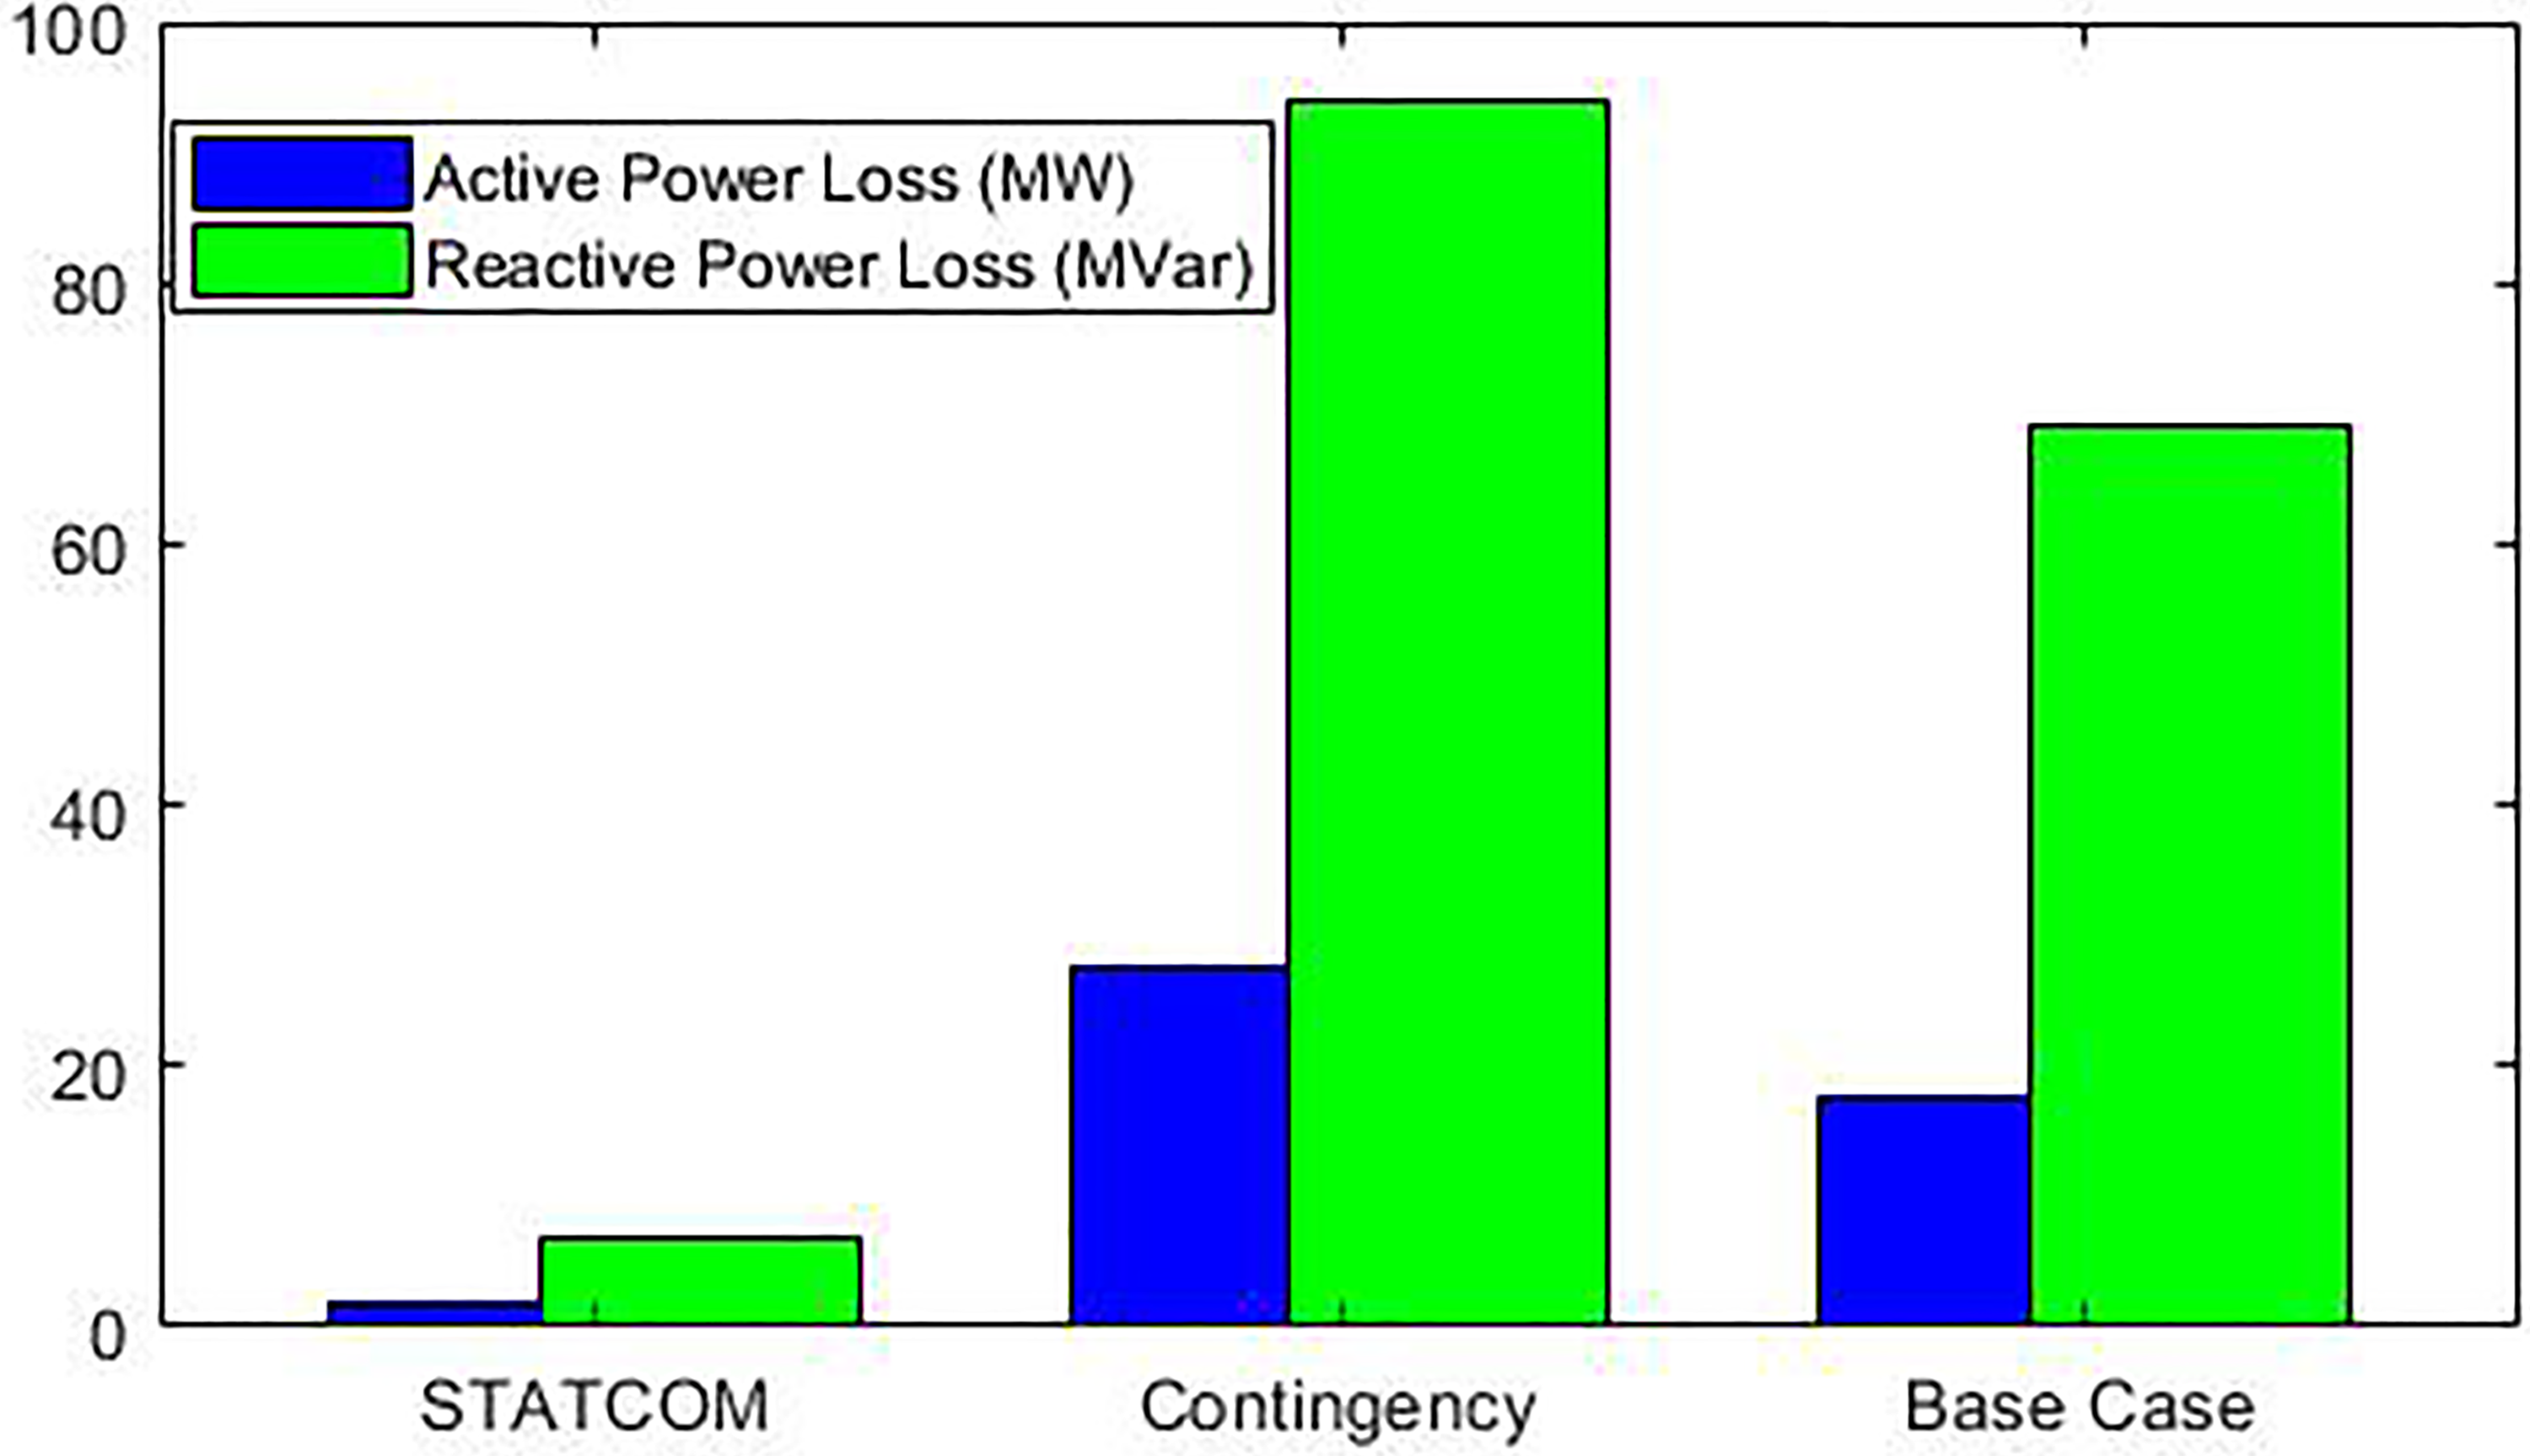
The total line loss with STATCOM, without STATCOM and contingency.
Investigation of optimum siting of STATCOM for maximum effect on power loss minimization
The optimum placement of STATCOM is crucial in securing the grid stability against unprecedented contingency events and thus, improving the performance of the grid by reducing the transmission line losses and enhancing the voltage profile. As revealed in Table 2, bus 30 of the IEEE 30-bus test system is the most vulnerable, followed by buses 26 and 29. A further investigation was conducted to determine the suitability and extent of each of these vulnerable buses to offer support in the emergence of contingency. A special attention was given to the first ranked two most vulnerable buses and was considered as a single candidate bus for STATCOM. Thereafter, a comprehensive analysis was assessed by combining two STATCOMs for the most two vulnerable buses—30 and 26. The assessment of three STATCOMs placement at the most ranked vulnerable buses had earlier been discussed in the Assessment of grid contingency support system section. The results from the analysis revealed that placement of STATCOM at bus 30 yielded best results as a single candidate STATCOM bus resulting in a reduction of 1.7493 MW and 6.8783 MVar for active and reactive power, respectively, at contingency. Similarly, placement of STATCOM at bus 26 yielded an active power and reactive reduction of 5.5728 MW and 16.1833 Mvar, respectively. Table 2 shows the comparative assessment of STATCOM placement in IEEE 30-bus test grid and their respective impact as a single, and double grid supports.
From the results obtained from Table 3, the maximum reduction of active power loss and voltage profile improvement was recorded when the candidate bus for STATCOMs are double (i.e. buses 30 and 26). However, in order to satisfy a cost-effective system while upholding the tenacity of the grid stability, a single STATCOM candidate at bus 30 is recommended for the overall improved system performance. Figure 12 depicts the voltage profile of the STATCOM placed as a single and double candidate at the vulnerable buses from Table 3.
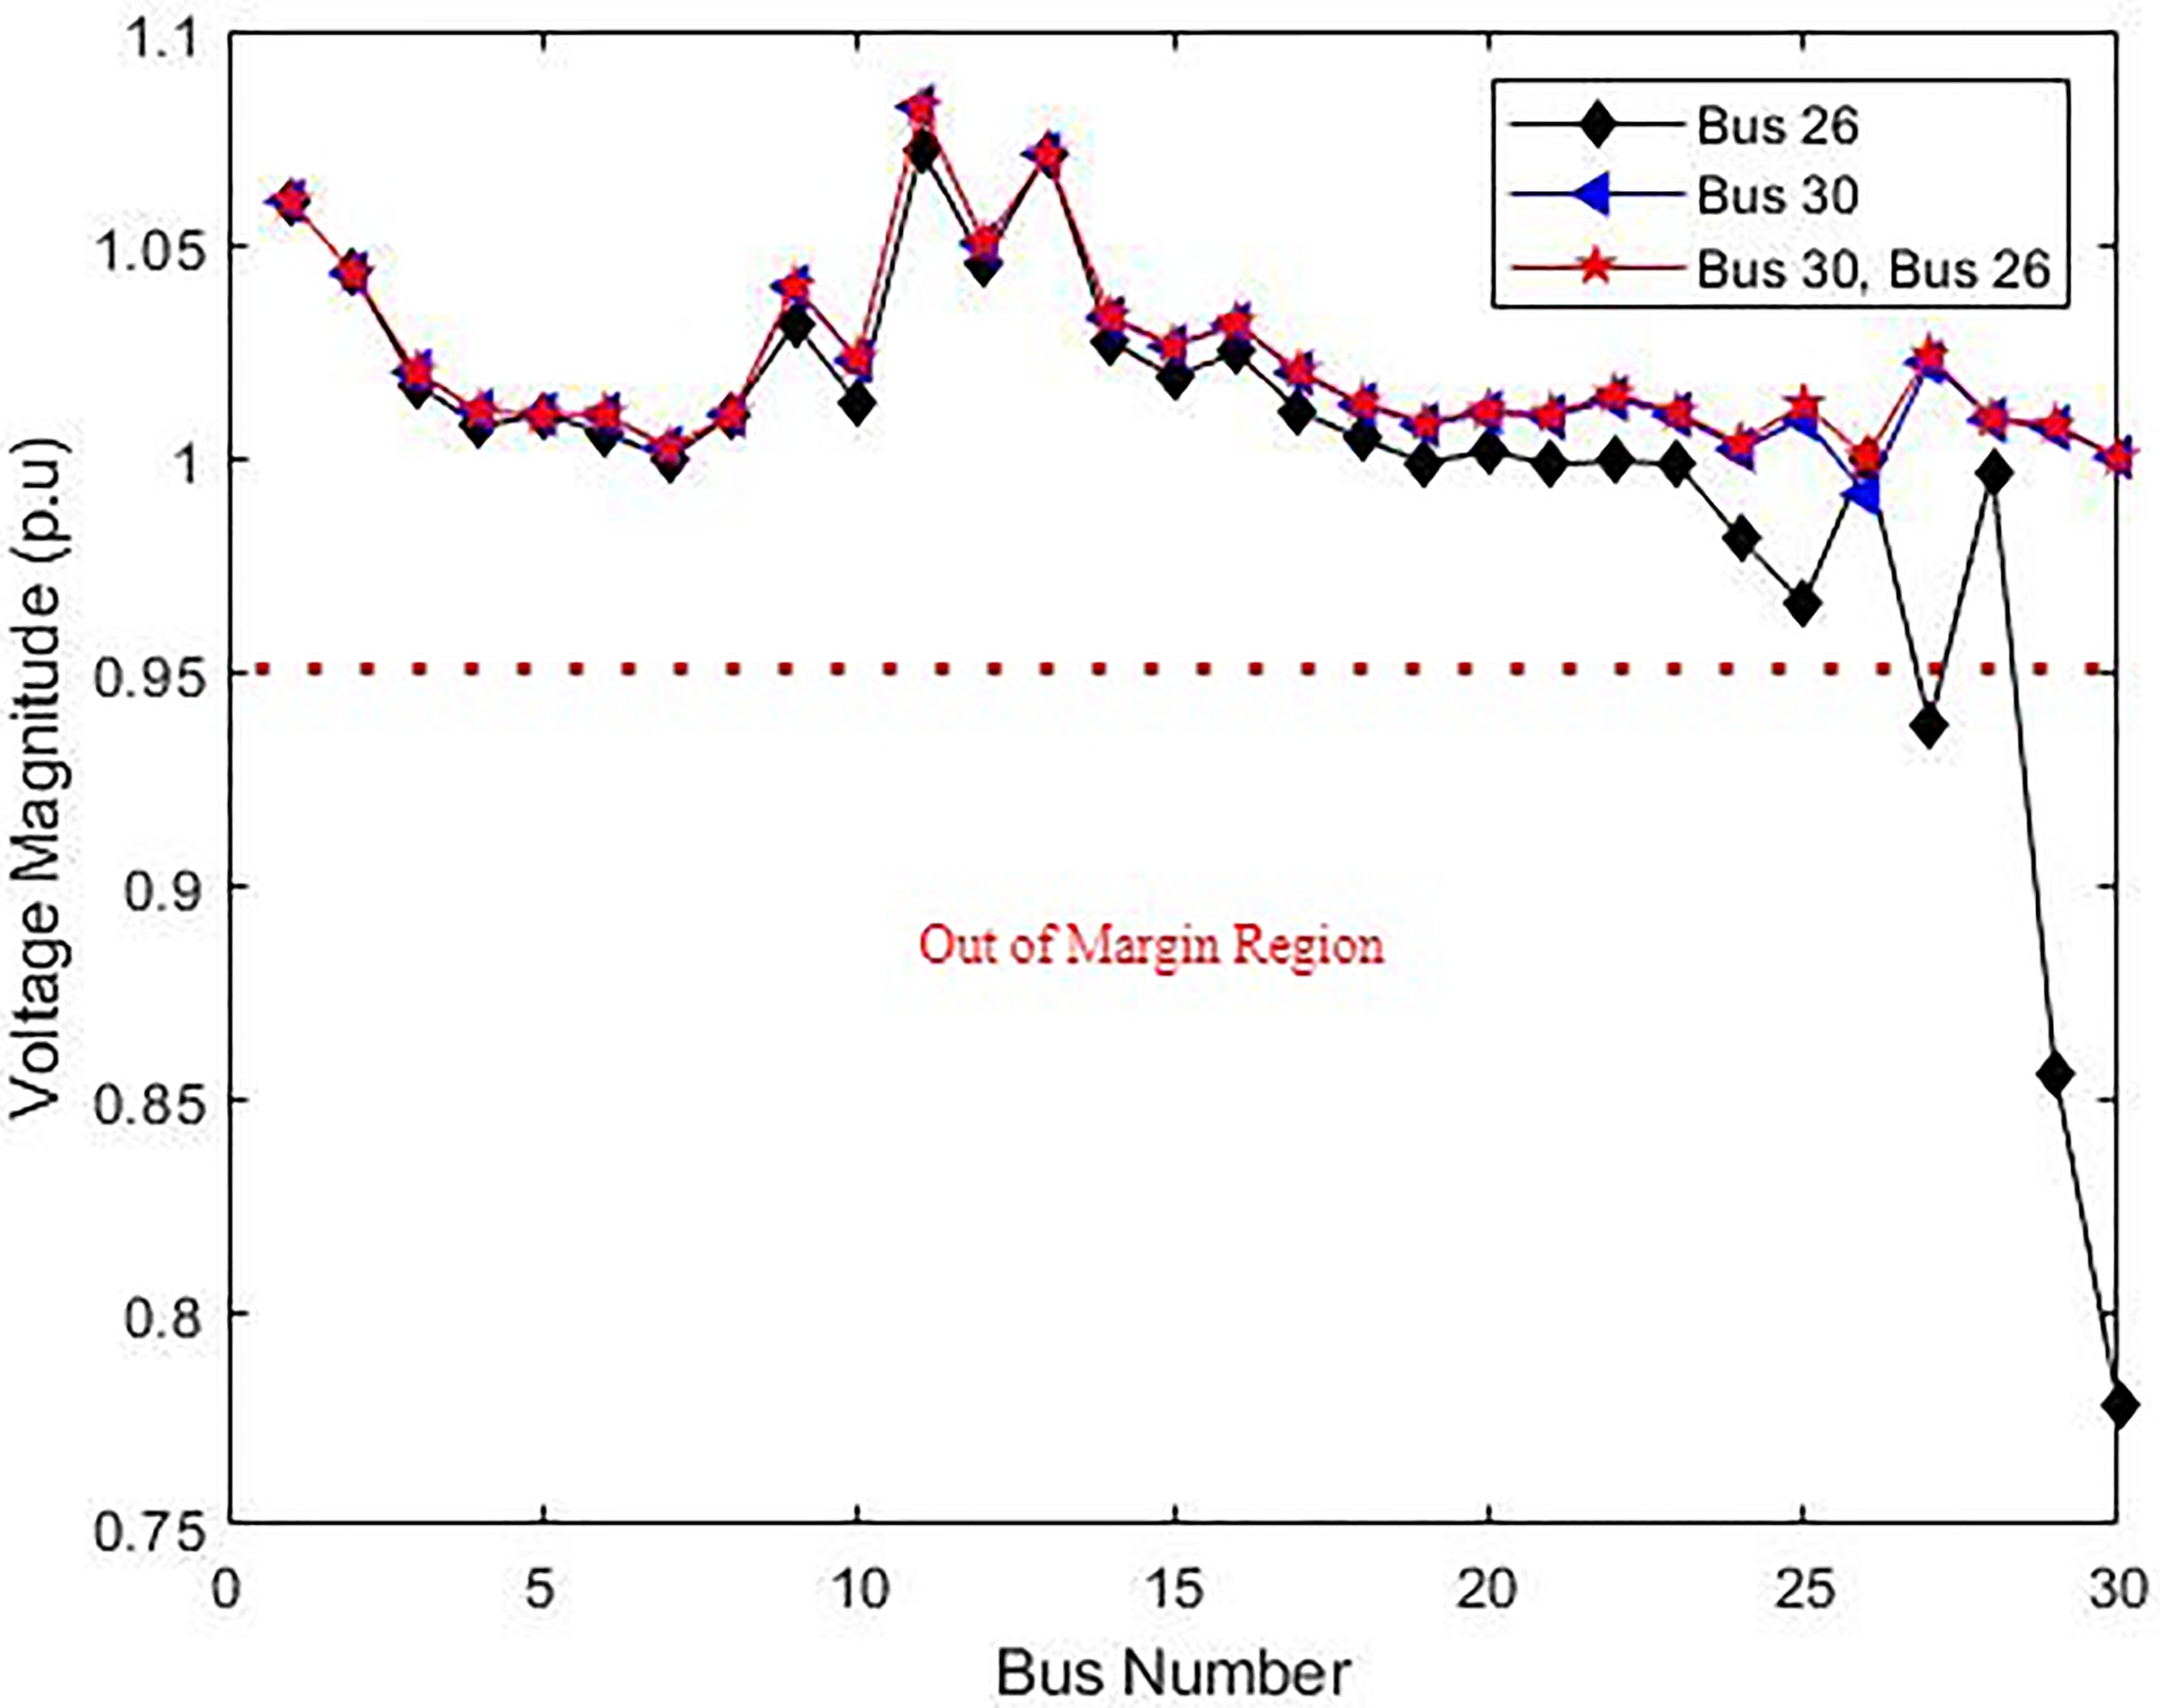
Voltage magnitude of STATCOMs allocation as a single and double contingency support at vulnerable buses.
Impact of STATCOM placement on transmission line loss reduction.
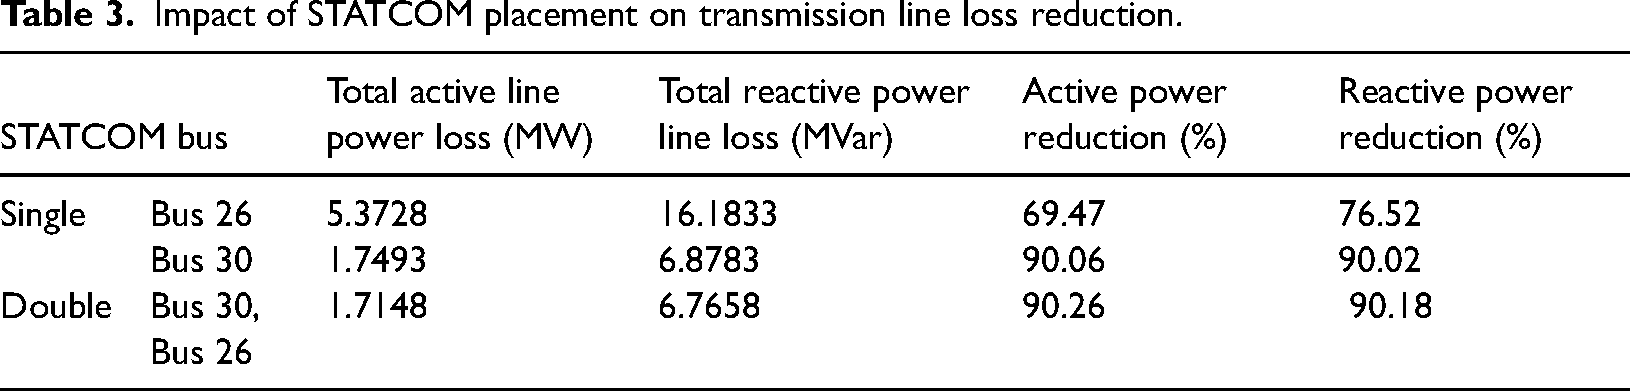
From Figure 12, it was observed that even after the placement of the STATCOM at bus 26, three buses’ voltage magnitude still falls outside the safe operating margin. The buses are 27, 29, and 30 with corresponding voltage magnitude of 0.937(p.u), 0.8554 (p.u), and 0.7776 (p.u), respectively. These buses are operating outside the safe margin for a stable power system at contingency. In summary, the highest level of voltage improvement and active power loss reduction was achieved when the STATCOM is placed at bus 30 as a single candidate bus.
Comparative analysis with extant literature on IEEE 30-bus system
There are a handful of published research articles focusing on grid stability in power network utilizing different methodologies for optimum siting of compensative devices. Maintaining grid stability is crucial in preventing grid collapse and efforts in finding the best approach are in top gear (Robak et al., 2017). Eissa et al. (2013) presented harmony search optimization to ascertain the optimum location and number of STATCOM for the overall improvement of the grid's voltage profile. The effectiveness of the proposed algorithm was validated with IEEE 30-bus test system. The results revealed that buses 26, 29, and 30 are the weak buses. However, further results from the analysis depict the best number of STATCOM is one and location is at bus 30 which is in consonance with the current research. Research by Ismail et al. (2020) utilized real power performance indicator (PI), voltage profile index (VPI) for the optimum siting of the STATCOM, the study suggested bus 26 for the minimum voltage deviation and the critical lines were said to be 10–20, 19–20, and 27–29. Similarly, Ladumor et al. (2017) suggested bus 28 for the optimal siting of STATCOM using gray wolf optimization algorithm. However, none of the presented literature considers power loss evaluation before and after the placement of STATCOM.
Meanwhile, a comprehensive analysis of different optimization algorithms that consider both optimum siting and active power reduction on IEEE 30-bus system is presented in Table 4.
Comparative assessment of STATCOM placement on IEEE 30-bus.
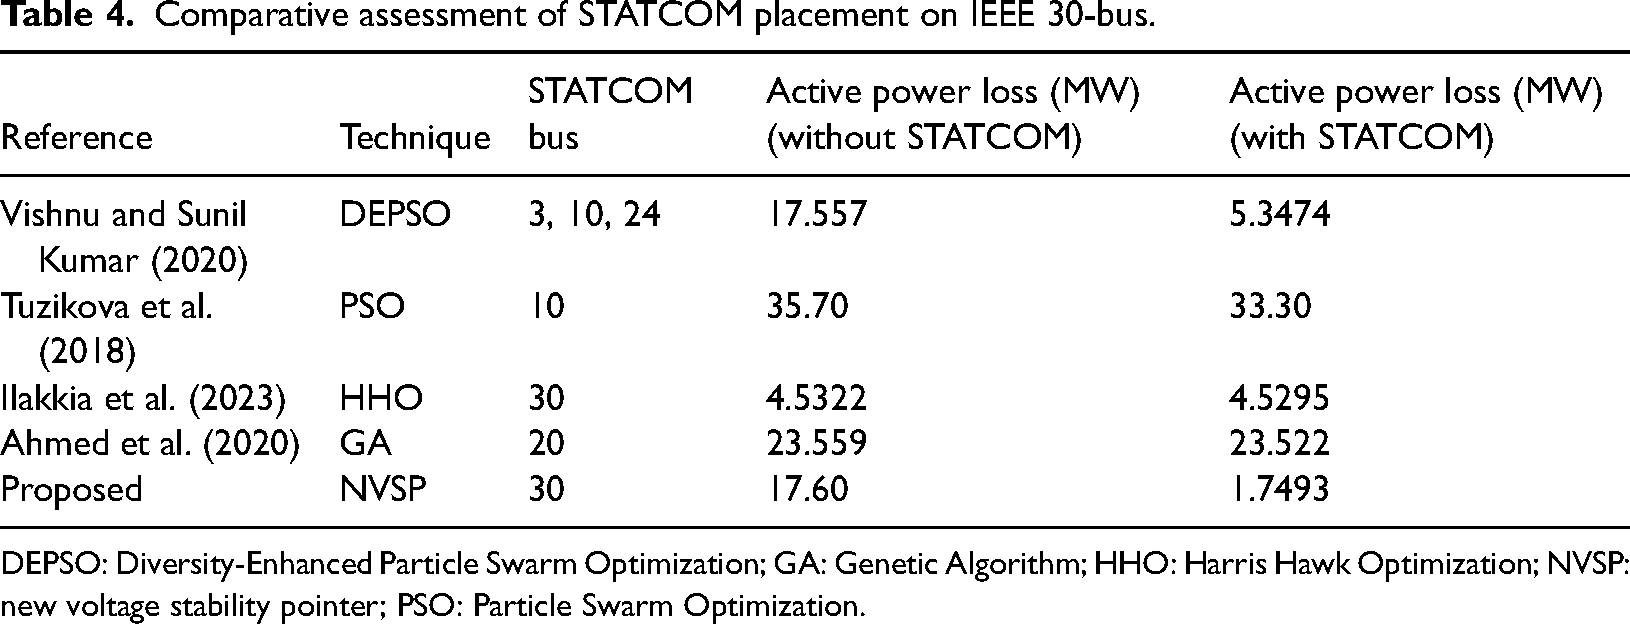
DEPSO: Diversity-Enhanced Particle Swarm Optimization; GA: Genetic Algorithm; HHO: Harris Hawk Optimization; NVSP: new voltage stability pointer; PSO: Particle Swarm Optimization.
It is evident from Table 4 that the proposed NVSP produced the minimum active power loss as a single STATCOM candidate for the IEEE 30-bus system. The active power loss obtained after the placement of STATCOM at bus 30 yielded 1.75 MW which is about 90% reduction.
Conclusion
This study has investigated the importance of STATCOM devices as a contingency support system for an improved overall grid performance. The results obtained from the IEEE 30-bus test data revealed that placement of STATCOMs as a contingency support system significantly reduced the active and reactive transmission power losses from 27.70 MW and 93. 98 MVar at contingency to 1.72 MW and 6.82 MVar, respectively. The effect of the multiple STATCOMs placement at buses 30, 26, and 29 during contingency has obtained a 90% reduction of transmission power line losses. Similarly, the voltage magnitude of the buses 30, 26, and 29 are 0.735 (p.u), 0.907 (p.u), and 0.817 (p.u), respectively, at contingency were improved to a minimum of 1.00 (p.u) for all buses after the placement of STATCOM. In furtherance, for a cost-effective management of the IEEE 30-bus test system, bus 30 is the preferred location as a single candidate STATCOM bus for minimal power loss and voltage deviation.
It was discovered that the contingency events increase the transmission line loss and hamper the stability of the voltage profile. Therefore, the effectiveness of contingency support system in a power network is of utmost importance for the improvement of the voltage profile and the reduction transmission line losses in the presence of disturbances resulting from contingency. This study concluded that the optimal placement of multiple STATCOMs as grid contingency support device have the potential to substantially improve the overall performance of the power grid.
Footnotes
Declaration of conflicting interests
The author(s) declared no potential conflicts of interest with respect to the research, authorship, and/or publication of this article.
Funding
The author(s) received no financial support for the research, authorship, and/or publication of this article.