
Abstract
This research reports the implementation of logarithmic mean Divisia index (LMDI) and categorizes the growth of total energy usage in three different industrial sectors for the years of 2010 to 2021. Furthermore, it classifies and evaluates the factors influencing on energy consumption in Punjab province thru a sustainable way. The growth consumption is classified into scale influence, structure influence, and efficiency influence. Likewise, the long-term energy alternatives planning-Punjab model is executed with the energy consumption, scale impact, structure impact, and efficiency impact. Besides, comprehensive adjustment scenarios are also introduced to examine the impact of three different factors on overall energy usage. The results from the qualitative decomposition of LMDI indicate that the high scale can lead to high-energy consumption in Punjab Province. However, it can be reduced by high-efficiency reinforcement. The total energy consumption in 2024, 2036, and 2044 under reference scenario is 304.12, 460.01, and 590.04 million tons compared to structure influence analysis for slow terminology (SIAS) and
Keywords
Introduction
At the present time, the energy is considered an imperative wave for every sector which is connected to national production and overall economic security. Therefore, numerous studies in the past have perceived the relationship between energy utilization and economic growth. Further, it also discovers dissimilar results for different economies in the world. During the historical review, Pakistan had imported energy and was mainly dependent on fossil fuels. Due to rising fossil fuel prices, the cost of imported oil (crude oil) is affecting Pakistan's economy. The growing supply and demand gap along with rising oil prices in the international markets also generates additional pressure on Pakistan's fragile electricity grid Abbas and Waqas, 2020 (Abbas et al., 2017a). Thus, to meet the growing demand in energy sector, the Government of Pakistan allocated a budget of $ 440 million for the fiscal year 2019–2020 for the development of the energy portfolio. Similarly, about 80% of the budget will be reserved for the production of energy from biomass, biogas, and solar to meet the demand for energy (Abbas and Waqas, 2020).
Veysset et al. (2010) stated a comprehensive study of four provinces and two autonomous territories in Pakistan (Punjab, Sindh, Khyber Pakhtunkhwa, and Balochistan; the Islamabad Capital Territory; and the administrative territories of Azad Jammu and Kashmir and Gilgit–Baltistan). Where, Punjab has several different features and fascinating opportunities such as growing economic development, faster transformation of the structure of three industries, inferior energy self-sufficiency, and a greater degree of external dependence (Veysset et al., 2010). It has also been studied that Punjab has the largest population of about 93 million inhabitants. Therefore, it is the largest consumer of electricity due to its larger industrial base. Moreover, it has also been studied that Punjab contributes 60% to Pakistan's gross domestic product (GDP). The growing demand for electricity creates an opportunity to invest in the energy sectors. In addition, Punjab province is very reluctant in terms of technology and energy management as a major energy consuming province. So, the poor energy management creates many environmental issues and disasters for human health in the society (Peng et al., 2022). Hence, it is essential to discover some comprehensive measures to reduce energy consumption and increase energy usage in the province. Immense studies have identified drivers that affect energy consumption and have measured the reduction of energy savings in one or several sectors using the long-term energy alternative planning (LEAP) model and the breakdown of logarithmic mean Divisia index (LMDI) (Chen et al., 2018).
The LMDI is a widely used method for decomposing energy that tracks the relative contributions of various factors which develops some fluctuations in energy consumption, energy concentration, and the environment. Currently, many research scholars have paid more attention to do energy use deterioration analysis, and several approaches are known as exponential separation or LMDI (Ang, 2005). The researchers have analyzed and highlighted four main categories such as hypothetical basis, universality, consistency, and discussions of results. They have described in detail that the LMDI approach presents a better solution and prediction due to its properties of complete separation. But contemporary, the decomposition of energy consumption in LMDI focuses chiefly on the qualitative level, which has no in-depth quantifiable study of the various decomposition influences on future energy consumption. Similarly, the LEAP model has been widely used as a model of quantitative analysis of energy consumption, economic policies, and environmental emissions. Furthermore, it is used to predict electricity demand and affordability in recent years in the world scenario Abbas and Waqas, 2020 (Abbas et al., 2017b). Thus, the energy economics is the field that studies the human use of energy resources and energy commodities. Further, it explores the consequences of the world's energy use. Therefore, an energy-economic model is discussed to simulate the energy-economy interactions and consumption in the society. This is used to analyze energy strategies, challenges and its appropriate implications in developing countries like Pakistan. The model consists of multiple sub-models (e.g. LEAP, LMDI, visual model, and empirical model) of energy supply/demand for coal, renewable resources, and electricity linked to a macroeconomic model (Lotfi et al., 2021a; Lotfi et al., 2022ba; Lotfi et al., 2022bb).
The main objective of this research is to implement the LMDI technique-based LEAP model to discover the factors that affecting energy consumption in the Punjab province and to understand their influence ability. The sub-objectives of this study are given below;
Investigation of energy consumption forecast using Punjab LEAP model based on LMDI approach among the years of 2020 to 2040 under medium-term development framework (MTDF). Investigation of economic analysis to examine the financial ups and downs using the LMDI technique-based LEAP model in order to reduce the additional expenditures and times with the present value factor. Evaluation of environmental impacts on the energy consumption growth rate processes for long-term actions. Optimization of LEAP-LMDI models and determination of operating parameters for the desired energy decomposition for application of industrial sectors.
Thus, the major changes are analyzed in energy consumption for MTDF of (2020–2044) years under the reference scenario (RS) and two inclusive analysis scenarios (Pinjari and Bhat, 2021). In the low-demand scenario, the total energy consumption in 2024, 2036, and 2044 is 178.25, 280.15, and 420.5 million tons of equivalent coal respectively. More, in the high-demand scenario, the values are 200.52, 300.12, and 680.05 million tons of equivalent coal, respectively. The combination of qualitative and quantitative results in this work has played a very important and substantial role for the various functional departments of the provincial and municipal governments to formulate future energy development policies (Mat Daut et al., 2017).
This manuscript comprises the different sections such as introduction, literature review, methodology, discussions, and outcomes of the study. In the introduction part, the background of study, importance of energy consumption, and economic analysis has been discussed for different regions. In addition, comprehensive literature review regarding different substitution models such as LEAP model, LMDI models, and green house emission analysis models are presented computationally. The evaluation/assessment of study is performed in order to predict the energy consumption, emission analysis, and economic security analysis. In methodology section, the data collection, description of LEAP model based on LMDI method, gray system model (GSM), and LEAP-Punjab model have been discussed extensively. In outcomes/results section, the LMDI decomposition method, LEAP-Punjab model, and economic analysis are conferred with quantitative, qualitative, and graphical approaches.
Literature review
The relevant discussions establishing the nexus between LEAP-Punjab model & LMDI method and economic analysis have been an area of scholarly contributions among researchers and economists in the last few decades. For example, Goli et al. (2022a) proposed a mathematical model and solution method to optimize the supply chain for organ transplants under shipment timing uncertainty. For the location, allocation, and distribution of organ transplant centers, a possibilistic programming model and simulation-based solution approach (Wang et al., 2022) were created. The proposed mathematical approach reduced overall costs by taking into account the fuzzy uncertainty of organ demand and transportation time.
Similarly, Goli and Mohammadi (2022) proposed a unique approach to determine supply chain performance based on its sustainable energy strategies. This method included a balanced scorecard, path analysis and a hybrid Shapley value and Multimoora method for the appropriate and sustainable energy consumption. The main contribution of this research was the development of an intelligent performance evaluation system for various supply chains. Goli et al. (2023) concurrently examined and investigated the optimization of non-permutation flow-shop scheduling challenges and lot-sizing. Using modified innovative meta-heuristic algorithms, they first investigated the energy awareness of non-permutation flow-shop scheduling and lot-sizing. Goli et al. (2019) proposed two-objective approach (minimizing risk and maximizing return) mathematical model is concerned with the influence of investment, reliability, and permissible missed sales on the designed product portfolio. Due to the return uncertainty, two robust counterpart models were constructed based on the Bertsimas and Sim and Ben-Tal and Nemirovski approaches. Then, to reduce the time required to solve the robust model, an exact solution approach was proposed. Goli et al. (2021) projected dairy product demand in order to investigate dairy product supply and demand. Initially, a set of economic and social factors that appeared to be effective in predicting demand for dairy products was established (Goli et al., 2021). The ineffective indices were then excluded using the Pearson correlation coefficient, and statistically significant factors were identified. Tavakkoli-Moghaddam et al. (2012) stated that the uncertain integrated model was tremendous for simultaneously establishing temporary health centers in afflicted areas, allocating affected areas to these centers, and routing to transport their required good. The health centers could be established in one of the affected areas or in a location outside of them. Thus, the proposed model provides the optimum relief operation policy when it is able to supply products to affected areas (which are clients of goods) directly or through coverage (Alinaghian and Goli, 2017).
Khatri et al. (2023) developed a novel solution approach for two-echelon distribution system employing electric vehicles. The essential products were transported from a central storage to satellite stations at the first level. These products were provided to various clients at the second level (Goli et al., 2022b). Likewise, the study investigated the impact of climate change and energy policies on the Australia's future energy system. All the scenarios were created to reflect climate variability and change consequences and policy choices, which were then analyzed using the long-term energy alternative and planning system from 2010 to 2050 (Emodi et al., 2019). Many of the researchers have already contributed and studied the impact of economic variables on carbon emissions from China's metallurgical industry by using energy structure, energy intensity, carbon intensity, industrial structure, and labor productivity. The study further analyzed the carbon dioxide emissions within a range of quantile models framework (Benjamin and Lin, 2020). In another study, researchers examined the concerns by evaluating Bangladesh's energy sector's historical CO2 emissions from 1979 to 2018. The LMDI approach was used to analyze three different scenarios for future emissions (Hasan and Chongbo, 2020). Huang et al. (2019) suggested the use of long-range energy alternatives planning model framework, which is considered a city-level energy consumption and greenhouse gas emission analysis model (Huang et al., 2019). Hussain et al. (2021) proposed a regional power-generation system for the United Kingdom (GB) using the LEAP model (2016 to 2050) to explore future clean pathways. The model provided the understanding of planning and operational implications for futuristic variable renewable energies and best available technologies (Hussain et al., 2021). From 2005 to 2015, (Li et al., 2018) investigated the spatial pattern evolution of transport carbon emissions in China. Yang et al. (2021) established a LEAP-Zhang model to examine the environmental and socioeconomic effects of renewable energy development in Zhangjiakou by projecting energy consumption and associated greenhouse gas emissions by various sectors over the 2016–2050 period (Yang et al., 2021). The researchers proposed a novel approach for renewable energy in a particular case study. The proposed model suggested a data driven robust optimization for multi-objective renewable location by considering the risk (Data Driven Robust Optimization for Multi Objective Renewable Location by Considering the Risk, DDROMORELR). They considered risk by adding the minimum function in the energy profit objectives (Lotfi et al., 2022). Reza Lotfi et al. (2018) conducted a research work related to budget constraints consideration which is considered for the first time in wind energy project. They conducted this study for Khorasan provinces of Iran. The proposed study is mainly based on the regional and municipal data pertaining to the year of 2016 and used fuzzy approach for the order of the preference by similarity of ideal solution in order to deal with the uncertainty of the data (Lotfi et al., 2018). In another survey, they indicated that the resilience and sustainable SCND by considering renewable energy (RSSCNDRE) for the first time was prosperous under different climate. A double-stage new robust stochastic optimization is embedded for RSSCNDRE. Reza Lotfi et al. (2021) presented the vital innovation which consisted of applying the robust bi-level programming approach and game theory for renewable energy location sites. They used robust stochastic approach is implemented for the robustification of the model against variation and uncertain conditions (Lotfi et al., 2021b). The scholars presented a Resource-Constrained Time-Cost Quality-Energy-Environment Trade of Problem by considering BCT, Risk and Robustness (RCTCQEETPBCTRR) in project scheduling. They utilized hybrid robust stochastic programming, worst case and conditional value at risk in order to cope with uncertainty and risks. Reza Lotfi et al. (2023) suggested a robust, resilience MCDM with risk approach for renewable energy location. They proposed a novel risk approach by adding a risk function in MCDM. This risk approach is mainly used to tackle the uncertainties of the model for the real world. The comparison study was conducted the RRMCDMR issues in a wind farm location in the Iran with different risk coefficient function. The researchers investigated the account of sustainability pillars in scheduling projects and uncertainties in modeling study. The robust nonlinear programming involving the objectives of the cost, quality, energy, and pollution level was applied in order to model the study problem. Abbas et al. (2021) presented a novel kind of robust optimization with stochastic approach in order to tackle uncertainties in CCFL and compared it with the stochastic CCFL (Abbas et al., 2021). The objective of this work is to include function which maximizes the mean and minimum profits coefficient under various scenarios by adding an energy-aware constraint. Table 1 listed some of the major literature review conducted by researchers using different renewable approaches.
Some of the major literature studies conducted by other researchers.
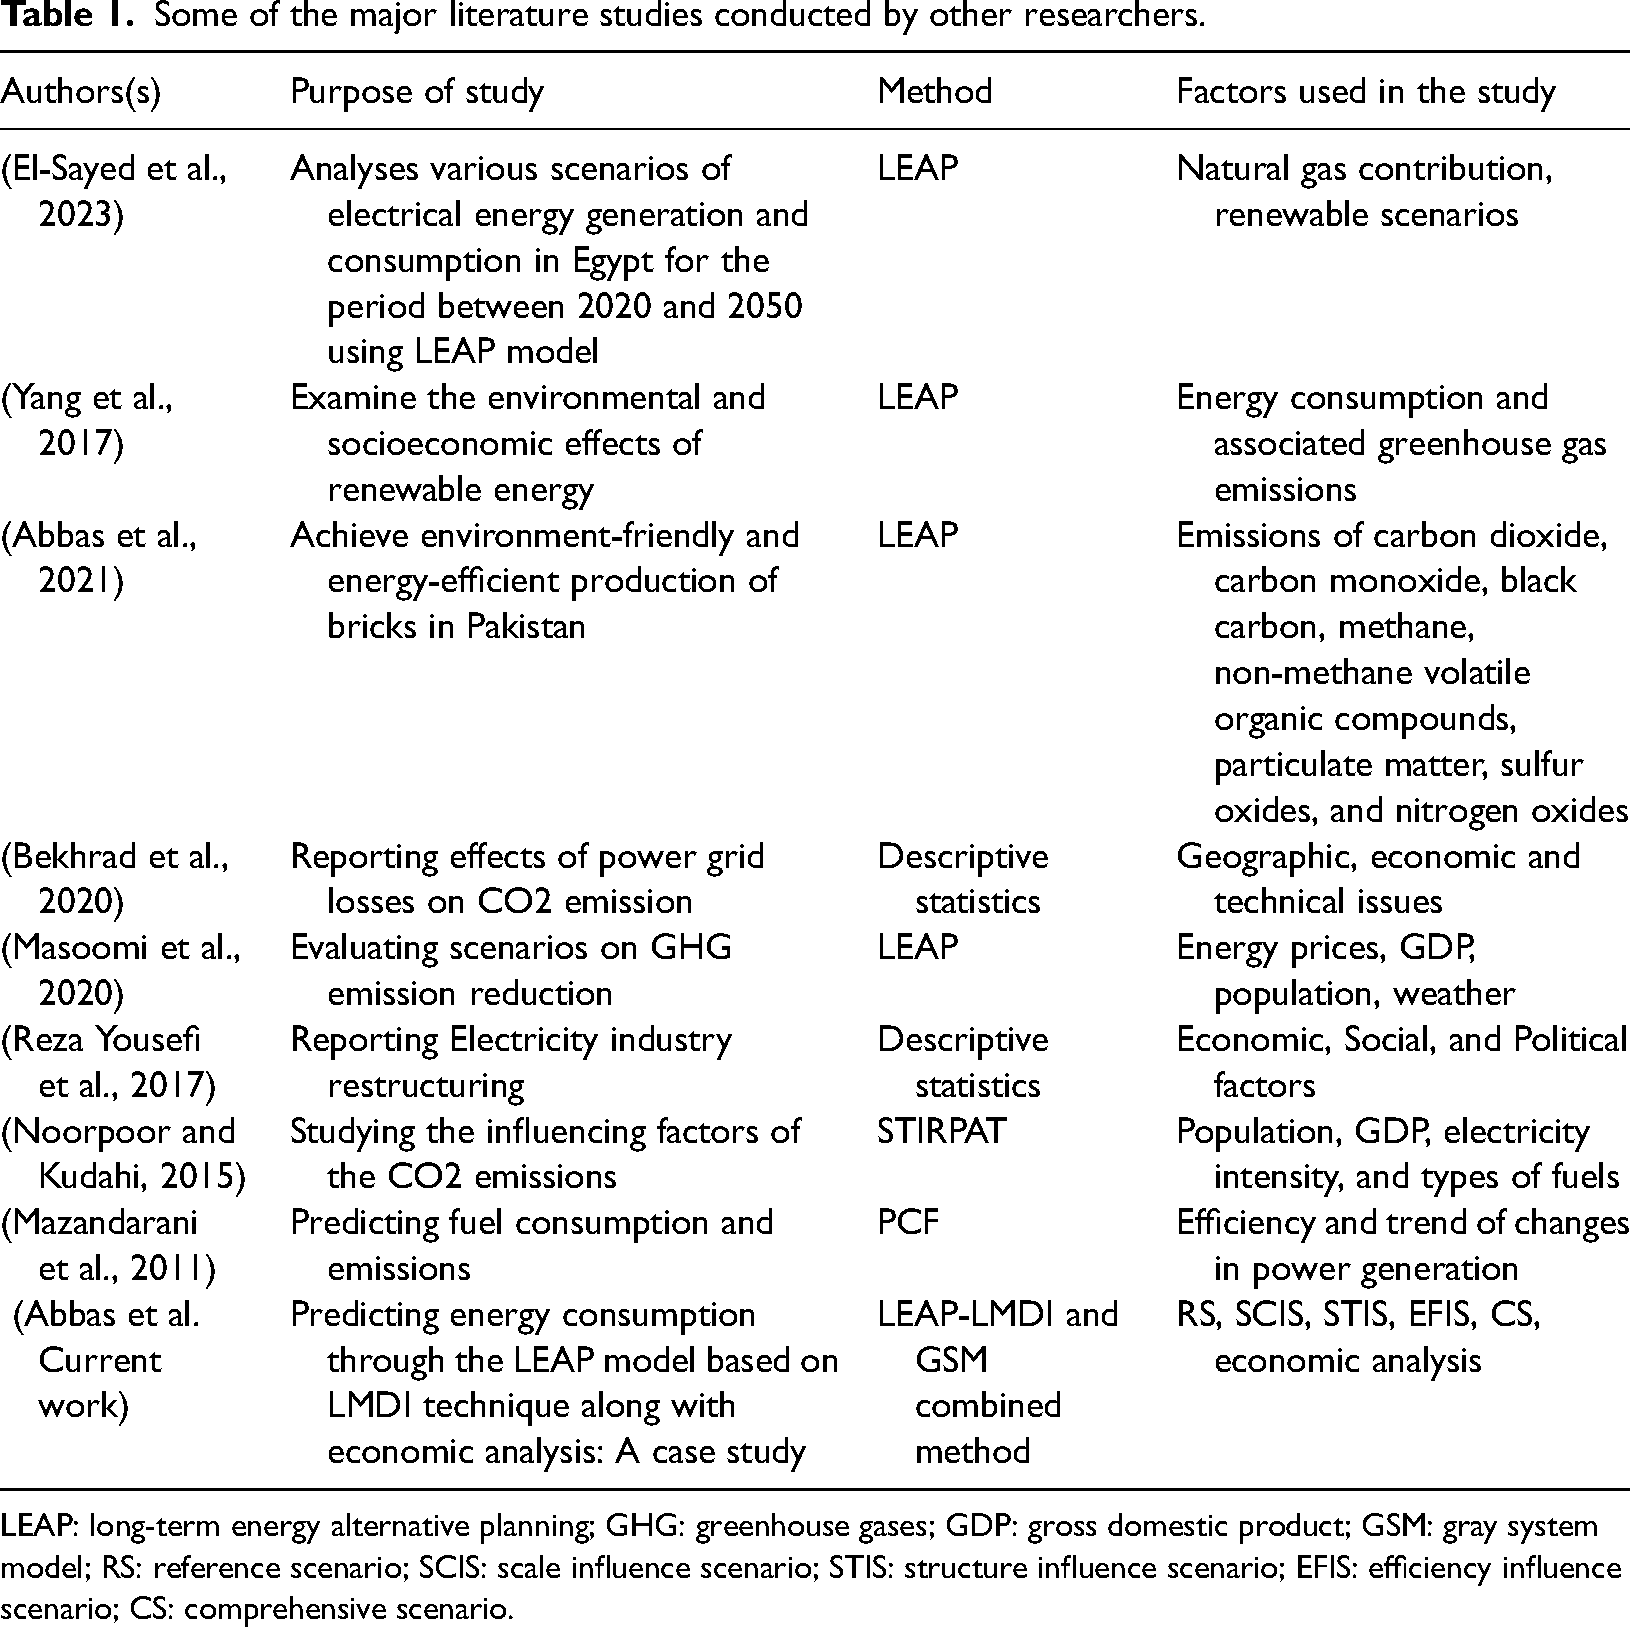
LEAP: long-term energy alternative planning; GHG: greenhouse gases; GDP: gross domestic product; GSM: gray system model; RS: reference scenario; SCIS: scale influence scenario; STIS: structure influence scenario; EFIS: efficiency influence scenario; CS: comprehensive scenario.
In contrast to this extensive literature, very few studies have been conducted on predicting the energy consumption. Meanwhile, the conducted studies on economic analysis were also minimal. Most of the solely focused on reporting the energy consumption and environmental analysis based on descriptive statistics or predicting their future level using different models such as PCF. In addition, the present literature review revealed no comprehensive study on energy consumption and economic analysis for Punjab province of Pakistan. There are various studies regarding the energy consumption forecasting, some are at small scale for distribution level, and some are at large scale for energy generation. Thus, its transmission requires extensive power planning along with its economic anticipation impacts. The discussed methodology can be used for forecasting the power consumption. However, those are evaluated by comparing the economic benefits and incremental cost for economic development. The obtainable results will not only provide the feasibility of current options but also lead to sustainable alternatives that are commercially feasible (Qian et al., 2020). Conversely, the financial benefits cannot be totally quantifiable (Li et al., 2018). Since, this is the demand and consumption side therefore the financial and economic benefits can be measured through electricity meter. The prime benefits that can easily be identified are the savings on the electricity bills. The energy saving elements can be segregated such as energy usage time, demand management, and cost efficiency. The proposed algorithm can be used to optimize the energy supply and contracted supplies based on the load profile of the consumers (Collignon and van Gijzen, 2010). This work provides a dynamic approach to quantify the economics that are helpful for evaluating the commercial feasibility of the proposed methodology.
The majority of the simulation models have not considered two important energy patterns that are necessary if an unbiased and consistent analysis is to be obtained; energy models are the LEAP-LMDI method and the GSM. The gaps between this current study and previous ones are in many ways. First, it reveals what will be the long-term effect of the energy policies/schemes of the government of Pakistan on the use of renewable energy sources for sustainability towards enriched alternative sources. Second, it evaluates both favorable and productive assumptions for Punjab province under the MTDF (e.g. 2020 to 2040). In addition, it examined the relationship between the LEAP-LMDI method (including scenario-based factors) and energy consumption by adopting the growth hypothesis. Also, there is no record of this analysis being conducted in the regions of Punjab province between the time periods of 2010–2021.
Methodology
Data collection
In this paper, the model is used for annual final energy consumption by different categories, (e.g. total GDP and industrial sector with factor costs in billions and energy prices in $/kg) and to predict the impact of factors for the period 2020 to 2040 (El-Sayed et al., 2023). The detail records have been collected from different sources such as ministry of energy, power division of Pakistan, and alternative energy development board of Pakistan (Ma et al., 2018). Furthermore, this current model uses other variables such as GDP, crude oil prices, and the cost of producing thermal-based electricity for the period of 2021–2030 for long-term forecasts as given in Table 2.
Information on the collection of energy consumption data for the forecast period for the province of Punjab.
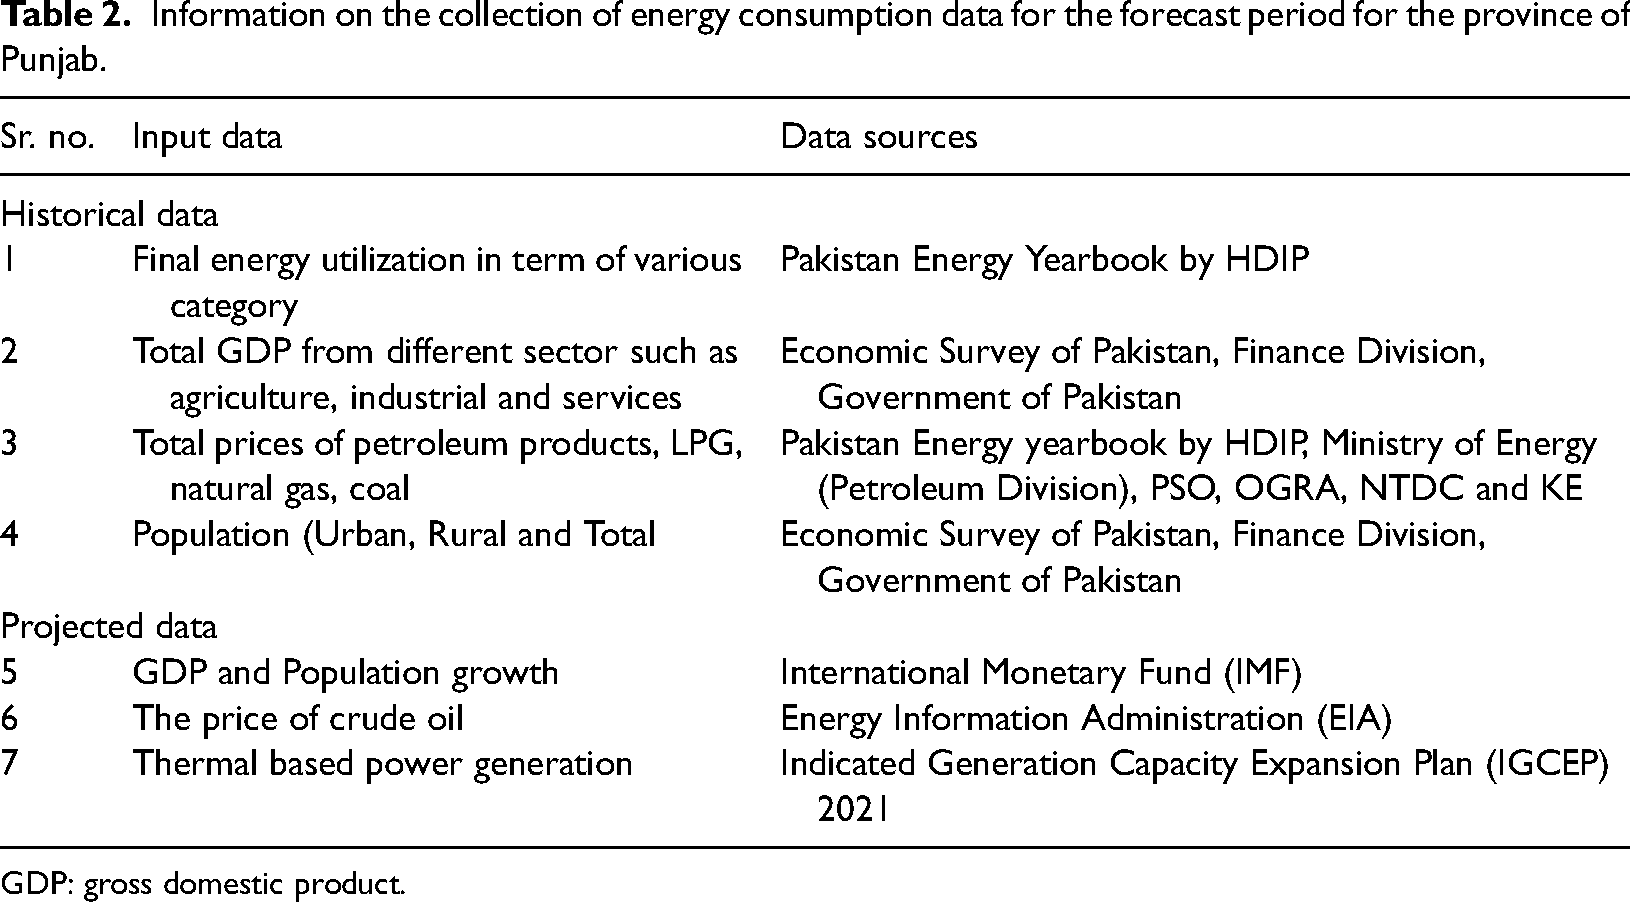
GDP: gross domestic product.
LEAP model based on LMDI method
This work investigates the characteristics and features that affecting energy consumption in Punjab Pakistan using data for the period of 2020 to 2040. The study is limited to the energy sectors due to its well-embedded data of energy for the easier creation of each sector to assess the impact of industrial reorganization as shown in Figure 1.
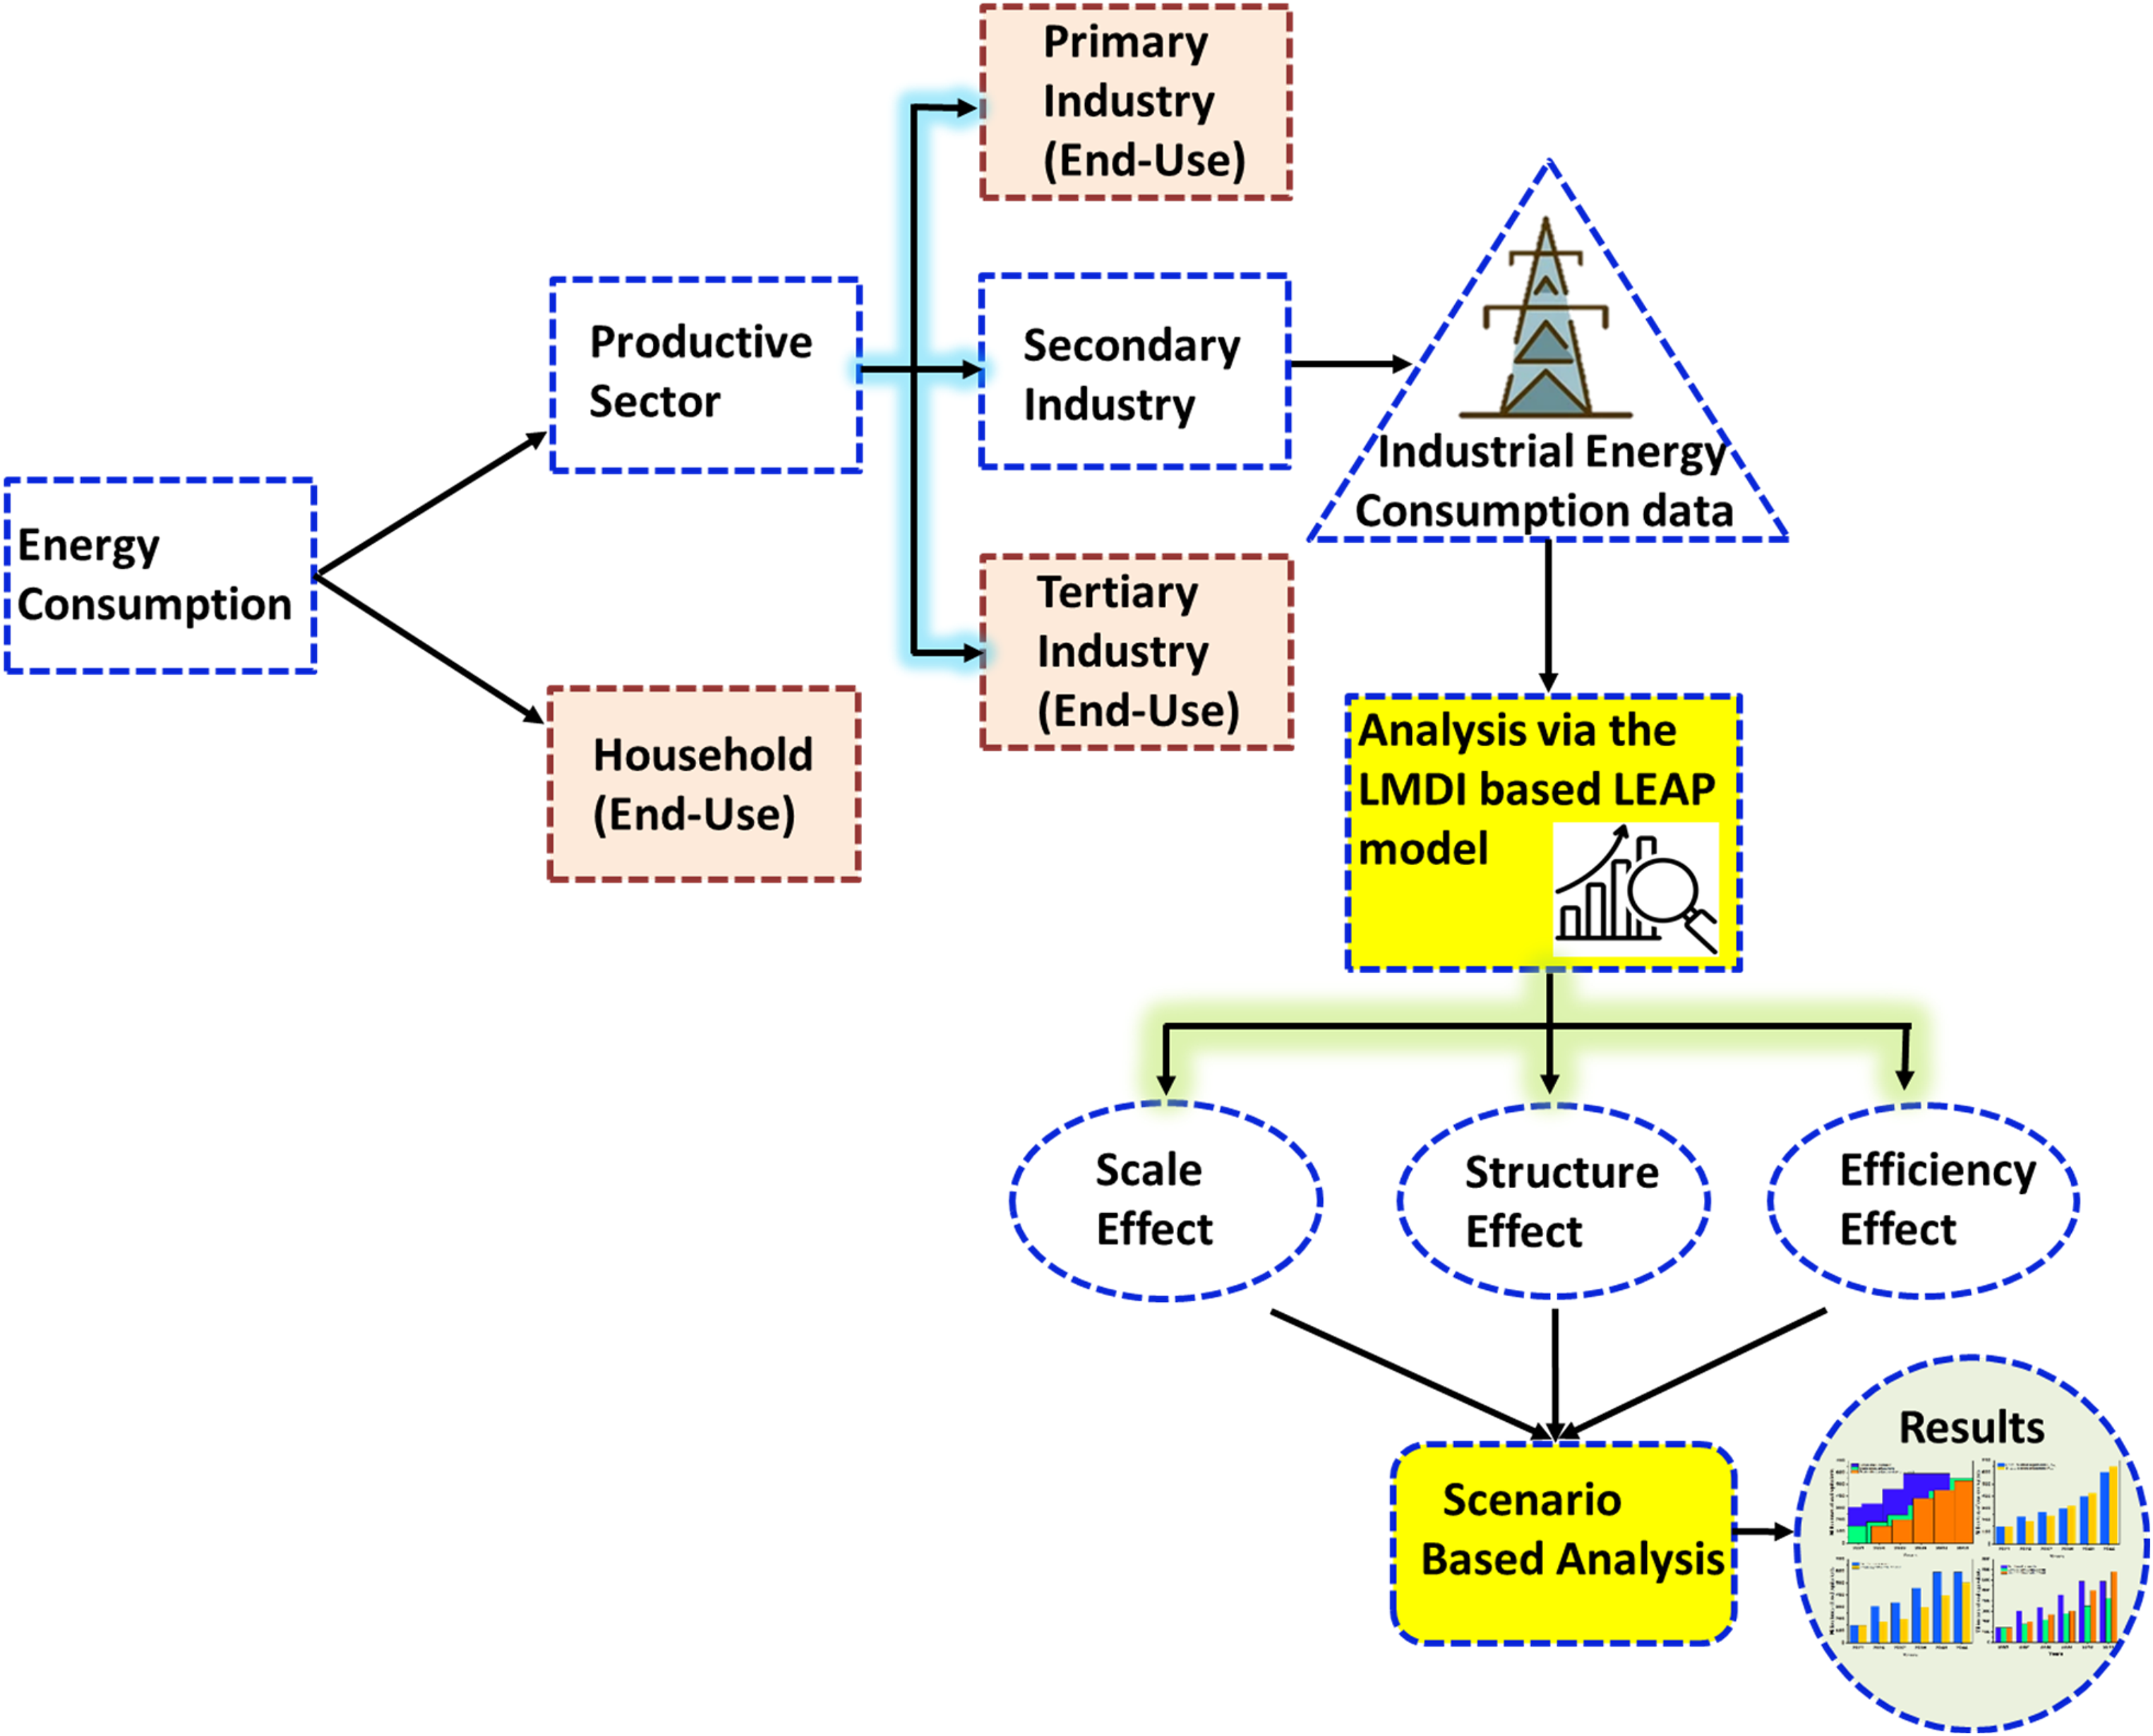
Process flow chart of different energy consumption sectors.
The chief analysis approach espoused is the LEAP model based on the LMDI technique, which uses the Divisia index and the weighted logarithmic mean value to crumble energy utilization. It also has the benefit of not leaving any residual results after decomposition. Moreover, the proposed approach is known to be better compared to the other approach in terms of its analytical basis and applicability, as well as ease in evaluating the results (Abbas et al., 2021). It is recommended to bring variations in industrial energy utilization, which can be deliberated by determining the influence of variations on three different elements: total sectorial activity (scale influence), activity combination (structure influence), and sectorial energy concentration (efficiency influence). The cumulative sub-category is the energy sector which is given in equation (1).
Additive decomposition


While Q is equal to the GDP of the t year; ET is equal to industries energy consumption; QT is added value for the ith of the industry in the “t” year; ET is equal to the energy consumption for the ith of the industry in the t year. In the same way,
Gray system model
The GSM is applied worldwide to predict uncertainty of a constructive system. The key function of GSM is to bridge the interdisciplinary gap across various specialized fields. The reported applications include judicial system, traffic, management, sports, military affairs, meteorology, ecology, economy, environment, and material science (Wu et al., 2023).
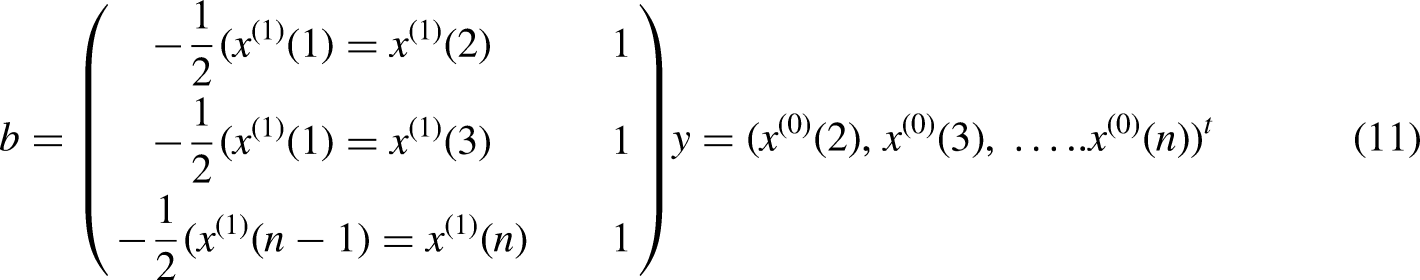
In gray system theory, the gray differential model (GM) is established using a set of differential equations. This research work uses GDP time series-based GSM to predict future GDP of MTDF from 2010 to 202, in order to establish the LEAP-Punjab model. The assumed model is created according to the differential formulas as given in the equations (5–11) as follows (Ortega-Ruiz et al., 2020):


Differential equation after x(l) discretization: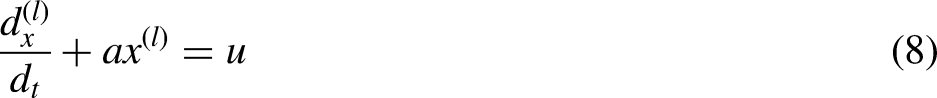


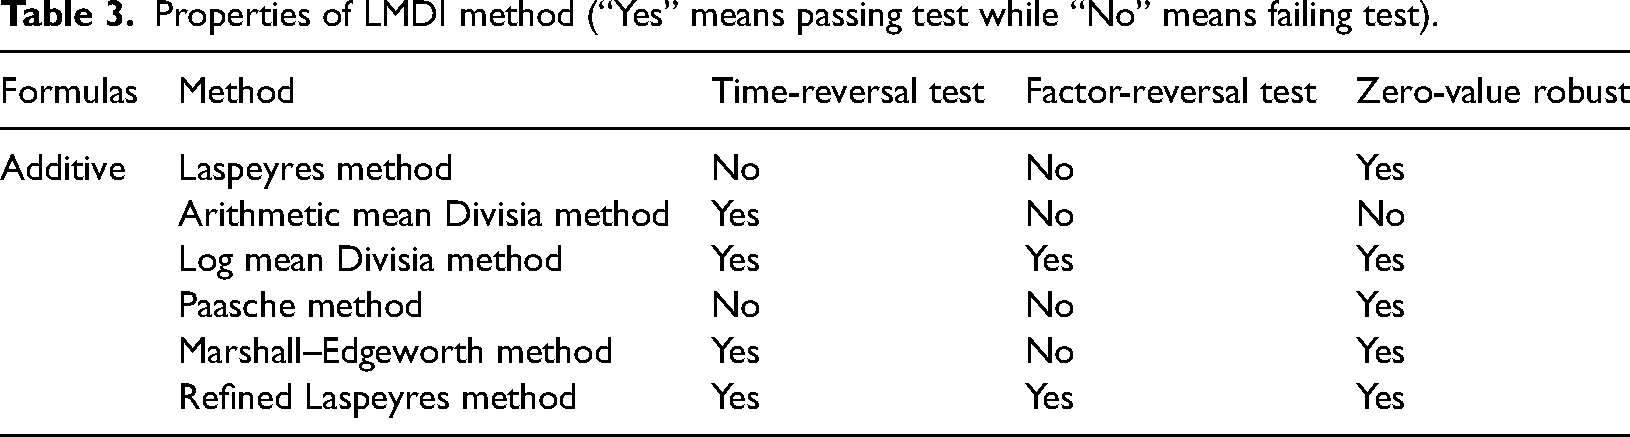
Properties of LMDI method (“Yes” means passing test while “No” means failing test).
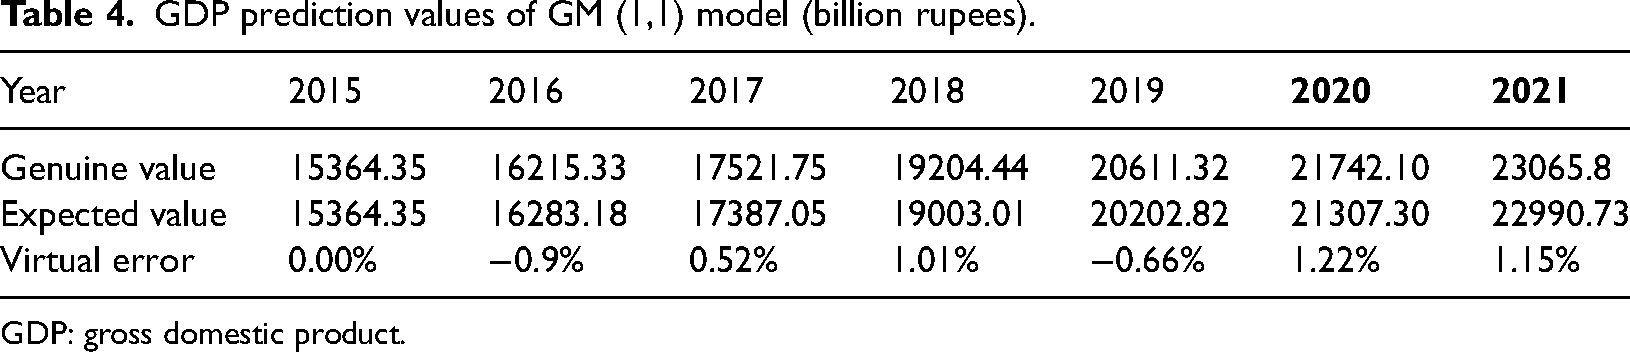
GDP prediction values of GM (1,1) model (billion rupees).
GDP: gross domestic product.
LEAP-Punjab model
Model configurations
In LEAP-Punjab model, year 2021 is treated as a base year to predict energy consumption from 2020 to 2044 in viewpoints of the scenario settings, with four parts of energy consumption department, that is, primary, secondary (industry, construction), tertiary industry, and local life.
Computing procedure
The product of industry added value and population etc. (Departmental activity level) is equal to the total energy demand of three chosen industries in Punjab Province. The total energy demand for primary industry equals the consistent energy intensity multiplied with sum-up value of primary industry, including same secondary and tertiary industry (Wang et al., 2019). However, the energy consumed in residential zone, this departmental activity level is equal to the total residents of the province, where the energy intensity is defined as energy consumption per capita. The detailed formulas of the energy prerequisite in the LEAP-Punjab model are as follows in equations (12 and 13) (Liao et al., 2019):

Scenario-based setting
As can be seen from the decomposition results of the LMDI method, the growth rate of GDP, the structure of primary, secondary and tertiary industries are favorable for many MSW producing sectors around the world. The results exhibited that decomposition energy intensity reflects the impact of efficiency influence, scale influence, and structure influence on energy expenditure. Therefore, the LEAP-Punjab model, when combined with these results, can be established upon scenario analysis including formation of RS and adjustment scenario of comprehensive, efficiency, scale, and structure influences (Chen et al., 2018). The detailed study of these influence and their influences on energy consumption can help in providing a better control on future energy demand and associated changes in Punjab province.
(1)
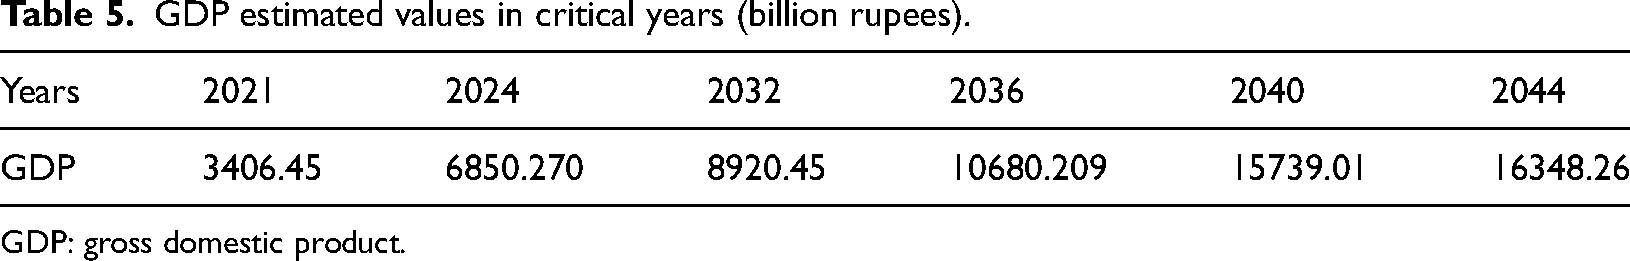
RS provides more recognizable information on how other scenarios influence the overall influence, where the population growth is assumed to be equal to the average annual growth rate, that is, 3.7% of MTDF in Punjab province. However, the structure of industries remains the same as 16.6:45.05:38.35 in year 2021 (Abbas et al., 2021). The gray theory or gray system predicts the GDP data of the subsequent 20 years based on GDP data obtained from years 2010–2021, revealing that error between obtained value and actual value is measured only −0.67% for year 2021. The GDP values of main years are presented in Table 5.
GDP estimated values in critical years (billion rupees).
GDP: gross domestic product.
The statistical report of national socioeconomic development, which is published in 2021 (Punjab Province) exhibits of 2680.67 billion rupees data as actual value and 2735.790 billion rupees data as forecasted value with 1.65% error only. Thus, gray model is a reliable system to calculate future GDP data. The rate of change of energy intensity for primary, secondary, and tertiary industries as well as domestic life regions are inferred as – 1.3%, −1.9%, −2.2%, and 5.5%, respectively, as per the growth trend of the selected years.
(2) (3)
The GDP growth rate reflects the influence of scale influence on the total energy utilization in Punjab Province. Since the gray model predicts 8.3% average annual GDP growth rate, so 7.4% and 9.5% as different annual GDP rates are subjected to comparison (Abbas and Waqas, 2020). Where, the targeted national socioeconomic development value for Punjab Province is 7.7% in the MTDF, while the actual value for MTDF is 9.3%. Setting the base value as forecasted GDP value of the year 2021 and while using 7.4% and 9.5% as growth rates then GDP values for the selected years are evaluated. Similarly, by keeping other parameters steady with the RS to obtain proper predicted values as presented in Table 6.
GDP estimated values in critical years under different scale influences (billion rupees).
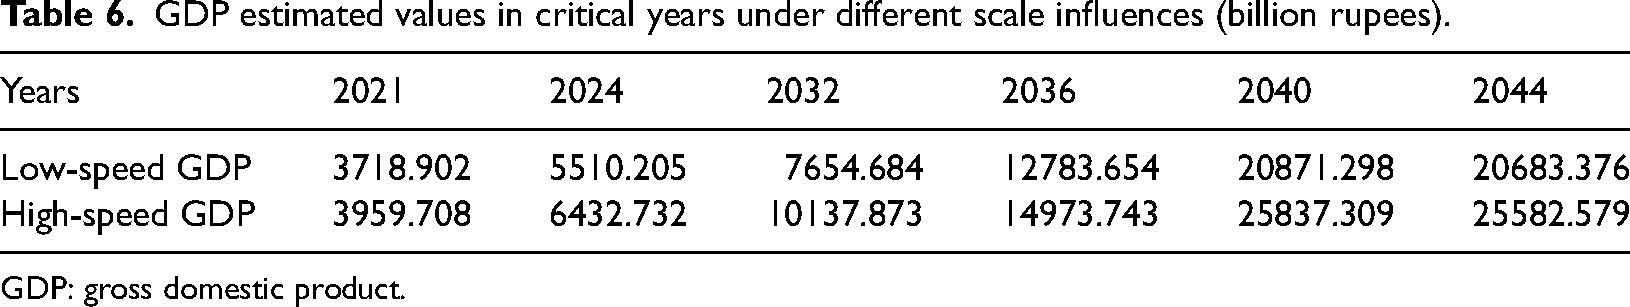
GDP: gross domestic product.
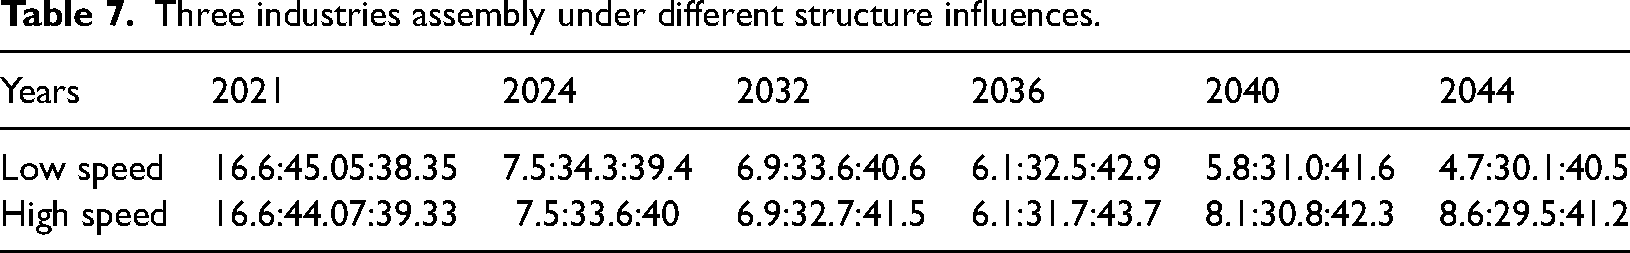
Structure influence is the influence of industry on the entire influence. With the objective of studying the structure influence, according to the change situation of the primary, secondary, and tertiary industrial structures of 2021–2044 in Punjab Province, together with the national and provincial situation, the low-speed change scenario and the high-speed change scenario of industrial structure are established. Under the rapid changing circumstances, the growth proportion of tertiary industry is higher among all. Keeping the main parameters constant with the RS for industrial assembly trials then obtain low- and high-speed influences which is presented in Table 7.
(4)
Three industries assembly under different structure influences.
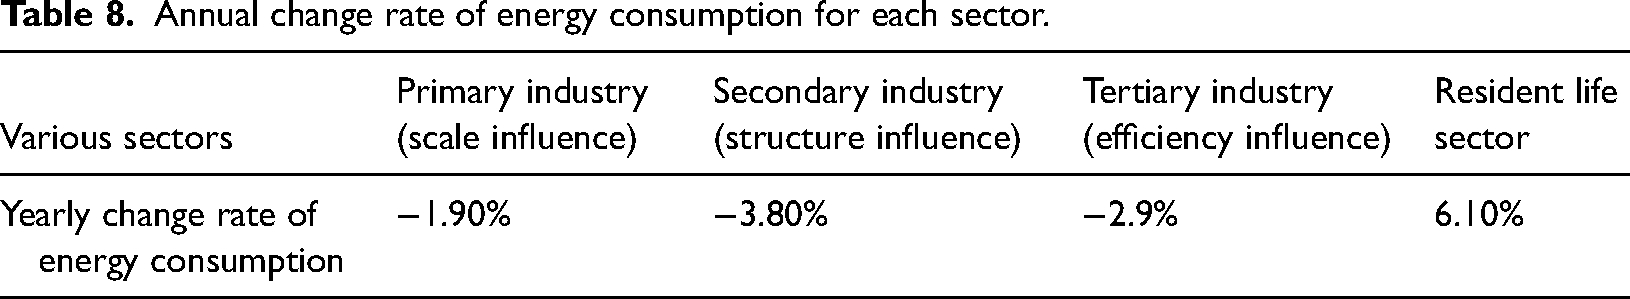
A descending trend in energy utilization intensity is observed when production technology and energy consumption efficiency are subjected to improvement. In conjunction with the economic growth and technological advancement, life quality in residential sector is progressively enhanced, with the increasing energy demand and energy utilization intensity. In consideration with the given circumstances, the energy intensity of residential sector and primary, secondary, and tertiary industries are evaluated in terms of efficiency influence scenario (EFIS), where the other crucial parameters are kept consistent with the RS, as presented in Table 8.
(5)
Annual change rate of energy consumption for each sector.
A comprehensive adjustment scenario is a collection of efficiency influence, scale influence, and structure influence adjustment scenarios. It has different subclasses known as high-energy demand (HED) and low-energy demand (LED) scenarios. HED scenario has high energy intensity, high-speed industry structure change, and a high GDP growth rate under RS with other consistent factors. In contrast, low values are depicted in the case of the LED scenario under EFIS.
Results and discussion
Outcomes exploration of LMDI decomposition method
The LMDI decomposition was used to break down the energy consumption influence of the three industrial sectors during 2010–2021. Table 9 indicates the comparison of the analysis of the results throughout this study.
Decomposition outcomes of energy consumption (104 tons of coal equivalents).
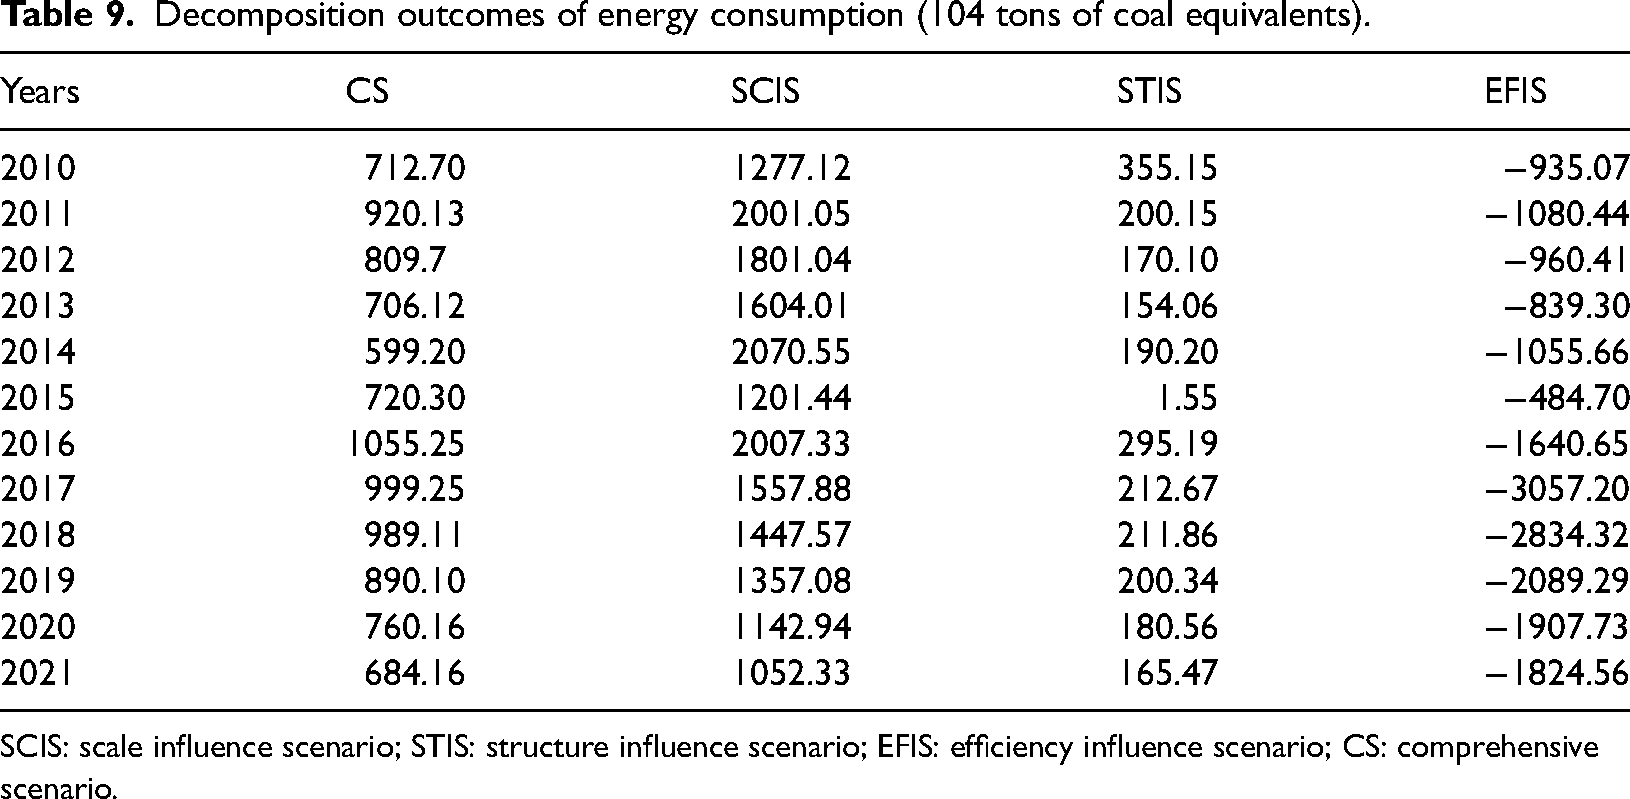
SCIS: scale influence scenario; STIS: structure influence scenario; EFIS: efficiency influence scenario; CS: comprehensive scenario.
The total energy consumption in Table 8 indicates to last year's energy usage bubble up. Table 7 and Figure 2 reveal that the three influences have different impacts on Punjab's total outcomes and energy consumption. Hence, the data is divided into two specific periods to evaluate the effects, for example, the first period is the MTDF (I) and the second period is the MTDF (II).
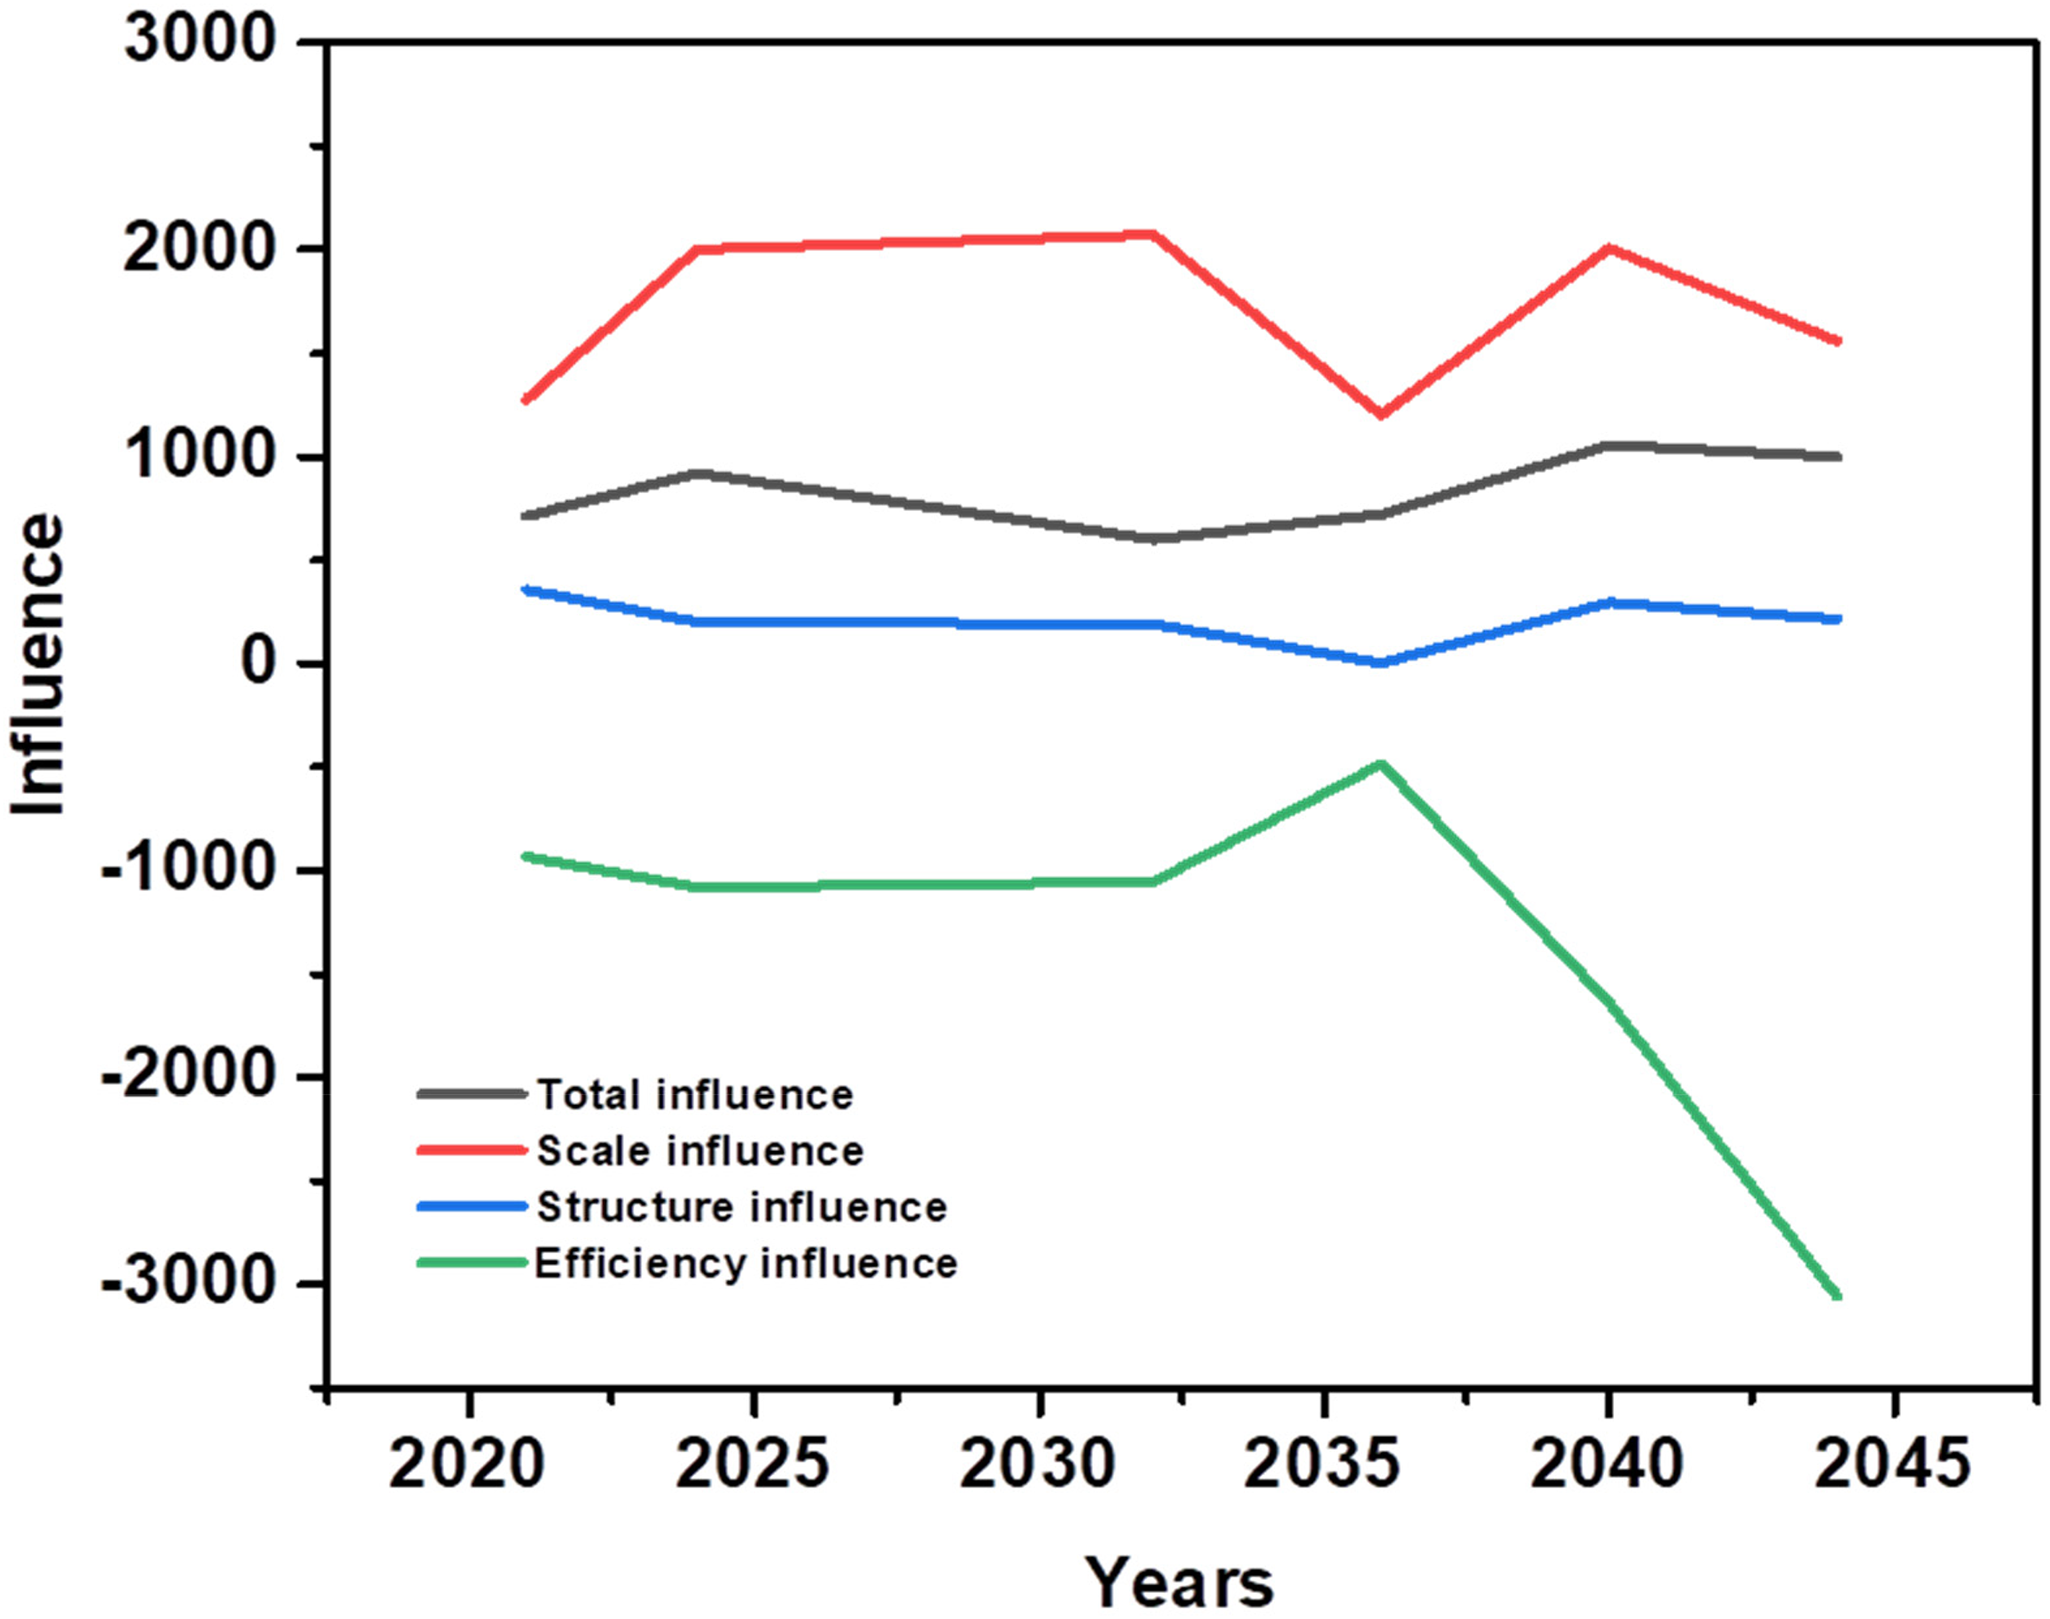
Particular decomposition results of energy consumption of total influences.
Throughout, the MTDF I period, from 2010 to 2015, energy consumption hits record high in the collected data. The decomposition values of (SACI) and structure influence scenario (STIS) were high and positive that is, 1604.01 and 154.06, respectively. The scale and structure of industry growth have played a significant part in driving energy consumption growth. The scale influence scenario value, the GDP growth rate are 10 times that of STIS decomposition. It indicates the rising scale influence on energy consumption growth. This means that the GDP growth rate is stronger, and the industry structure is more influential in the energy consumption growth. The growth of GDP during this period was so rapid that it has significantly contributed to the growth of energy consumption. The development of the tertiary industry has had a relatively small contribution to total energy consumption. Efficiency has always been an important factor in energy consumption. The value of EFIS is −839.30 which is representing the energy decomposition. From this, it is observed that technology and improved energy efficiency have substantially influenced the enhancement of energy consumption.
In the MTDF II period, from 2016 to 2021, the total energy consumption went up and down. This evaluation indicates that the STIS and EFIS could combat total energy consumption growth when it was in a negative state. MTDF II has an overall negative influence on the environment. With the advent of better production technology, more efficient energy use, and more sustainable industry adjustment, MTDF II's total energy consumption greatly decreased. The values during MTDF II are lower than those in MTDF I by 24%. This is due to EFIS has a scale influence decomposition value of 1142.94 in MTDF II, which is much lower than the MTDF I period. The decomposition analysis of the total energy consumption in Punjab province, conducted by the MTDF II, was negative. However, there were still periods in which this total consumption was positive. Since the influence of the STIS on this consumption wasn't strong enough and needed to be stronger, it was necessary to continue developing its effect with the progression of the economy and society.
It can be observed from the years of 2010–2021, the decomposition of influences the total effects to the progress of Punjab Province as the region is experiencing the fastest growth. During the MTDF (I) period, the GDP of the Punjab Province has grown robustly, with an annual average growth rate of 65%. Industry STIS has been adjusted uninterruptedly and accelerated new industries and upgrades. The ratio of the secondary industry to the primary industry has increased by 19%. The energy intensity is declining in Punjab with the passage of time. So, the MTDF (II)-the central government has defined this period as a new phase in Punjab's economic development. The province was stated to promote new and service-related industries while also “optimizing and upgrading” traditional outdated industries hindering growth. Technology was swiftly innovated, and energy consumption generally increased, but slowly and steadily.
Outcomes exploration of LEAP-Punjab model
Figure 3 provides a map of the various energy demands of numerous scenarios to provide a clearer view of the effects of multiple influences. Table 10 illustrates the energy consumption in numerous scenarios. Analyzing these data reveals the effects of numerous scenarios. It becomes clear that the high-scale influence and high demand for comprehensive scenario (CS) have crossed RS, which means it is evident that the energy consumption will grow because the scale influence of the scenario will continue to thrive.
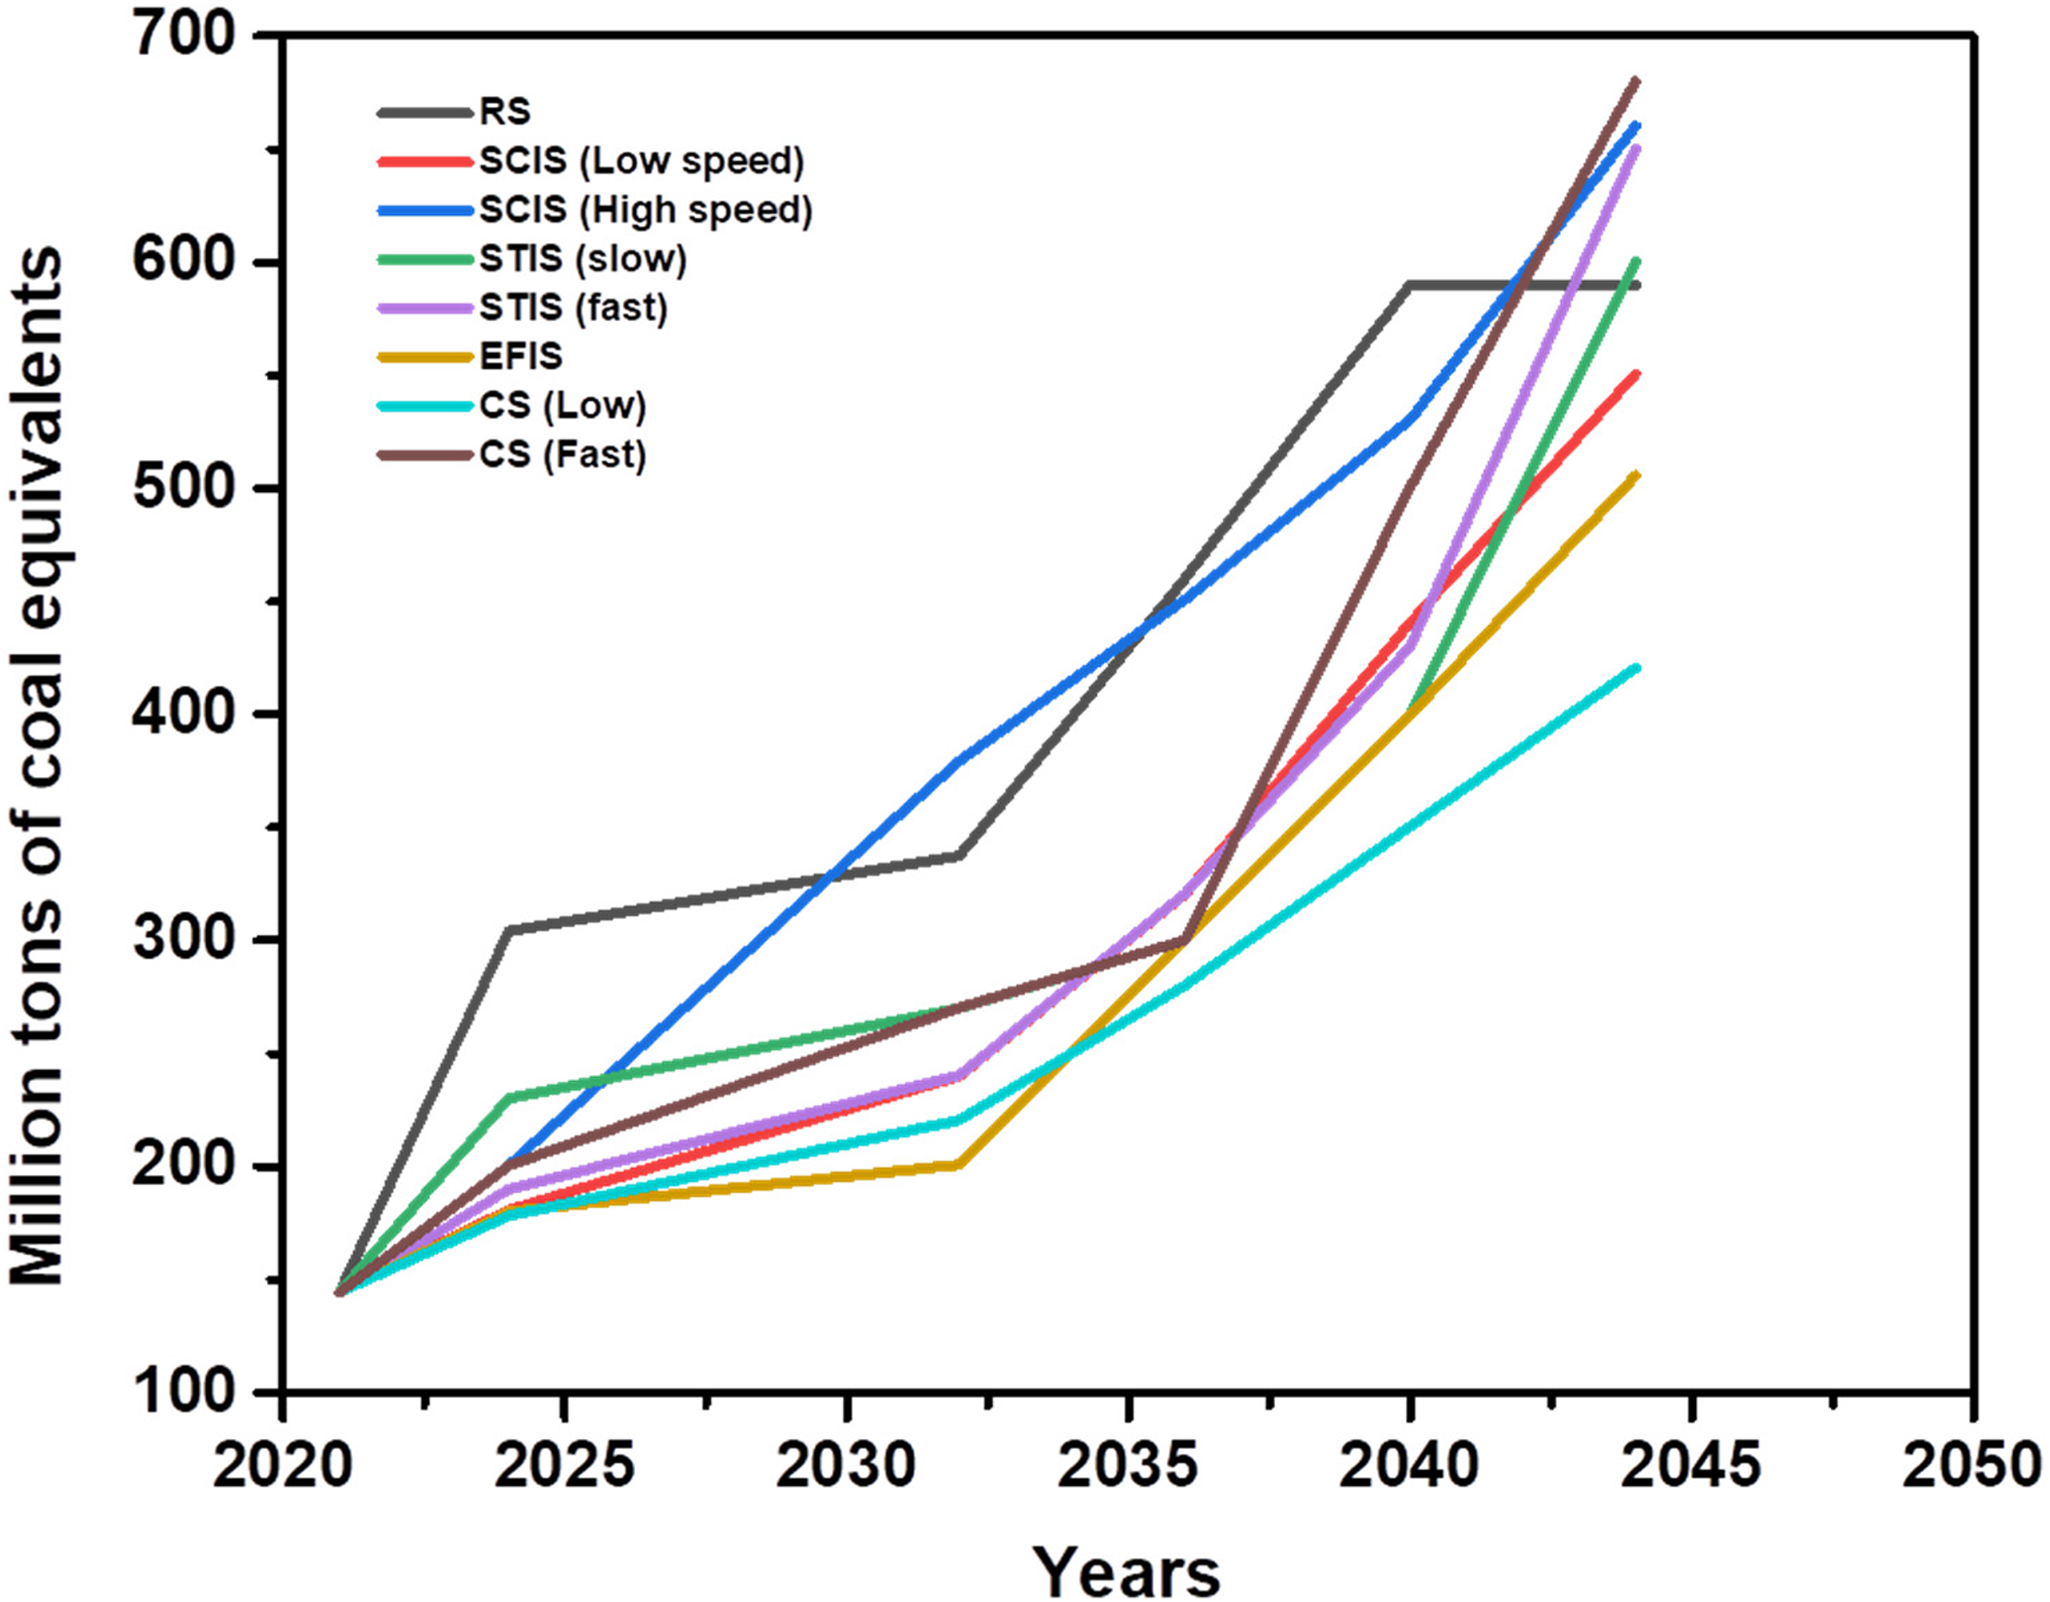
Comparison of entire energy consumption in different scenarios under the low and high speed.
Whole energy consumption analysis in numerous scenarios of different years (million tons of coal equivalents).
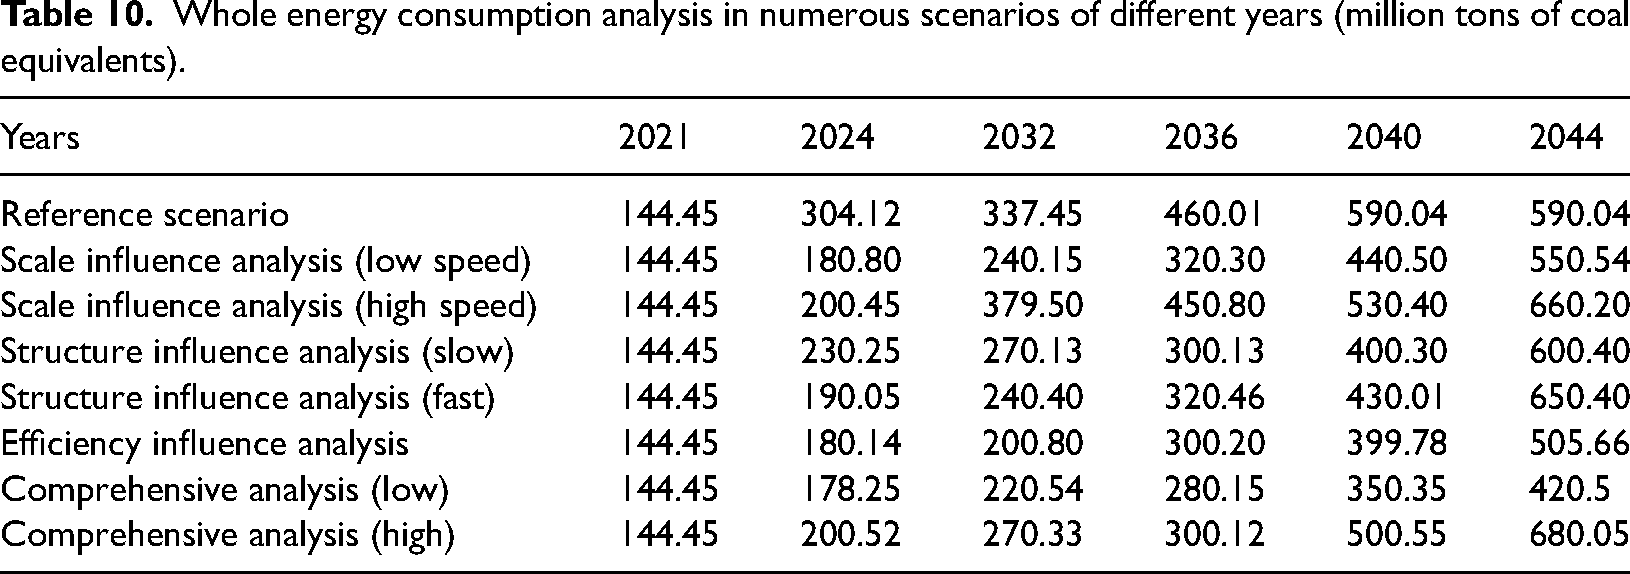
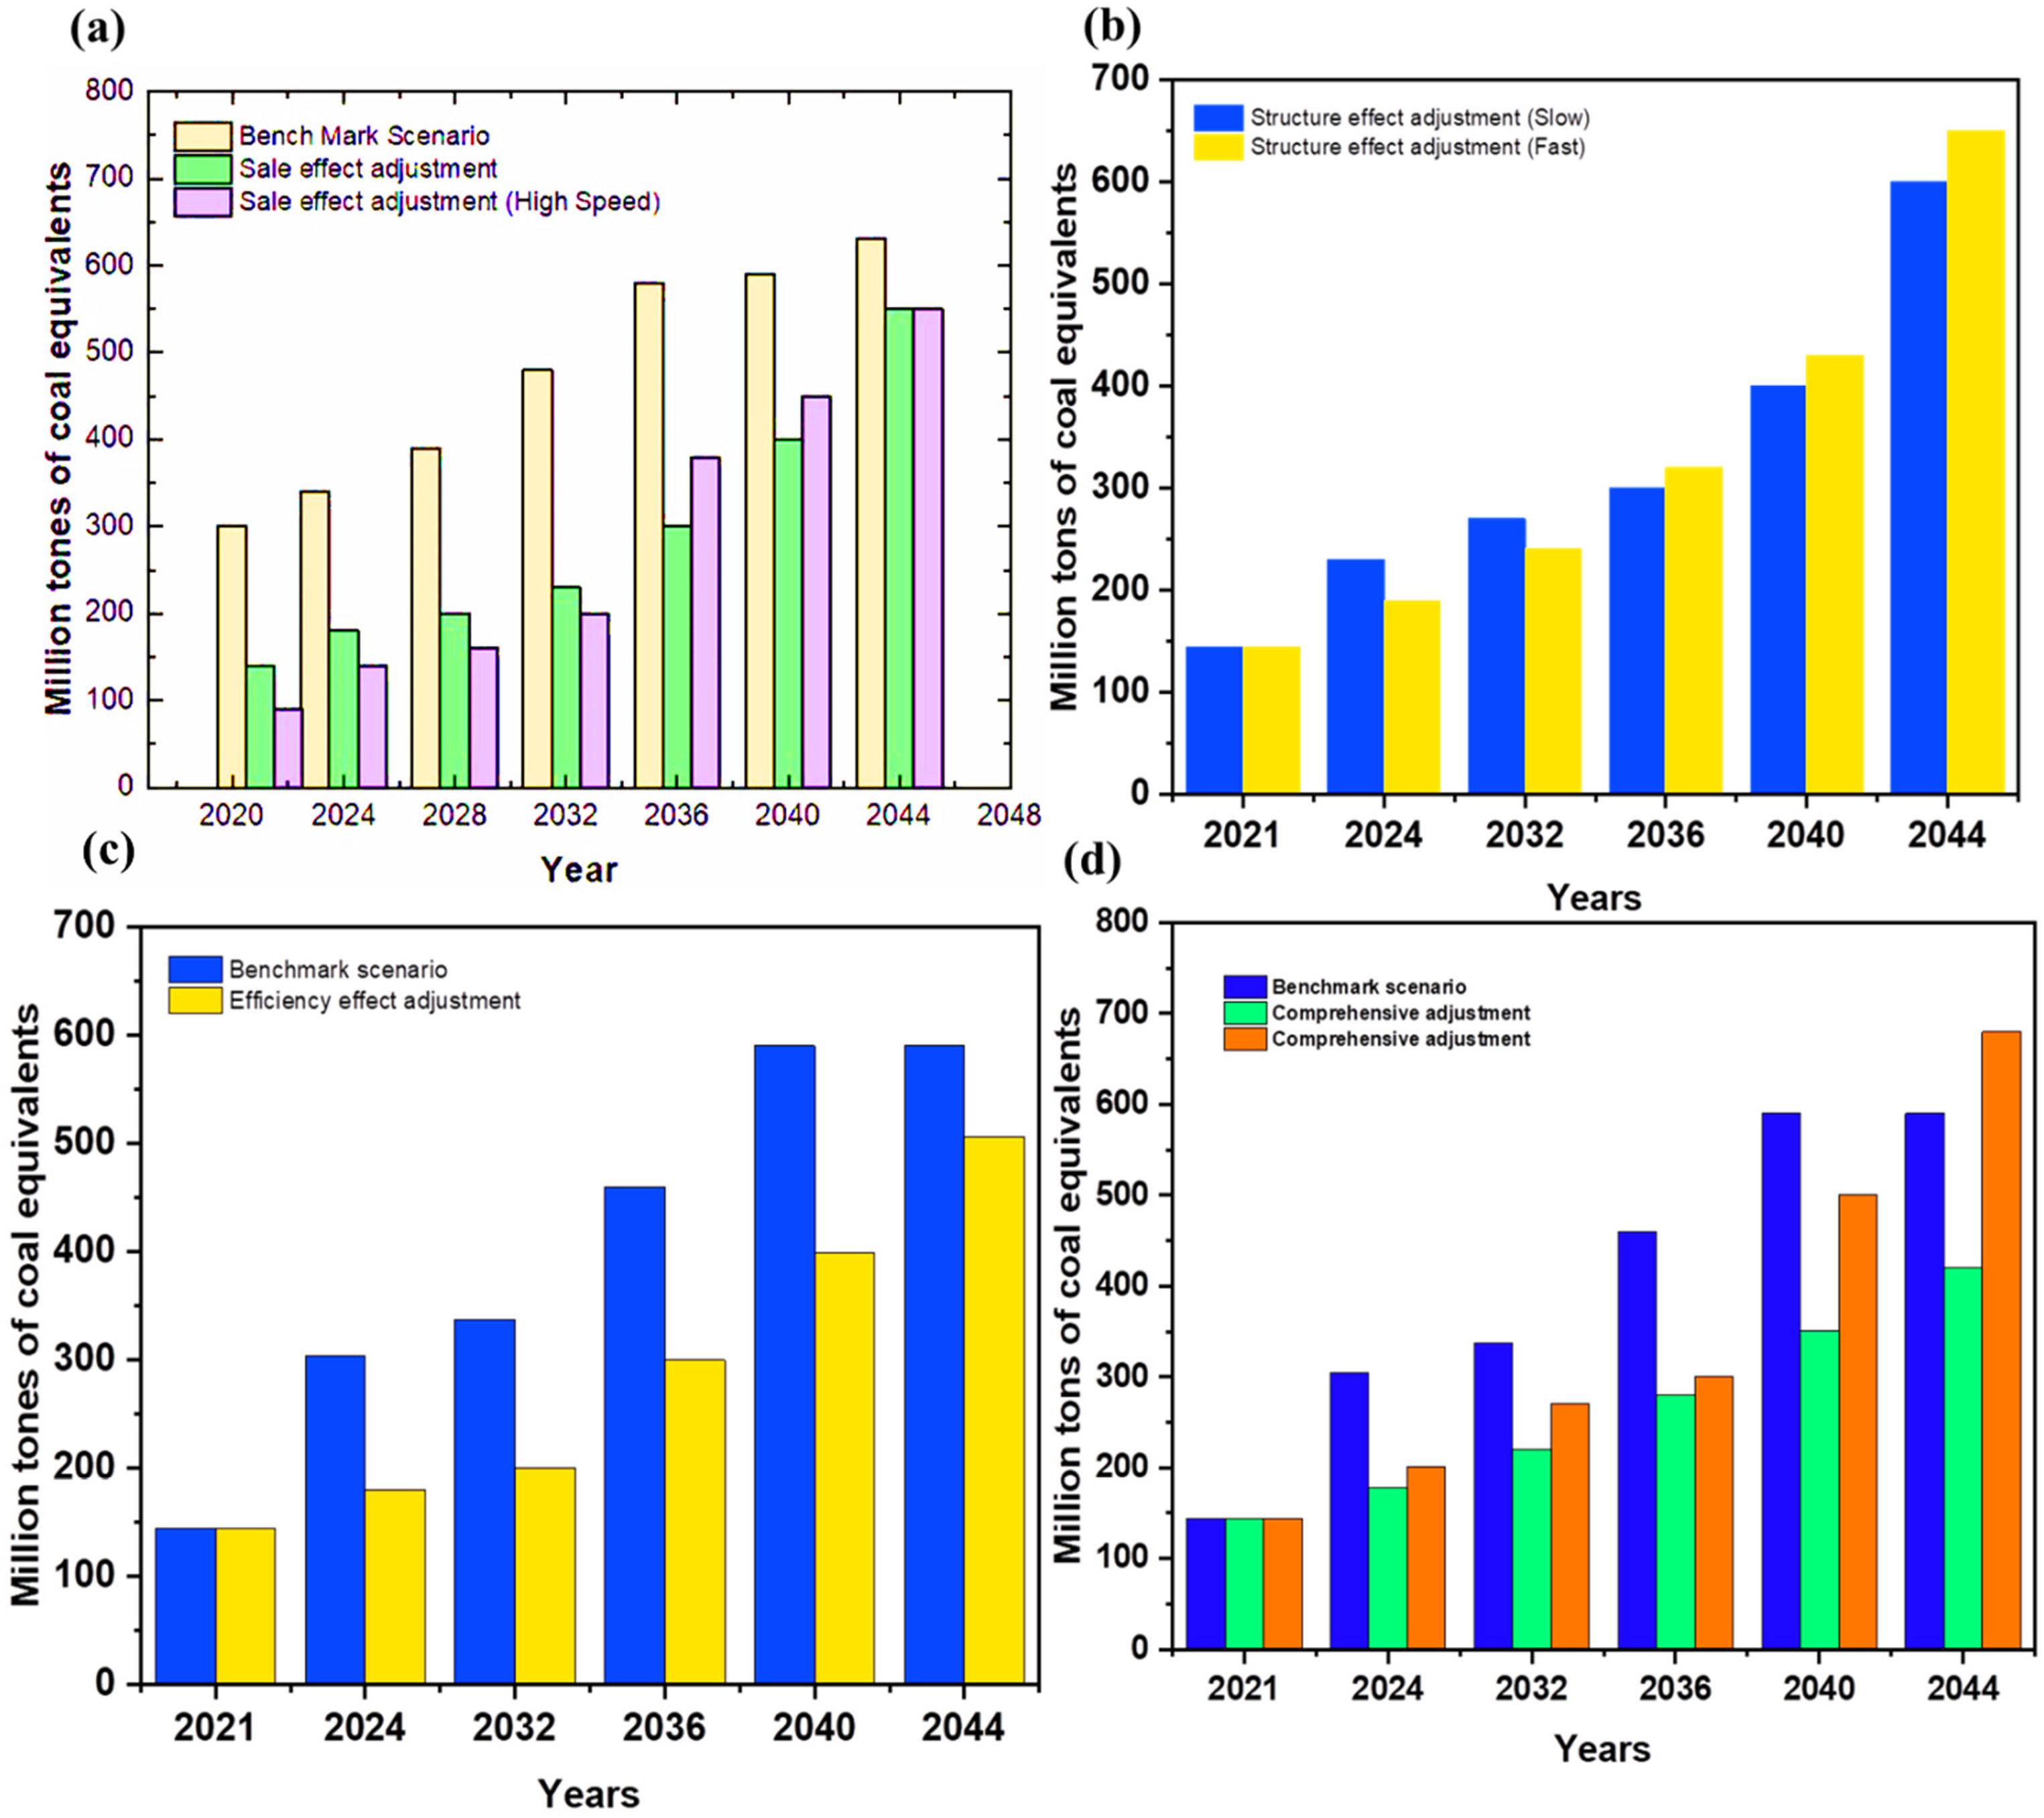
Figure 4(a) exhibits the energy consumption changes from 2021 to 2044 of Punjab Province under the RS and two structure influence analysis for slow terminology (SIAS) terminologies. It can be observed that the total energy consumption is far more than the other two scenarios. The numbers of total energy consumption in 2024, 2036, and 2044 under the fast GDP growth rate (65%) and high SIAS energy consumption growth rate are 200.45, 450.80, and 660.20 million tons of equivalent coal, respectively. Similarly, it is observed that the total energy consumption is far lower than the other two scenarios. The numbers of total energy consumption in 2024, 2036, and 2044 under the low GDP growth rate (60%) and low SIAS energy consumption growth rate are 180.80, 320.30, and 550.54 million tons of equivalent coal, while the total energy consumption in 2024, 2036, and 2044 under the RS are 304.12, 460.01, and 590.04 million tons of equivalent coal. All these factors have created a climate that's influenced by scale and is heavily involved in energy consumption in Punjab. These results are in line with the decomposition method of LMDI.
Comparison of total energy consumption between reference scenario (RS) and other scenarios.
Furthermore, the MTDF II period in federal government policy stated when industry structure in Punjab was enhanced and improved continuously then every year, the percentage of new industries and tertiary industries is upstretched significantly. Figure 4(b) inhibits the alternations in energy consumption during the 2021–2044 years under the RS and two STRS. The figure shows that, no matter how much the tertiary industry increases or decreases, STIS's total energy consumption is always lower than RS. In this new era, the inhibitory influence of industry structure on energy consumption growth is greater than ever. In the future, social and economic development trends and energy consumption will align. This result is in line with the linear programming model decomposition. A reasonable extrapolation indicates that it's necessary to diminish Punjab's energy use by improving and modernizing the industry structure.
Figure 4(c) exhibits the energy consumption changes in 2021–2044 years under the RS and the EFIS. The energy consumption intensity chart shows that energy consumption drops instantly. The energy consumption growth rate and the total energy consumption are much lesser than the RS. The total energy consumption in RS is 299.34 million tons of equivalent coal in 2024, 460.78 million tons of equivalent coal in 2036, and 591.5 million tons of equivalent coal in 2044. In EFIS, the total energy consumption is 180.14 million tons of equivalent coal in 2024, 300.20 million tons of equivalent coal in 2036, and 505.66 million tons of equivalent coal in 2044. Therefore, decreasing energy consumption intensity with the progression of technology and energy efficiency has become the main force in the past few years. Efficiency has served as an important factor in restraining energy consumption growth in Punjab in recent years. The outcome also assure to the LMDI decomposition method's efficiency influence breakdown.
Figure 4(d) indicates the energy consumption changes in 2021–2044 years under the RS and two CS scenarios. In a low-demand scenario, the total energy consumption is 178.25 million tons of equivalent coal in 2024, 280.15 million tons of equivalent coal in 2036, and 420.5 million tons of equivalent coal in 2044. In a high-demand scenario, the total energy consumption is 200.52 million tons of equal coal in 2024, 300.12 million tons of equivalent coal in 2036, and 680.05 million tons of equivalent coal in 2044. It is observed that the GDP growth rate is low, and the development speed in the tertiary industry is high. However, Punjab consumes a minute amount of total energy and has a moderate growth rate when it comes to energy consumption. The outcomes of this research clearly point out energy consumption. First, the GDP growth rate needs to be appropriate, as does the industry structure transformation step. Now the time to change the trend of energy is dependence. These steps help to move away from the primary industry towards the tertiary. The total energy consumption in Punjab can reach its lowest possible level, if technology and the efficiency of the utilized energy are continuously improved. Figure 4 illustrates the comparison of total energy consumption between reference and other scenarios throughout this work.
Economic analysis
The economic/financial analysis indicates the net benefit of anticipated savings that will arise by using the LMDI technique-based LEAP model. This will achieve less the additional expenses and times with the present value factor. This financial analytical tool called net present value (NPV) that caters all the aspects of cost and benefits, the positive NPV shows that the applied method is commercially feasible and vice versa. The NPV formula is specified in equation (14).

Limitations and managerial insights
Privatization/efficiency Demand for energy Energy and economic growth Rural electrification/ shortage of independent power producers Need for an effective energy policy Alternative and renewable energy resources
Conclusions
Prediction of energy consumption and economic analysis of Punjab province using Punjab LEAP model based on LMDI approach among the years of 2020 to 2040 under MTDF evaluates the advantageous and productive assumptions. The conclusions of the study are as follows:
It is evident from the LMDI evaluation that the energy utilization growth rate is efficiently restricted under the efficiency influence. However, an enhancement is observed under the continuous role of scale influence. In contrast, a gradual change from elevation to inhibition is observed under structure influence on the energy utilization growth rate. Overall, the role of scale influence is weakening gradually, and those of the adverse function of efficiency and structure influence are increasing on energy consumption growth rate. The findings of LEAP-Punjab model are highly compatible with those of the findings of LMDI method, where the values of structure influence are rationally inferred by LEAP-Punjab model. The efficiency and structure influence are expected to the mutually embark on inhibition influence on growth of total energy utilization, where the prevention influence of structure influence will expectedly intensify year by year. Energy requirements surpass the RS during the selected time (2010–2044), where only HED and high-scale influence scenarios are observed. Energy utilization estimates, as compared to RS are lower for all other scenarios. Among all, the maximum energy requirement is evaluated for high-speed scale adjustment scenario, indicating the rate of growth of GDP as the crucial factor to determine the overall energy demand in the future. Moreover, the financial performance is quantified in terms of energy saving; whereas the financial benefits can be optimized with the real-time dispatch strategies. This model gains recognition as a novel, low-cost, high-speed and environmentally friendly in energy consumption growth rate processes. More, this model can provide guidance for optimizing the LEAP-LMDI methods and a quick determination of operation parameters for the desired energy decomposition for application of industrial sectors.
Highlights
An approach for determining the energy consumption by the modern prediction methods is proposed.
The factors affecting the energy consumption calculation by modern approach are confirmed.
The analysis of energy consumption is investigated based on the growth consumption which is classified into scale influence, structure influence, and efficiency influence.
Footnotes
Declaration of conflicting interests
The authors declared no potential conflicts of interest with respect to the research, authorship, and/ or publication of this article.
Funding
The authors disclosed receipt of the following financial support for the research, authorship, and/or publication of this article: This research is funded by Africa New Energies Limited, UK and National Natural Science Foundation of China (No. 12104324), Scientific Research Startup Fund for Shenzhen High-Caliber Personnel of SZPT (No. 6022310046K), Xindongli Ultrasonic Welding Technology R & D Center (602331009PQ).
Data availability statement
The authors declare that the data presented in this study are available within the article.