
Abstract
Deep-shaft mining in roadway stress concentration, difficult control of the surrounding rock, and mining imbalance affect mining efficiency in coal mines. The mechanical parameters and crack development law of roadway surrounding rock were studied by laboratory experiments. The mechanical model was established by the method of theoretical analysis, the maximum empty roof distance was deduced, and two support schemes were designed. Through the numerical simulation method, the support scheme was compared and analyzed, the deformation rule of roadway surrounding rock, the optimization of roadway support parameters and the application of hysteresis technology are studied. The effect of different support schemes was verified by three-dimensional similar simulation experiments. The practical engineering verification showed that the construction time of each support circle was reduced by approximately 1 h, and the work was completed 60 days earlier. The research showed that the optimal support scheme was support scheme 1 (7 bolts with 800 mm × 1000 mm spacing between the roof, 10 bolts with 800 mm × 1000 mm spacing between the two sides, and 2 × 1 × 2 cables with 1600 mm × 2000 mm spacing between the roof). Support scheme 1 was applied to the engineering site to control the deformation of surrounding rock at 80 mm, and the deformation was less than the original support scheme. The construction was completed in advance under the hysteresis process, and the support efficiency and operation safety were improved. The results revealed the mechanism of surrounding rock control and proved the effectiveness of digging support synergy. This optimization plan serves as a reference for studying roadway support in rapid excavation and provides theoretical support for safe and efficient coal roadway mining.
Keywords
Introduction
The growth rate of economic development and increased domestic and foreign production and demand have significantly increased the demand for coal in the energy market. The primary goal of coal mining enterprises is to complete production tasks, improve production efficiency, and ensure safe production within the approved annual production capacity. Although the digging speed has been significantly enhanced with improvements in the mining mechanization level, the complexities of deep shafts with high stresses have also increased (Jia, 2022; Li et al., 2020; Xie et al., 2012). However, the complex environment of deep wells with high stress (Rong et al., 2021) and difficulty of timely roadway support follow-up significantly limit mechanized equipment application. Thus, they are key factors in determining the efficiency of roadway excavation and enterprise production efficiency.
Skrzypkowski et al. (2022) established a rock mass model with faults through RS3 numerical simulation software of finite element method, studied the displacement of steel frame support in areas with faults, and proposed the method of selecting arch compression support in the preparation work of hard coal seam excavation. Lawrence (2009) proposed a longwall roadway roof support model (GRSM) aiming at roadway development and mining area through the combination of numerical simulation and experience. Li et al. (2015) conducted an in-depth study on roadway support and rock control in deep coal seams based on mechanical tests. They verified and analyzed the characteristics and mechanisms of roadway rock damage. Yang et al. (2021a, 2021b), Zhang et al. (2014), and Ma et al. (2013) studied the factors influencing the rapid excavation of large-section coal roadways. They analyzed the time-consuming support technology and optimized the roof-support mode. Qiao et al. (2020) studied the stress distribution of top and bottom slabs during roadway excavation using numerical simulation and field monitoring. They analyzed the principle of top and bottom slab deformation and revealed the principle of overburden damage under the influence of mining. Sakhno and Sakhno (2023), aiming at the problem of floor heave in soft rock roadway, studied the use of anchor rod to strengthen strata and control the degree of surrounding rock fracture through numerical simulation. Ma et al. (2018) studied the fracture evolution law of the surrounding rock in the support of a deeply buried soft rock roadway. They proposed the support principle of joint control of top and rib plates and the support method of combining grouting technology and bolt and anchor cable supports. Majcherczyk et al. (2014) studied the effectiveness of combined support of anchor rod and steel arch shed, and proposed an index for evaluating construction stability. Niedbalski et al. (2013) verified the effectiveness of pressure support and the ability of bolt to absorb elastic strain through monitoring data. Xie et al. (2018) proposed a new support system to cope with roof deformation and fissure development during the excavation and mining process in studying fast, safe, and stable excavation of deep roadways. Horyl and Snuparek (2012) analyzed and compared the supporting effects of different quantities and positions of bolts through computer modeling, and studied the construction quantities and positions of reinforced bolts. Chen et al. (2019) determined the supporting parameters of integrated excavation and anchoring roadway through numerical simulations. They improved the construction process and labor organization by adopting the “3-7-1-3” operation method. Wagner (2019) analyzed regional stress changes caused by mining. The progress in design concepts for open stopes and stopes with caving of the roof strata is illustrated. Su et al. (2023) used a numerical simulation and response surface method to study the problems affecting roadway heading speed and roof stability. The supporting strength and driving speed under different supporting spacings were compared and analyzed to verify the feasibility of the method. These studies focused on analyzing the mechanical characteristics of roadway surrounding rock and optimizing the rapid excavation technology through various methods. These studies achieved significant results. However, in rapid excavation, more refined and extensive research on the support parameters according to different geological conditions and optimization of the support process is necessary, particularly for the lag process and related support technology.
This study explores a synergistic optimization method for support technology and roadway excavation to improve the efficiency of coal mine roadway mining and support reliability, reduce safety risks, and provide technical support for the sustainable development of coal mine production (Han, 2017; Hu et al., 2022; Wang, 2014). Based on the engineering practice of the Qianyingzi Mine, support schemes were explored through data collection, theoretical derivation, and numerical simulation (Hou, 2017; Wang, 2021). Subsequently, validation studies were conducted in a laboratory and the engineering sites. This study focused on analyzing support parameters, optimizing support schemes, exploring the surrounding rock geology, and evaluating the support effect through simulations. This study provides theoretical support for optimizing roadway support schemes and a theoretical basis for synergizing excavation and support. The schemes and concepts derived from this study can be applied to other similar mines.
Analysis of the basic roadway parameters
Engineering overview
The research subject was the W3233 return airway of the Qianyingzi Coal Mine, as shown in Figure 1. The mineral and hydrologic conditions of the mine were complex and medium, respectively. Structural development of folds and faults in W3233 working face. The roof was dominated by mudstone and siltstone, and the inclined fractures in the upper part were relatively developed. The floor was composed of sandstone with an average buried depth of 479.20 m. The coal-bearing strata were covered by Cenozoic loose beds with an average thickness of 230.70 m. The minimum distance between the highest point of the working face and the bottom boundary of the loose layer was 84 m, which had no influence on the working face. Judging from the area and the adjacent production mines, the fault was generally rich in water conductivity and weak.
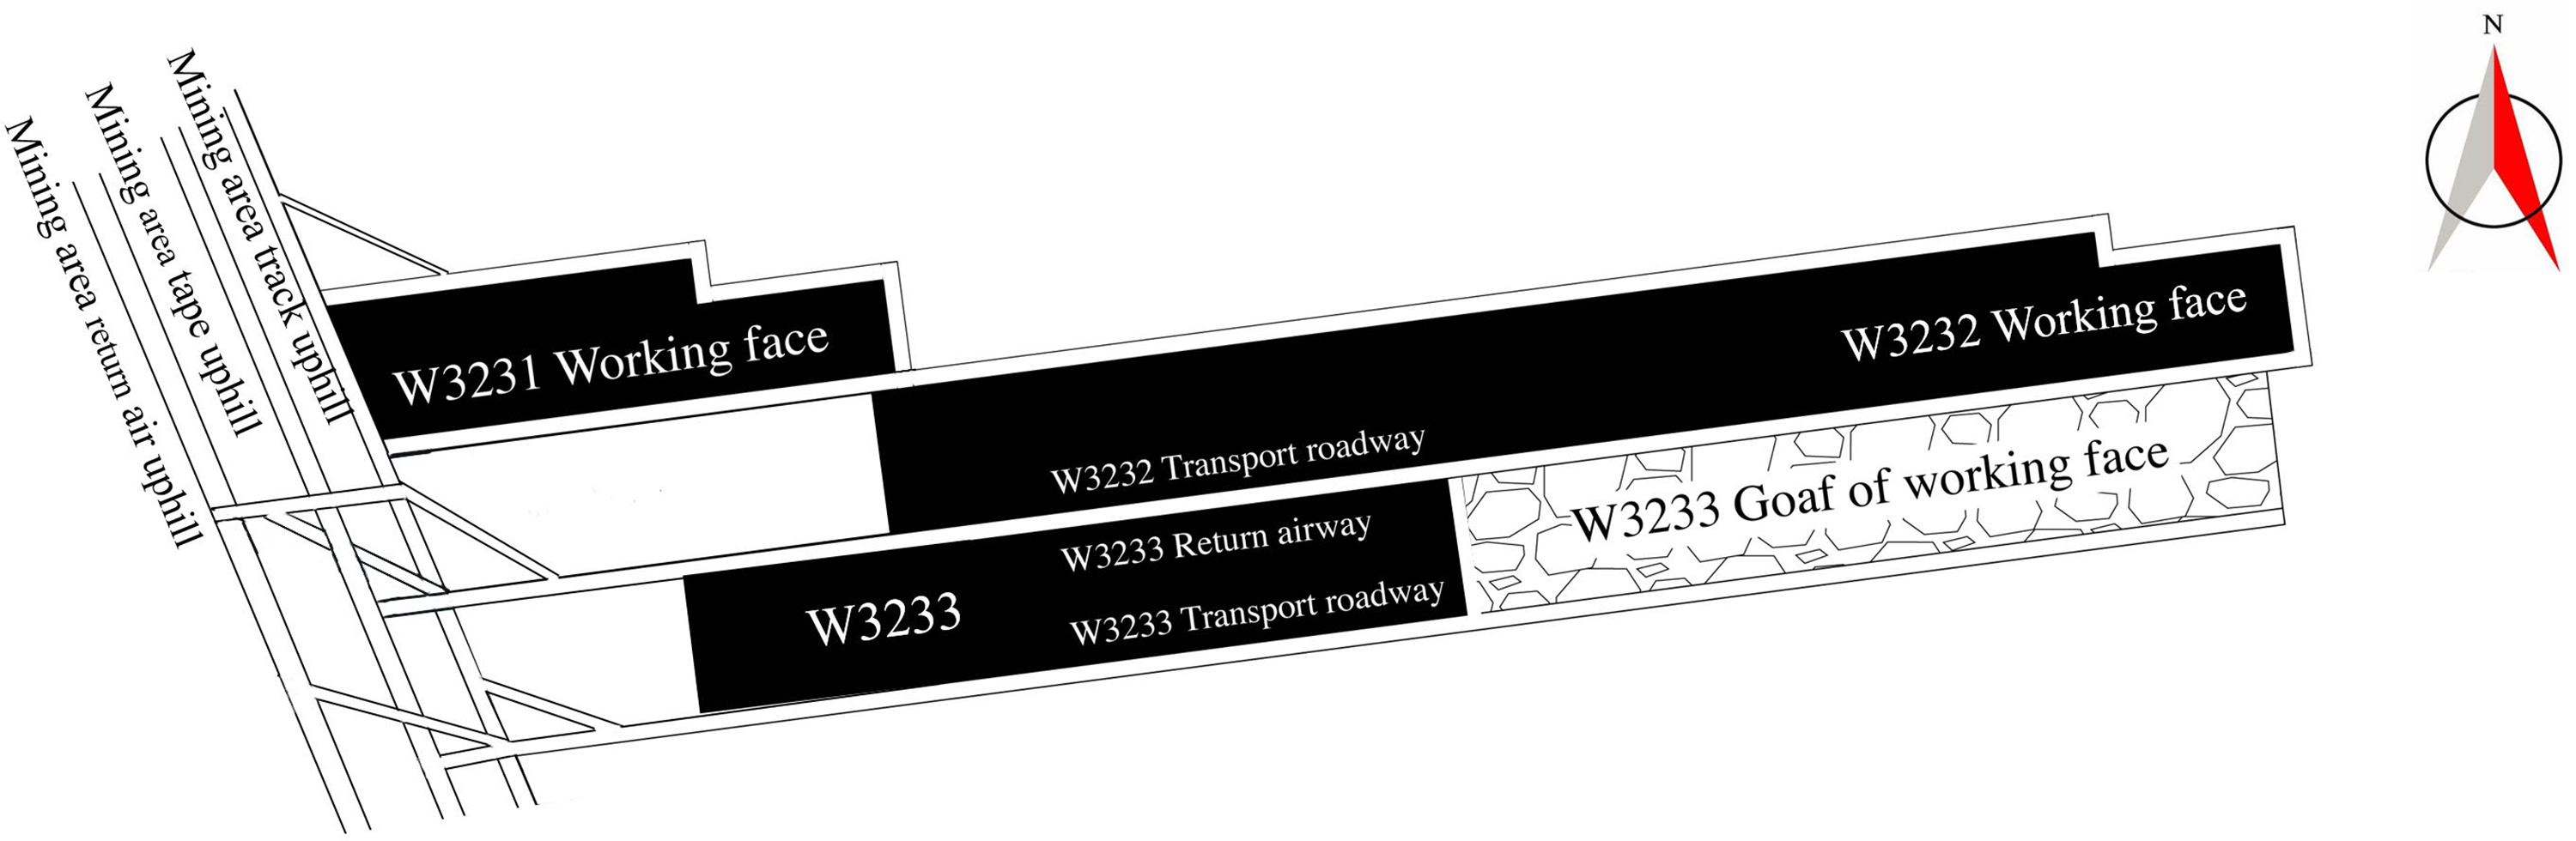
Schematic of the basic parameters of the W3233 return airway.
The coal production primarily comprised gas coal and coking coal. The average total thickness of the coal seam was 4.67 m, of which 32 and 82 coal seams were the main coal seams. Qianyingzi Coal mine is the main coal seam of the mine, the “32” of “3233” represents 32 coal seam, and the “33” represents the working face number. The design orientation of the return airway and transport roadway on the W3233 working face was N30°. They serve a mining roadway with a designed service life of 5 years. There was no goaf in the tunnel construction area. The dip angle of the coal strata in the working face was 20–25°, and the dip of the coal strata was 300–330°. The distance between the transport roadway floor and the 32-coal method was 24 m. The design tunneling quantity was 2972.5 m (horizontal distance).
This study was conducted on the W3233 return airway. The surrounding rock dip azimuth is 120–150° and dip angle was 20–30°. The rock stratum had a monoclinic structure. Among them, the design length of the airway was 3185 m, all of which are rectangular sections. First, 1800.721 m was constructed in the first section with width × height = 5 × 3.6 m, and then 1255.881 m was constructed in the second section with width × height = 5 m × 3.2 m to the design position. Because other environmental factors were the same, the two sections were only different in height. The surrounding rock deformation of the first section with a height of 3.6 m could be controlled through support scheme research (Chen, 2017; Shen, 2014; Xue, 2017). Under the same support scheme, the surrounding rock of the section with a height of 3.2 m could also be effectively controlled. The design excavation work was 3056.602 m.
The original support scheme is shown in Figure 2. In the original support scheme, φ22 mm, L = 2400 mm left-handed longitudinal reinforcement-free equal-strength threaded steel bolts with 800 mm × 900 mm distance between bolts were selected. The length of 2000 mm bolt was selected for the roadway sides. The roof anchor cable was φ17.8 mm × 6200 mm, and the spacing between rows was 1600 mm × 1800 mm.
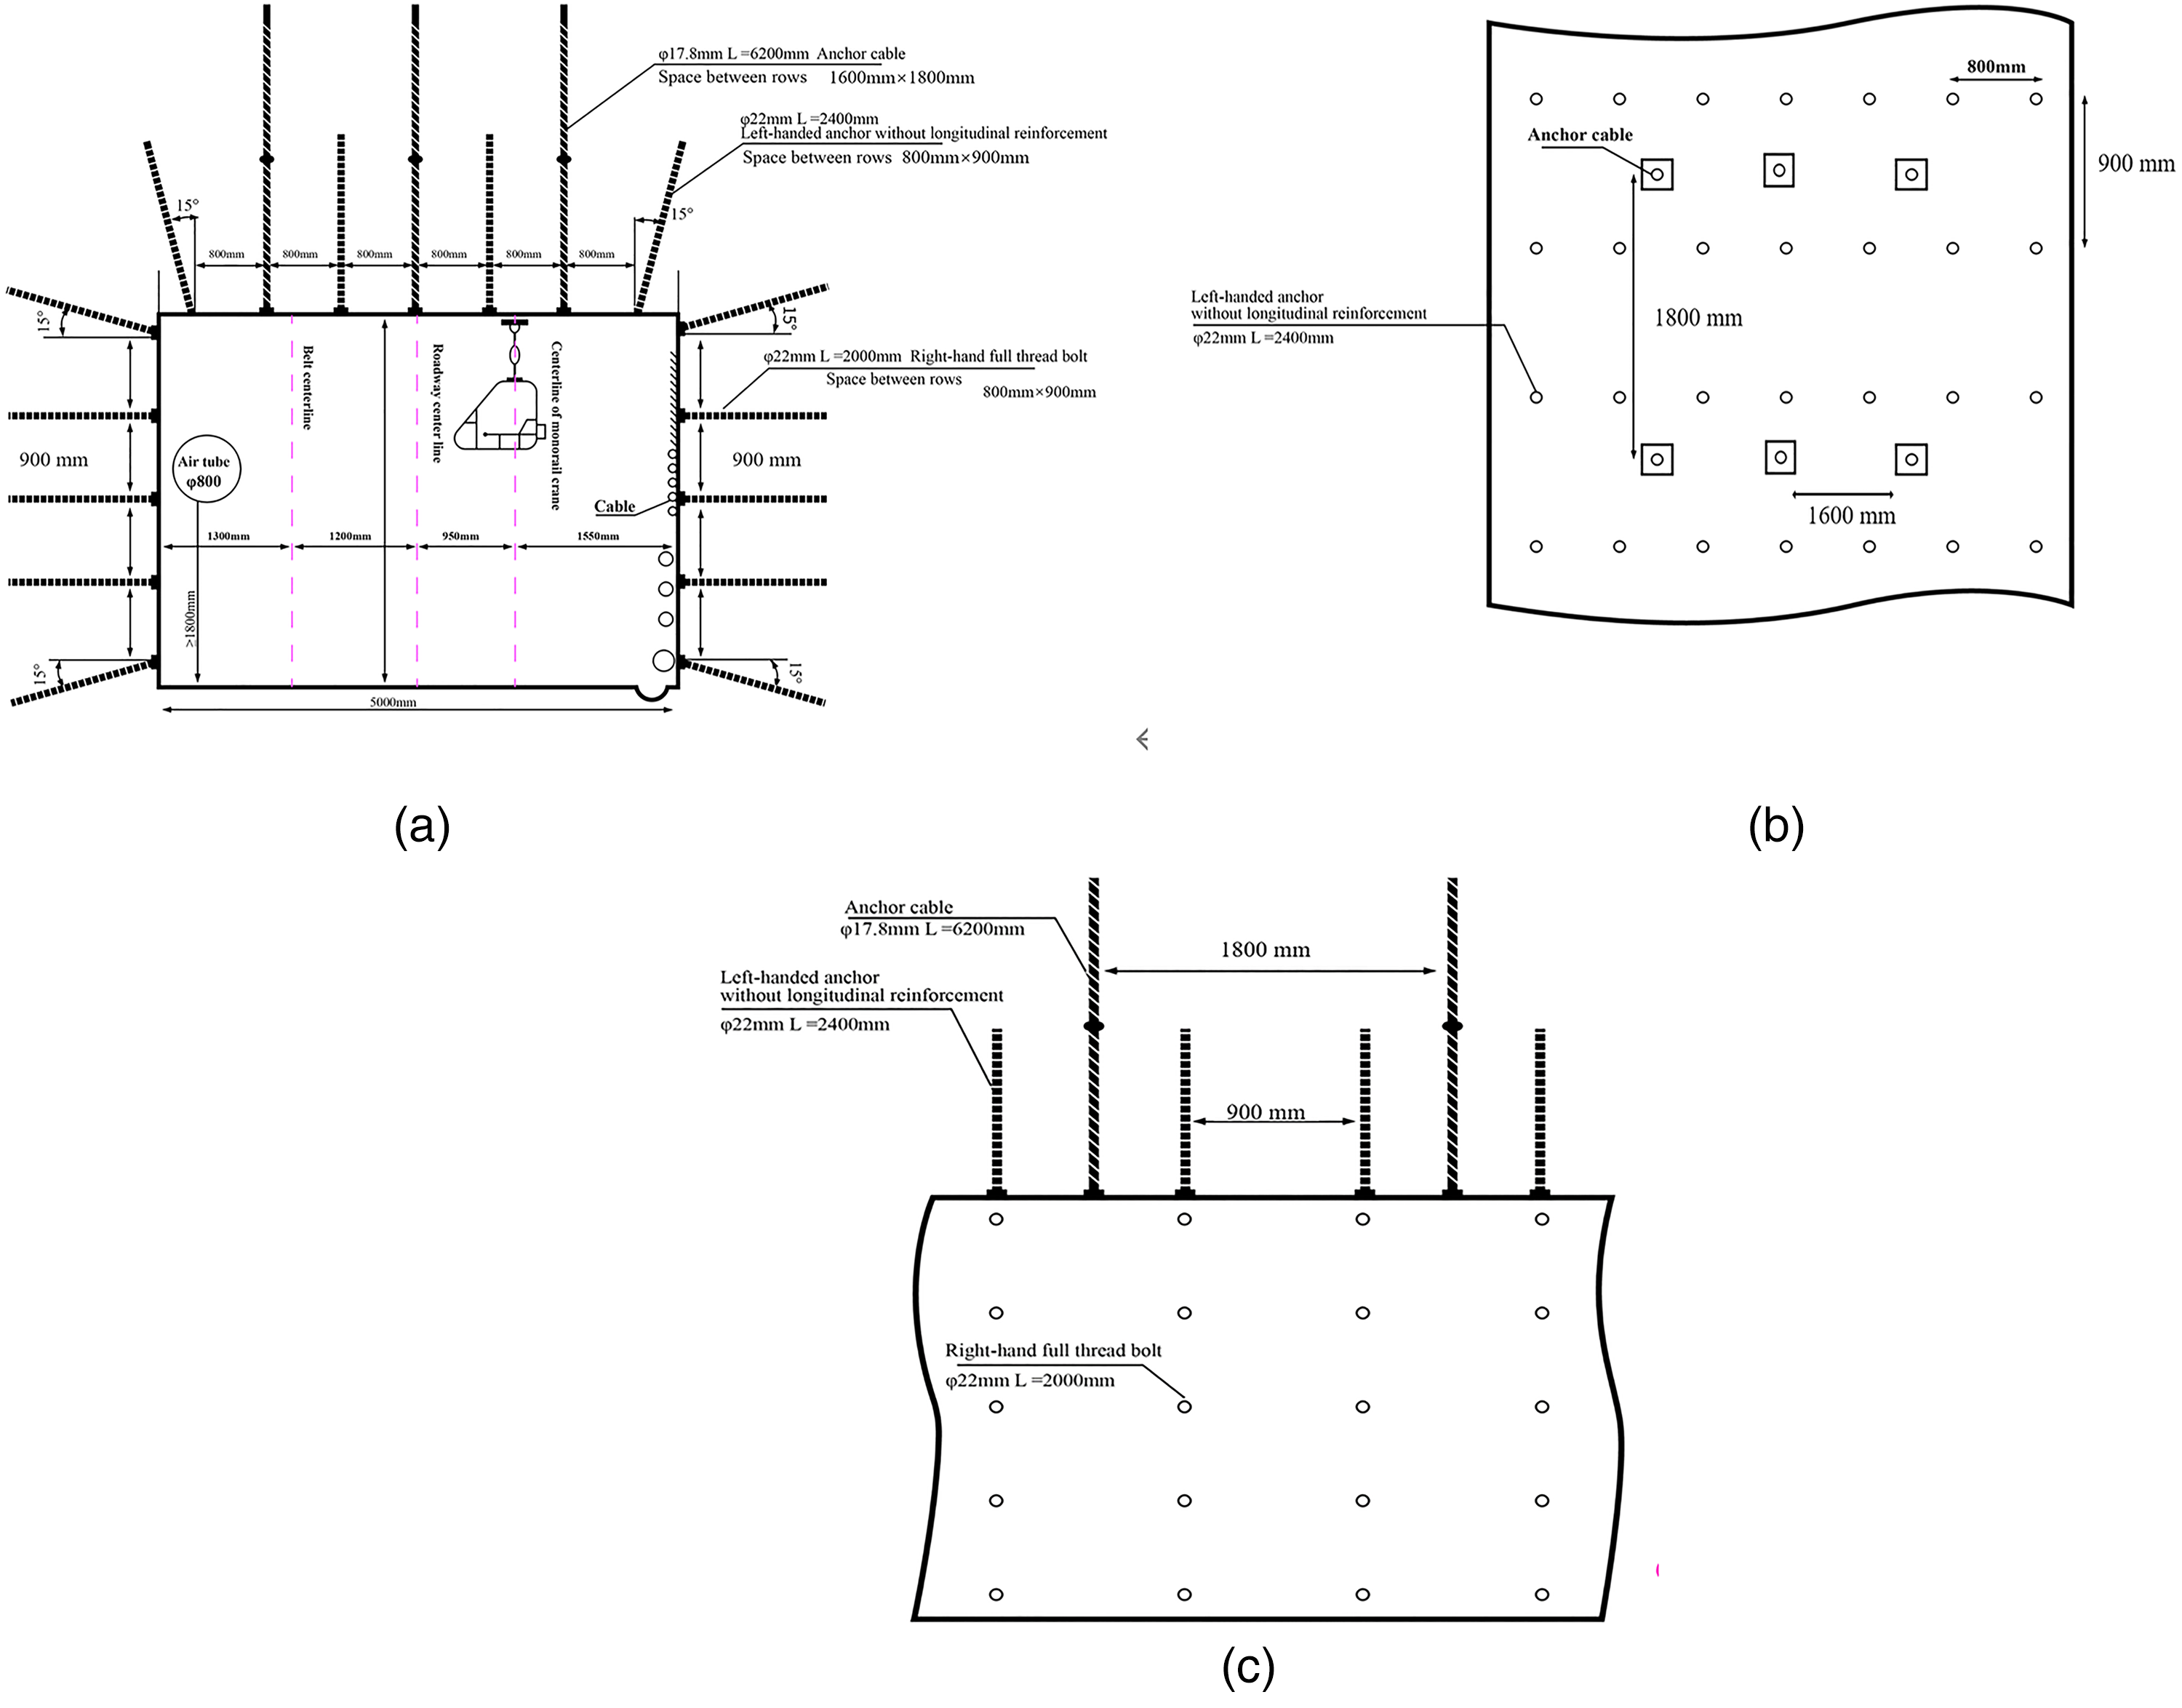
Design drawing of original support scheme. (a) Main view, (b) Top view, (c) Side view.
The lithology of the top and bottom slabs of the W3233 return airway primarily comprised mudstone, fine sandstone, and medium sandstone. The burial depth of the bottom slab was 279.05–830.05 m. The thickness of the sandstone was 1.55–50.55 m, with a 23.28 m average. Figure 3 shows a rock column diagram of the top and bottom slabs of the 32-coal seam.
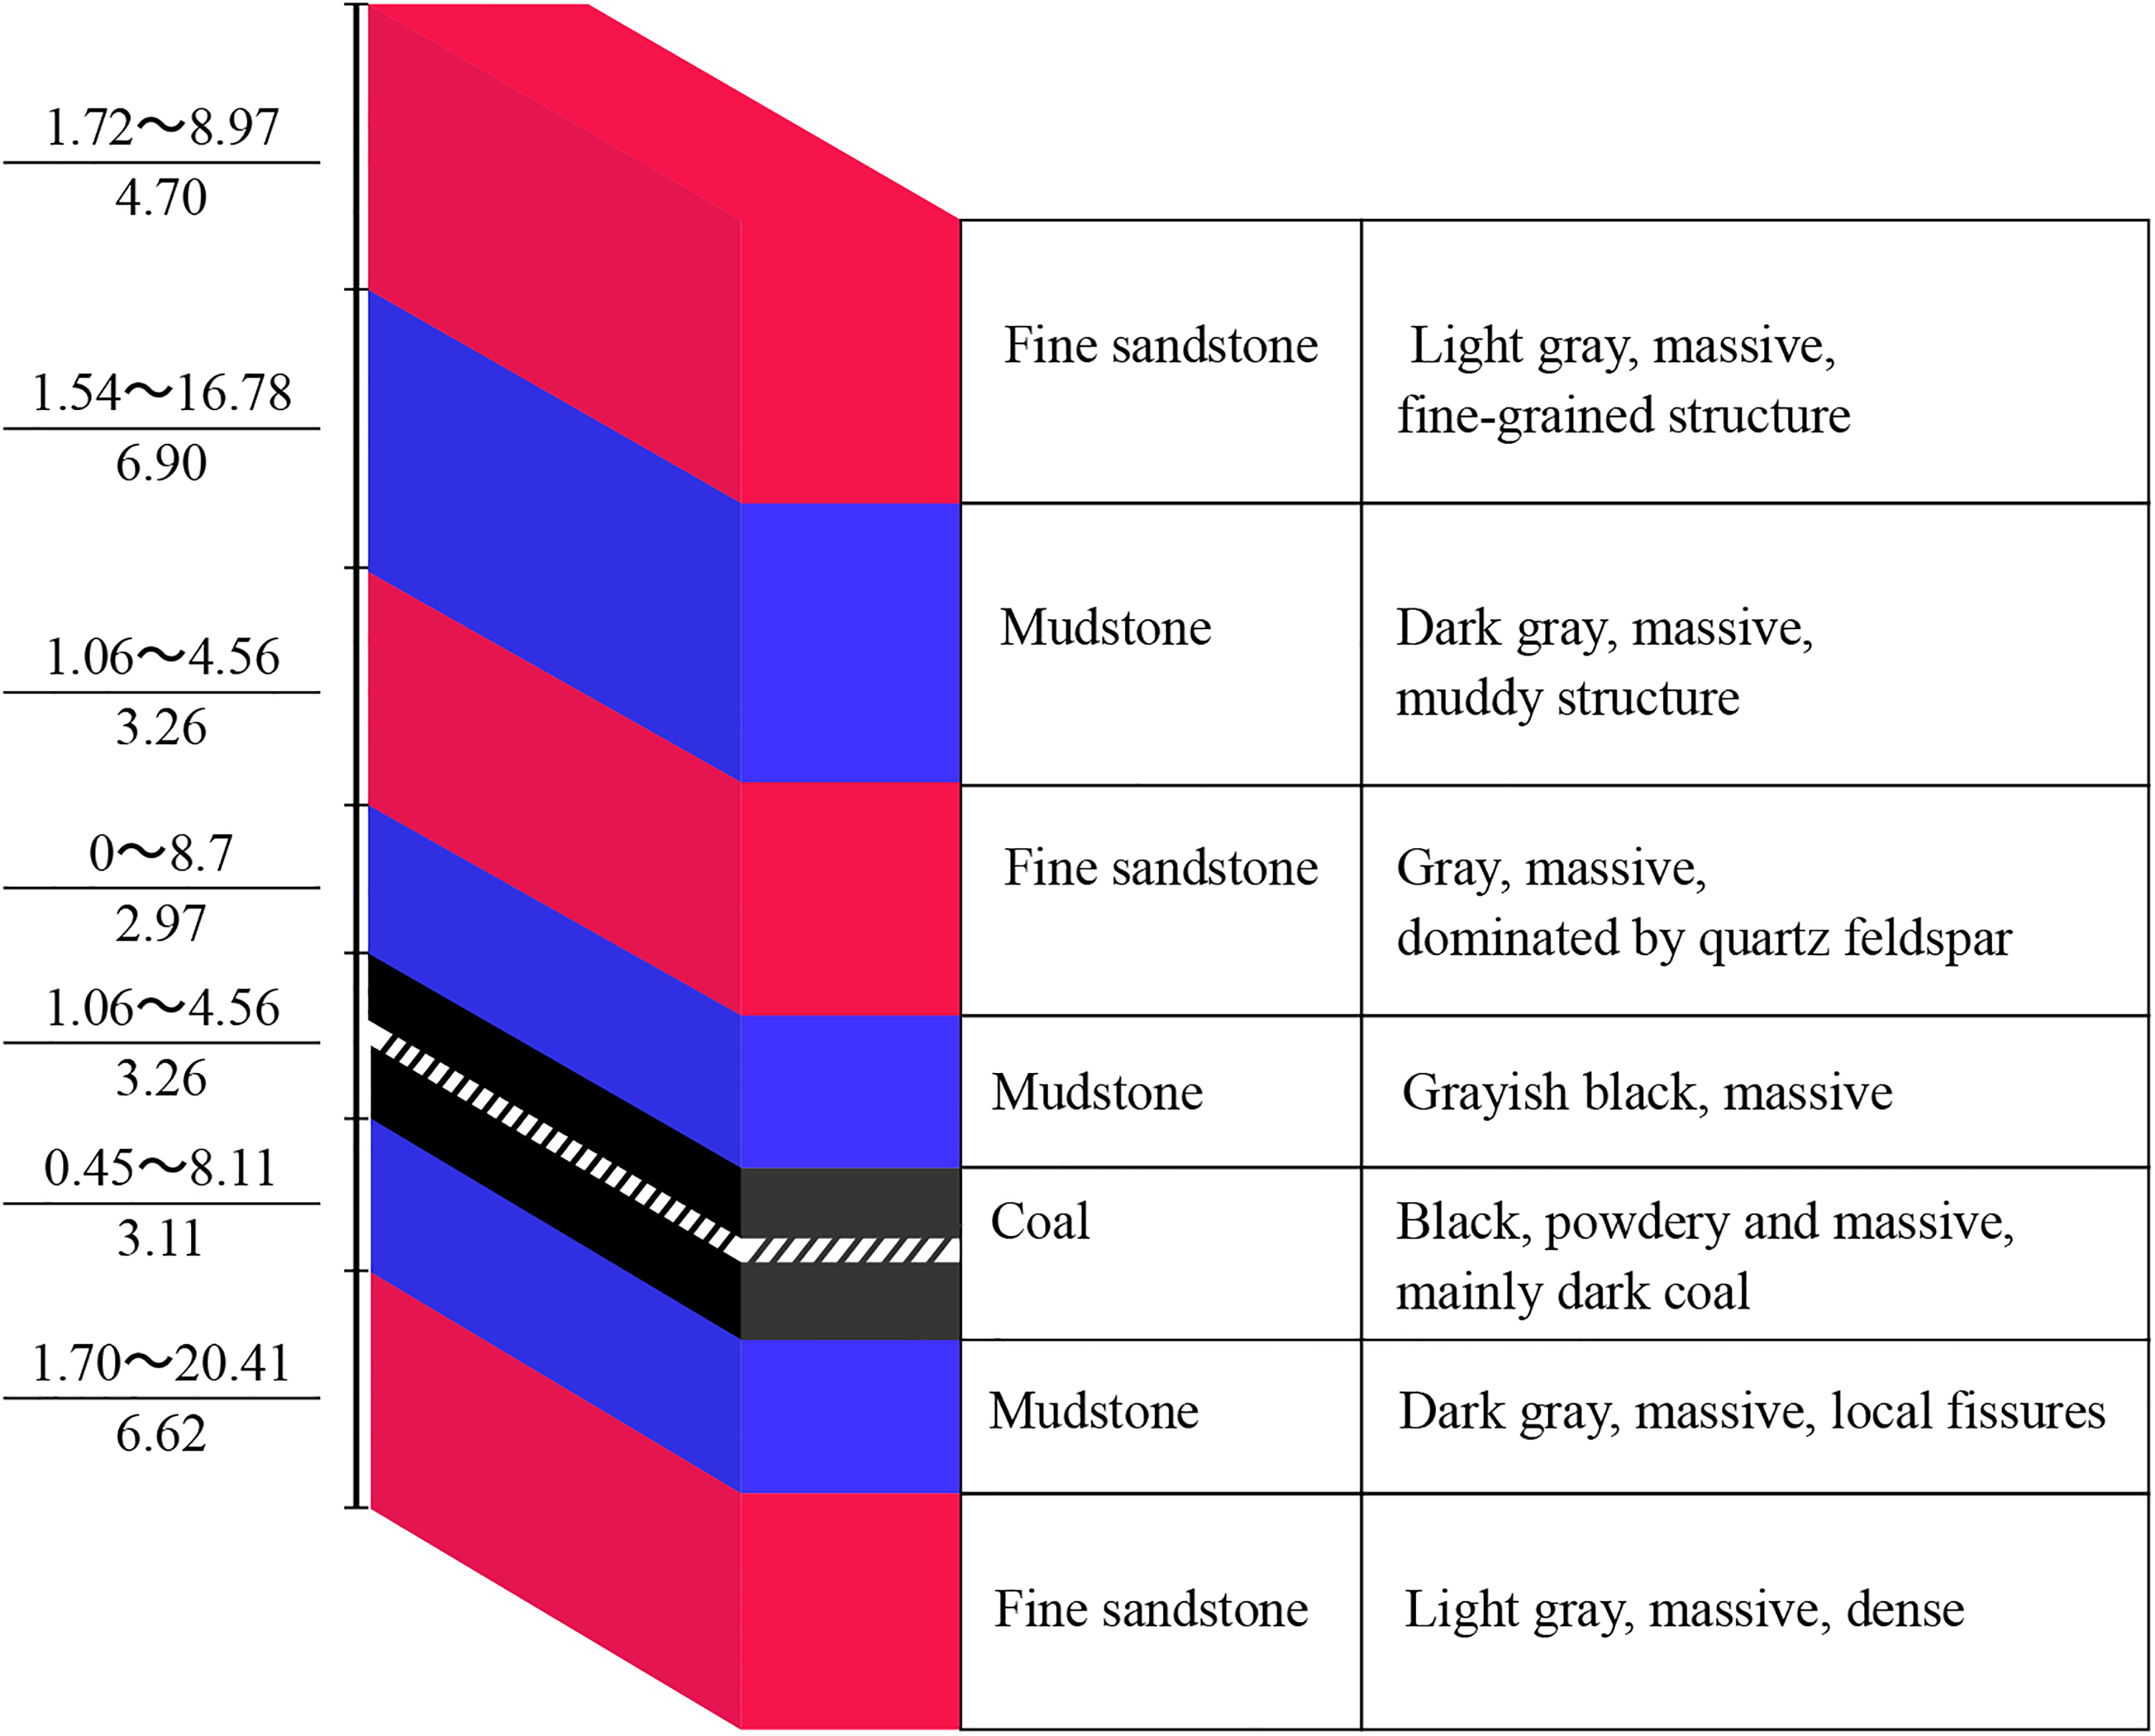
Column chart of the rock layer.
Analysis of rock sample parameters
Coal rock samples of the roof slab with different hole depths were taken from the boreholes in the roof of the W3233 return airway to determine the mechanical parameters of the surrounding rocks of the W3233 return airway. As shown in Figure 4, the samples were tested in a laboratory to calculate their elastic modulus, cohesion, uniaxial compressive strength, Poisson's ratio, and uniaxial tensile strength. The results served as data support for optimizing the roadway support scheme, numerical simulations, and 3D similar simulation experiments.
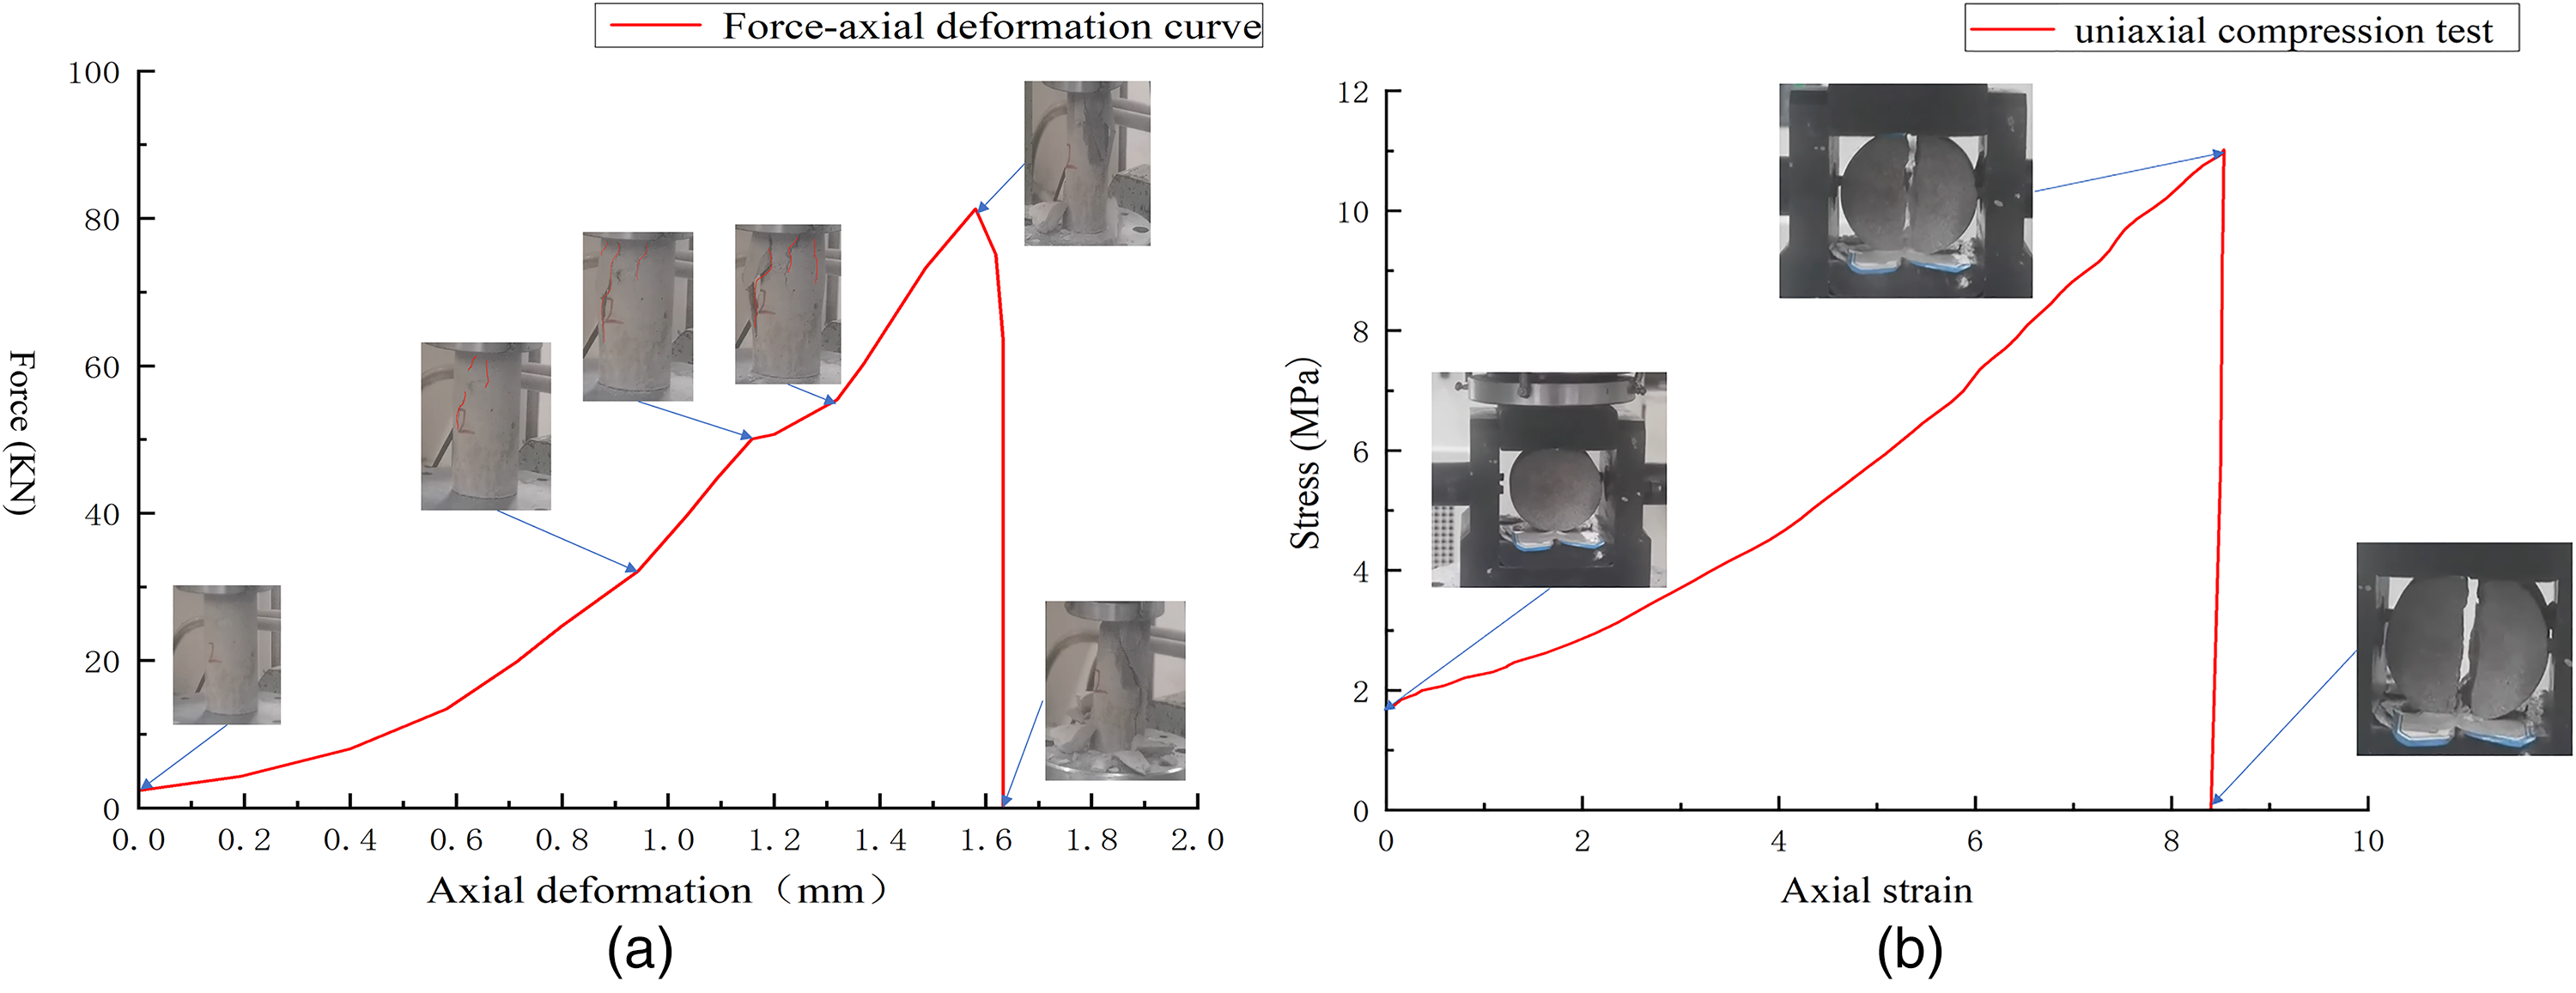
Rock mechanical properties test. (a) Force–axial deformation curve, (b) Stress–strain curve.
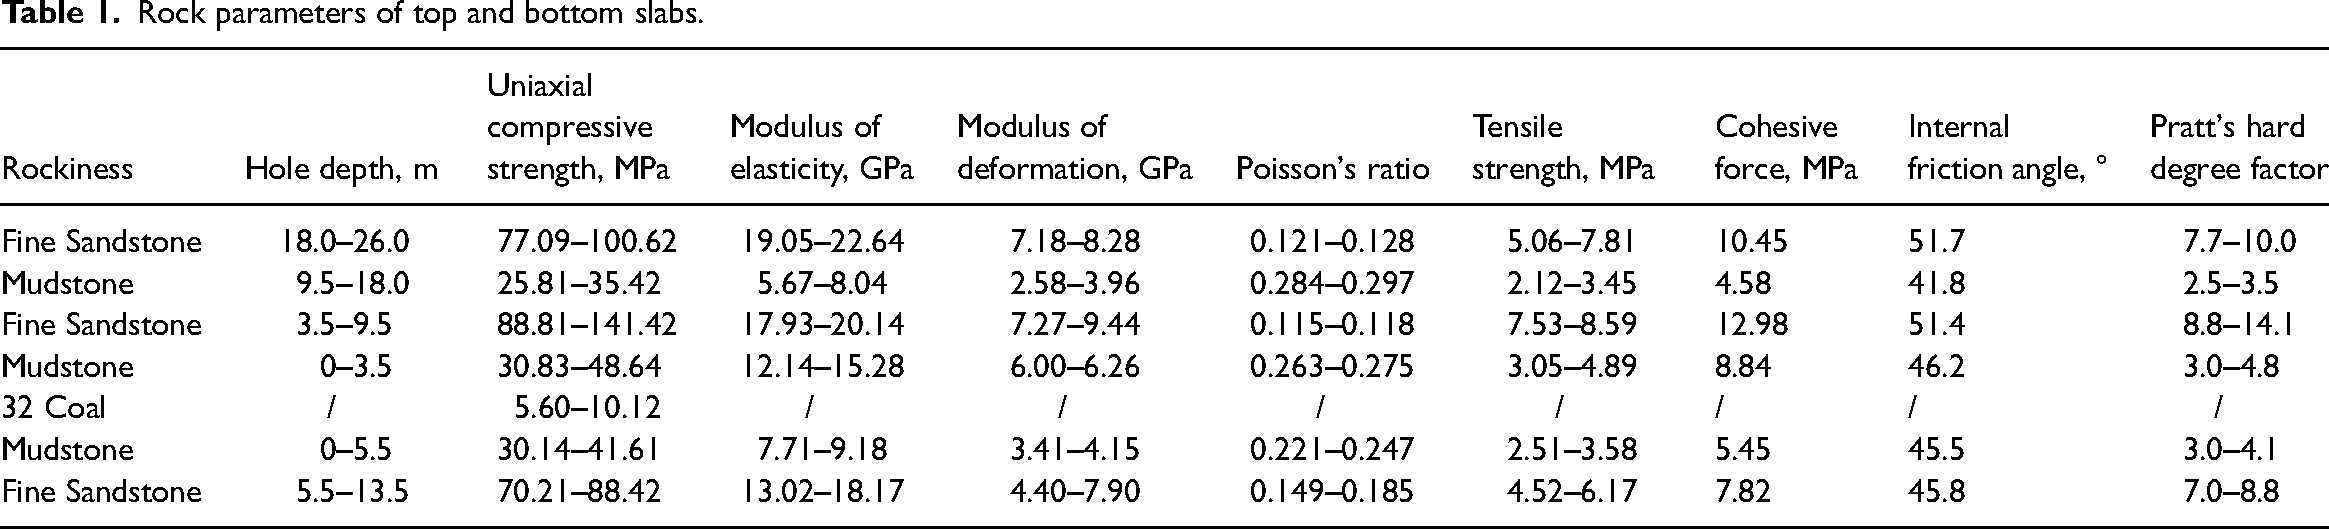
The specimens were processed into standard cylindrical specimens with a 50 mm diameter and 100 mm height in the laboratory using a double-knife rock-cutting machine and double-end rock smoother. Uniaxial compression and splitting tests were performed on the specimens. The stress–strain and force–axial deformation diagrams of the specimens were obtained after the tests. A comprehensive analysis of the images indicated that after the longitudinal load was applied to the specimen, longitudinal crack development rapidly reached the threshold limit of compressive strength, dropped steeply, and finally leveled off. Table 1 lists the physical properties of the rock parameters obtained from the calculation according to the mechanical equation.
Rock parameters of top and bottom slabs.
Research on roadway support parameters and support process
First, the bolt support theory was applied to determine the reasonable support parameters and layout of the roadway based on the theoretical derivation of the bolt and anchor cable spacing (Qian et al., 2015). In addition, a mechanical model for calculating the maximum roof clearance was constructed to determine whether the mine has the conditions for roof clearance operation. Accordingly, two optimization schemes were proposed. Second, the control effects of different supports on the rock surrounding the roadway were compared based on the rock damage theory and numerical simulation. Third, the optimal support parameters were selected, the lagging support process was applied, and the numerical simulation results were compared to determine the best lagging support optimization scheme to control the surrounding rock deformation, as shown in Figure 5.
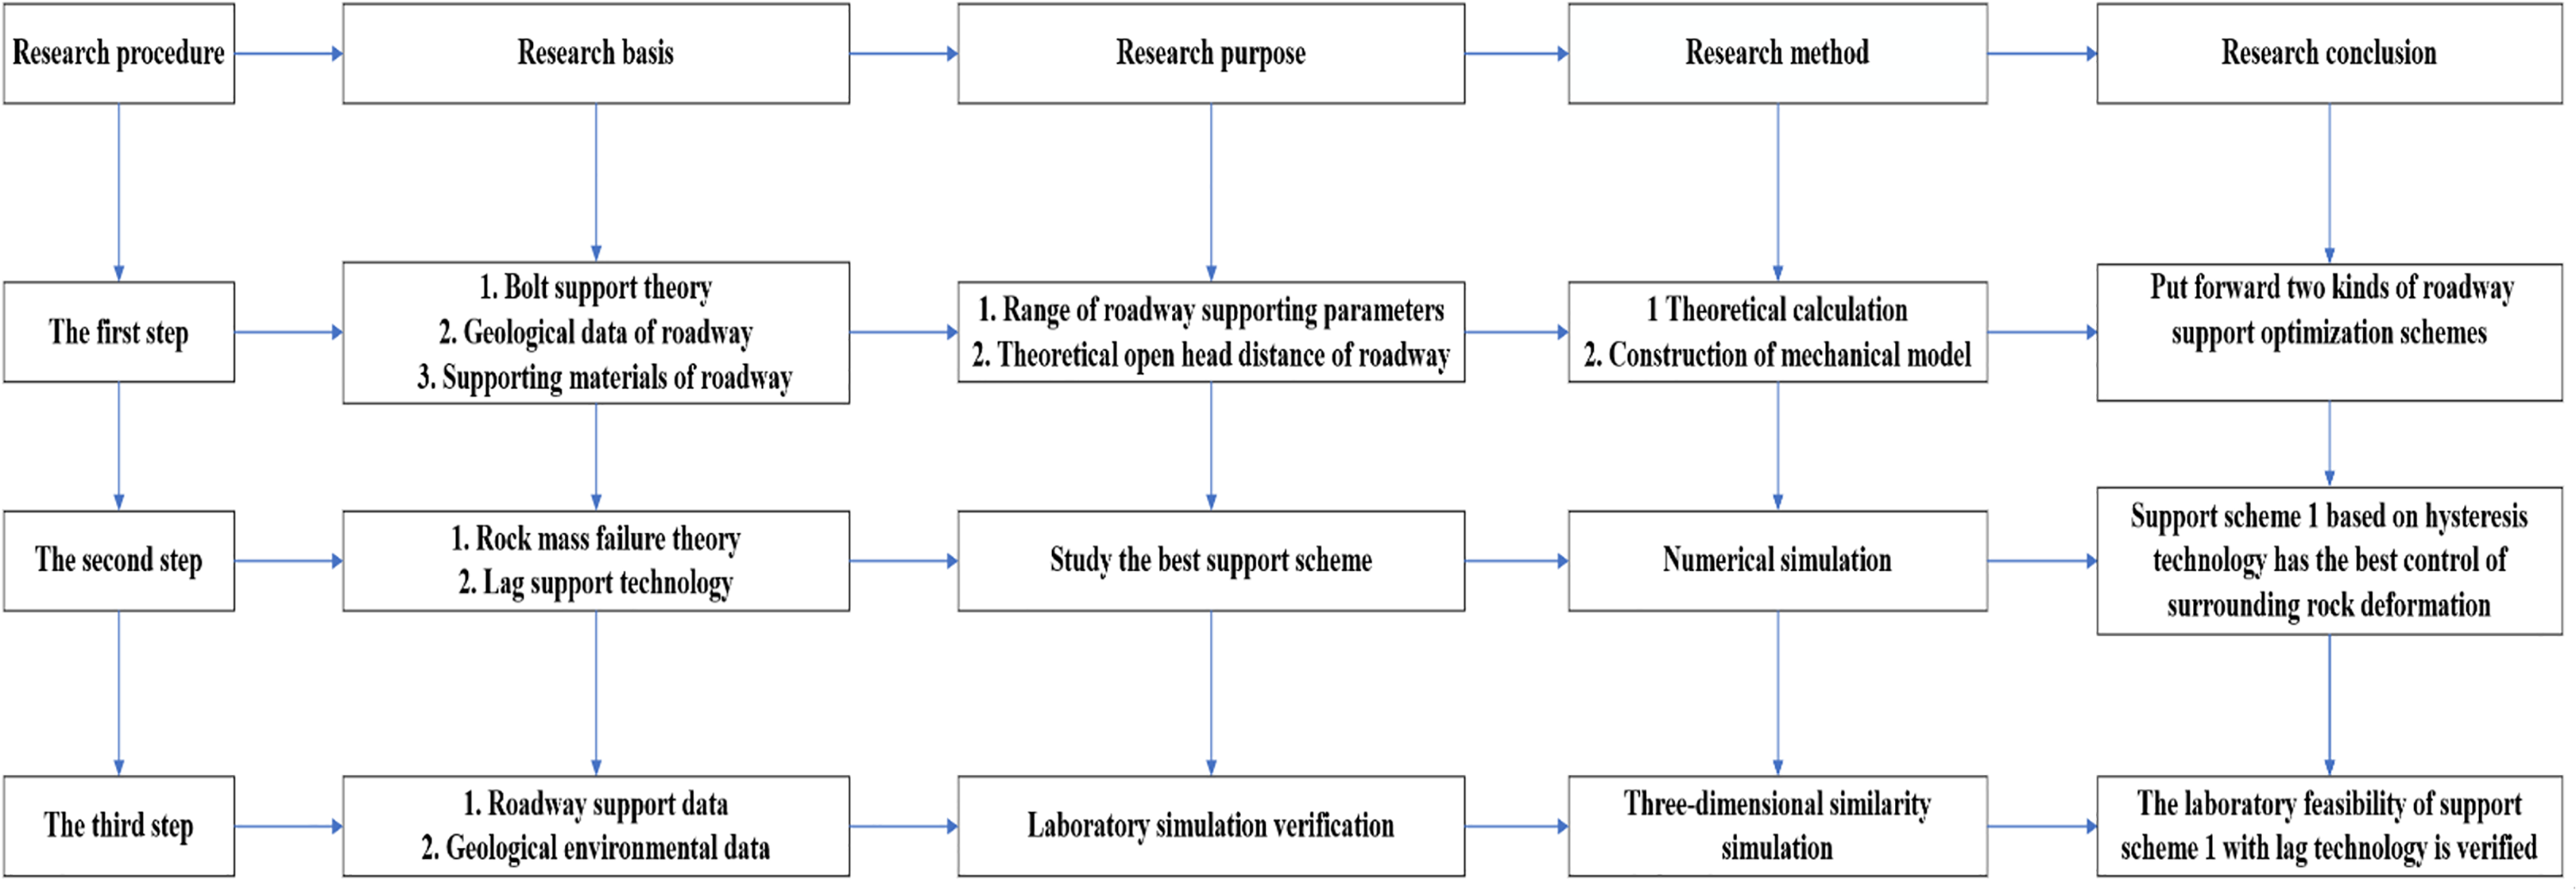
Flowchart of the experimental study.
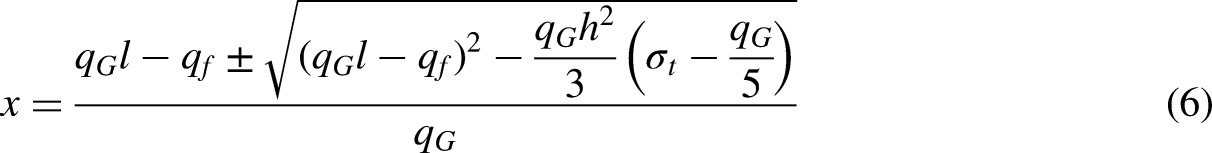
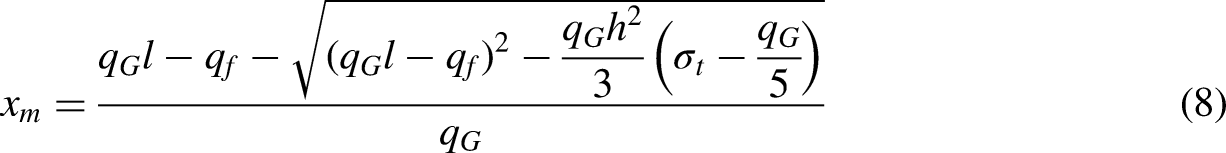
Analysis of the empty top distance
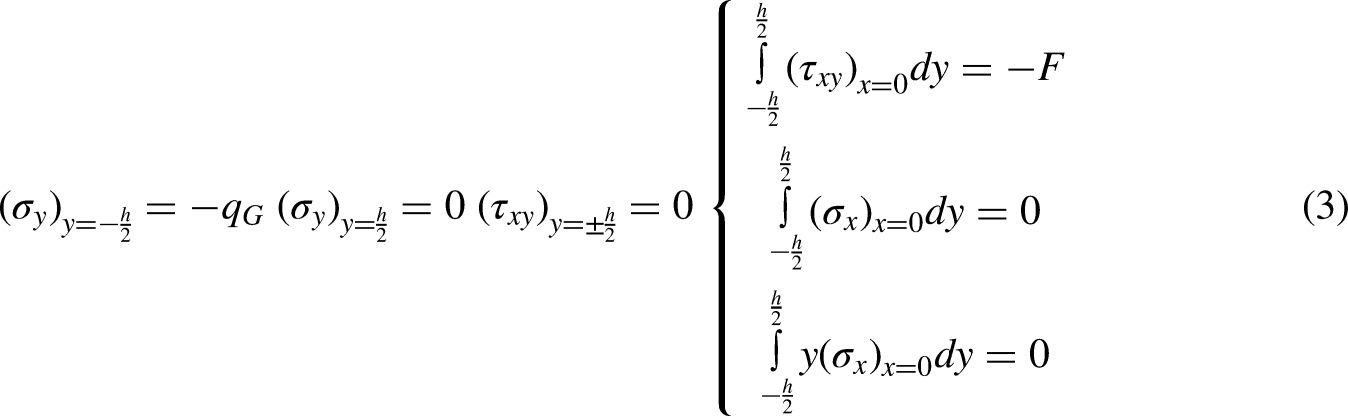
The redistribution of stress in the surrounding rock as the roadway is excavated reduces the effect of the surrounding rock support, making the direct top of the roadway prone to collapse. Therefore, a mechanical model of the excavated working face was established. The section of the axial excavation of the roadway was made as shown in Figure 6. The influence area of the headway was divided into coal wall support, support, and empty roof areas. The direct roof of the intermediate section was studied.
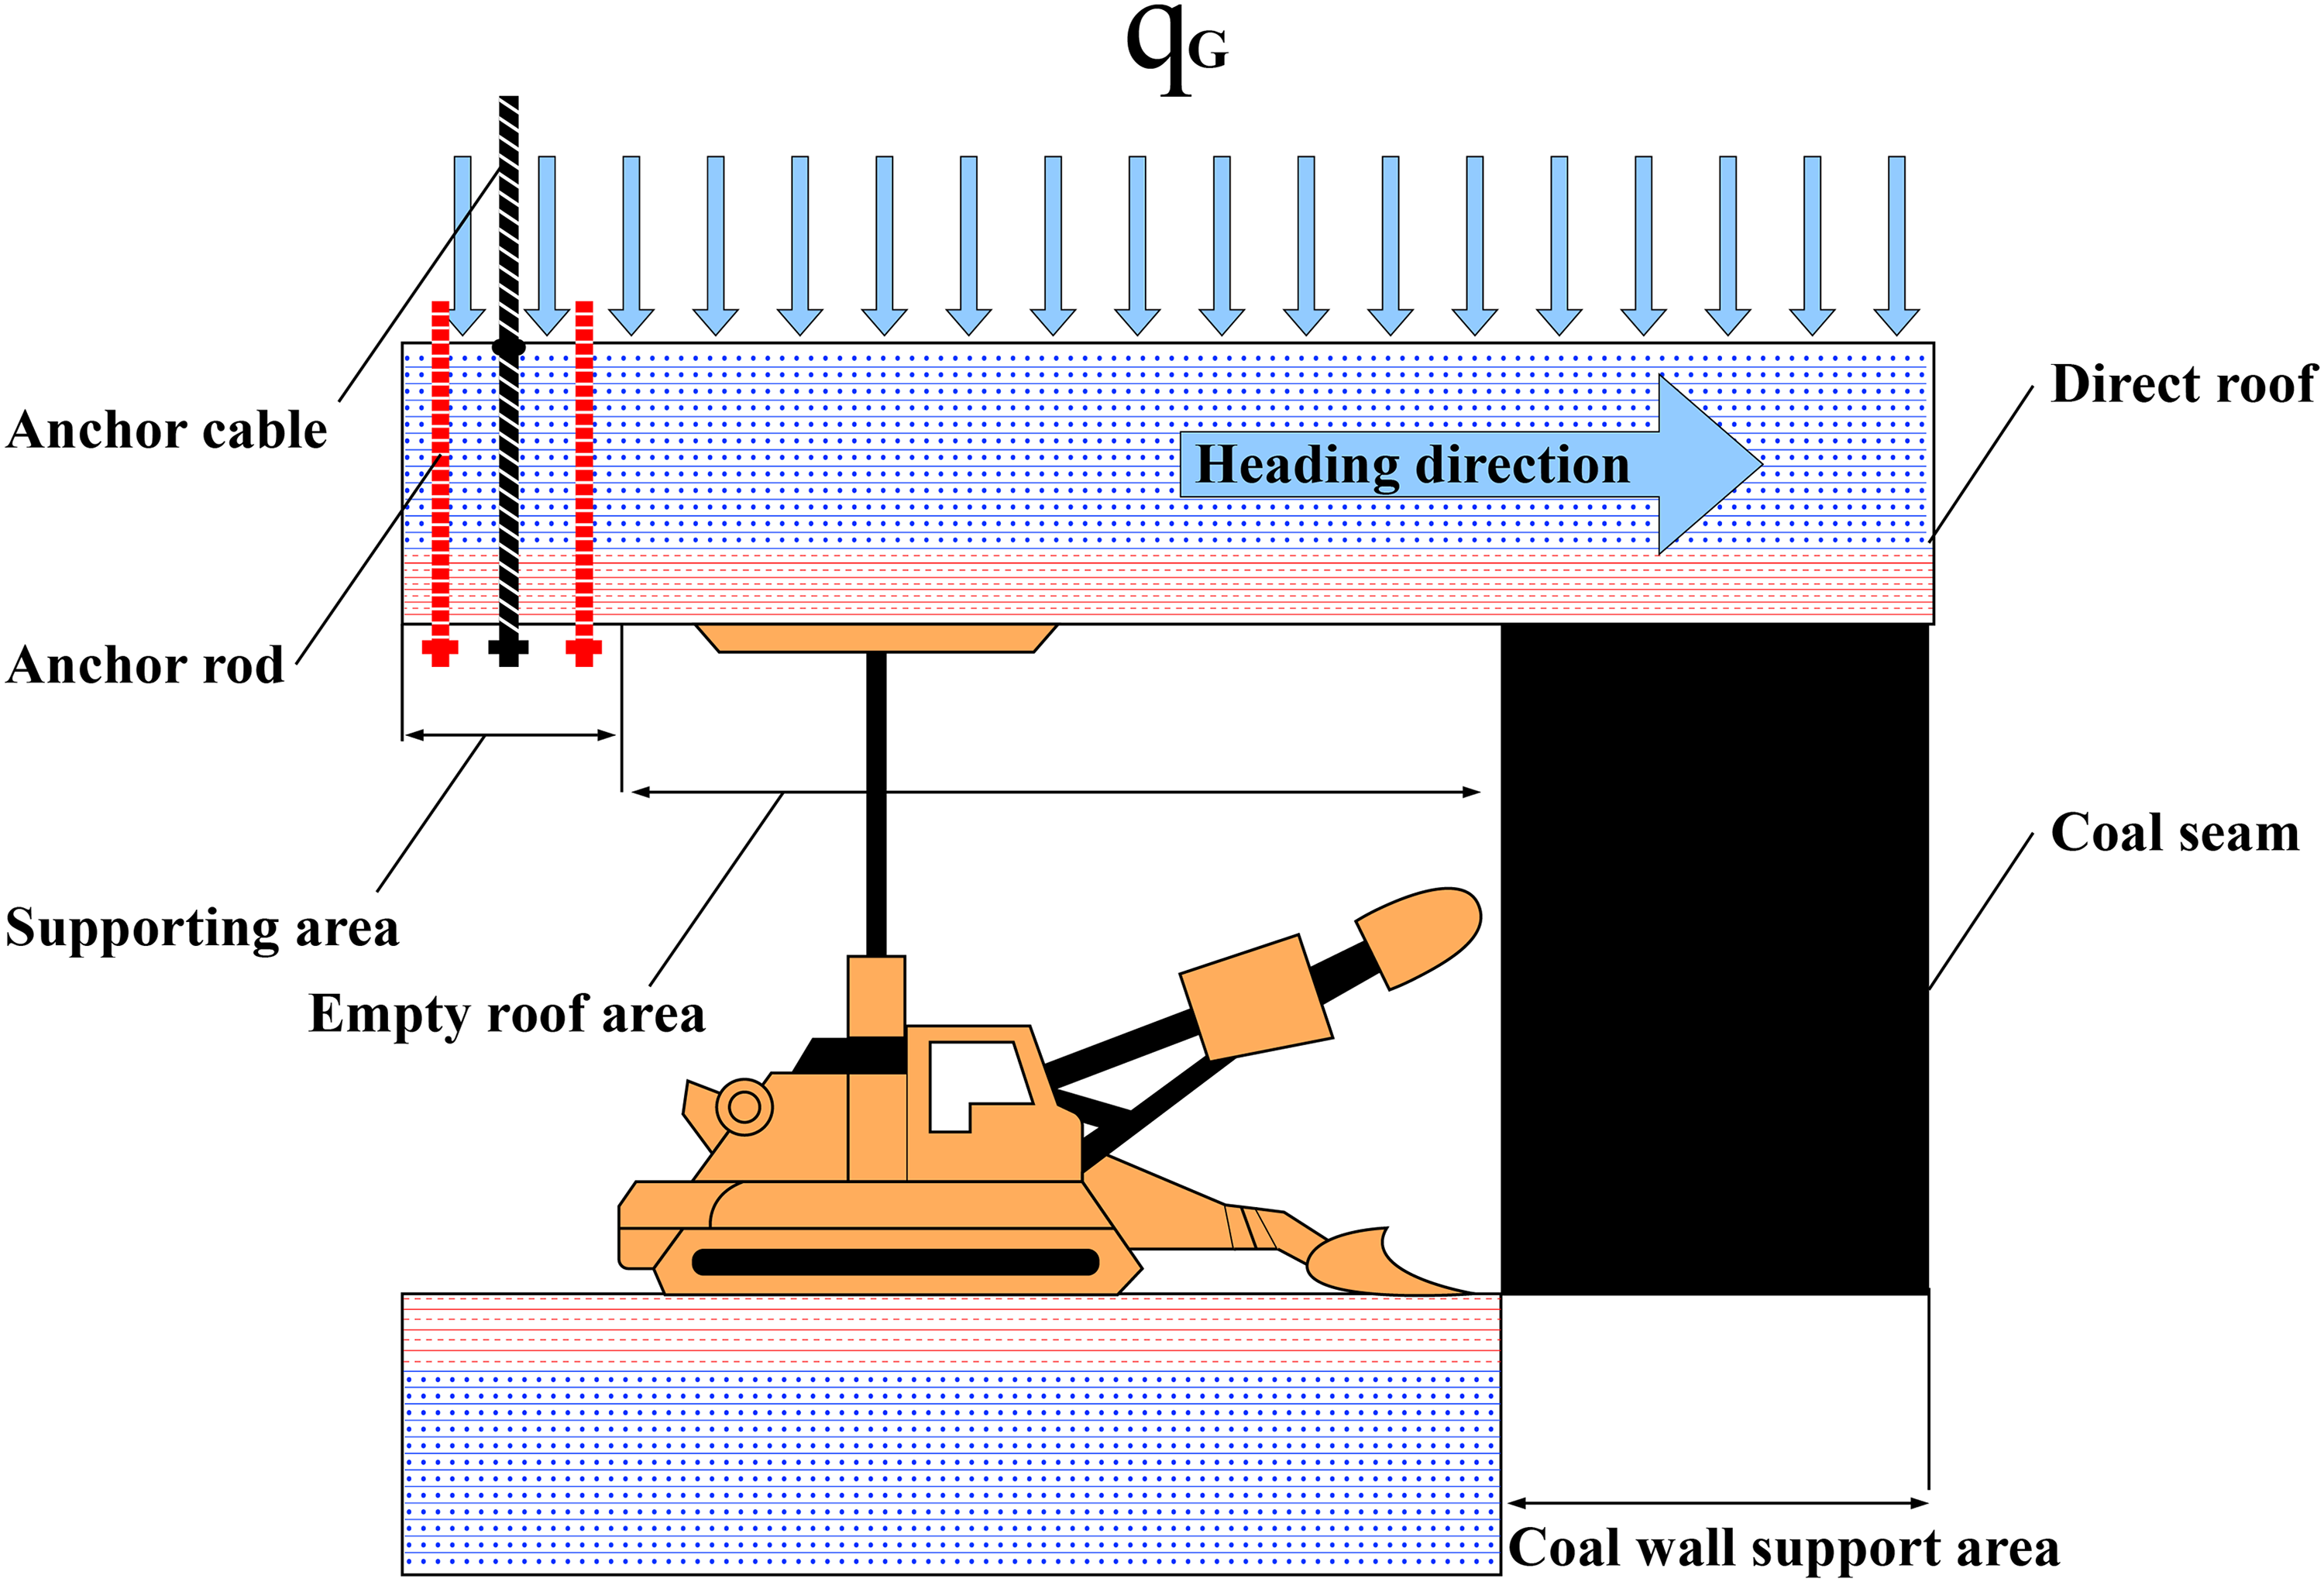
Mechanical model of the top plate in the area of the roadway excavation working face.
After the support, the surrounding rock stress regained equilibrium, and the deformation resistance and bearing capacity of the support and empty roof areas changed more. Therefore, the coal wall support and support areas in Figure 4 were considered as the unit length. The static friction resistance
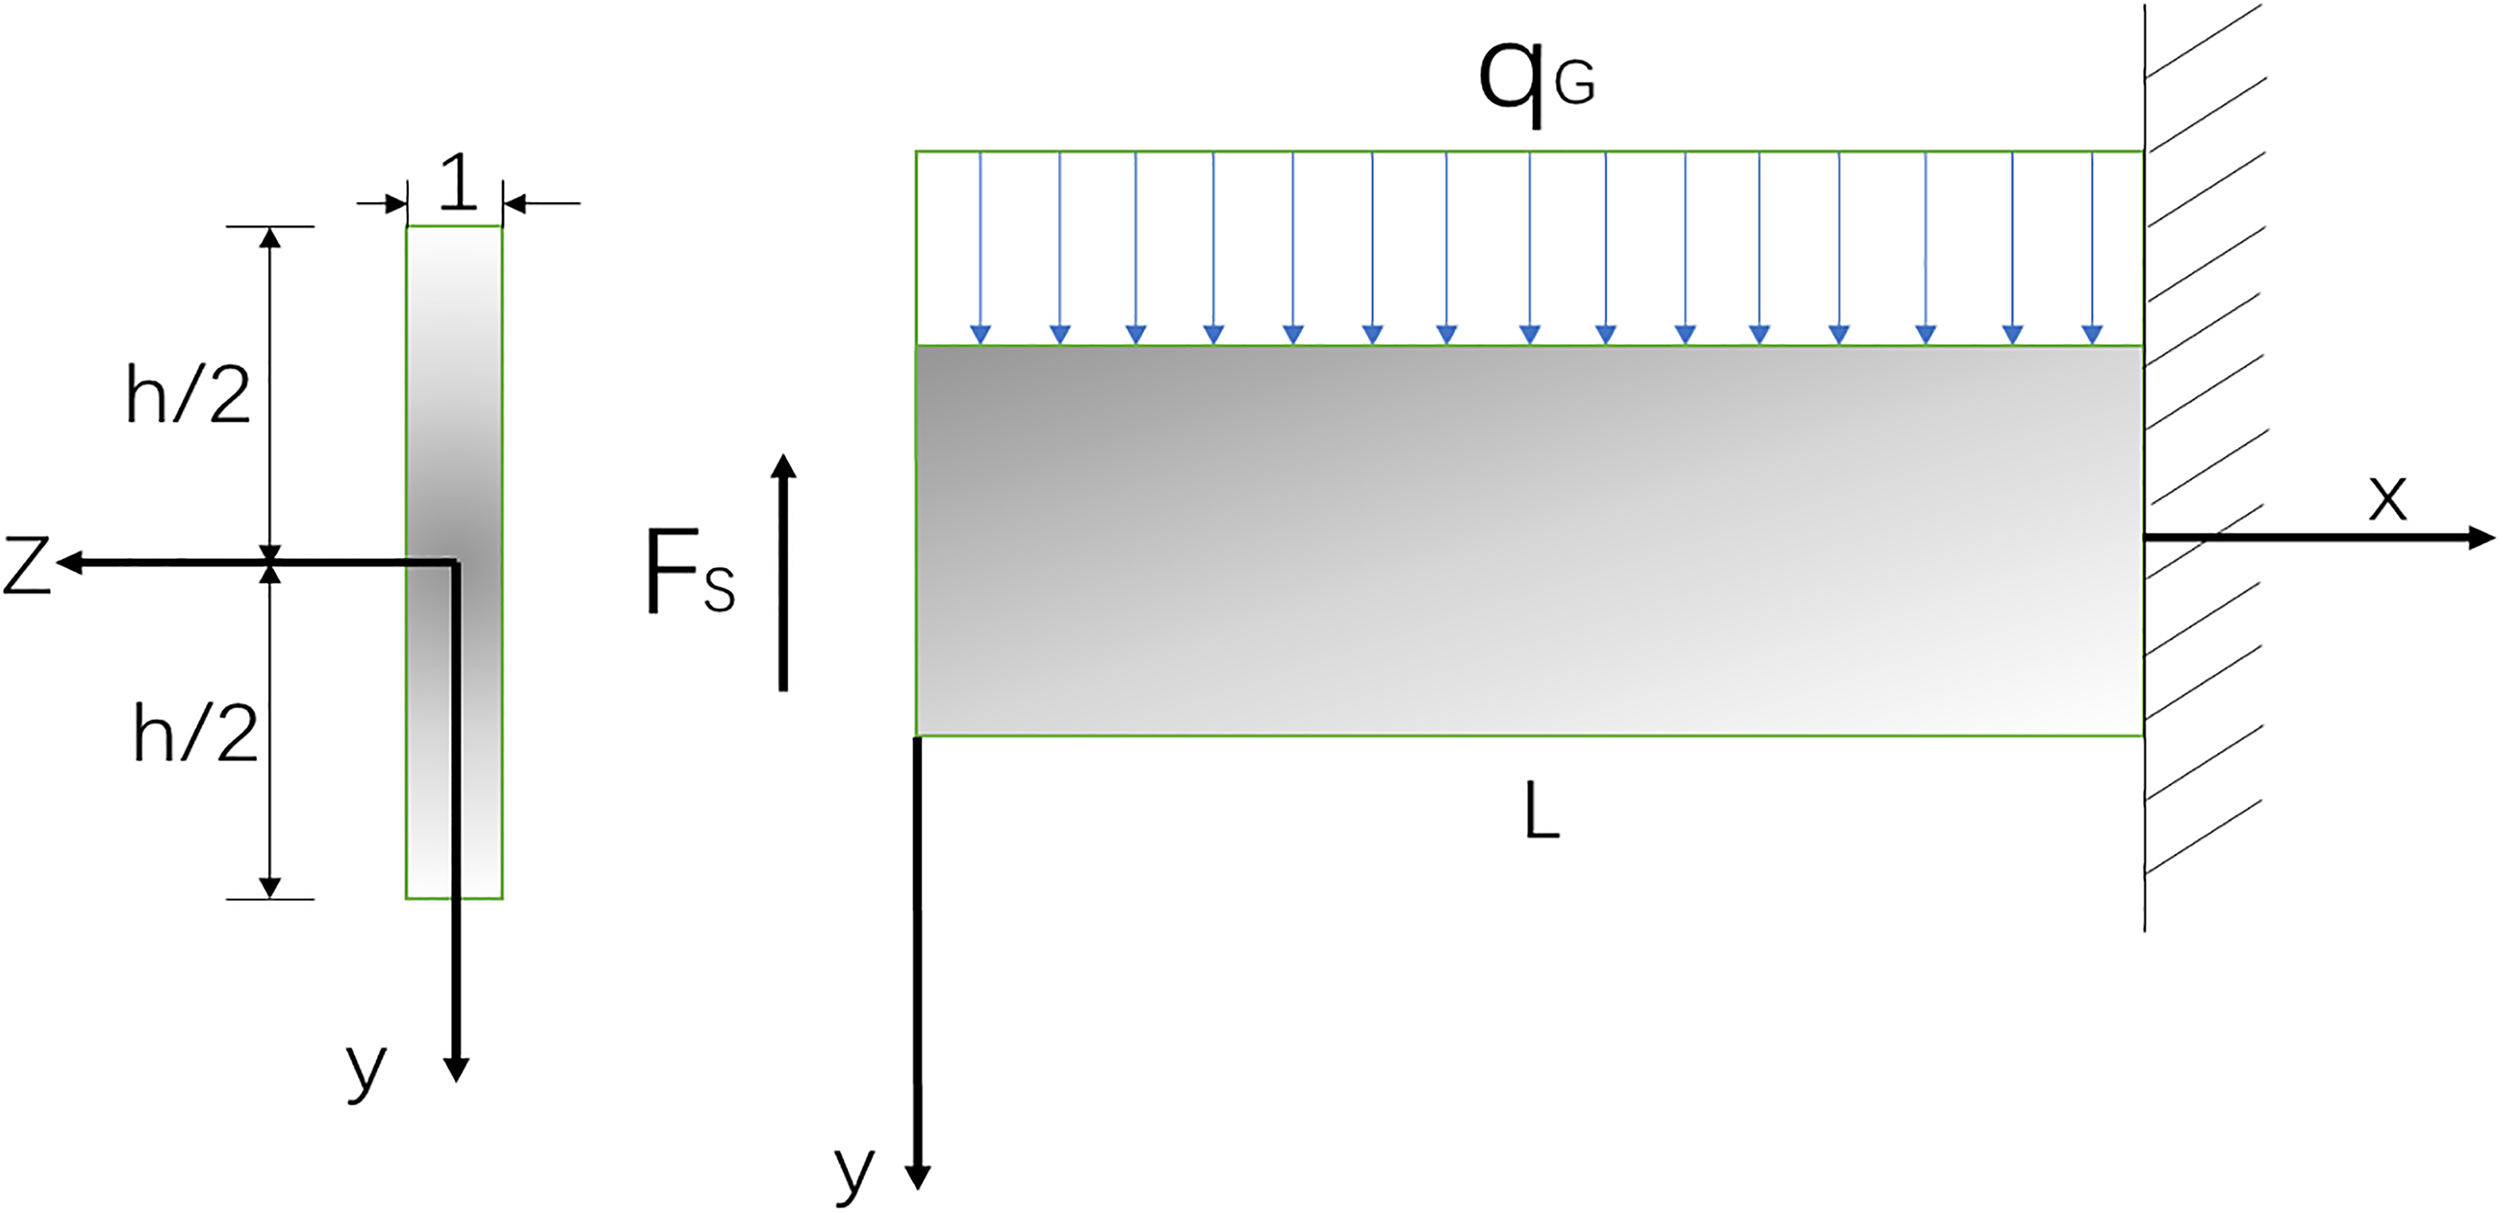
Simplified mechanical model of the top plate.
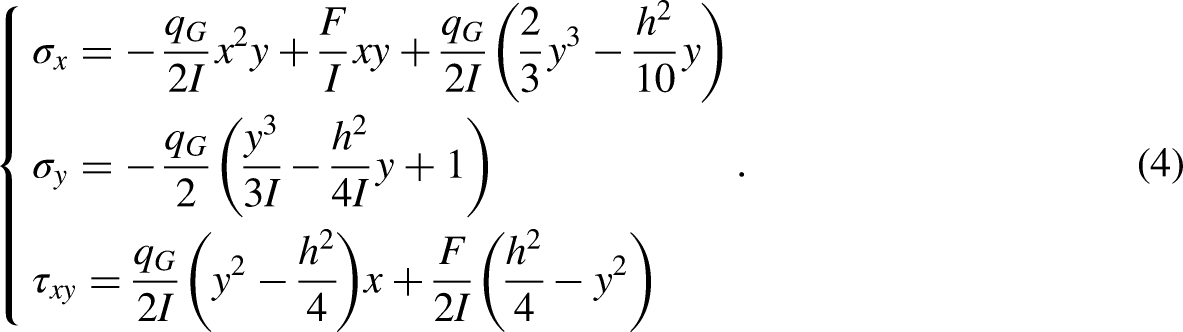
In the following elastic mechanical stress function,


Numerical simulation
The geometric model of the W3233 return airway was established based on the rock-breaking theory using FLAC3D software. The changing pattern of the surrounding rock with the excavation depth was studied by comparing the vertical stress, plastic zone, and displacement clouds under different support schemes. The optimal support parameters were found by applying the lagging process.
Establishing the geometric model
The geometric model was constructed according to the Mohr–Coulomb yielding criterion, in which the tensile strength of the rock mass is considered as damage to the rock mass (Wang et al., 2012).


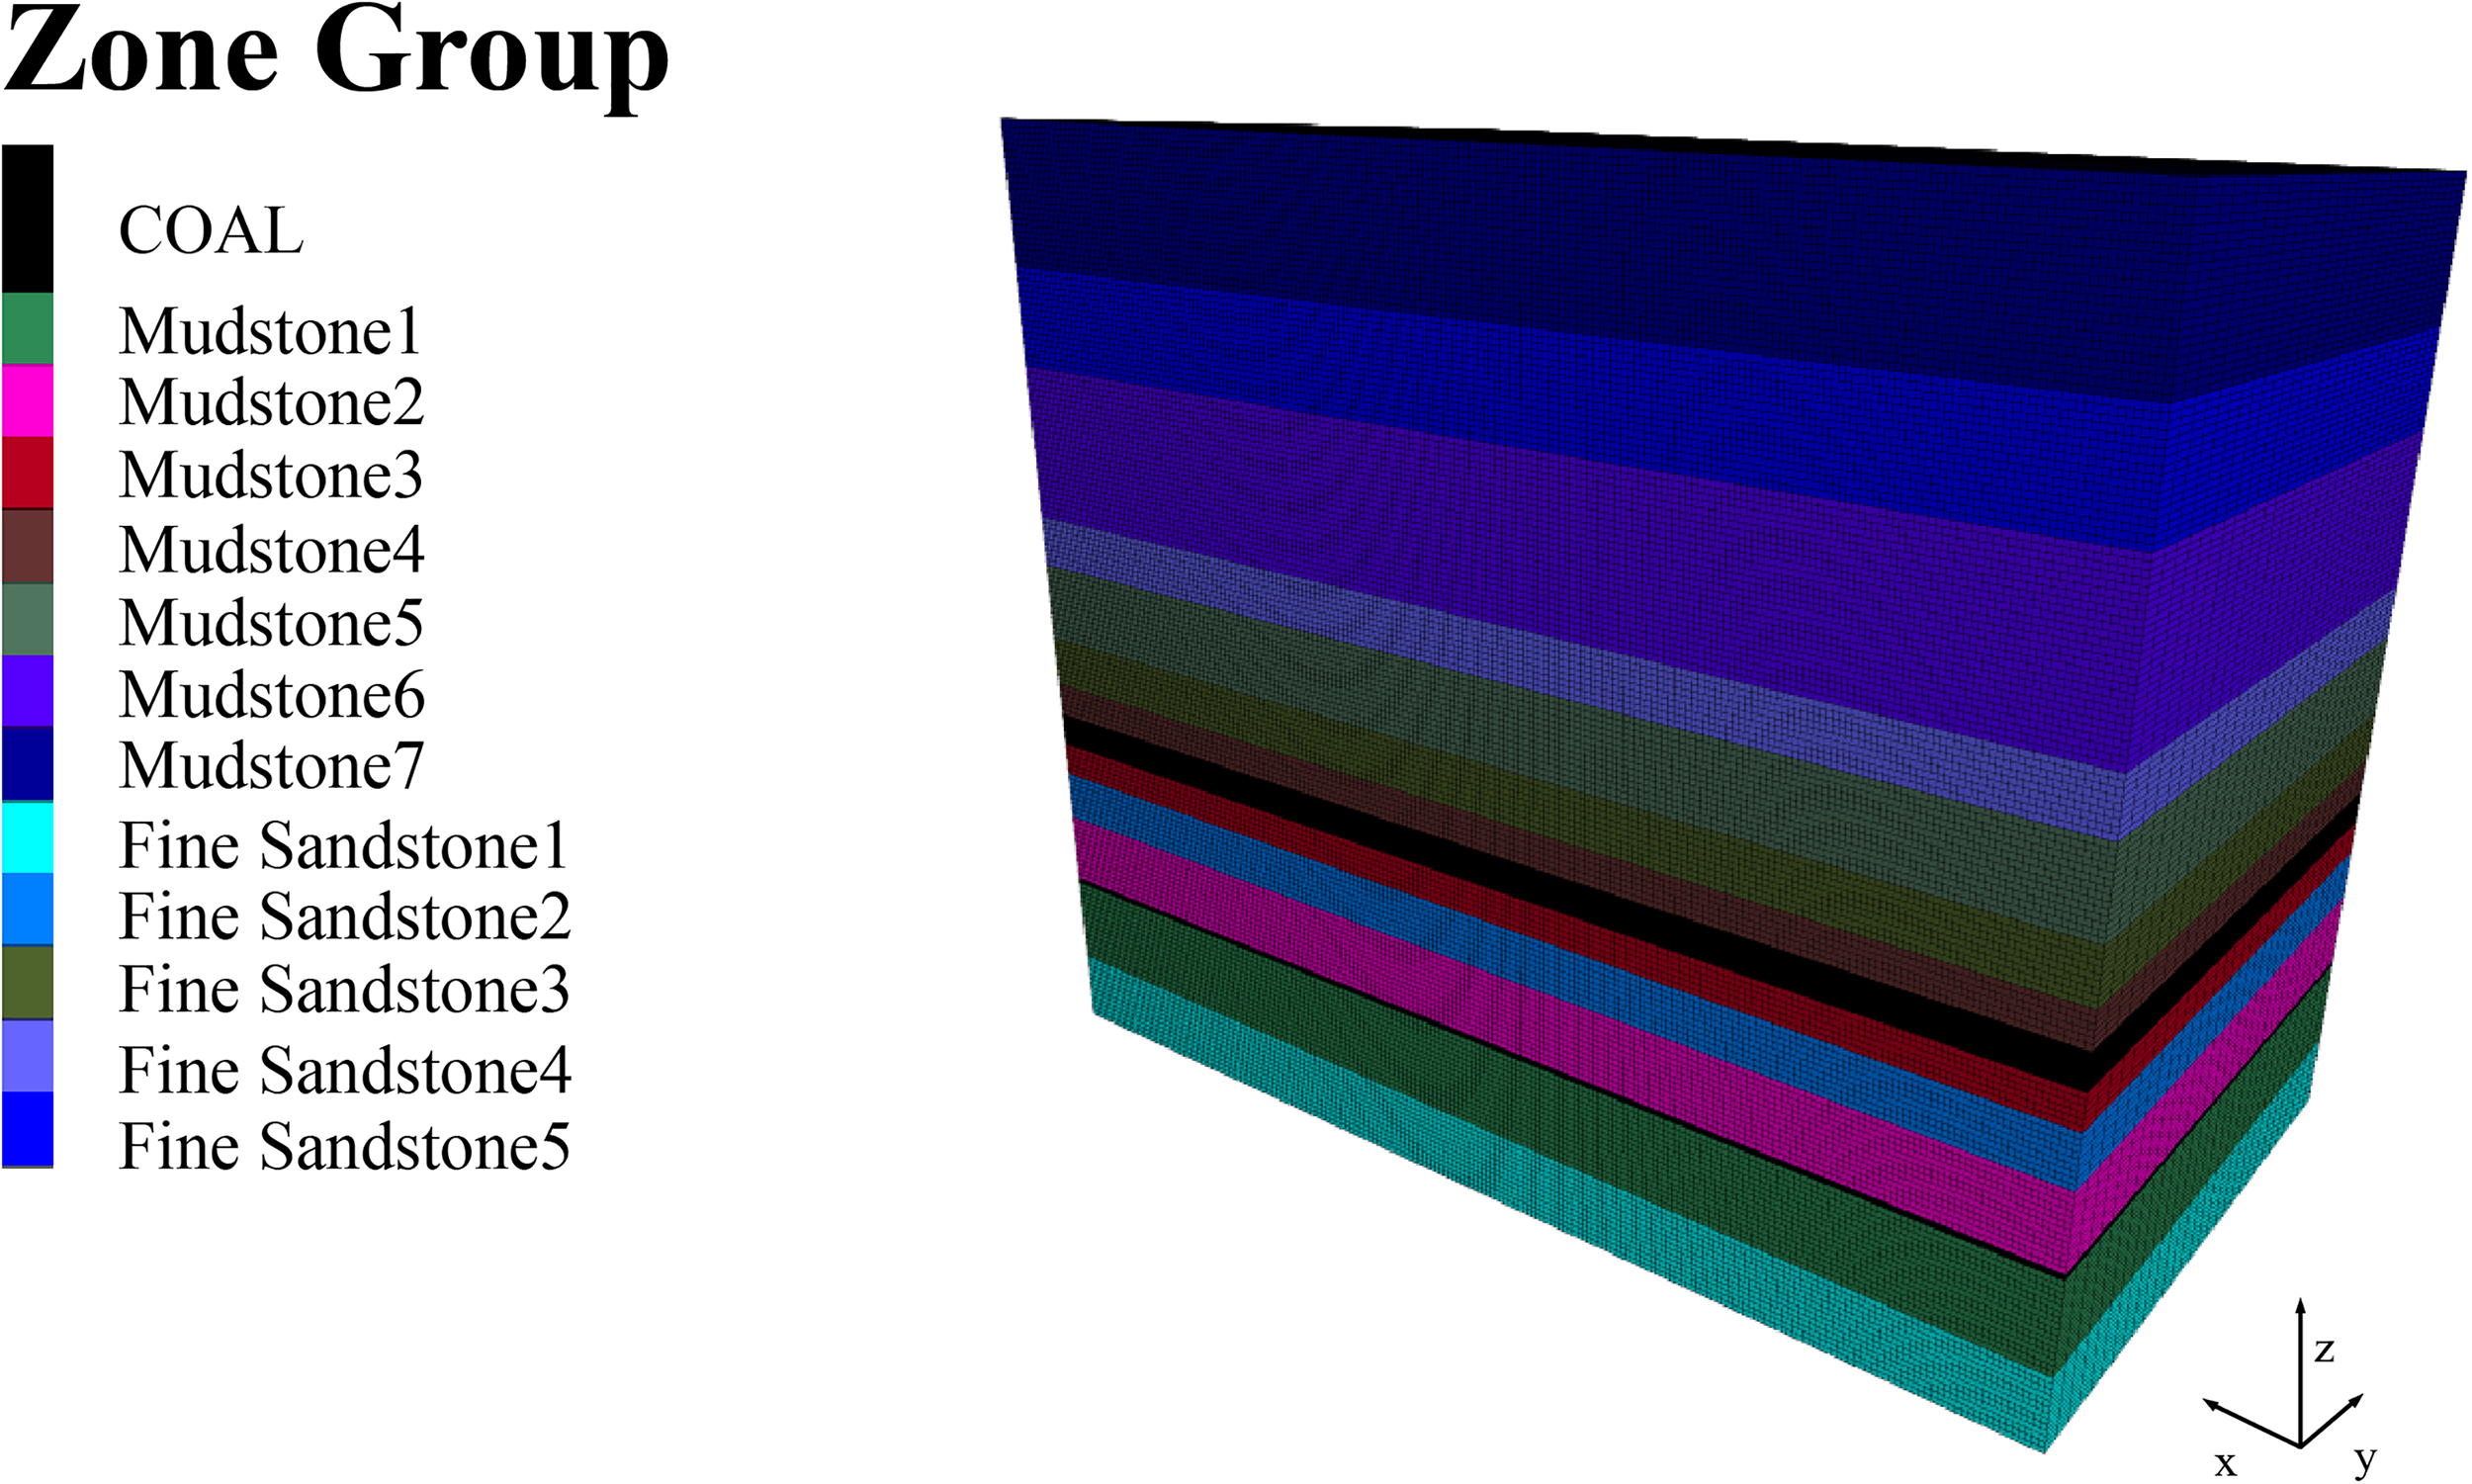
FLAC3D model diagram.
Comparative analysis of support solutions
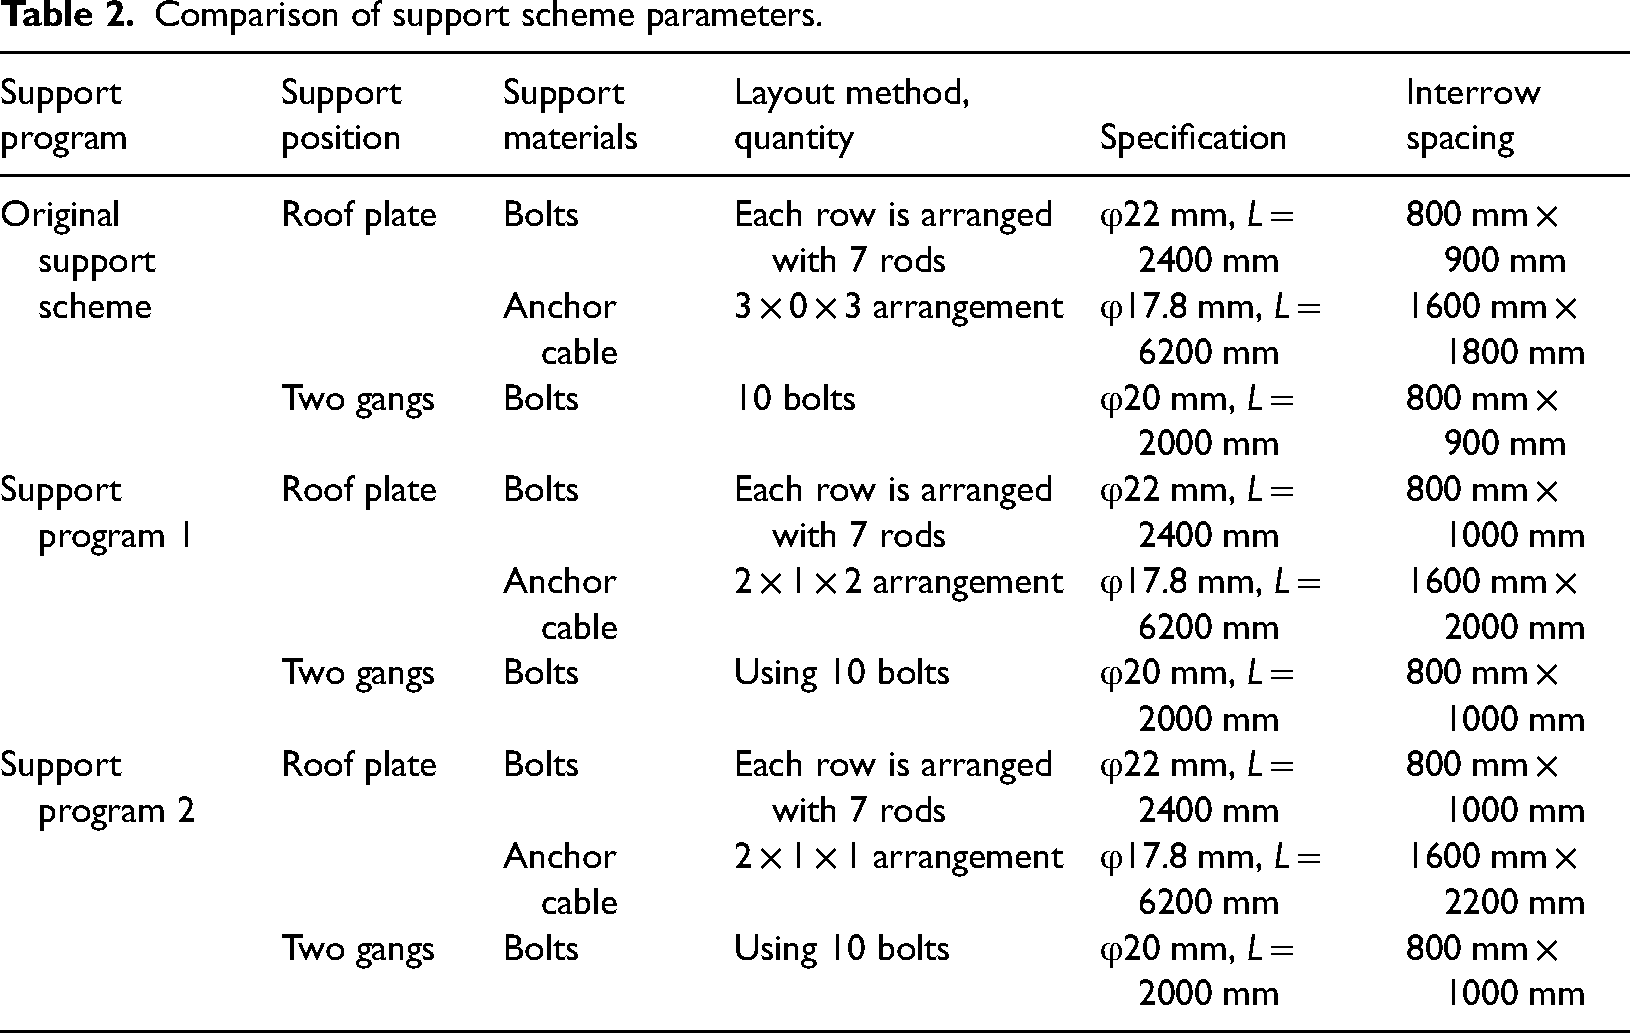
Based on the parameter range obtained from the theoretical calculations, two optimization schemes were established for comparison with the original support scheme, as shown in Table 2. The analysis compared the stress distributions in the surrounding rock caused by the three support schemes and the development of a plastic zone in the surrounding rock to determine the optimal support scheme.
Comparison of support scheme parameters.
First, the horizontal stresses under each scheme were compared, as shown in Figure 9. The results indicated that the horizontal stress peak effect was larger for the roadway without support measures. The increase in the support row distance after implementing shoring scheme 2 resulted in poor control of the horizontal stress compared with those of shoring scheme 1 and the original shoring scheme. When the row distance increased to 1100 mm, the horizontal stress of the roadway was too concentrated, and the control effect of the surrounding rock decreased significantly.
Roadway stress diagram for each scheme. (a) Unsupported, (b) original support, (c) support option 1, (d) support option 2.
Figure 10 compares the horizontal displacement of the different support schemes. The original support method and support method 1 controlled the horizontal displacement of the roadway gang to a certain extent. By contrast, the support of the roadway gang exhibited apparent horizontal displacement. The horizontal displacement of the roadway gang increased to 120–130 mm when the support row distance increased from 1000 to 1100 mm, and the control effect of the surrounding rock decreased.
Comparison of horizontal displacement of each scheme. (a) Unsupported, (b) original support, (c) support scheme 1, (d) support scheme 2.
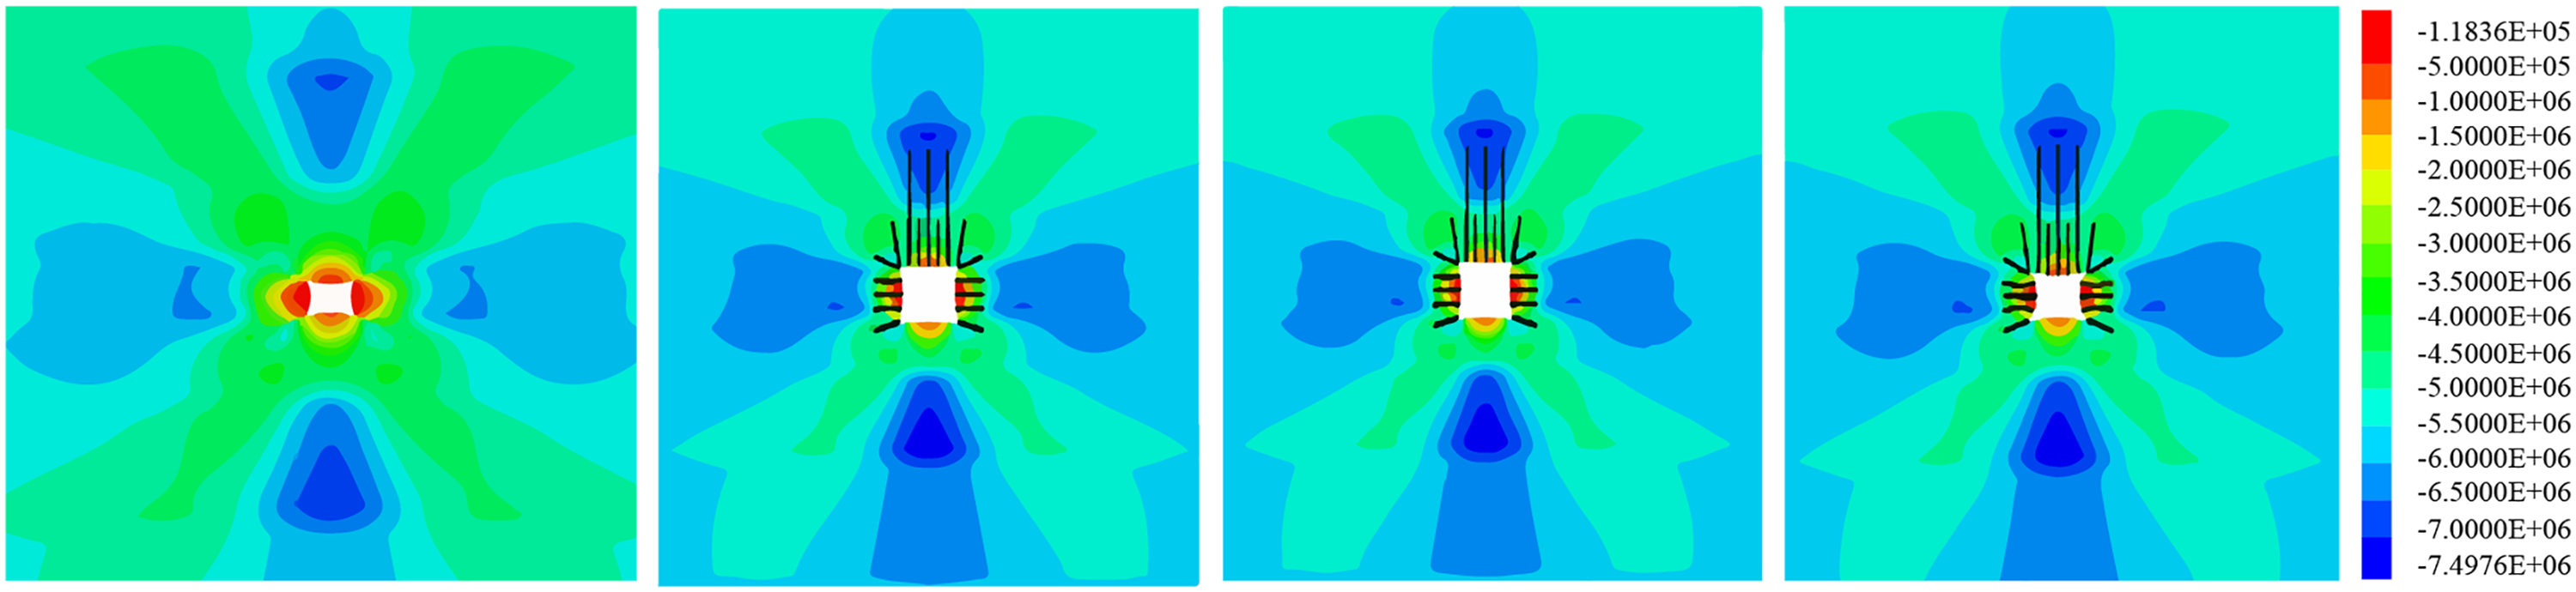
Figure 11 compares the vertical stresses. In contrast to the wide area affected by the peak concentration of the vertical stress when unsupported after the support, the original support scheme and support scheme 1 controlled the vertical stress better after the support. The vertical stress was too concentrated when the row distance increased from 1000 to 1100 mm, and the support effect was poor for safe production.
Comparison of vertical stress of each scheme. (a) Unsupported, (b) original support, (c) support scheme 1, (d) support scheme 2.
The vertical displacement comparison showed that the unsupported roadway exhibited apparent top and bottom plate displacements, as shown in Figure 12. When the support row distance increased, the original support scheme and support scheme 1 controlled the displacement within the safe ranges of 90–120 and 30–60 mm for the top and bottom plates. The displacements of the top and bottom plates reached approximately 150 and 85 mm, respectively, when the row distance increased from 1000 to 1100 mm. In addition, the control effect of the surrounding rock was poor.
Comparison of vertical displacement of each scheme. (a) Unsupported, (b) original support, (c) support scheme 1, (d) support scheme 2.
Figure 13 compares the plastic zone of the different schemes. The displacement of the two gangs of the unsupported roadway reached 5 m. The original support scheme and support scheme 1 controlled the plastic zone well with increased support row distance. The plastic zone increased significantly when the row distance increased from 1000 to 1100 mm, and the control effect of the surrounding rock was weak.
Comparison of plasticity zones of each scheme. (a) Unsupported, (b) original support, (c) support scheme 1, (d) support scheme 2.
Research analysis of the lagging support process
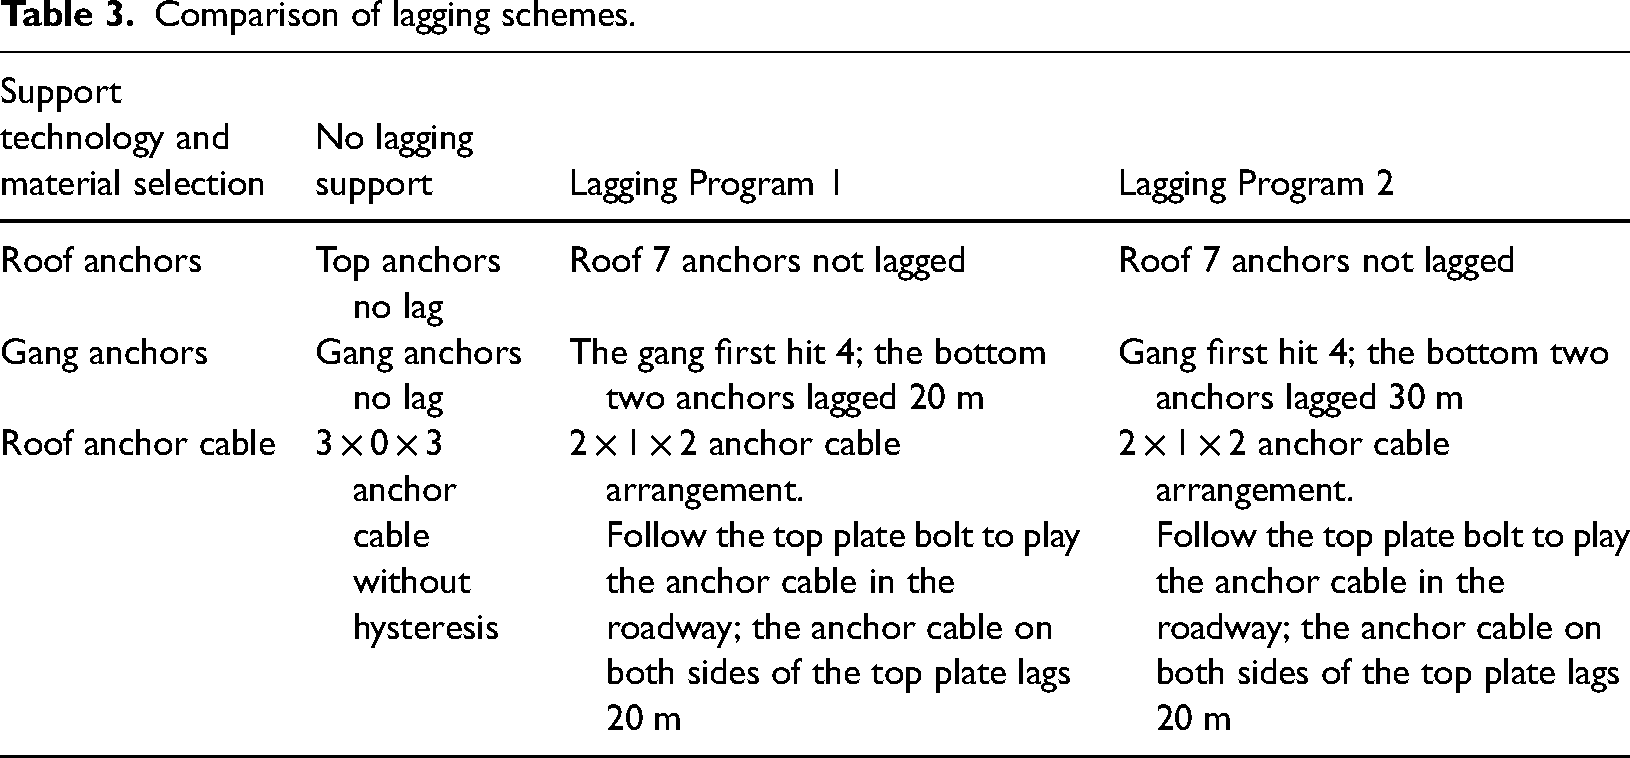
Common support processes include immediate, combined, and lagging support. To ensure the speed of roadway excavation, reduce the project cost, and improve the safety of the project, the feasibility and effectiveness of applying lagging support were explored, considering the geological conditions of Qianyingzi. Two lagging support process optimization schemes were designed based on the optimal support parameters (support scheme 1), as shown in Table 3.
Comparison of lagging schemes.
The comparison of the horizontal displacement of the bolts with that of the lagging process indicated that the displacement of the gang area was concentrated in the middle three bolts. Therefore, it was feasible for the bottom bolt to lag and be replaced. Figures 14 and 15 show the horizontal and vertical displacements of the top plate of the helper. The horizontal displacement of the helper did not change significantly up to 80 mm when the bolts and top anchor ropes were replenished with 20 m of excavation. The vertical displacements increased to 140 mm and approximately 180 mm, respectively, and the control of the surrounding rock was unstable.
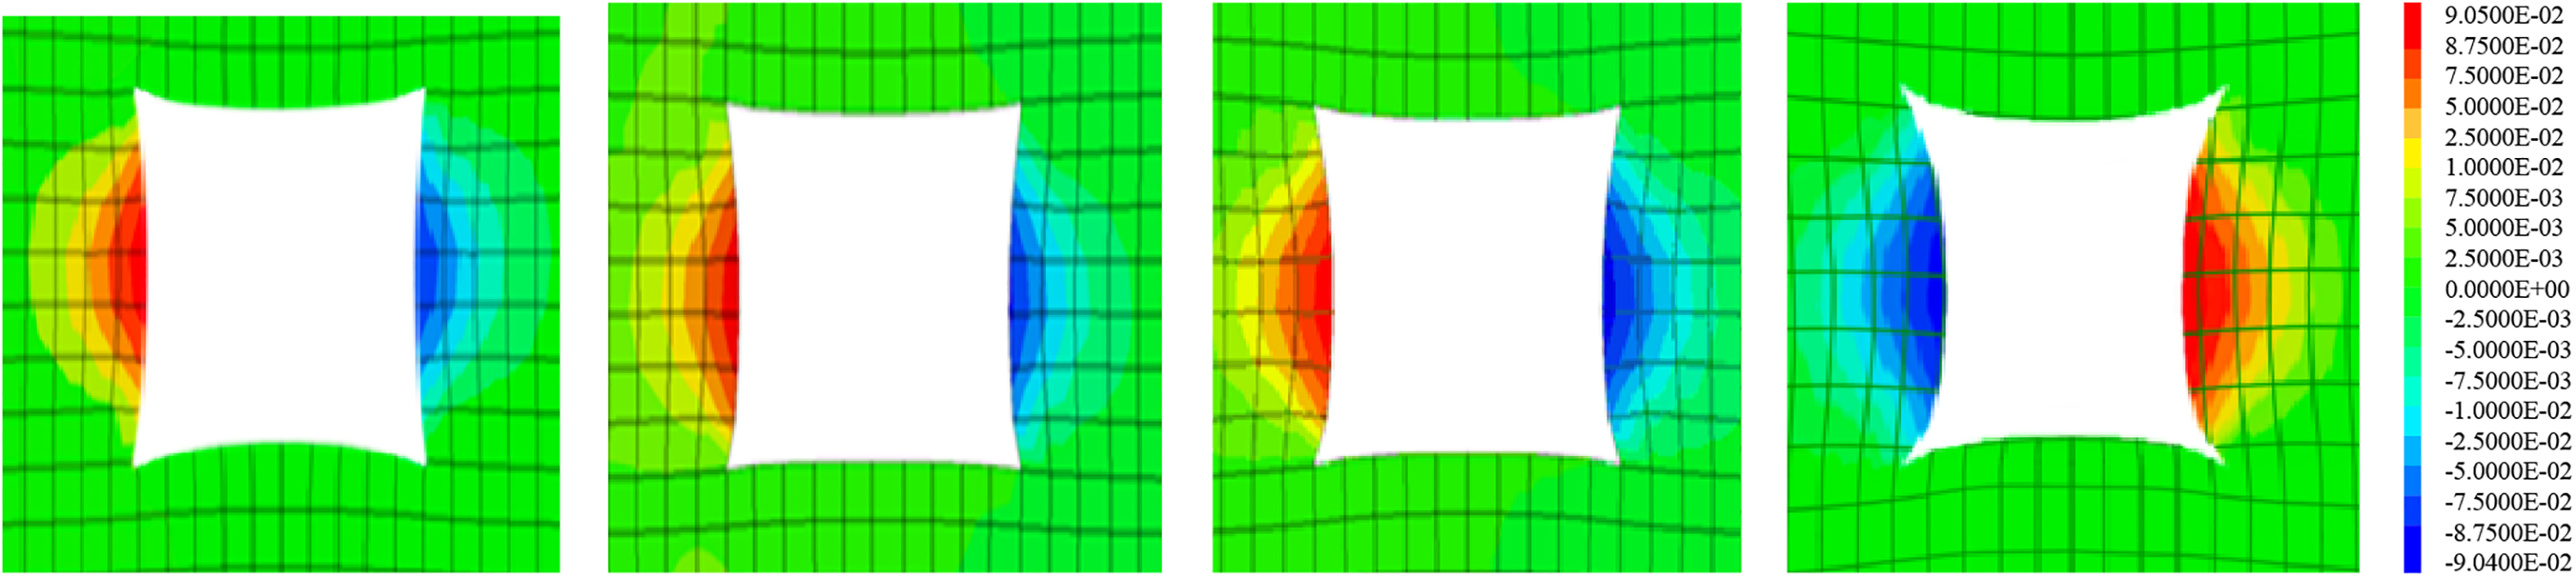
Comparison of horizontal displacement of bolts with different hysteresis cases. (a) Lag 20-20 bolt, (b) lag 20-40 bolt, (c) lag 30-30 bolt, (d) lag 30-60 bolt.
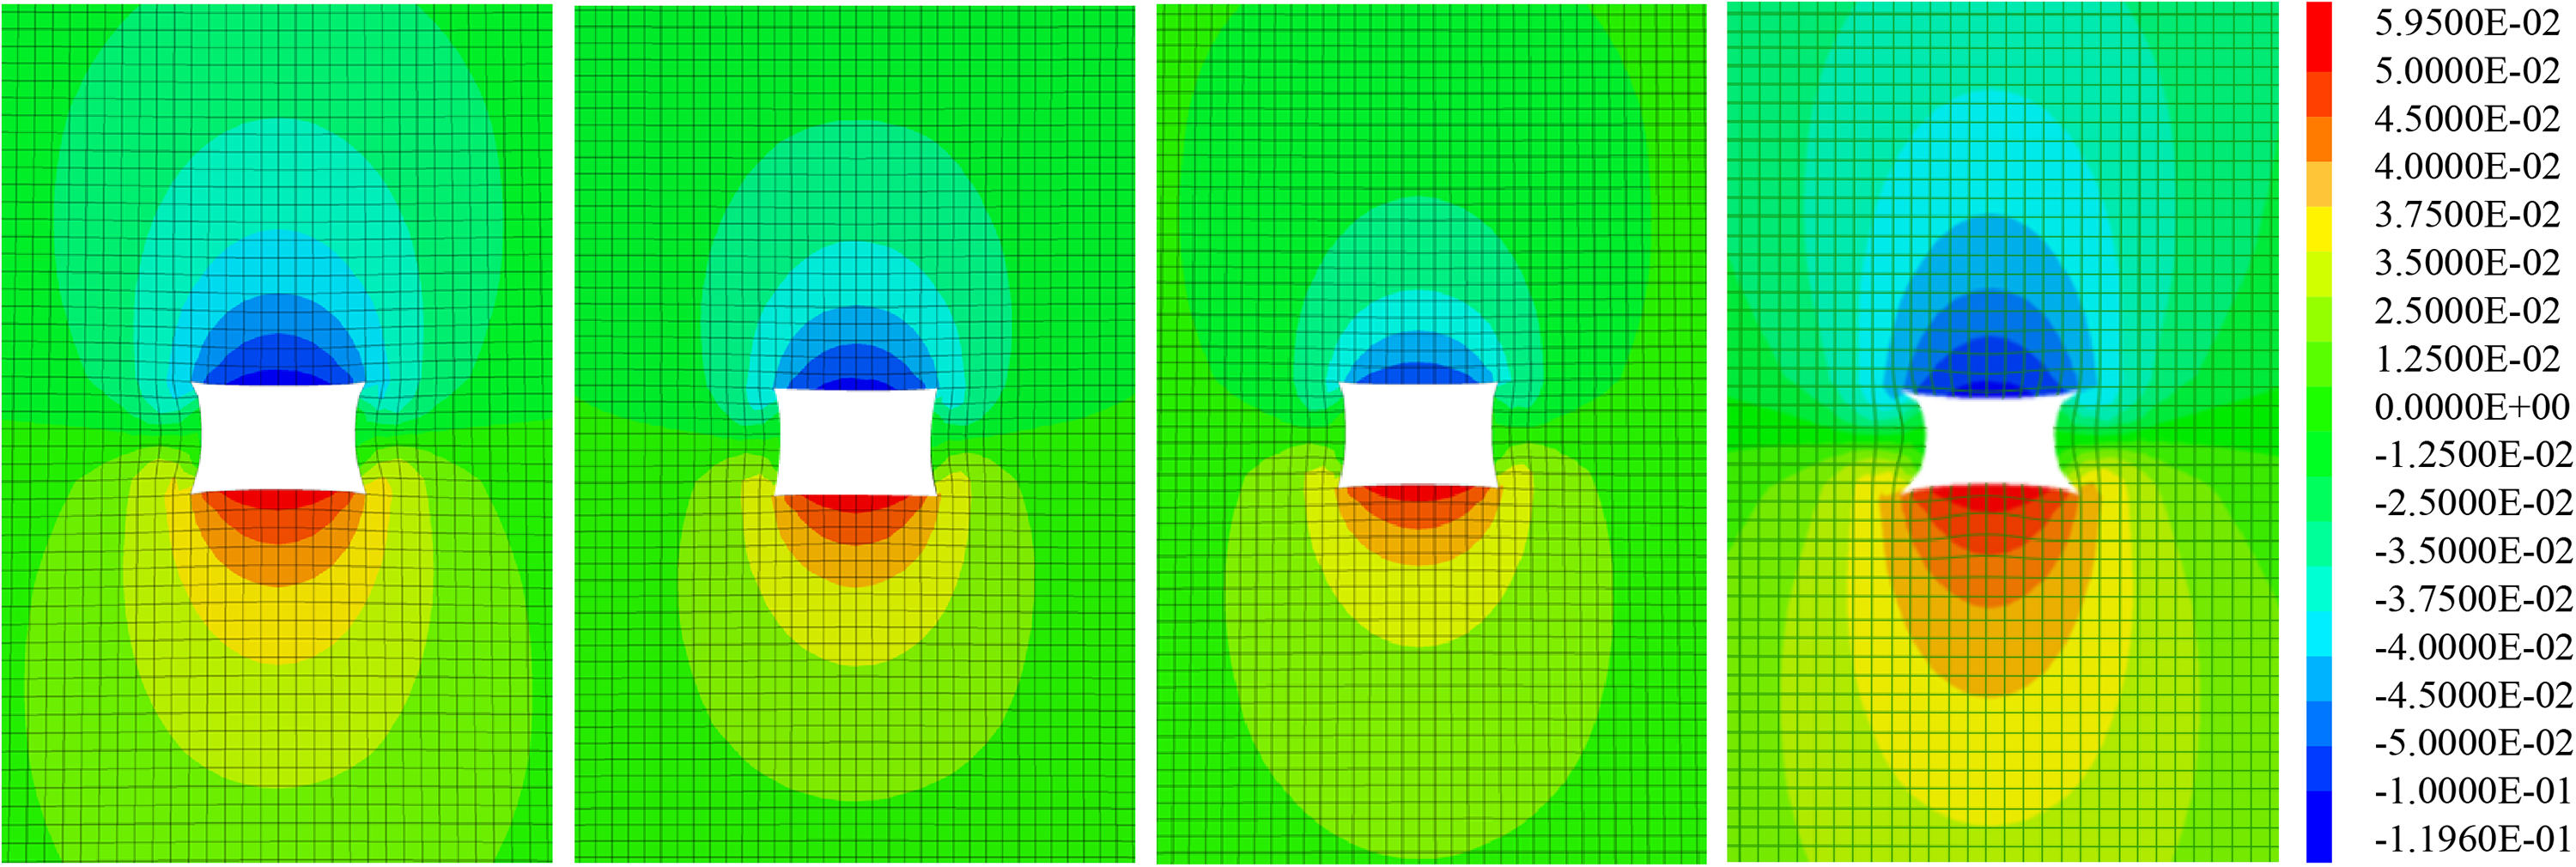
Comparison of vertical displacement of bolts with different hysteresis cases. (a) Lag 20-20 bolt, (b) lag 20-40 bolt, (c) lag 30-30 bolt, (d) lag 30-60 bolt.
Figure 16 shows the displacement convergence coefficient of the bolts. The results show that the stress at the head end was small when only one bolt was driven into the roadway, and the displacement convergence coefficient of the bolts was the highest. The displacement convergence coefficient of the bolts with a 20 m lag in the gang part of the roadway was smaller than that with a 30 m lag. The stress control effect of the two bolts at the bottom and two bolts at the top was the best with a 20 m lag.
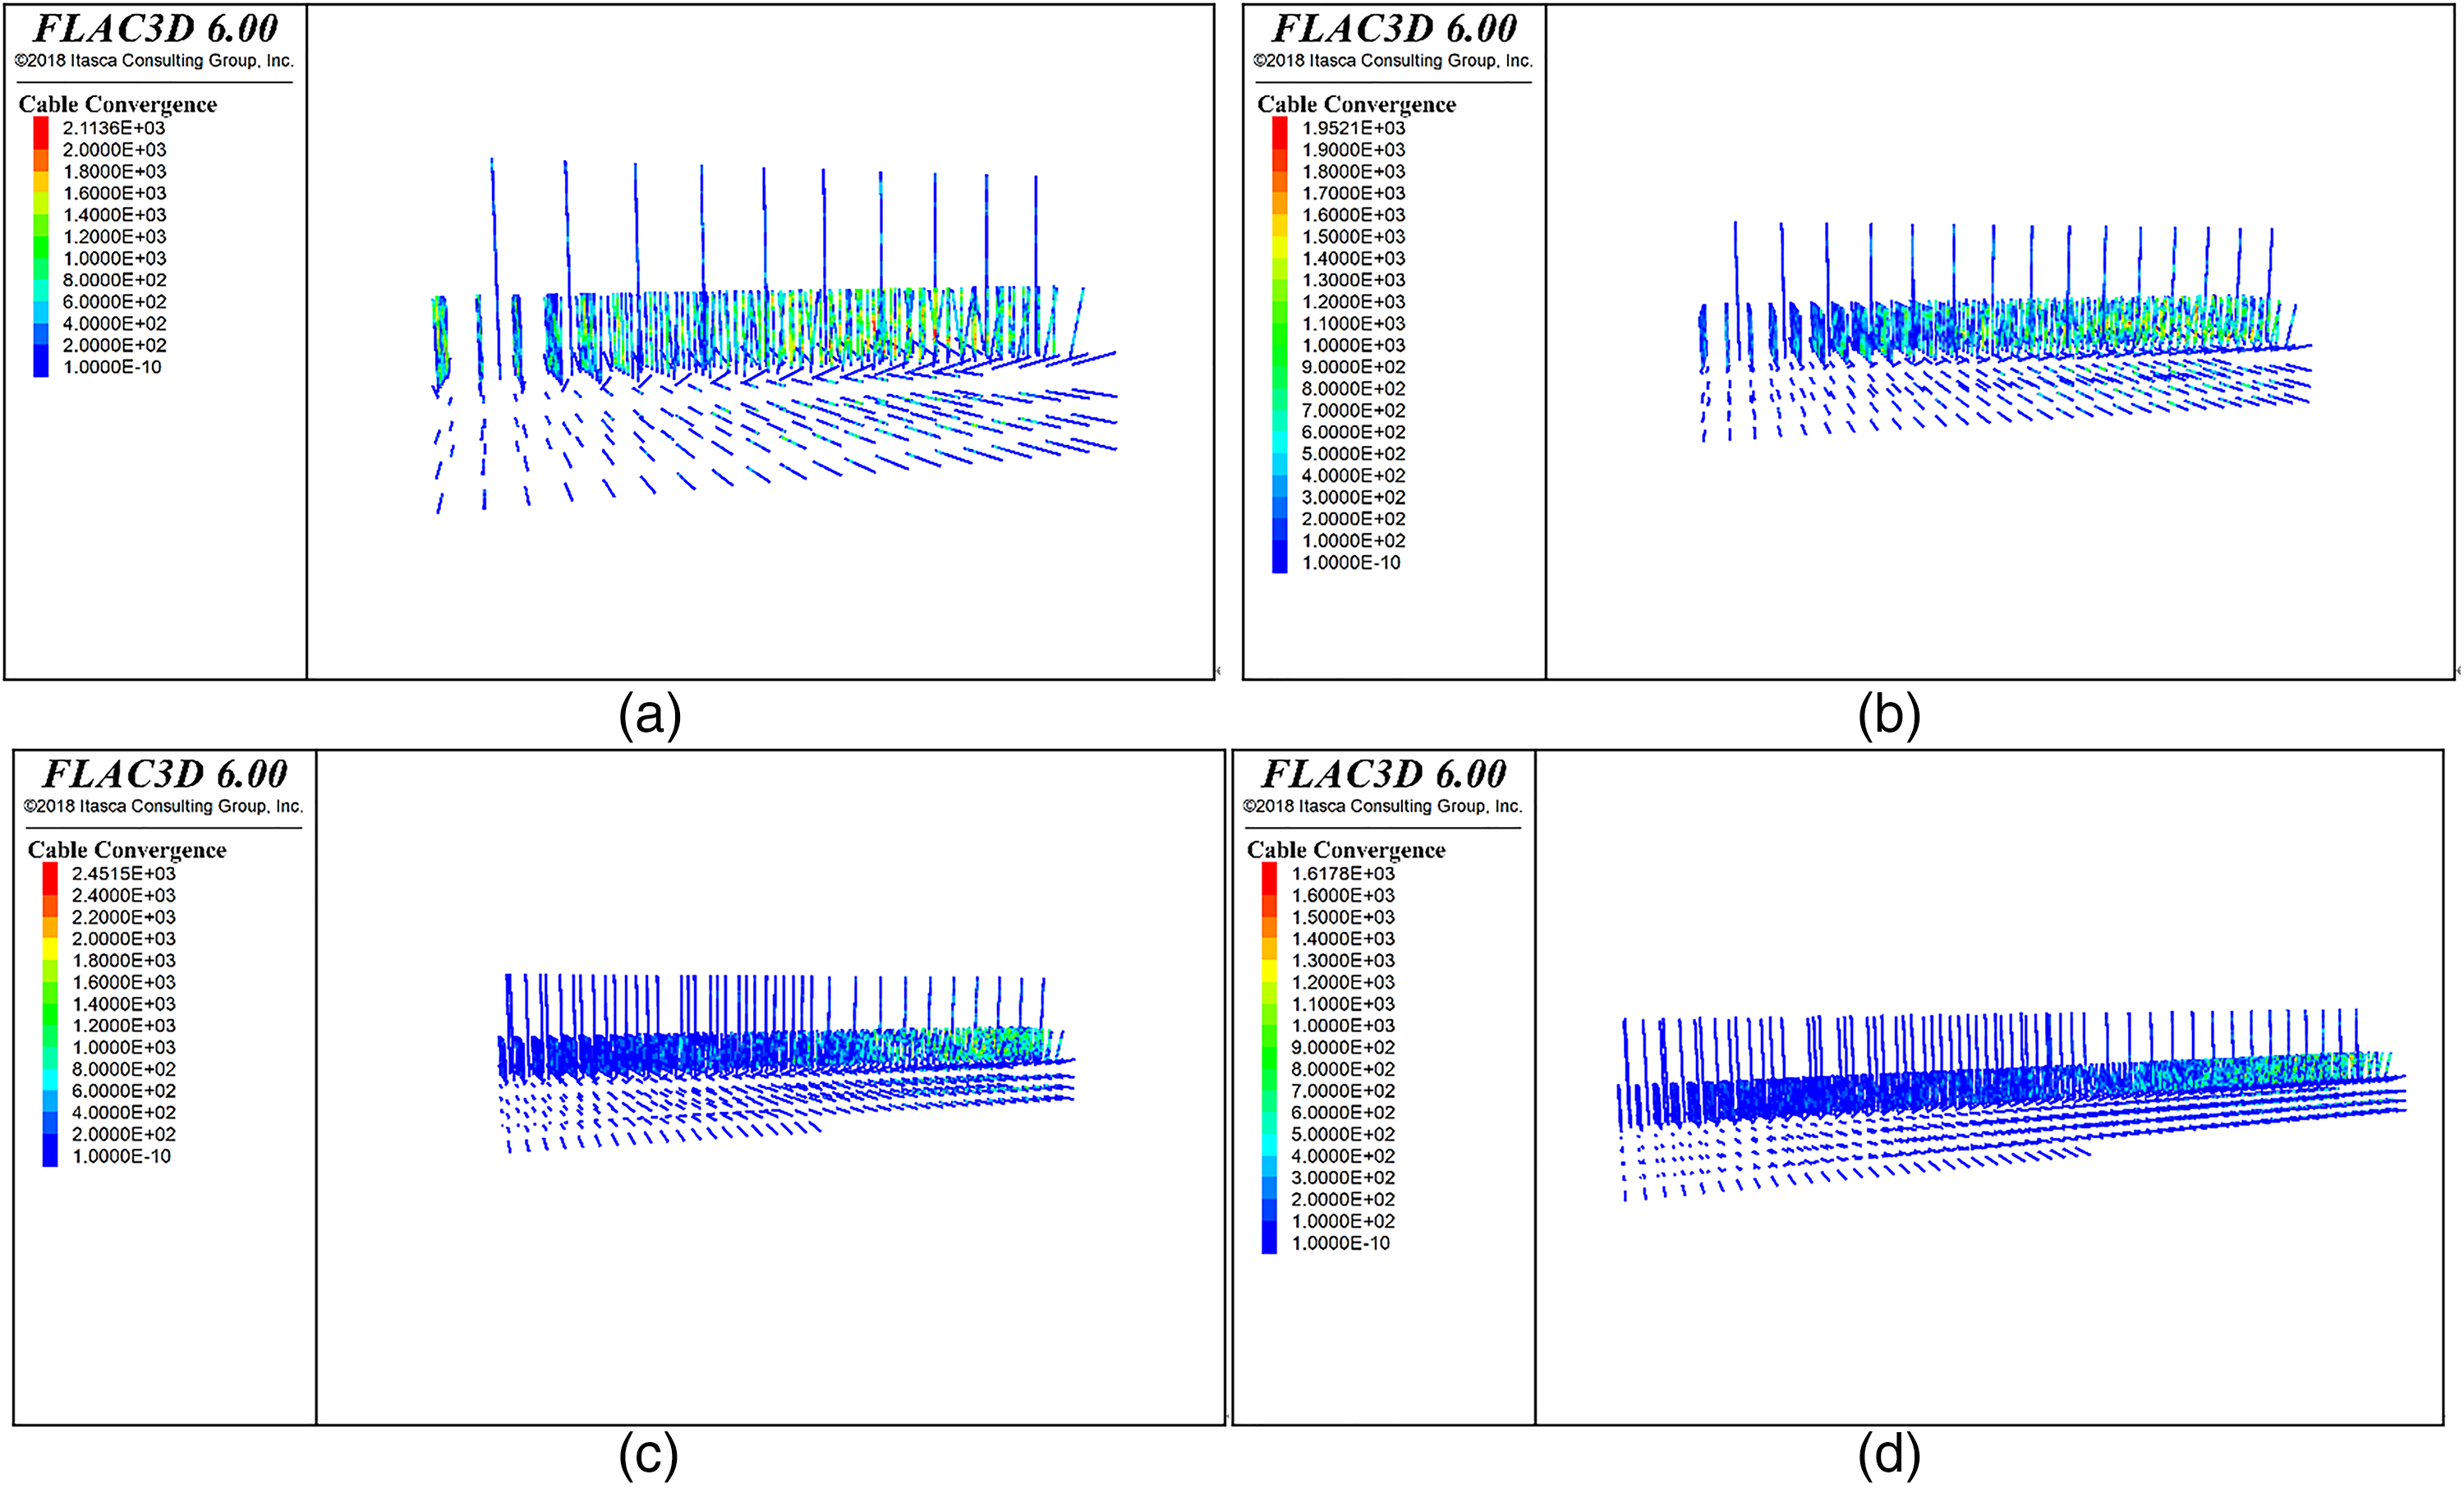
Comparison of anchor displacement convergence coefficients for different hysteresis cases. (a) Lag 20-20 bolt, (b) lag 20-40 bolt, (c) lag 30-30 bolt, (d) lag 30-60 bolt.
A comparison of the horizontal, vertical, and anchor displacement convergence coefficients of the three types of bolts with a 20 m lag, 30 m lag, and no lag replenishment indicated that the roadway surrounding rock support effect was the best with a 20 m lag replenishment of bolts.
Optimized support plan verification
First, the geological conditions were simulated by creating a 3D model in the laboratory. Subsequently, strain gauges, peepers, and other equipment were used to observe and collect stress and surrounding rock deformation data, as shown in Figure 17. Finally, excavation along the tendency and direction was performed to simulate the excavation construction and observe the support and surrounding rock stress and strain to compare and analyze the best support solution. Other monitoring equipment, such as a geological radar, GD3Q-GA borehole TV, KGE30B top slab departure indicator, and tower ruler, was used in the return airway of W3233 to collect data and verify the actual support level and construction optimization effect.
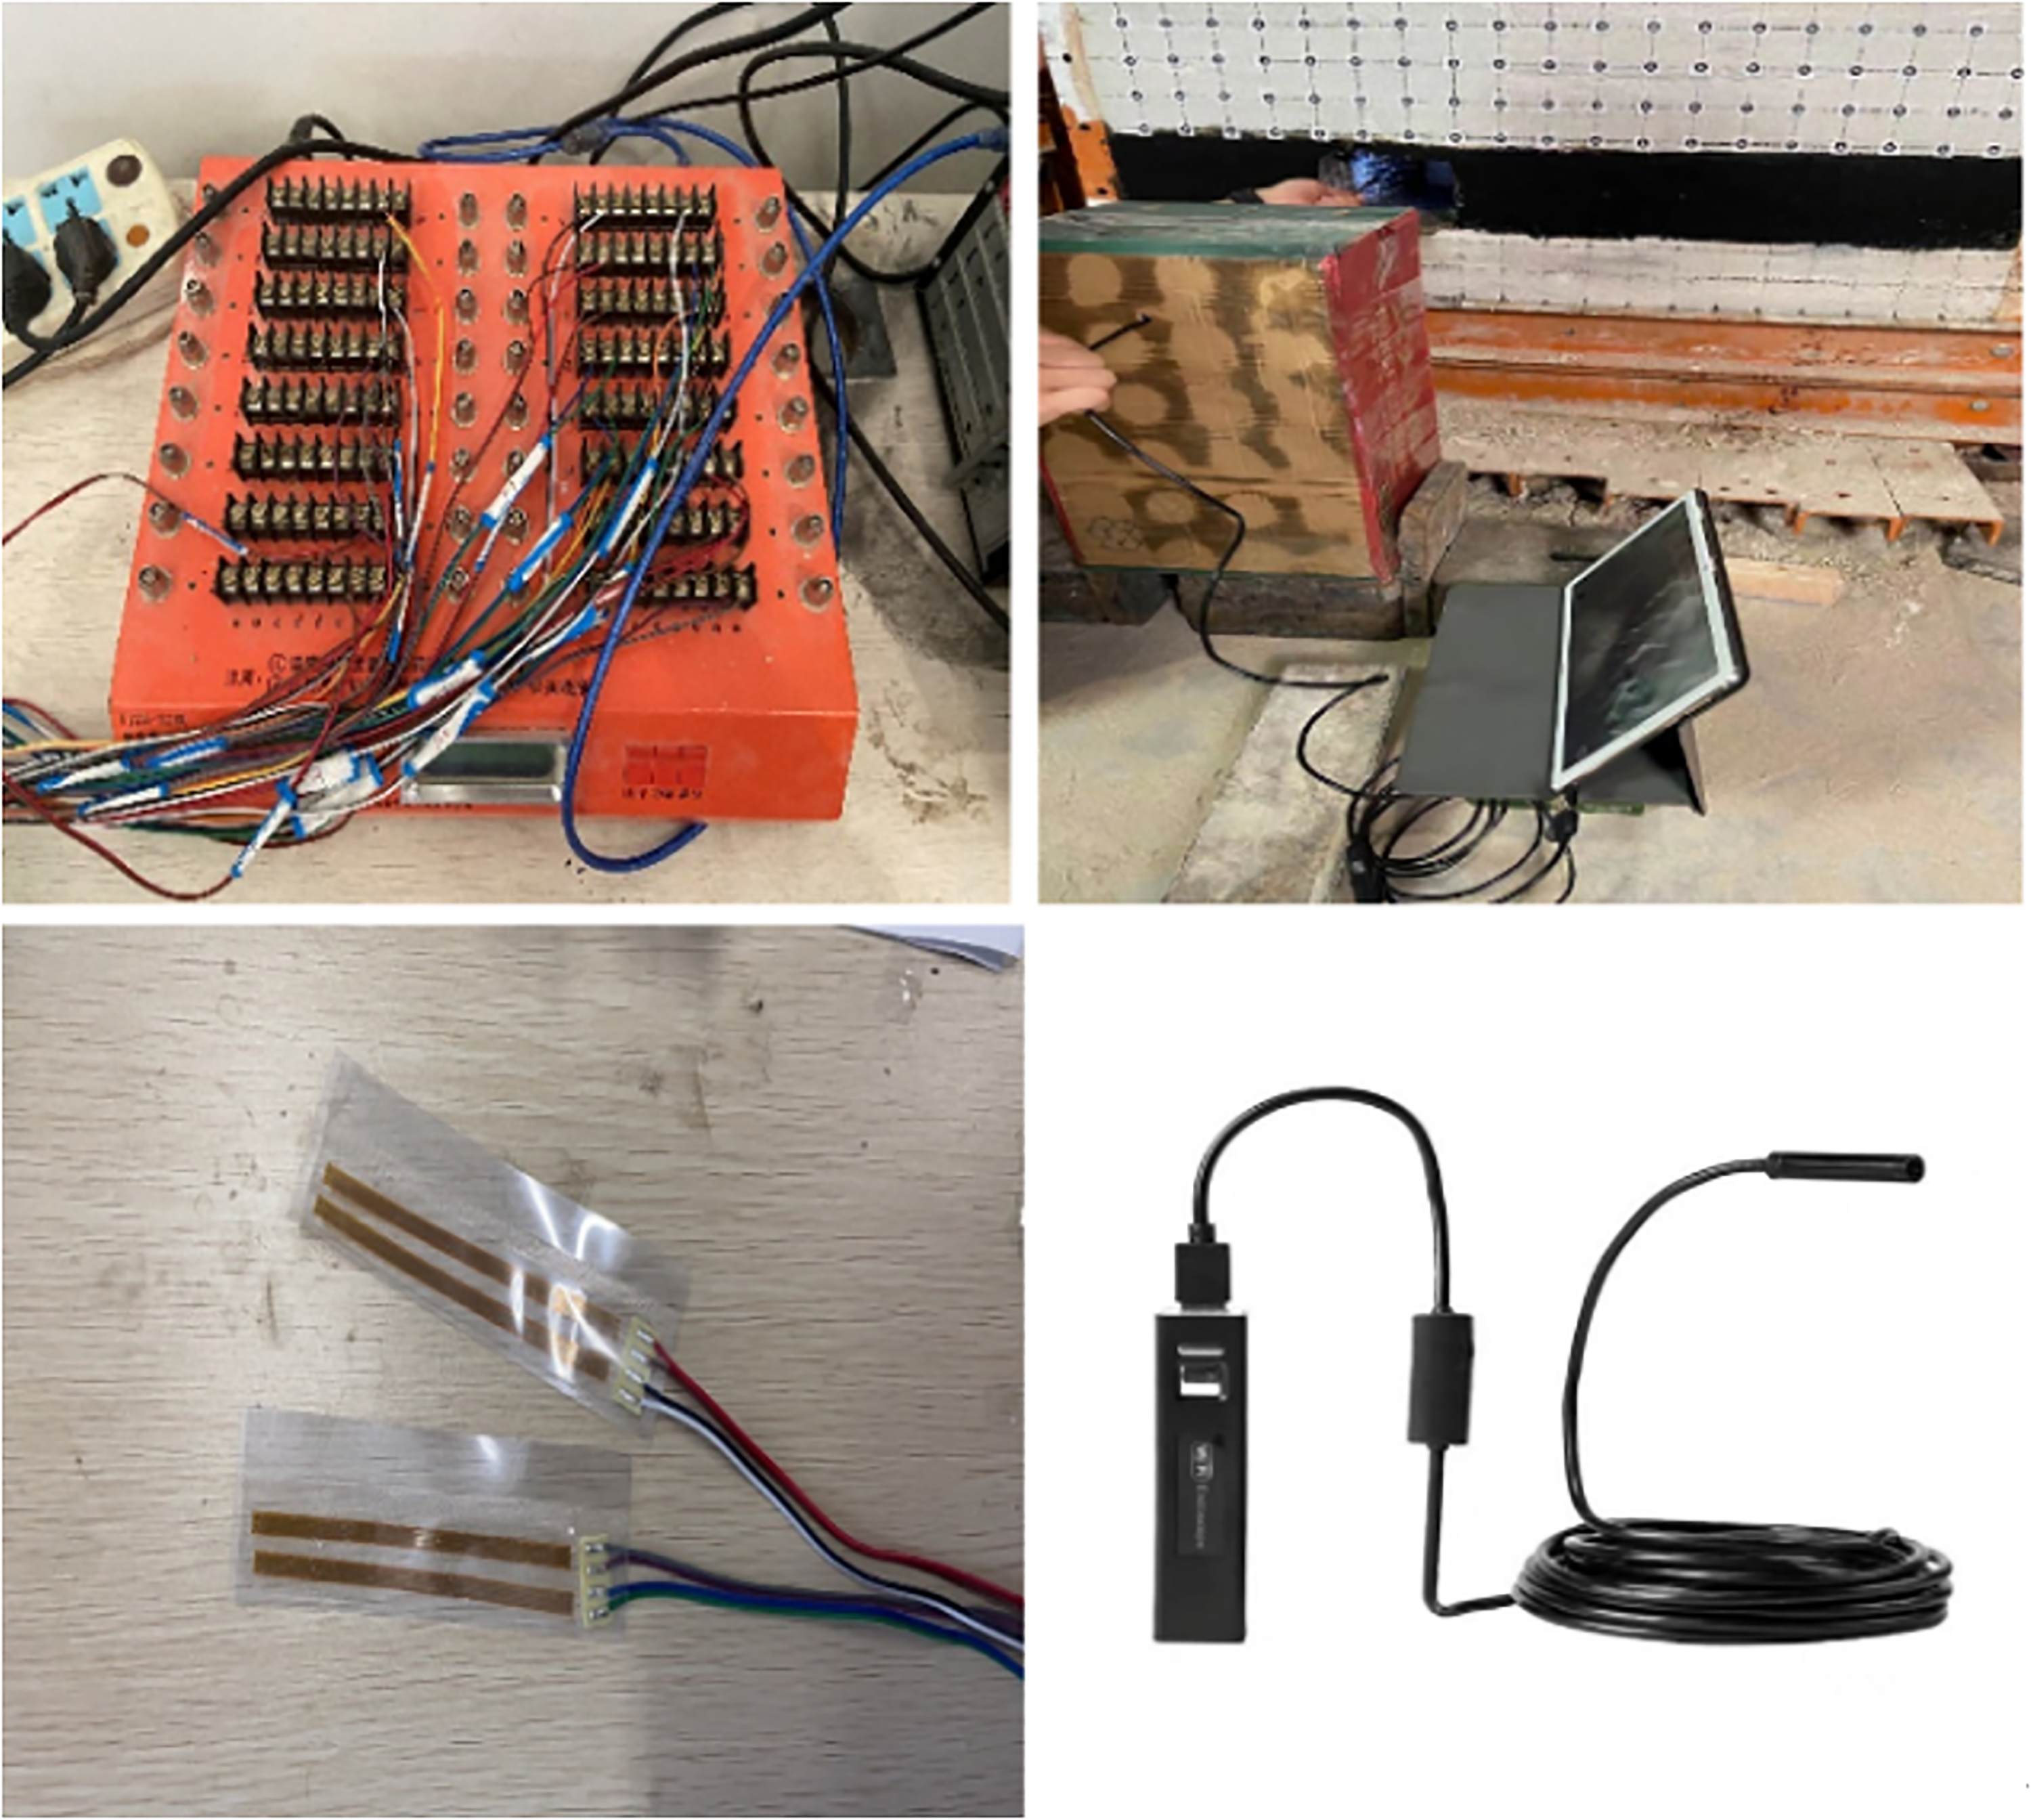
Relevant monitoring equipment diagram.
Three-dimensional simulation experiment
This experiment used a similar 3D simulation test to simulate the change law of the surrounding rock stress under different support conditions. A three-dimensional test device with L × B × H = 1000 mm × 1000 mm × 1400 mm was created, as shown in Figure 18. The test device was excavated to better study changes in the surrounding rock, dynamically monitor the surrounding rock stress, verify and evaluate the roadway support scheme, and simulate the excavation construction site.
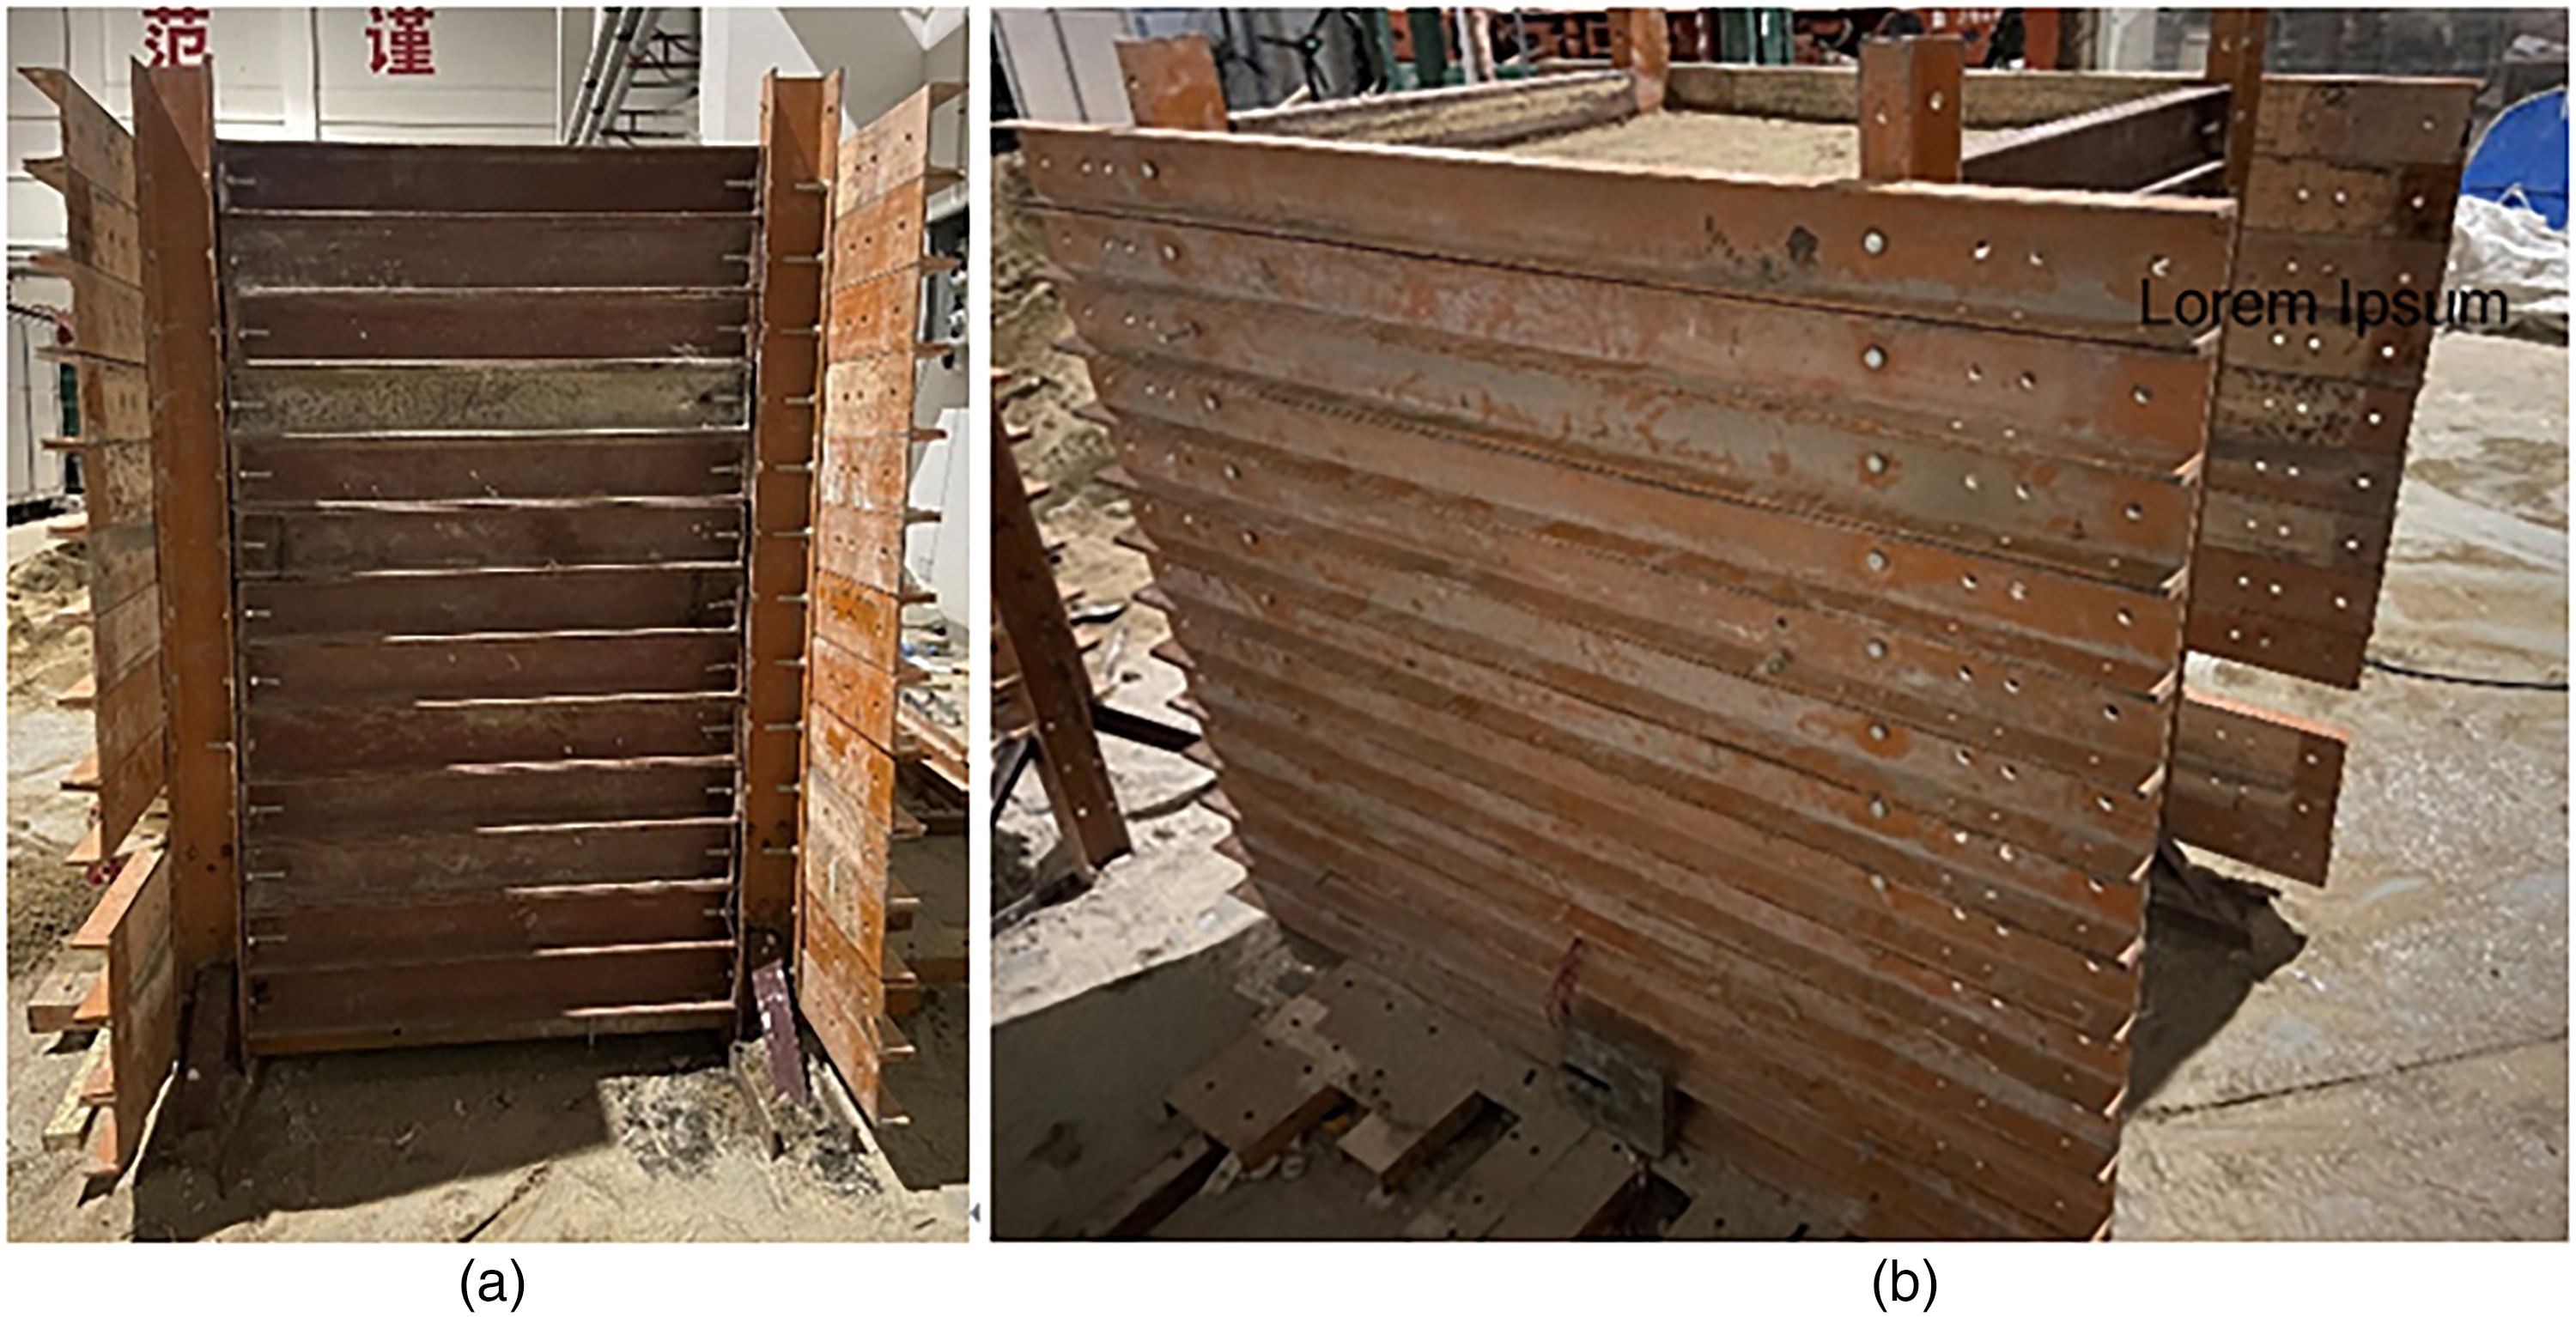
Three-dimensional model physical image. (a) Front view, (b) side view.
The channel support was simulated using different types of wires for bolts and anchor cables to determine similar material ratios based on known channel envelope parameters (Huang, 2011; Yang et al., 2021a, 2021b). Wooden squares of different sizes were used to simulate the channel and working face. Two layers of measurement lines were arranged in the channel along the excavation direction. The six measurement points were divided into the first and second layers. The distances from the bottom of the channel were 3 and 6 cm. The location of each measurement point in the direction of support excavation was 16.5 cm. Figure 19 shows the specific locations.
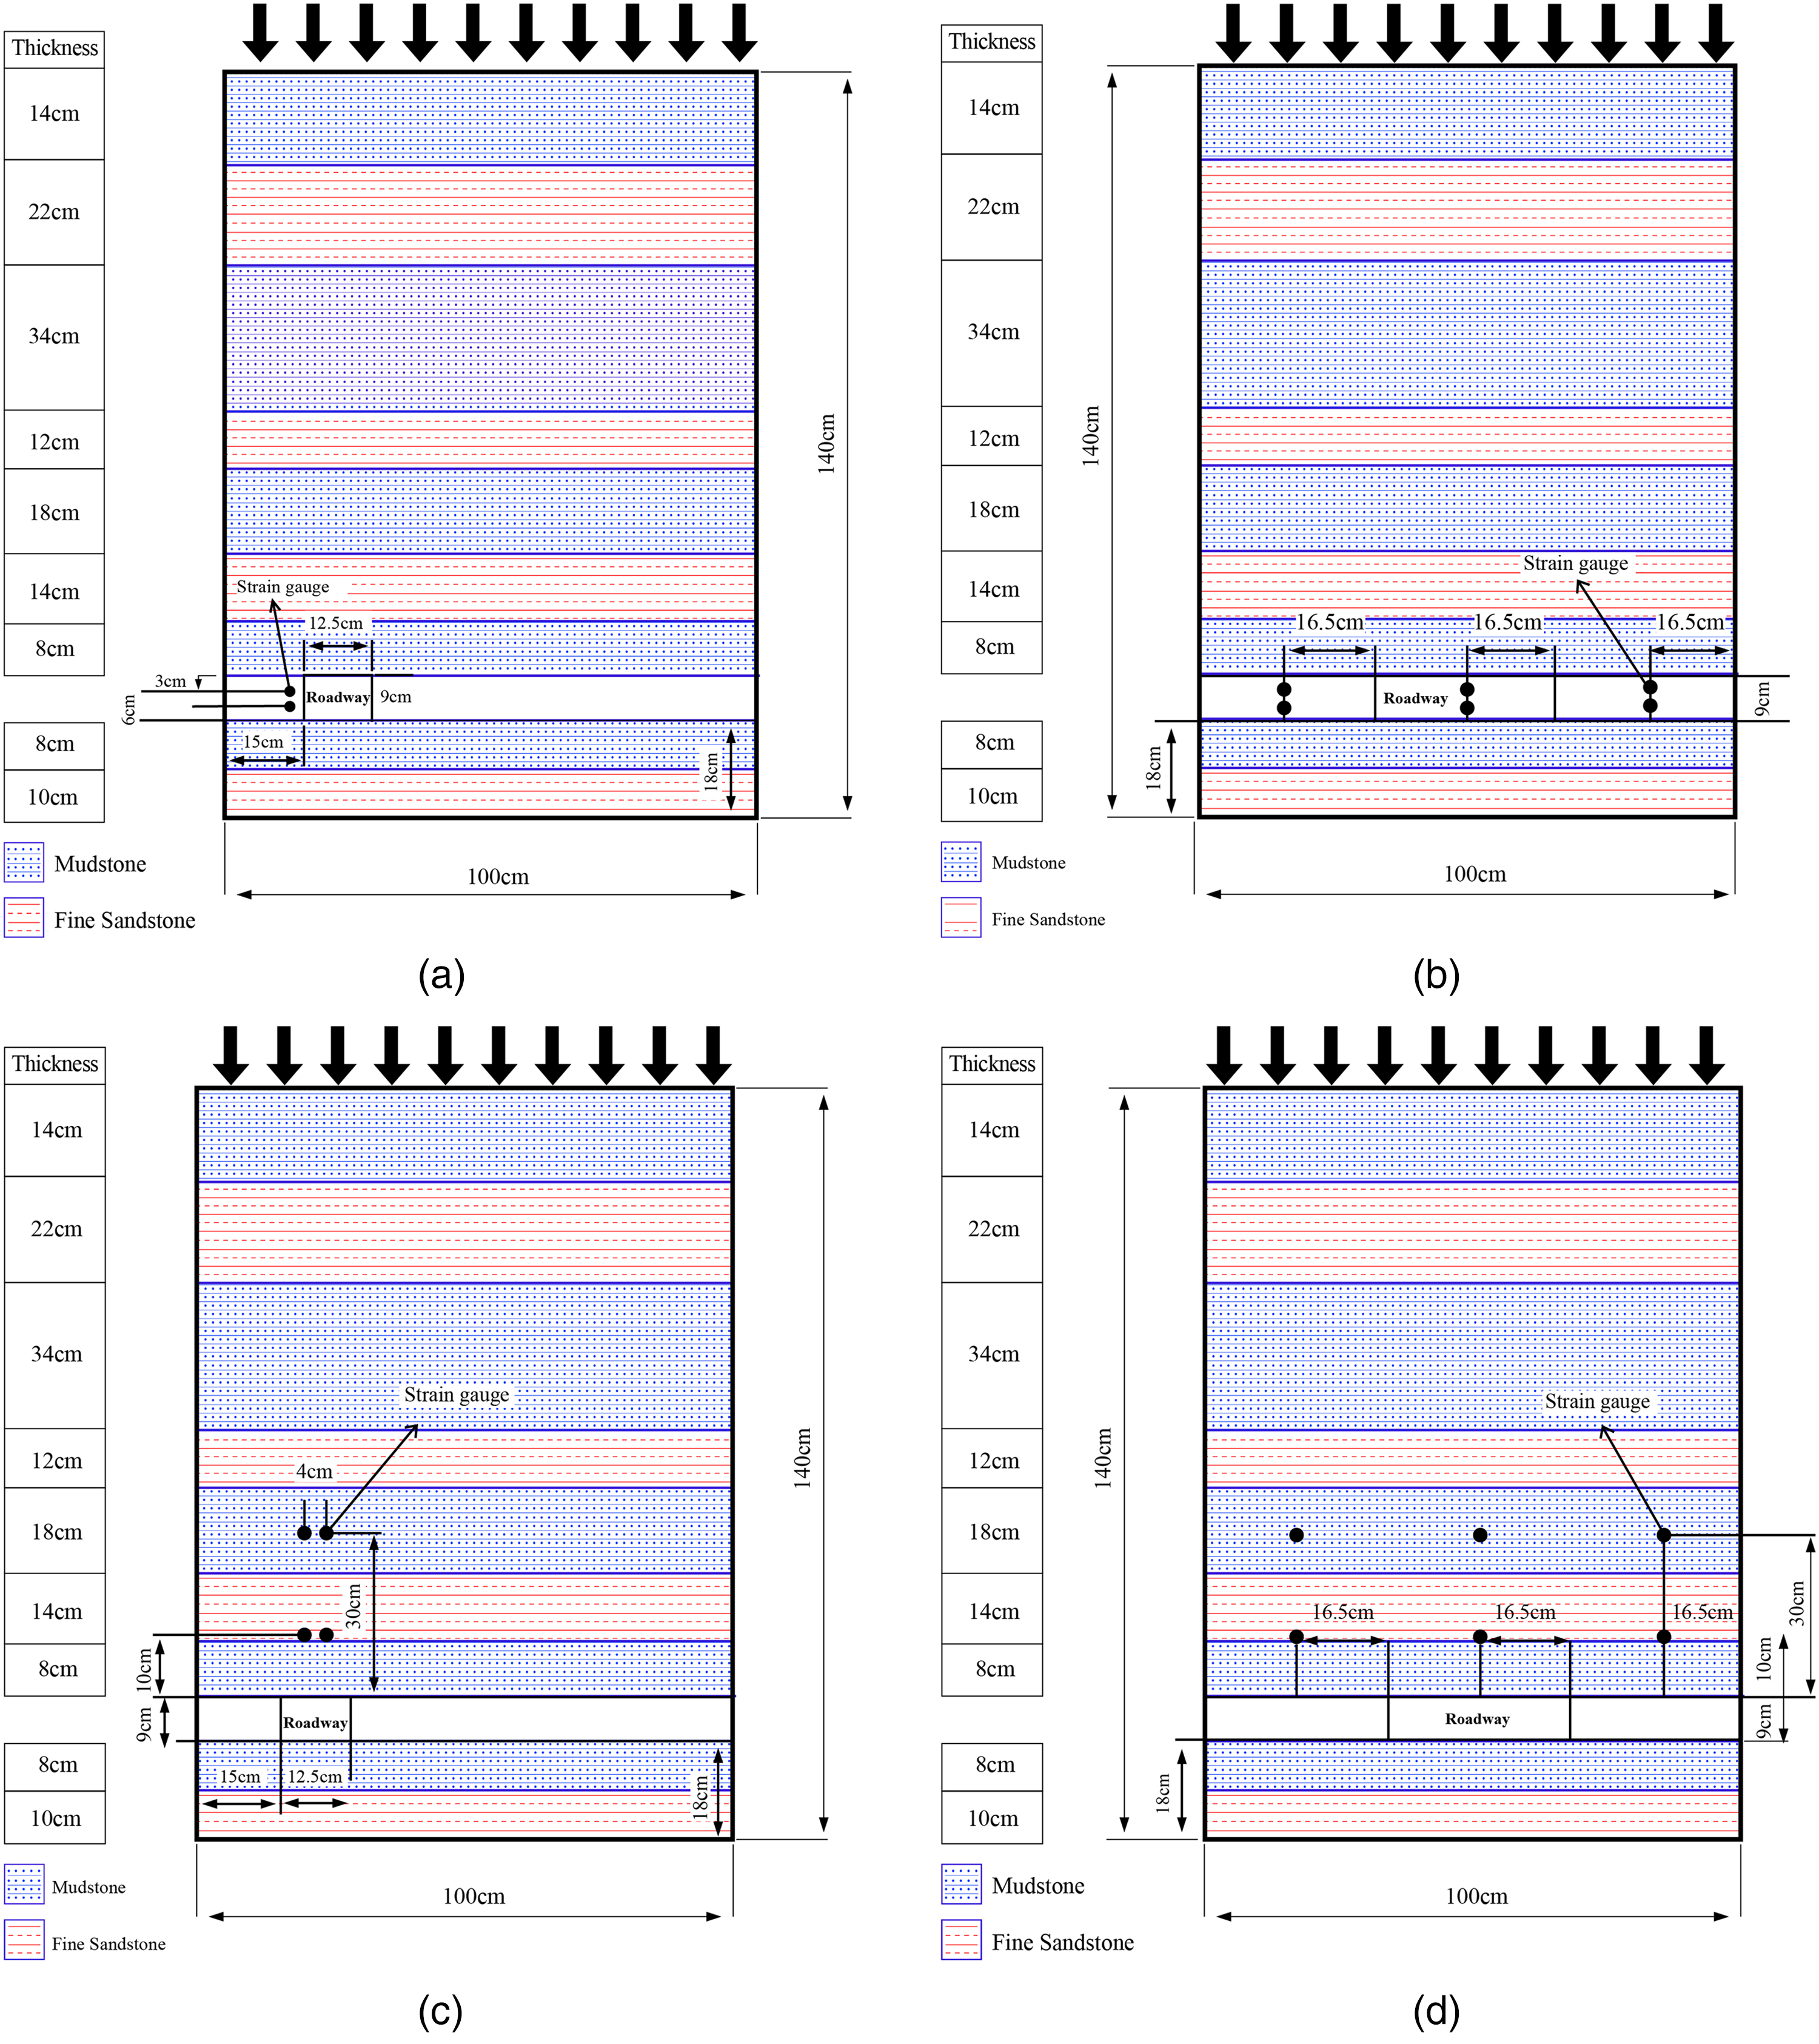
Distribution of measuring points on the front and side. (a) Front view of roadway-side measuring point, (b) side view of roadway-side measuring point, (c) roof measuring point plane diagram, (d) side view of roof measuring point.
Experimental procedure
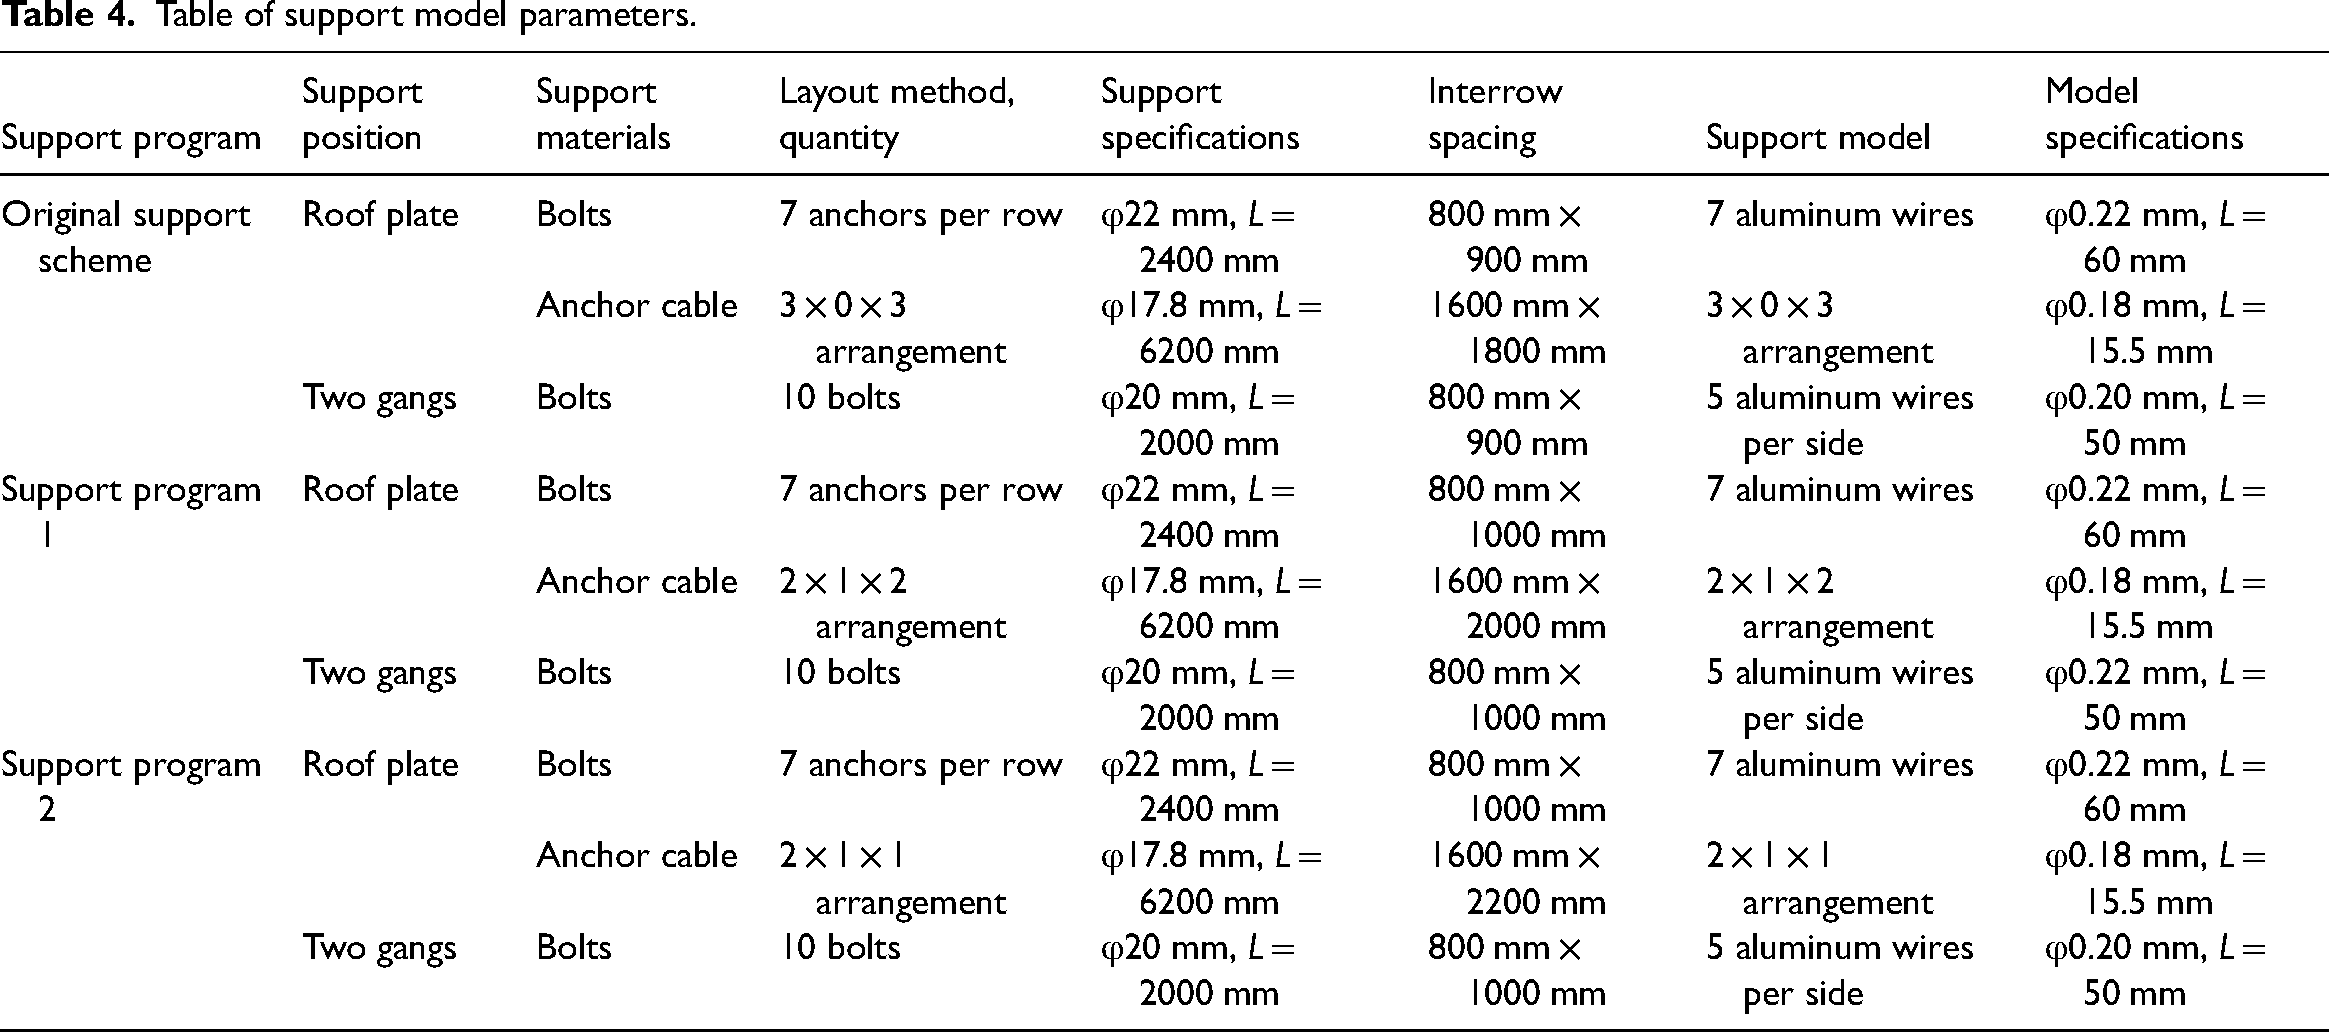
First, an experimental model was developed, and the wire was divided into three sections to simulate different support methods for each section. The wooden square was laid flat with a working face size of L × W × H = 0.7 m × 0.05 m × 0.08 m, simulated roadway size of LM × WM × HM = 1 m × 0.125 m × 0.09 m, and boundary coal pillar of 15 cm. Table 4 lists the support model parameters. Subsequently, a support model was built, as shown in Figure 20. The three support schemes were divided according to the digging direction: the original support scheme, support scheme 1, and support scheme 2. The strain gauges were installed and numbered.
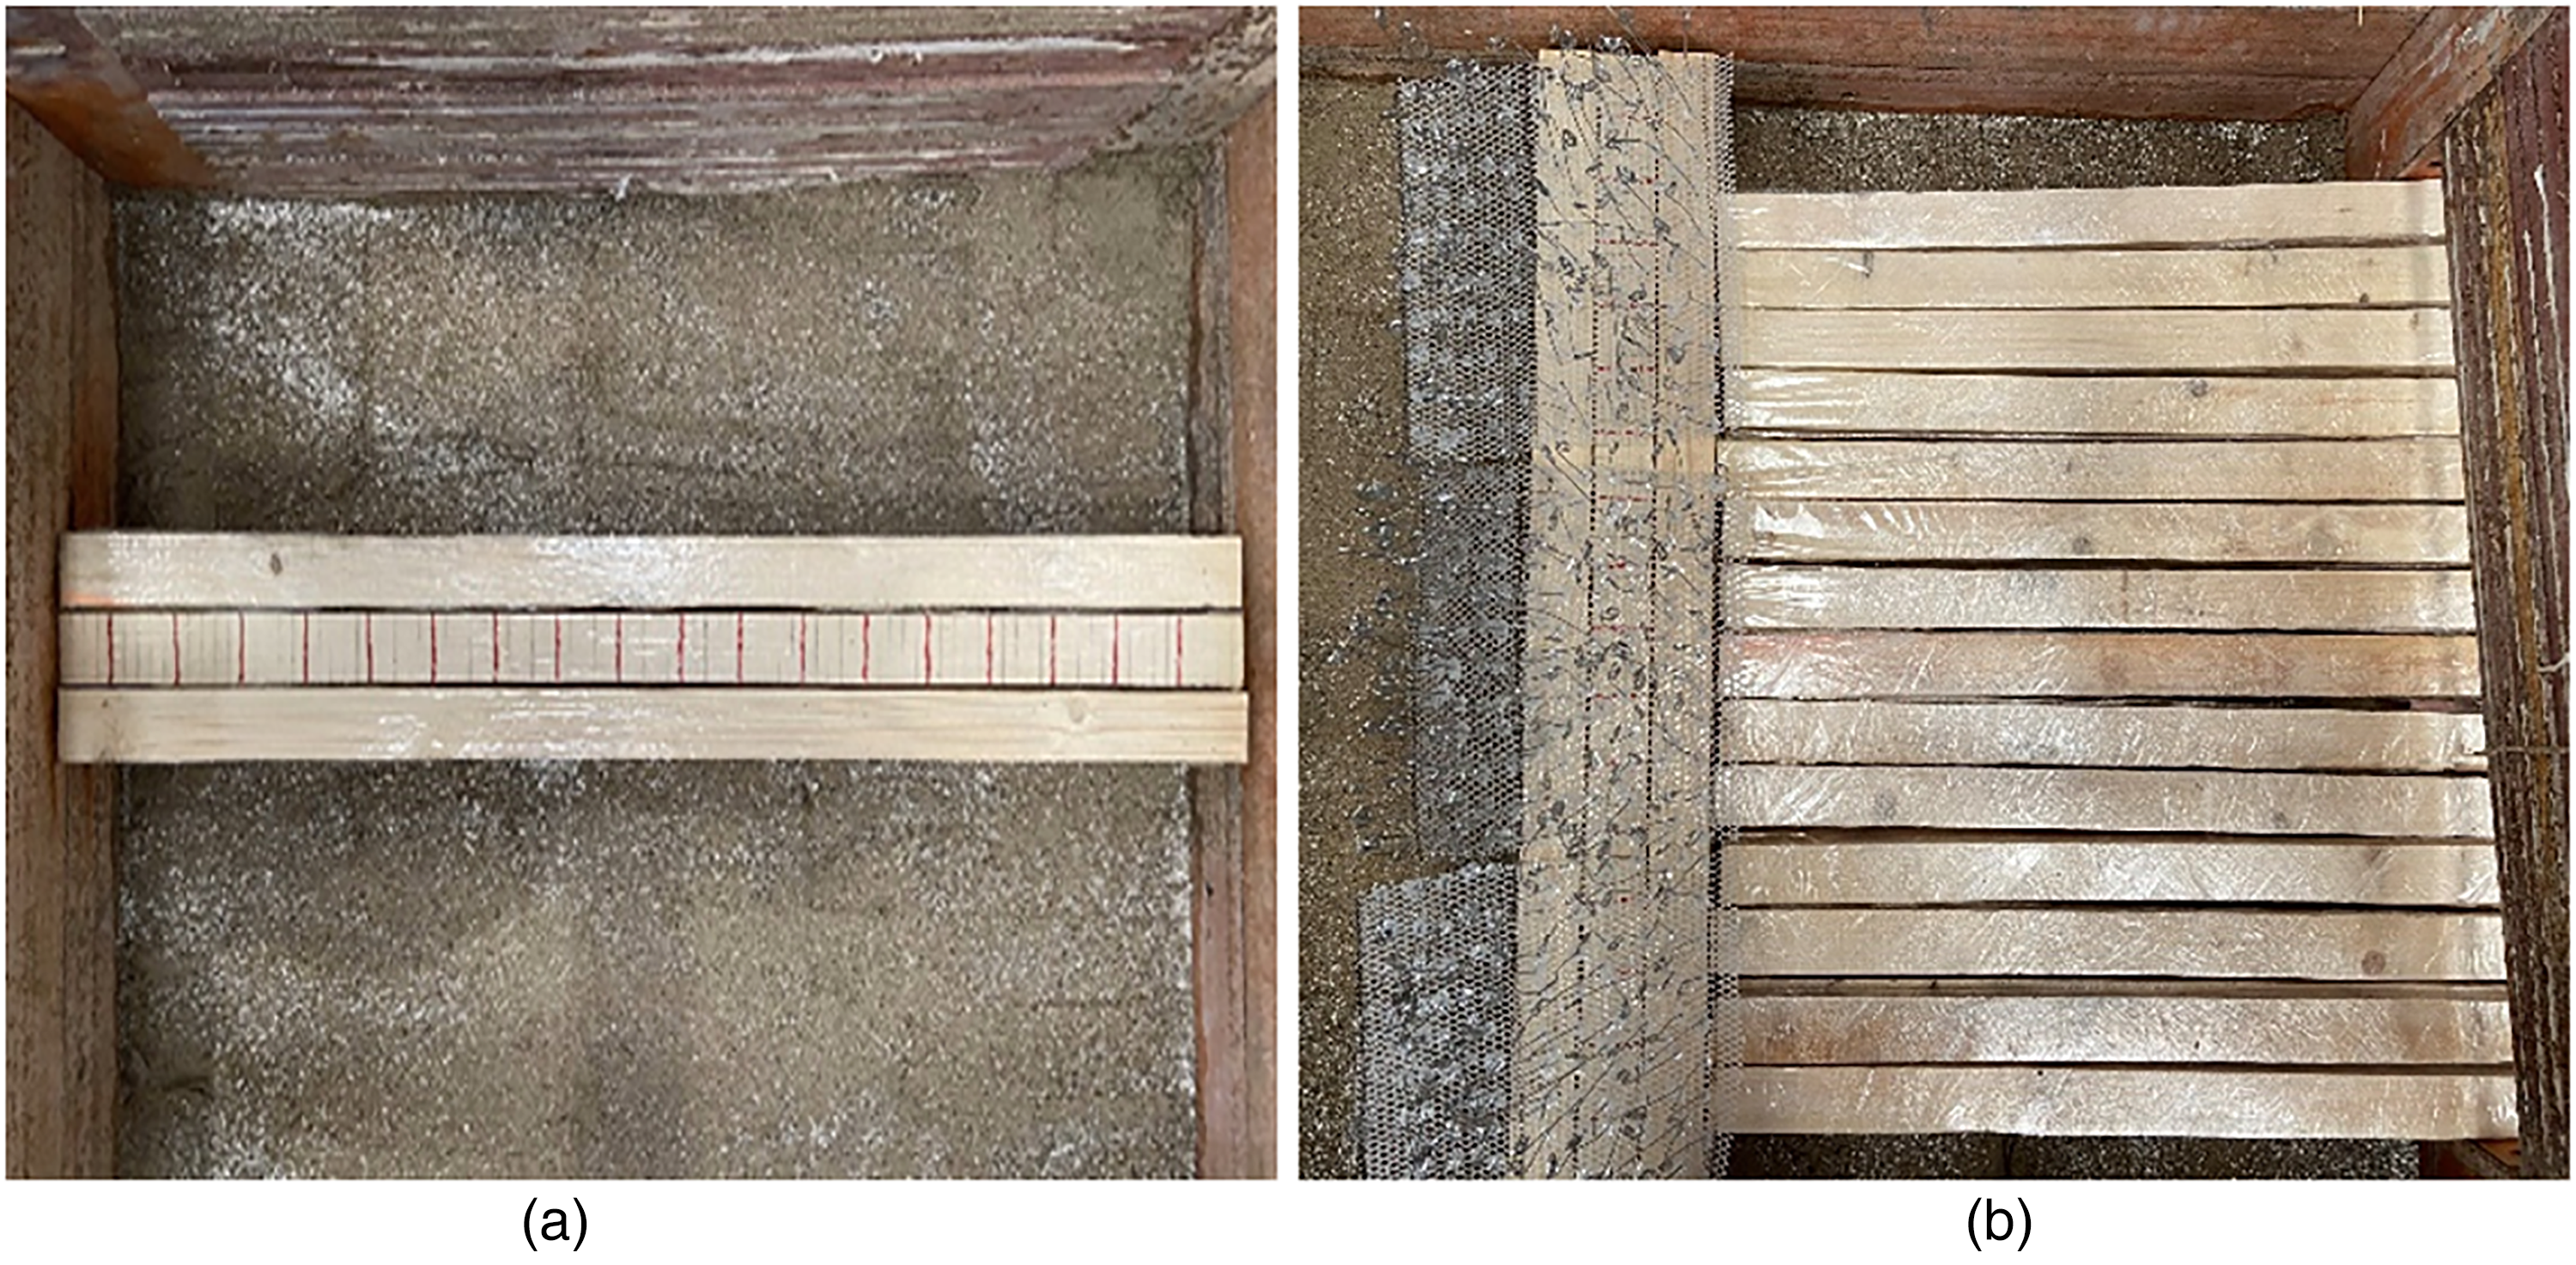
Layout support model, (a) layout of roadway, (b) layout working face.
Table of support model parameters.
The actual specification of the roadway was LH × WH × HH = 45 m × 5 m × 3.6 m, so the geometric similarity ratio of the roadway was 45 after calculation, and the prototype was reduced to 1/45. The average of the actual volume resets is about 


A 6.7-h model calculation was equal to 24 h on-site. It took 2 h to dig 10 cm of the roadway, totaling 100 cm. No apparent deformation was observed in the original support scheme for 6 h. No apparent deformation was observed in the rock surrounding the roadway for another 6 h under support scheme 1. The top slab sank 0.5–1 cm in 6 h under support scheme 2. Figure 21 shows the support effect.
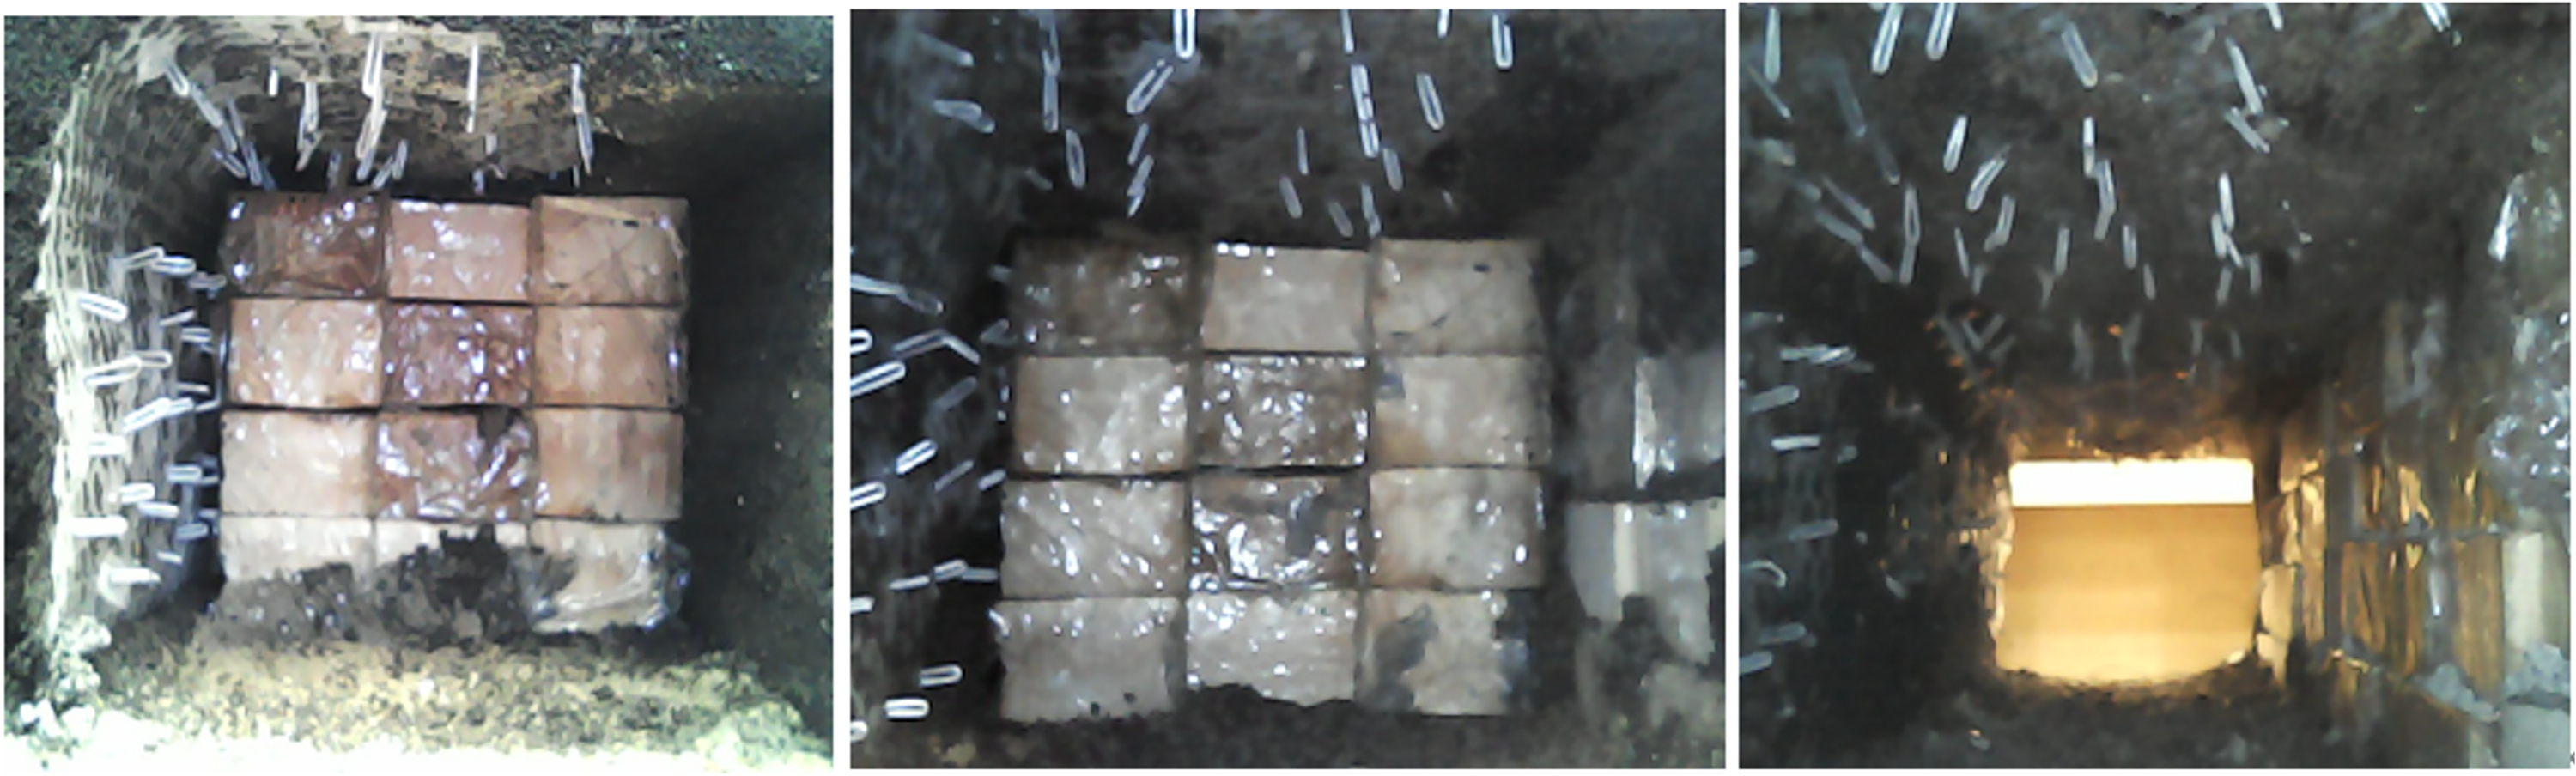
Comparison of support effects of different support schemes. (a) Original support scheme, (b) support scheme 1, (c) support scheme 2.
Figure 22 compares the support effect of the three support schemes at 100 cm. The figure shows that the top plate of support scheme 2 sank significantly.
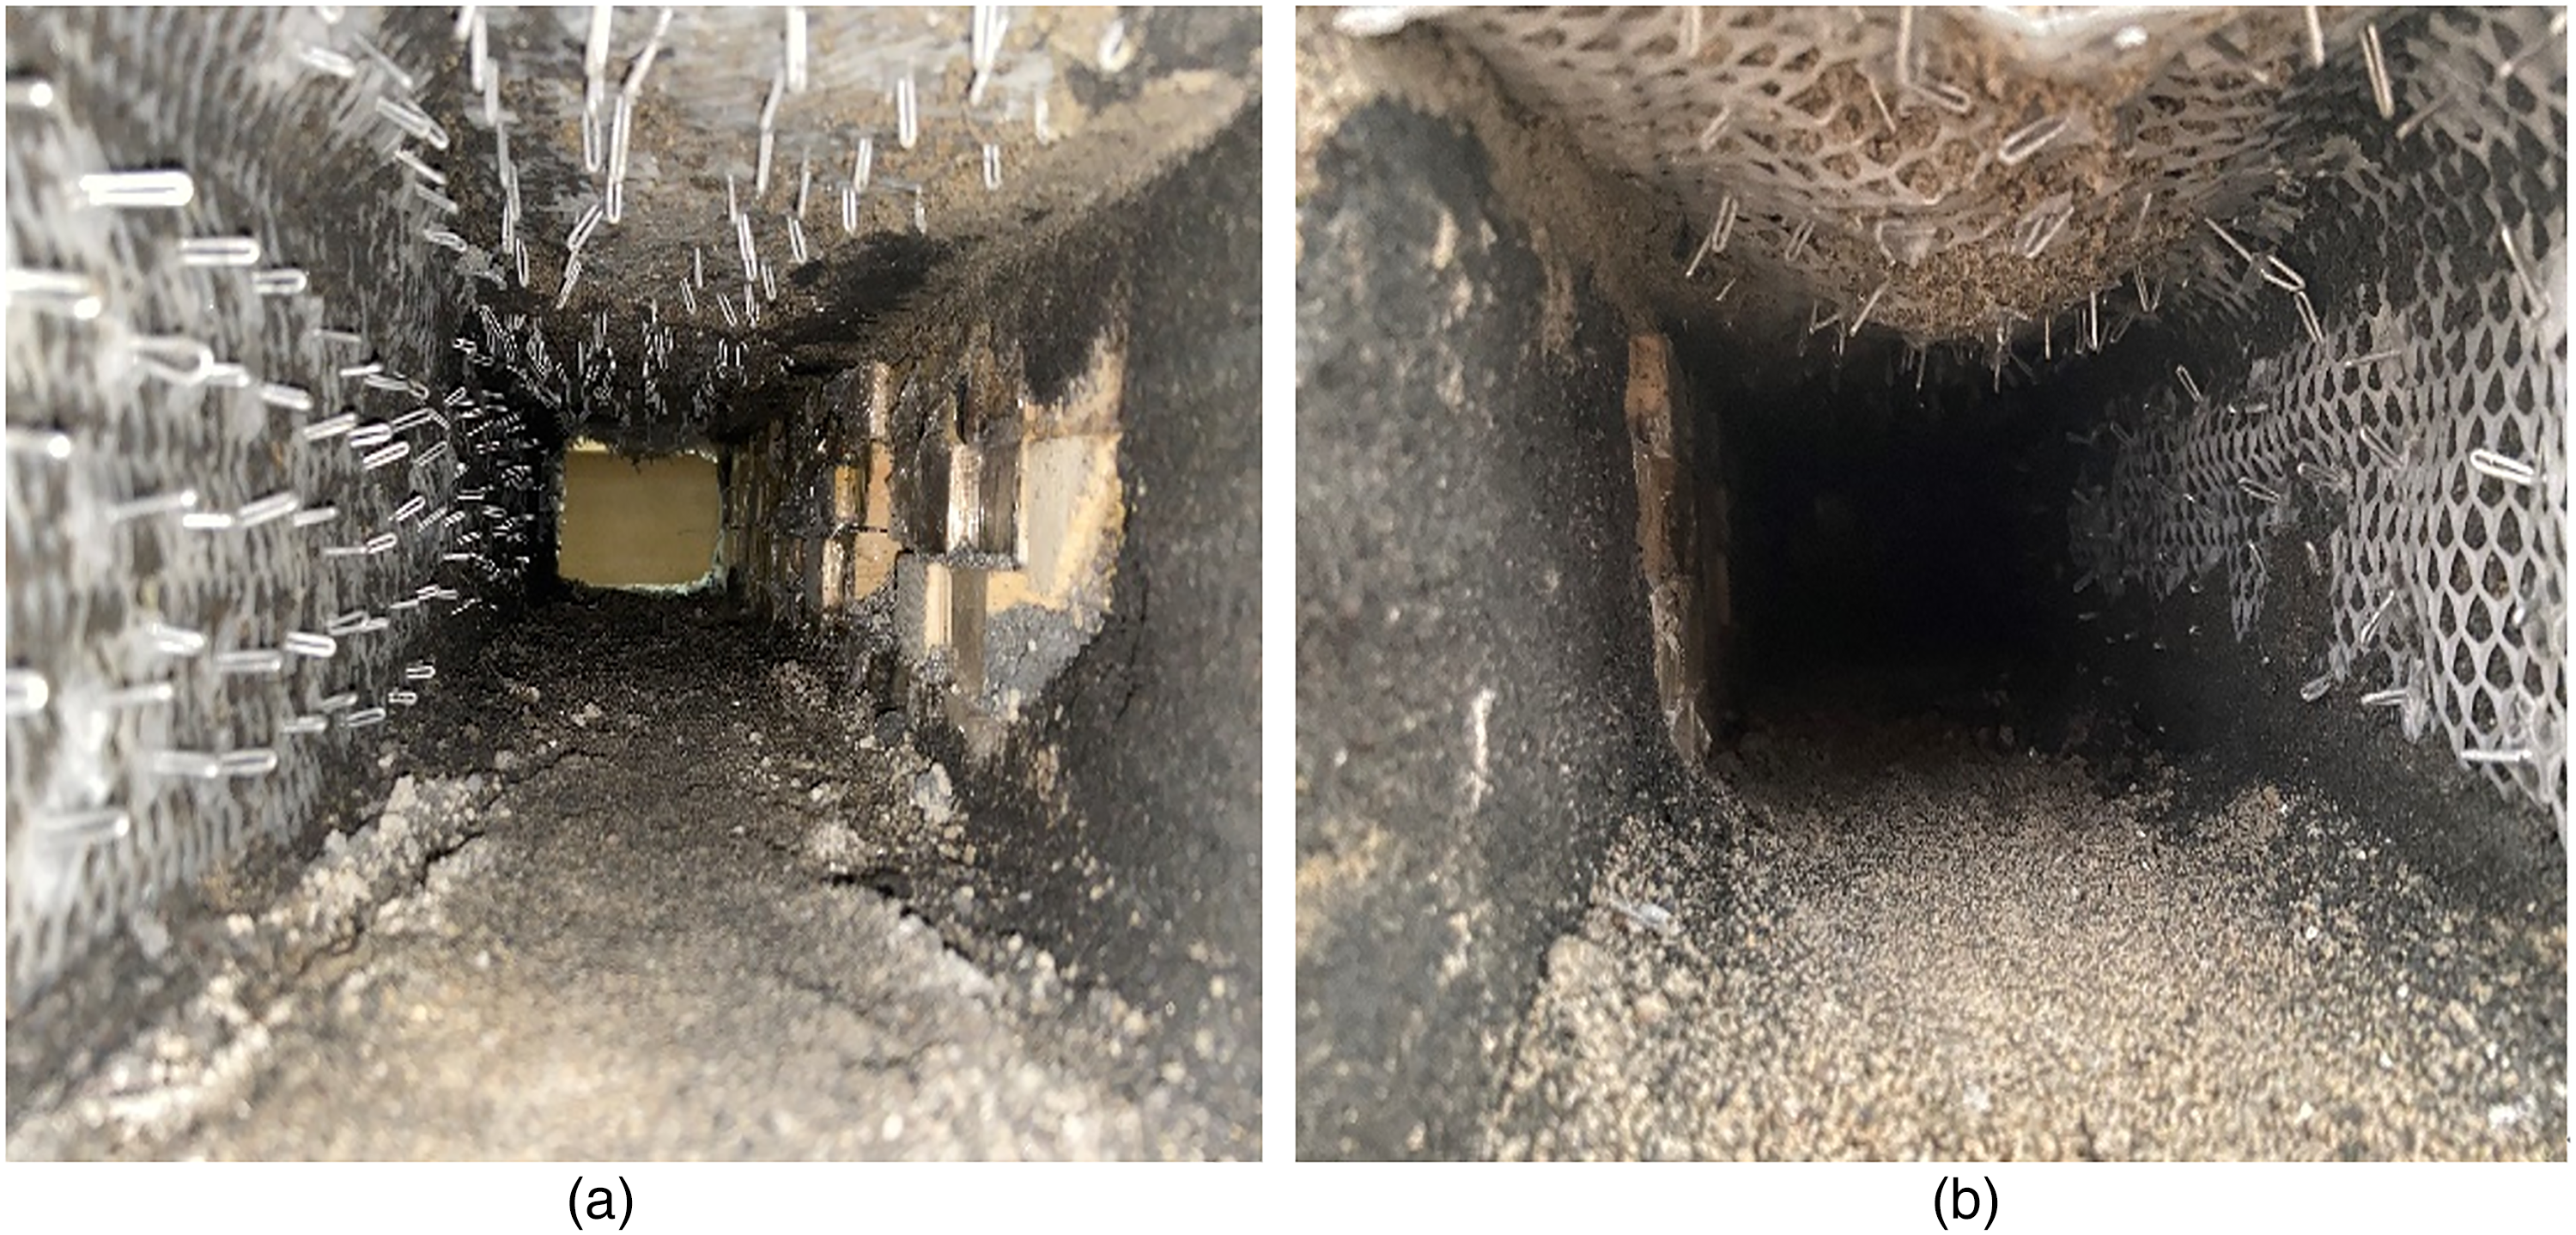
Comparison of top slab subsidence of different support schemes. (a) Original support and support scheme 1, (b) original support and support scheme 2.
Subsequently, the top plate excavated along the tendency and direction. After excavating along the coal seam tendency and direction, fissures gradually appeared in the mining area as the working face mining progressed. The initial pressure of the mining area decreased. The roadway gang deformation and periodic pressure of the mining area also decreased. Under the stress monitoring, the surrounding rock stress characteristics were determined according to the same support program under the roadway measurement data. The vertical stress of the roadway with increased length first increased, decreased, and finally leveled off, as shown in Figure 23. In the stress concentration zone disturbed by the overrunning support pressure, the peak vertical stresses of support scheme 2 and original support scheme were similar at 20 and 18 MPa, respectively, whereas that of support scheme 1 reached 24 MPa.
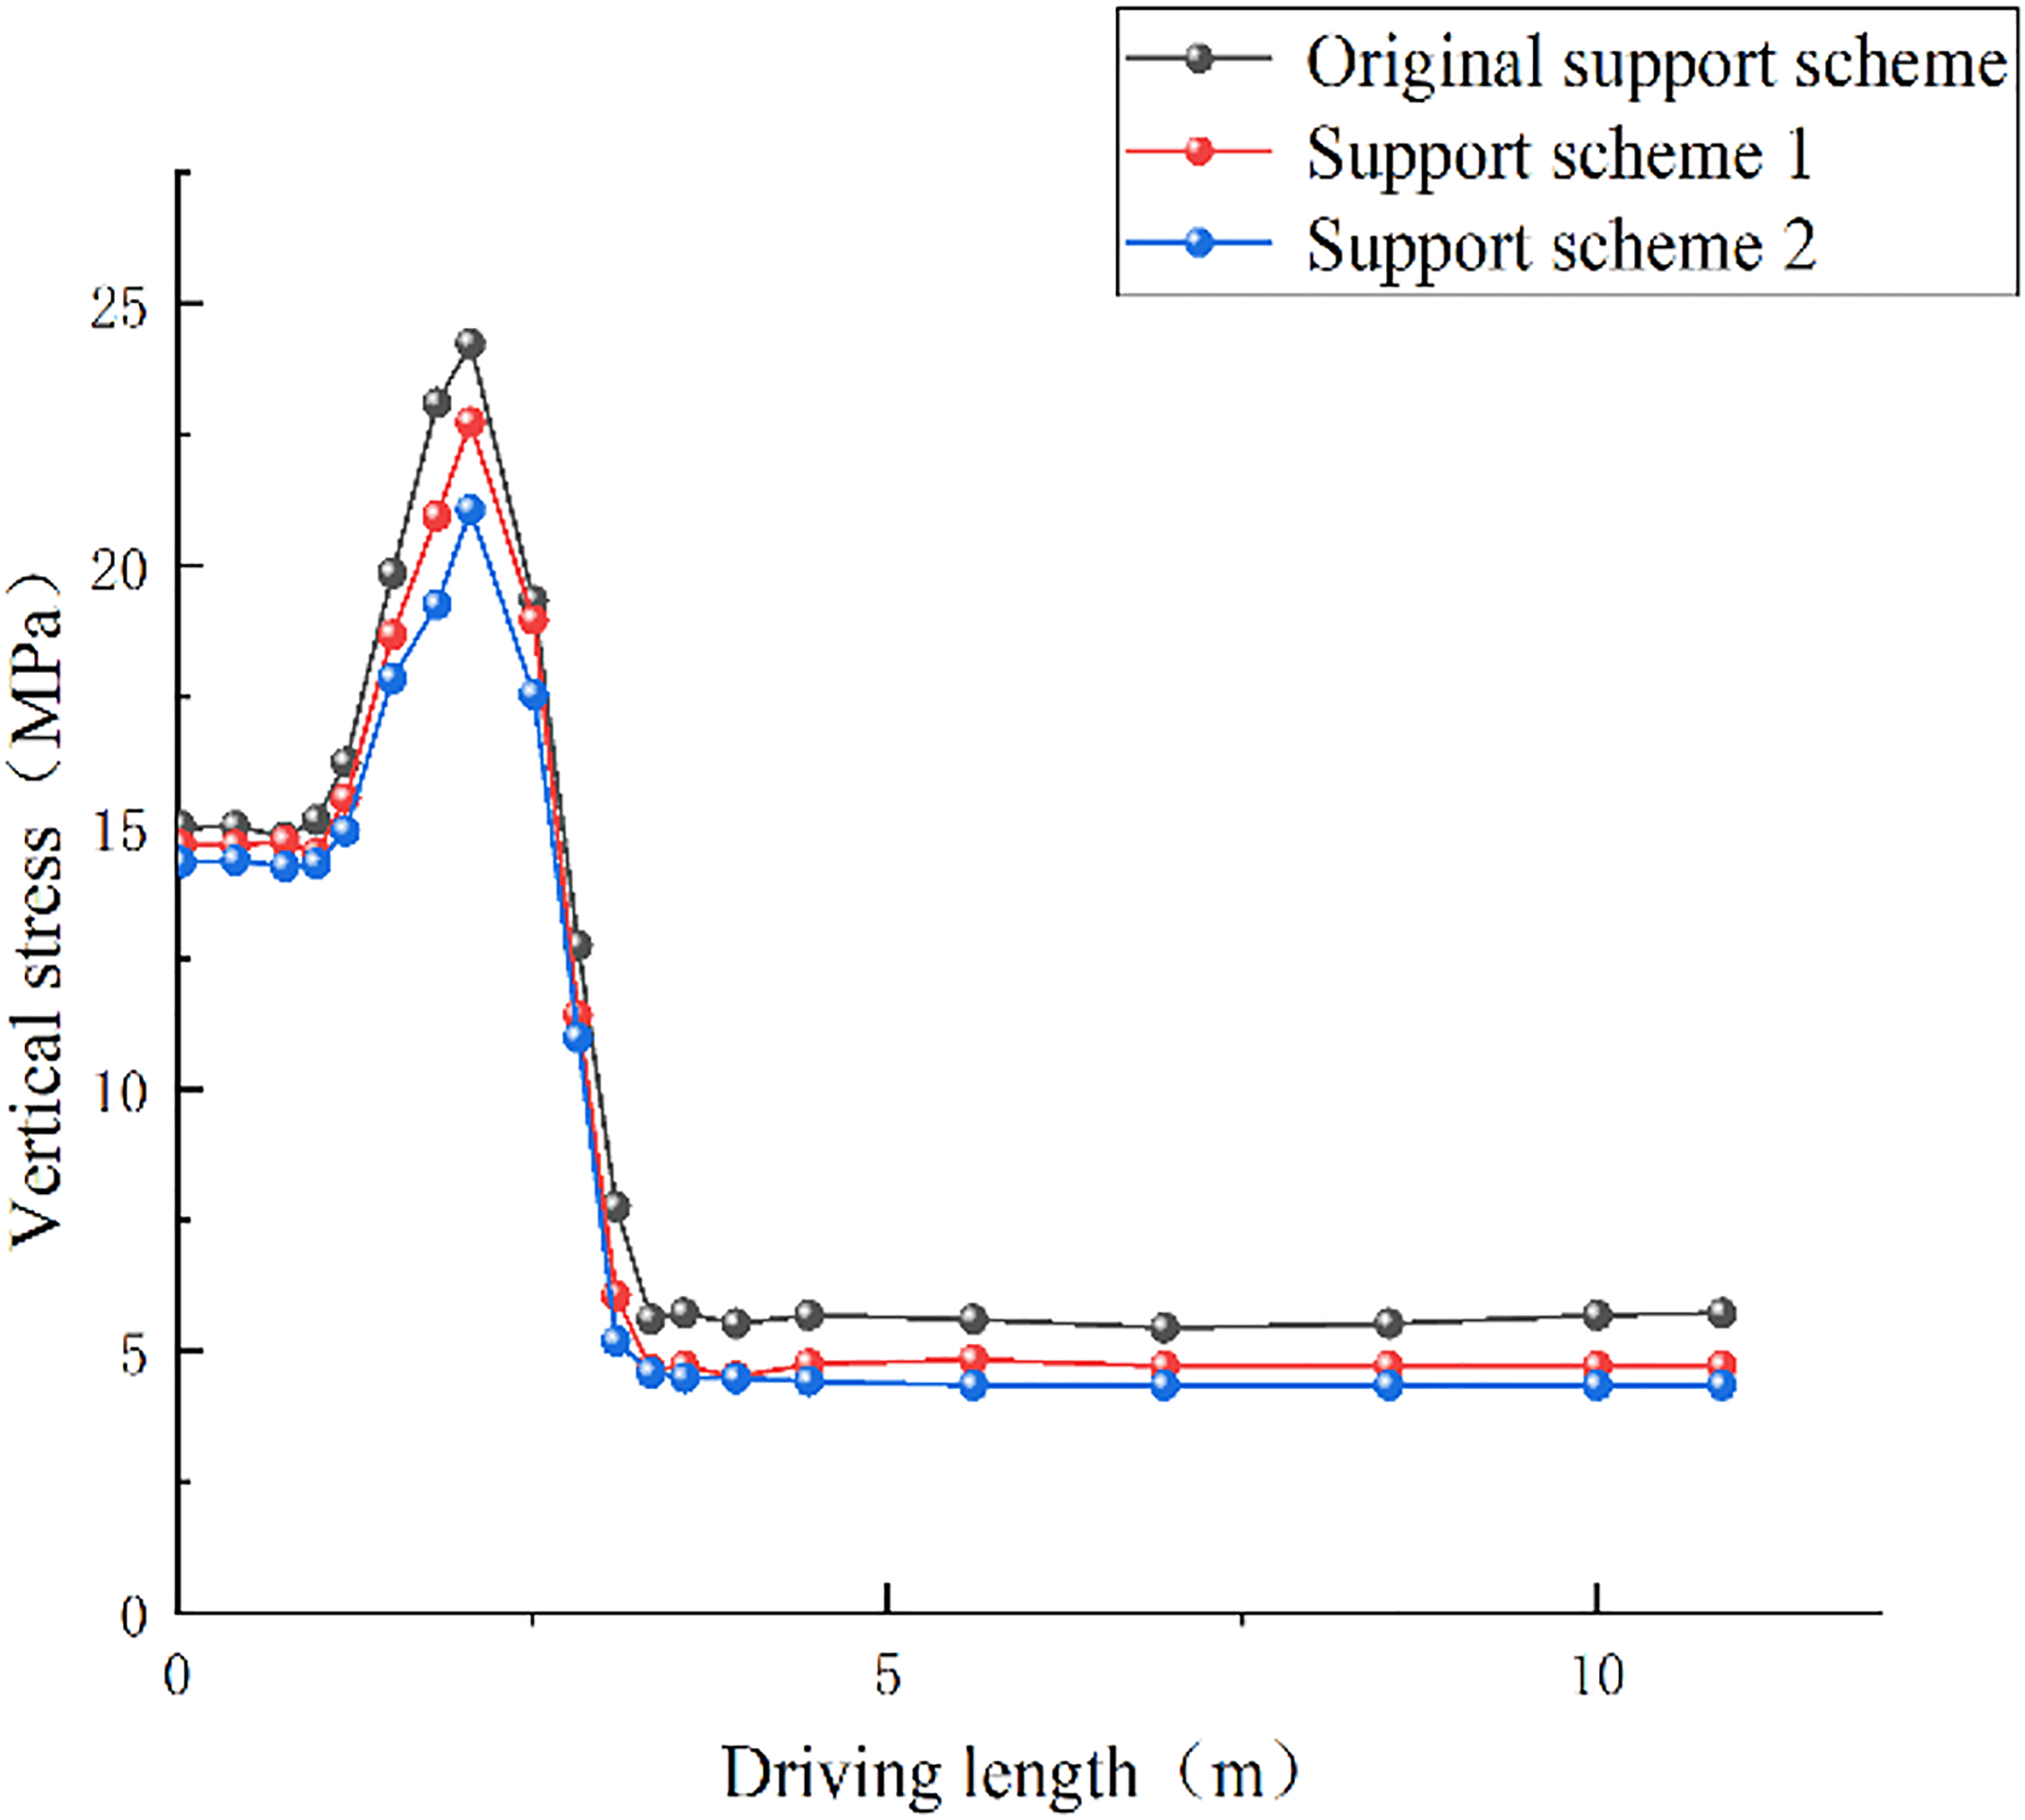
Surrounding rock stress characteristics trend diagram.
The magnitude of the control of the surrounding rock of support schemes 1 and 2 was on the XY-axis, and the digging length was on the Z-axis, as shown in Figure 24. This demonstrates the difference in the vertical stress control effect of the different support schemes on the surrounding rock during the digging process according to the line fluctuation. The advantages and disadvantages of the two support schemes for controlling the surrounding rock at different excavation lengths were compared visually.
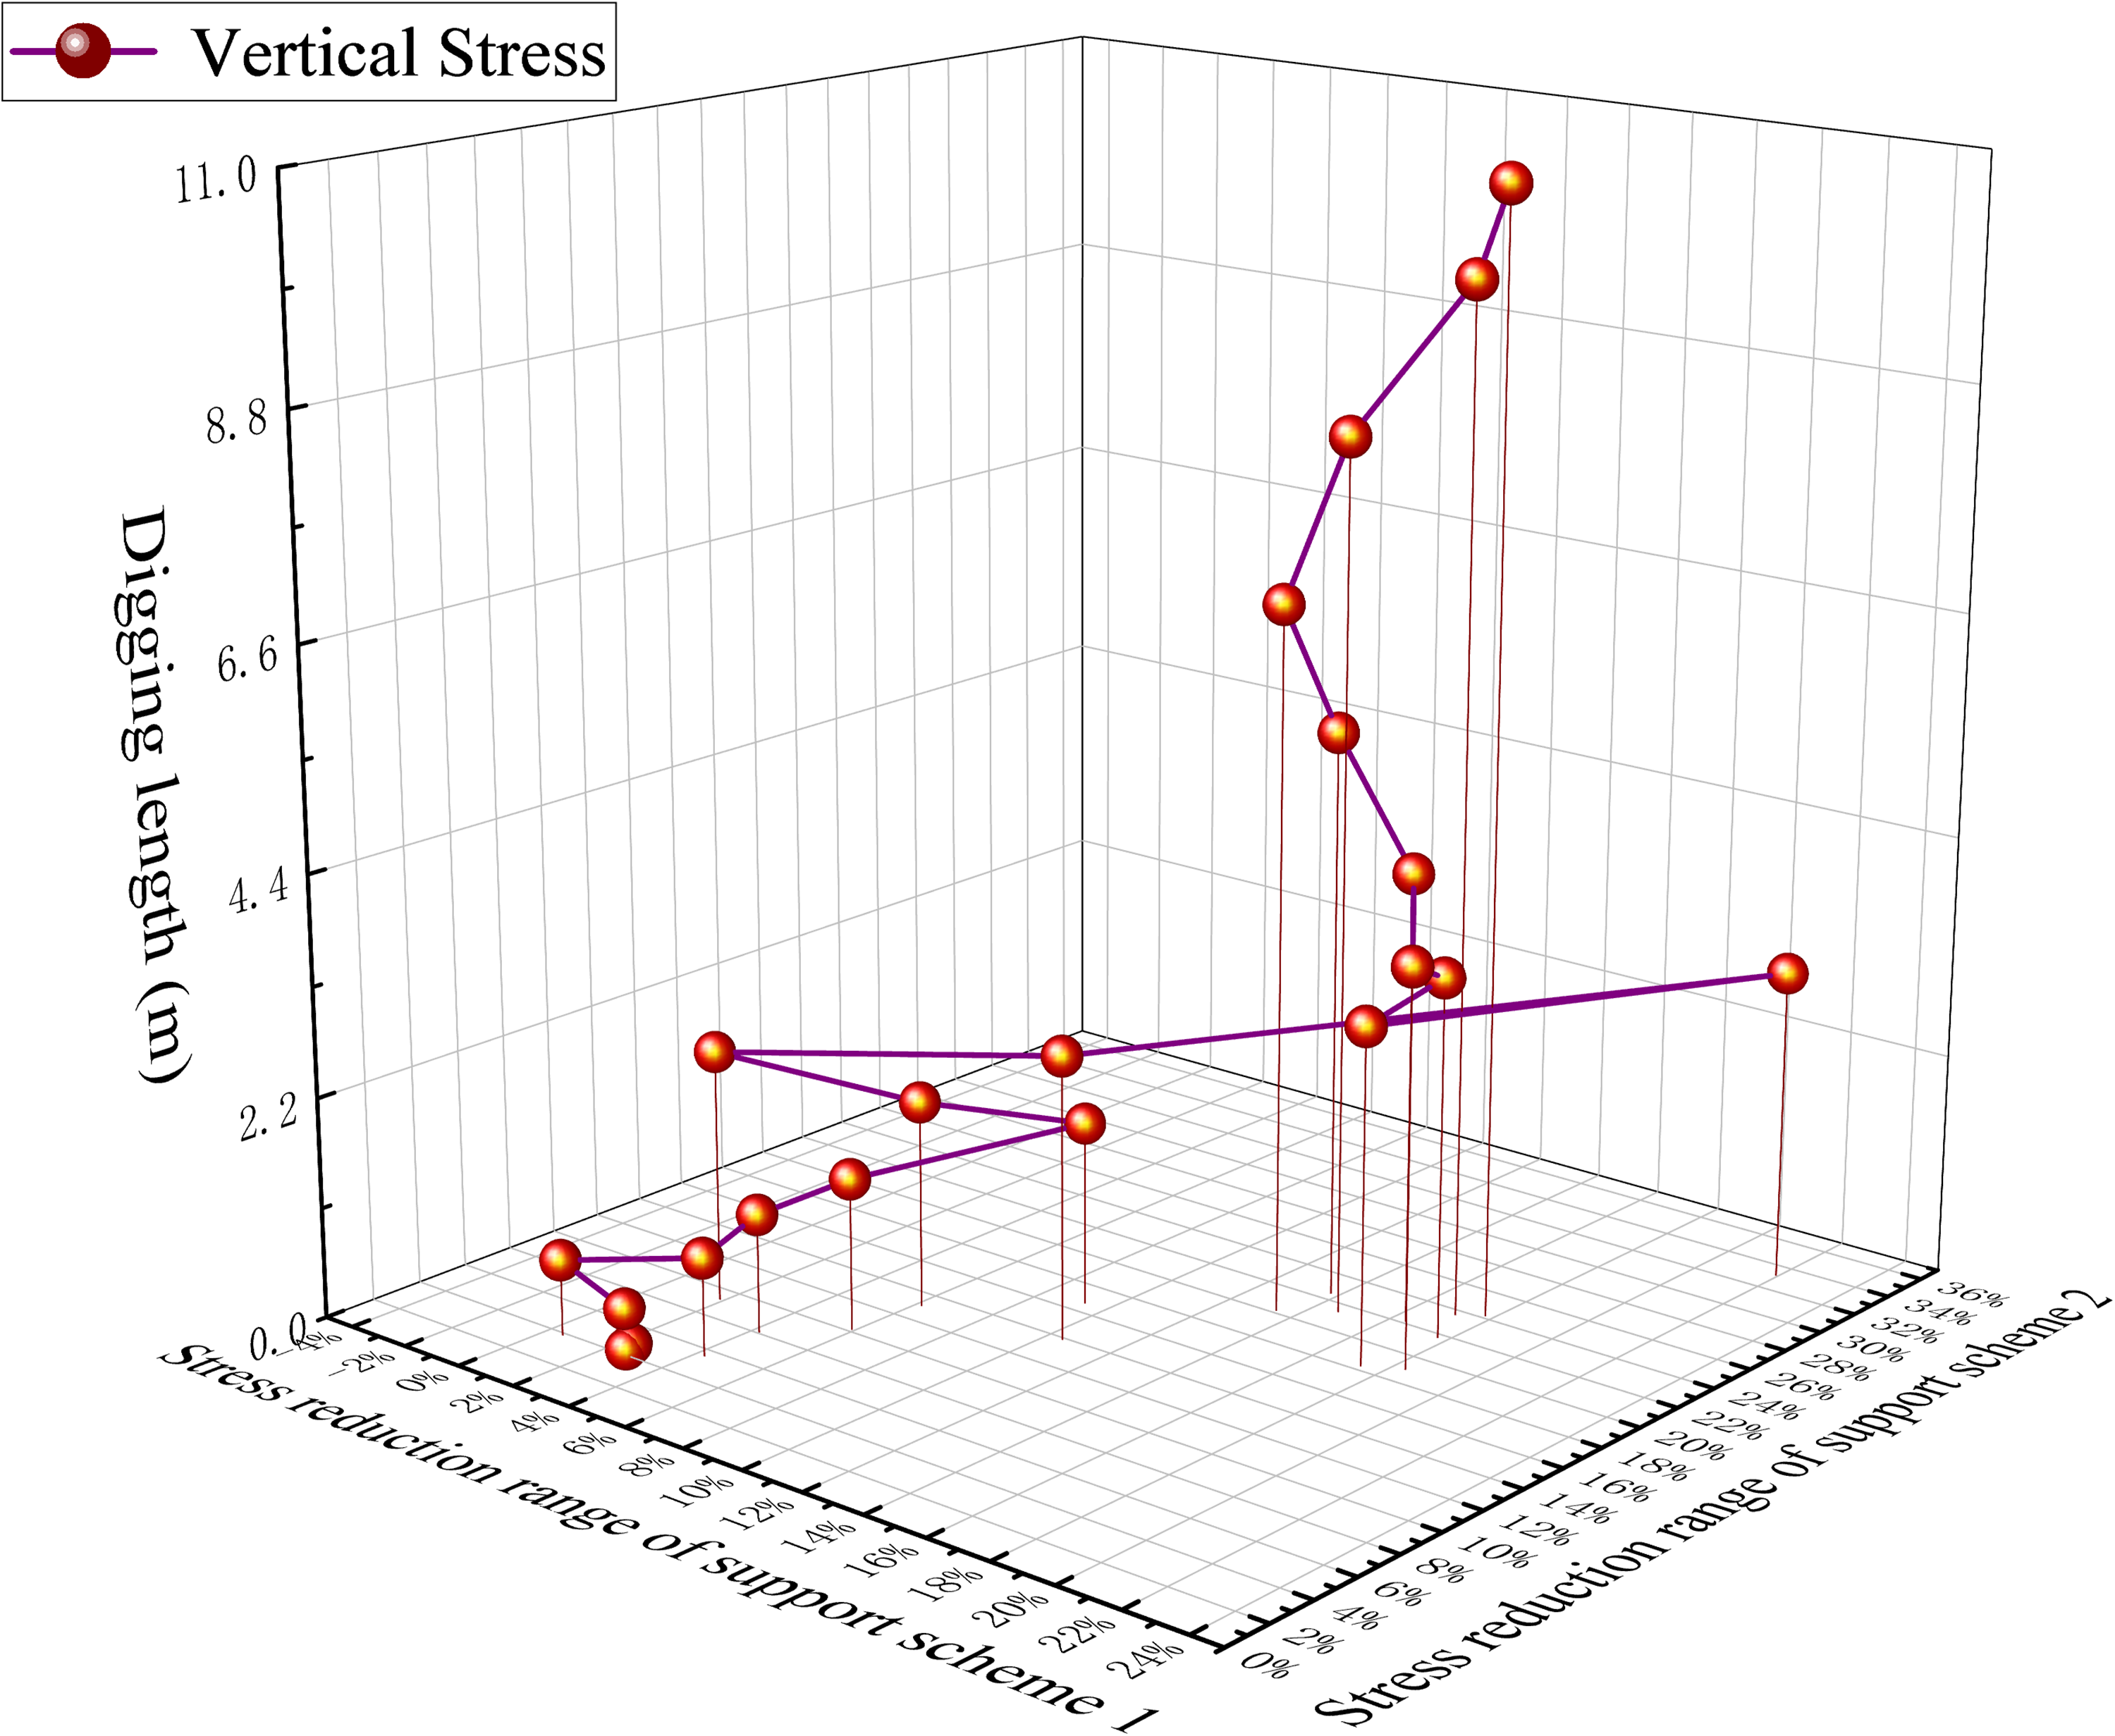
Comparison of stress control for each support scheme.
Analysis of experimental results
After observing and analyzing the deformation of the surrounding rock under the three support schemes, the top plate deformation of the original support scheme and support scheme 1 was calculated at approximately 100 mm, and that of the gang was approximately 80 mm. These were significantly less than that of support scheme 2 at approximately 170 mm. The performances of the original support scheme and support scheme 1 were relatively better. By contrast, the performance of support scheme 2 was worse. According to the stress–strain analysis, the stress concentration in support scheme 2 was the most ambiguous. An endoscope was used to analyze the tendency of the model. The results showed that the surrounding rock of support scheme 2 was damaged, the roof plate collapsed for the first time at 12 m, a square span fall appeared at 25 m, and the mine pressure was prominent. Comprehensive measures, such as the amount of two-gang shifts, stress distribution, and observation results, recommended the application of support scheme 1 under the excavation program.
Engineering practice verification
Field experiments were performed at the rapid-driving site of the W3233 working face return airway after verification using similar simulation experiments. The lagging process was applied to a construction site using a single-shift regular cycle of parallel operation of the process cycle. The stability of the rock surrounding the roadway was assessed from multiple perspectives using roof drilling, geological radar, and roadway surface displacement monitoring, as shown in Figure 25.
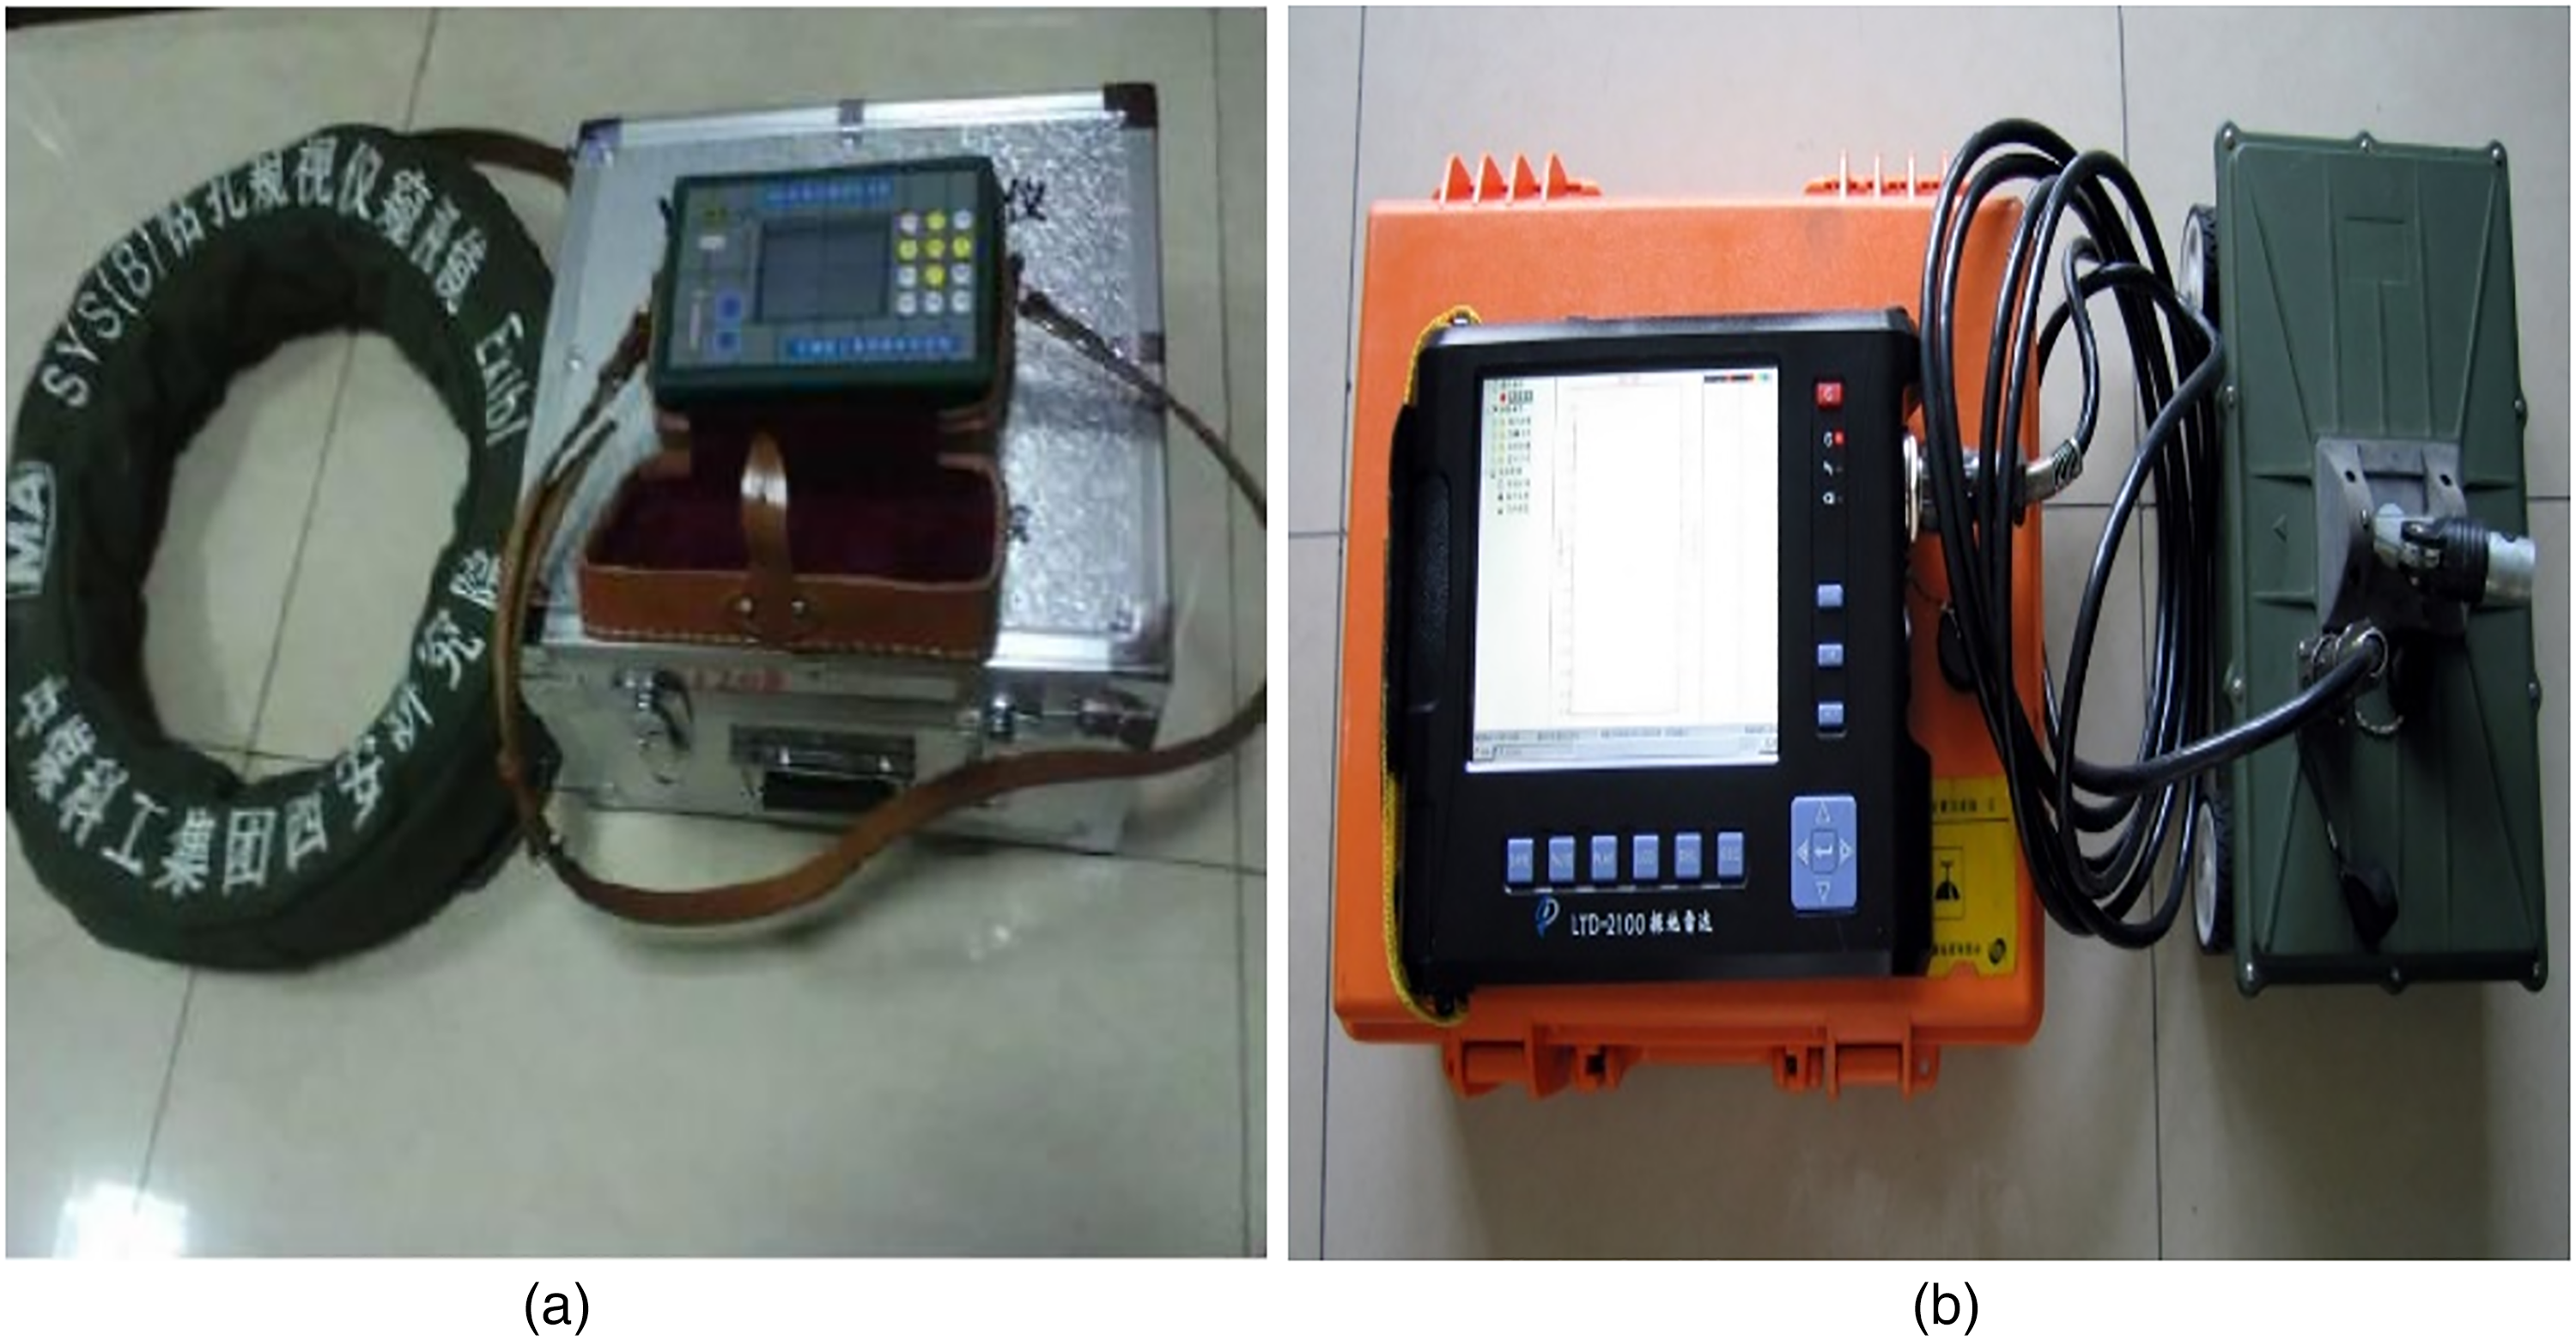
Monitoring instruments. (a) Borehole pepper, (b) George Adar.
Comparison of lagging support application
The practical engineering verification of different lagging anchors was performed at the construction site; each construction operation time was recorded, and the comparison operation time was obtained, as listed in Table 5 (Kan and Jiang, 2012; Xiao et al., 2011). Figure 26 shows the site construction reference after optimizing the support parameters.
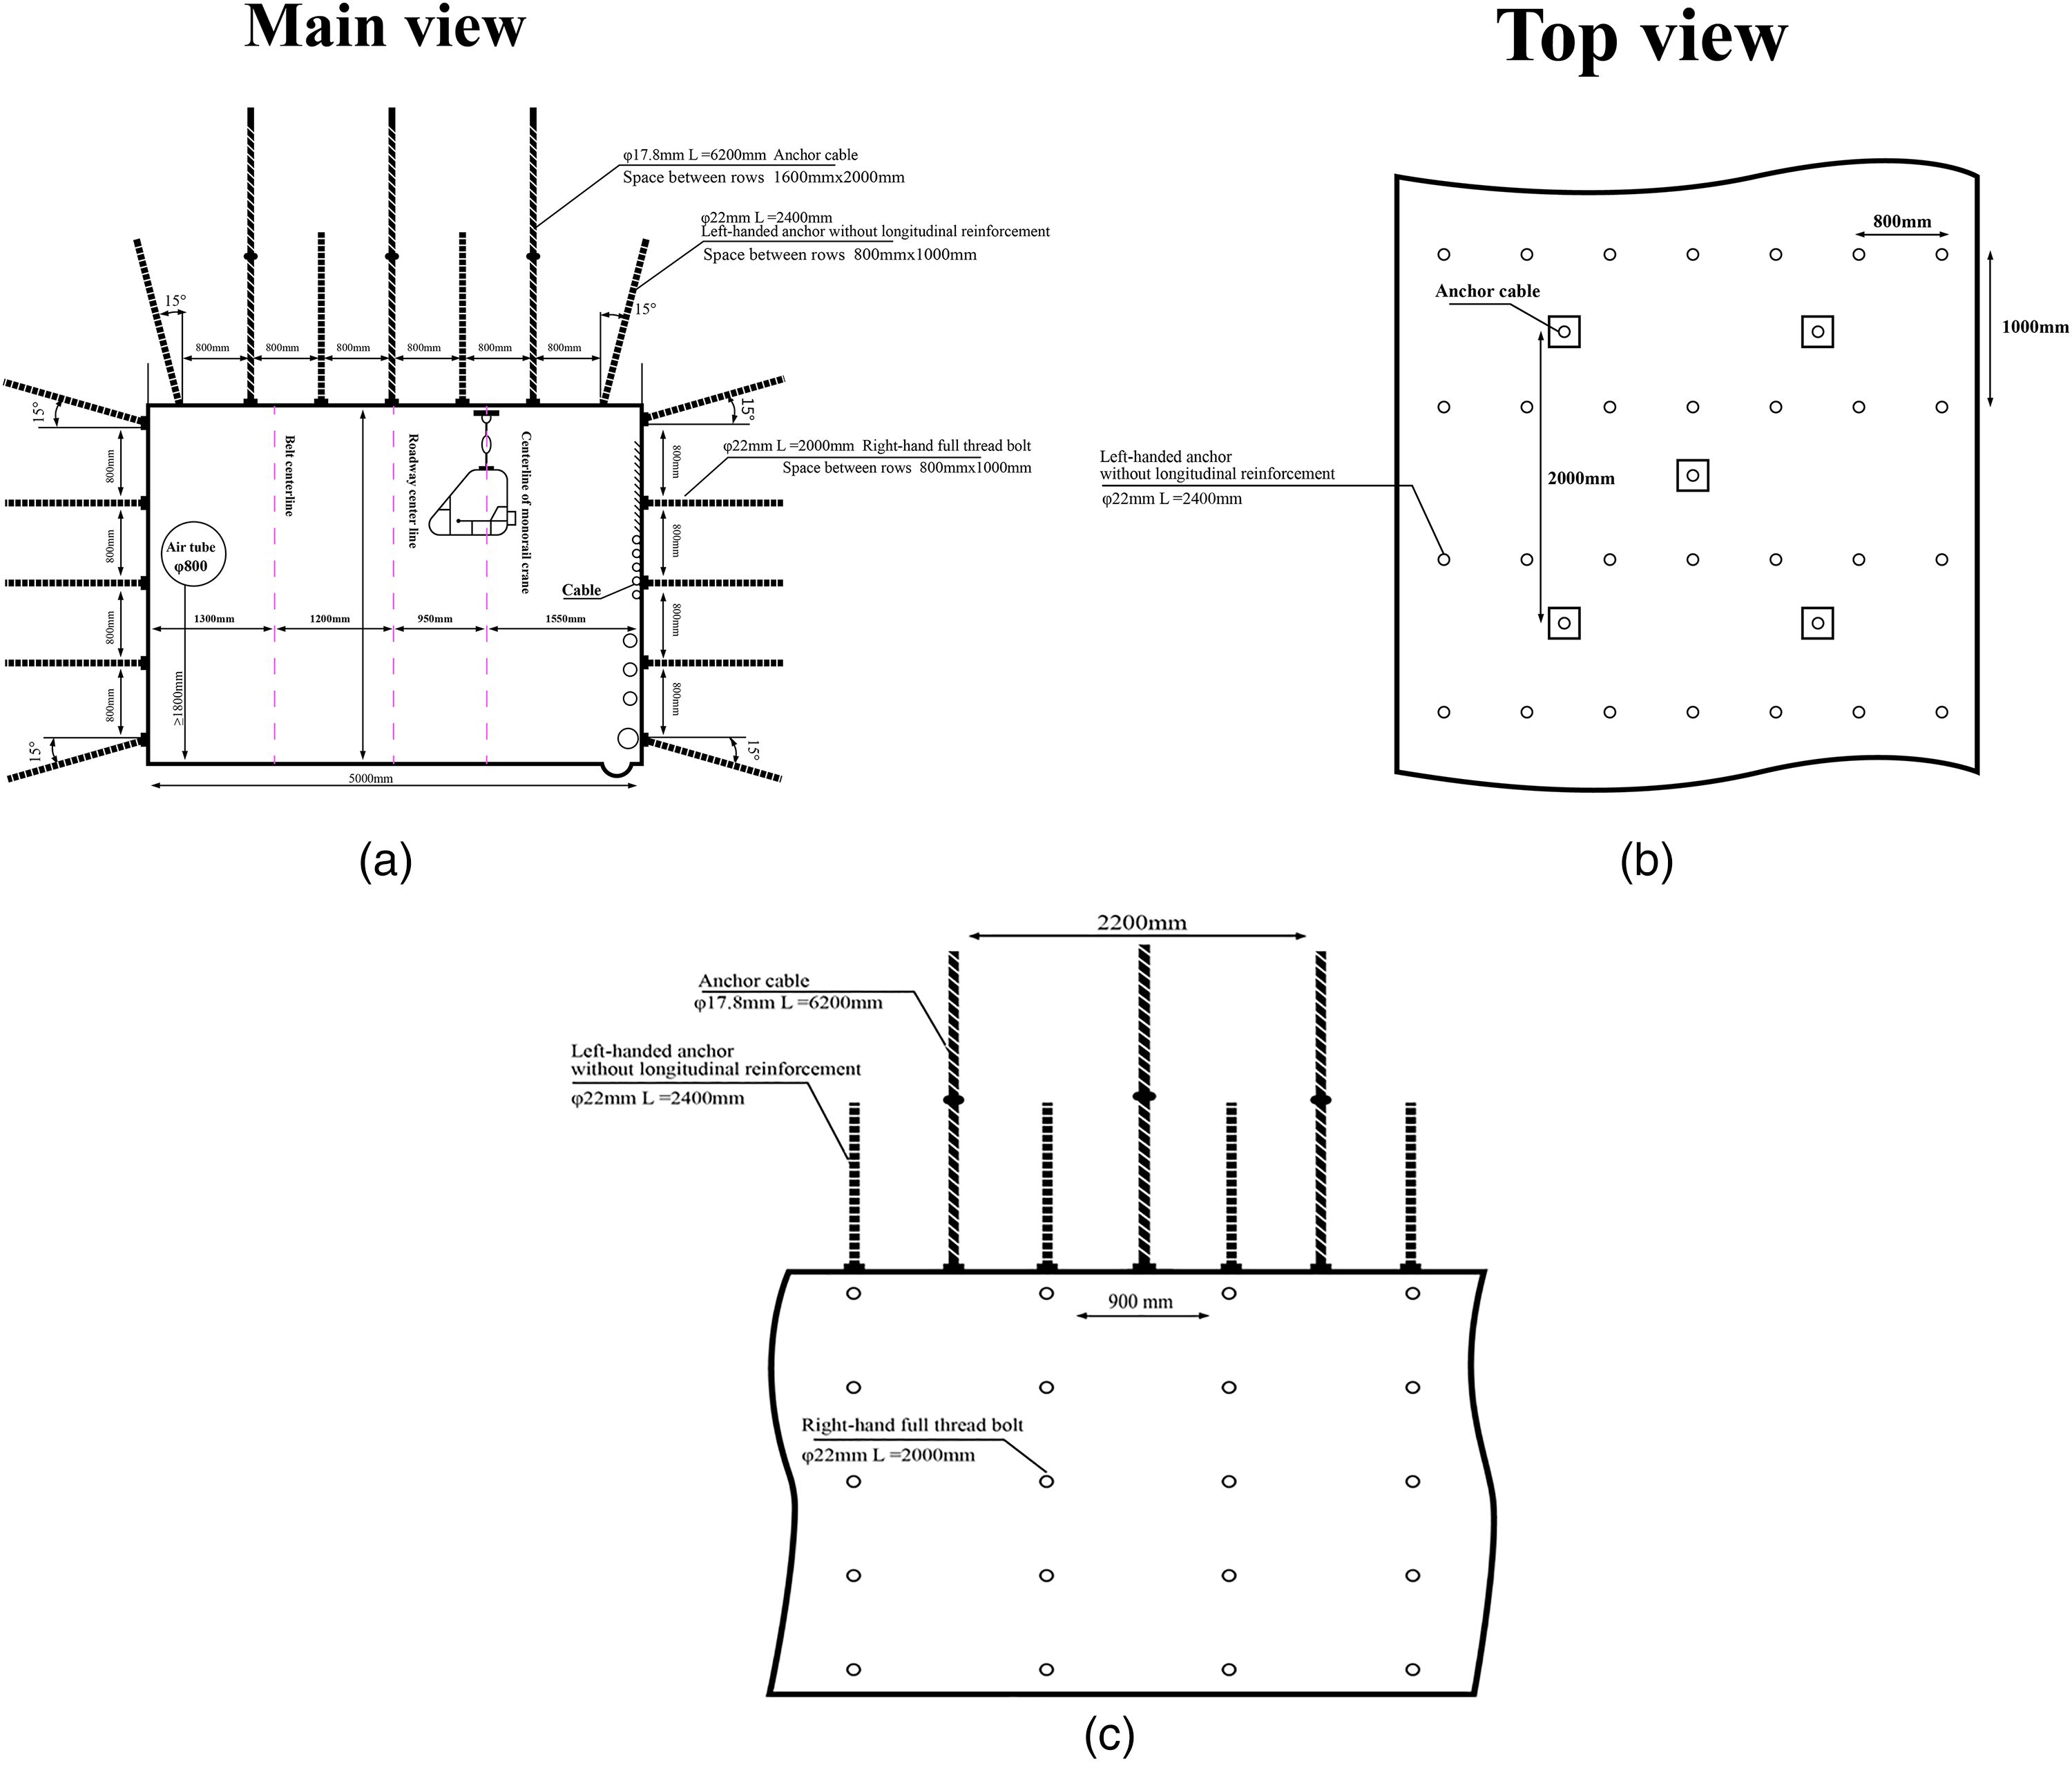
Main, top, and side views of optimized support parameters. (a) Main view, (b) top view, (c) side view.
Operation time comparison of lagging support process.
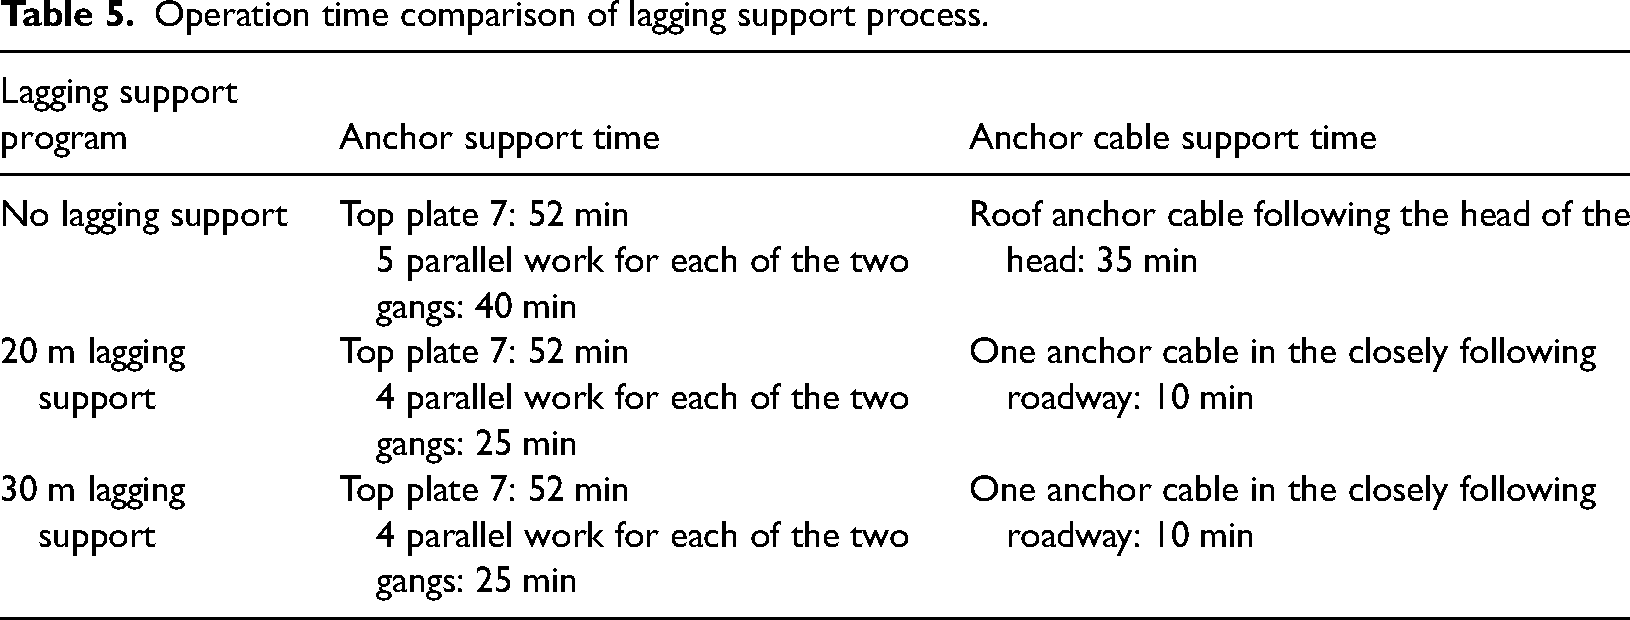
Drilling the holes accurately in the field was difficult because of the angle of the low gang, consuming substantial time. By contrast, lagging can save at least 15 min on the anchor support of the gang. Workers need to use the road header when working on the roof at the headway. Moving the road header consumes considerable time. As shown in Table 5, the lagging 20 and 30 m supports will have one less top plate anchor cable, and the remaining four lagging supplementary hits at the head will follow the anchor cable in the roadway. This will facilitate the timely moving position of the road header, saving more than 25 min, equating to approximately 60 min per lap.
Monitoring analysis of surrounding rock deformation
Holes were drilled at 20 m above the head to observe the integrity of the rock roof. The roadway was probed at 10, 20, and 40 m from the headway. The extent of the loosening circle of the surrounding rock after the rebalancing of the stress after the roadway support was analyzed by georadar monitoring combined with software to evaluate the integrity of the rock surrounding the roadway (Xu et al., 2020; Yang and Fan, 2019). Figure 27 shows the georadar maps. Measurement stations #1 and #2 were set 10 and 20 m from the headway, respectively. Each station set four measurement points to observe the displacement of the top and bottom of the roadway, displacement of the two gangs, sinking of the top plate, and bottom dropsy to analyze whether the surrounding rock of the roadway has stabilized. The loosening circle of the surrounding rock was detected at different distances from the headway position. The results indicated that the loosening circle of the surrounding rock at 10 m had an average thickness of approximately 2 m. The loosening circle was effectively controlled by applying seven bolts with anchor cables. The average thickness of the loose circle at 20 m was approximately 2.4 m, an increased value but was still within the anchorage range. Low-gang anchors were added to suppress the further expansion of the loosening circle. The loose circle of the surrounding rock was approximately 2.45 at 40 m. The lagging support process verified that the surrounding rock was well controlled.
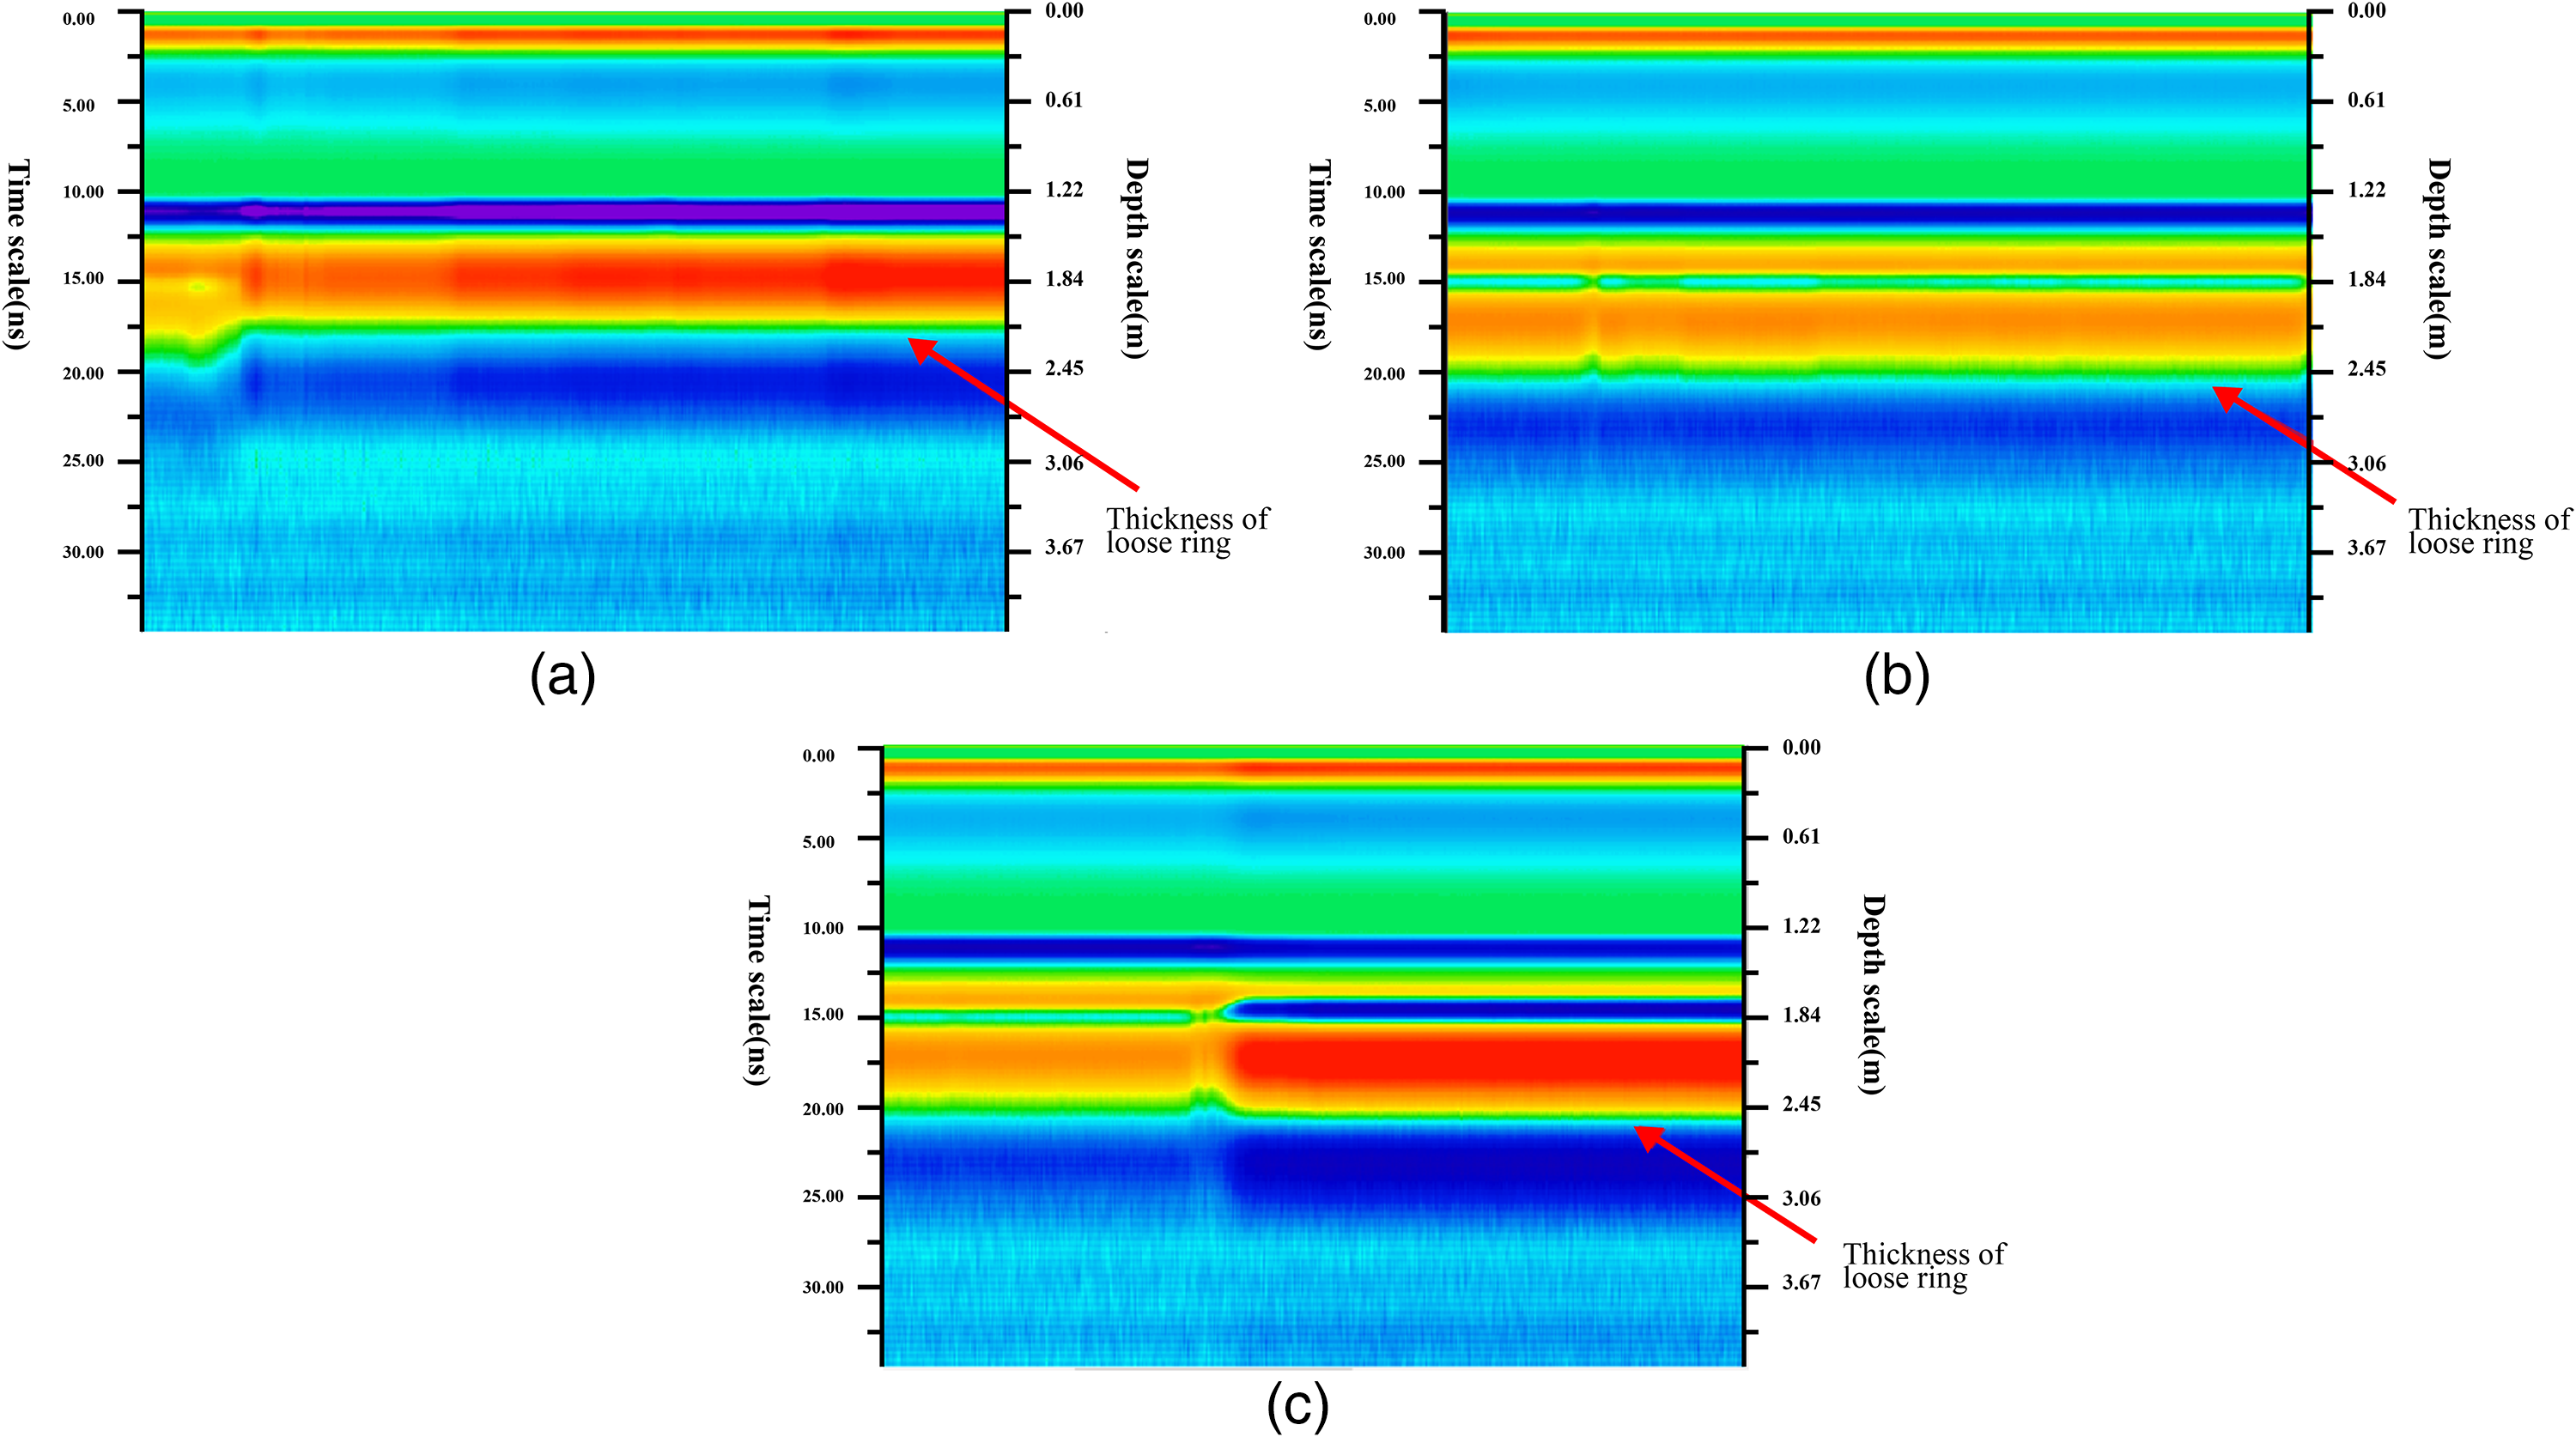
Loose circle cloud map. (a) Cloud map of the pine circle at 10 m from head-on position, (b) cloud map of the pine circle 20 m from head-on position, (c) cloud map of the pine circle at 40 m from head-on position.
Drill hole peeping revealed multiple fractures in the rock formation at different depths, as shown in Figure 28. At 0.681 m, circumferential fissures, longitudinal fissures, and a circumferential fissure zone were found at 0.985, 1.592, and 2.385 m, respectively. The stability of the surrounding rock was secured after implementing the optimized plan.
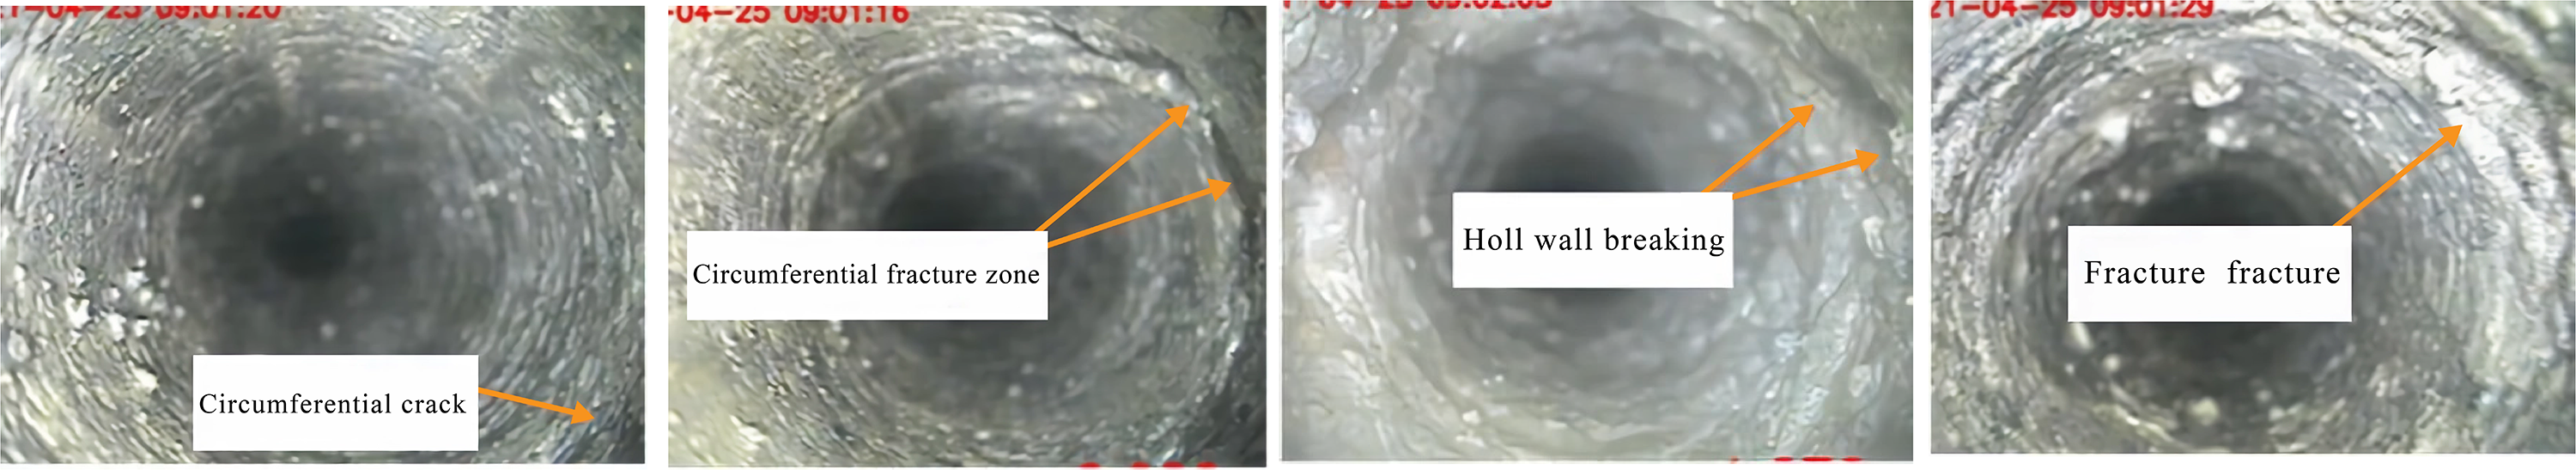
Site surrounding the rock fracture observation chart.
The amount of surrounding rock shift was observed by analyzing the cumulative change curve of displacement in the roadway stage, as shown in Figure 29. At the beginning of the roadway, the two helpers had a large deformation, and the depth of the roadway deformation on both sides was greater than that on the bottom plate. The deformation of the bottom plate of the roadway increased after a period. This proved that the horizontal and vertical stresses affected the roadway deformation from the initial stage of the horizontal stress to its transformation to vertical stress. The observation results show that the horizontal displacement of the roadway was less than or equal to 80 mm vertical displacement in approximately 60 mm roadway surrounding rock stability, verifying the significant support effect.
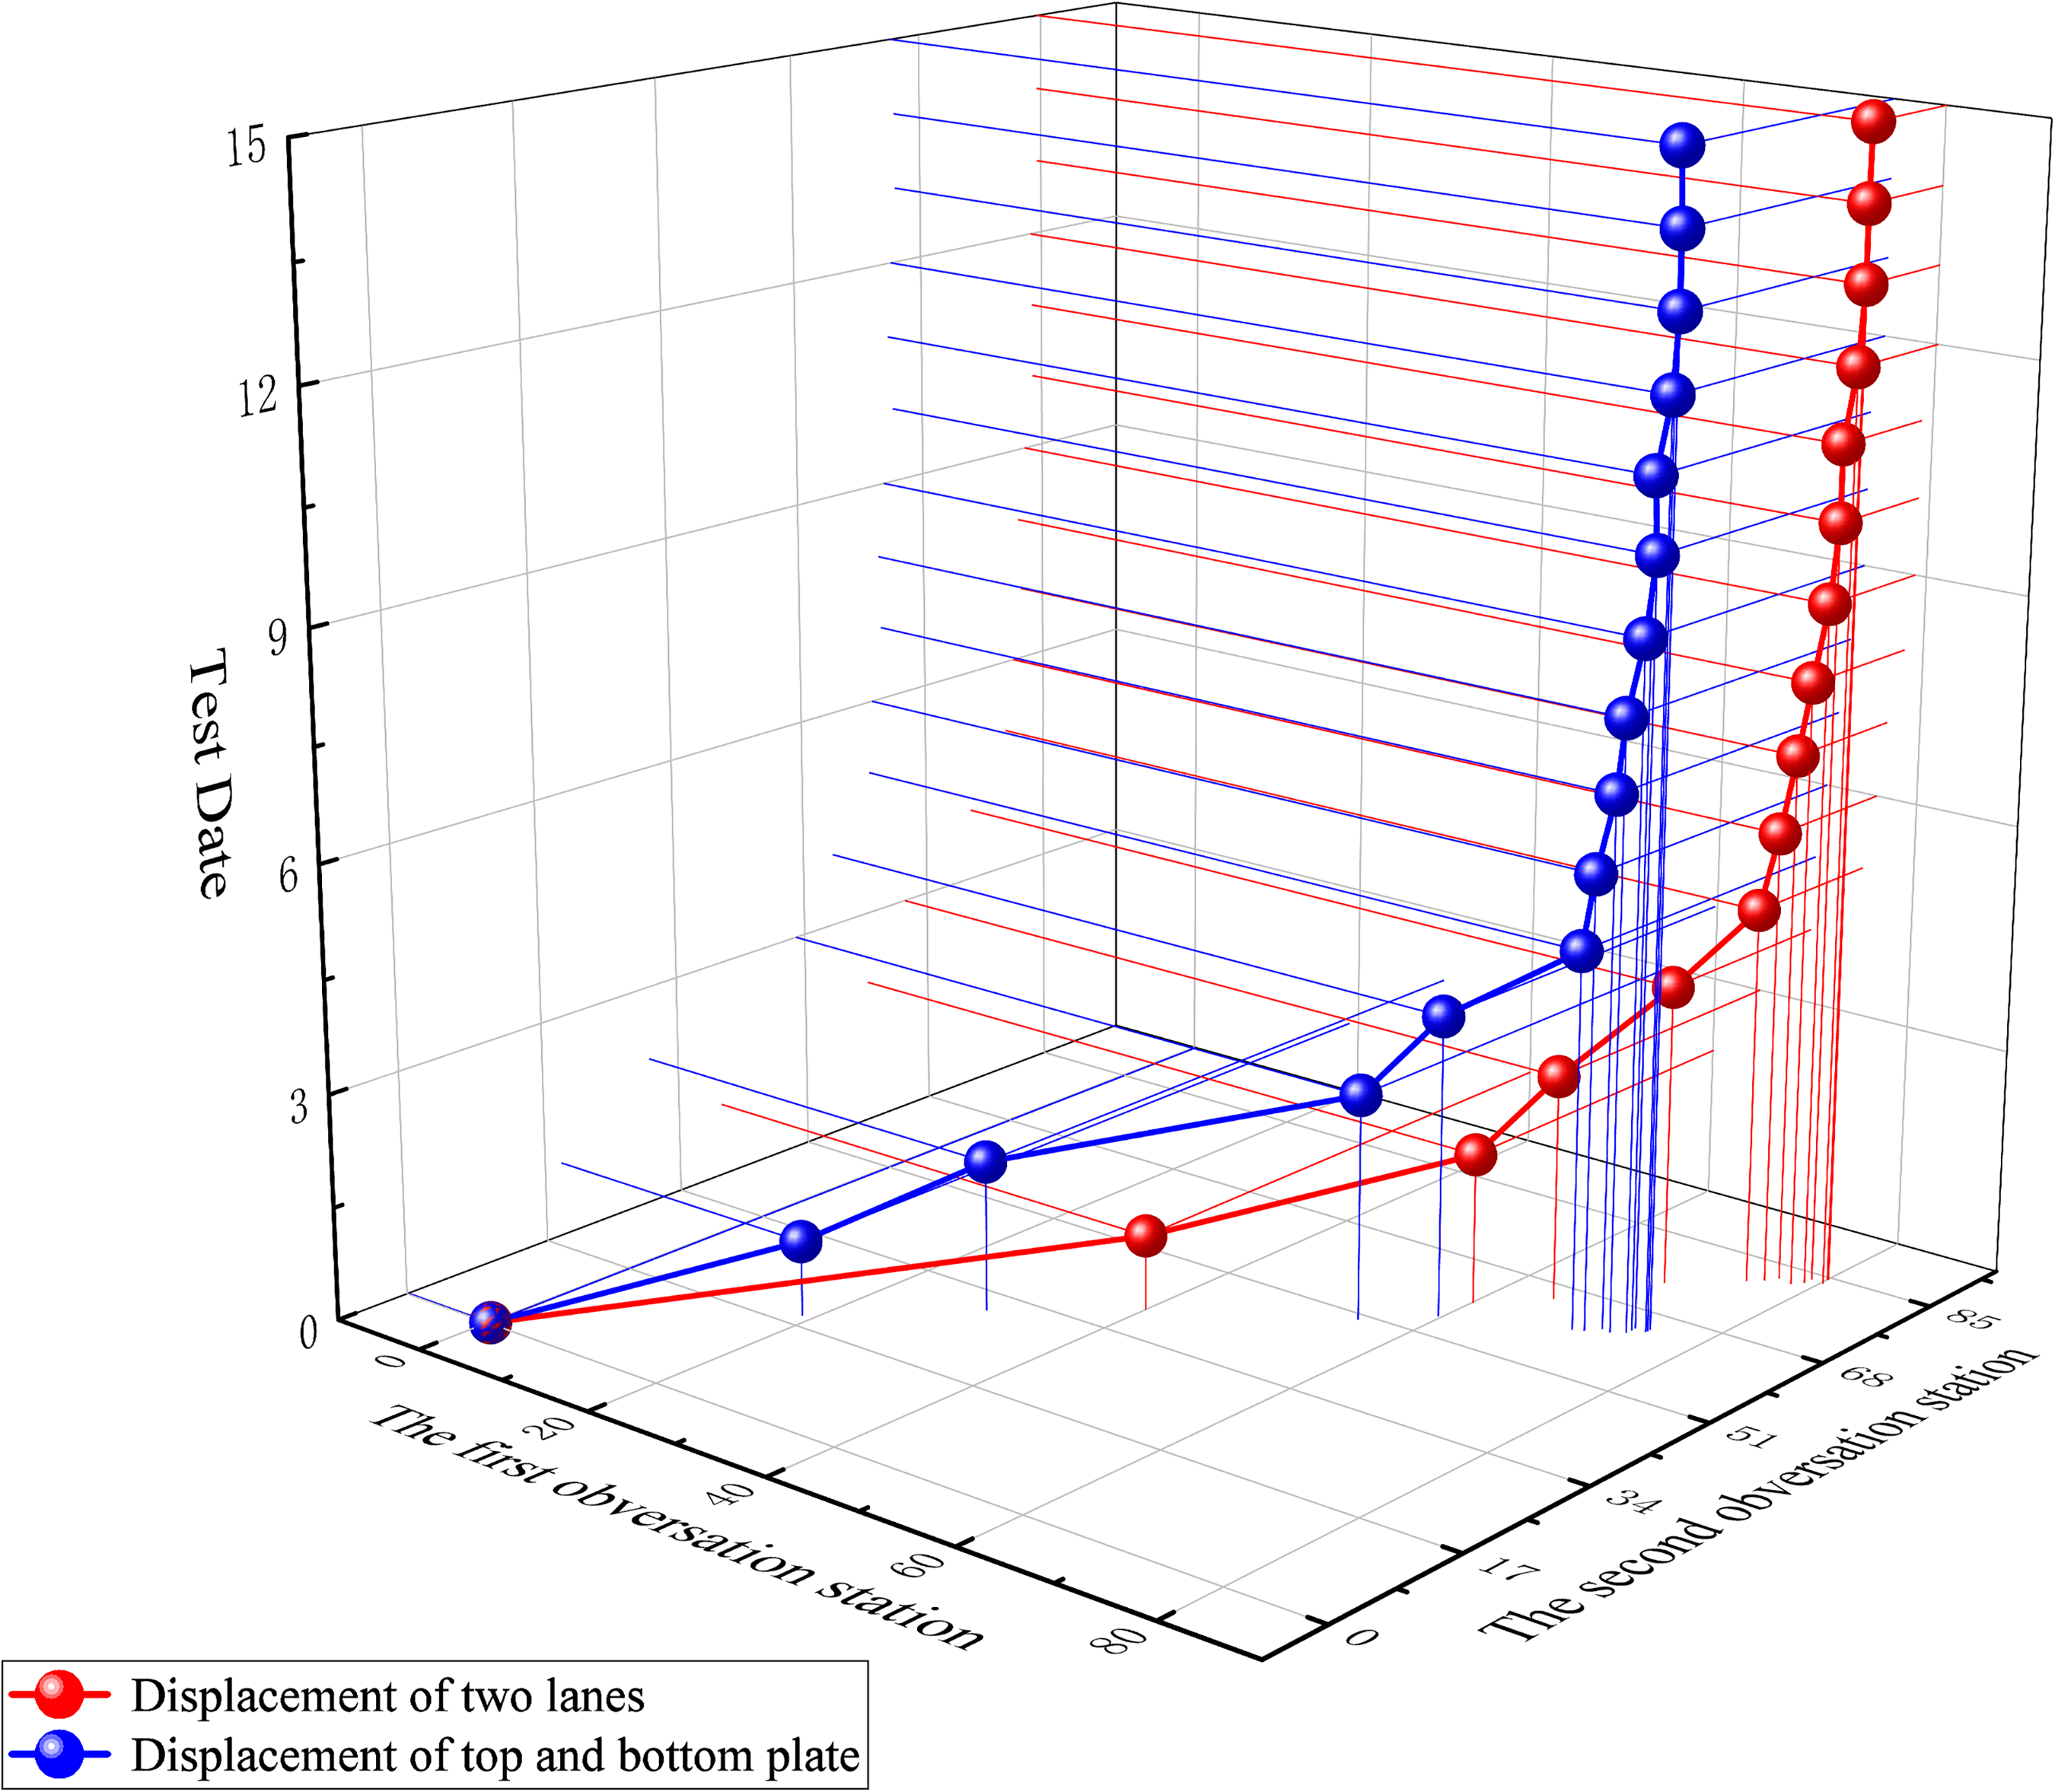
Cumulative change in displacement of measuring stations #1 and #2.
As shown in Figure 30, through observation, the roof deformation of support scheme 1 is about 100 mm and the side is about 80 mm in the similar simulation experiment, and the vertical stress of surrounding rock is well controlled. In the field, the observation results through drilling and monitoring of surrounding rock proximity show that the horizontal displacement of the roadway is less than or equal to 80 mm and the vertical displacement is 60 mm, which also proves the effect of support plan 1 on surrounding rock control, and guides the field construction to correspond with the actual deformation of the W3233 working face.
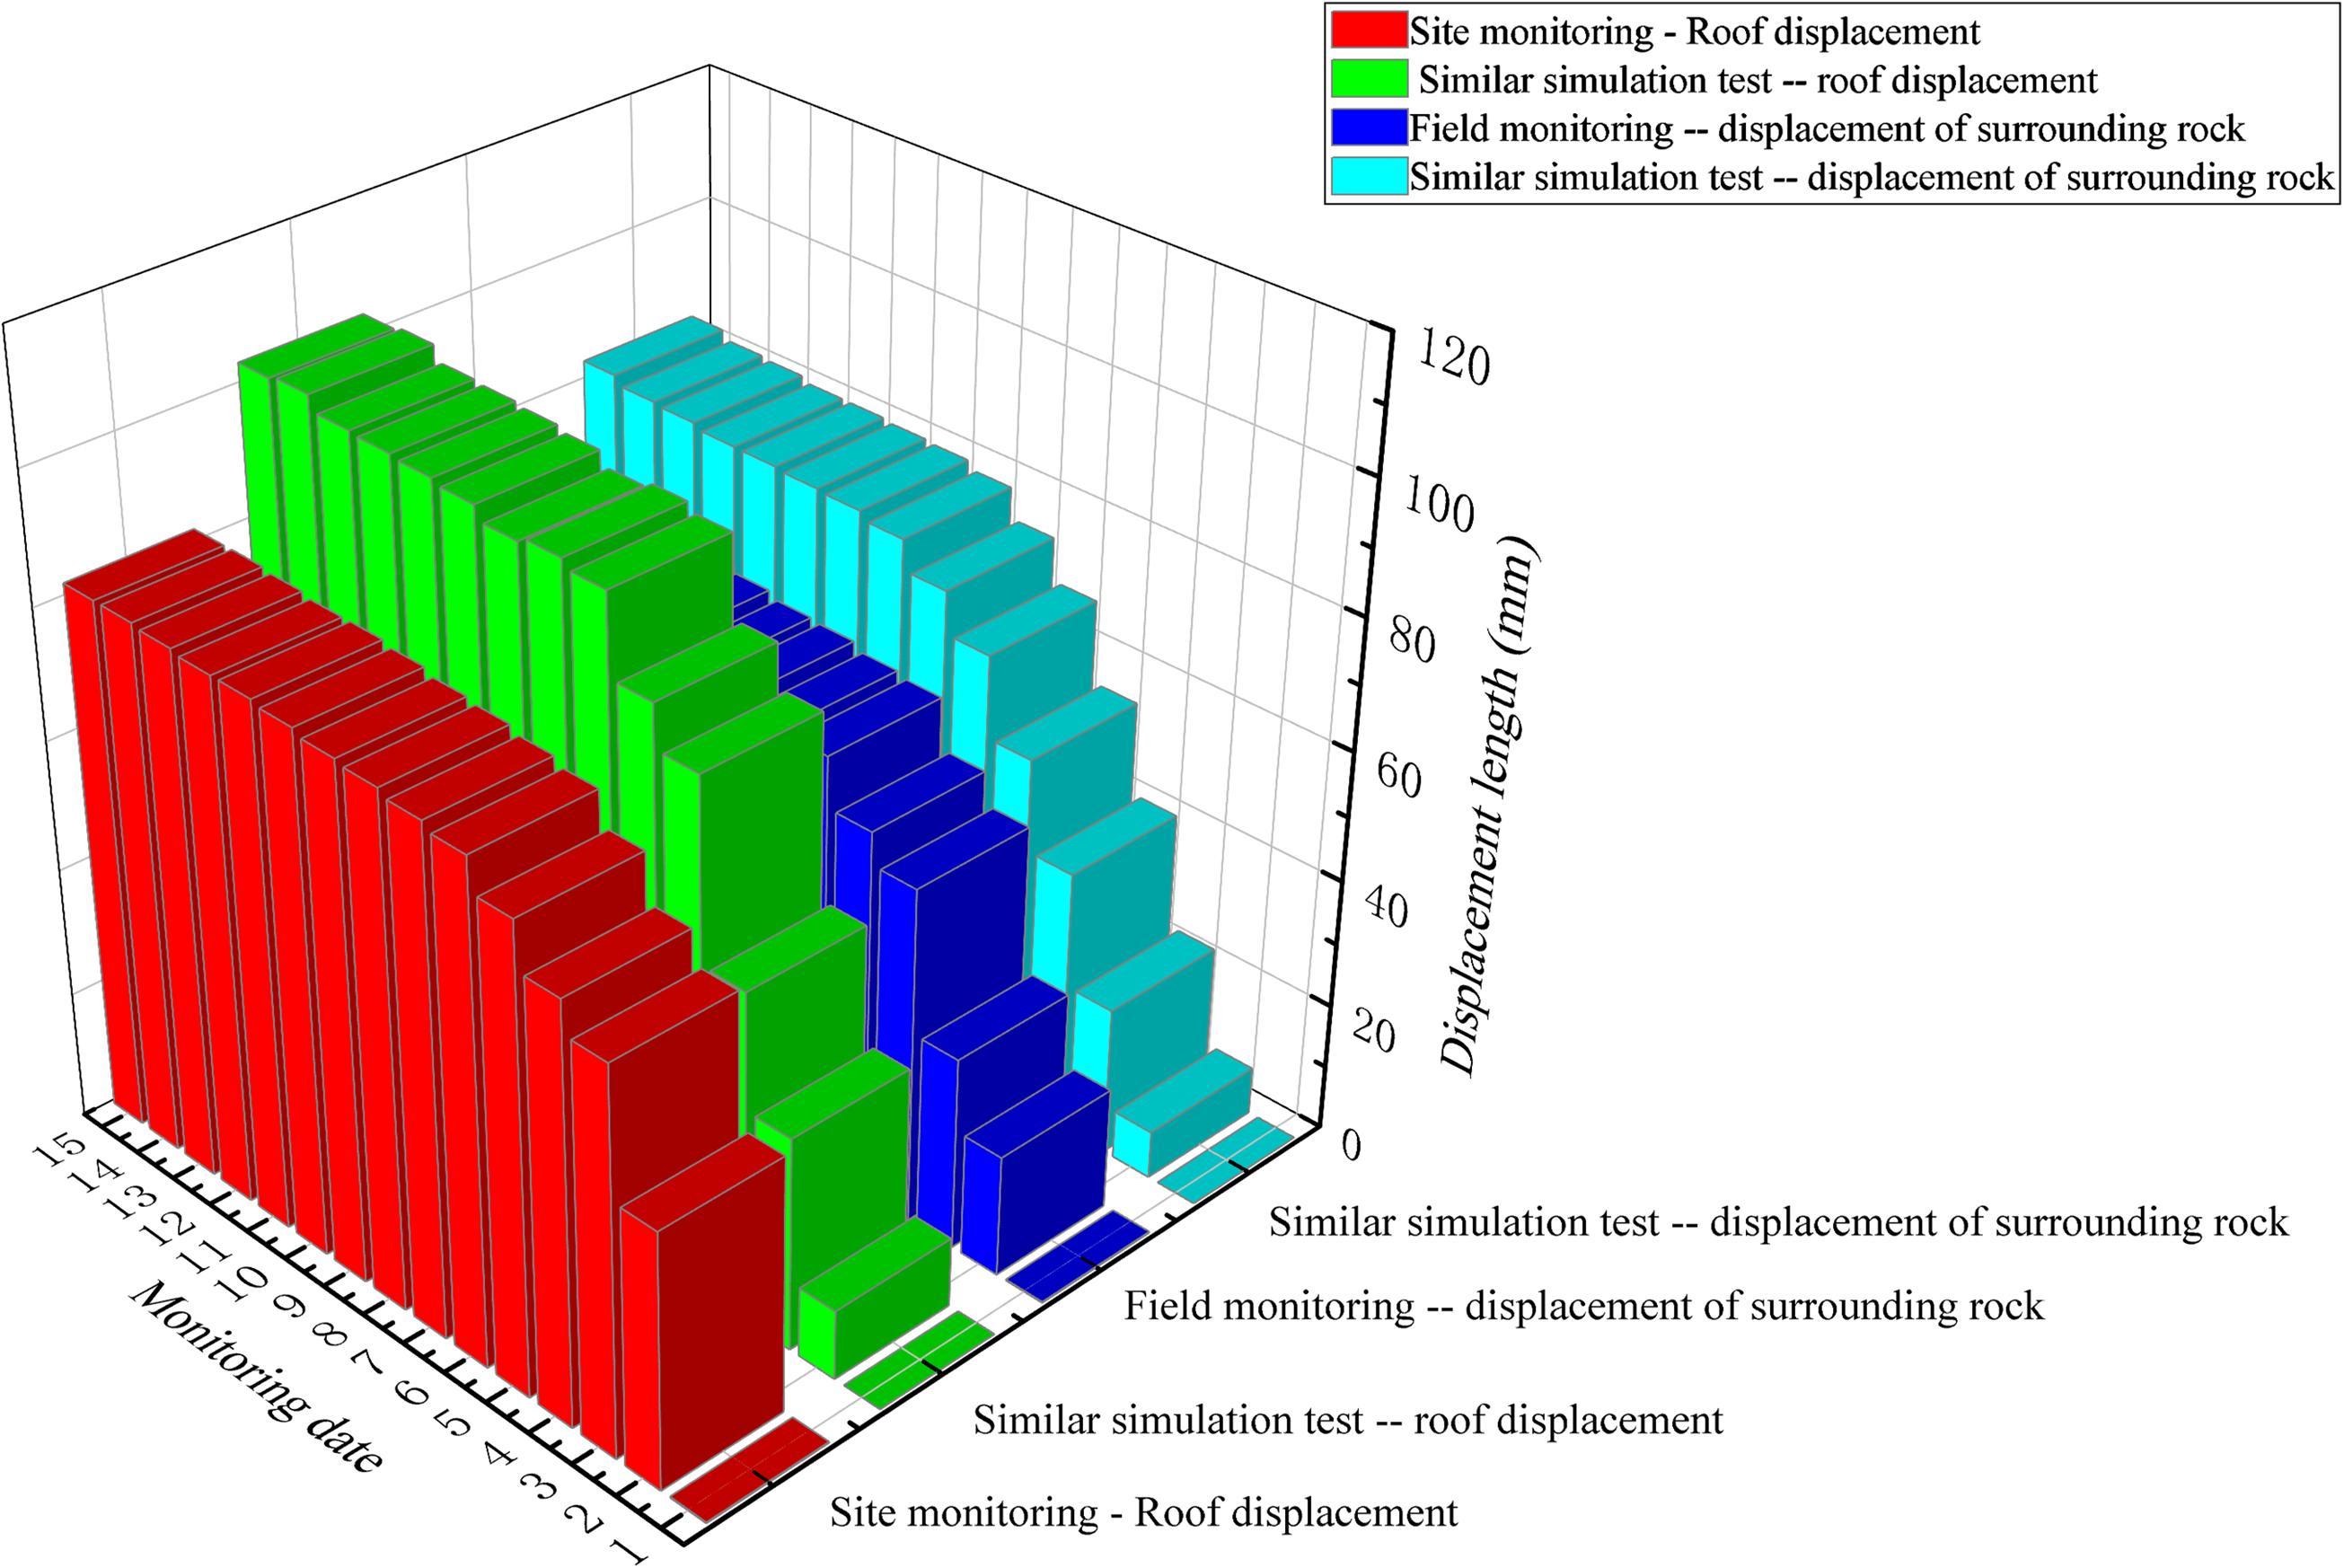
Similar simulated monitoring data were compared with field monitoring data.
Conclusions
This study obtained the maximum critical empty roof distance and range of optimal support parameters based on the geological data of the W3233 return airway using the bolt support theory, Mohr–Coulomb model, and a custom mechanics model. Accordingly, two optimization schemes for the roadway support parameters and two hysteresis optimization schemes for the hysteresis support process were proposed based on an optimal support scheme using numerical simulation. The validity of the support model was verified using self-made 3D simulation experiments. Stress changes were monitored to determine the law of stress changes in the surrounding rock. On-site industrial verification, comparison of the construction of the hysteresis support process, georadar, roof drilling, and roadway surface displacement monitoring proved the excellent effect of roadway support and surrounding rock control and the efficiency of the hysteresis support process.
The main conclusions are as follows:
Comparing the three support optimization schemes, optimal support scheme 1 with a gang deformation of approximately 90 mm, top plate displacement control of approximately 110 mm, and bottom plate displacement control of approximately 50 mm was obtained after a numerical simulation using FLAC3D. Subsequently, two bolt replacement schemes were proposed based on the optimal support parameters by applying the lagging bolt roping process, in which the gang displacement of the 20 m lagging support scheme was approximately 80 mm. The top and bottom plate displacements were approximately 120 and 60 mm, respectively. The convergence coefficient of the anchor displacement was less than that of the 30 m lagging solution. A 3D similar simulation experiment was performed to observe the effects of rock control and support under each support scheme. Support scheme 2 had the worst performance, with a 170 mm top plate displacement. By contrast, support scheme 1 and the original support scheme had a top plate deformation of approximately 100 mm. The gang deformation was approximately 80 mm. A comprehensive comparison of the support effect indicated that support scheme 1 was better than the original support scheme. On-site industrial construction uses 2 × 1 × 2 fewer anchor cables in one anchor cable roadway to follow-up the headway. The remaining four anchor cables were lagged to verify the efficiency of anchor lagging, saving approximately 1 h of operation time per lap of support, while ensuring stable control of the surrounding rock, and approximately 60 days of total working time until the completion of roadway excavation. The results demonstrated that the support parameters of support scheme 1 could ensure fast driving. Furthermore, the support effect was better than that of the original support scheme, and the surrounding rock control was stable.
Footnotes
Acknowledgments
Author contributions
Ziyi Yang: writing—original draft preparation, Zulin Wang: writing—review and editing, Zhigang Zhu: visualization, Guowei Wang: supervision, Peng Kong: project administration, Yinfu Li: funding acquisition. All authors contributed to the study's conception and design. All authors have read and agreed to the published version of the manuscript.
Data Availability Statement
The original contributions presented in the study are included in the article. Further inquiries may be directed to the corresponding author.
Declaration of conflicting interests
The author(s) declared no potential conflicts of interest with respect to the research, authorship, and/or publication of this article.
Funding
The author(s) disclosed receipt of the following financial support for the research, authorship, and/or publication of this article: This work was supported by the Natural Science Foundation of Anhui Province (grant number 2208085QE144).