
Abstract
The present-day in-situ stresses affect the drilling design, well pattern deployment, well completion modification, hydraulic fracturing and water injection of tight-oil sandstones. The measurement data of these stresses are commonly unavailable because of their high costs and limited core samples, therefore employing conventional logs for these stress determination is imperative for tight-oil sandstones. Firstly, the suitable calculation models for the present-day in-situ stress calculation by conventional logs were selected according to the geological characteristics of the sixth member of the Yanchang Formation (Chang 6) in Heshui area of the southern Ordos Basin, China. Then, the dynamic rock mechanical parameters were determined by conventional logs, and corrected by the static rock mechanical parameters obtained from the triaxial rock mechanical tests. Moreover, the pore fluid pressure was determined by the empirical formula method. Finally, the maximum and minimum horizontal compressive stresses (σH and σh), and the vertical stress (σv) of six wells were calculated according to the selected models of these stresses, respectively. The present-day in-situ stresses, determined by the proposed method in the paper, were verified by those obtained from acoustic emission tests and finite-element numerical simulations with the relative errors of less than 10%. The results show that the magnitudes of σH, σh and the horizontal differential stress (σH−h) in the study area mainly range from 32 to 43 MPa, 23 to 37 MPa and 5 to 8 MPa, respectively. The magnitude of the three-dimensional present-day in-situ stress increases with the increase of depth. The average gradients of σH, σv and σh are 0.018, 0.014 and 0.015 MPa/m, respectively, that is σH>σv>σh. In this stress state, the hydraulic fractures, with a trend of little expansion towards multiple directions, are commonly developed at a small angle intersecting with the direction of σH in the study area.
Keywords
Introduction
In recent years, tight oil and gas has become the focus and the hot spot of global unconventional oil and gas exploration (Aguilera, 2014; EIA, 2021; Ou et al., 2016; Zou et al., 2012). Because of its poor properties, low permeability, strong heterogeneity and poor percolation capacity, there is barely natural production from single wells in tight-oil sandstone reservoirs. Consequently, hydraulic fracturing is utilized to obtain industrial oil production in tight-oil development (Ganguli and Sen, 2020; Osiptsov, 2017; Zou et al., 2012). Not only hydraulic fracture propagation but also wellbore stability, well pattern deployment, well trajectory optimization, well completion reconstruction, are affected by the present-day in-situ stress in tight-oil sandstone reservoirs (Du et al., 2017; Ganguli and Sen, 2020; Ju et al., 2020a). Therefore, the present-day in-situ stress plays an important role in the efficient exploration and development of tight-oil sandstone reservoirs.
Many methods have been proposed to determine the present-day in-situ stress, such as measurement methods, methods based on well logs, numerical simulation methods and so on (Bernard and Stephansson, 1997; Du et al., 2017; Ju et al., 2020a; Paul and Chatterjee, 2011; Pestman et al., 2001; Zeng et al., 2015; Zoback and Haimson, 1983). The measurement methods, such as acoustic emission and differential strain analysis, are direct and relatively accurate means for the measurement of the present-day in-situ stresses. However, their cost is high. Meanwhile these measurement data are not available for most wells because of the limited core samples, thus being unable to meet the requirements of tight-oil exploration and development (Yin et al., 2018), whereas, conventional logs are cheap and generally available. In addition, conventional logs provide a means for obtaining longitudinal continuous profile of the present-day in-situ stress. Therefore, knowing how to use conventional logs for the determination of the continuous present-day in-situ stresses is of great significance to the efficient exploration and development of tight-oil sandstone reservoirs.
Many scholars have studied the approaches of using conventional logs to determine the present-day in-situ stresses, and they have concluded a variety of different calculation models with different practicability (Anderson et al., 1973; Cheng et al., 2014; Ju et al., 2020b; Katahara et al., 1996; Mohaghegh et al., 2004; Pal et al., 2015; Yin et al., 2017; Zhang et al., 2019). However, most calculation models are proposed for the present-day in-situ stress calculation of shales, which have limitations for tight-oil sandstones. In addition, rock elastic parameters and intermediate parameters, such as tectonic stress coefficient and effective stress coefficient, are related to tectonic movement and lithology of specific areas, and thus obtaining these parameters accurately is critical to calculate the present-day in-situ stress (Cheng et al., 2014; Ju et al., 2020b). Therefore, it is crucial to create a more applicable approach for the present-day in-situ stress calculation in tight-oil sandstones.
Some scholars have studied the present-day in-situ stress distribution of the seventh member and the eighth member of the Yanchang Formation (Chang 7 & Chang 8) in Heshui area of the Ordos Basin through measurement methods and numerical simulation methods (Ju et al., 2018, 2020b; Liu et al., 2021). However, little research has been done on the stress calculation by well logs of the tight-oil sandstones of Chang 6 in Heshui area, thus lacking the systematic calculation method of the stress by conventional logs.
With a case study of the tight-oil sandstones of Chang 6 in Heshui area, southern Ordos Basin, China, this study discusses the calculation of the present-day in-situ stress by conventional logs in tight-oil sandstones (Figure 1). Firstly, based on the relatively undeformed characteristics and developed natural fractures in the tight-oil sandstones in Heshui area, the suitable Newberry model is chosen to determine the present-day in-situ stress. Secondly, the empirical formula method is utilized to predict the pore fluid pressure, since the prediction methods of pore fluid pressure are applied in shales, but not suitable for tight-oil sandstones. Because shear-wave (S-wave) slowness, which is a key parameter for the present-day in-situ stress calculation, are unavailable in most wells, the dipole acoustic logs of a key well are used to draw the relationship between compressional wave (P-wave) slowness and S-wave slowness to predict S-wave slowness of other wells. Then, the intermediate parameters for the stress calculation are obtained by combining with dual caliper logs and density logs. The present-day in-situ stress calculated by the proposed approach using conventional logs are verified by those obtained from acoustic emission tests and numerical simulations. The continuous profiles of the present-day in-situ stress are established based on the proposed approach. Finally, the distribution of present-day in-situ stress and its influence on hydraulic fracturing are discussed.
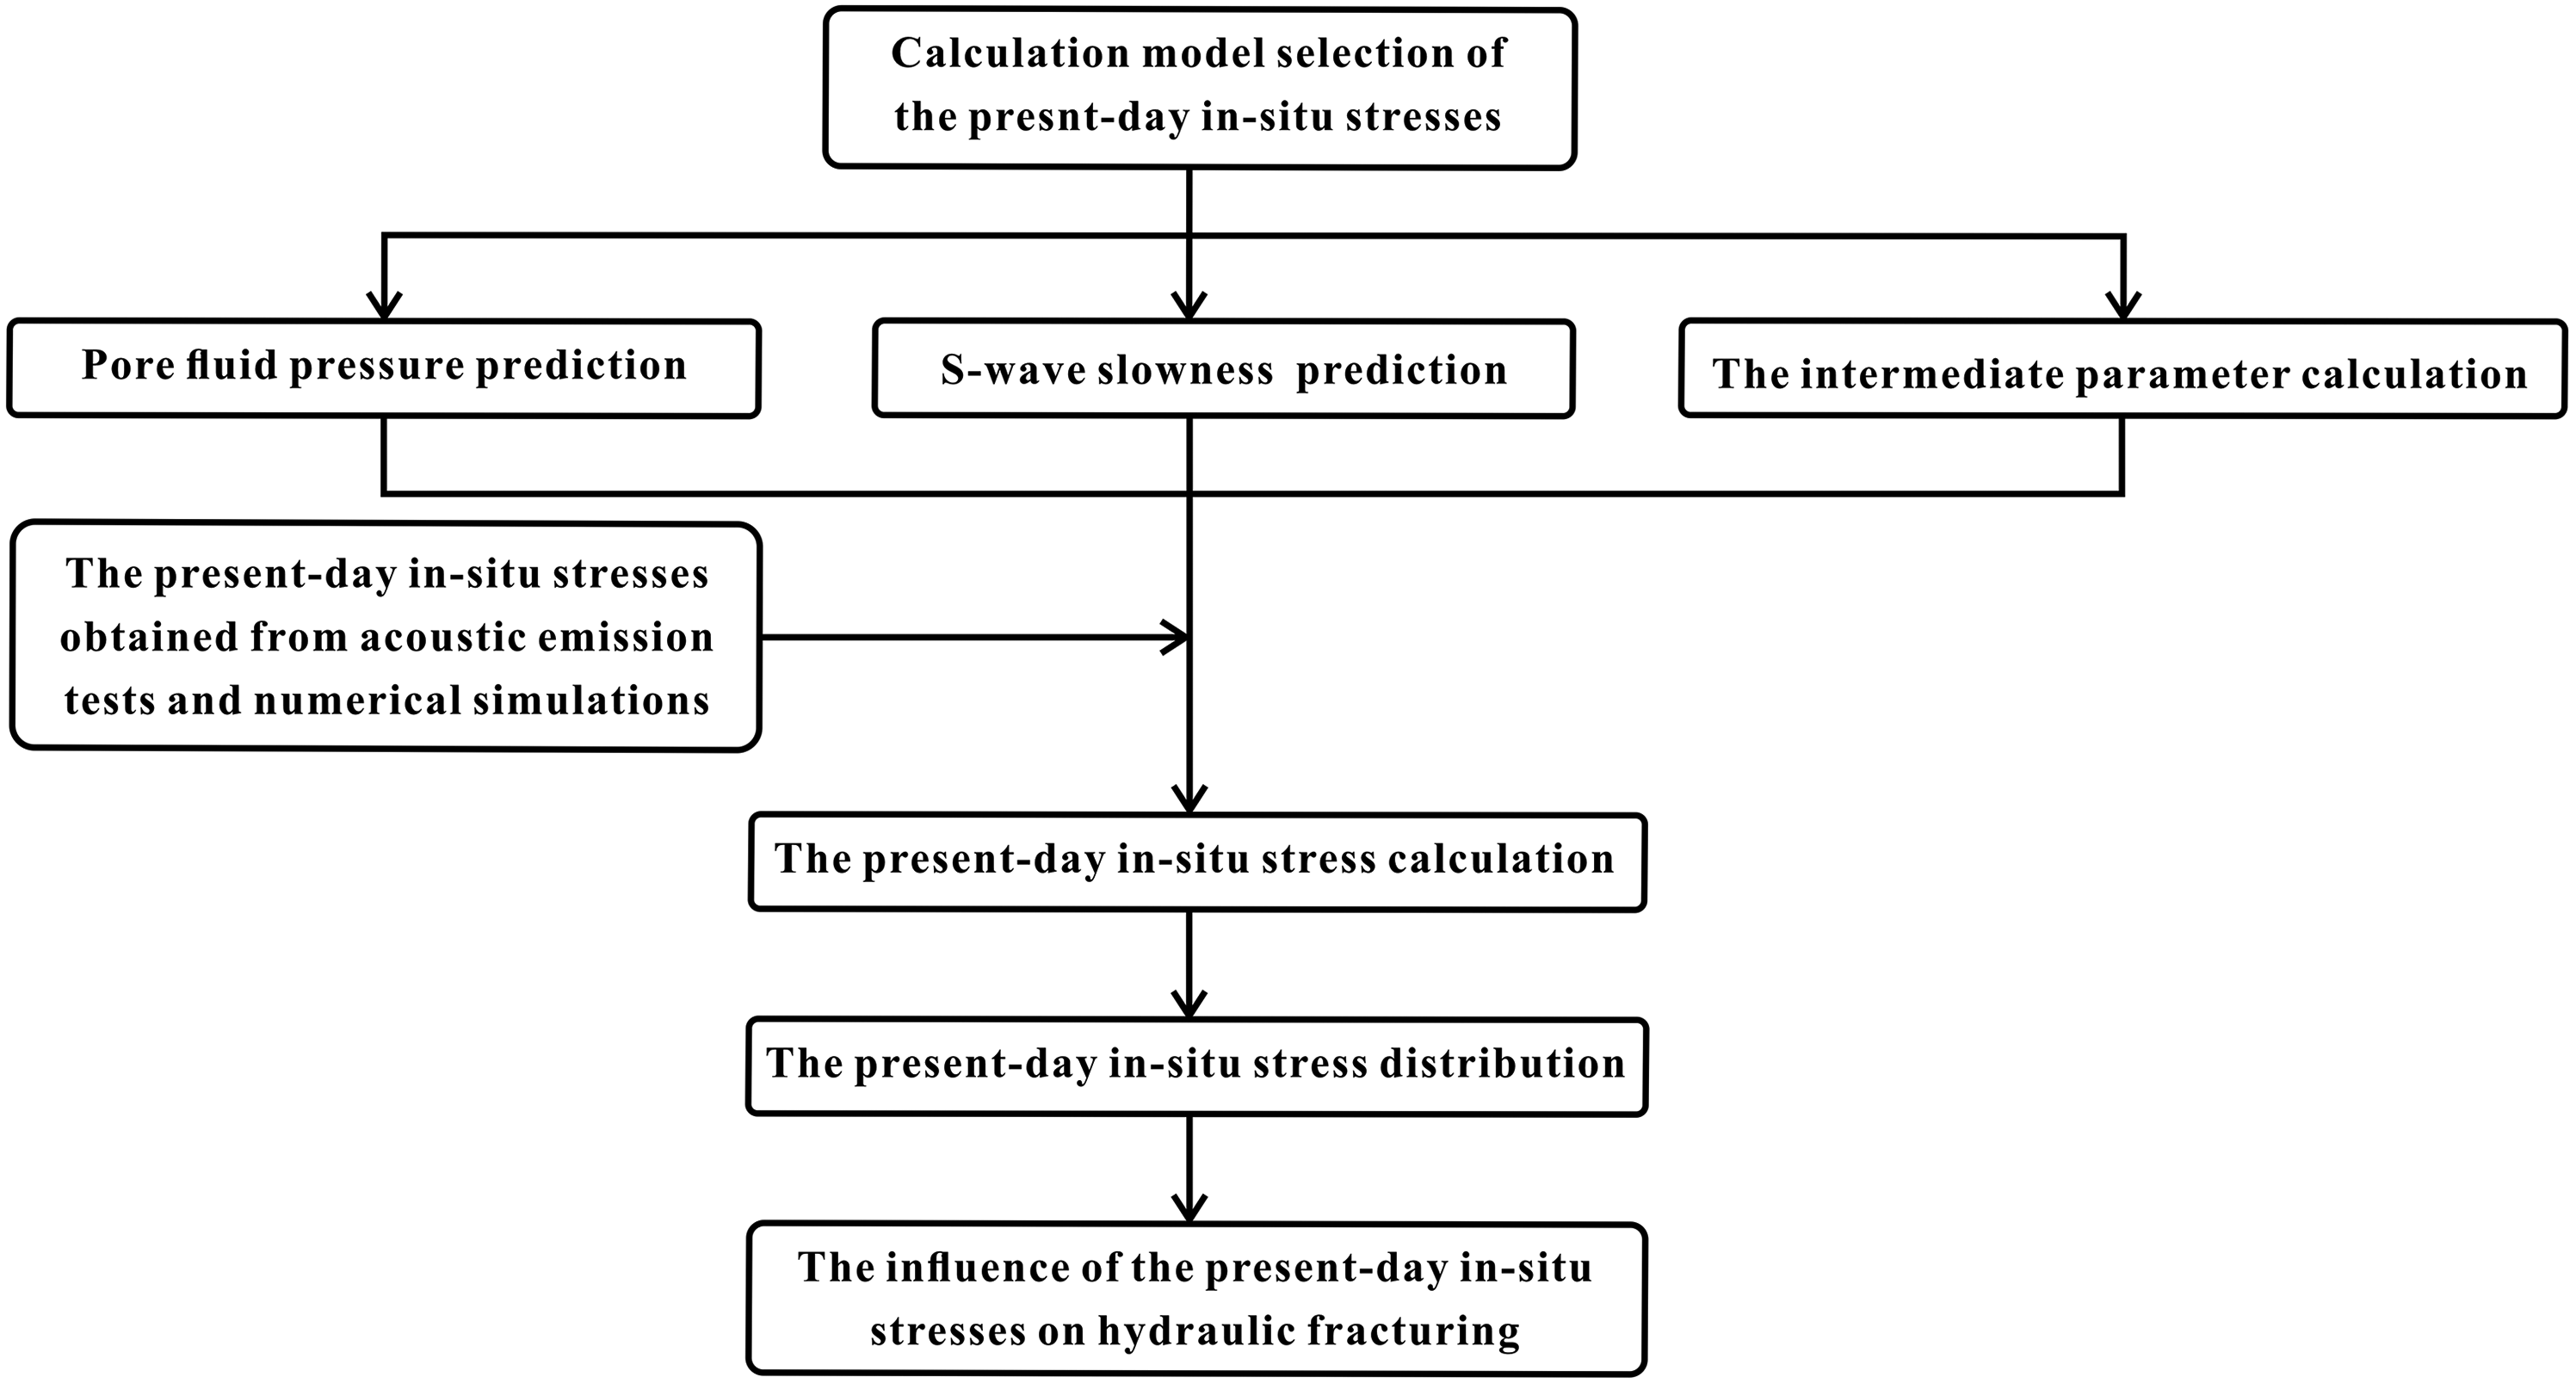
The workflow of the research steps.
Geological setting
Heshui area is located in the southern Ordos Basin, China, and is tectonically located in the southwest of Yishan slope (Figure 2). The study area is a smooth monocline with an east-to-west dip of less than 1° (Gao and Wen, 2016). According to lithological, electrical and oil-bearing characteristics, the Triassic Yanchang Formation in Ordos Basin can be divided into 10 oil-bearing members (Figure 3), ranging from the first member to the tenth member (Chang 1 to Chang 10) respectively from bottom to top (Yan et al., 2020; Zhou et al., 2016). Braided river delta front subfacies are primarily developed including underwater distributary channel, estuary bar, distributary bay and sheet sand microfacies. Its lithology is mainly fine sandstone and siltstone (Liu et al., 2009). According to petrophysical parameter analysis, the average porosity and air permeability of Chang 6 in the study area are 8.47% and 0.11 mD (0.11 × 10⁻³ μm2) respectively (Ju et al., 2014), which is a typical tight sandstone reservoir. According to core observation and image logs, natural fractures are developed in Chang 6, and most of them are trending east-northeast to west-southwest (E-NE to W-SW). The existence of natural fractures improves the porosity and permeability of reservoirs to a certain extent (Lyu et al., 2019; Qu et al., 2020). Meanwhile, the genetic type of the pore fluid pressure of Chang 6 in Heshui area belongs to a unloading type, which indicates it is a typical low-pressure reservoir with a pressure coefficient of about 0.8 (Zhao et al., 2015). According to hydraulic fracturing, borehole breakouts and induced fractures during drilling, the dominant direction of σH is about NE70°–80° (Figure 4). With the increase of depth, σH and σh increase linearly (Lyu e t al., 2019; Zeng, 2008; Zeng and Li, 2009).
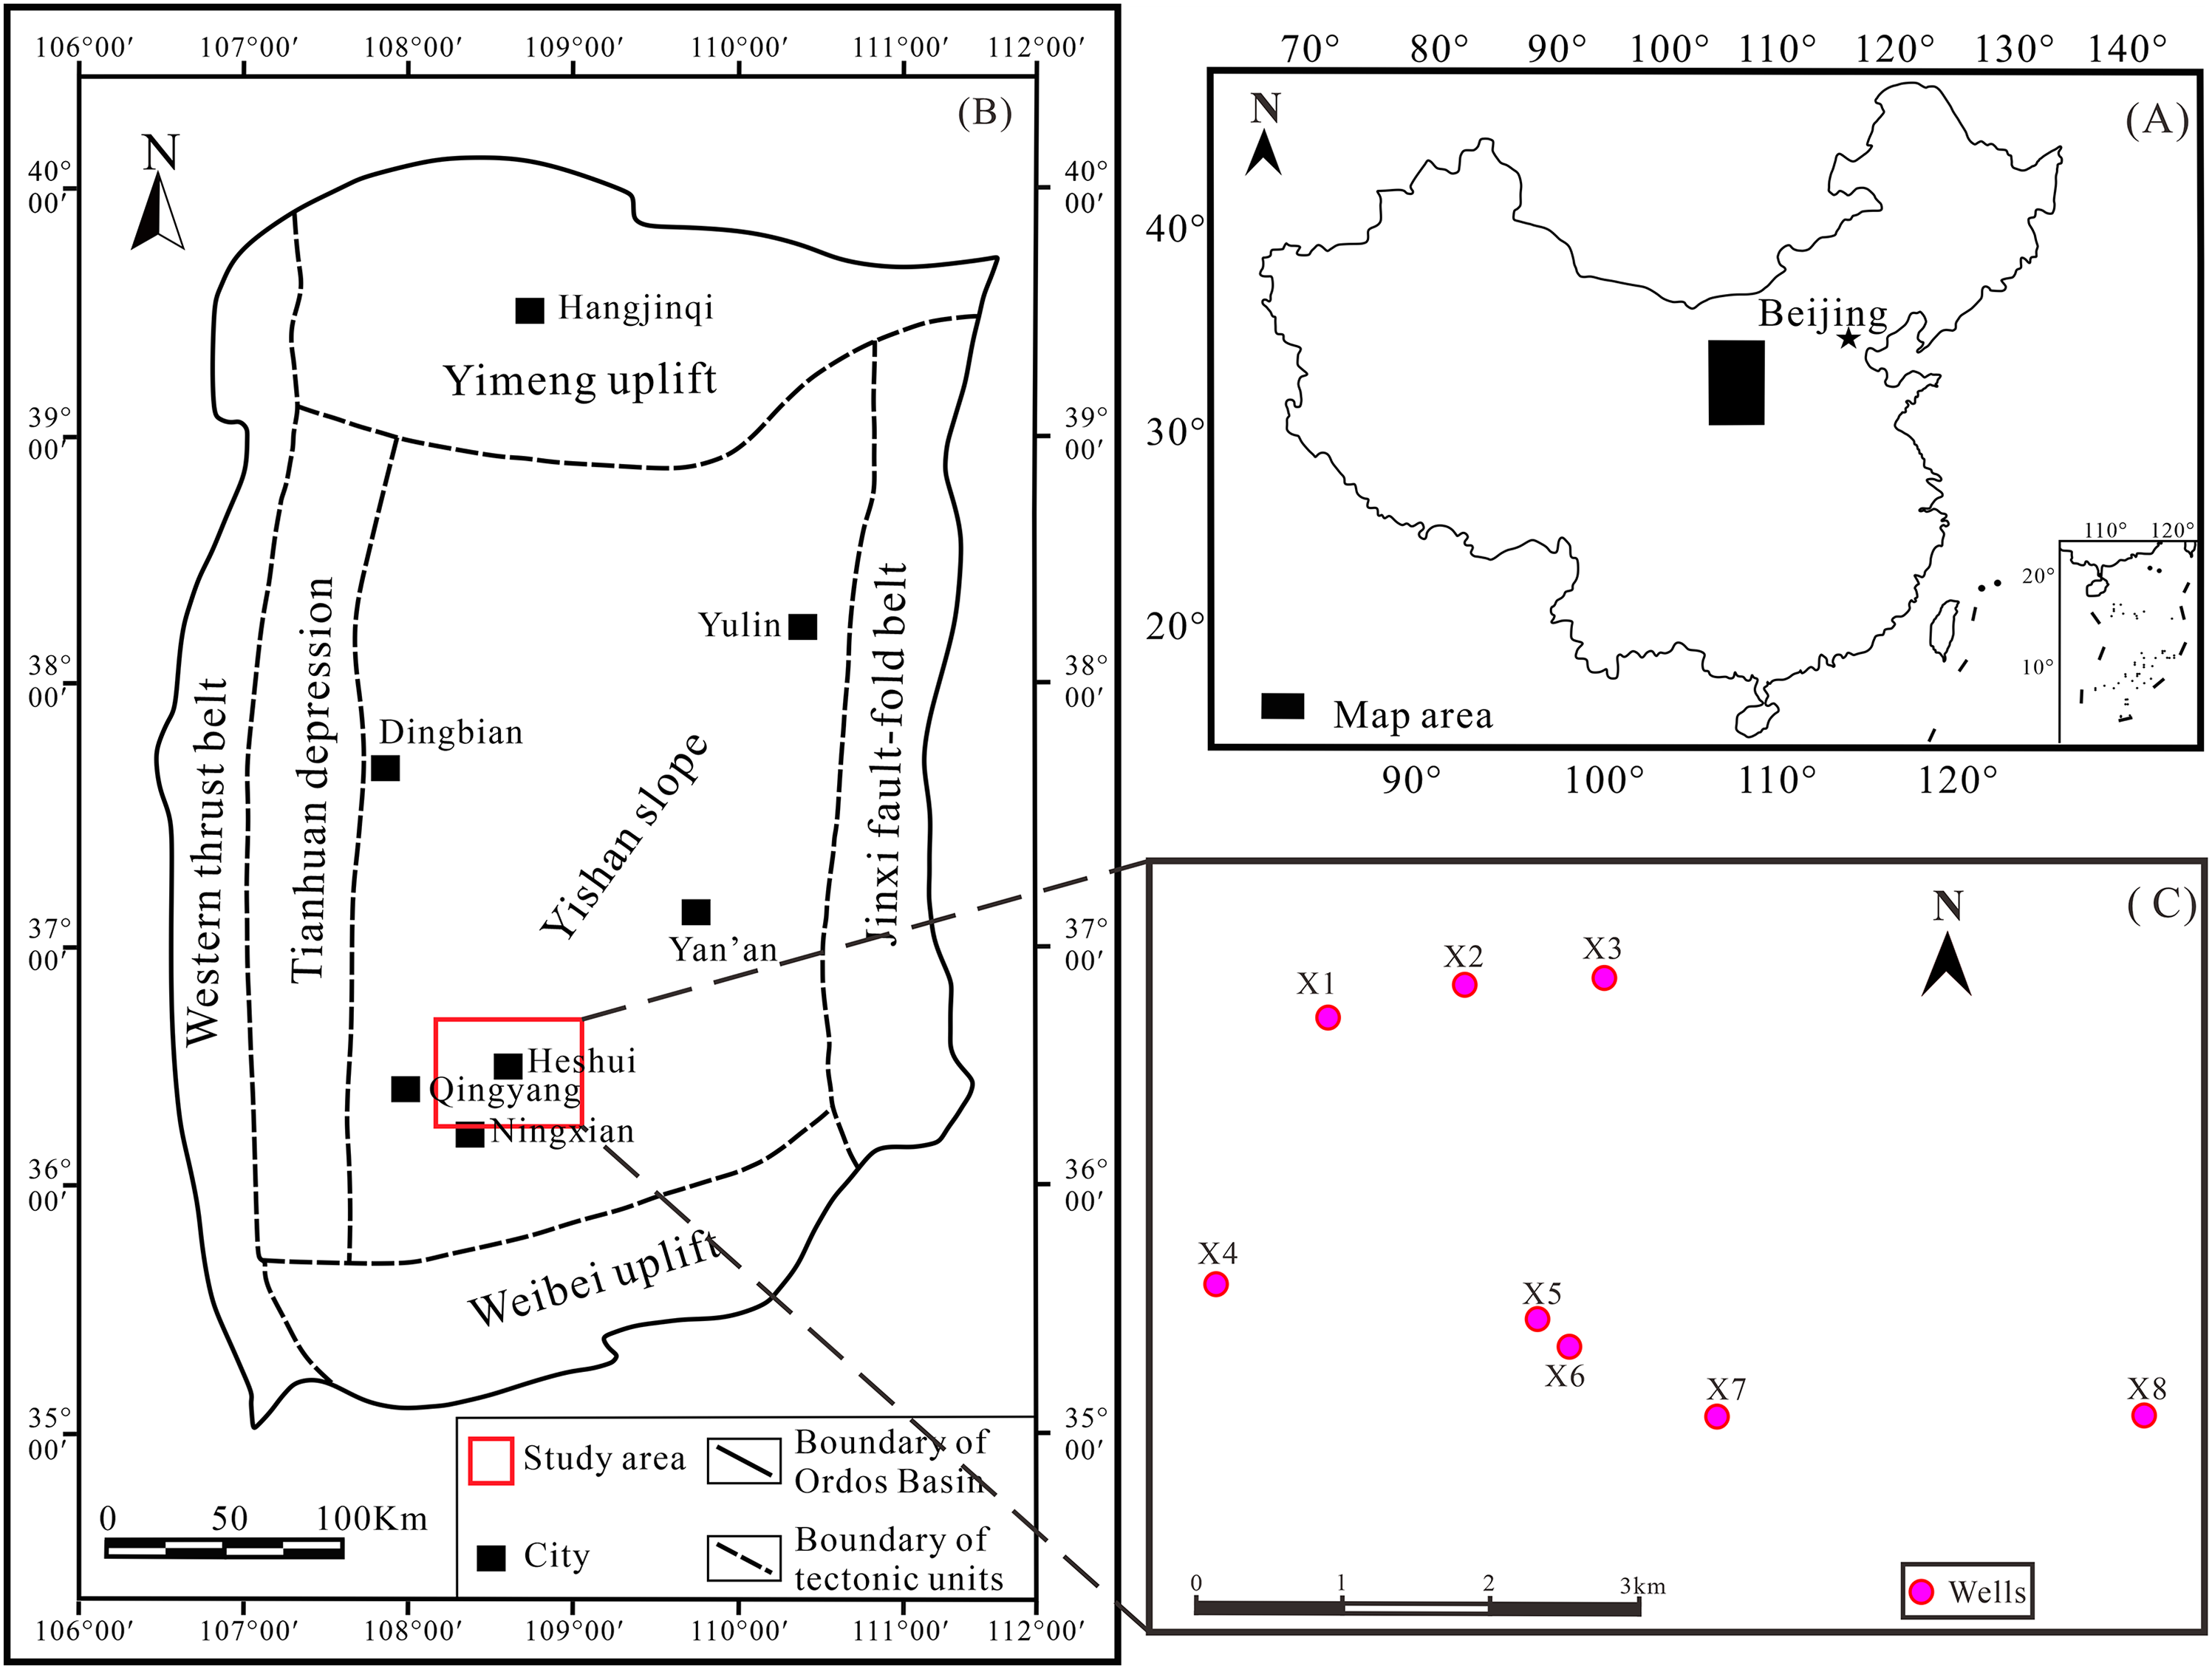
Location map of the Ordos Basin, study area, and wells (Figure 2(a) and (b) are modified from Lyu et al., 2016, 2019; Zeng and Li, 2009).
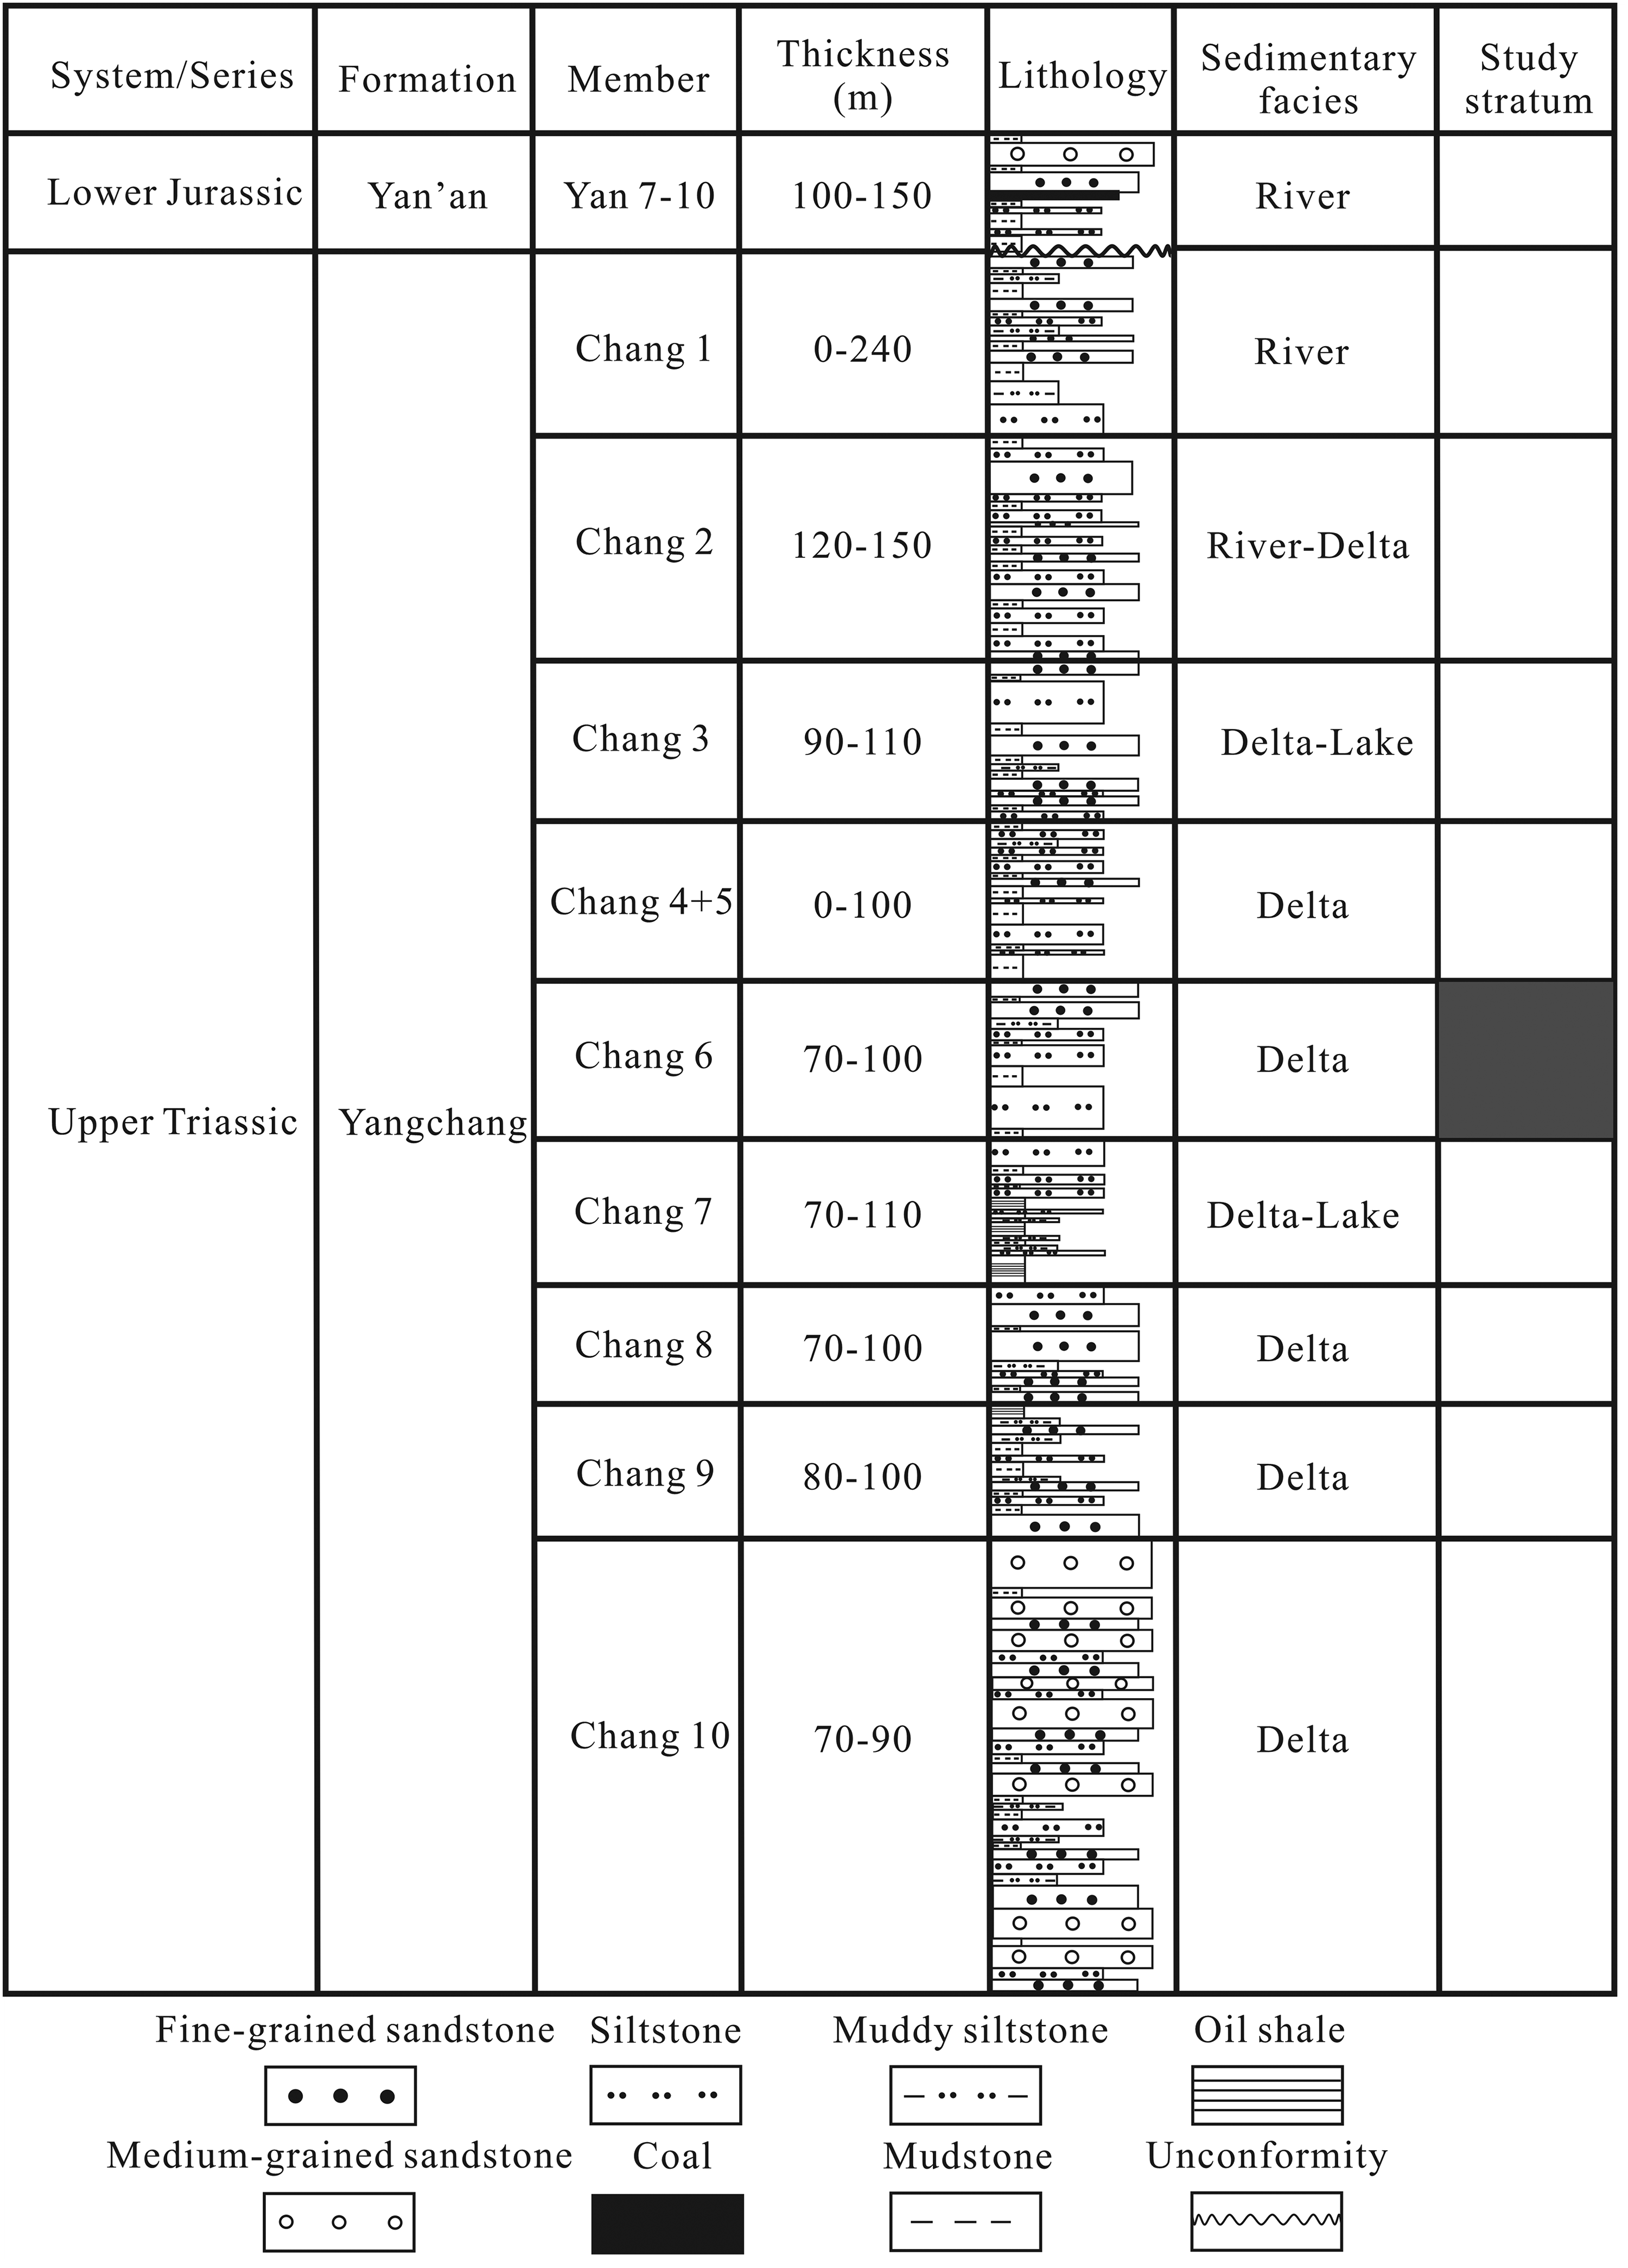
Schematic stratigraphy of the Yanchang Formation of Heshui area in the southern Ordos Basin.
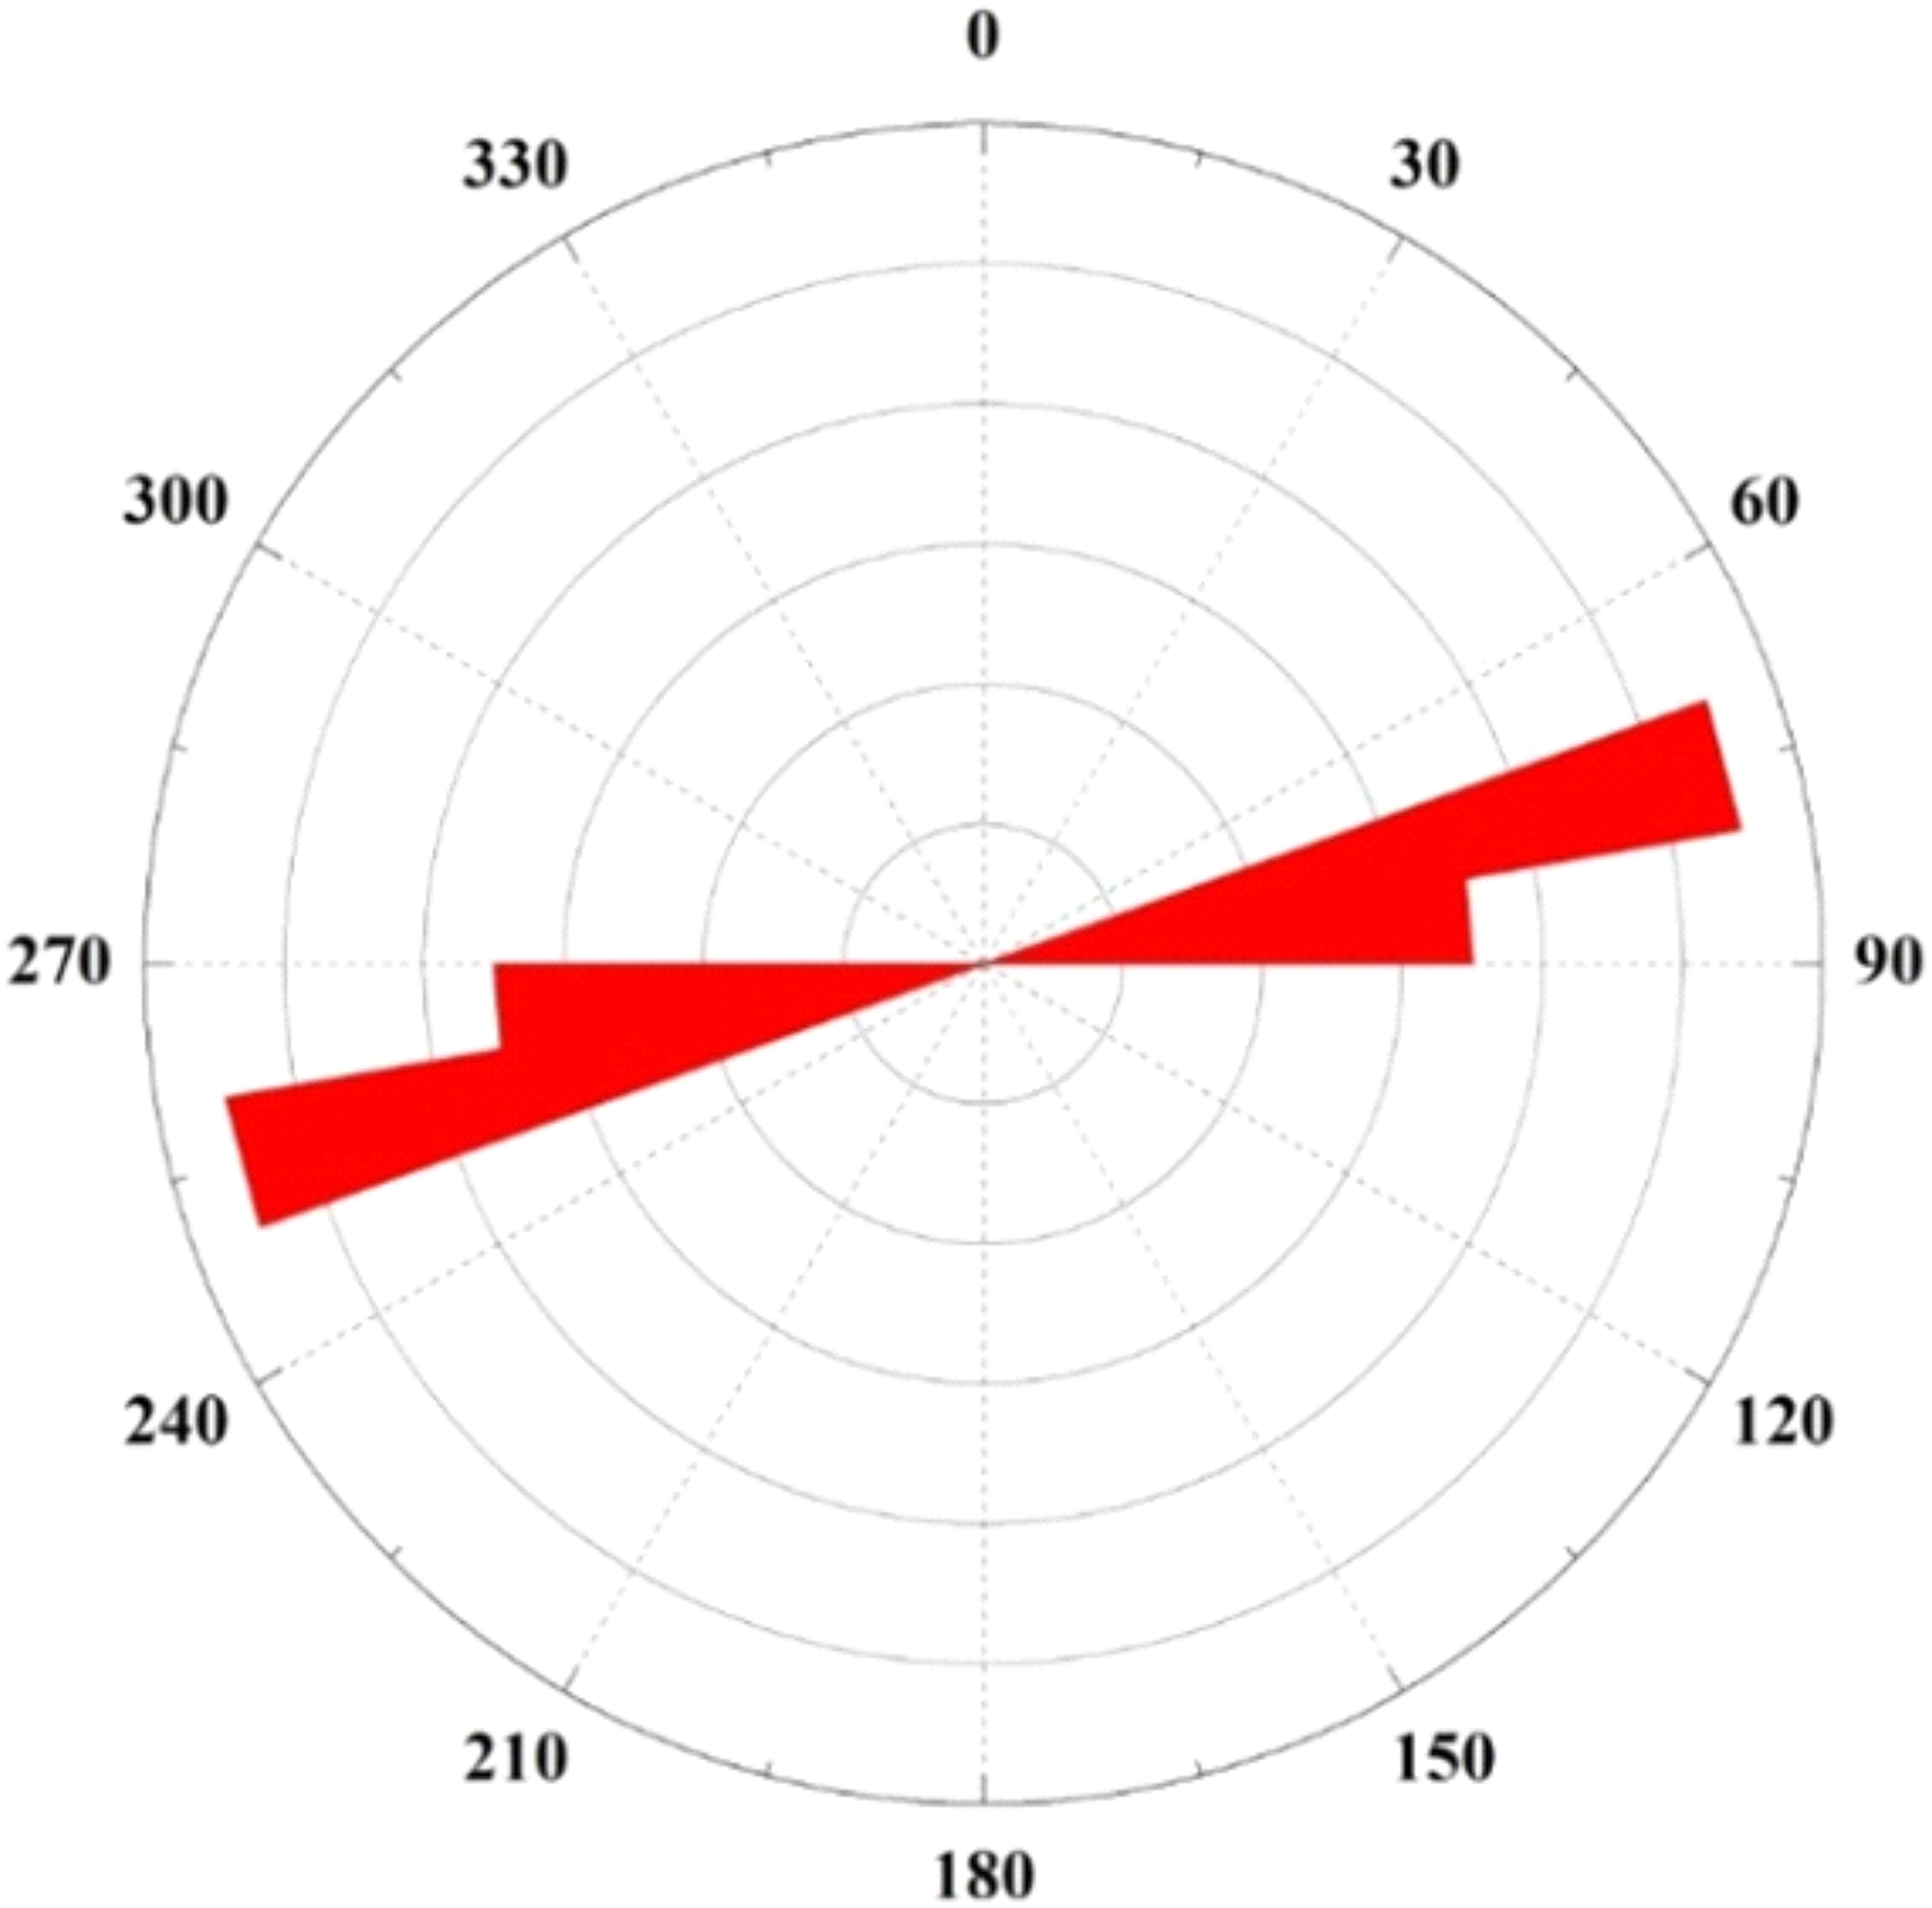
Rose diagram of the present-day maximum horizontal principal compressive stress (σH) for hydraulic fractures, borehole breakouts and induced fractures during drilling in the tight-oil sandstones of Chang 6 in Heshui area, Ordos Basin, China (n = 80).
Material and methods
Conventional logs from six wells, the dipole acoustic logs from one well and the rock mechanics parameters measured by triaxial rock mechanics test of 14 core column samples were used to determine the present-day in-situ stress profile. The processes of the present-day in-situ stress determination in this study mainly include calculation model selection, S-wave slowness prediction, mechanical parameters determination and pore fluid pressure prediction.
Acoustic emission tests were conducted out to measure the present-day in-situ stresses of Chang 6 in well X4. The finite-element numerical simulation was used to predict the present-day in-situ stresses of Chang 6 in the study area (Liu et al., 2021).
Calculation model selection
Vertical stress calculation model
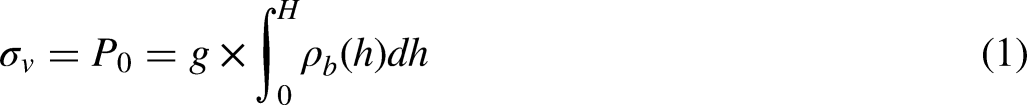
In non-compressional basins, it is generally believed that vertical stress is basically equal to the gravity of overlying strata:
Calculation model of the horizontal principal stress
Many models, including uniaxial strain model, Mohr-Coulomb model, anisotropic model, Eaton model, Anderson model, Newberry model, Schlumberger model, and so on, are utilized to calculate the horizontal principal stress, however different models are separately applicable for different areas with different geological settings (Anderson et al., 1973; Cheng et al., 2014; Eaton, 1976; Huang and Zhuang, 1986; Ju et al., 2020b; Newberry et al., 1985; Yin et al., 2017; Zhang et al., 2019). As for uniaxial strain models, Anderson and Newberry models are the most commonly used. And these models assume that the horizontal deformation of strata is limited during deposition, that is, the horizontal principal stress is caused by the gravity of overlying strata (Ma and Sun, 2002). Therefore, uniaxial strain models are suitable for areas with slight tectonic deformation. In addition, Newberry model is suitable for areas with low permeability and natural fracture developed. Mohr-Coulomb model, which is suitable for both extensional and compressional basins, is more applicable for unconsolidated sandstone reservoirs (Tian, 2015). Anisotropic models, including Huang's model, Ge's model and triaxial strain model, are suitable for areas with strong tectonic deformation (Ge et al., 1998; Huang and Zhuang, 1986; Xu et al., 2012; Zhang, 1997).
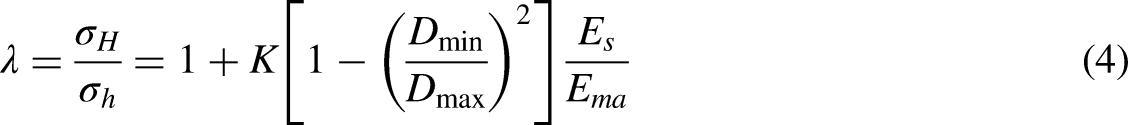
As mentioned above, the study area presents slightly tectonic deformation, low porosity, low permeability and developed natural fractures; thus, Newberry model is chosen to calculate the present-day in-situ stress in the study area. The calculation formulas of the Newberry model are as follows:


S-wave slowness prediction method
S-wave slowness is a crucial parameter for the present-day in-situ stress calculation by conventional logs, because mechanical parameters such as Young's modulus and Poisson's ratio are obtained based on S-wave slowness. In general, dipole acoustic logs and wave velocity tests are the main ways to obtain S-wave slowness (Sun and Zheng, 2009; Zhang et al., 2012). However, most wells lack S-wave slowness data due to unavailable dipole acoustic logs, and the high cost and time-consuming test. So, it is necessary to predict S-wave slowness through other well logs, such as conventional logs (Ni et al., 2017; Wang, 2017; Yang et al., 2015). At present, various methods, such as empirical correlations, artificial intelligent methods based on well logs, and so on, have been proposed to predict S-wave slowness in different areas (Anemangely et al., 2017; Eberhart-Phillips et al., 1989; Nourafkan and Kadkhodaie-Ilkhchi, 2015; Oloruntobi et al., 2019; Russell et al., 2004). However, shear-wave velocity predictions from compressional-wave velocity data are relatively reliable, since they are affected by a lot of the same factors (Xu and White, 1995).
The tectonic movement of the study area is relatively weak, and faults and folds are not developed. Thus, S-wave and P-wave slownesses are less affected by local structures in different parts of the study area. In addition, P-wave slowness is available in most wells in the study area. However, only one well has the dipole acoustic logs, which indicates that the number of sample labels is not enough for artificial intelligent methods to well predict S-wave slowness. The empirical method is used to establish the suitable S-wave slowness prediction formula. The correlation between P-wave slowness and S-wave slowness is created based on the dipole acoustic logs of well X2. Then, other wells’ S-wave slowness can be predicted by P-wave slowness based on the S-wave slowness prediction formula.
Rock mechanical parameter determination
Rock mechanical parameters (such as Young's modulus, Poisson's ratio, shear modulus, volume compression coefficient, rock skeleton compression coefficient, and effective stress coefficient) are indispensable for determining the present-day in-situ stress. However, only Young's modulus and Poisson's ratio are independent, the rest of rock mechanical parameters are derived from these two parameters (Hong, 2008). The rock mechanical parameters obtained from well logs are dynamic rock mechanical parameters, whereas the static rock mechanical parameters are commonly obtained from triaxial rock mechanics test.
Dynamic rock mechanical parameter calculation
On the basis of S-wave slowness prediction, combining with density logs and acoustic logs, the dynamic Young's modulus
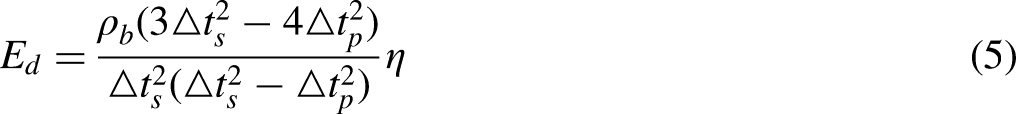
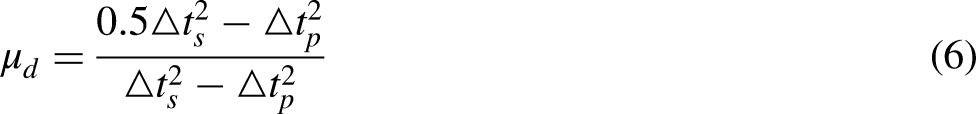
Furthermore, based on the dynamic Young's modulus


Static rock mechanical parameter determination
Triaxial rock mechanics tests were conducted on 14 core column samples with the size of 25 mm × 50 mm in the state of natural dryness to obtain the static rock mechanical parameters (Figure 5). The triaxial rock mechanics tests were carried out by the TAW-2000 triaxial rock test instrument of University of Science and Technology, Beijing. Axial pressure was applied vertically whereas confining pressure was applied radially, and the maximum magnitude of confining pressure is determined as 25 MPa due to the depth of Chang 6 range from 1200 m (3937.0 ft) to1700 m (5577.4 ft). The confining pressures are 0, 5, 10, 15, 20 and 25 MPa to draw the stress–strain curves. According to the stress–strain curves, static rock mechanical parameters such as Young’s modulus, Poisson’s ratio, compressive strength, and so on can be calculated.
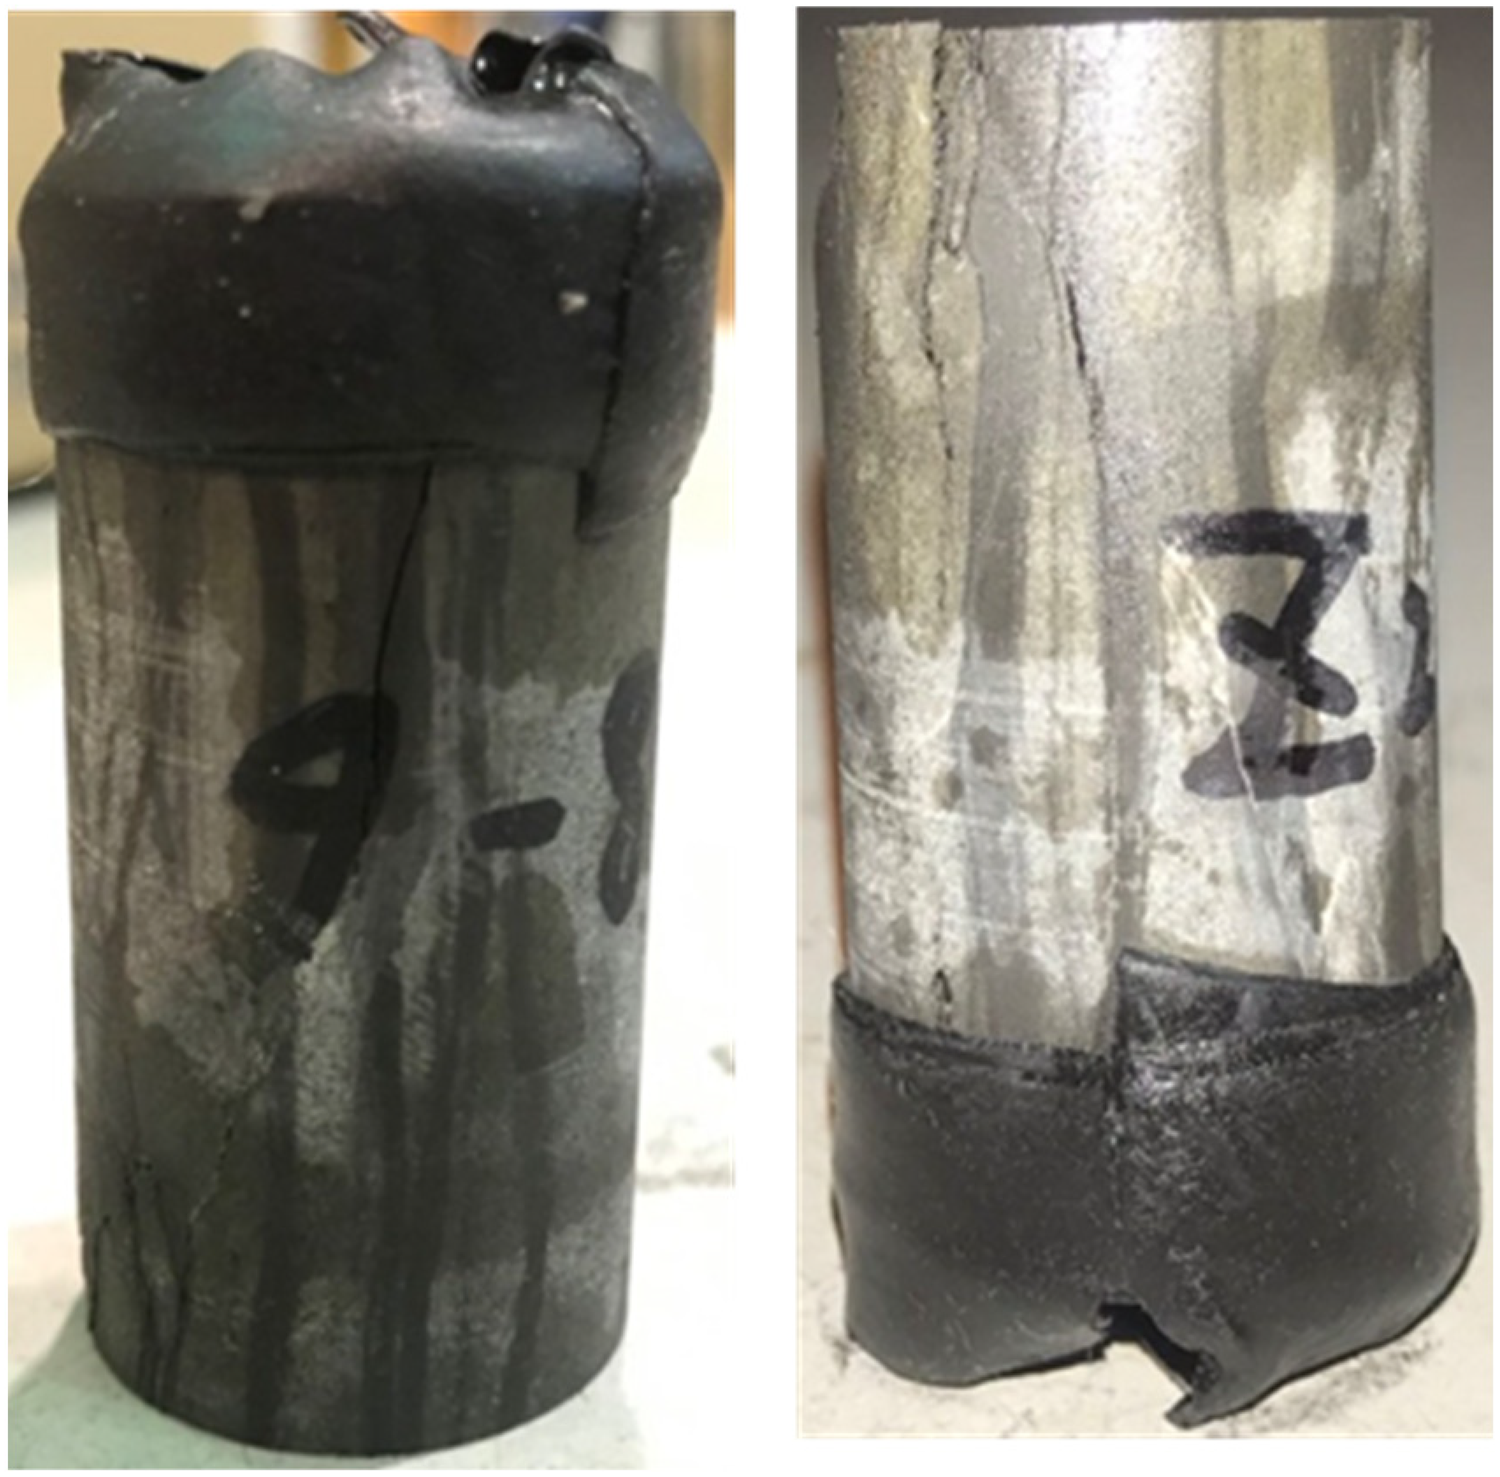
Photos of core samples of well X1 after the triaxial rock mechanics test. See Figure 2(c) for the well location.
Dynamic rock mechanical parameter calibration
The dynamic rock mechanical parameters have the advantage of being continuous but cannot reflect the actual stress state of rock. Whereas, the static rock mechanical parameters obtained from triaxial rock mechanics tests can reflect the actual mechanical properties of rocks more accurately, and thus are widely used during tight-oil exploration development (Lin et al., 1998). Therefore, dynamic rock mechanical parameters need to be corrected by static rock mechanical parameters to improve their accuracy. Crossing plot method is used to draw the relationship between dynamic and static rock mechanical parameters in this study.
Due to the limited core samples and high costs of triaxial compression tests, the data of static rock mechanical parameters obtained from triaxial compression tests are limited, whereas conventional logs are cheap and abundant plentiful. Therefore, to meet the requirements of tight-oil exploration and development, conventional logs are used to determine static rock mechanics parameters by correcting the dynamic rock mechanics parameters using the relationship between dynamic and static rock mechanical parameters (Ju et al., 2020b; Magara, 1968).
Pore fluid pressure determination
Many methods for predicting pore fluid pressure have been developed, such as equivalent depth formula method, Eaton method, Bowers method, empirical formula method, Fillippone method, and so on (Baouche et al., 2020; Bowers, 1995; Hottman and Johnson, 1965; Liu et al., 2006; Terzaghi et al., 1996; Tong et al., 2010; Xiong et al., 2019; Wang et al., 2019). Among which, equivalent depth method and Eaton method are both based on the establishment of normal compaction trend line, which is more suitable for uncompacted shales (Bowers, 2001). Bowers method characterizes abnormal pressure and calculates pore fluid pressure by establishing the relationship between acoustic velocity and effective stress (Bowers, 1995; Li et al., 2019; Song et al., 2015), which generally aims at the mudstone formation, thus might having a huge error of pore fluid pressure prediction in sandstones (Yao et al., 2014). The empirical formula method for pore fluid pressure prediction is widely used in various reservoirs with different lithologies (Baouche et al., 2020; Tong et al., 2010; Wang et al., 2019). Since the tight-oil sandstones of Chang 6 in the study area are typical low-pressure reservoirs, the pore fluid pressure can be predicted through the empirical formula method.
As the formation pressure coefficient in the study area is known, the pore fluid pressure

Results
S-wave slowness
According to the relationship between P-wave slowness and S-wave slowness from dipole acoustic logs of well X2 in the study area (Figure 6), the formula for predicting S-wave slowness is obtained:

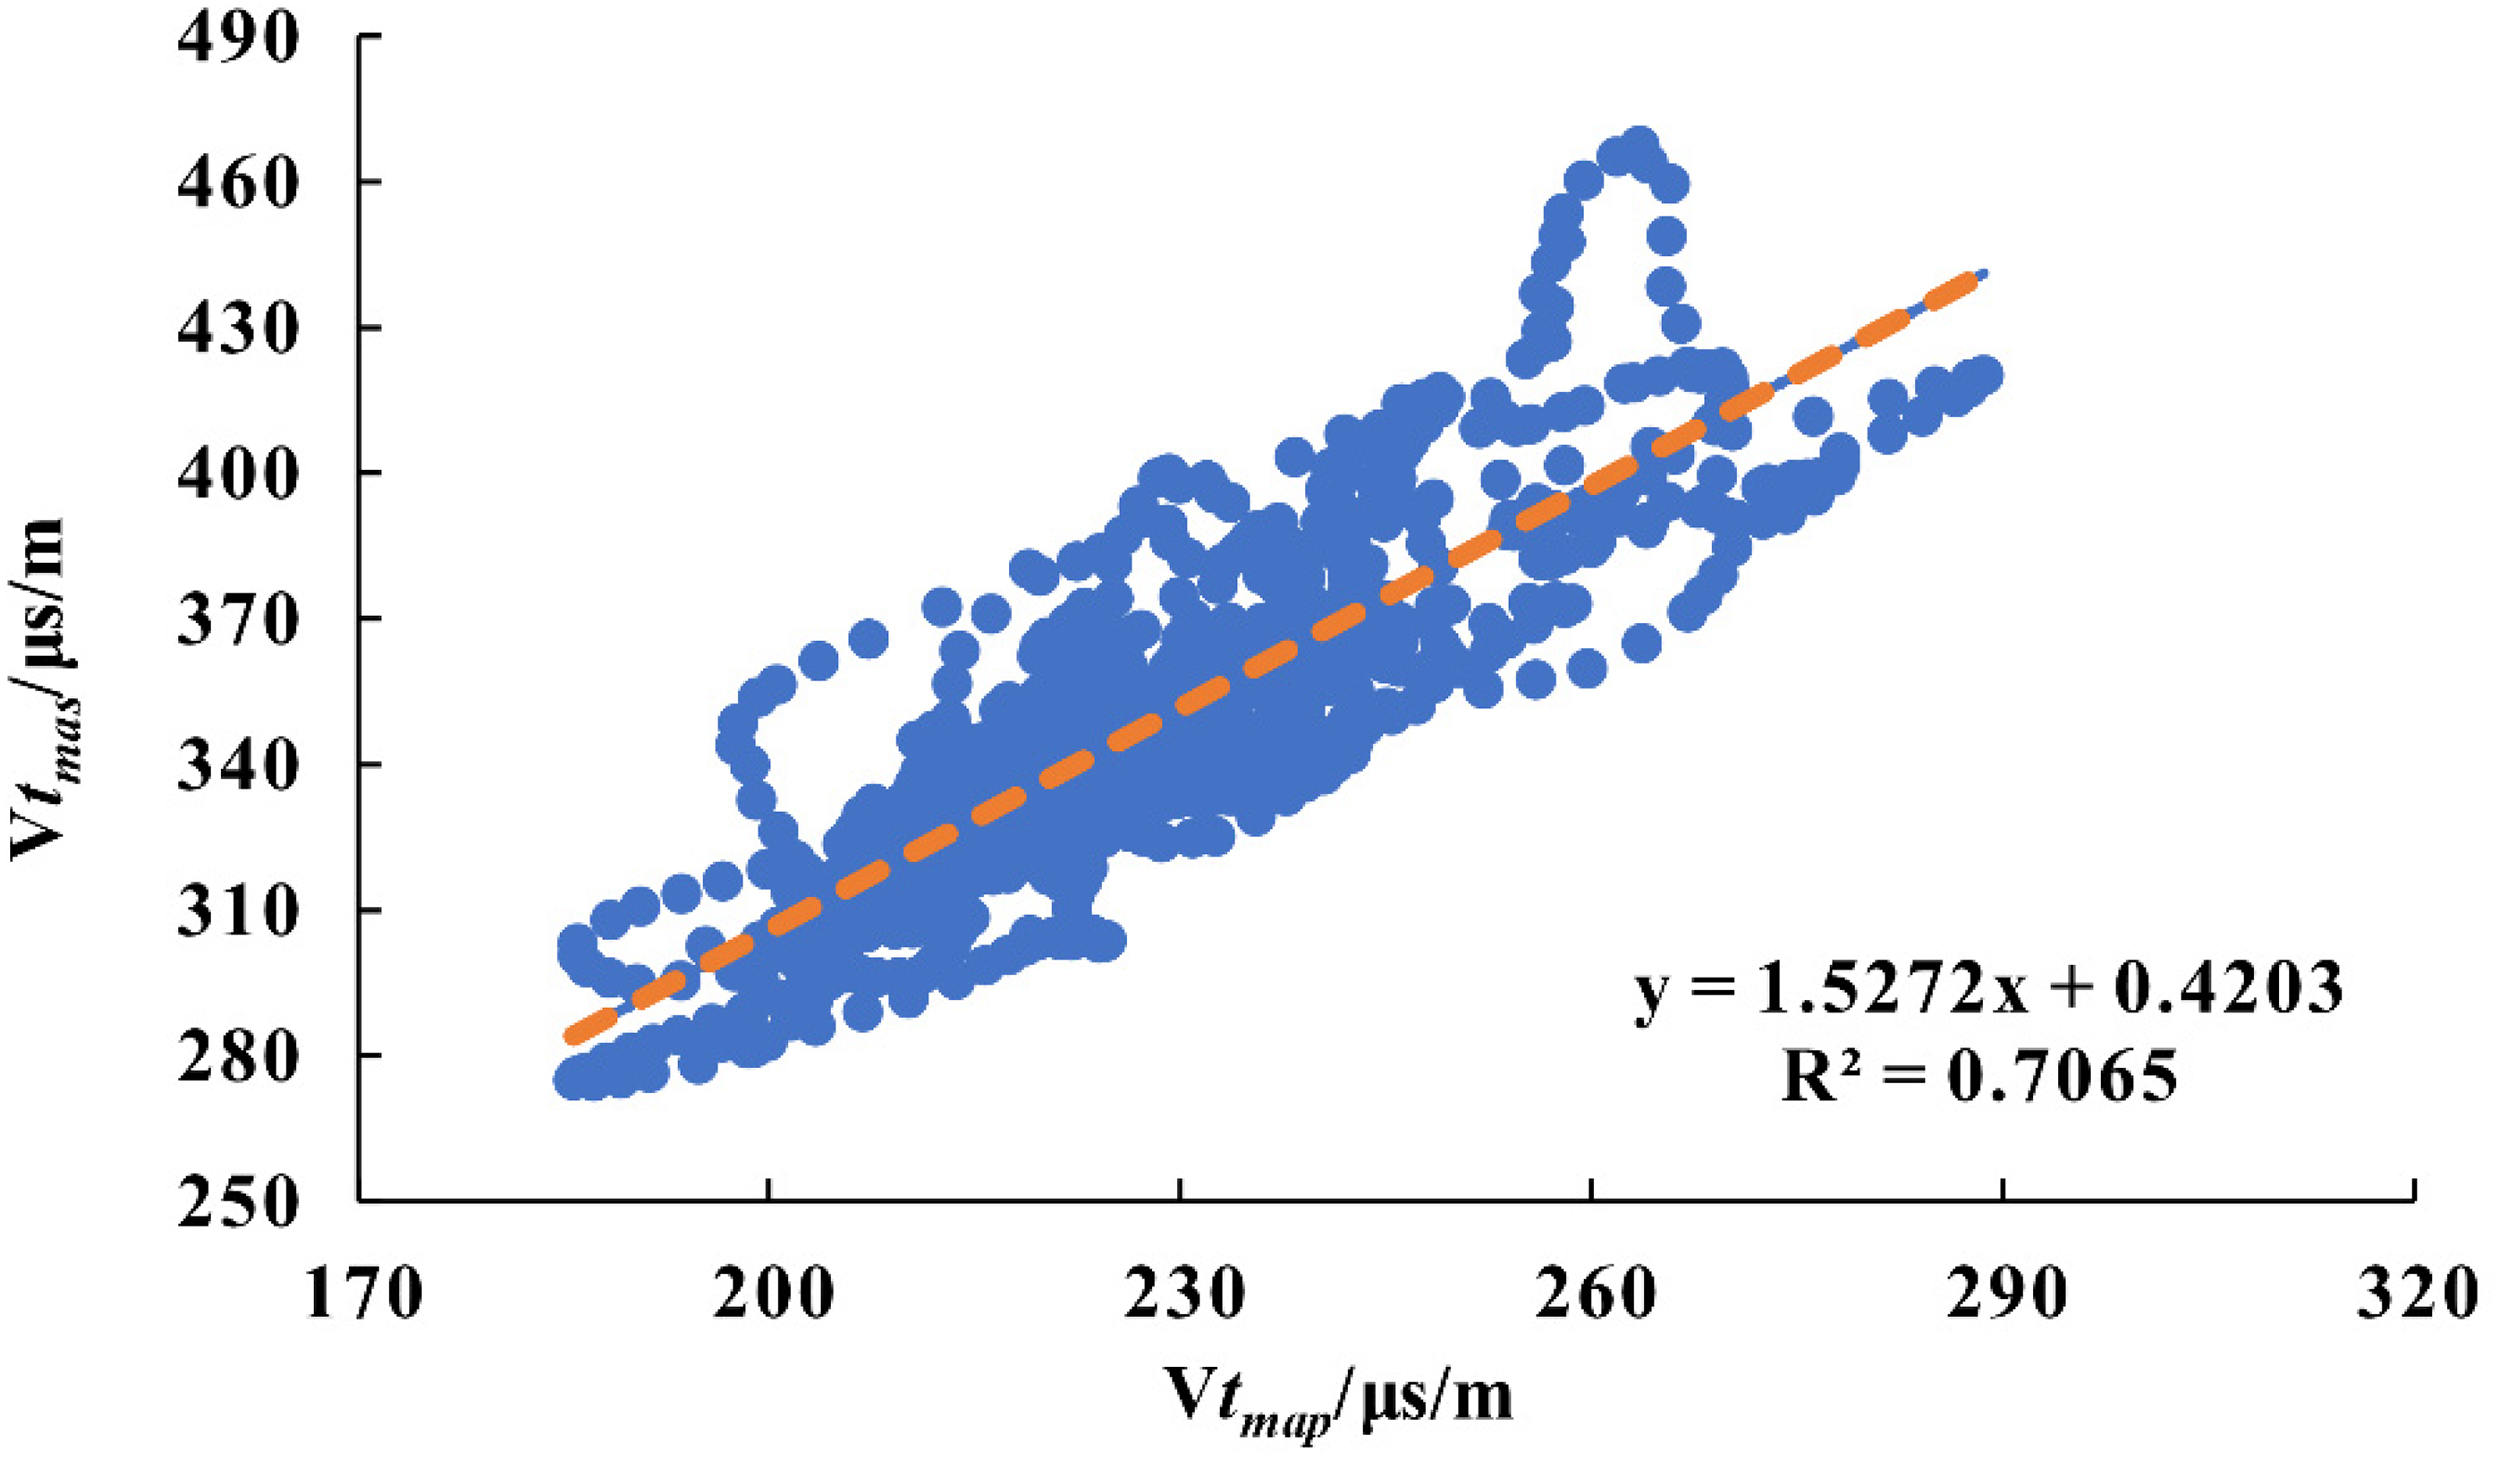
Correlation between P-wave and S-wave slowness (Vtmap and Vtmas) of well X2 in the study area. See Figure 2(c) for the well location.
Based on this formula, the S-wave slowness in other wells is predicted.
Rock mechanical parameters
The results of the triaxial rock mechanics tests show that the magnitudes of the static maximum compressive strength of rock samples ranges from 114 to 229 MPa; the magnitudes of static Young's modulus
These static Young's modulus


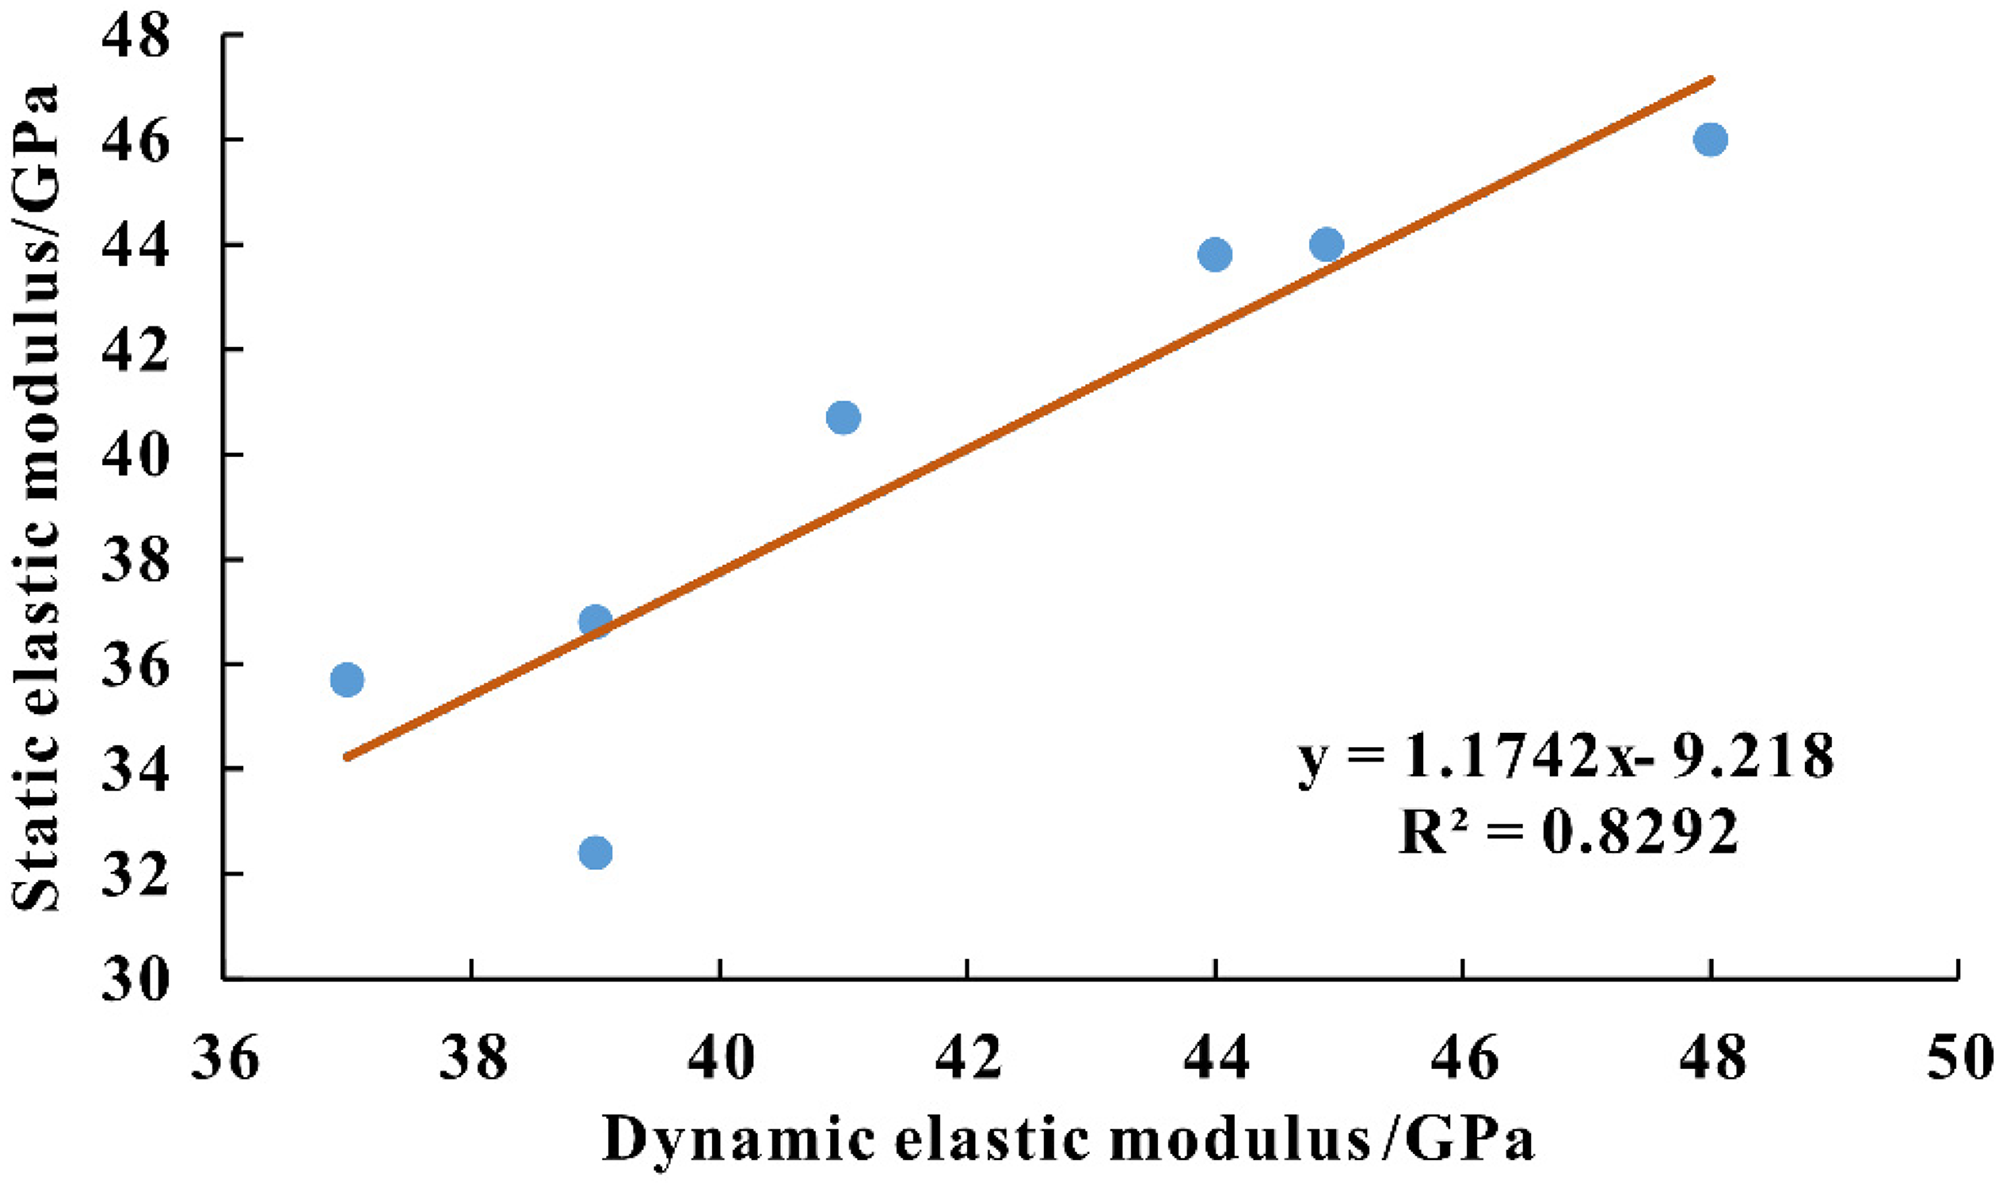
Correlation between dynamic and static Young's modulus obtained from conventional logs and the triaxial rock mechanics tests of Chang 6 in Heshui Area, respectively.
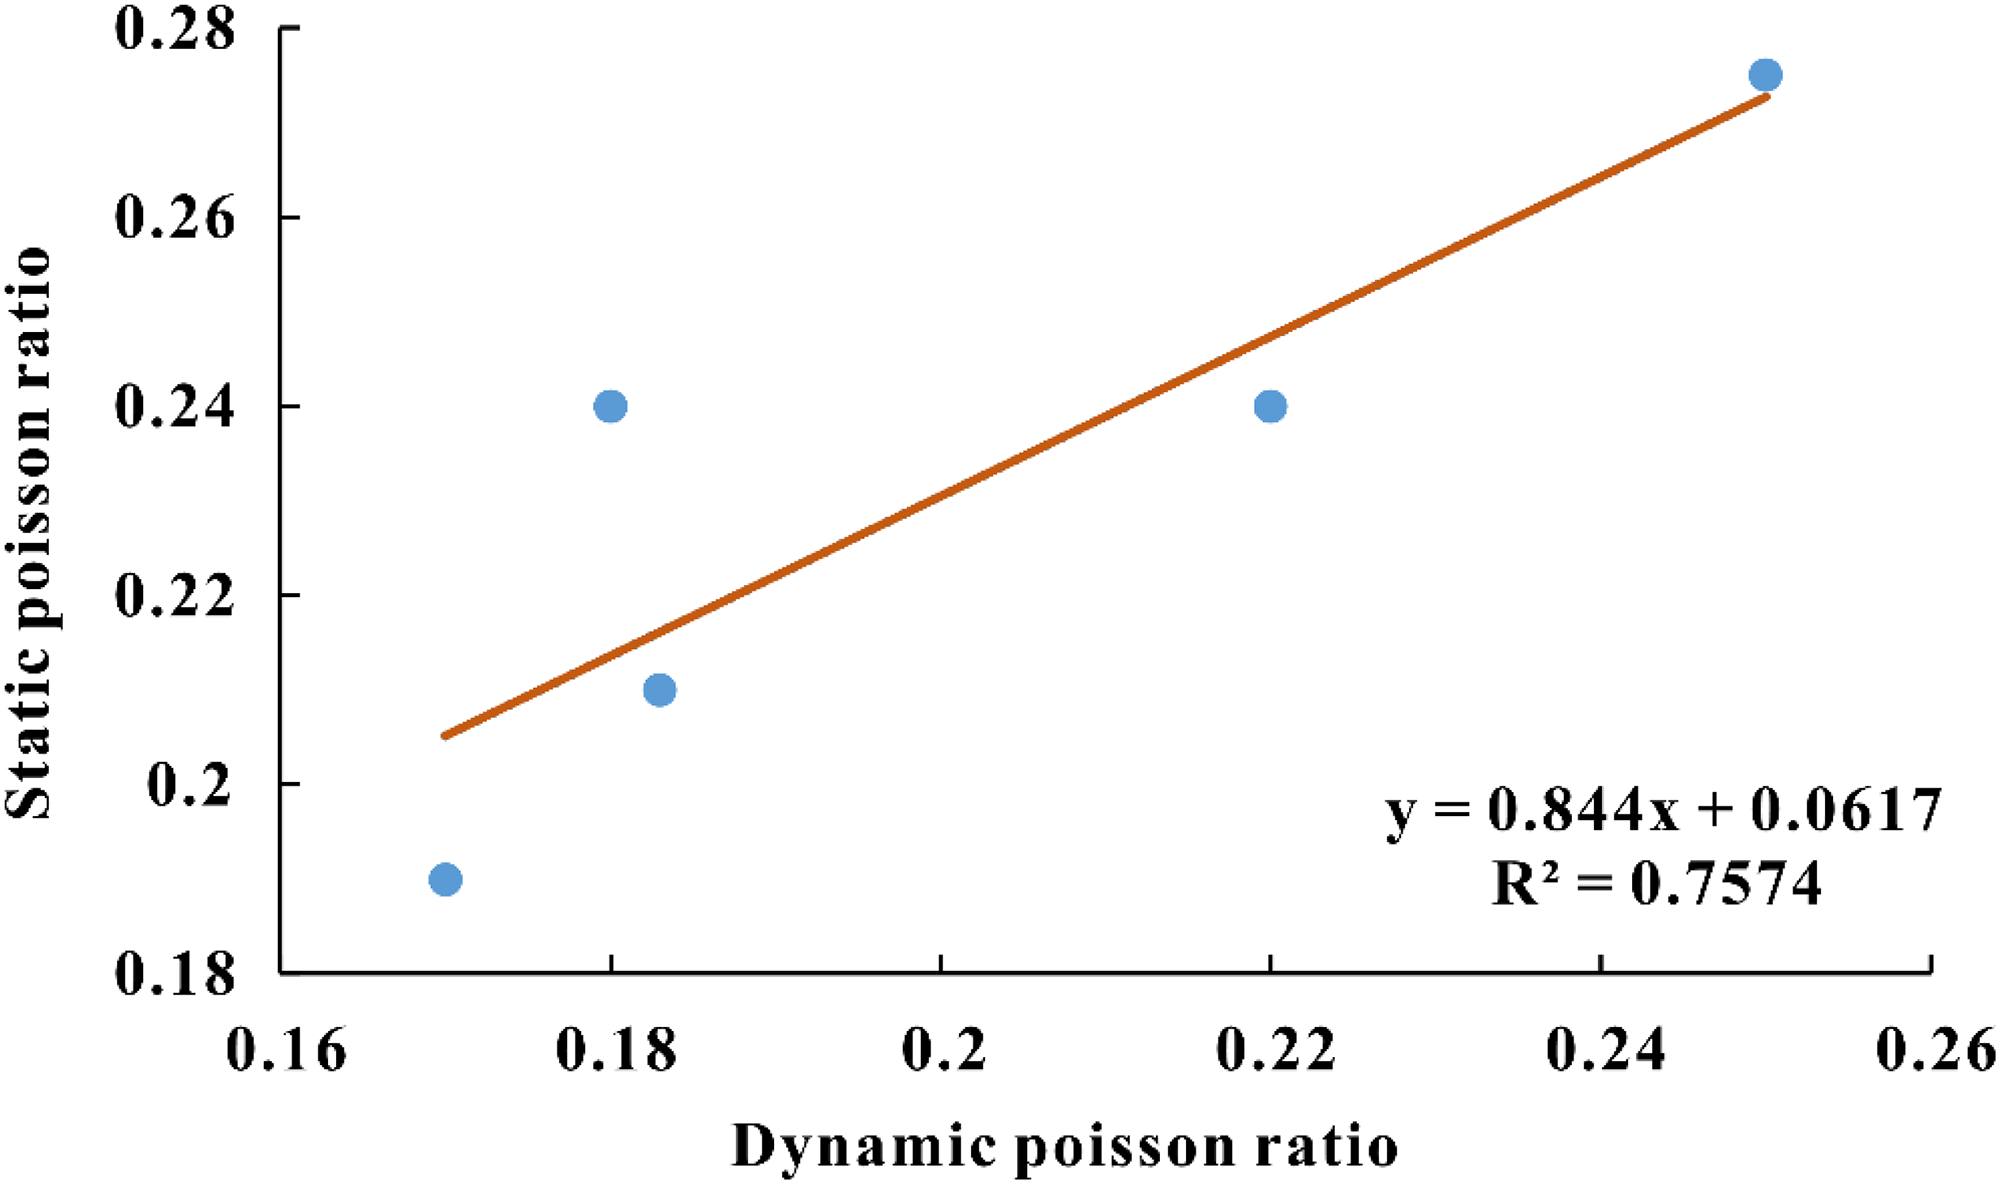
Correlation between of dynamic and static Poisson's ratio obtained from conventional logs and the triaxial rock mechanics tests of Chang 6 in Heshui Area, respectively.
The dynamic rock mechanical parameters obtained from conventional logs in other wells are calibrated by formulas (13) and (14) to get the statics rock mechanical parameters.
Pore fluid pressure
According to the empirical formula method, with the increase of depth, the pore fluid pressure increases obviously (Figure 9). The relationship between pore fluid pressure and depth is as follows:

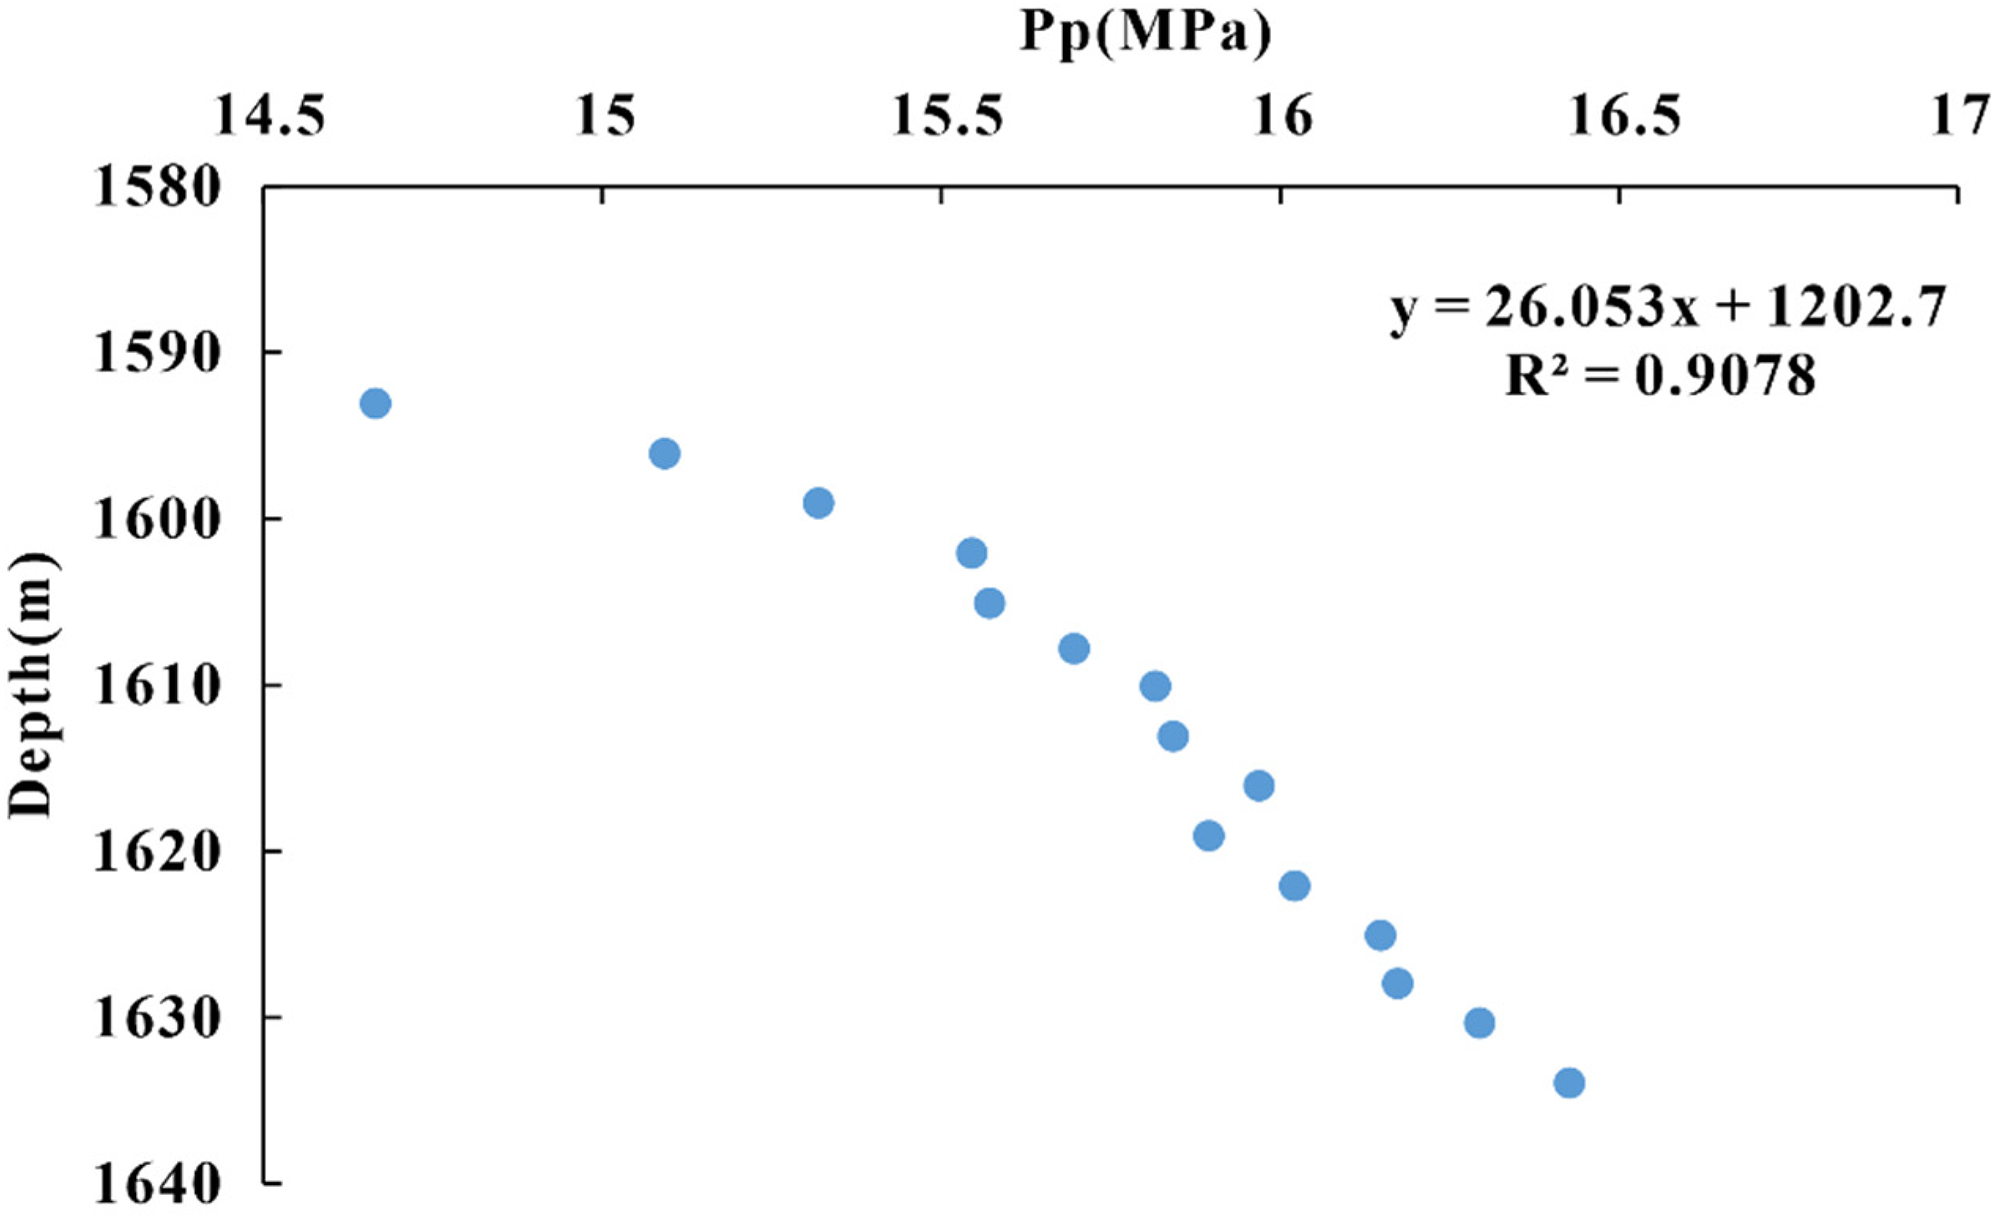
The relationships between pore fluid pressure (
The present-day in-situ stress profile
Based on the corrected static Young's modulus, Poisson's ratio and pore fluid pressure results, σv, σH, σh and σH−h of Chang 6 in six wells were obtained (such as well X1 (Figure 10) and well X2 (Figure 11). The results show that the magnitudes of σH and σh range from 32 to 43 MPa and 23 to 37 MPa, respectively. The magnitudes of σH−h range from 5 to 8 MPa.
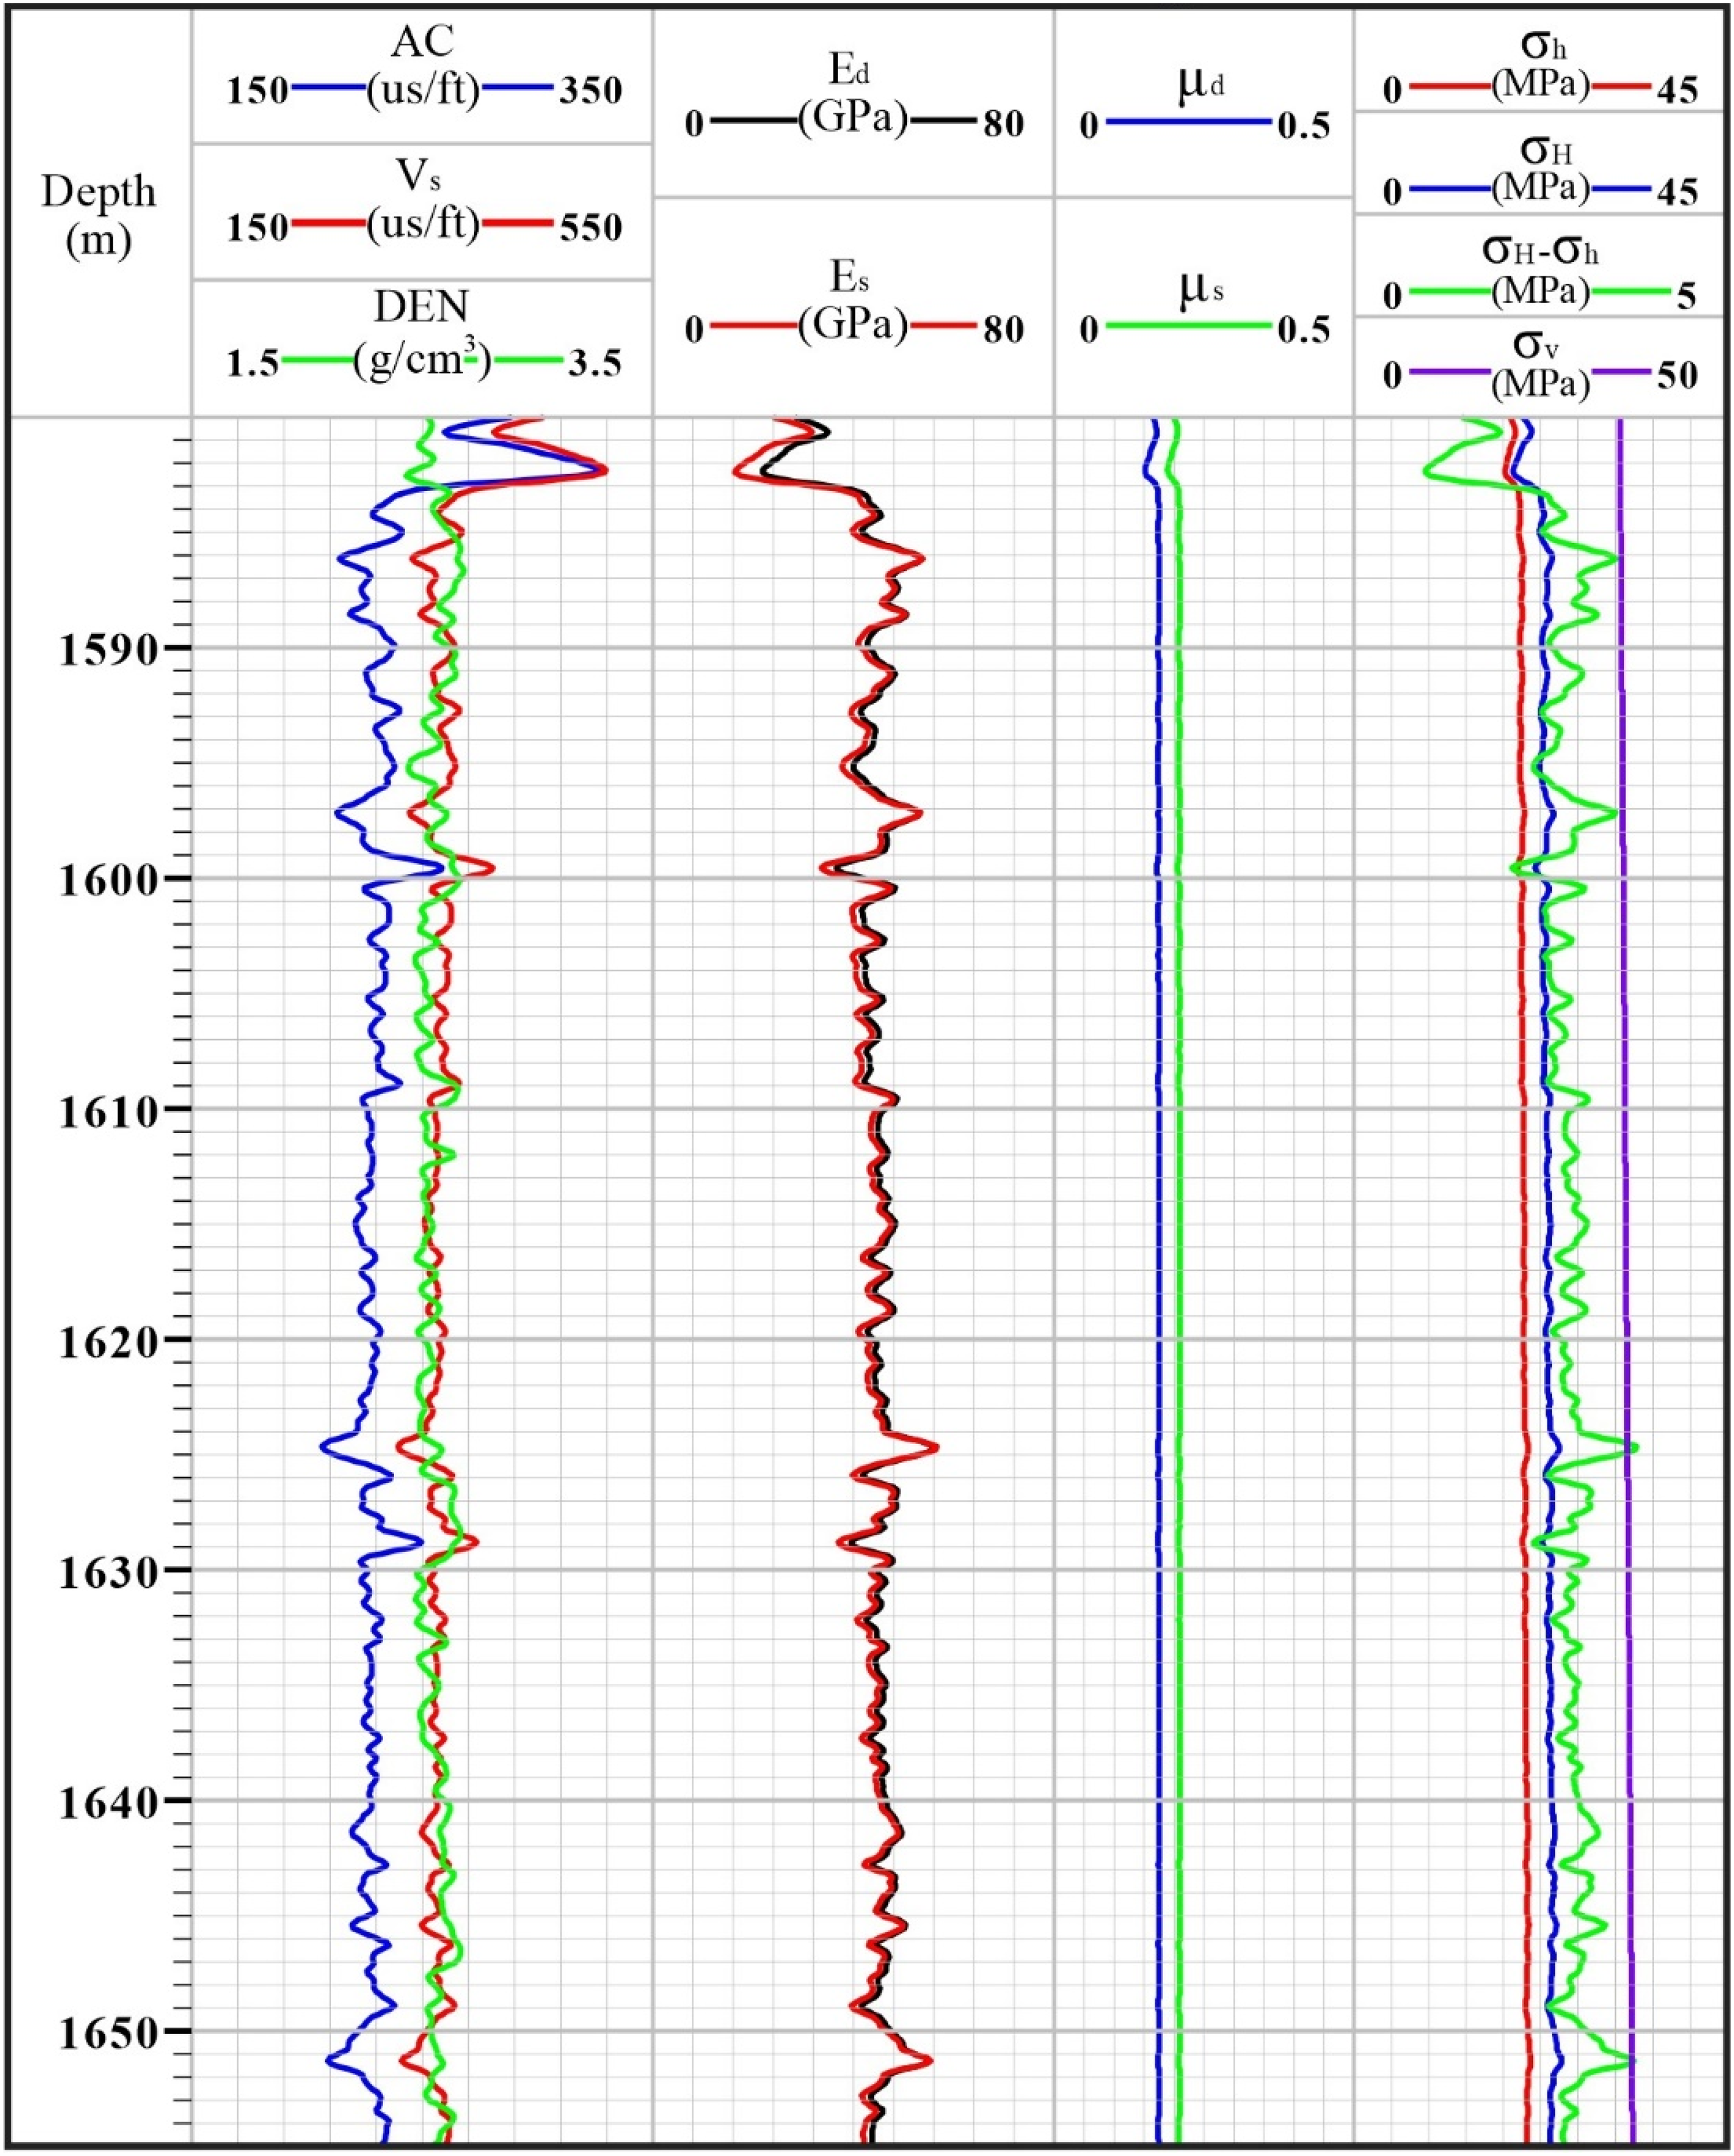
The present-day in-situ stress distribution profile of Chang 6 of well X2 in the study area. See Figure 2(c) for the well location.
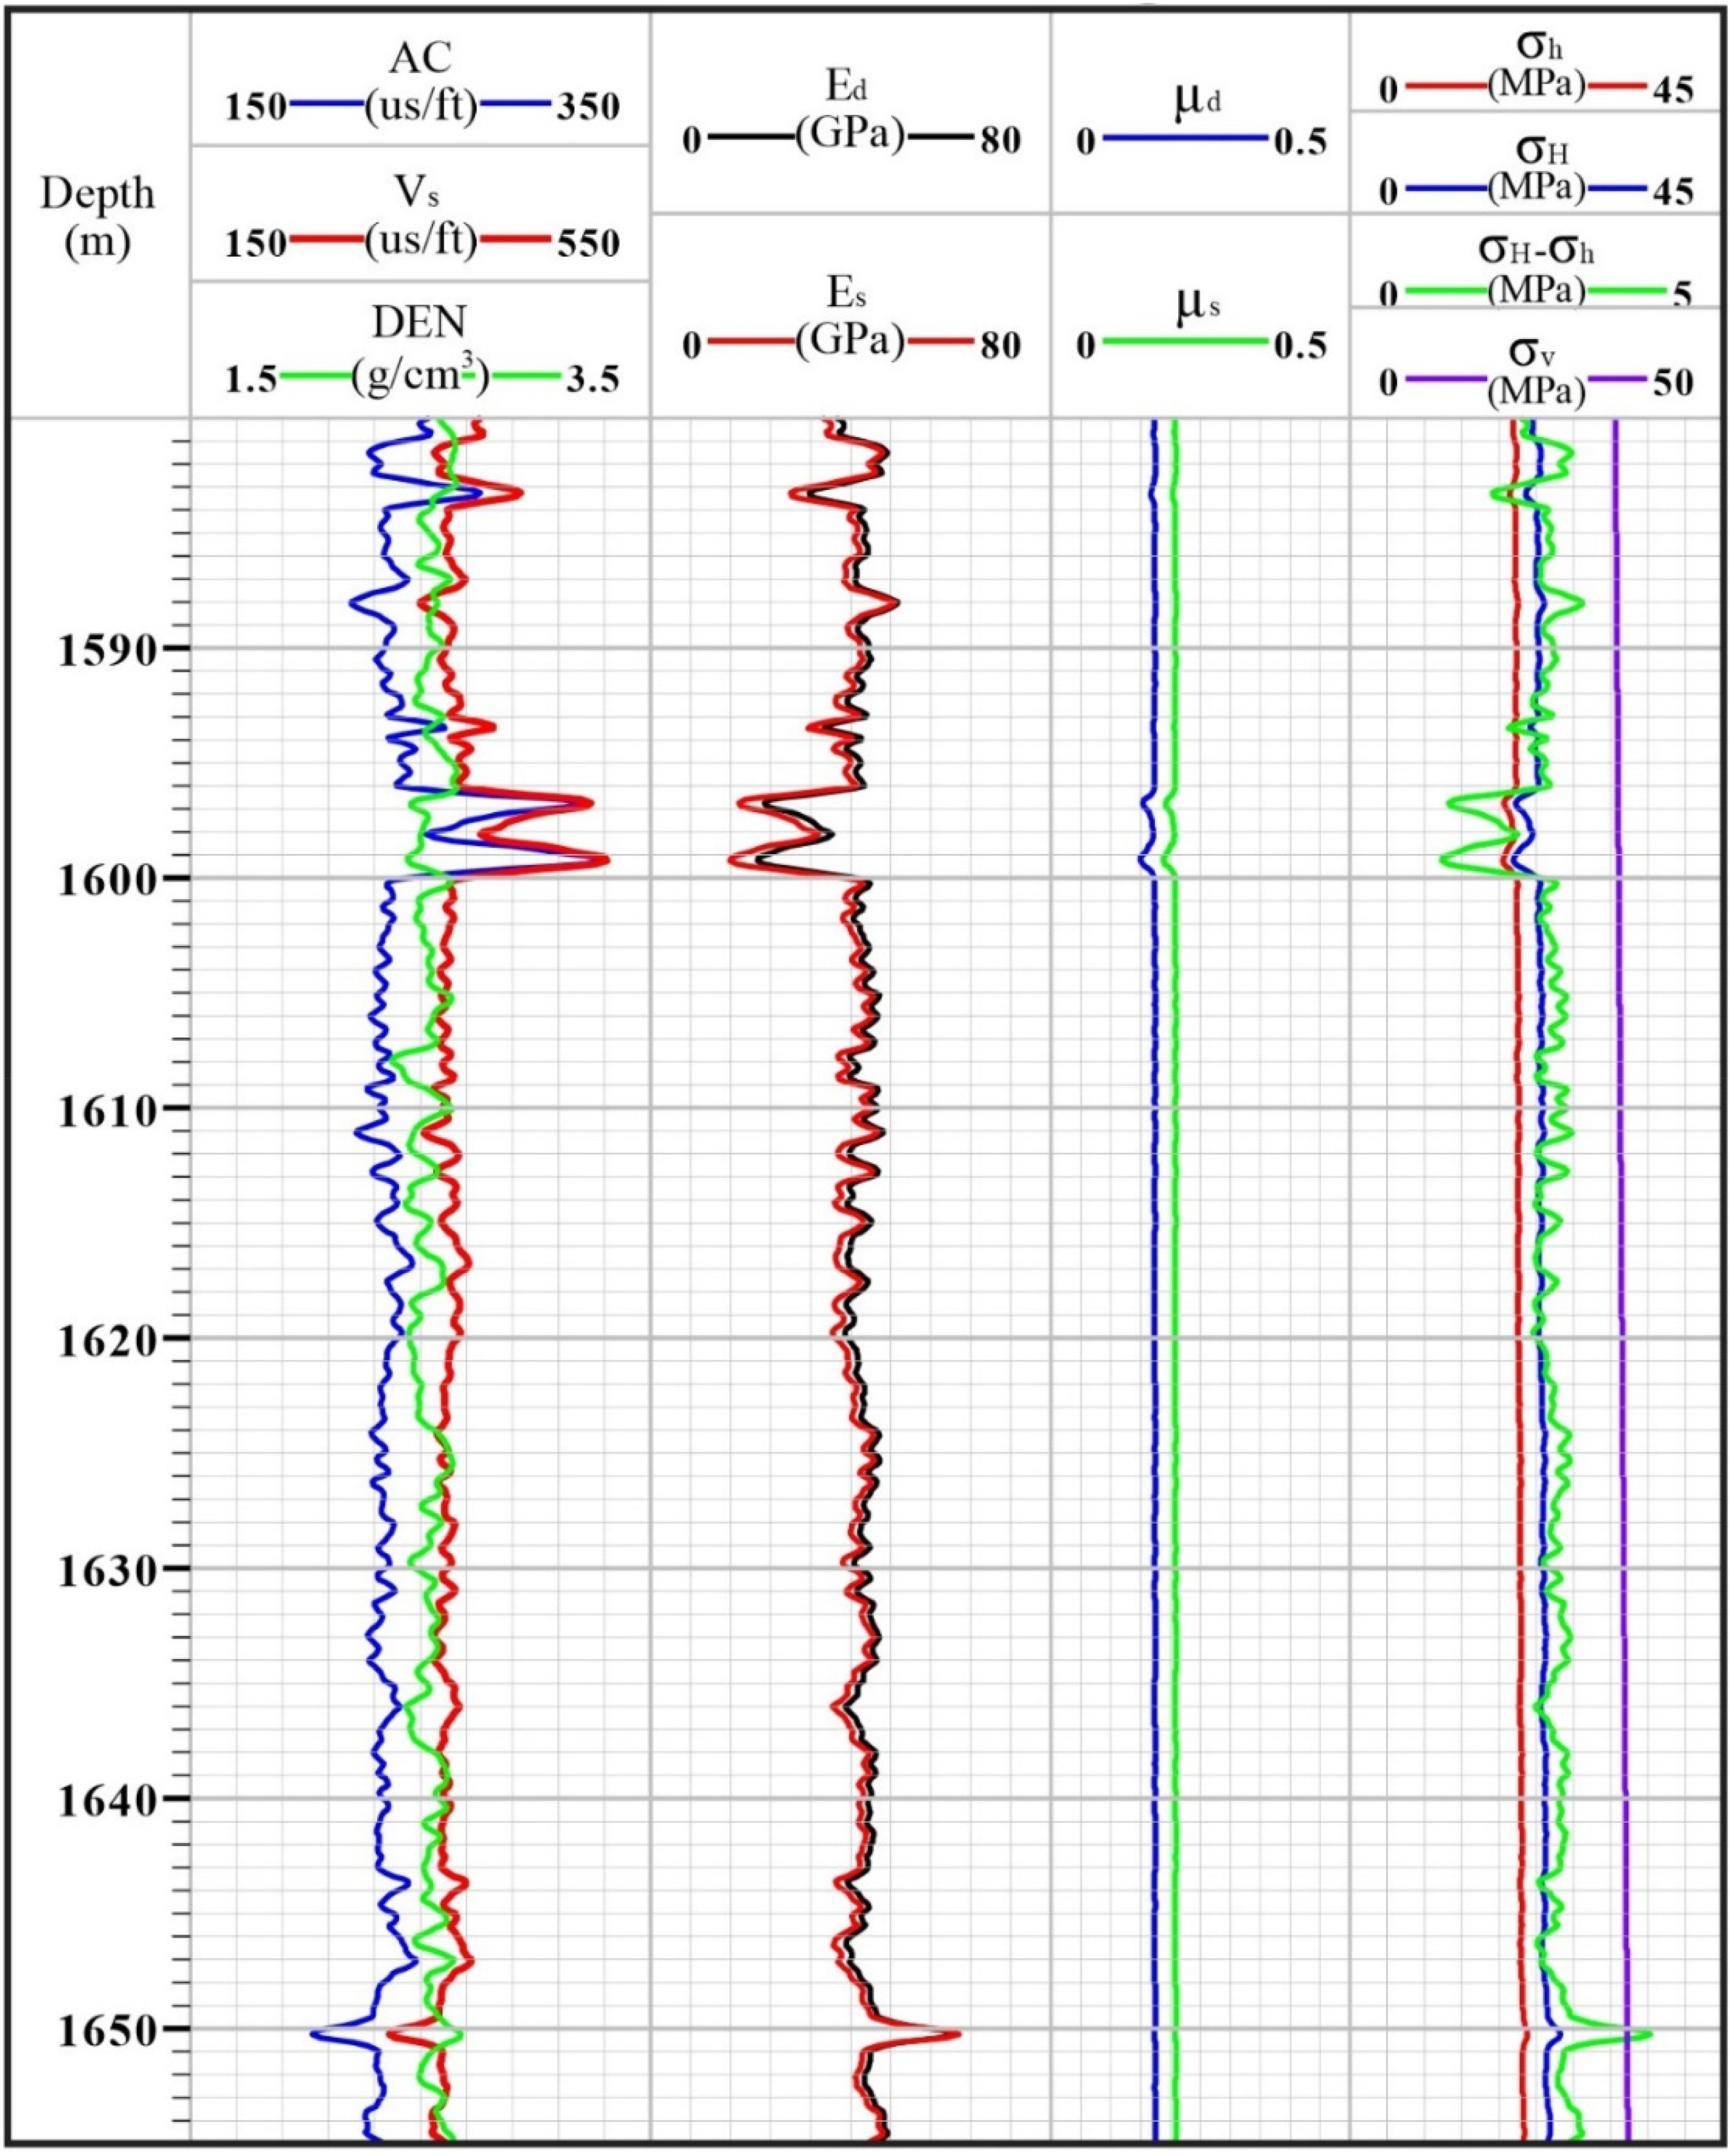
The present-day in-situ stress distribution profile of Chang 6 of well X2 in the study area. See Figure 2(c) for the well location.
The present-day in-situ stresses in three directions, namely σv, σH and σh, increase with the increase of depth in the study area (Figure 12). The average gradients of σv, σH and σh are 0.015, 0.018 and 0.014 MPa/m, respectively. Consequently, the maximum principal stress in the study area is σH, whereas σv is intermediate stress and σh is the minimum principal stress.
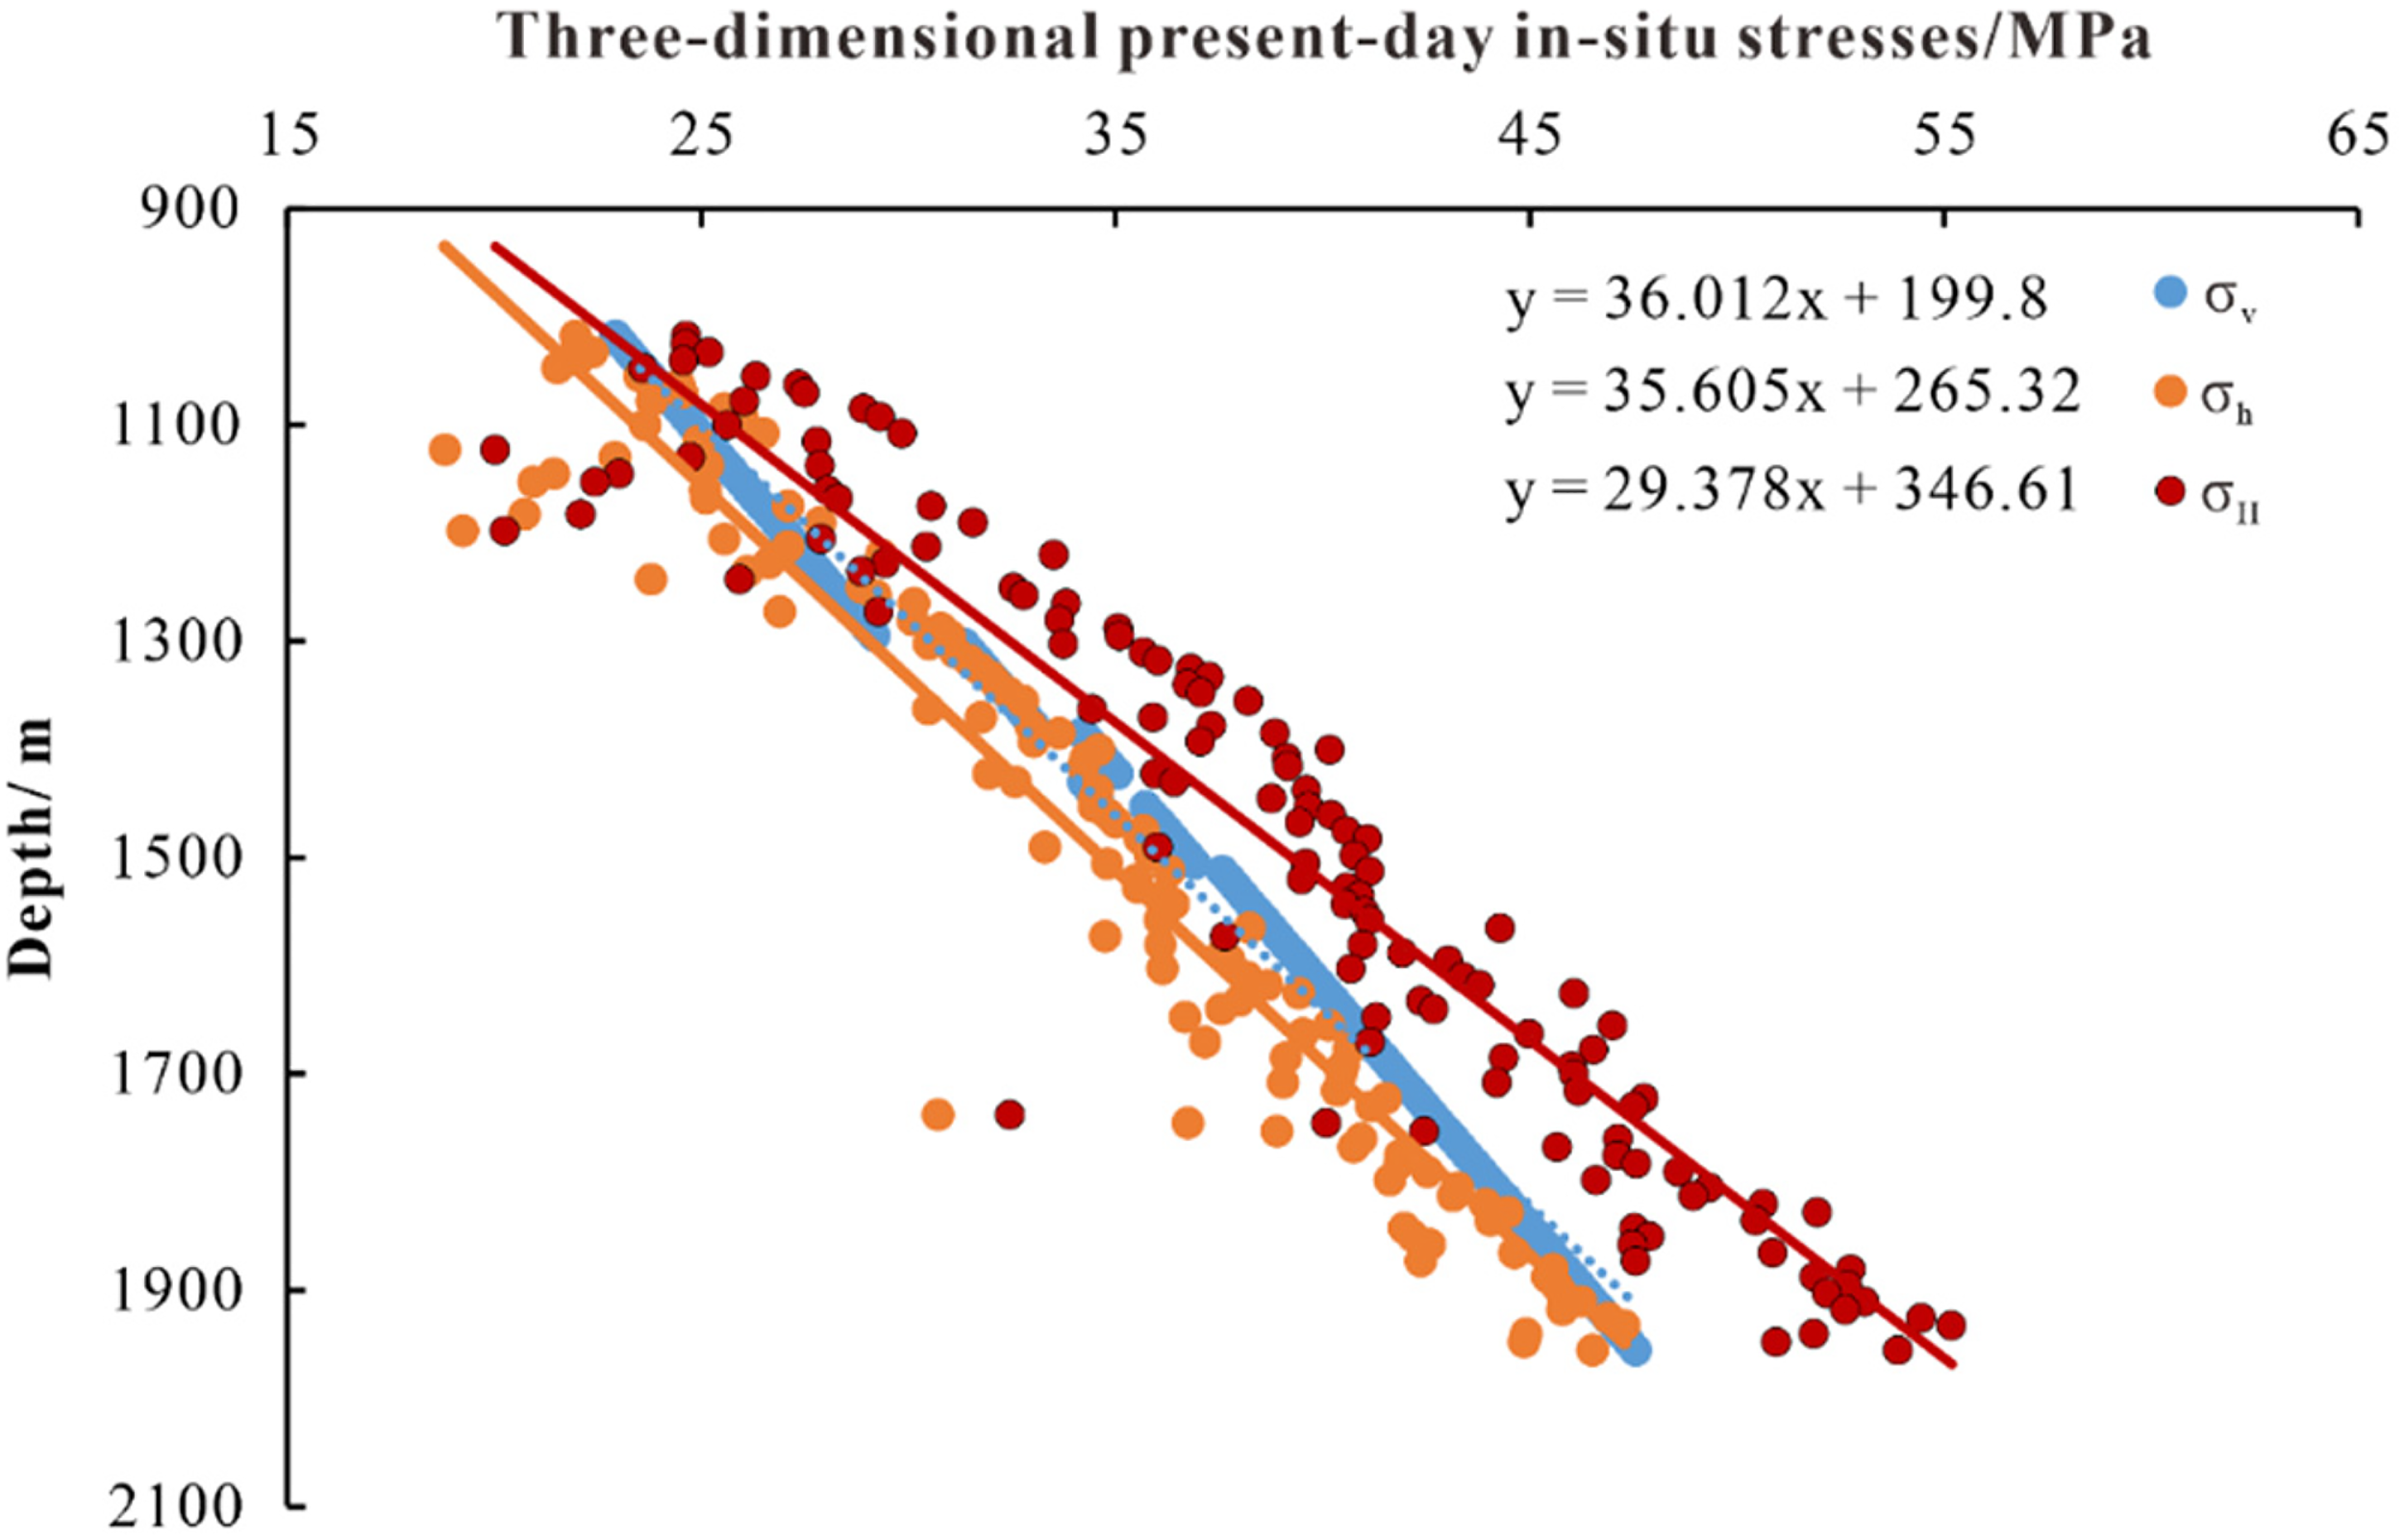
The relationships between the present-day in-situ stresses in three directions and depth of well X4. See Figure 2(c) for the well location.
The magnitude of σH of Chang 6 in well X4 is 37 MPa (Table 1). The finite-element numerical simulations show that the magnitudes of σH and σh of Chang 6 in well X1 is 39 and 32 MPa, respectively; being 39.5 and 31.5 MPa in well X3, 37.5 and 31 MPa in well X4, 38 and 32 MPa in well X7, 38 and 32 MPa in well X8 (Table 2).
Comparison between the present-day in-situ stress calculated by conventional logs and that measured by the acoustic emission of Chang 6 in well X4.
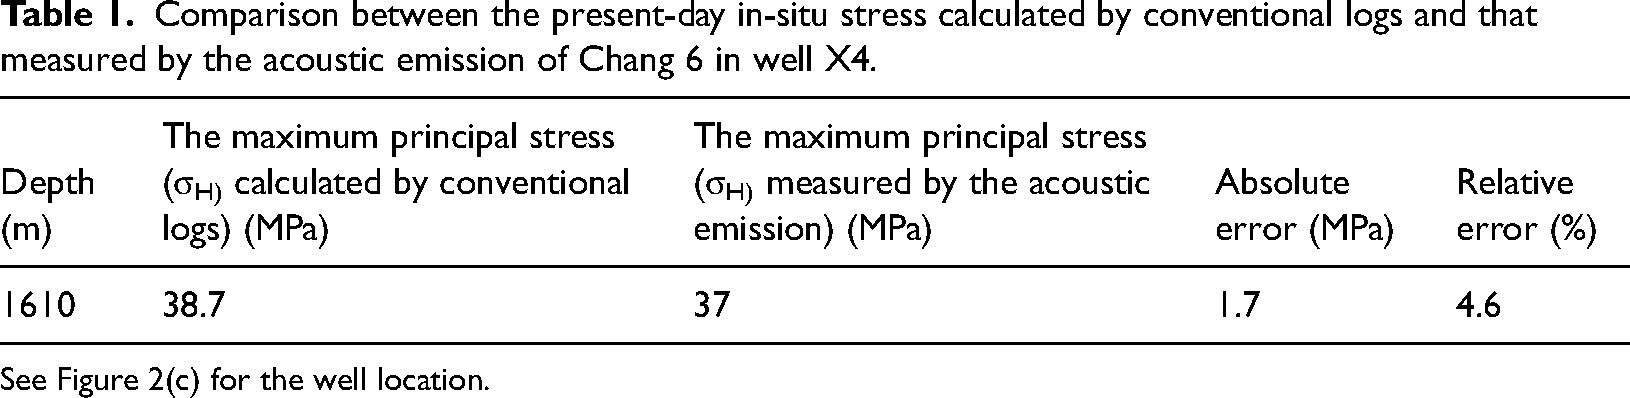
See Figure 2(c) for the well location.
Comparison between the present-day in-situ stresses of Chang 6 calculated by conventional logs (calculated values) and those obtained by finite-element numerical simulations (simulated values).
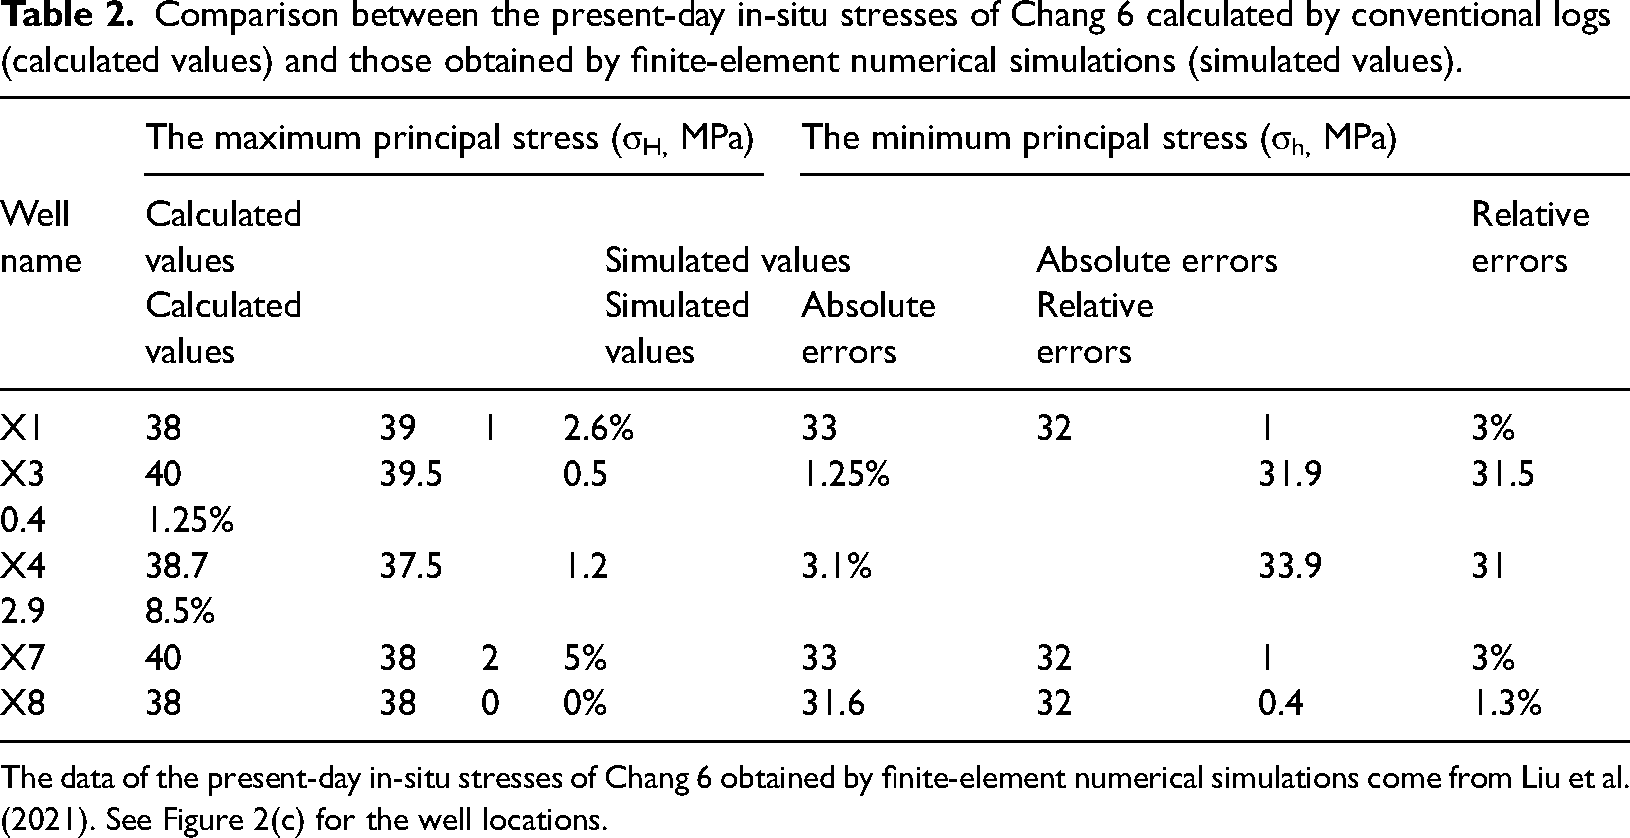
The data of the present-day in-situ stresses of Chang 6 obtained by finite-element numerical simulations come from Liu et al. (2021). See Figure 2(c) for the well locations.
Discussion
Accuracy analysis of the present-day in-situ stress calculated by conventional logs
The continuous profile determination of the present-day in-situ stress by conventional logs is an indirect method. Moreover, it is inevitable to obtain inaccurate logs due to system errors because of instrument accuracy. Therefore, to improve the accuracy of the present-day in-situ stress calculated by conventional logs, dynamic rock mechanical parameters obtained from conventional logs need to be corrected by static rock mechanical parameters drawn from triaxial rock mechanics tests. Meanwhile, a suitable calculation model also affects the accuracy of the present-day in-situ stress calculated by conventional logs. It is important to select suitable calculation models and methods according to the geological characteristics of specific areas. The study area is a tight sandstone reservoir with natural fractures and weak tectonic movement; thus, the Newberry model is relatively suitable for the present-day in-situ stress calculated by conventional logs.
Moreover, precise pore fluid pressure prediction affects the accuracy of the present-day in-situ stress calculated by conventional logs. The pore fluid pressure in Heshui area of Ordos Basin is mainly low pressure with a pressure coefficient of about 0.8, which is related to tectonic movement (Bao, 2009; Liu et al., 2021). Moreover, the study area is a typical tight sandstone reservoir, it is unreasonable to obtain the pore fluid pressure by using the method suitable for the uncompacted abnormal high pressure shale reservoirs. Therefore, the empirical formula is applied for pore fluid pressure prediction.
In addition, intermediate parameters for the present-day in-situ stress calculation by conventional logs, such as tectonic stress coefficient, can be calculated by P-wave and S-wave slowness and density logs. Because few wells with S-wave slowness are available in the study area, and as mentioned above, the S-wave slowness is predicted by P-wave slowness. So, the accuracy of P-wave slowness could affect the accuracy of intermediate parameters thus affecting the accuracy of the present-day in-situ stress calculated by conventional logs.
In the study, the present-day in-situ stresses of Chang 6 calculated by conventional logs are verified by those obtained by acoustic emission tests of well X4 and finite-element numerical simulations (Liu et al., 2021). The results show that the absolute error of the calculated present-day in-situ stress is 1.7 MPa and its relative error is 4.6% compared with that obtained by acoustic emission tests (Table 1). Compared with the present-day in-situ stress obtained by finite-element numerical simulations (Liu et al., 2021), the relative errors of both the calculated σH and σh are less than 10% (Table 2), which indicates that the calculated present-day in-situ stresses by conventional logs are credible.
The present-day in-situ stress influence on hydraulic fracturing
The propagation and distribution of hydraulic fractures are affected by the present-day in-situ stress and natural fractures (Ren, 2016; Taleghani and Olson, 2014; Zhang et al., 2018). As mentioned above, most of natural fractures are trending east-northeast to west-southwest (E-NE to W-SW), which is nearly parallel to the direction of σH. So, the influence of the present-day in-situ stress is focused on hydraulic fracturing in this study. Firstly, the present-day in-situ stress state affects the expanding modes of hydraulic fracturing (Lyu, 2017; Zhang et al., 2018). The present-day in-situ stresses of most wells in the study area present this relationship, that is σH>σv>σh (Figure 12). In this present-day in-situ stress state, which is confirmed to be the best state to form hydraulic fracture networks, hydraulic fractures mainly expand along or at a small angle relative to the direction of σH (Gale et al., 2007; Hossain et al., 2000; Zhang et al., 2018). According to the micro-seismic monitoring results, the extension direction of hydraulic fractures in the study area is about NE 60° (Figure 13), which is indeed at a small angle relative to the direction of σH.
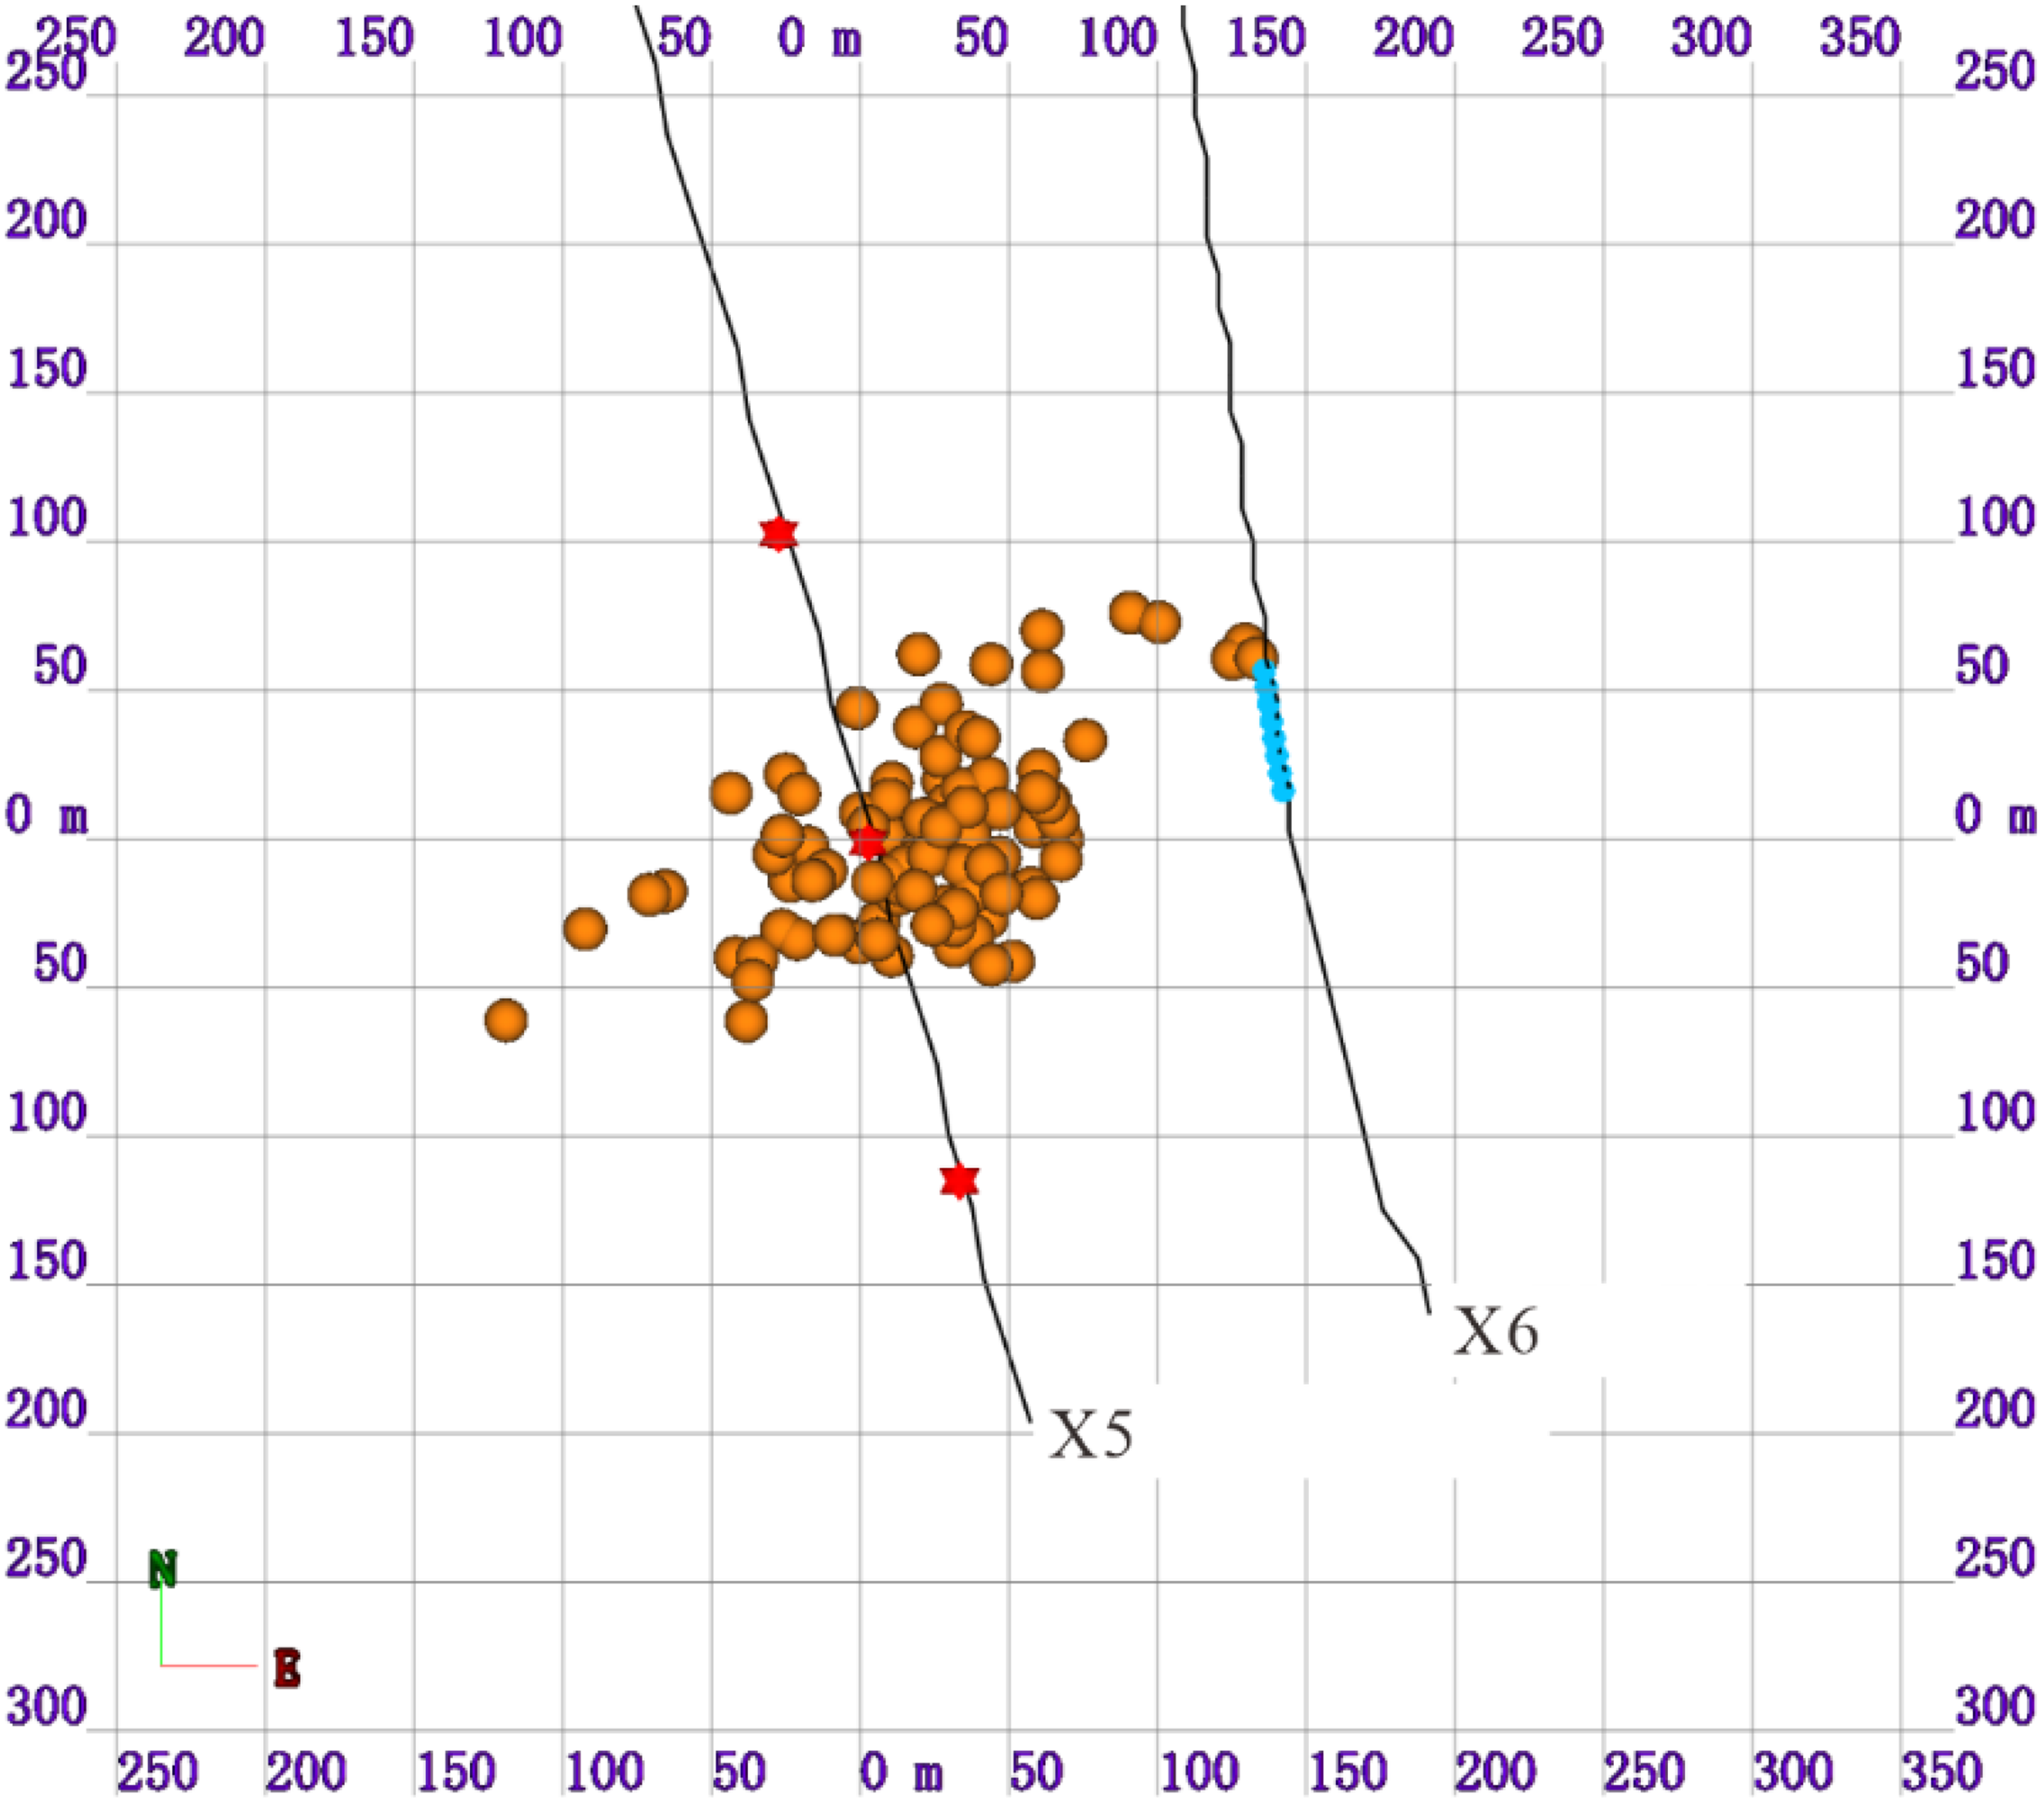
Schematic diagram of microseismic monitoring results of well X5 in the study area. See Figure 2(c) for the well locations.
Moreover, the σH controls the main direction of hydraulic fracture propagation, whereas the σH−h has an impact on the shape complexity of hydraulic fracture networks (Ren, 2016). When the magnitude of σH−h is small and less than 5 MPa, the shape of hydraulic fractures is complex and extends in many directions; When the magnitude of σH−h increases gradually and exceeds 10 MPa, the shape of hydraulic fracture network tends to be a long strip and generally extends in the direction of σH (Gale et al., 2007; Hossain et al., 2000; Ju et al., 2019). According to the present-day in-situ stresses calculated by conventional logs, the magnitude of σH−h mainly ranges from 5 to 8 MPa in the study area. Combining with micro-seismic monitoring results, the hydraulic fractures are generally extending at a small angle relative to the direction of σH with a trend of slightly extending towards multiple directions (Figure 13).
In a word, as mentioned above, the present-day in-situ stresses calculated by conventional logs can be applied to guide hydraulic fracturing in the study area.
Conclusions
This study provides an example for the present-day in-situ stress determination by conventional logs in tight-oil sandstones, which mainly includes the calculation model selection, S-wave slowness prediction, pore fluid pressure prediction and rock mechanical parameter determination. The suitable calculation model, the accuracy of S-wave slowness, pore fluid pressure, rock mechanical parameters and intermediate parameters can affect the accuracy of the present-day in-situ stress calculated by conventional logs.
The magnitudes of σH and σh of Chang 6 in Heshui area range from 32 to 43 MPa and 23 to 37 MPa, respectively. The magnitude of σH−h mainly ranges from 5 to 8 MPa. The calculated σH and σh are in consistent with those obtained by acoustic emission tests and finite-element numerical simulations with relative errors of less than 10%. The average gradients of σH,, σh and σv are 0.018, 0.014 and 0.015 MPa/m, respectively, which can provide a basis for the prediction of the three-dimensional present-day in-situ stresses in the study area.
The present-day in-situ stress state affects the expanding mode of hydraulic fracturing. In the present-day in-situ stress state (σH>σv>σh), hydraulic fractures mainly propagate along or at a small angle relative to the direction of σH. The direction of σH and the magnitude of σH−h also affect the extension and complexity of hydraulic fractures. The hydraulic fractures mainly propagate at a small angle to the direction of σH with a trend of slightly extending towards multiple directions in the study area.
Highlights
An approach for determining the present-day in-situ stresses of tight-oil sandstones by conventional logs are proposed.
The factors affecting the present-day in-situ stress calculation by conventional logs are confirmed.
The influence of the present-day in-situ stress on hydraulic fracturing is analyzed.
Footnotes
Acknowledgements
This work is financially supported by the National Natural Science Foundation of China (No. 42002135), the Strategic Cooperation Technology Projects of CNPC and CUPB (No. ZLZX2020-02) and Science Foundation of China University of Petroleum, Beijing (No. 2462017YJRC057).
Declaration of conflicting interests
The author(s) declared no potential conflicts of interest with respect to the research, authorship, and/or publication of this article.
Funding
The author(s) disclosed receipt of the following financial support for the research, authorship, and/or publication of this article: This work was supported by the Strategic Cooperation Technology Projects of CNPC and CUPB, National Natural Science Foundation of China (grant numbers ZLZX2020-02, 42002135).