
Abstract
The accurate calculation of the height of fractured water-conducting zone (FWCZ) is of great significance for mine optimization design, water disaster prevention, and safety production of the coal mines. In this article, a height-prediction model of FWCZ based on extreme learning machine (ELM) is proposed. To address the issues of low prediction accuracy and challenging parameter optimization, we optimized the ELM model using the gray-wolf optimization algorithm (GOA), whale optimization algorithm (WOA), and salp optimization algorithm (SOA). These optimization algorithms mitigate the issues of slow convergence, poor stability, and local optimality associated with traditional neural networks. The mining depth, mining height, overburden strata structure, working face length, and coal seam dip angle are selected as the main controlling factors for the height of FWCZ. A total of 42 fields-measured samples are collected and divided into 2 subsets for training and validating with a ratio of 36/6. The prediction capability of GOA-ELM, WOA-ELM, and SOA-ELM models are evaluated and compared, and the results show that the calculation results of the three models are optimized compared with the ELM model. The prediction capability of GOA and WOA are similar, while the prediction results of SOA-ELM are better than the other two models, and the relative errors of the test sets are all less than 10%. Therefore, the SOA-ELM model is finally applied to predict the height of FWCZ formed after the mining of No.15 coal seam in Xinjian Coal Mine. Finally, we verified the prediction results using measured data from the borehole television detection instrument, which showed good consistency. This provides further evidence of the effectiveness of the swarm intelligence optimization algorithm in predicting the height of FWCZ.
Introduction
After coal seam mined, the overlying rock layer of the working face will have significant movement, resulting in the destruction of the overlying rock. The destruction zone is called fractured water-conducting zone (FWCZ). Once the FWCZ extends upward to the overlying water, goaf water, or surface water, it may cause mine water inrush accidents and seriously threaten the safety production of coal mines. Meanwhile, the height of FWCZ is the key parameter of water-preserving coal mining. Therefore, the prediction of the height of FWCZ is the key to the prevention of mine water inrush accidents (Xu et al., 2017).
For the prediction of the height of FWCZ, scholars have proposed a variety of methods, including in situ measurements, numerical simulation, physical similarity simulation, theoretical calculation, empirical formula, and so on. Liu (1981) proposed an empirical formula by regression analysis of field actual measurement data from several large coal mines in northern China. However, this formula only considers a few factors, which cannot accurately reflect the highly complex development mechanism of the height of FWCZ, and have some limitations in its application. Singh and Singh (2009) proposed a numerical simulation method to predict the progressive collapse behavior of strata and the performance of dynamic roof support in a given geological mining operation. Lu et al. (2011) conducted a physical similarity simulation test based on the geological and technical conditions, and found that the ratio of maximum FWCZ height to mining height was 9.25. Both numerical and physical simulations can predict the height of FWCZ, but they are difficult to achieve a high degree of similarity between the reality and the model. Meanwhile, the simulation accuracy is limited by the instrumentation and applied materials. In the theoretical research, Wang et al. (2012) established a mechanical model based on the type of rock formation and its mechanical strength characteristics. Although this model has achieved good application results in Daliuta Coal Mine, the model of the theoretical calculation method is relatively idealized and the calculation and consideration factors are relatively simplified, which makes the prediction results have great uncertainty. Currently, the most effective method is to use drilling camera system, water injection system and other direct monitoring equipment for in situ measurements (Li et al., 2021). However, due to the limitation of topographic and geological conditions, these systems require a large amount of engineering costs.
In recent years, with the rapid development of artificial intelligence technology, machine learning methods such as artificial neural network (ANN), support vector machine (SVM), and extreme learning machine (ELM) have been widely used in the prediction of the height of FWCZ due to their low cost, easy implementation, and high accuracy (Zhao et al., 2018). Li et al. (2015) and Sun et al. (2009), respectively, established back propagation neural network (BPNN) and SVM models to predict the height of FWCZ. However, these methods have more or less problems, such as the elimination of the redundant data of the SVM model has not been fundamentally solved (Rui et al., 2023), and BPNN model has several defects, such as slow convergence, relatively poor computing power, and easy to fall into local optimality. Therefore, further optimization of these machine learning models is extremely necessary in the practical application.
Swarm intelligence optimization algorithm is a powerful tool to solve the complex optimization problems by simulating clustering behavior in biological or physical systems. In this article, the traditional BP models, ELM models, gray-wolf optimization algorithm (GOA), whale optimization algorithm (WOA), and salp optimization algorithm (SOA) optimization algorithms are used to optimize the ELM prediction model of the height of FWCZ, and the prediction results of the three models are compared.
Study area
Xinjian Coal Mine is situated in the south of Changzhi City, Shanxi Province, China, covering an area of about 4.41 km2. The elevation is approximately 1039 to 1270 m, and the landform in the study area is classified as low and middle mountain area. It has a warm temperate continental monsoon climate with a mean annual precipitation of 532.3 mm (Figure 1).
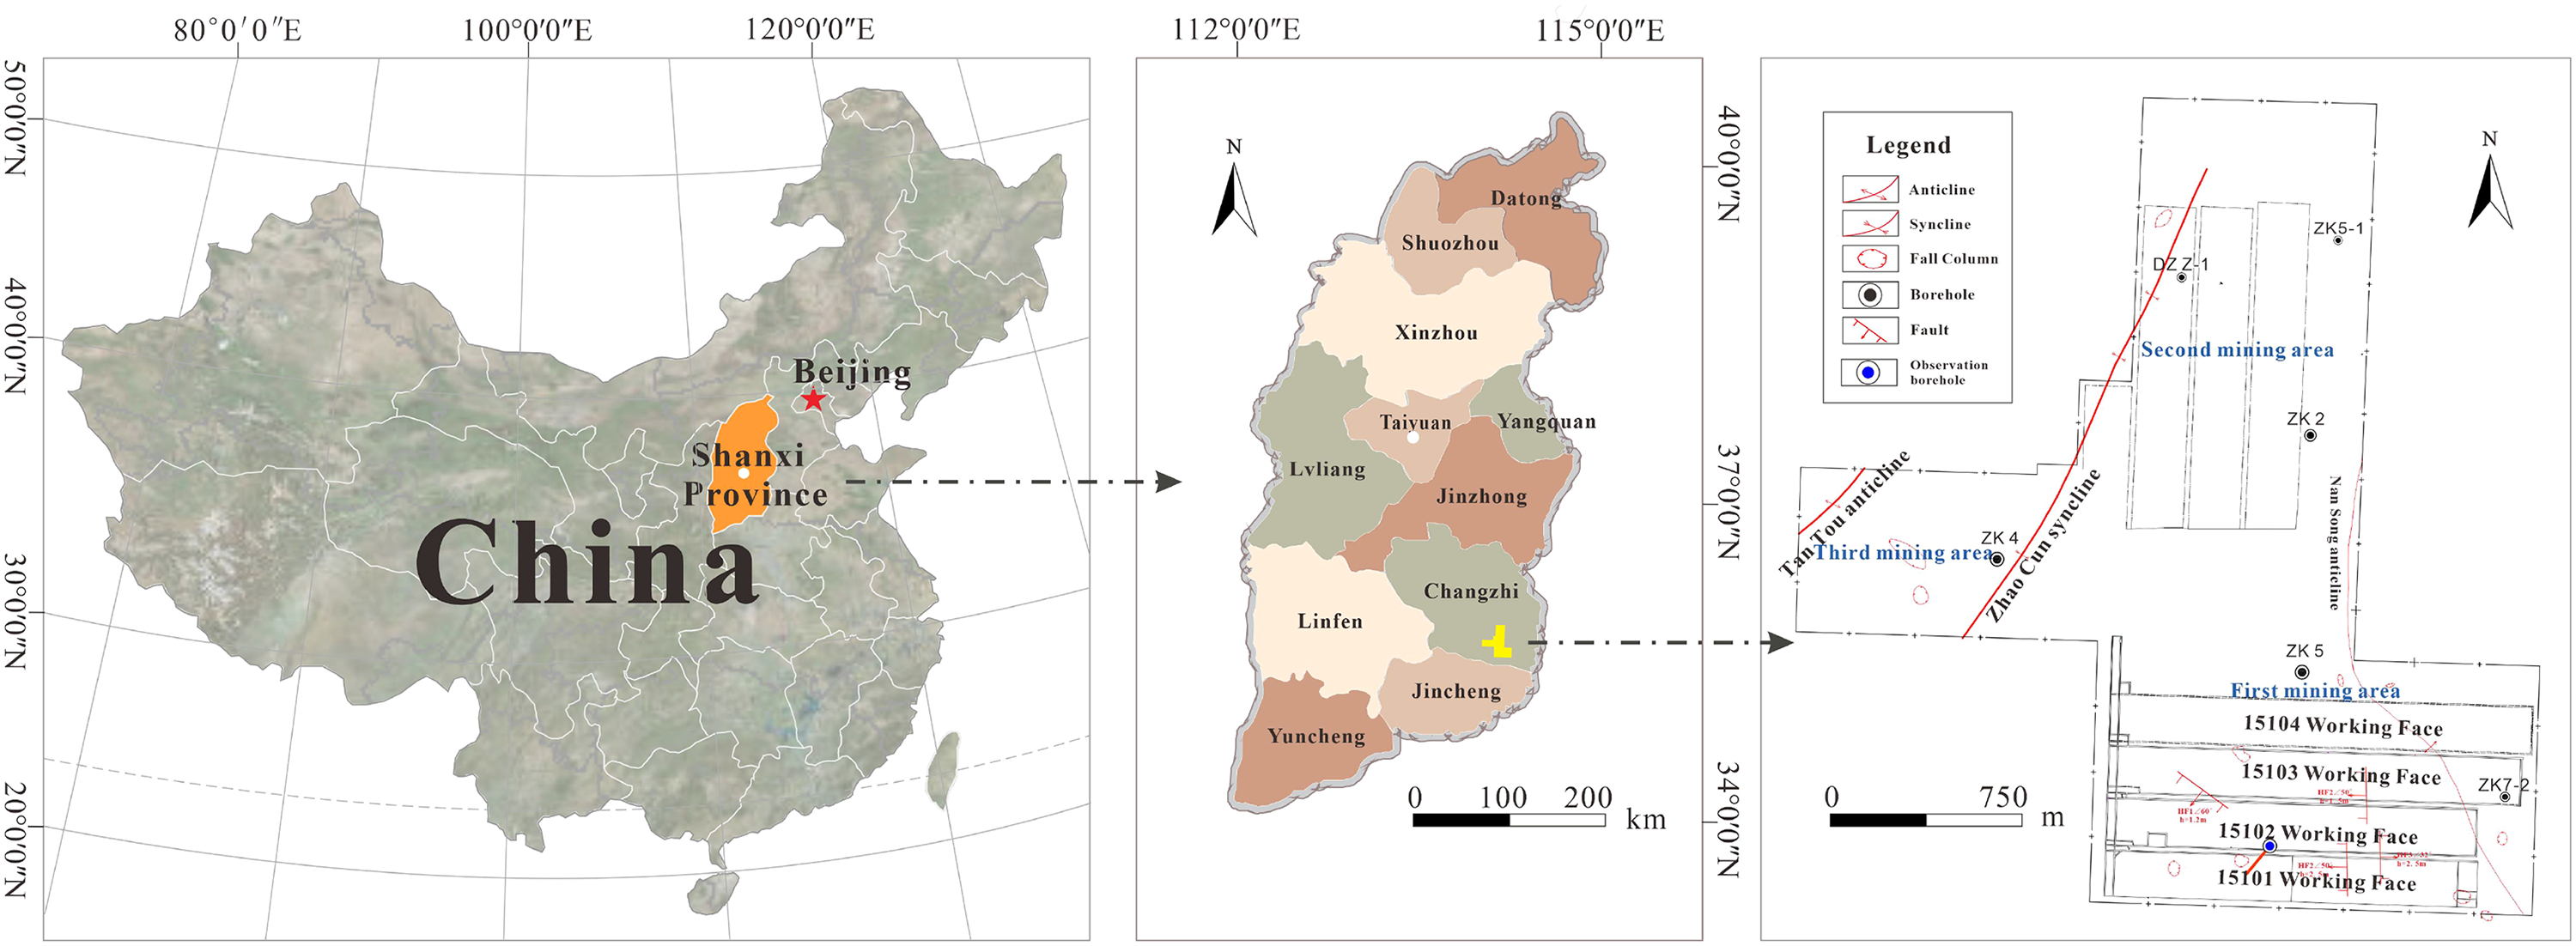
Overview of the study area (Using CorelDRAW 2019; Powered by “Alludo”, www.coreldraw.com).
The Upper Shihezi Formation strata of Upper Permian are exposed in a large area of the surface, and locally exposed strata are middle and upper Pleistocene strata of the Quaternary system. The main strata include: Majiagou and Fengfeng Formation of Middle Ordovician, Benxi and Taiyuan Formation of Carboniferous System, Shanxi and Shihezi Formation of Permian and Quaternary upper Pleistocene.
Aquifers in the mine area can be divided into five groups according to the type of aquifer media and void: loose rock pore aquifer group of Quaternary; sandstone fractured aquifer group of Shihezi Formation; sandstone fractured aquifer group of Shanxi Formation; limestone and sandstone fractured aquifer group of Taiyuan Formation; and karst fissure aquifer group of Middle Ordovician.
In the mining area, a total of 12 coal layers were deposited in Carboniferous and Permian period. Among them No. 3 and No. 15 coal seams are stable and minable in the whole area. The structure of No.15 coal seam is simple with an average thickness of 4.67 m and an average dip angle of 4°. The lithology of the No. 15 coal roof is generally limestone and the lithology of the floor is generally mudstone (Figure 2).
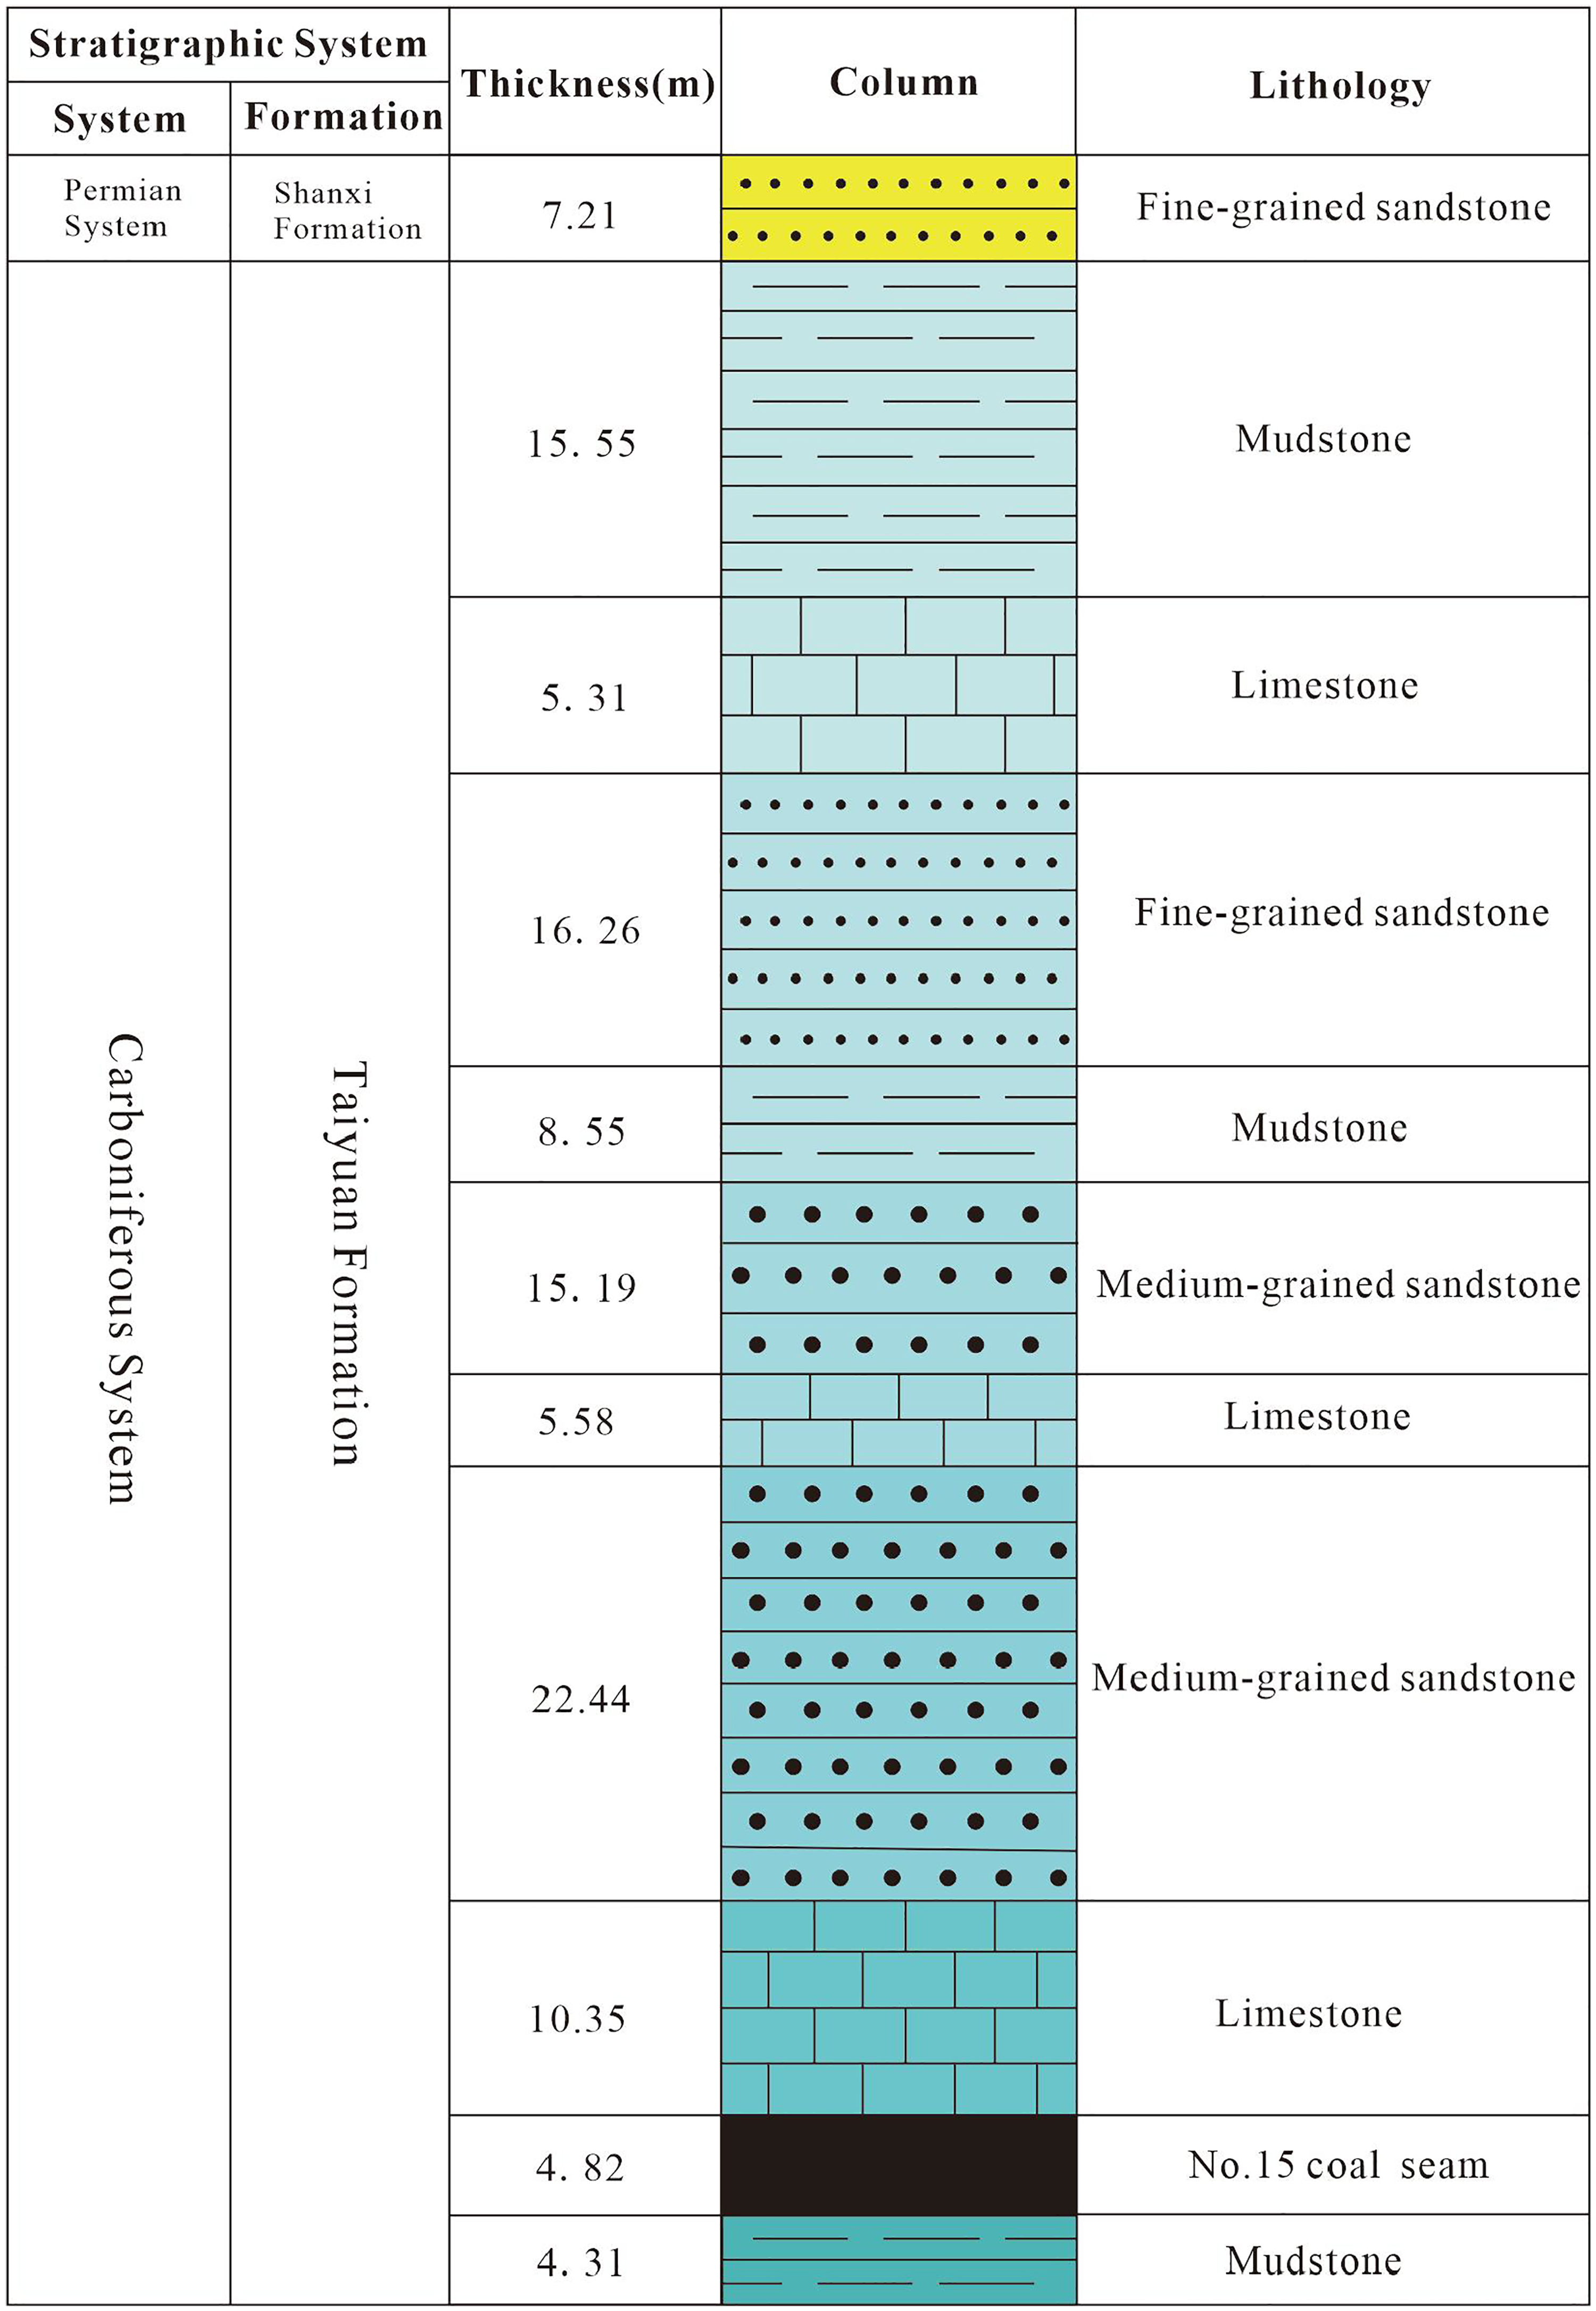
Comprehensive stratigraphic histogram of study area.
The overall tectonics in this area is a set of wide and gentle folds in the north-east direction with a stratigraphic dip of 6° to 15°. At present, 11 faults with an average drop of 8.8 m and 8 collapse columns have been exposed, and no magmatic intrusions have been found.
Neural network prediction model
Extreme learning machine
ELM is a single hidden layer feed forward neural network proposed by Huang guangbin in 2011(Huang et al., 2011). It differs from the traditional BPNN in which the connection weights of the input and hidden layers and the threshold of the implicit layer can be set randomly. Once the parameters are set, there is no need to adjust the weight and threshold repeatedly like BPNN. Instead, it can be determined all at once by solving the equations. Experimental validation shows that the ELM is faster and more generalized with guaranteed the learning accuracy (An et al., 2022; Cao et al., 2021). The structure diagram of ELM is shown in Figure 3.
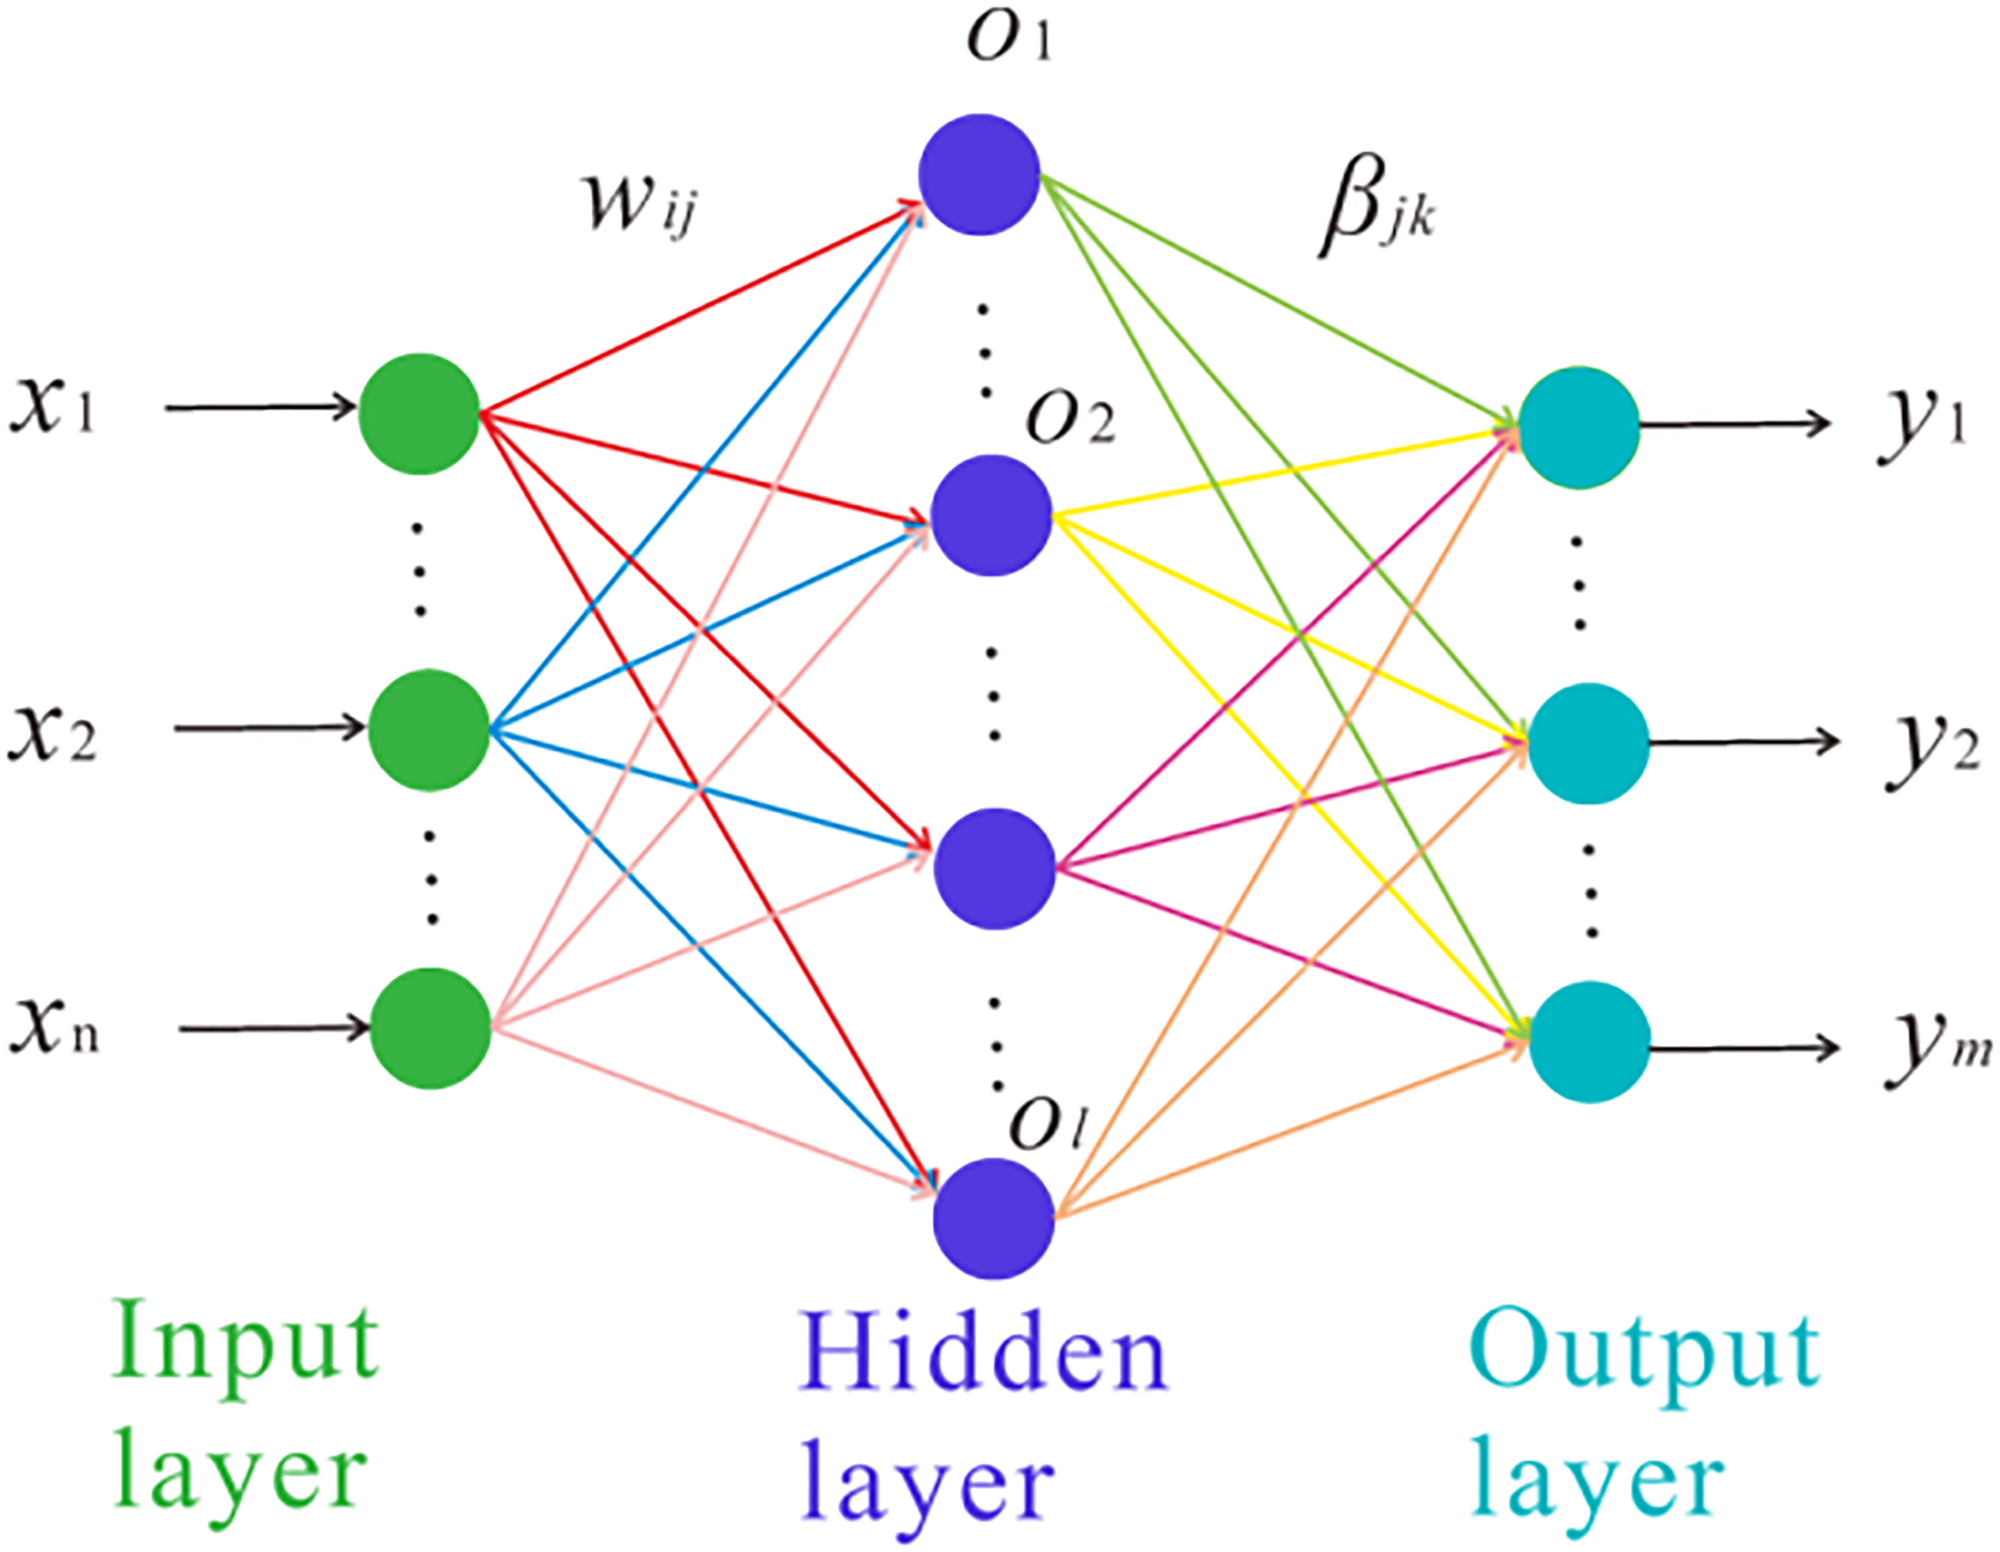
ELM structure. ELM: extreme learning machine.
The algorithm of ELM mainly includes the following steps:
Determine the number of neurons in the hidden layer, and then randomly set the connection weights w of the input layer and the bias of hidden layer neurons b; Select an infinitely differentiable function as the activation function of hidden layer neurons, and then calculate the hidden layer output matrix H; Calculate the output layer weights
Optimization algorithm
Compared with the traditional single hidden layer feed forward neural network, ELM has many obvious advantages. However, as the initial weights and thresholds of ELM are randomly generated, the generated hidden layer nodes are more likely to be invalid. Thus, when higher accuracy of the model is required, more hidden layer nodes need to be added. Therefore, the randomness of ELM has a great impact on its generalization and prediction accuracy, and its stability is reduced (Fan et al., 2014; Lai et al., 2021; Mirjalili et al., 2014; Pradhan et al., 2016; Yan et al., 2021).
To solve these problems, swarm intelligence optimization algorithms are used to optimize the initial weight and the threshold of ELM. Swarm intelligence optimization algorithm mainly simulates the group behavior of insects, herds, birds, fish, and so on. These groups look for food in a cooperative way. Each member of the groups constantly changes the search direction by learning its own experience and the experience of other members. Any algorithm or distributed problem-solving strategy inspired by insect groups or other animal social behavior mechanisms belongs to swarm intelligence. In this article, the ELM prediction model is optimized by the GOA, WOA, and SOA, respectively. A brief description of the algorithms is presented in the following paragraphs.
Gray-wolf optimization algorithm
GOA is a swarm intelligence optimization algorithm with advantages of strong convergence performance, few parameters and easy implementation, and it was first proposed by Mirjalili et al. (2014). There is a strict hierarchy within the gray wolves (Pradhan et al., 2016, 2017), as shown in Figure 4. In the mathematical model, α, β, δ, and ω are the optimal solution, the second-best solution, the third-best solution and the other solutions, respectively (Chen et al., 2019).
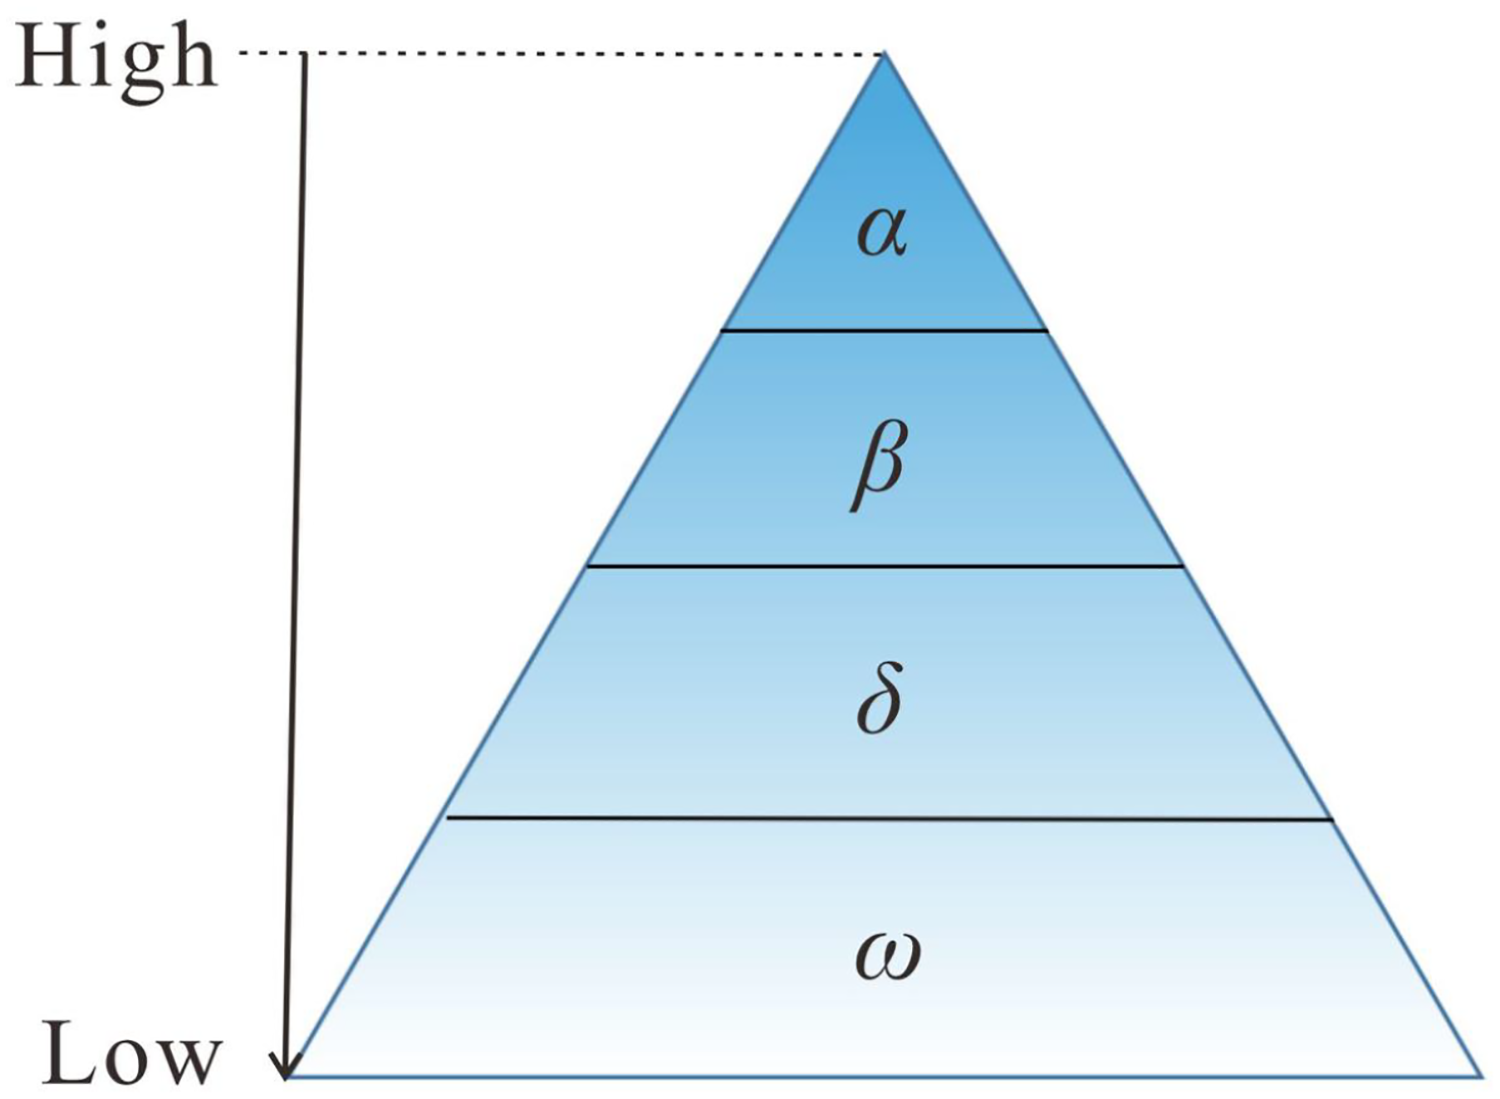
Hierarchy of the gray wolf (Mirjalili et al., 2014).
GOA includes the following steps (Figure 5):
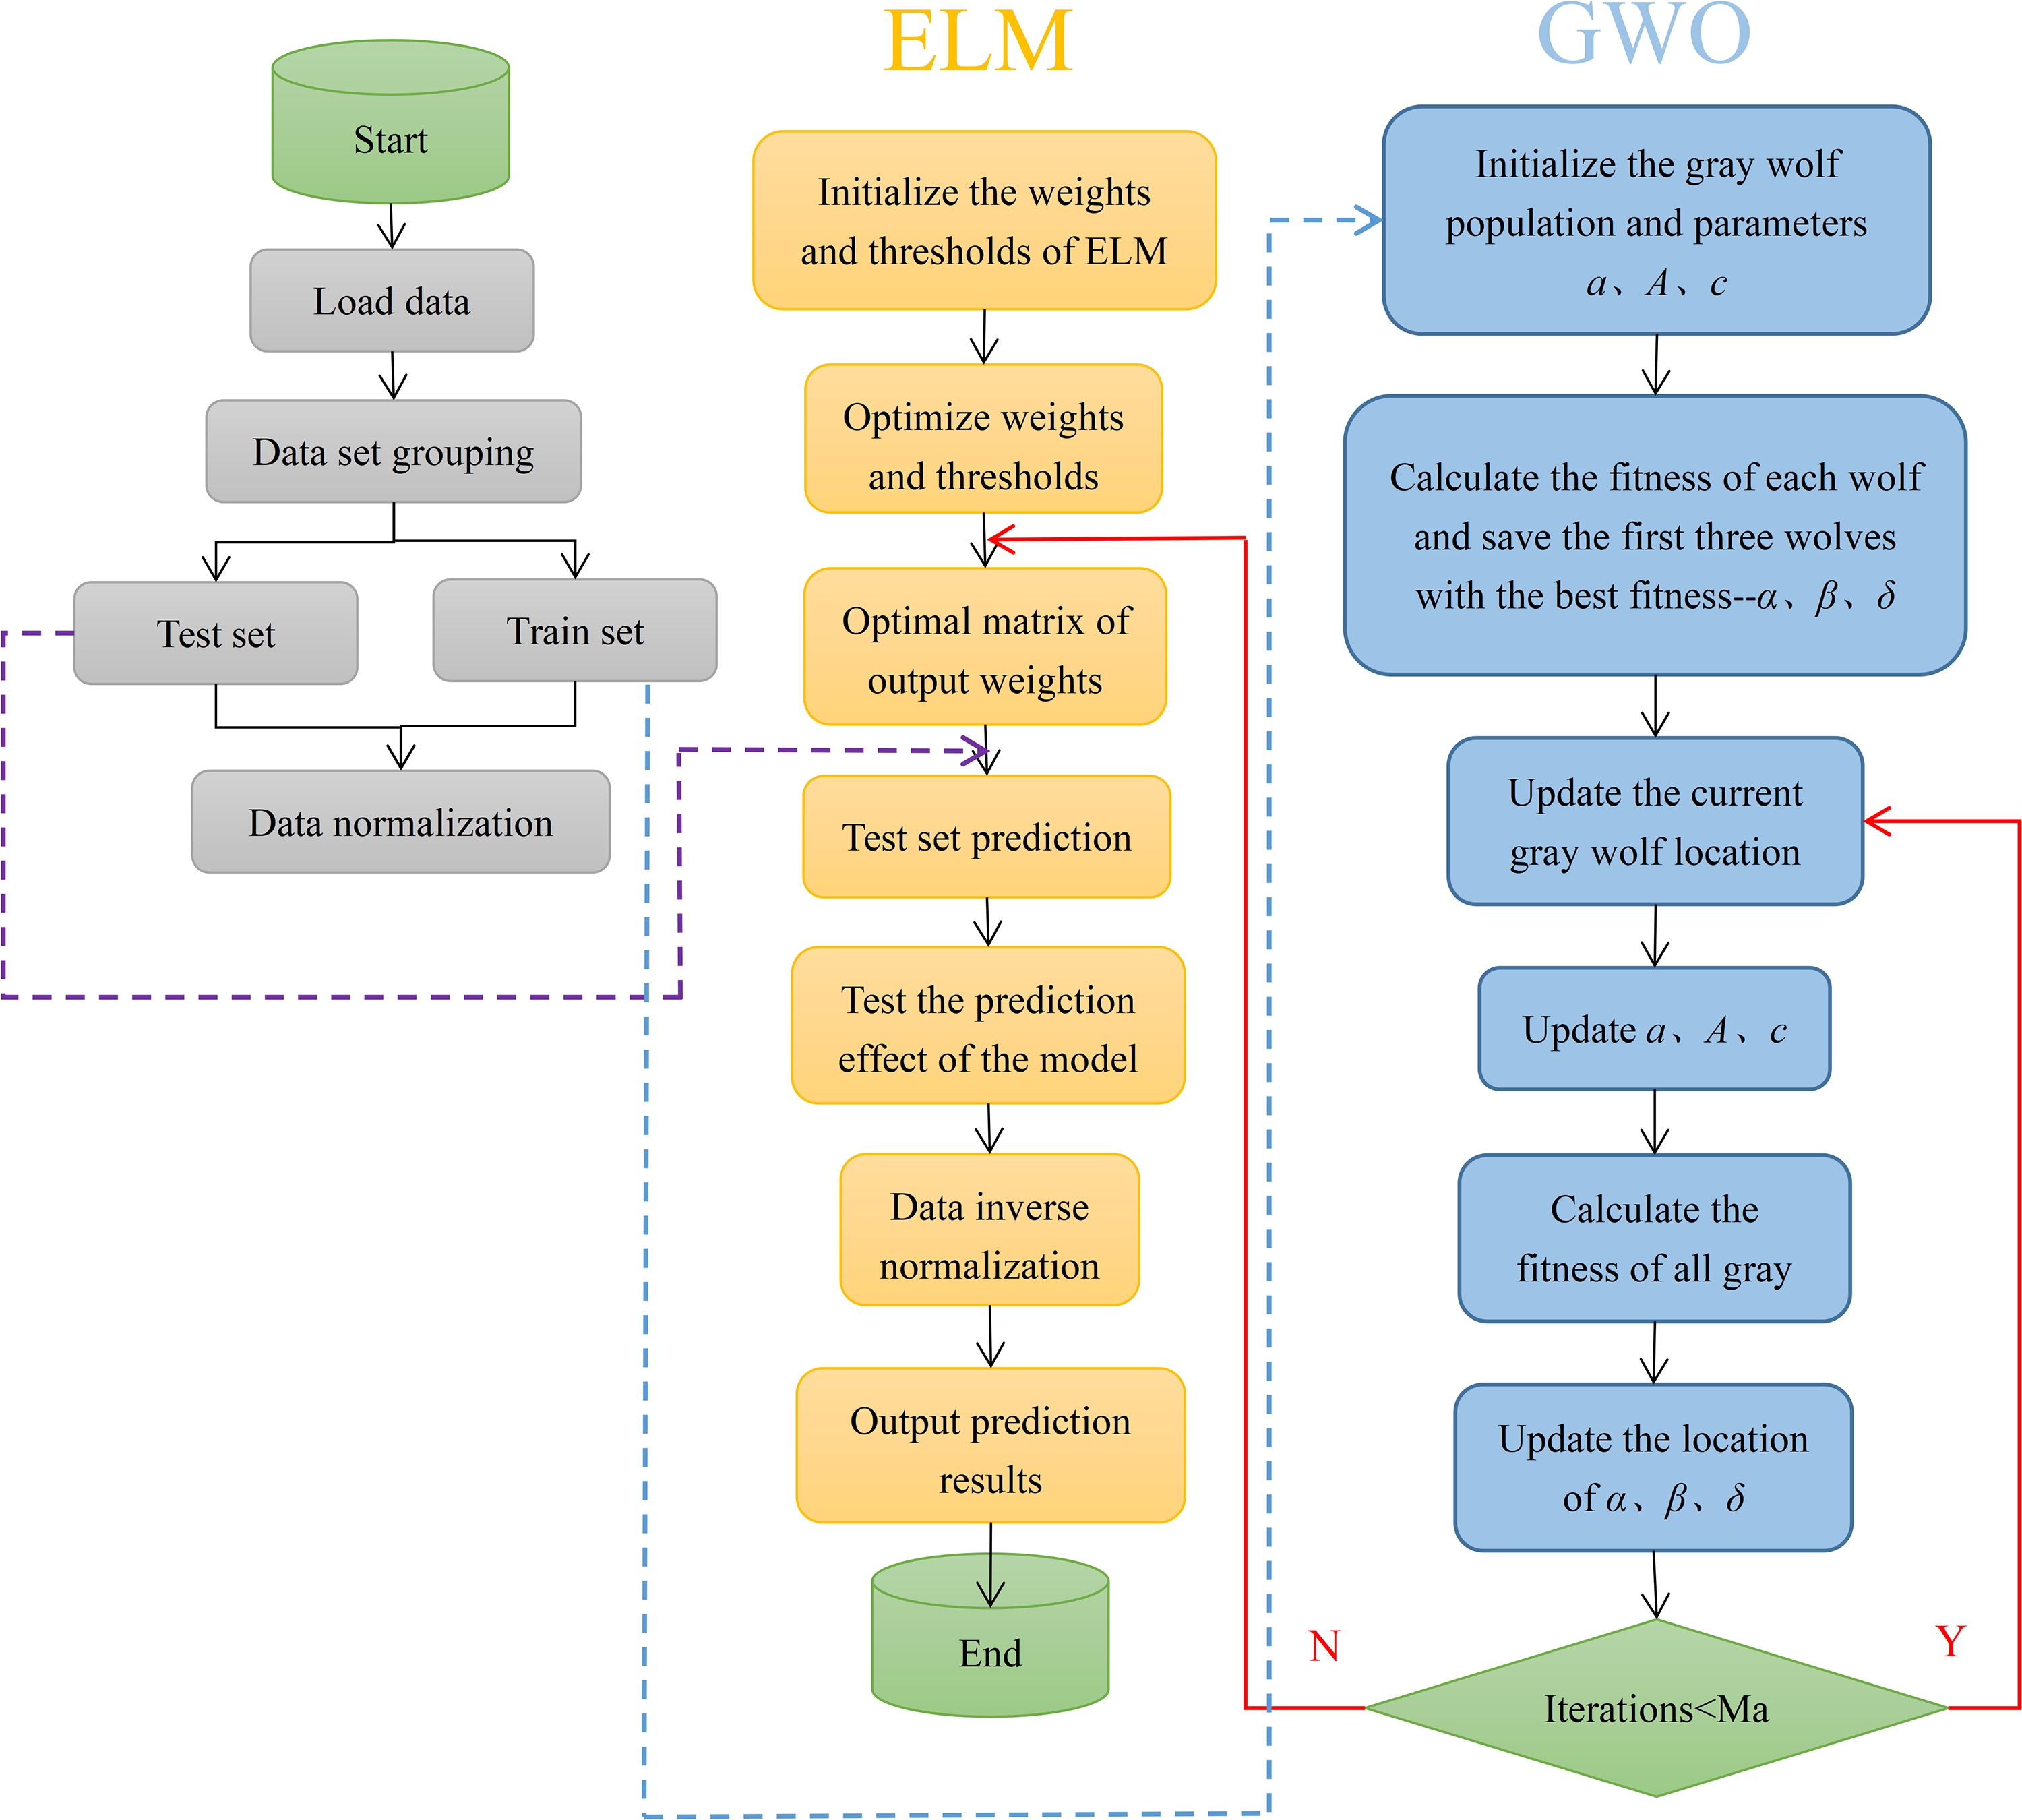
The algorithm flow chart of GOA-ELM. ELM: extreme learning machine; GOA: gray-wolf optimization algorithm.
(1) Social hierarchy
The three gray wolves with the best fitness are identified in the search space and labeled α, β, and δ in this order, while the remaining gray wolves are labeled ω (Zhang et al., 2020).
(2) Encircling prey
The mathematical model of the behavior of the gray wolf, which gradually approaches its prey and surrounds it when it lets go of its prey, is as follows:


(3) Hunting
The mathematical model of this behavior, which updates the locations of other searching wolves based on the location information of α, β, and δ, is represented as follows:


where Xα, Xβ, and Xδ are the position vectors of α, β, and δ in the current population, respectively; X denotes the position vector of gray wolves; Dα, Dβ and Dδ are the distances between the current candidate gray wolves and the optimal three wolves, respectively.
(4) Attacking prey
When |A| < 1, the wolves attack the prey (fall into local optimum).
(5) Search for prey
When |A| > 1, gray wolfs are separated from its prey (local optimum), and try to find a more suitable prey (global optimum). Another search coefficient in GWO algorithm is C, and this coefficient provides random weight for prey.
Whale optimization algorithm
WOA is a new swarm intelligence optimization algorithm proposed by Mirjalili and Lewis (2016) and it simulates the unique hunting method of humpback whales (Hof and Van der Gucht, 2007).
WOA includes the following steps (Figure 6):
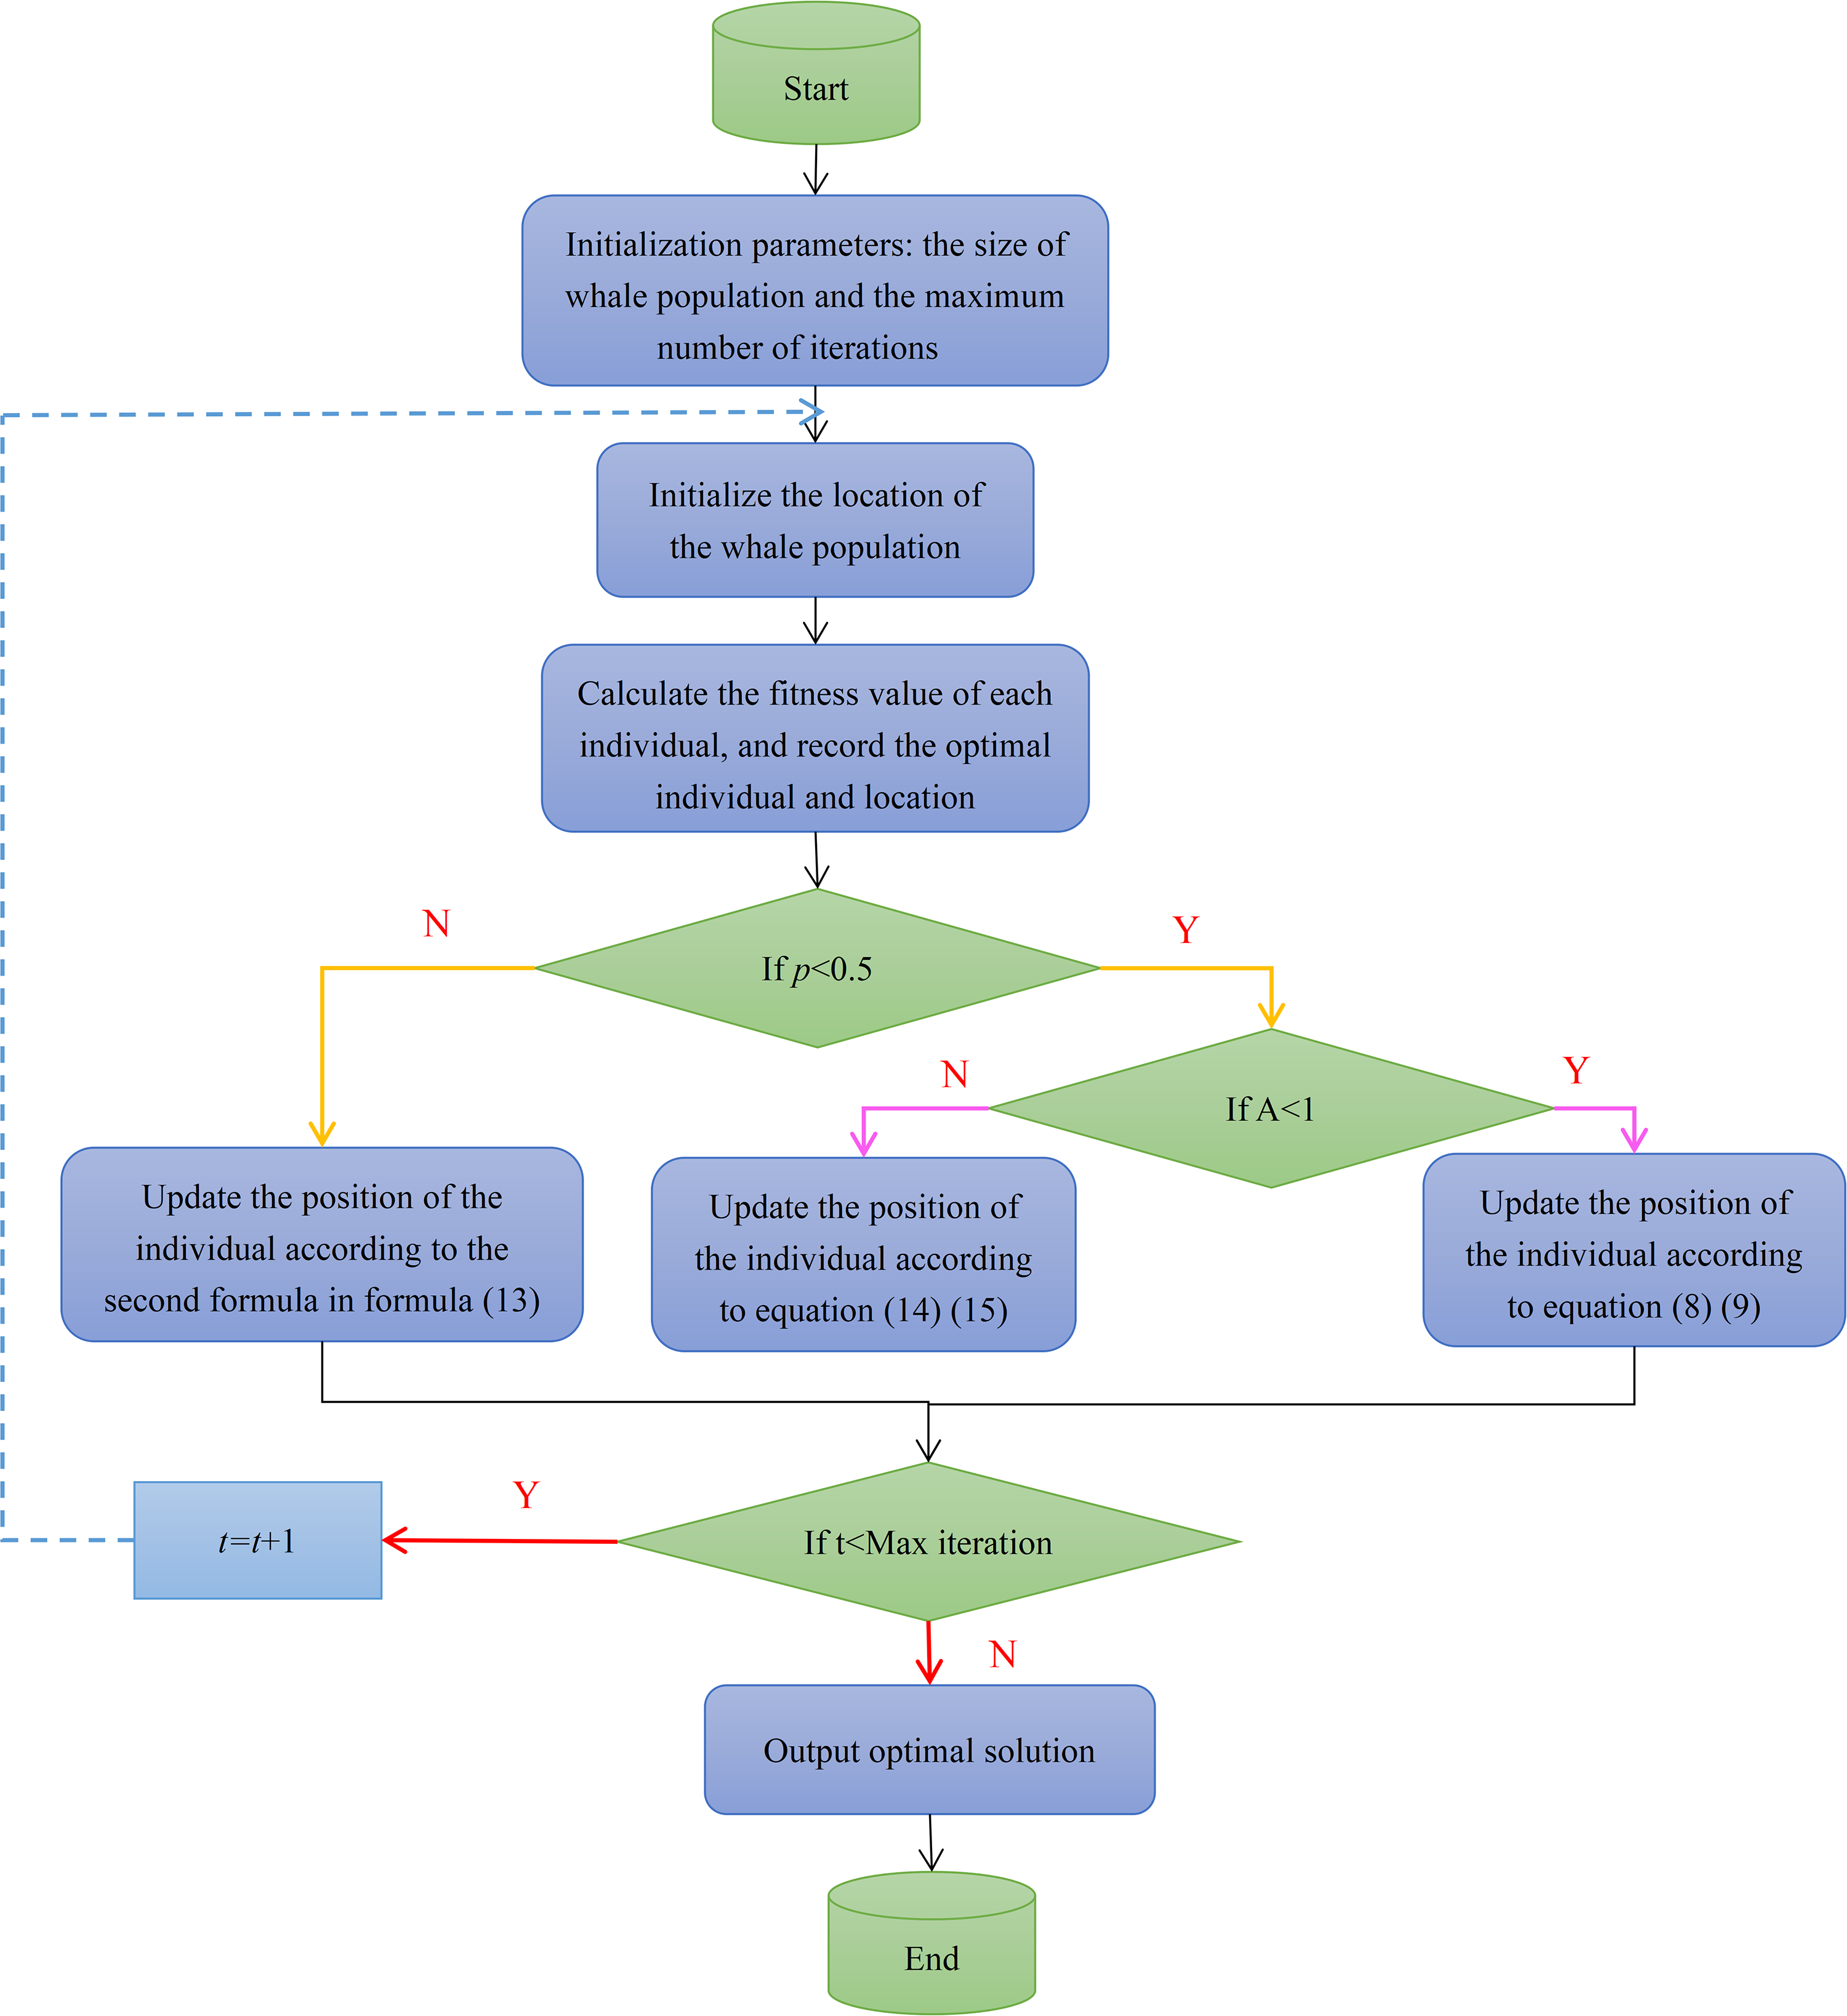
The algorithm flow chart of WOA-ELM. ELM: extreme learning machine; WOA: whale optimization algorithm
(1) Encircling prey
At the beginning of humpback whale feeding (Geng et al., 2022), the WOA assumes that the best candidate solution in the current search space is the location of the prey, or close to the prey location, and can update the search location of other individuals based on the location of the current optimal solution (Zhao et al., 2021; Watkins and Schevill., 1979) , a behavior that can be expressed by equations (8) and (9).


where t is the current iteration, A and C the coefficient vectors, X* the position vector of the current optimal solution, and X the position vector of the current solution. If a better feasible solution is found in the next stage, X* needs to be updated, and A and C are obtained from equations (10) and (11).


(2) Bubble-net attacking method
This step includes shrinking encircling mechanism and spiral updating position, firstly reducing the value of a in equation (10), and then creating a spiral equation.

The expression of the updated whale position is as follows:

(3) Search for prey
When |A| > 1, the WOA does not update itself with the optimal individual as a reference, but randomly searches for an individual as a target for position update. This behavior is expressed as follows:


Salp optimization algorithm
In the GOA and WOA, as the authority of the leader attracts all individuals to follow, the ability of individuals to search in other directions will be greatly restricted. Therefore, if the leader's search is not sufficient in the early stage, it will result in the leader falling into the local extremum, as will inevitability cause the calculation errors in the later stage (Chen et al., 2018).
In 2017, Seyedali Mirjalili et al. (2017) established a mathematical model of SOA based on the group behavior characteristic of salp (Figure 7).
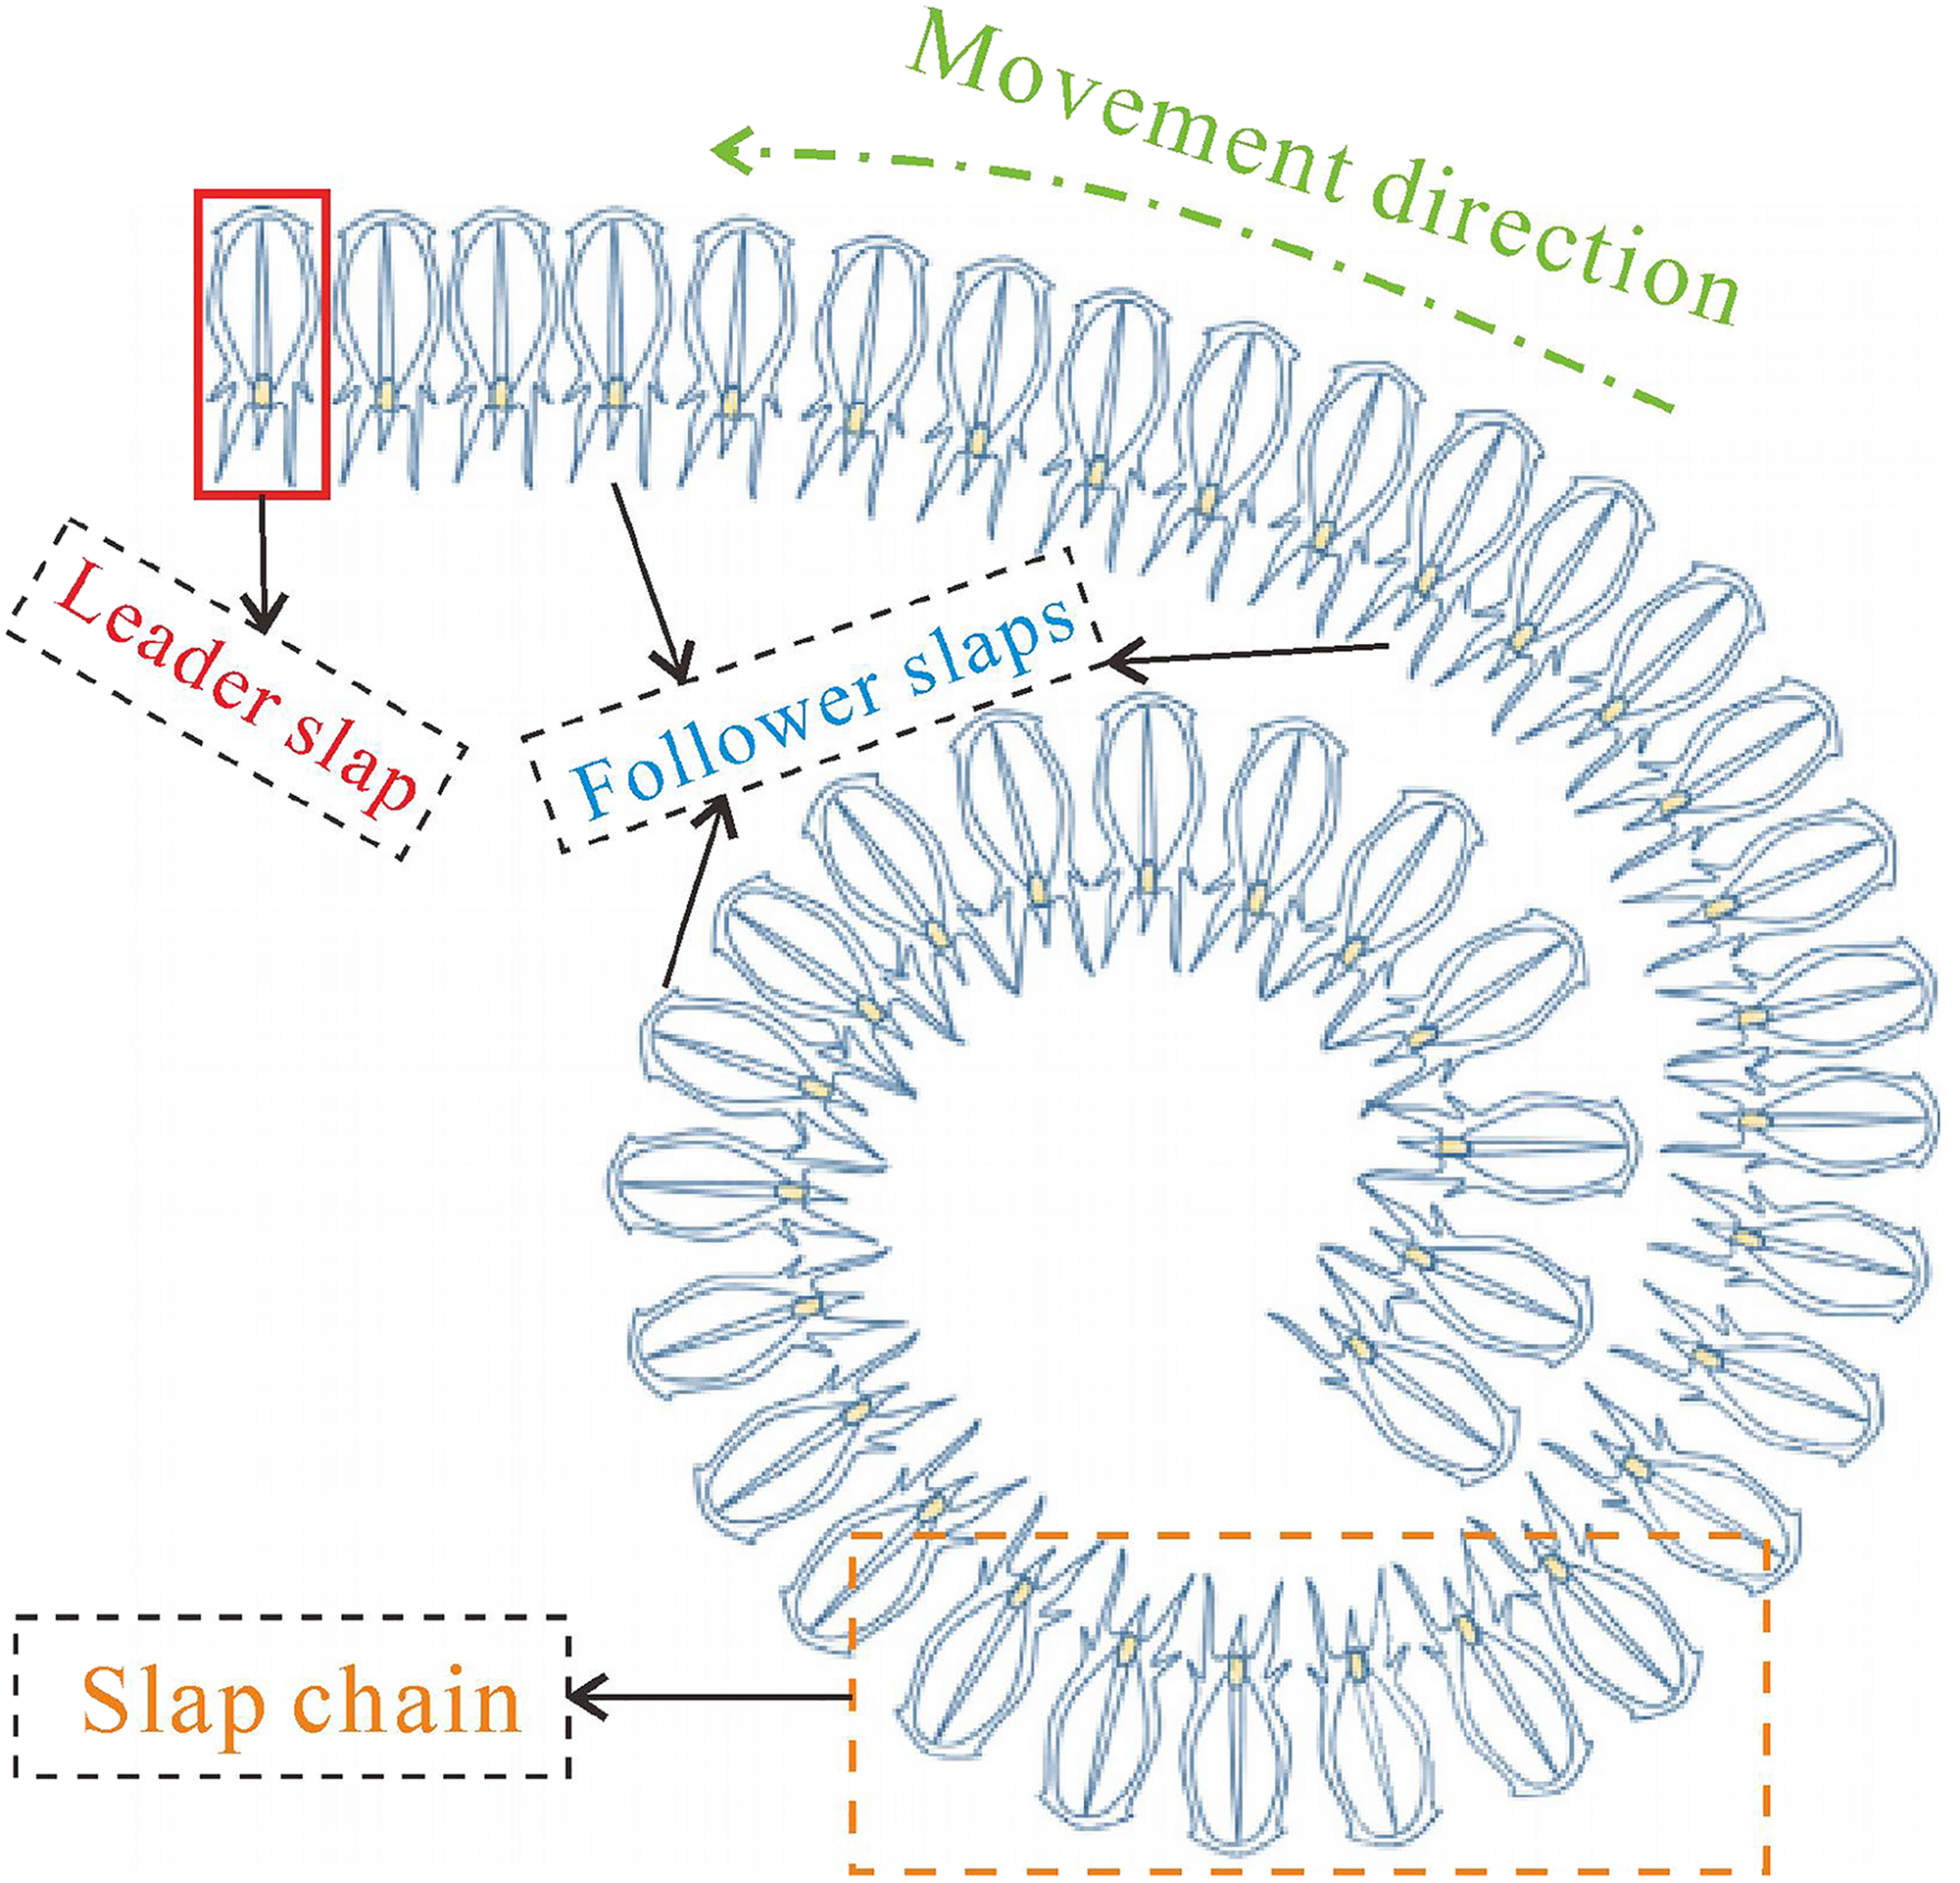
Leader and followers in the salp chain.
In the process of movement and foraging, the followers do not move randomly, but move sequentially in a “chain” pattern (Anderson and Bone, 1980) (Figure 8). Such a movement pattern enables salp leaders to explore globally, while followers to fully explore locally, greatly reducing the probability of falling into local optimization (Kansal and Dhillon, 2020; Wang et al., 2019).
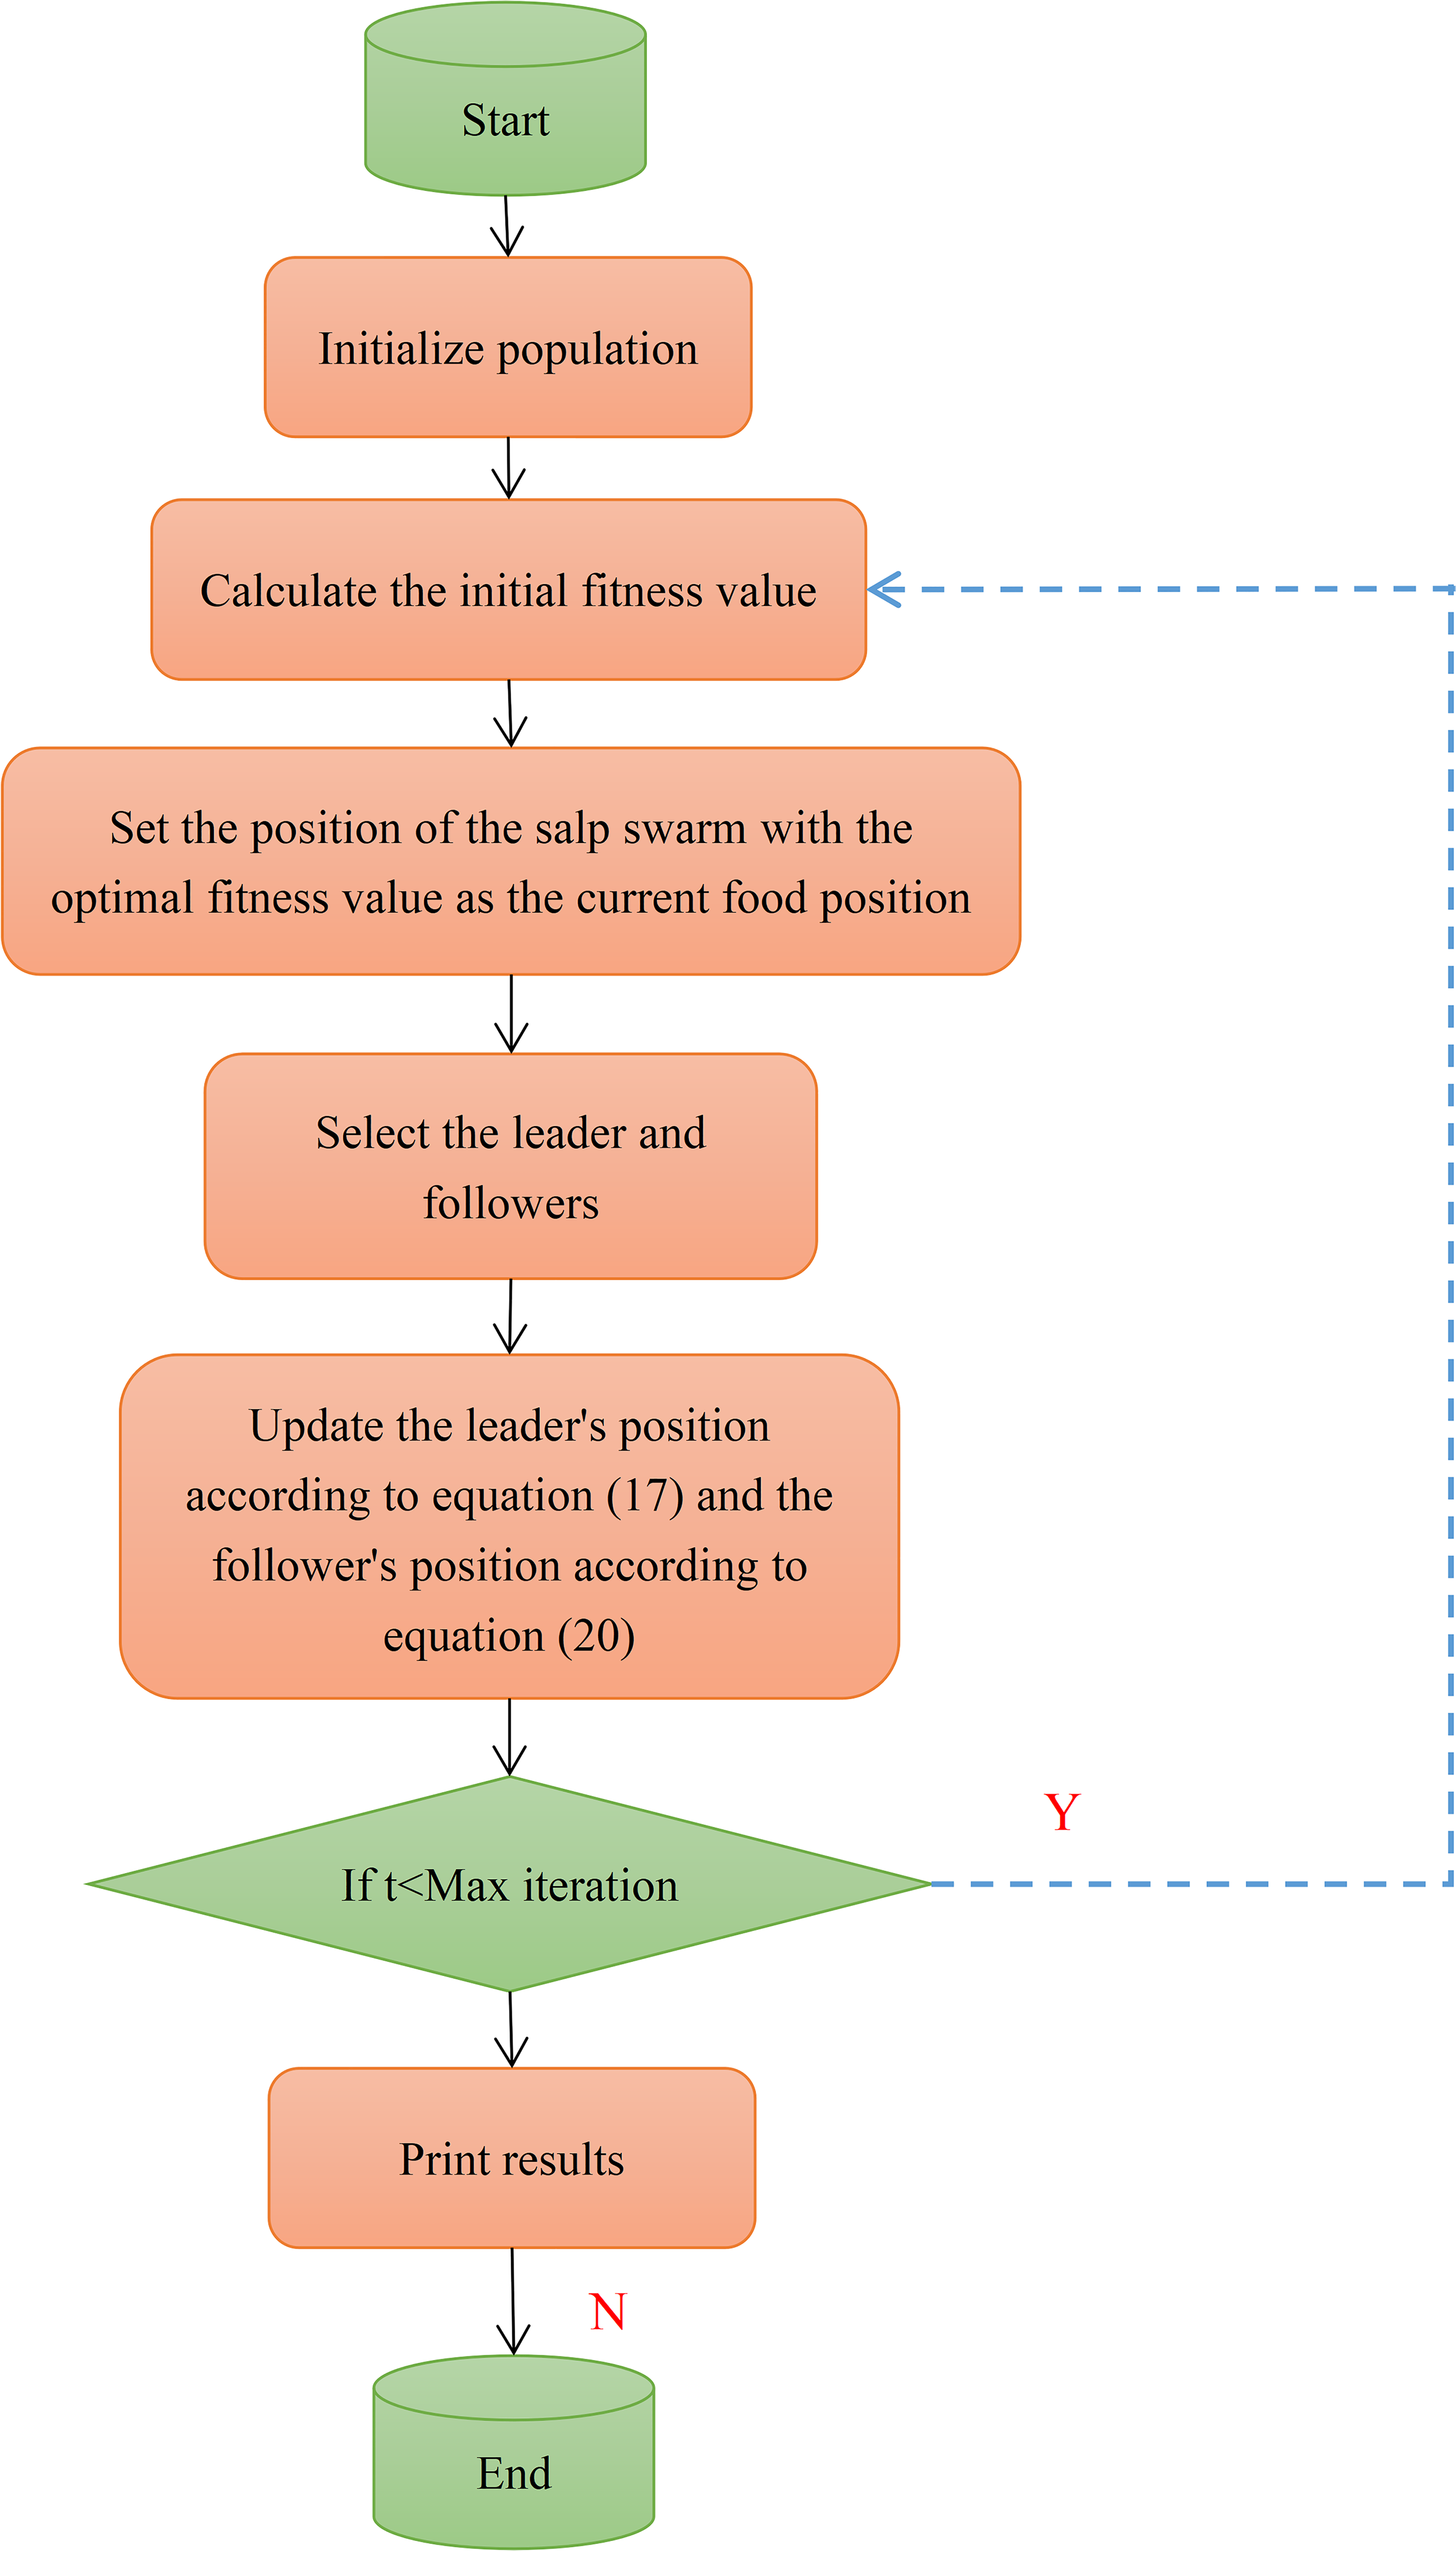
The algorithm flow chart of SOA. SOA: salp optimization algorithm.
SOA includes the following steps (Figure 8):
(1) Population initialization
Let the search range be the space D × N, D be the spatial dimension, and N be the population size. The position of salp in the space is denoted by

(2) Leader position update
In the process of salp chain moving and foraging, the leader's position update is expressed as:

(3) Follower location update
The followers move in a chain-like sequence following each other, and their displacements conform to Newton's laws of motion, so the displacement of the followers’ motion can be expressed as:

Model building and calculation
Model building
The most important influence factors of the height of FWCZ includes: mining depth, mining height, overburden strata structure, working face length, and coal seam dip angle.
Mining depth: With the increase of mining depth, the deformation value of surface movement decreases, the range of surface movement expands, and the velocity of surface movement decreases. Mining height: It is the main factor affecting the overburden and surface movement damage. The greater the mining height, the greater the height of the collapse zone and fracture zone, and the greater the value of surface movement and deformation. Overburden strata structure: The lithological characteristics of the overlying strata are divided into hard–hard, soft–hard, hard–soft, and soft–soft types, which are quantified as 1, 2, 3, and 4, respectively, with the height of FWCZ of hard–hard type is the largest and that of the soft–soft type is the smallest (Wang et al., 2022) . Working face length: Before the coal seam is fully mined, the length of the working face has a great influence on the development of FWCZ, and the height of FWCZ will increase with the excavation of the working face, when the coal seam reaches full mining, the length of the working face basically does not play a role (Wu et al., 2017). Coal seam dip angle: Coal seam dip angle has a great influence on the development process of overburden damage, the distribution form of the damage range, the maximum height, and other main characteristics. The greater the dip angle of the coal seam, the greater the height of FWCZ (Li et al., 2016; Li and Wu, 2019).
Results and discussion
Datasets used
The development of FWCZ is a complex and nonlinear process, influenced by various factors. In general, the maximum development height of FWCZ is determined by the minimum length of the working face; with the increase of mining depth and mining height, the height of FWCZ also tends to increase; and the mining dip angle and overburden strata structure play crucial roles in the development of FWCZ (Zeng et al., 2023) . Thus, we selected five parameters, including mining height, mining depth, coal seam dip angle, working face length, and overburden strata structure, as the primary controlling factors for the prediction model among numerous influencing factors. And 42 sets of sample data of the height of FWCZ are collected (Table 1). Thirty-six sets of data are selected as training samples, and the remaining six sets of data are used as test samples to test the model performance.
Training and testing samples (Zhao and Wu, 2018).
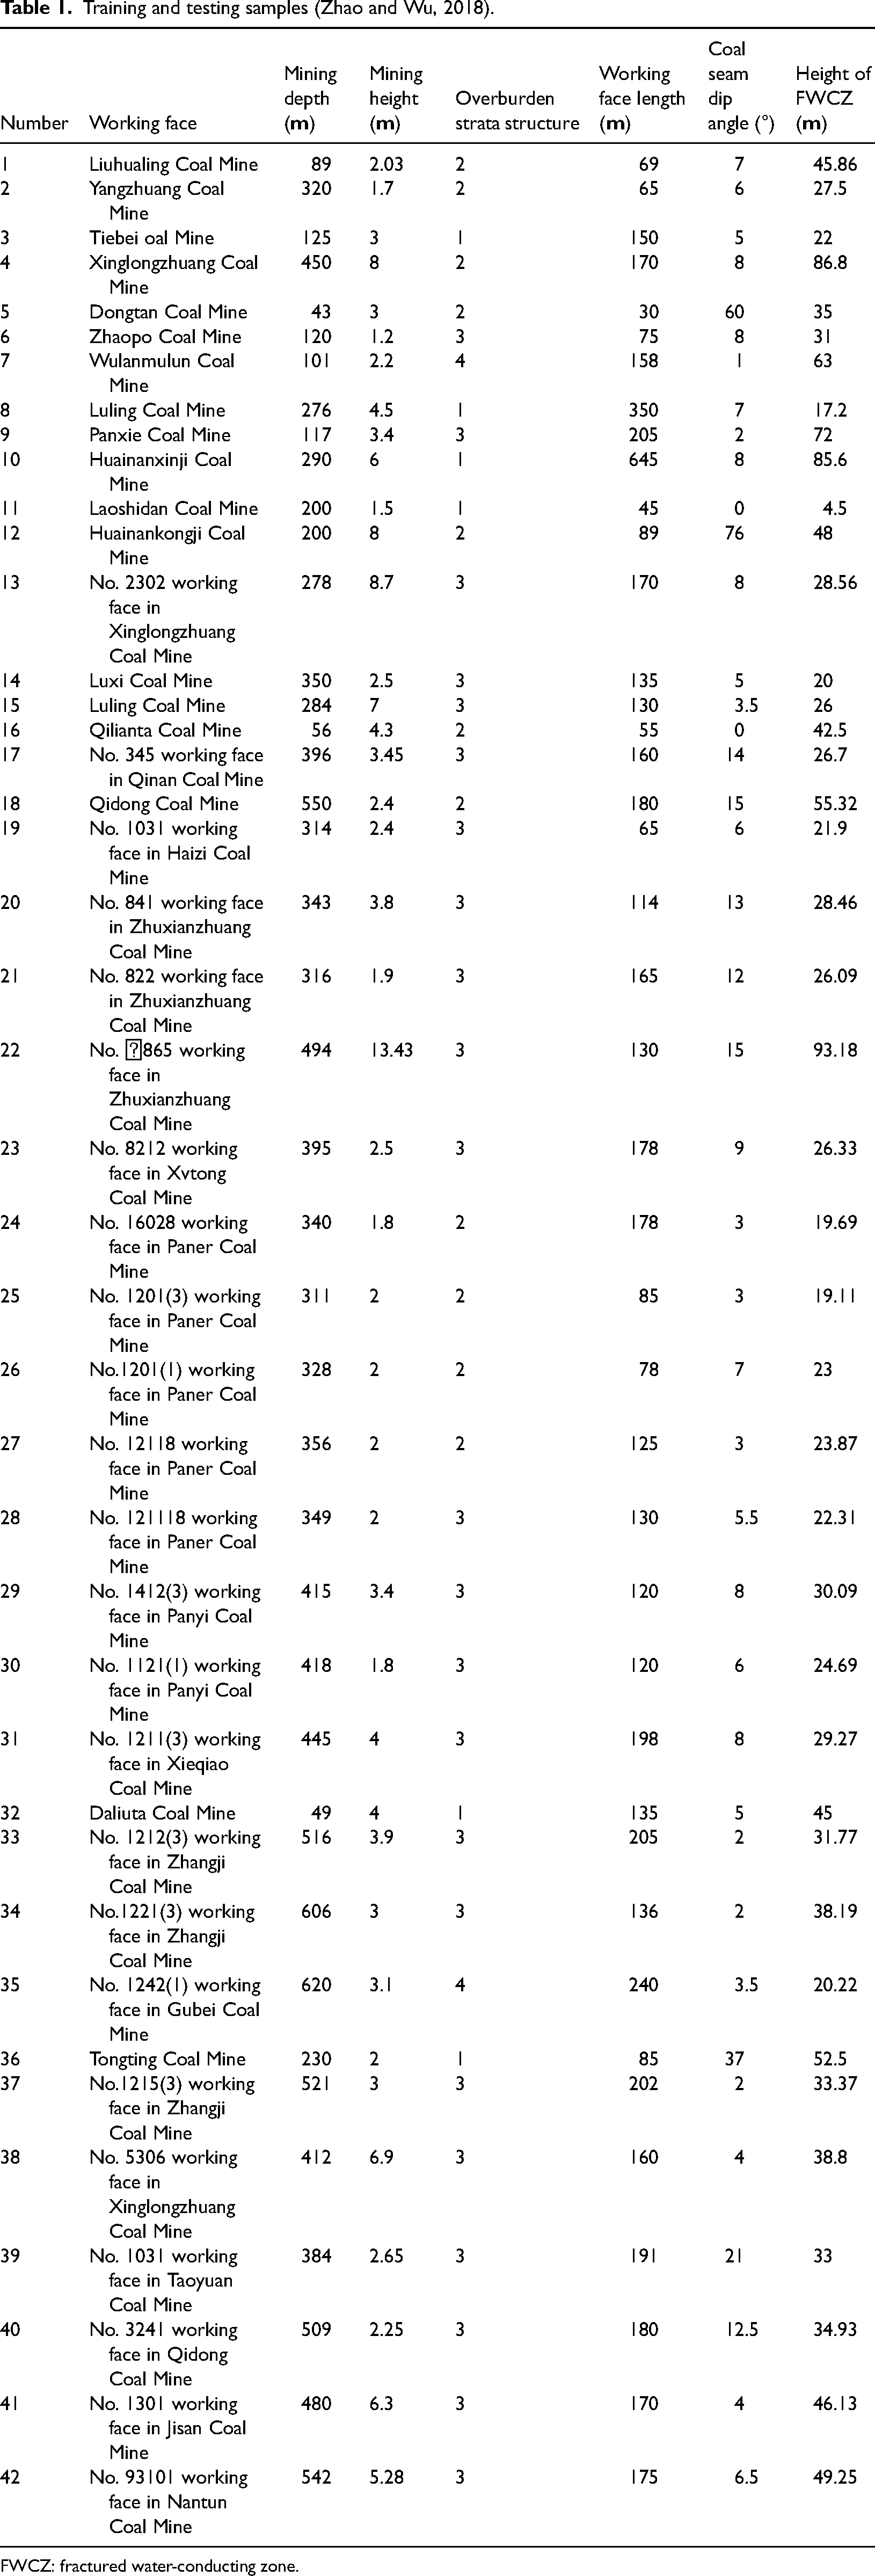
FWCZ: fractured water-conducting zone.
Model training
The maximum number of training iterations for the three models in this article is 50; the training error tolerance is 0.00001; the maximum number of training verification failures is 5. Based on the final parameter settings, the models are trained separately, and the iterative results of the optimized GWO-ELM, WOA-ELM, and SSA-ELM neural networks are shown in Figure 9.
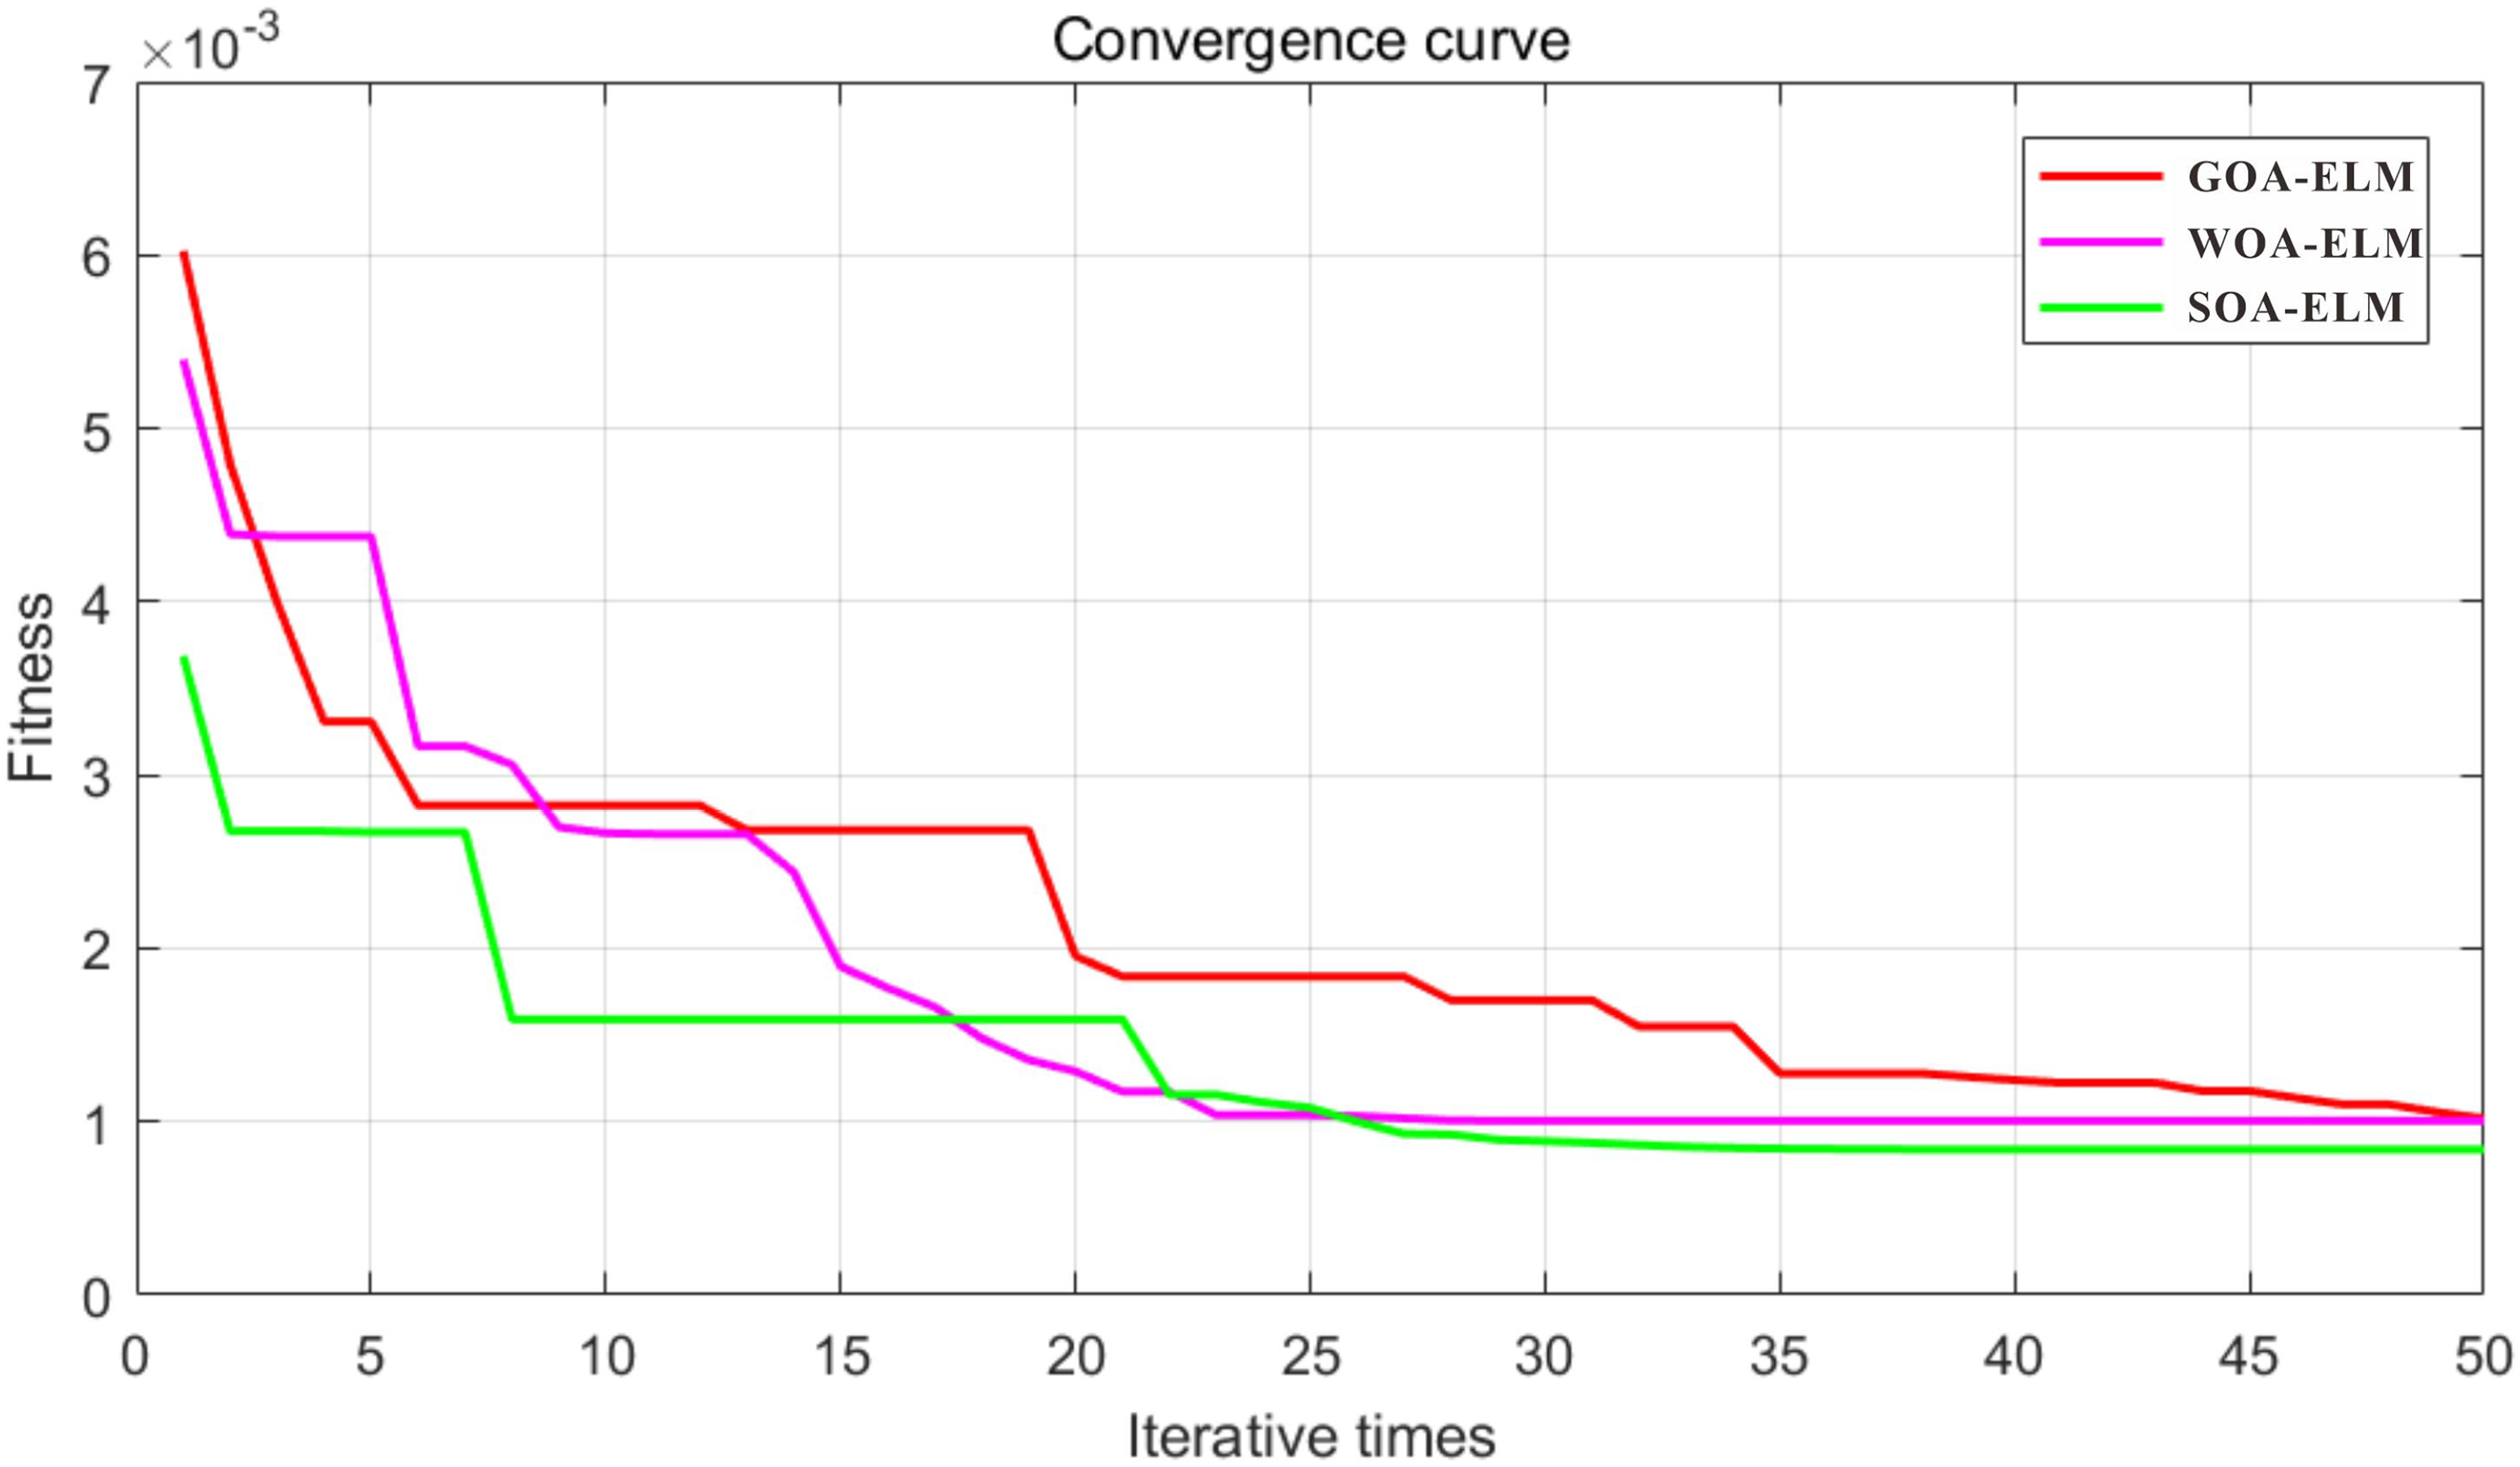
Model iteration results. ELM: extreme learning machine; GOA: gray-wolf optimization algorithm; SOA: salp optimization algorithm; WOA: whale optimization algorithm.
As can be seen from Figure 9, at the beginning of the iteration, GOA and WOA fitness values are larger than SOA; when the number of iterations is up to 10, the fitness value of SOA is the smallest at the same number of generations; after 20 generations, SOA and WOA reach the minimum value first than GOA with a short running time, which further indicates that SOA and WOA are relatively stable; in terms of the final fitness value reached, SOA value is the smallest, WOA is the second, and GOA is the largest. Based on the above analysis, the convergence effect of SOA is better than that of GOA and WOA.
Comparison of three models
No. 37–42 datasets in Table 1 are used as test samples, and the 3 trained networks are operated and tested. Then the prediction results are compared with the field measured data, and the model prediction accuracy are evaluated by the relative and absolute errors. The results are shown in Table 2 and Figures 10 and 11.
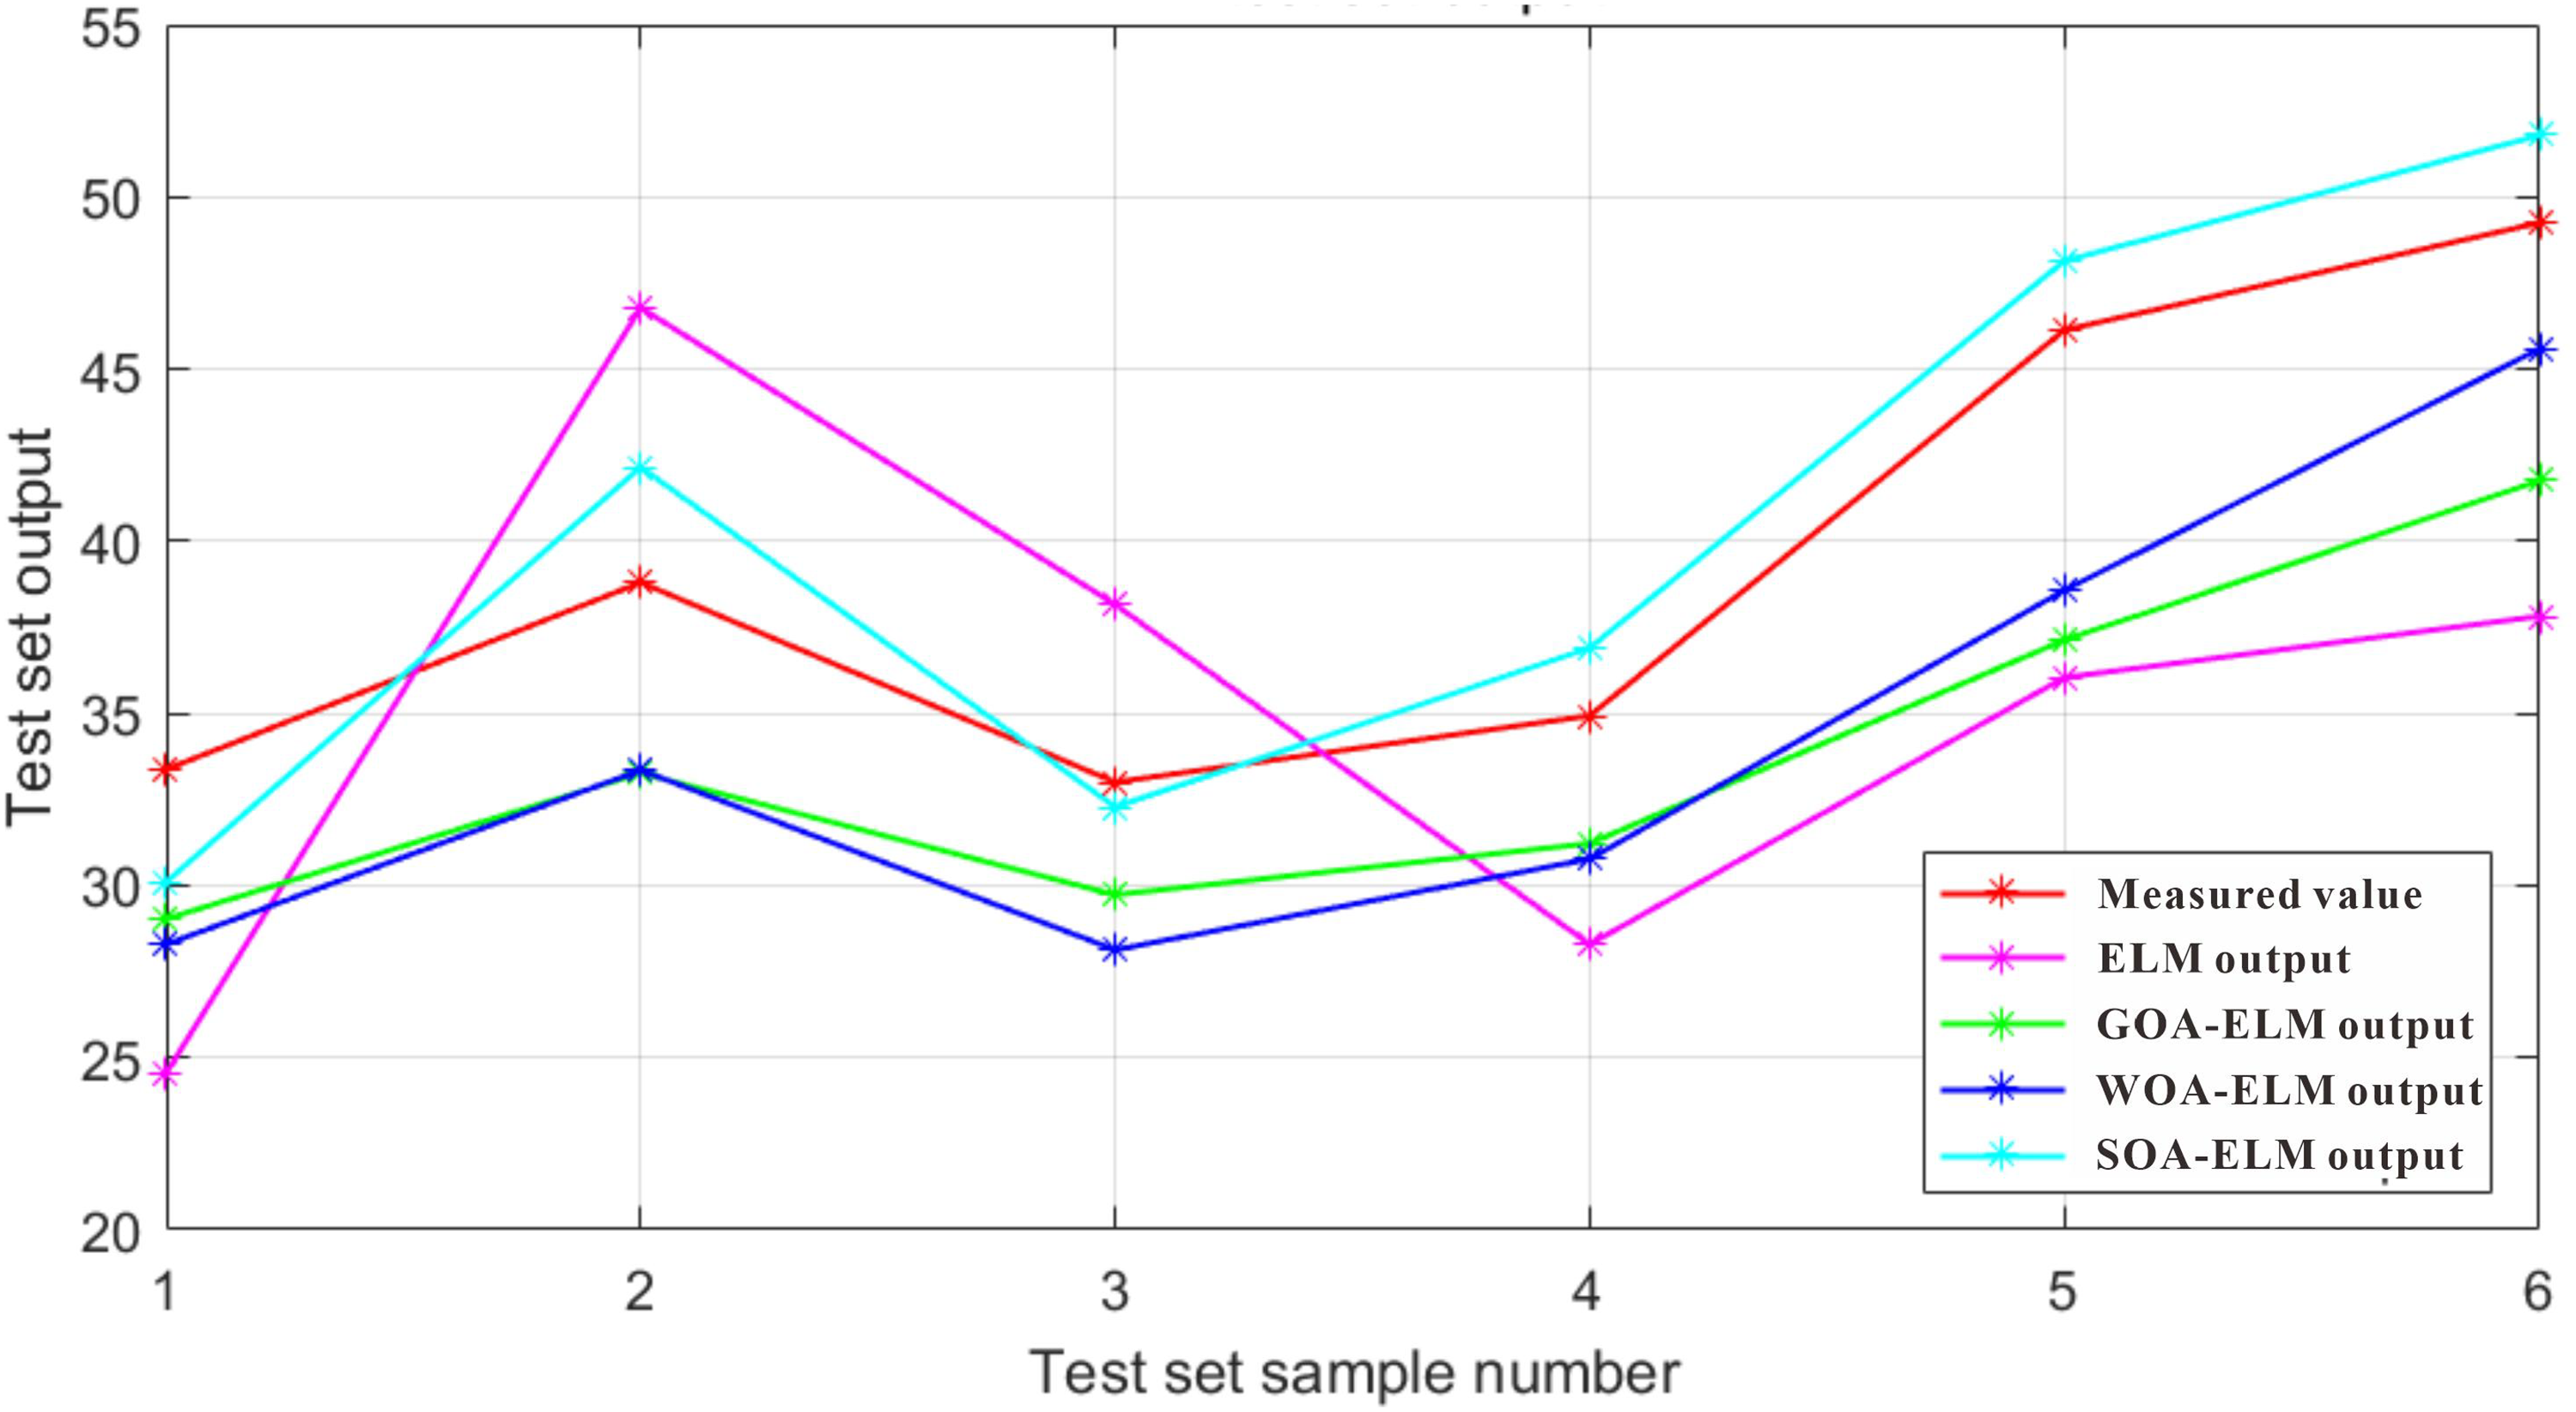
Models test set output. ELM: extreme learning machine; GOA: gray-wolf optimization algorithm; SOA: salp optimization algorithm; WOA: whale optimization algorithm.
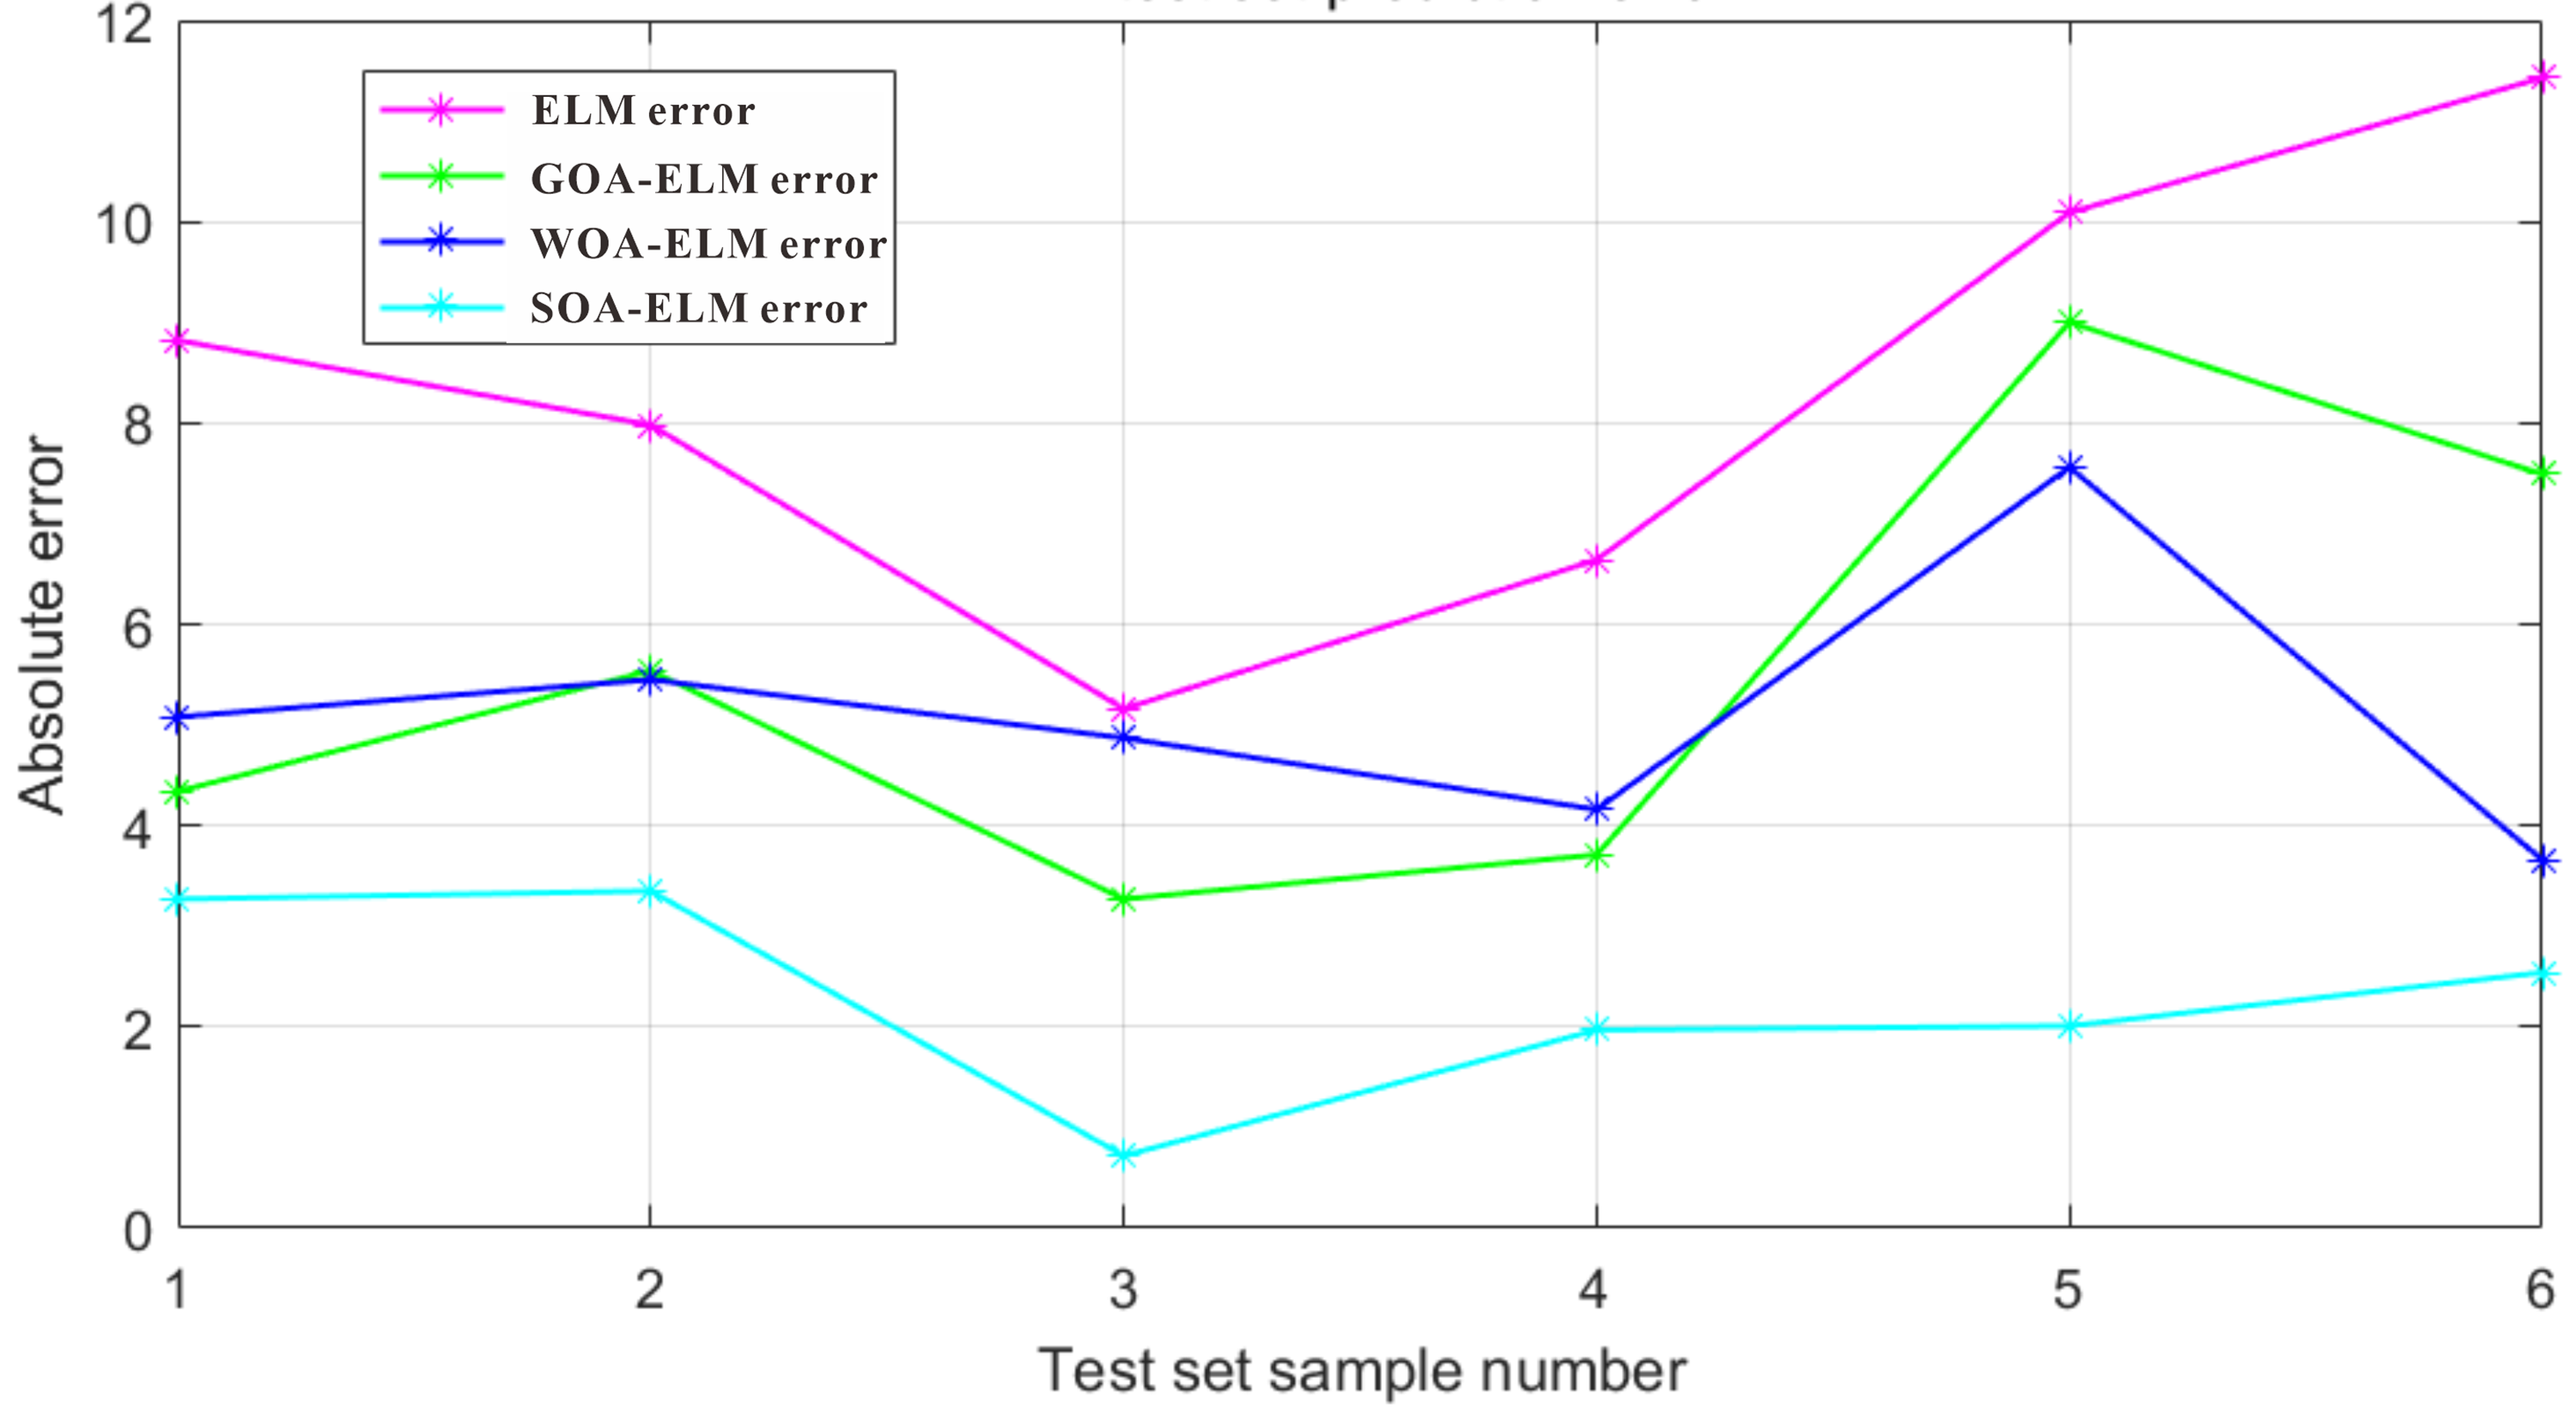
Models test set prediction error. ELM: extreme learning machine; GOA: gray-wolf optimization algorithm; SOA: salp optimization algorithm; WOA: whale optimization algorithm.
Models test set comparison.
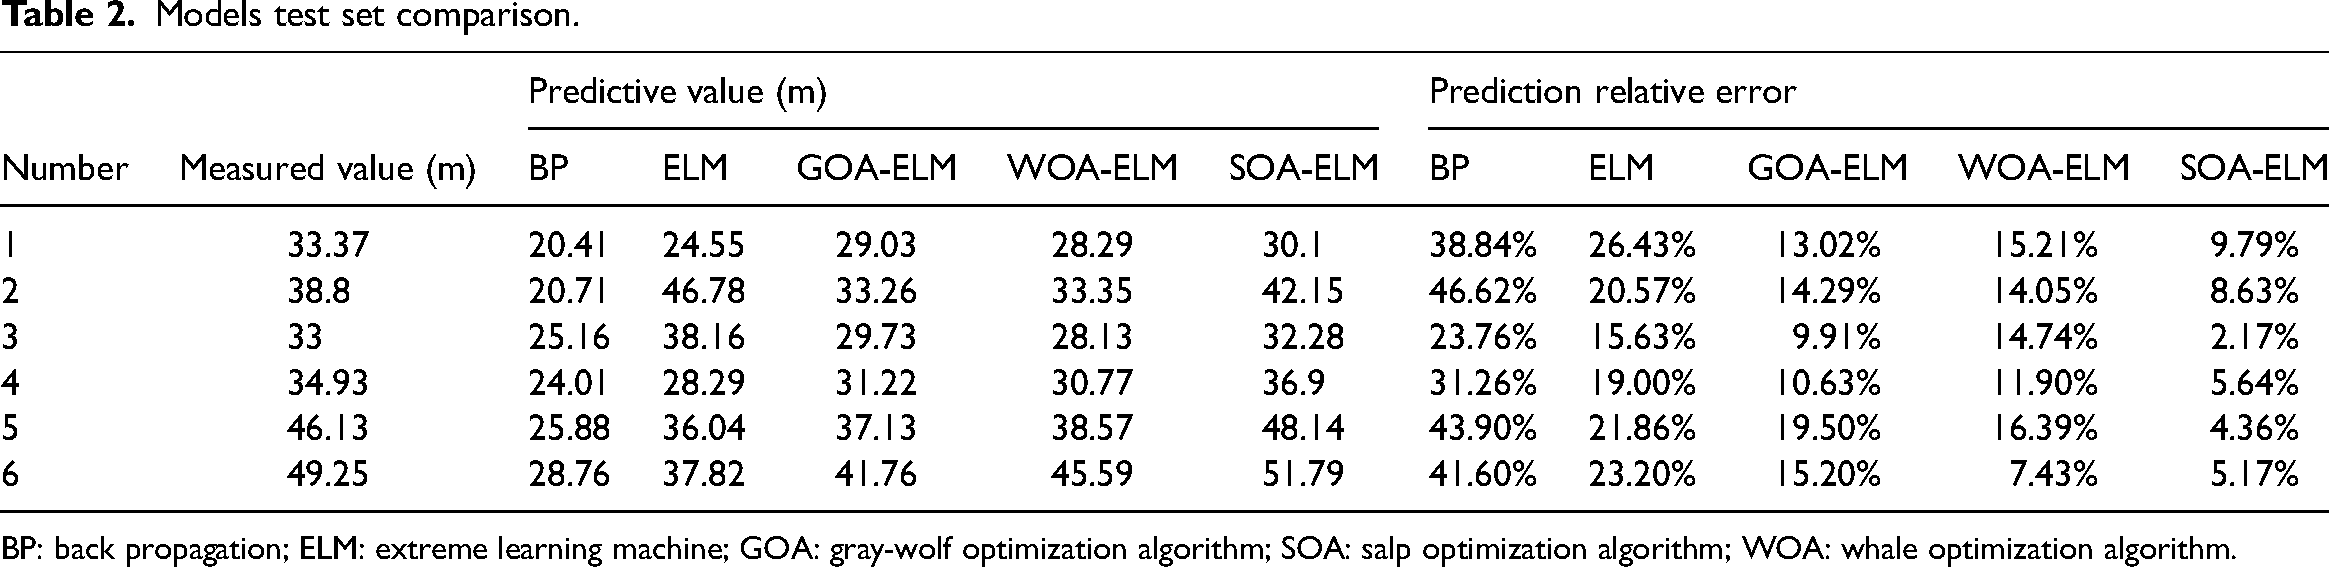
BP: back propagation; ELM: extreme learning machine; GOA: gray-wolf optimization algorithm; SOA: salp optimization algorithm; WOA: whale optimization algorithm.
As shown in Table 2 and Figures 11 and 12, the relative errors of ELM test results are all significantly smaller than the traditional BP model test results, which prove that the ELM model is more accurate than the traditional BP model. And the maximum absolute errors of the height of FWCZ predicted by GOA-ELM and WOA-ELM models are 9.00 and 7.56 m, and the relative errors are 19.50% and 16.39%, respectively; the minimum absolute errors are 3.27 and 3.66 m, and the relative errors are 9.91% and 7.43%, respectively. The maximum absolute error of SOA-ELM model is 3.35 m, and the minimum absolute error is 0.72 m. The maximum relative error is 9.79%, and the minimum relative error is 2.17%. It can be concluded that GOA and WOA have similar optimization effect, while SOA has better optimization results than the other two, and the relative errors of test sets are less than 10%. In addition, compared with the ELM test results, the three results are optimized, which further demonstrates the effectiveness of the swarm intelligence optimization algorithm.
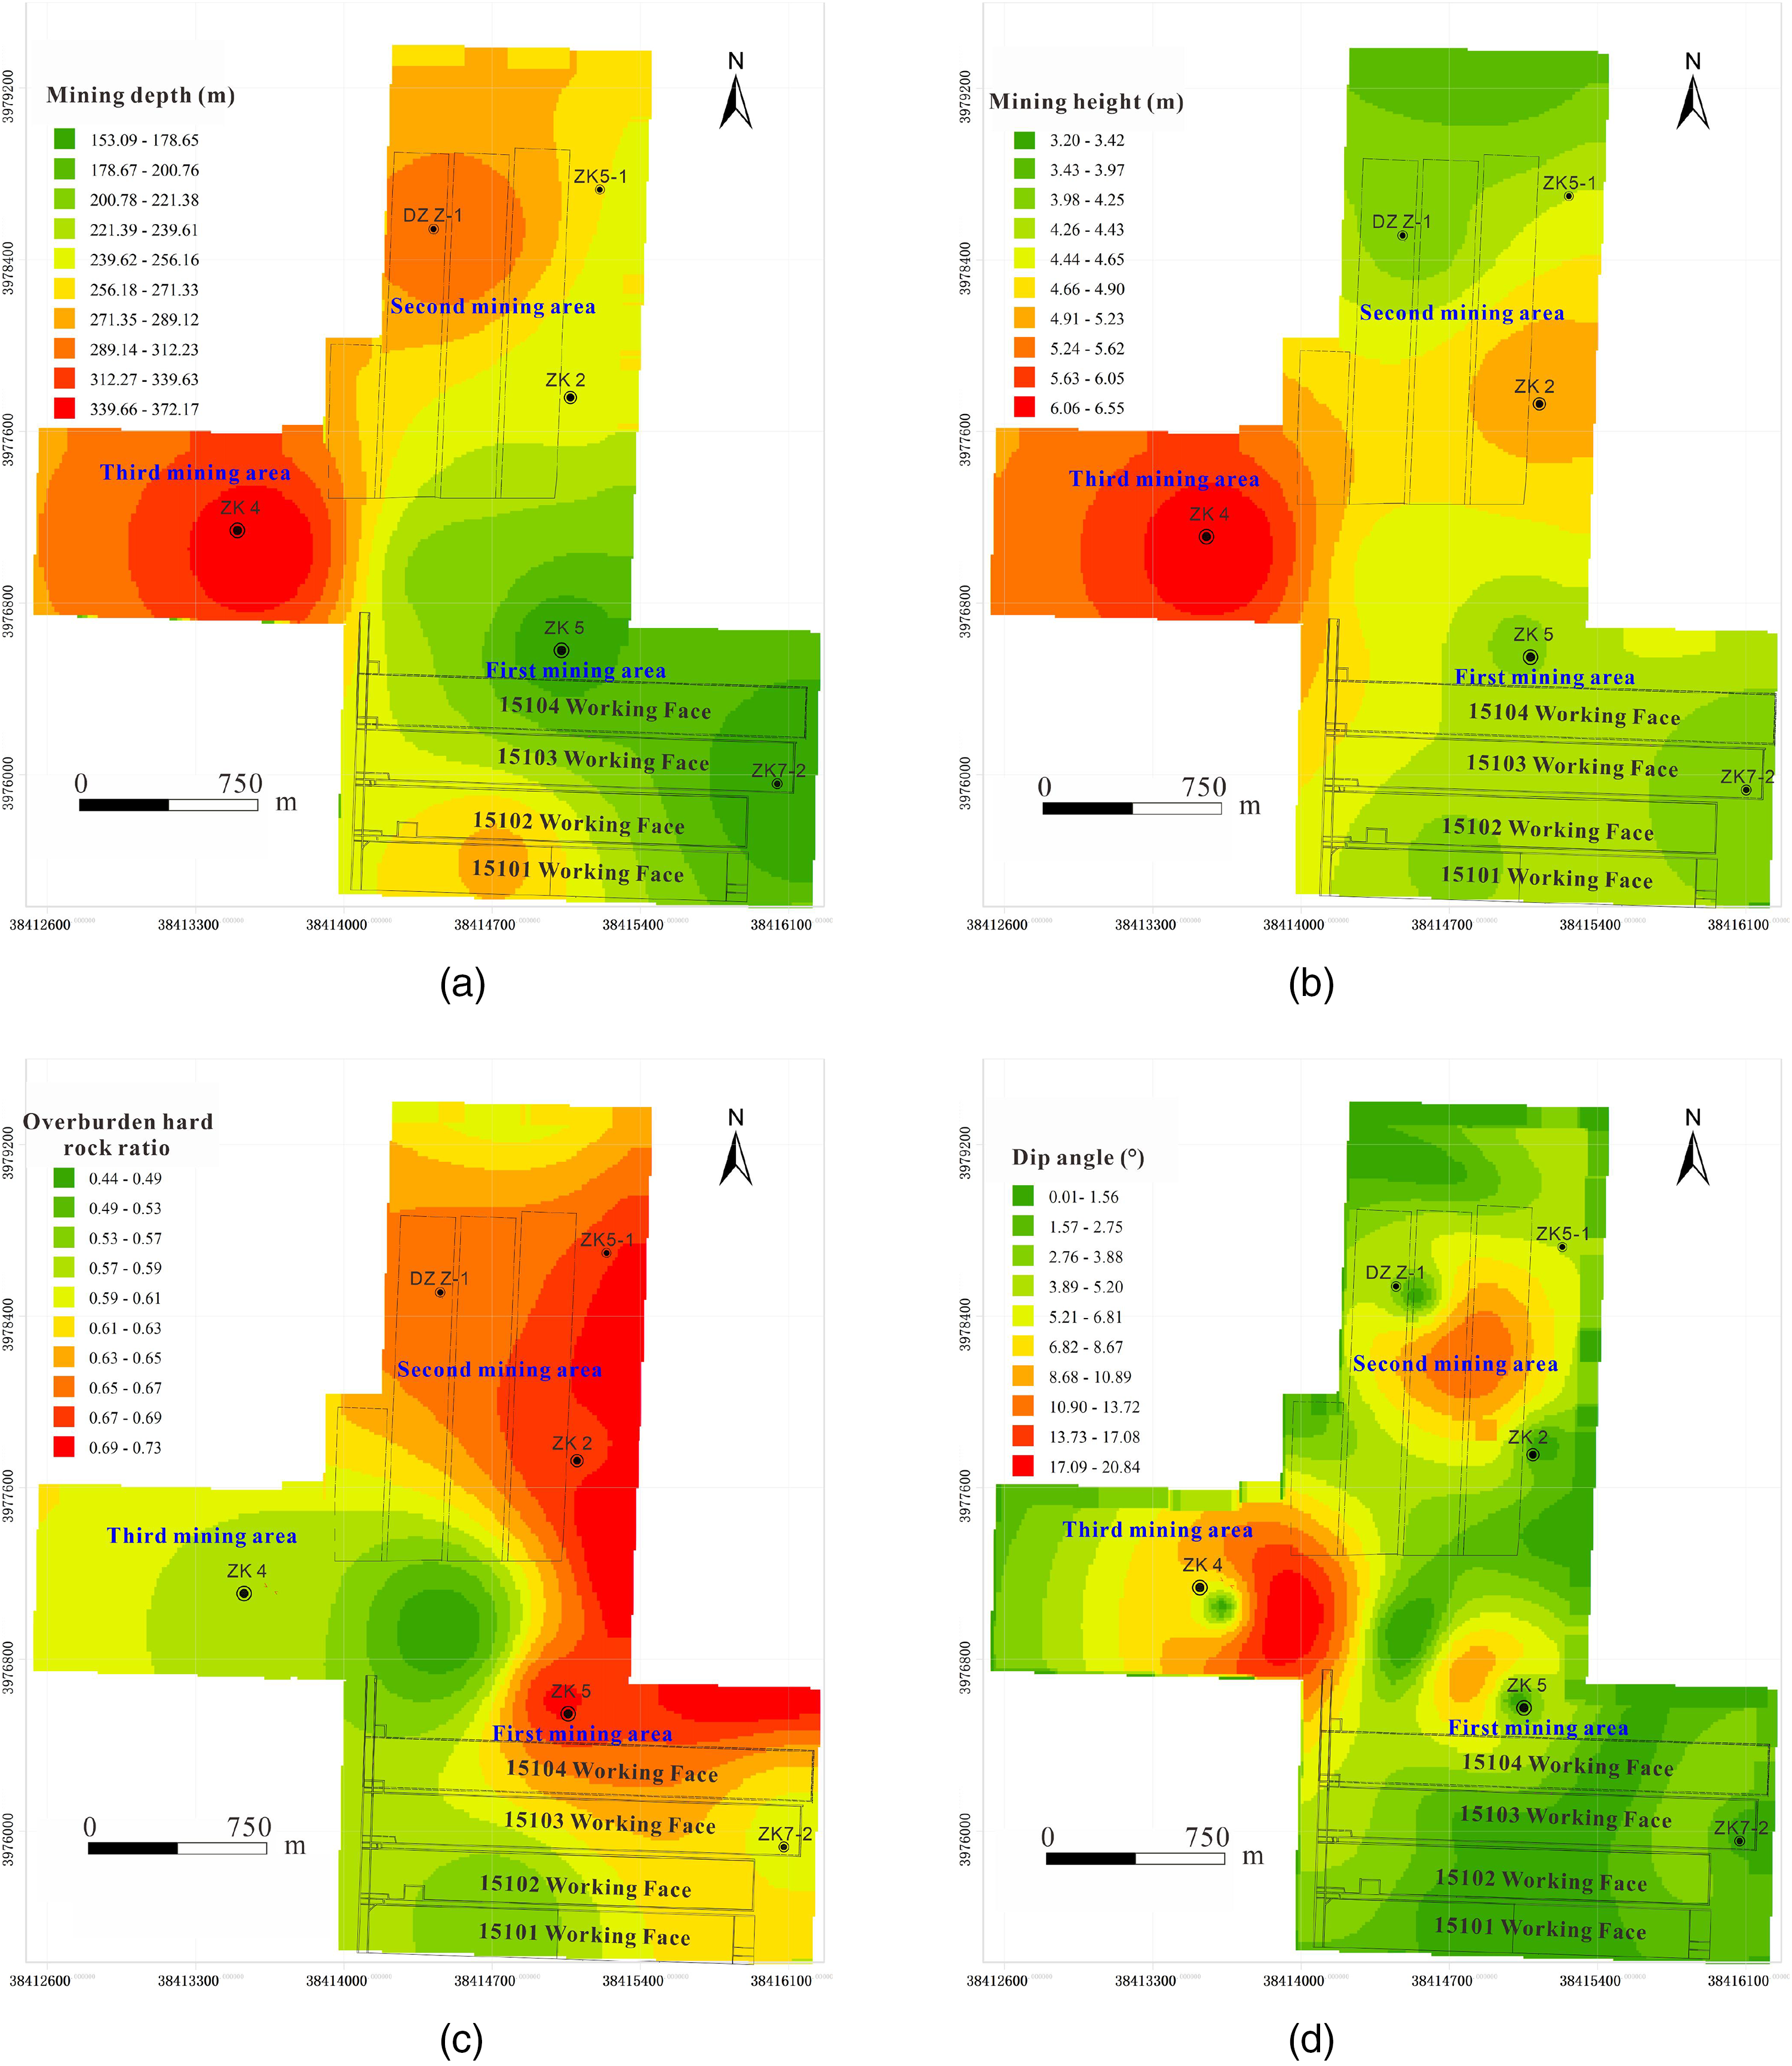
Four main factors affecting the formation of the height of FWCZ of No. 15 coal are analyzed: (a) the mining depth; (b) mining height; (c) overburden strata structure; (d) coal seam dip angle. FWCZ: fractured water-conducting zone.
Engnieering application
According to the research above, SOA-ELM model has the best prediction effect. Thus, based on the SOA-ELM model established above, the height of FWCZ formed by the mining of No. 15 coal in Xinjian Coal Mine is predicted. The specific steps are as follows:
Firstly, by analyzing the basic geological exploration data of the study area mine, four main factors affecting the formation of the height of FWCZ of No. 15 coal are analyzed: the mining depth, mining height, overburden strata structure, and coal seam dip angle, as shown in Figure 12. According to the mine working face layout plan, the oblique length of all working faces of No. 15 coal is 175 m. Secondly, the mine area was divided into 44,836 grid cells using ArcGIS. Finally, the established SOA-ELM model is used to predict the height of each grid, and the height of the entire mining area is obtained. The prediction result is shown in Figure 13.
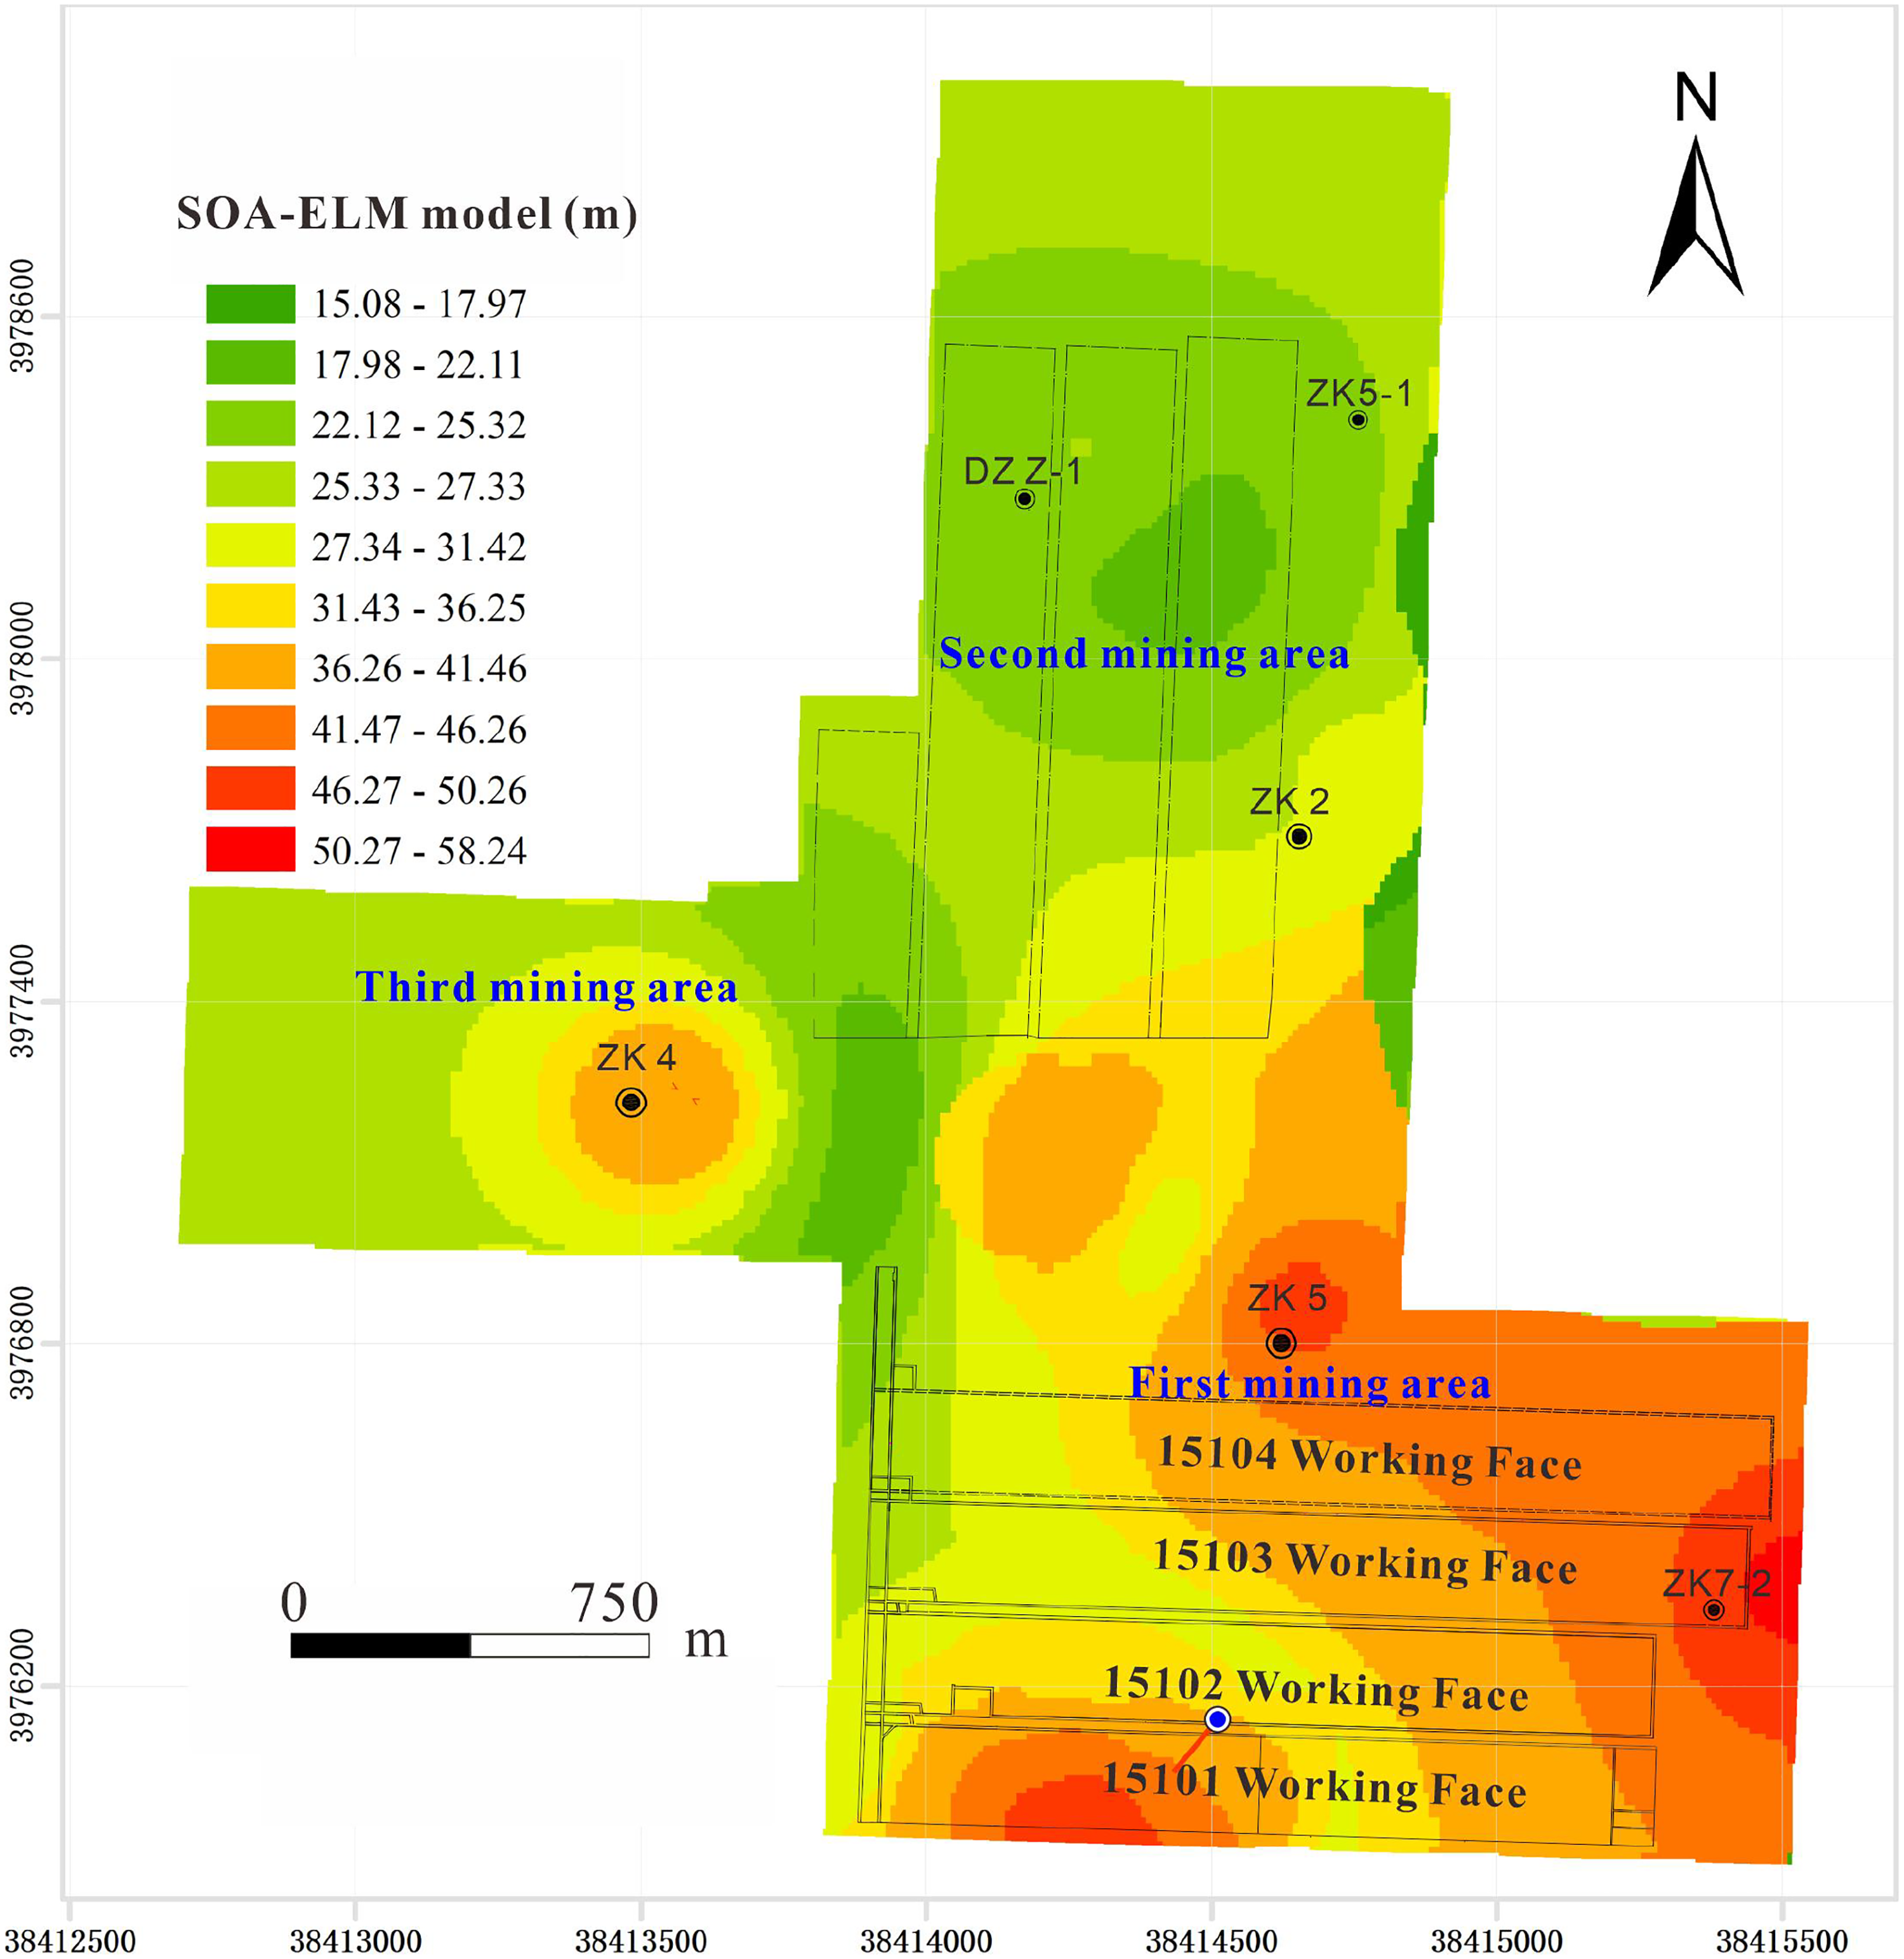
The prediction results of height of FWCZ by SOA-ELM model. ELM: extreme learning machine; FWCZ: fractured water-conducting zone; SOA: salp optimization algorithm.
As shown in Figure 14, the prediction height of FWCZ of the whole mine increases gradually from north to south and from west to east. At the southeast boundary of the mine, the height values a reach the maximum of 50 m or more. In order to further verify the accuracy of the prediction results, the field measured data of the 15,101 working face is used for verification.
Observation borehole location.
Engnieering verification
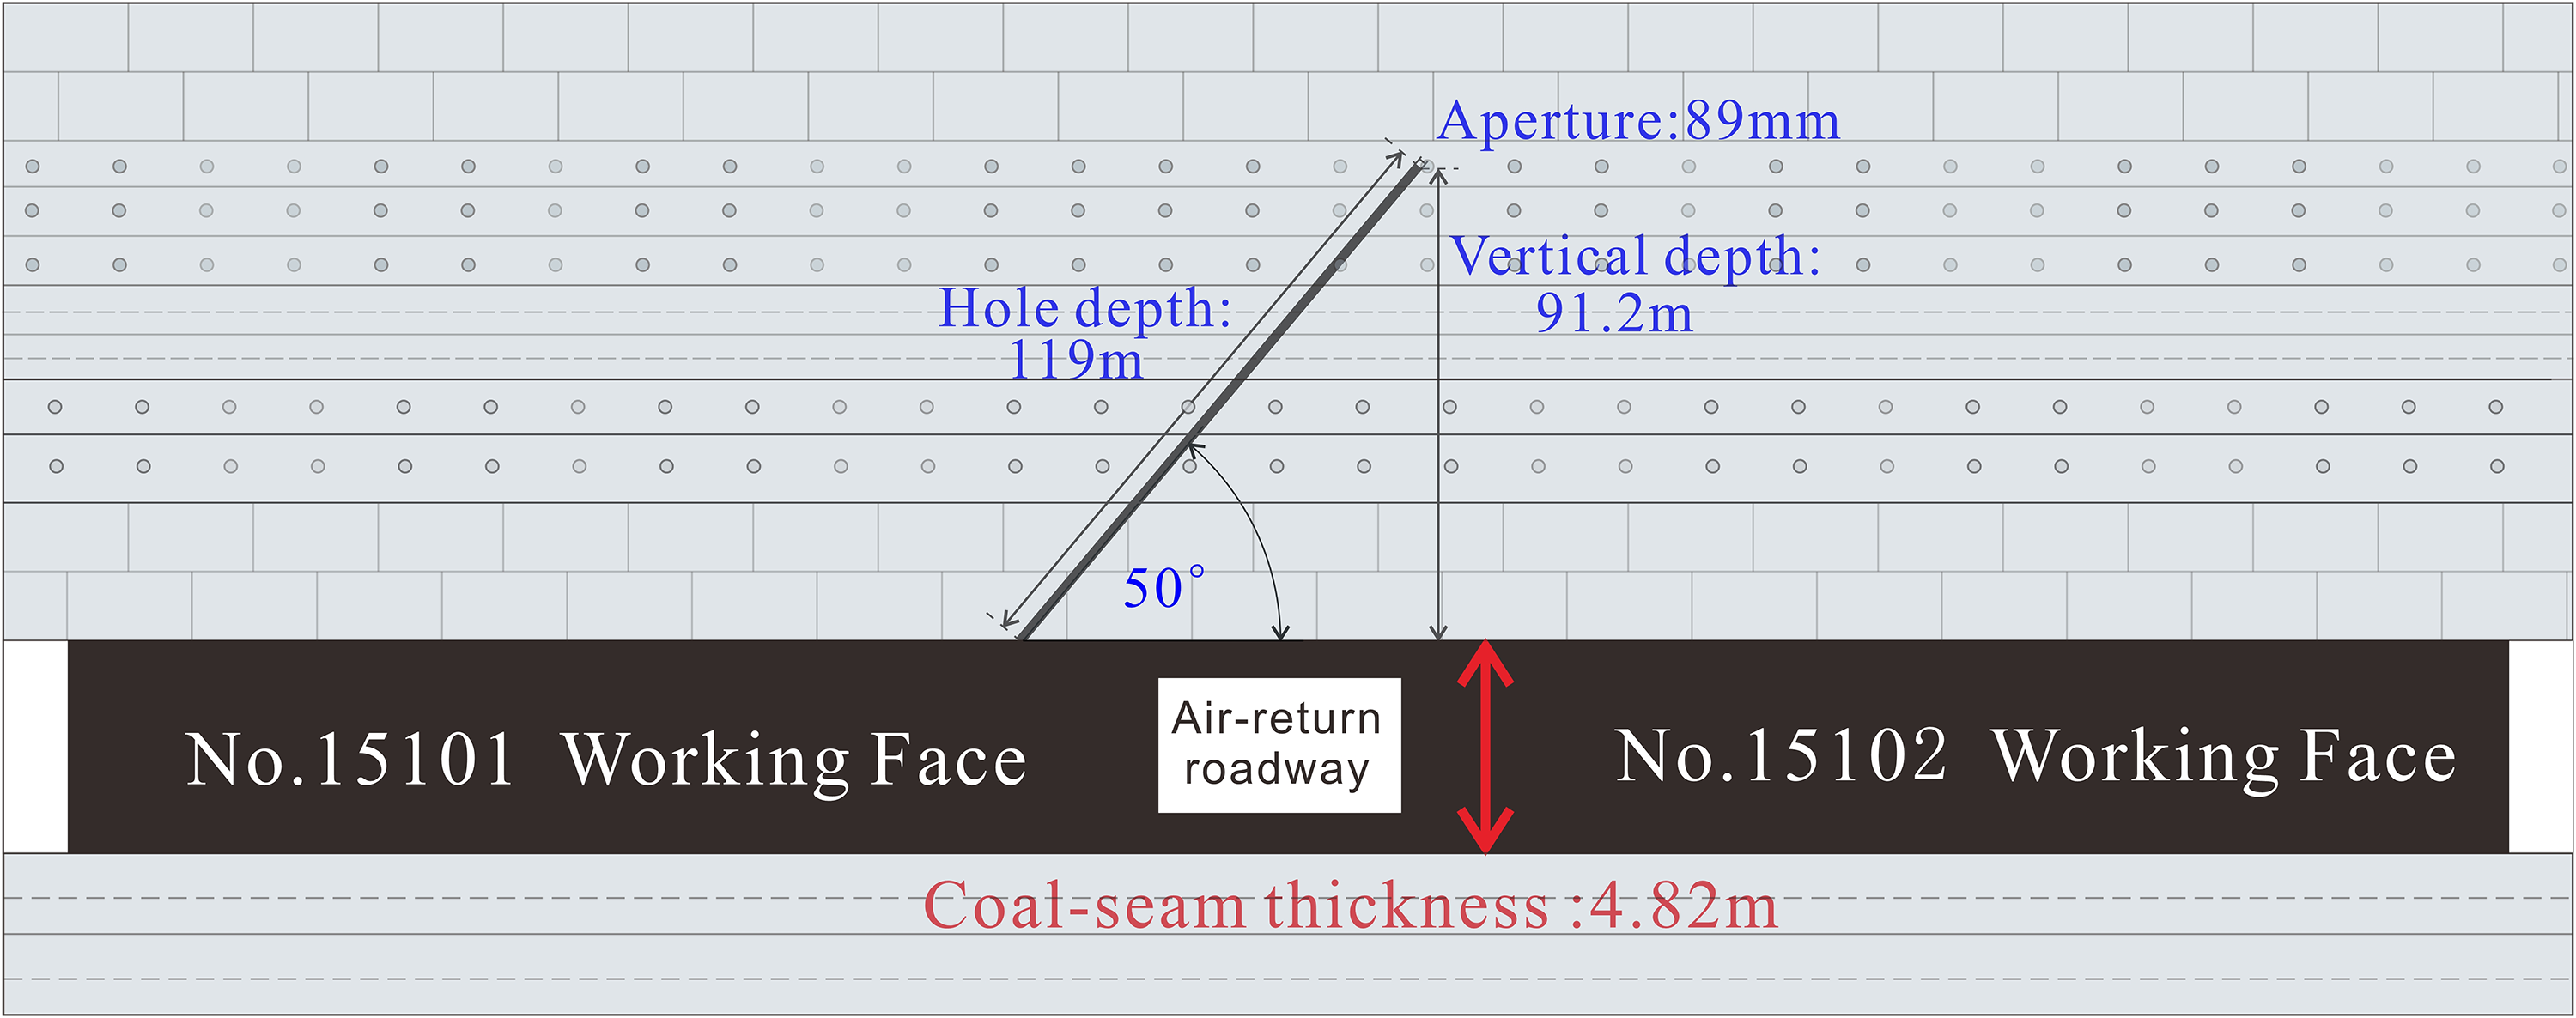
The 15,101 mining face is located in the south of the first mining area of the well field, with a face elevation of 849 to 920 m. Its average burial depth is 280 m and average coal seam dip angle is 4°. It has an area of 246,400 m2 with a strike length of 1400 m and an inclination length of 175 m. The lithology of the coal seam roof is dense massive limestone with a thickness of 8.28 m, and floor is mudstone and sandy mudstone, locally aluminous mudstone with a thickness of about 4 m. The observation borehole location is shown in Figure 14.
ZKXG100 borehole television detection instrument is used to observe the height of FWCZ in 15,101 working face. As shown in Figure 15, the instrument mainly includes imager, camera, depth detector, and extended rod (signal line). The camera is pushed into the borehole through the connecting rod, and the distribution of fissures in different rock layers in the borehole is observed through the imager. At the same time, the photos and videos are taken. Finally, the height of “two belts” is determined through the analysis and comparison of image data.
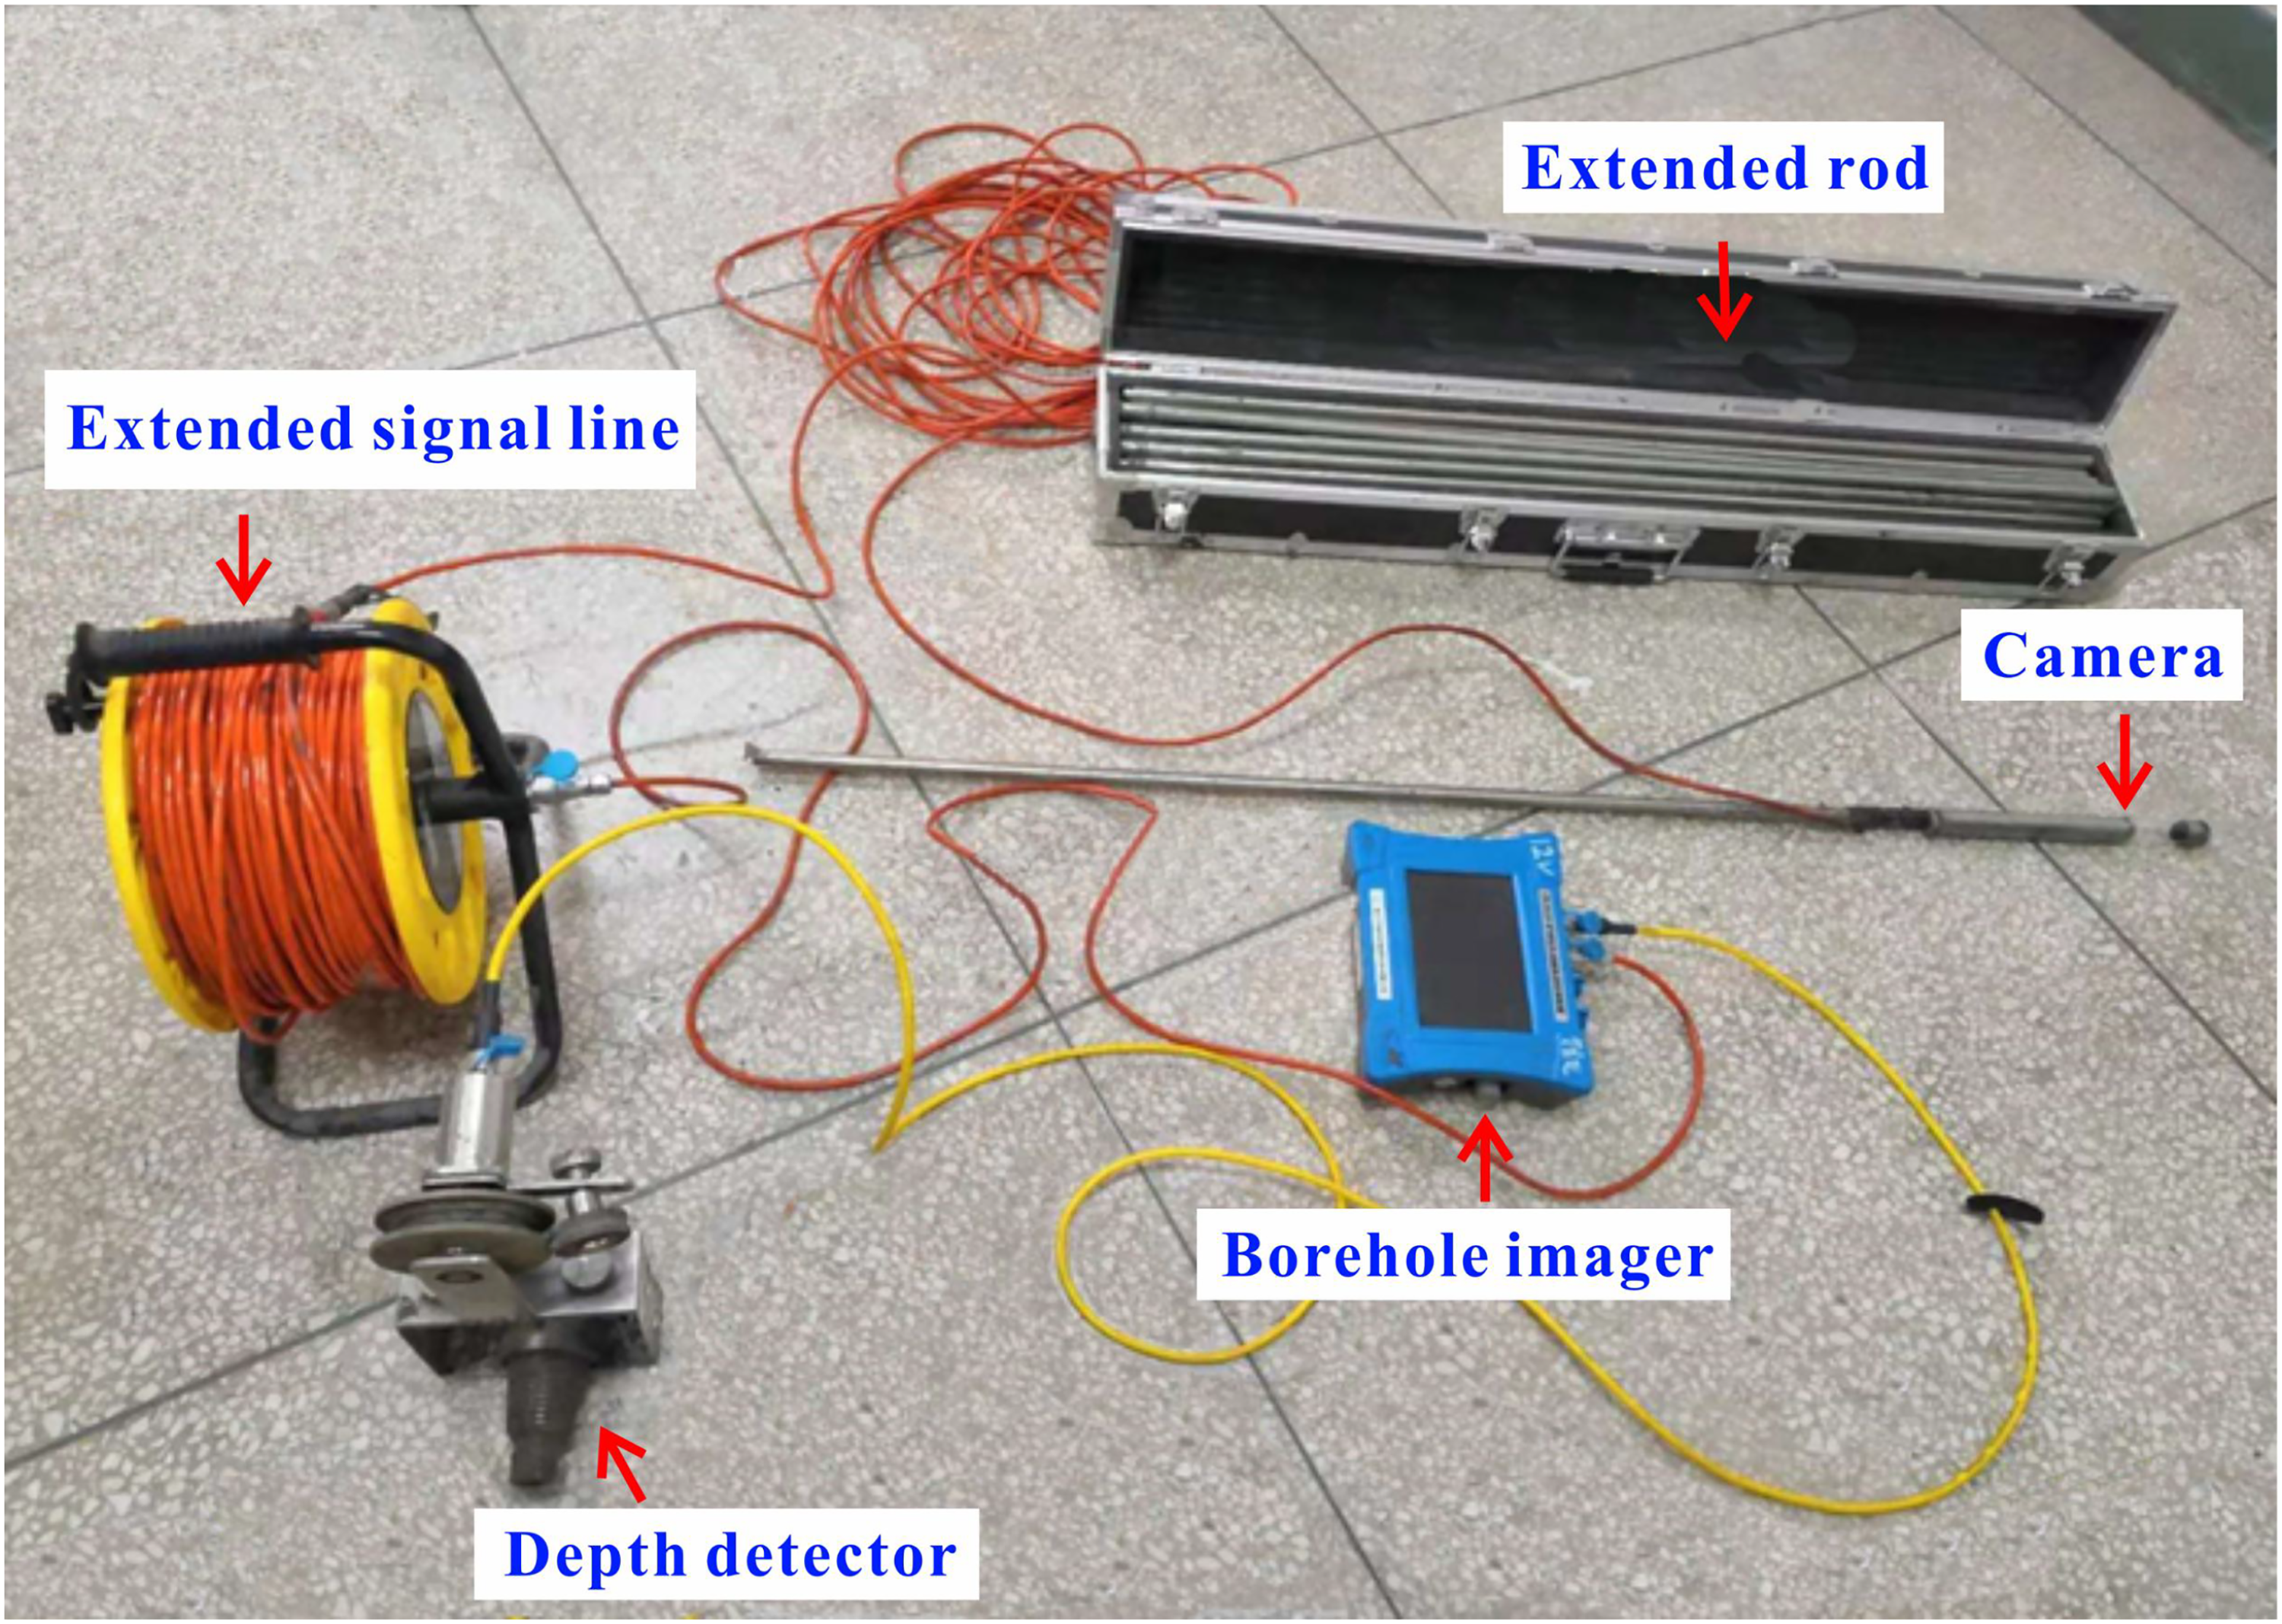
Borehole television detection system.
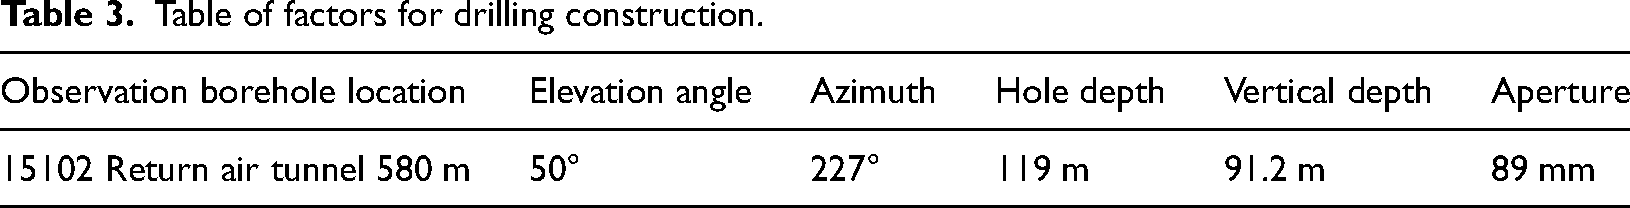
In the process of practical application, an upward borehole in the suitable position of the mining face was drilled firstly. Then the distribution of fissures in different rock layers was observed through the borehole television. When the transverse cracks appear in the borehole, it indicates that the rock layers have been separated, and the longitudinal cracks indicate that the rock layer is cracked due to mining. Finally, the height of FWCZ of the mining face is determined. The specific borehole parameters are as shown in Table 3.
Table of factors for drilling construction.
The farther away from the coal roof, the fewer fractures. When the borehole depth is small, obvious vertical and horizontal fractures will be seen in the hole wall, accompanied by groundwater seepage from the cracks, indicating that the FWCZ has spread to this layer, as shown in Figure 16. Until the hole depth is greater than 67.10 m, that is, the height of No.17 coal seam roof is more than 51.40 m, the last fracture appears. When the drilling depth continues to increase, the rock is relatively complete, and no significant mining fracture is found. Therefore, according to the fracture development conditions described above, the depth of 67.10 m is considered as the top boundary of the fractured zone and the height of FWCZ is 51.40 m.
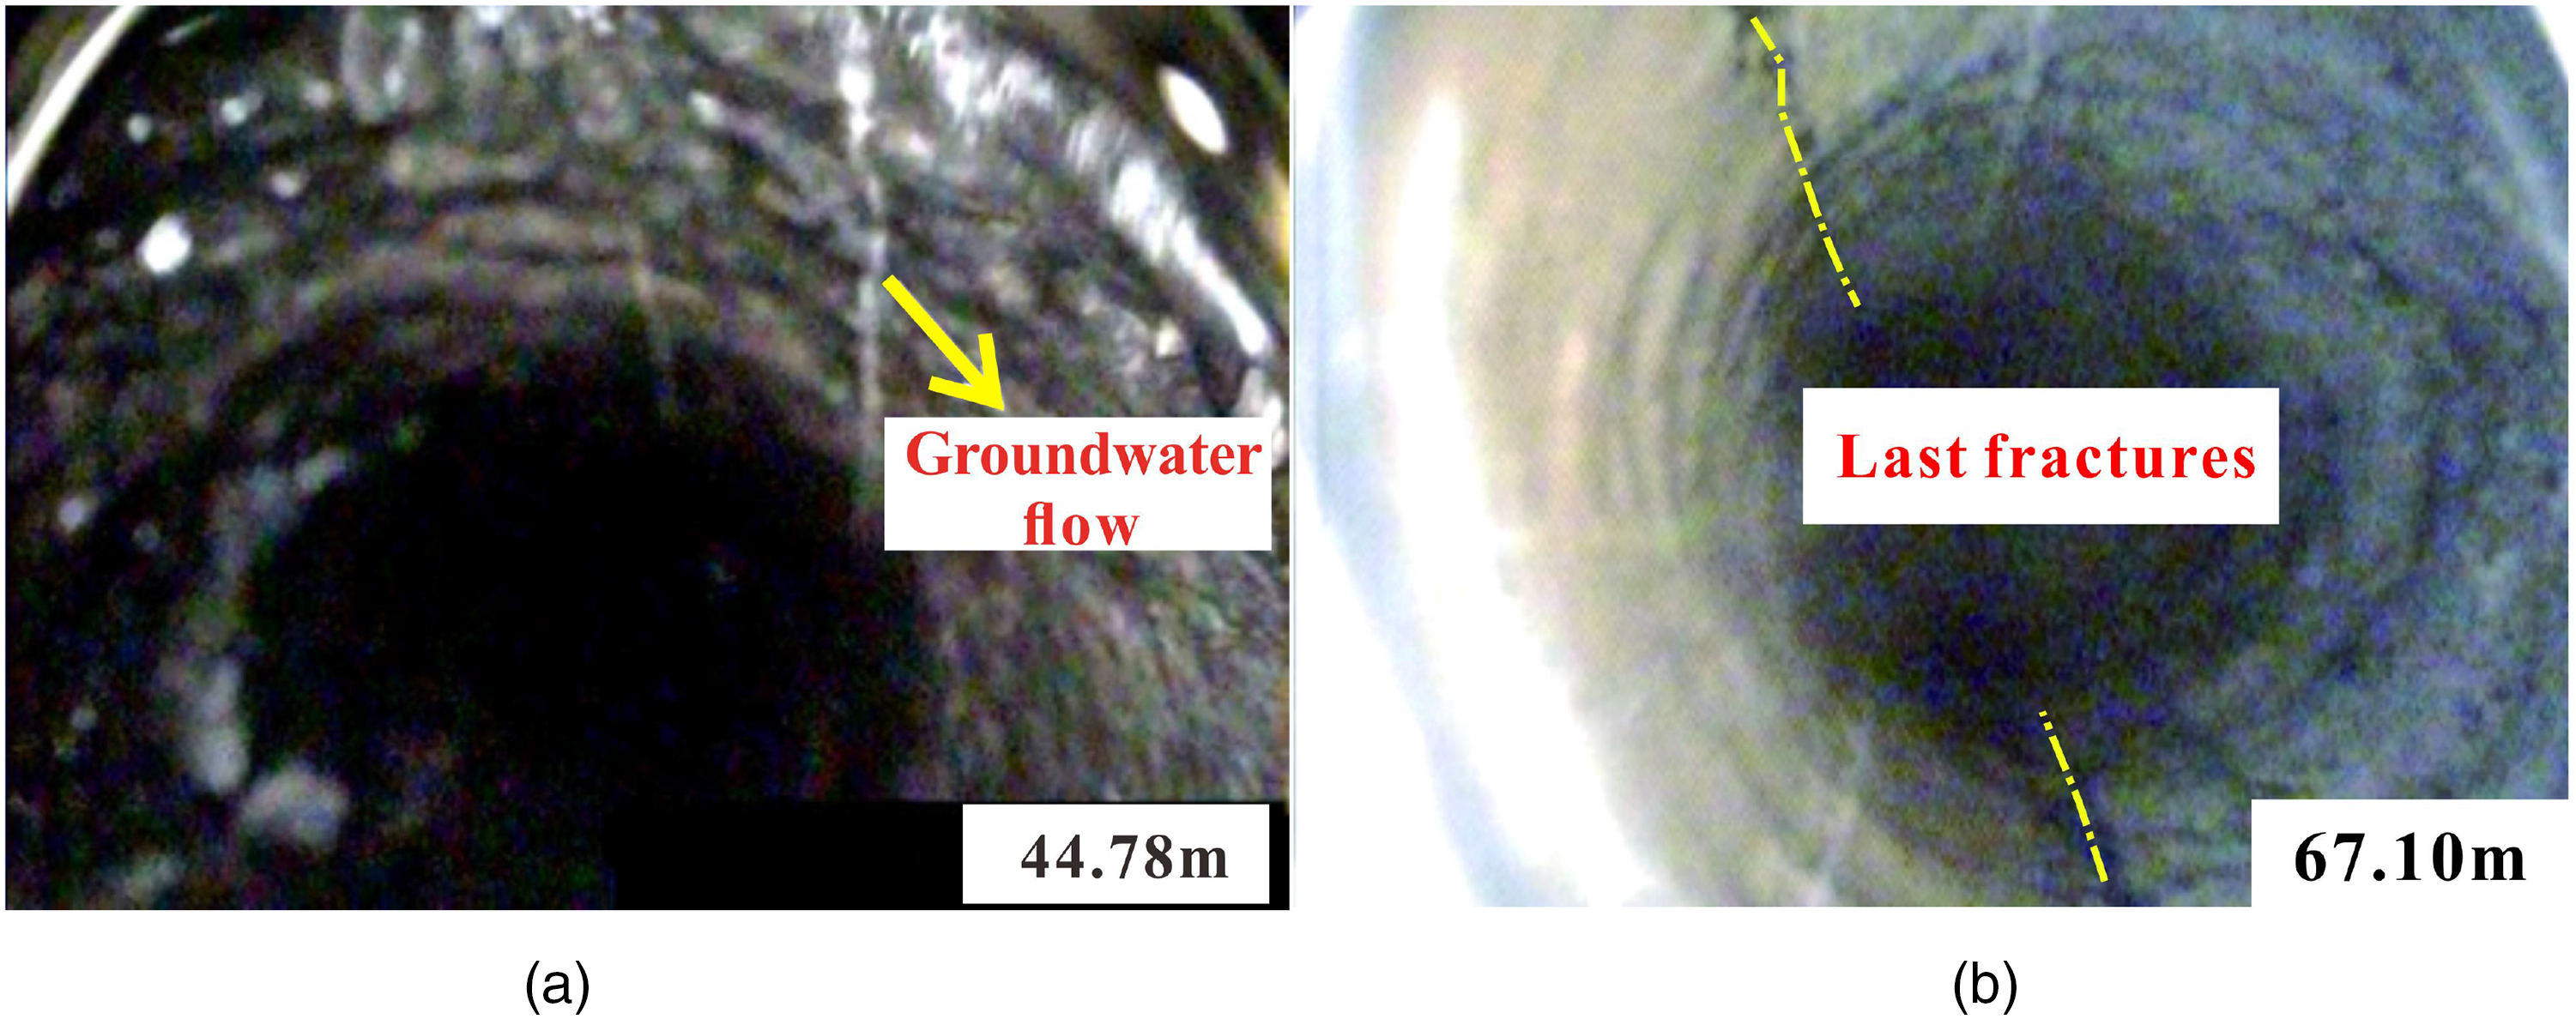
Borehole images: (a) borehole at 44.78 m; (b) borehole at 67.10 m.
According to the prediction results shown in Figure 16, the height of FWCZ in the observation borehole position is 51.4 m. Therefore, the prediction result of SOA-ELM model is consistent with measured value with the relative error of 10%.
Summary and conclusions
In order to ensure the safety of coal mining under water-containing, the three prediction models based on ELM optimized by GOA, WOA, and SOA, respectively, are established in this study. Then they are compared by relative error and absolute error. Finally, the SOA-ELM model is applied to predict the height of FWCZ formed after the mining of No. 15 coal seam in Xinjian Coal Mine. Prediction results are consistent with the measured data of the borehole television detection instrument. The main conclusions are as follows:
The mining depth, mining height, overburden strata structure, working face length, and coal seam dip angle are selected as the main controlling factors for the height of FWCZ. The three prediction models are established based on a total of 42 fields measured samples which are divided into 2 subsets for training and validating with a ratio of 36/6. The result shows that the ELM model is more accurate than the BP model and has a faster training speed. Additionally, all three optimized prediction models outperform the ELM model, with the SOA-ELM model exhibiting the highest prediction precision, averaging an error rate of only 2.28%, which is less than 10%. SOA-ELM model is applied to predict the height of the FWCZ that formed after the mining of No. 15 coal seam in Xinjian Coal Mine. The prediction results show that the height of the FWCZ gradually increases from northwest to southeast, with a maximum height of over 50 m. In order to verify the accuracy of the prediction results, the field measured data of the 15,101 working face is used for contrast. The height of FWCZ in 15,101 working face observed using borehole television is 51.4 m. It is consistent with the prediction result of the SOA-ELM model with the relative error of 10%.
Footnotes
Author contributions
DZ contributed to the conceptualization and methodology, and software; GF to formal analysis and validation; YH to resources; FW and ZL to visualization; SD to the writing and original draft preparation; CH to writing, review, and editing. All authors have read and agreed to the published version of the manuscript.
Data availability statement
All data generated or analyzed during this study are included in this published article.
Declaration of conflicting interests
The author(s) declared no potential conflicts of interest with respect to the research, authorship, and/or publication of this article.
Funding
The author(s) disclosed receipt of the following financial support for the research, authorship, and/or publication of this article: This work was supported by the Key projects of the Joint Fund of the National Natural Science Foundation of China, Distinguished Youth Funds of National Natural Science Foundation of China, Shanxi Province Science and Technology Major Project Funds, and Shanxi Province Basic Research Plan Project. This research was financially supported by Youth Funds of National Natural Science Foundation of China, Major Science and Technology Projects of Shanxi Province (grant number No. U21A20107, No. 51925402, No. 20201102004, No. 20210302124482, 20210302124485, No. 52104145, 20191101016).