
Abstract
After the near-abandoned production wells in the high part of the fault block reservoir are closed for a period of time, the remaining oil in the low part will accumulate at the fault in the high part to produce secondary enrichment. At present, research on the secondary enrichment of the remaining oil mainly focuses on the remigration method of the remaining oil, and there is less research on the mechanism of the secondary enrichment of the remaining oil. In view of the above problems, a planar numerical model is established to analyse the remaining oil secondary enrichment law, combined with the longitudinal numerical model to analyse the mechanism of the remaining oil secondary enrichment, and nine factors are selected to study their influence on the remaining oil secondary enrichment law, further determining the main control factors through sensitivity analysis. Based on the numerical simulation results, the reservoir conditions conducive to the secondary enrichment of the remaining oil are determined. The research shows that the remaining oil secondary enrichment mechanism includes pressure redistribution after well shut-in and the comprehensive effect of the micro force. The increase in the formation dip angle, permeability and water injection intensity before well shut-in is beneficial to accelerate the secondary enrichment of the remaining oil. Permeability and formation dip angle are the main controlling factors of positive correlation parameters, and the shut-in water cut is the main controlling factor of negative correlation parameters and the most sensitive. In addition, when the permeability is greater than 200 mD, the formation dip angle is greater than 9°, and the shut-in water cut is less than 95%, which is conducive to the secondary enrichment of the remaining oil. This study has reference significance for the field to understand the mechanism and influencing factors of the secondary enrichment of the remaining oil.
Keywords
Introduction
After shutting down the production wells in the high part of the fault block reservoir at the end of the ultrahigh water cut, the remaining oil will be transported to the high part with the time of shutting down the wells due to the formation dip angle, and eventually, a secondary enrichment area will be formed at the fault. The water cut of production wells near the fault decreases at the initial stage of reopening, and the daily oil production increases. It is of great significance for the field to judge the further development potential of nearby abandoned production wells to understand the secondary enrichment migration law and influencing factors of the remaining oil and to study its secondary enrichment mechanism.
At present, research on enriched remaining oil mainly focuses on the distribution characteristics and influencing factors of enriched remaining oil after displacement (Xia et al., 2010, 2021; Tang et al., 2012; Fang et al., 2019; Wang et al., 2020; Zhao, 2021; Jiang et al., 2022), the recovery method of enriched remaining oil (Chen et al., 2013; Liu et al., 2022), and the remaining oil storage mechanism (Dai and Lin, 2020; Song et al., 2020; Wolf et al., 2020). Wang and Ye (2013) studied the distribution law of remaining oil after polymer flooding and proposed five remaining oil enrichment areas after polymer flooding. Sun et al. (2019) analysed the oil displacement characteristics and remaining oil distribution control factors of sandstone reservoirs. The planar heterogeneity is characterised by “continuous flooding at low position and remaining oil enrichment at high position”; the heterogeneity in the layer is affected by rhythm, which is characterised by “the bottom of the oil layer is flooded to form secondary bottom water, and the remaining oil is concentrated in the middle and upper part of the oil layer”. Wei et al. (2019) studied the influence of various geological factors and development factors on the distribution of remaining oil and noted that the remaining oil is mainly controlled by the heterogeneity of low sequence faults, interbeds, physical properties and differences in hydrodynamic conditions. Wang et al. (2020) analysed the influence of crude oil viscosity on the distribution of remaining oil and water injection characteristics after the high water cut stage of sandstone oilfields and found that the remaining oil in low viscosity reservoirs after water flooding is mainly concentrated in the unswept area. The water flooding fingering of high-viscosity reservoirs is serious, and the remaining oil is also concentrated in areas that have been swept. The above study mainly describes the research direction of existing technologies on enriched remaining oil (remaining oil enrichment area) after water flooding and illustrates the phenomenon of the accumulation of remaining oil to the high part, which proves the secondary enrichment of remaining oil at the high part of the fault after well shut-in. Compared with previous studies, this paper investigates the spontaneous secondary enrichment of remaining oil after well shut-in at the end of an ultrahigh water cut in a fault block oilfield. The advantage is that the research direction will further focus on the secondary enrichment of remaining oil in the enrichment area and focus on the analysis of the secondary enrichment mechanism and the main control factors of the secondary enrichment law of remaining oil. The disadvantage is that the numerical simulation is solved by traditional Eclipse software. The above research has reference significance for further study on the influencing factors and formation mechanism of secondary enriched remaining oil.
Research on the secondary enrichment of remaining oil is mainly carried out through physical simulation experiments and numerical simulation methods from the aspects of the factors of the secondary enrichment of the remaining oil, the mechanism of the secondary enrichment of the remaining oil (Wang et al., 2017) and the remigration method of remaining oil (Fang et al., 2018; Cao, 2021; Li et al., 2022). Zhang et al. (2008) proposed four remaining oil displacement models based on the main pore structure characteristics and basic morphological characteristics of the remaining oil, analysed the pore-scale flow behaviour of viscoelastic fluids with numerical methods, and discussed the microscopic migration mechanism of the remaining oil. Wu et al. (2016) carried out a physical displacement experiment by using a microscopic glass model. The experimental results show that changing the injection direction can effectively displace the remaining oil in the enriched area. Zhang et al. (2021) took the change in water cut before and after well shut-in as the evaluation standard of the remaining oil enrichment effect, obtained the main controlling factors by using a numerical simulation method, and proposed the prediction formula of the remaining oil enrichment effect. Fan et al. (2021) discussed the displacement mechanism of the remaining oil film in the microchannel through numerical simulation and proposed that increasing the horizontal stress on the oil film can fundamentally mobilise the oil film and make it movable. The elasticity of the fluid will change the stress law on the residual oil film, which is more conducive to the migration of the oil film. In summary, the secondary enrichment of the remaining oil is mainly affected by static geological factors and dynamic development factors. When the driving force can overcome the flow resistance, secondary migration will occur, and secondary enrichment will occur in high parts after being shielded. However, there is no unified evaluation standard for the degree of secondary enrichment of the remaining oil in previous studies, and there is less research on the mechanism of secondary enrichment of spontaneous migration of the remaining oil. The lack of uniform criteria for determining the degree of secondary enrichment of the remaining oil affects the determination of the secondary enrichment time of the remaining oil and the determination of favourable values for factors influencing the secondary enrichment of the remaining oil. The lack of clarity on the secondary enrichment mechanism of remaining oil spontaneous transport can lead to a lack of understanding of the causes of secondary enrichment of remaining oil.
In view of the above research status and existing problems, this paper establishes a conceptual numerical model based on the geological characteristics and production data of the actual research block and determines the mechanism of the secondary enrichment of the remaining oil from the force field perspective based on the analysis of the law of the secondary enrichment of the remaining oil. Nine influencing factors are selected from the reservoir physical properties, fluid properties, injection and production parameters, and the influence of each factor on the secondary enrichment of the remaining oil is analysed by taking the production well point oil saturation as the evaluation standard. Based on the numerical simulation results, the sensitivity coefficient is used to determine the main control factors affecting the secondary enrichment of the remaining oil. The reservoir conditions favourable for the secondary enrichment of the remaining oil are determined. The key point of this study is to establish a numerical simulation model to analyse the mechanism of remaining oil secondary enrichment. The innovation of this paper is to determine the mechanism of secondary enrichment of remaining oil based on the analysis of oil saturation distribution, pressure distribution, pressure gradient distribution and remaining oil microscopic forces and to determine the main control factors and reservoir conditions conducive to secondary enrichment of remaining oil based on the analysis of factors influencing secondary enrichment of remaining oil. This study has guiding significance for the field to recognise the development potential of nearby abandoned production wells in high parts of fault block reservoirs and further determine the time of secondary well opening.
Methods
Reservoir overview
Block A of the L oilfield is a long and narrow fault block in a nearly east‒west direction sandwiched by faults in the south and north. Its structure is characterised by a low-amplitude anticline with high middle and low sides. Among them, E2s1 is controlled by structural factors, with a proven active oil-bearing area of 1.0 km2 and active geological reserves of 427 × 104 t. The reservoir is buried at 1900 m, the average effective thickness is 5.7−28.7 m, the average reservoir porosity is 20.55%, the average air permeability is 627.5 × 10⁻³ μm2, the original formation pressure is 19 MPa, the formation temperature is 353.15 K, the formation crude oil viscosity is 1.14−5.37 mPa·s, the original gas-oil ratio is 19–99 m3·t−1, and the relative density of crude oil is 830–844 kg·m−3. The oil recovery well CZ39 in this block was put into production in February 2005 with an E2s16−2 sand body and shut in October 2007 with a daily fluid production of 65 t, daily oil production of 4.8 t and water cut of 92.6% at the time of shut-in. Based on the geological characteristics and formation oil–water properties of production well CZ39 and water injection well Z108, a numerical model is established to study the mechanism and influencing factors of secondary enrichment of remaining oil after wells are shut-in.
Numerical modelling methods
This paper uses Eclipse software to establish a numerical model for research. The modelling and calculation methods include the following:
Click the “Office” module, select the data directory, and click “Run” to enter the modelling section; Create a new project in the file and click “Grid” to enter the modelling data input interface; Define the model name, simulation start date, grid number, unit, coordinate system, grid type, oil and water properties in “Case Definition”; Define the viscosity, density, and other physical properties of oil and water in “PVT”; Define the relative permeability curves of oil and water in “SCAL”. Define initial data such as reference depth, pressure at reference depth, and oil–water interface position in “Initialization”. Define the location of water injection wells and production wells, completion data, injection and production speed, well opening and closing date, and model operation end date in “Schedule”; Define the keywords of output results in “Summary”; Exit the data input interface and click “Run” to start computing the model; The result of the calculation is imported into “Result” to view the oil saturation, pressure and other result data under different dates.
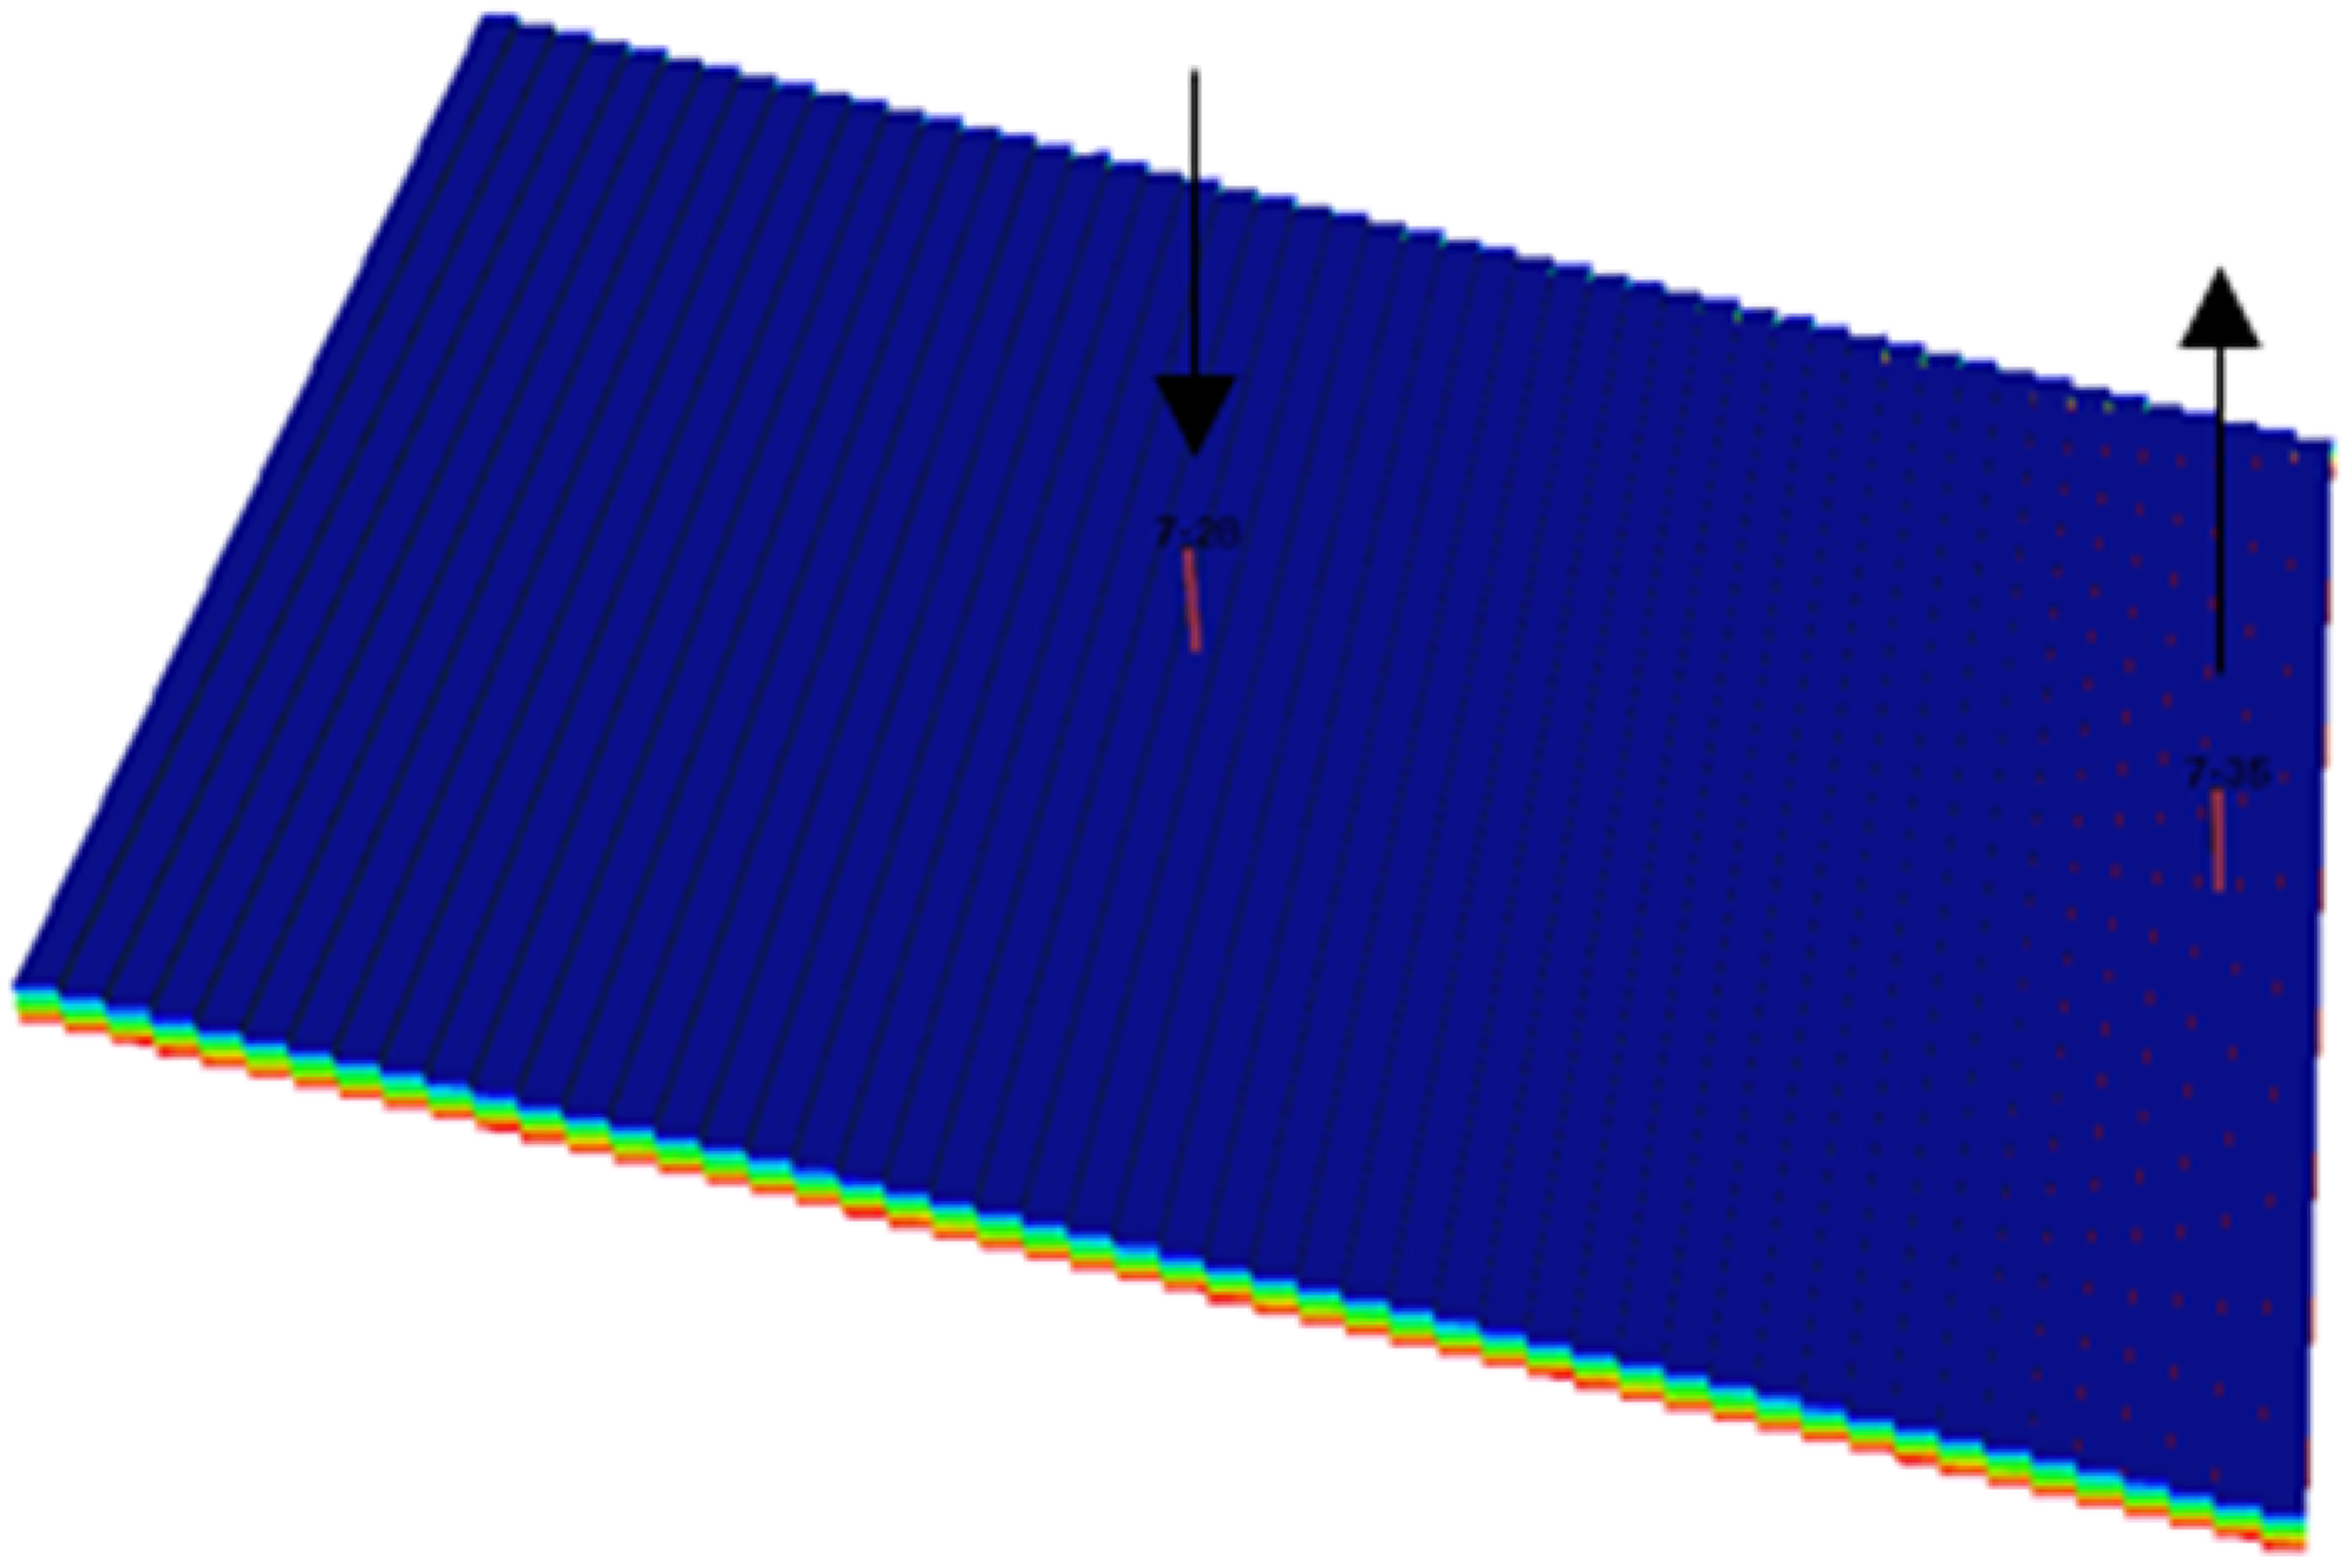
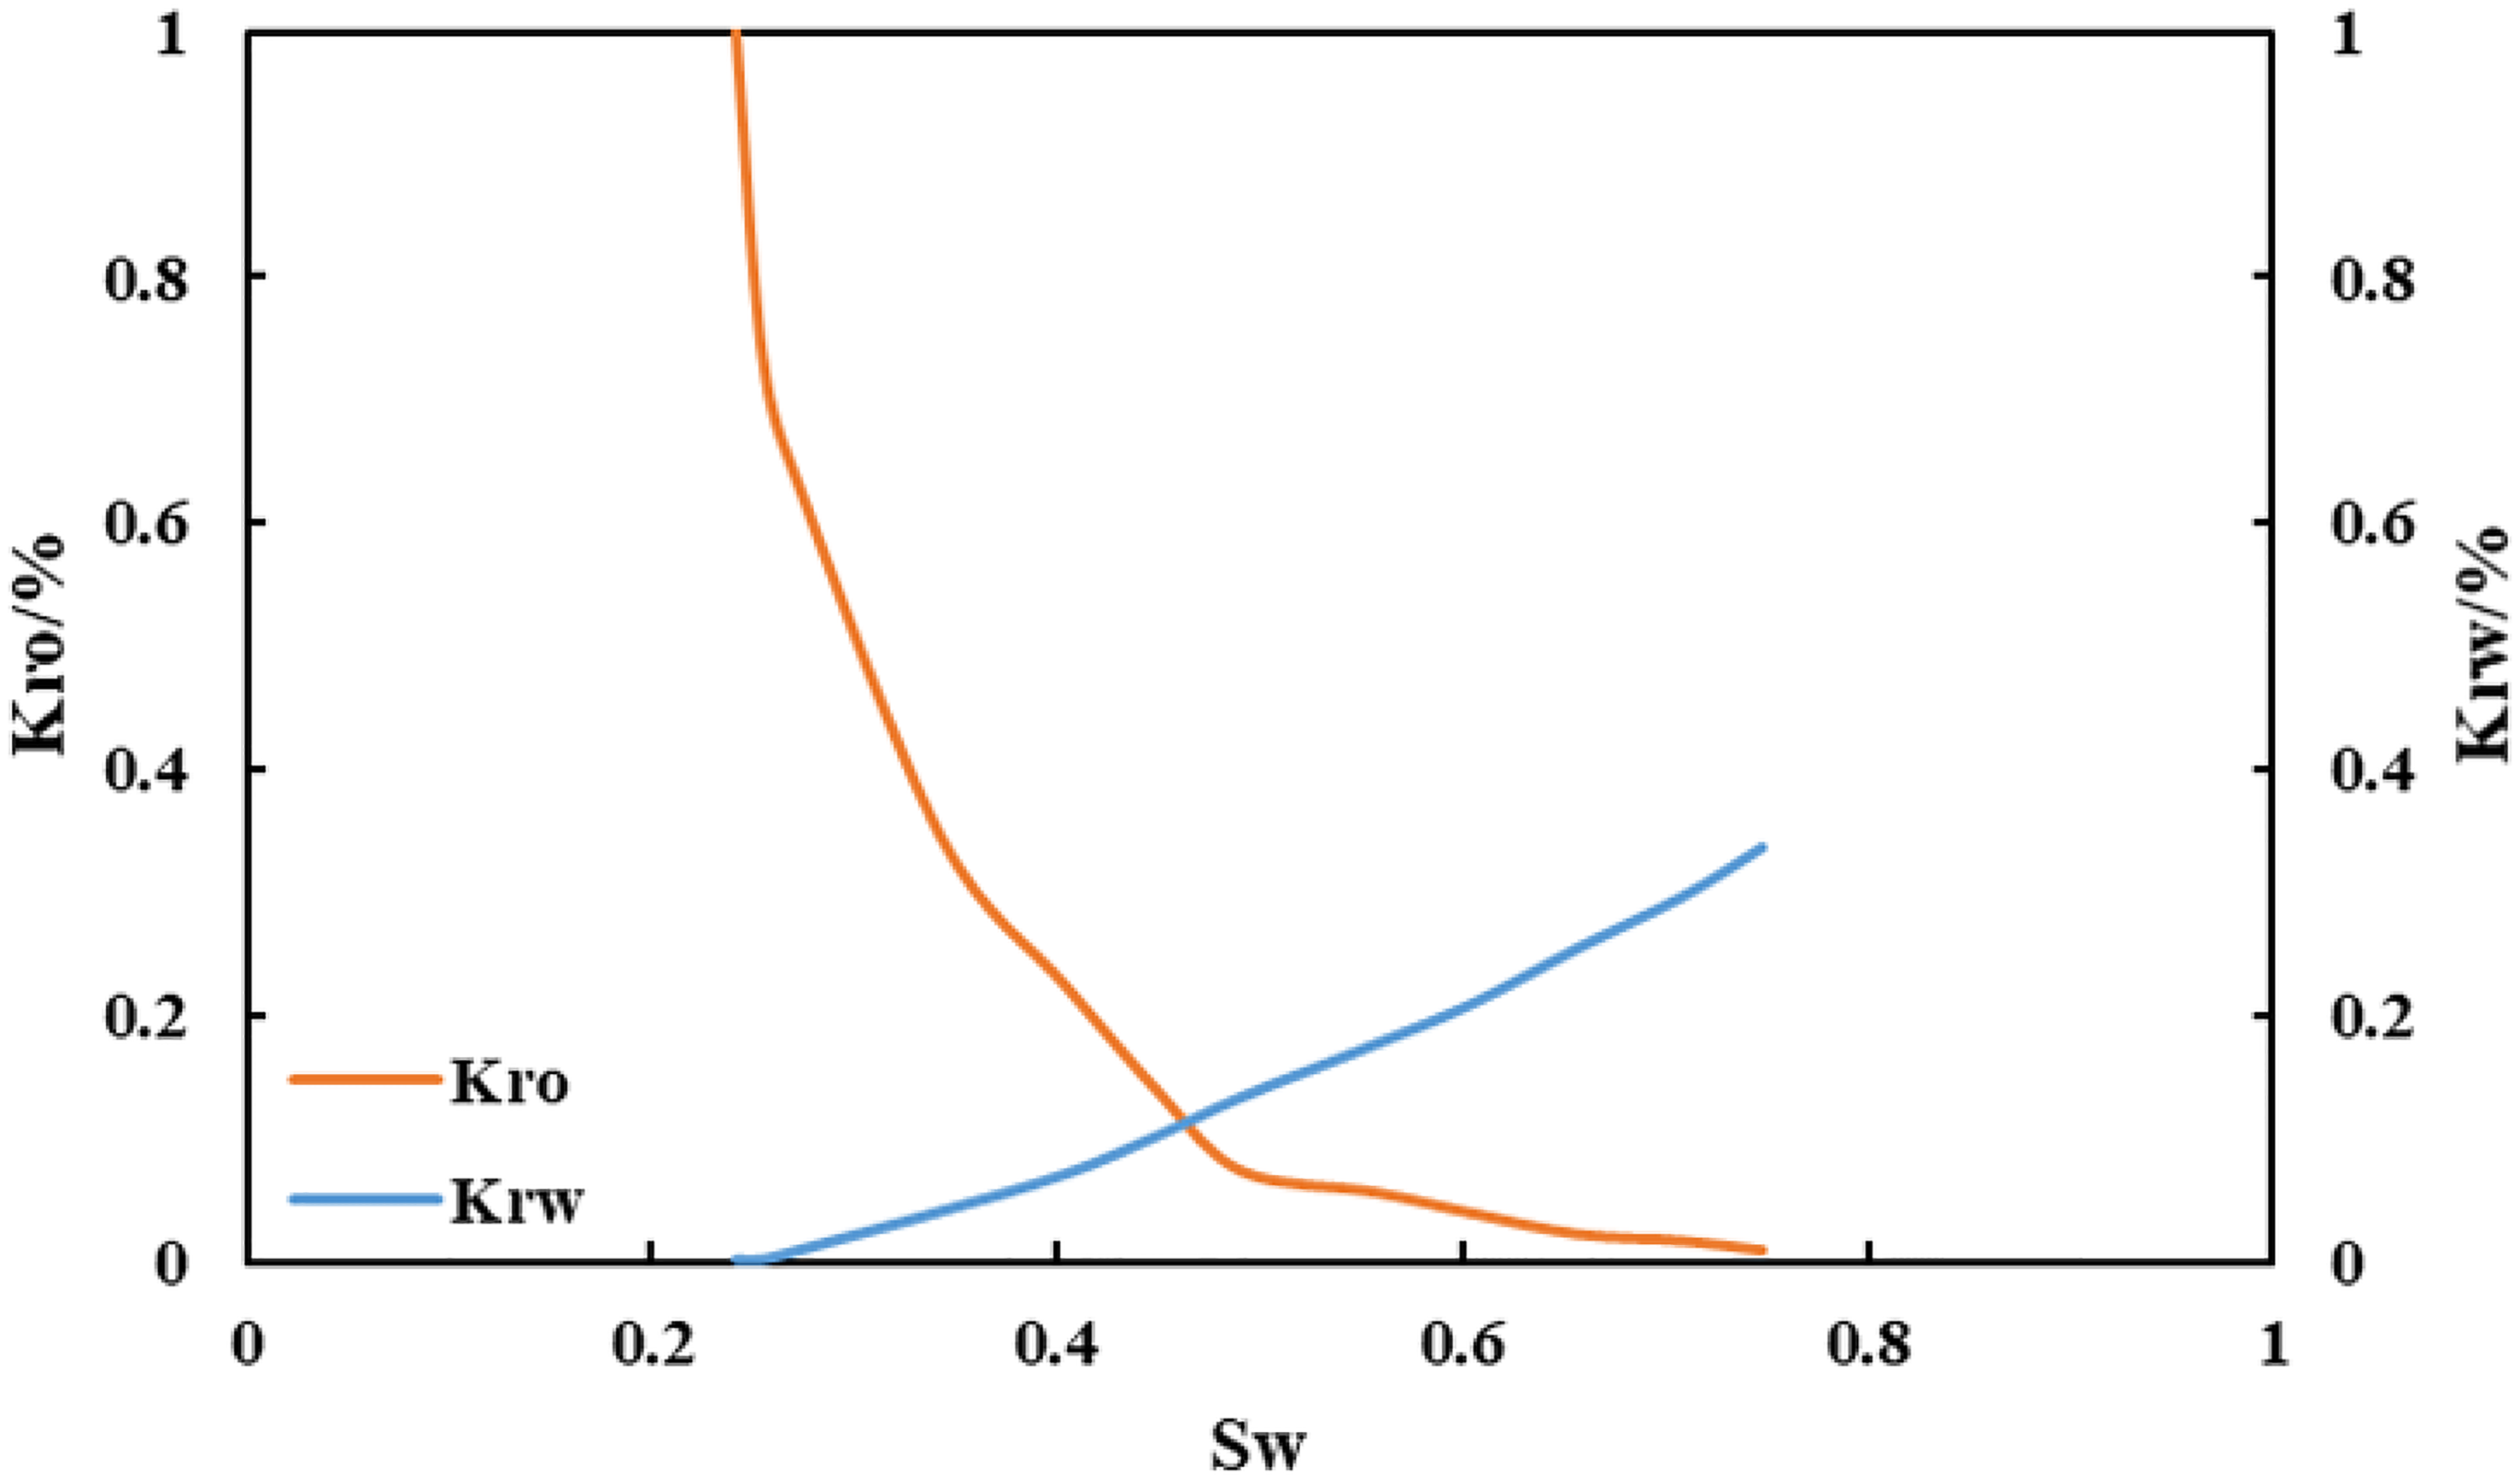
The single-layer homogeneous low injection and high production model of one injection and one production is established to analyse the law of secondary enrichment of the remaining oil. The model grid is divided into 50 × 50 × 1, the grid step is 10 m, the porosity is 21%, the formation dip angle is 15°, the permeability is 500 mD in the X and Y directions, the permeability is 50 mD in the Z direction, the reference depth is 1800 m, the oil-water interface is 2500 m, the reference pressure is 19 MPa, and the injection and production well distance is 250 m. The crude oil density is 844 kg·m−3, the formation crude oil viscosity is 2 mPa·s, the crude oil volume factor is 1.07, the water phase density is 1000 kg·m−3, and the water phase viscosity is 0.8 mPa·s. The injection volume and production volume are both 120 m3·d−1. The model plan is shown in Figure 1, and the oil-water relative permeability curve is shown in Figure 2.
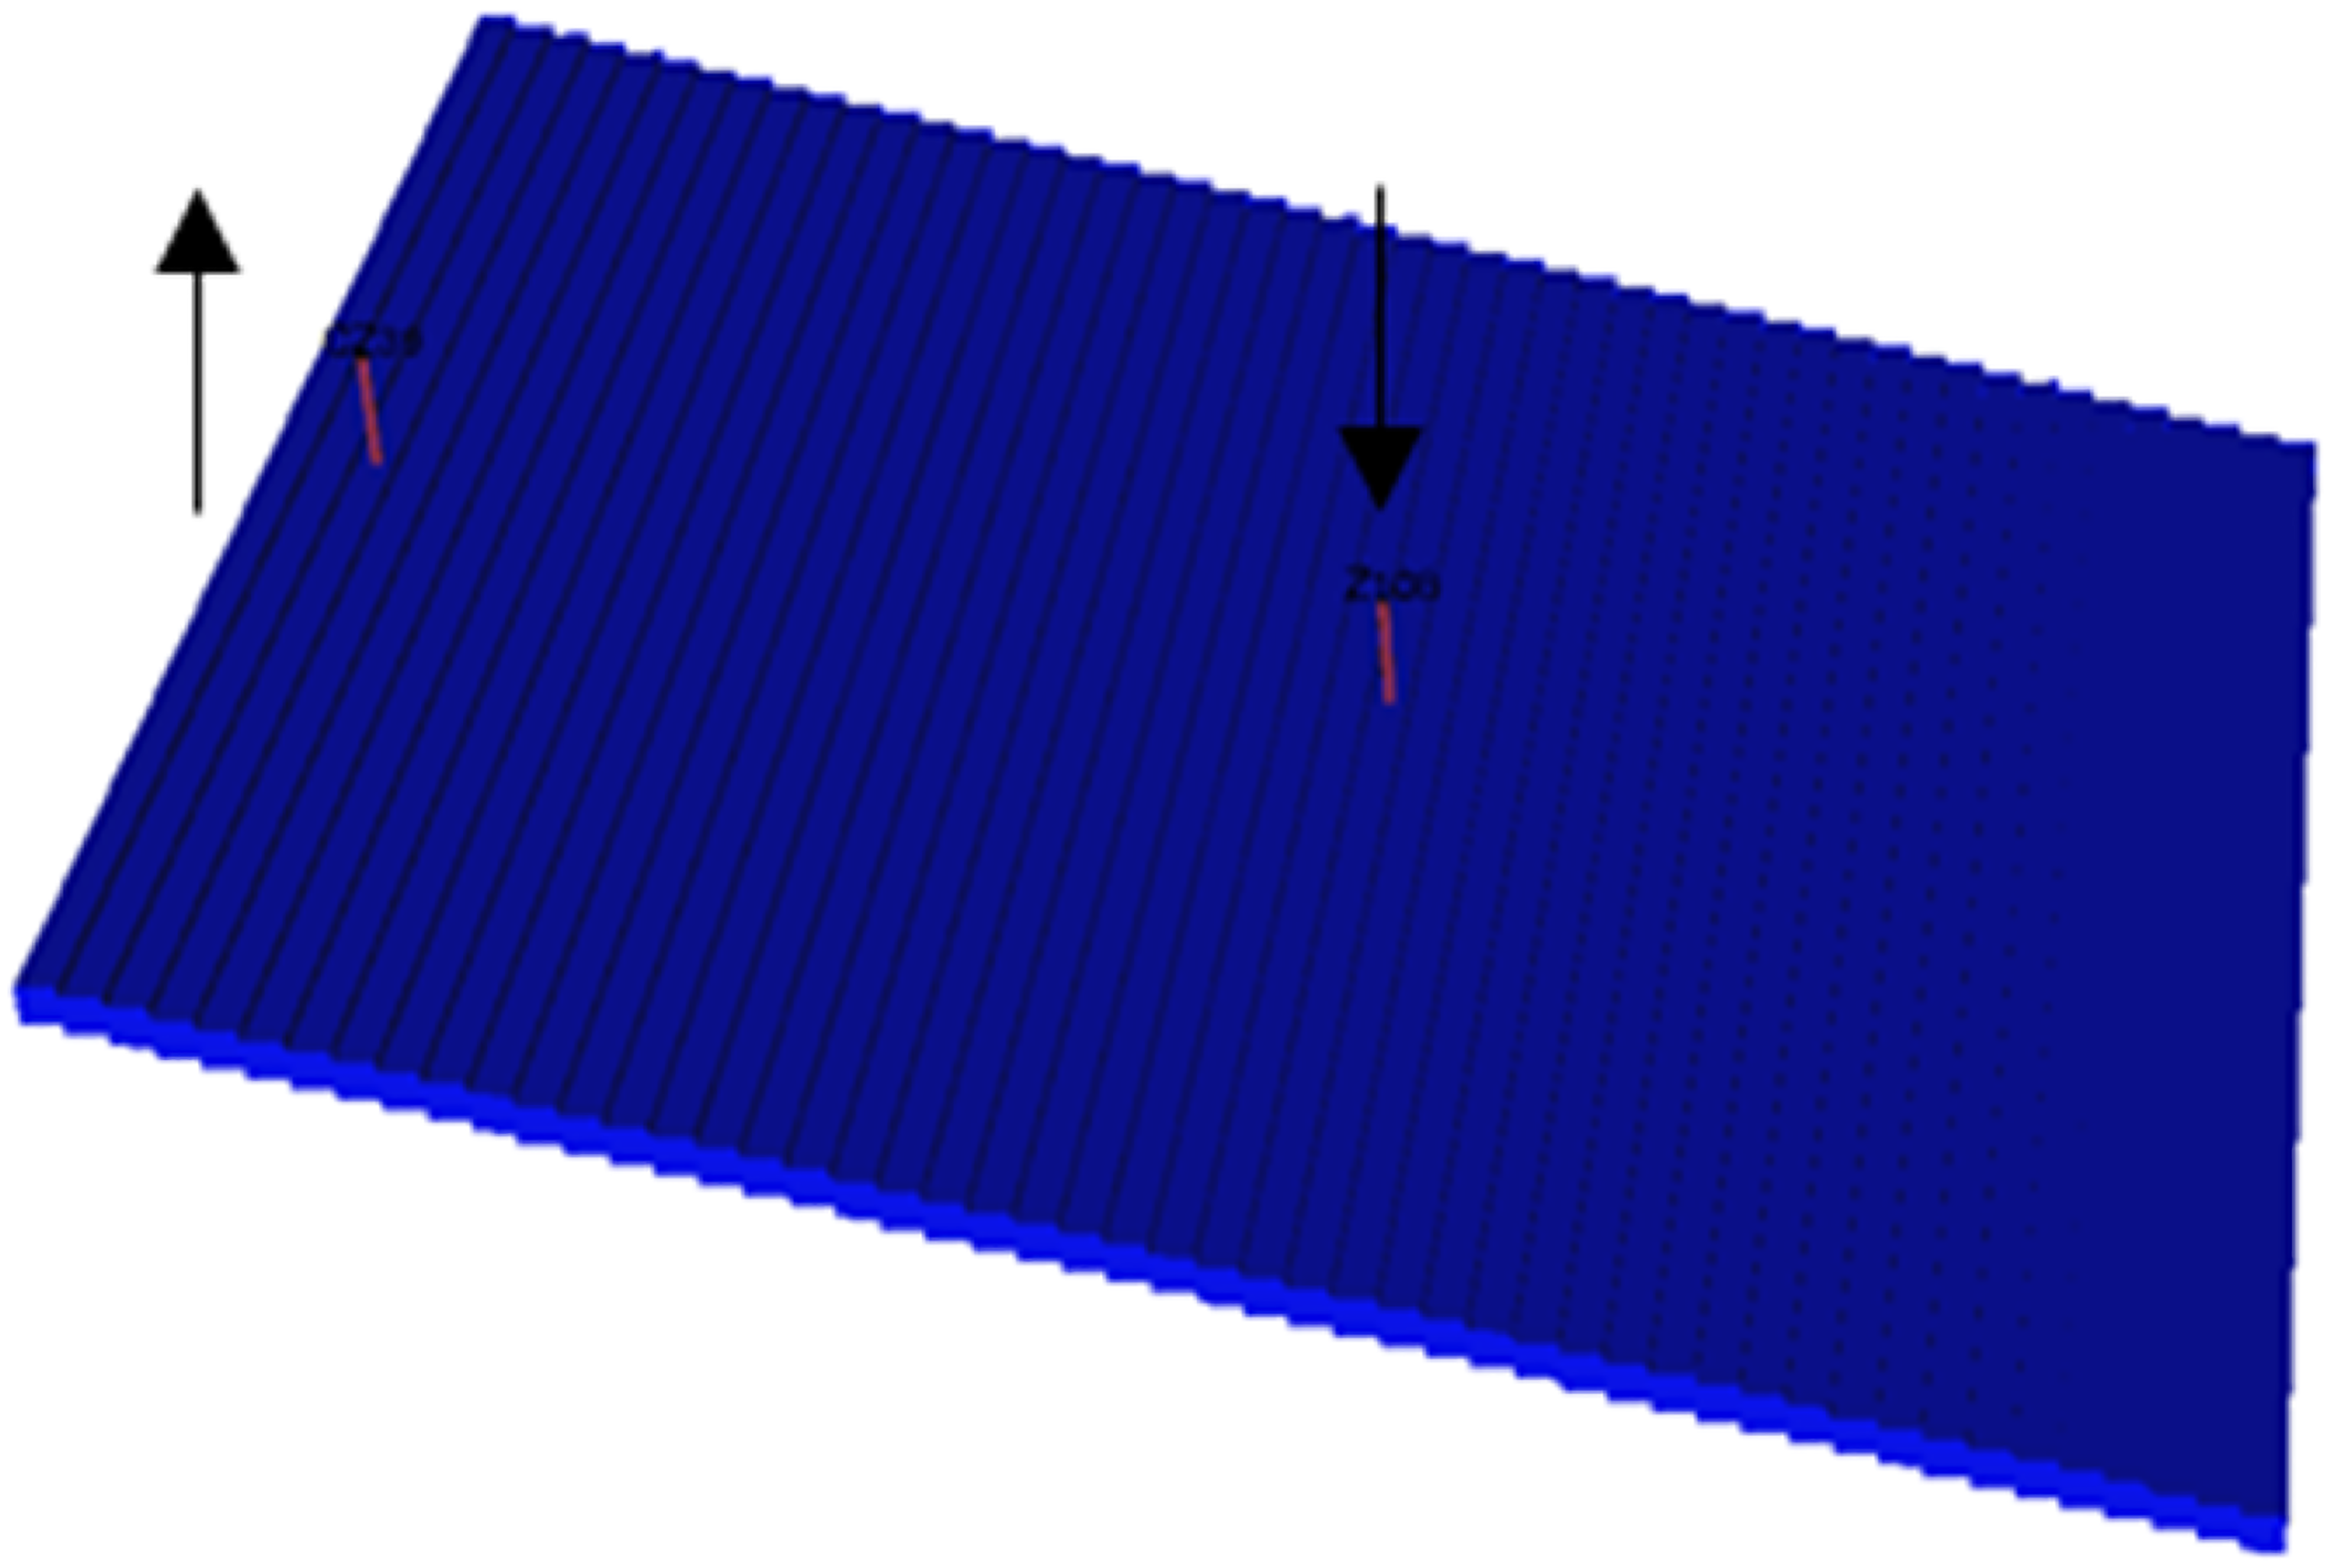
Planar single-layer model diagram.
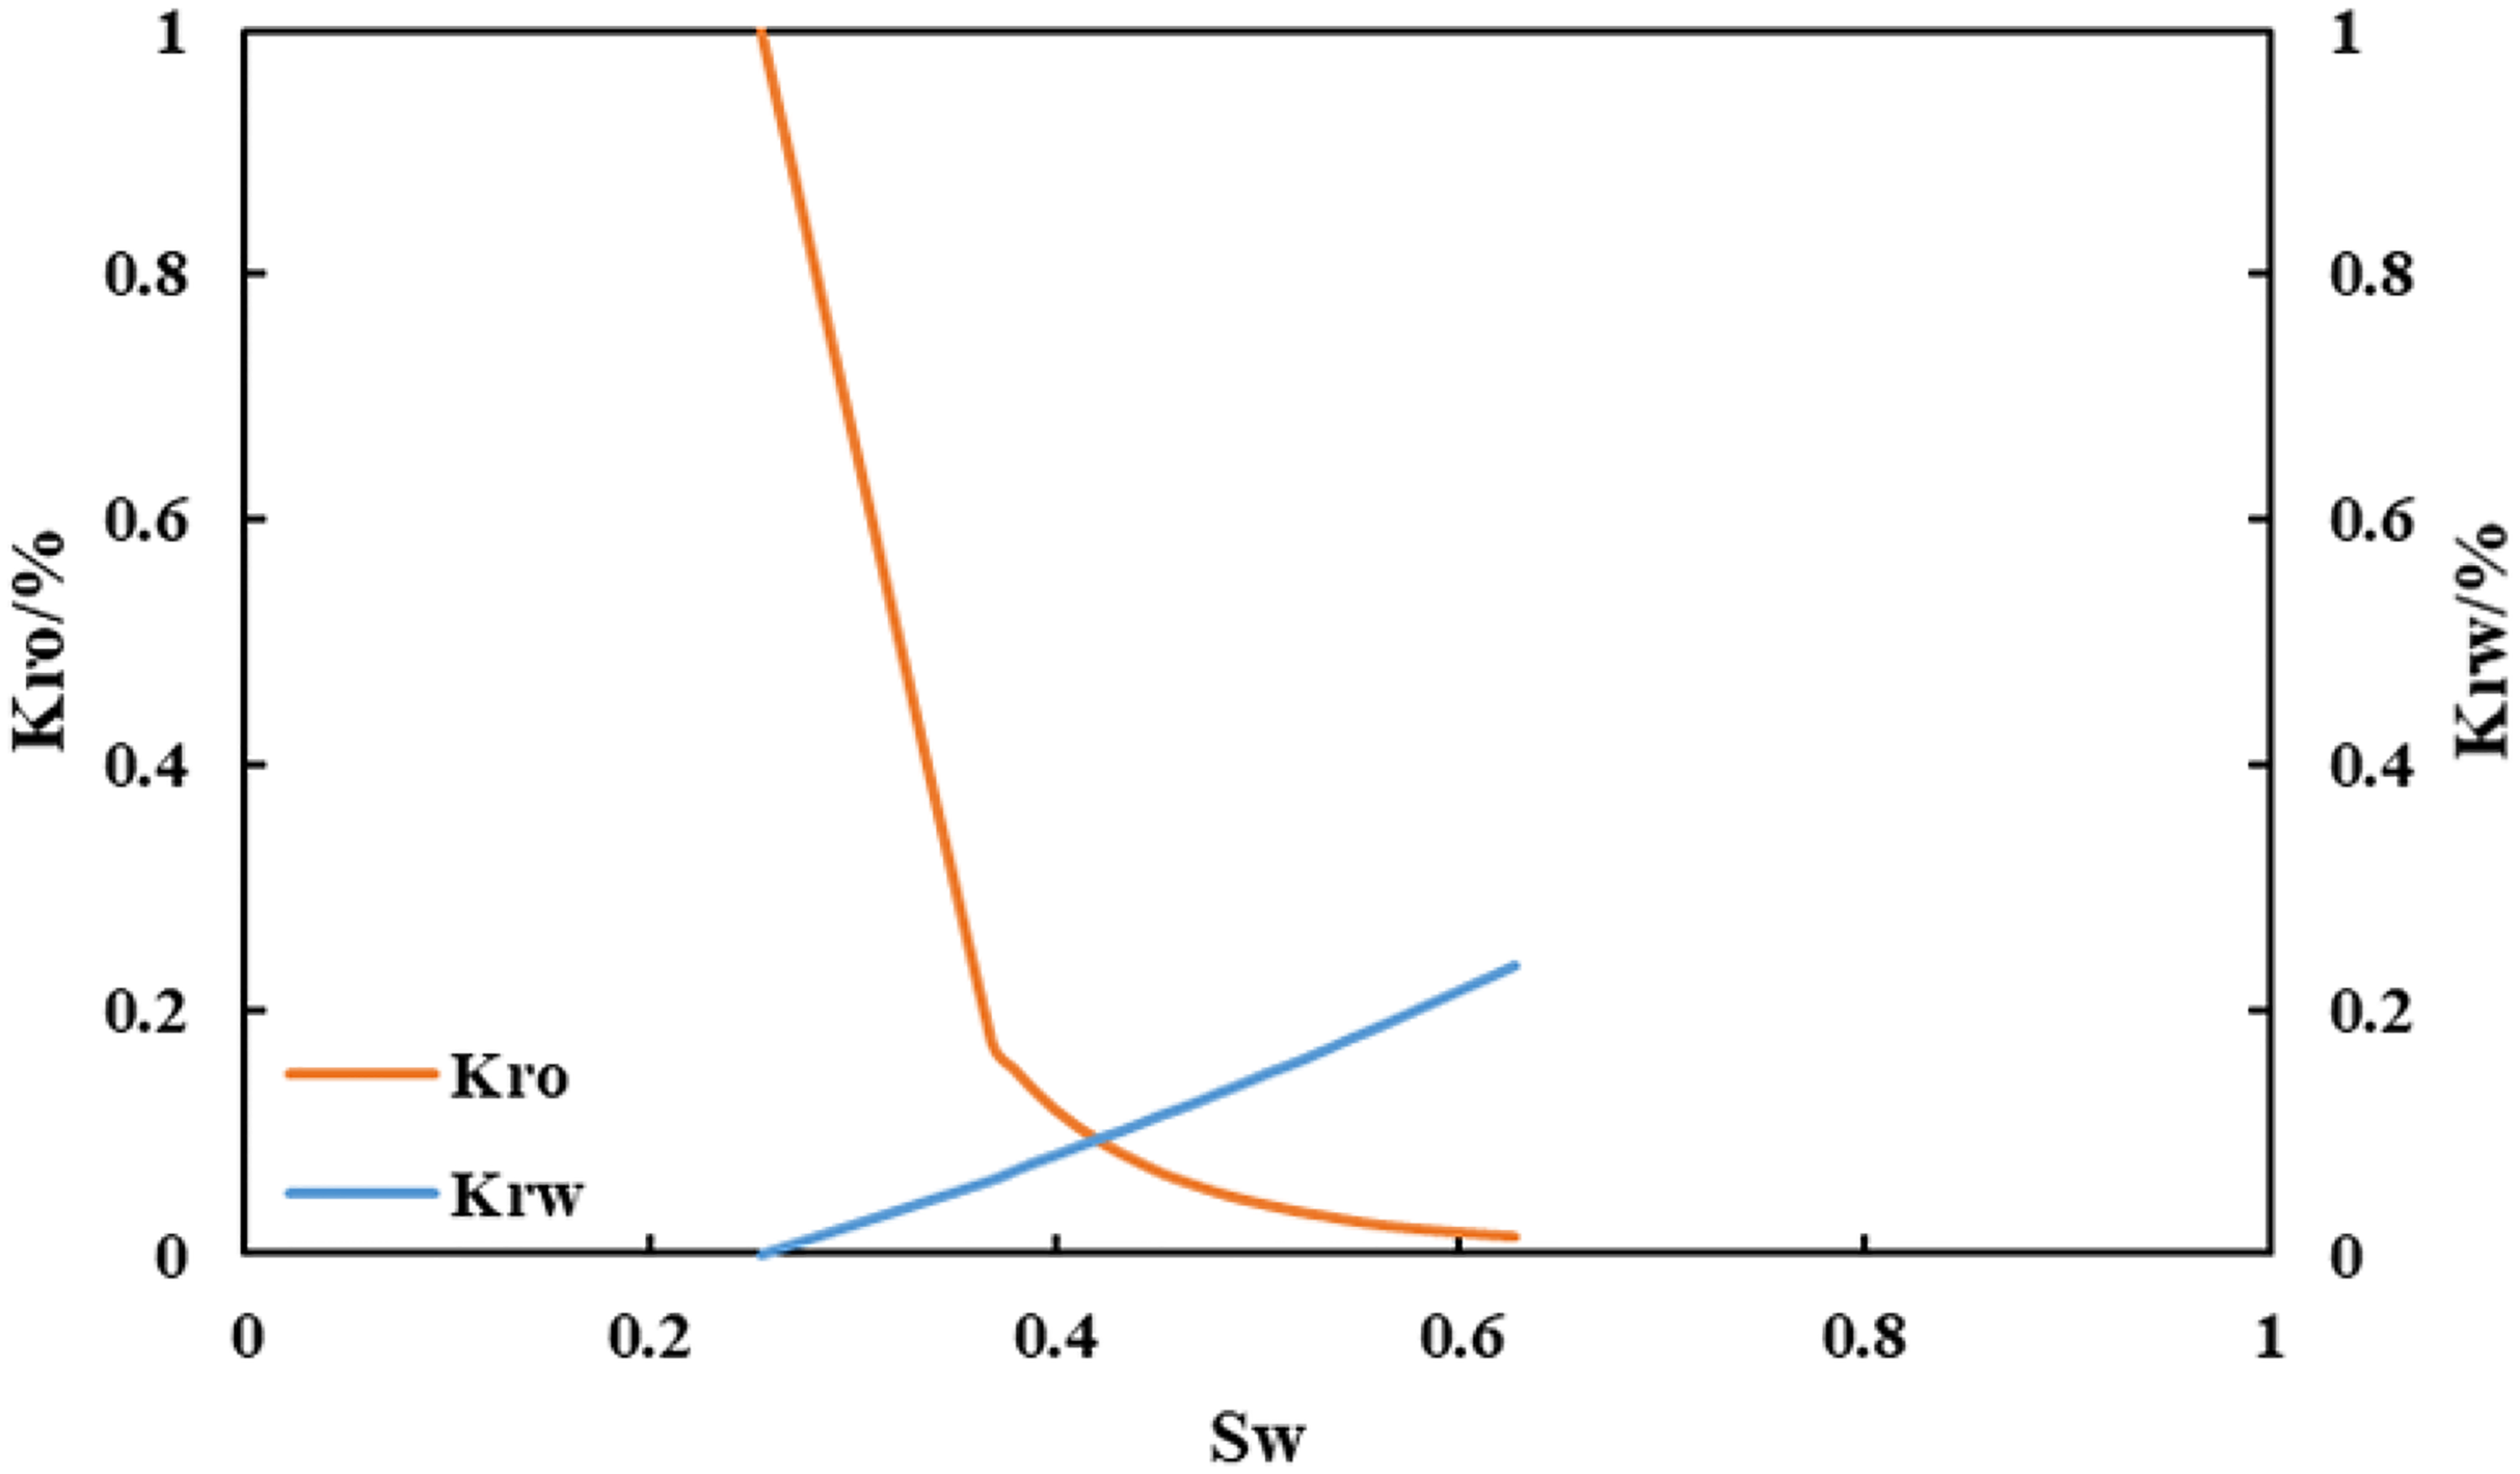
The oil–water relative permeability curve.
Results
Secondary enrichment law of the remaining oil
The injection production well was shut down after water flooding until the water cut reached 95%, and the secondary enrichment law of the remaining oil was observed after shutting in. Figure 3 shows the oil saturation variation diagram under different shut times. The figure shows that the fault plays a role in blocking the migration of the remaining oil. As the well is shut in for a long time, the remaining oil is continuously enriched to the fault at the high part under the gravity separation of oil and water. After reaching the initial oil saturation, the remaining oil is continuously enriched along the fault towards the lower production well. The horizontal enrichment sequence is from two sides to the middle, which finally increases the oil saturation at the production well.
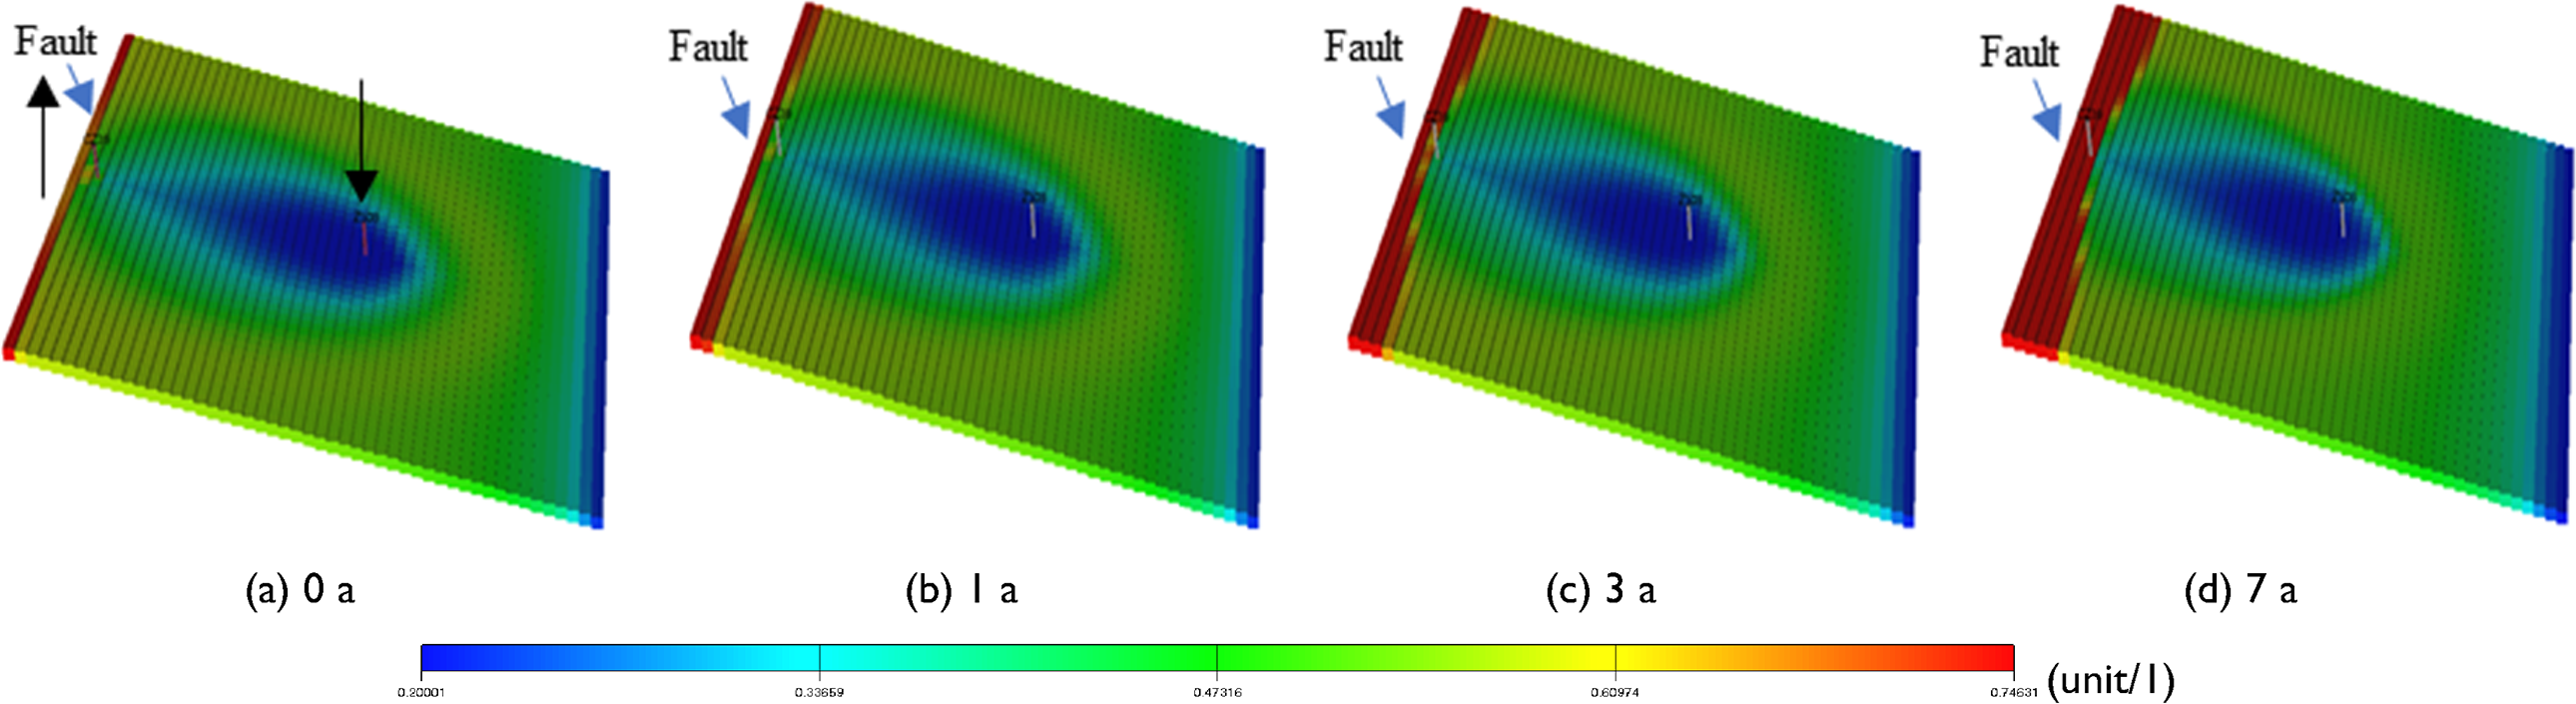
The oil saturation variation diagram under different shut times. Note: The left well point is production well CZ39 and the right well point is water injection well Z108. The oil saturation in the colour bar is a value between 0 and 1, dimensionless.
In this paper, the oil saturation of the production well point is taken as the evaluation standard of secondary enrichment of the remaining oil. According to the statistics of oil saturation of the production well point 1−10 years after well shut-in, the variation curve of oil saturation at the production well point under different shut-in times is obtained, as shown in Figure 4.
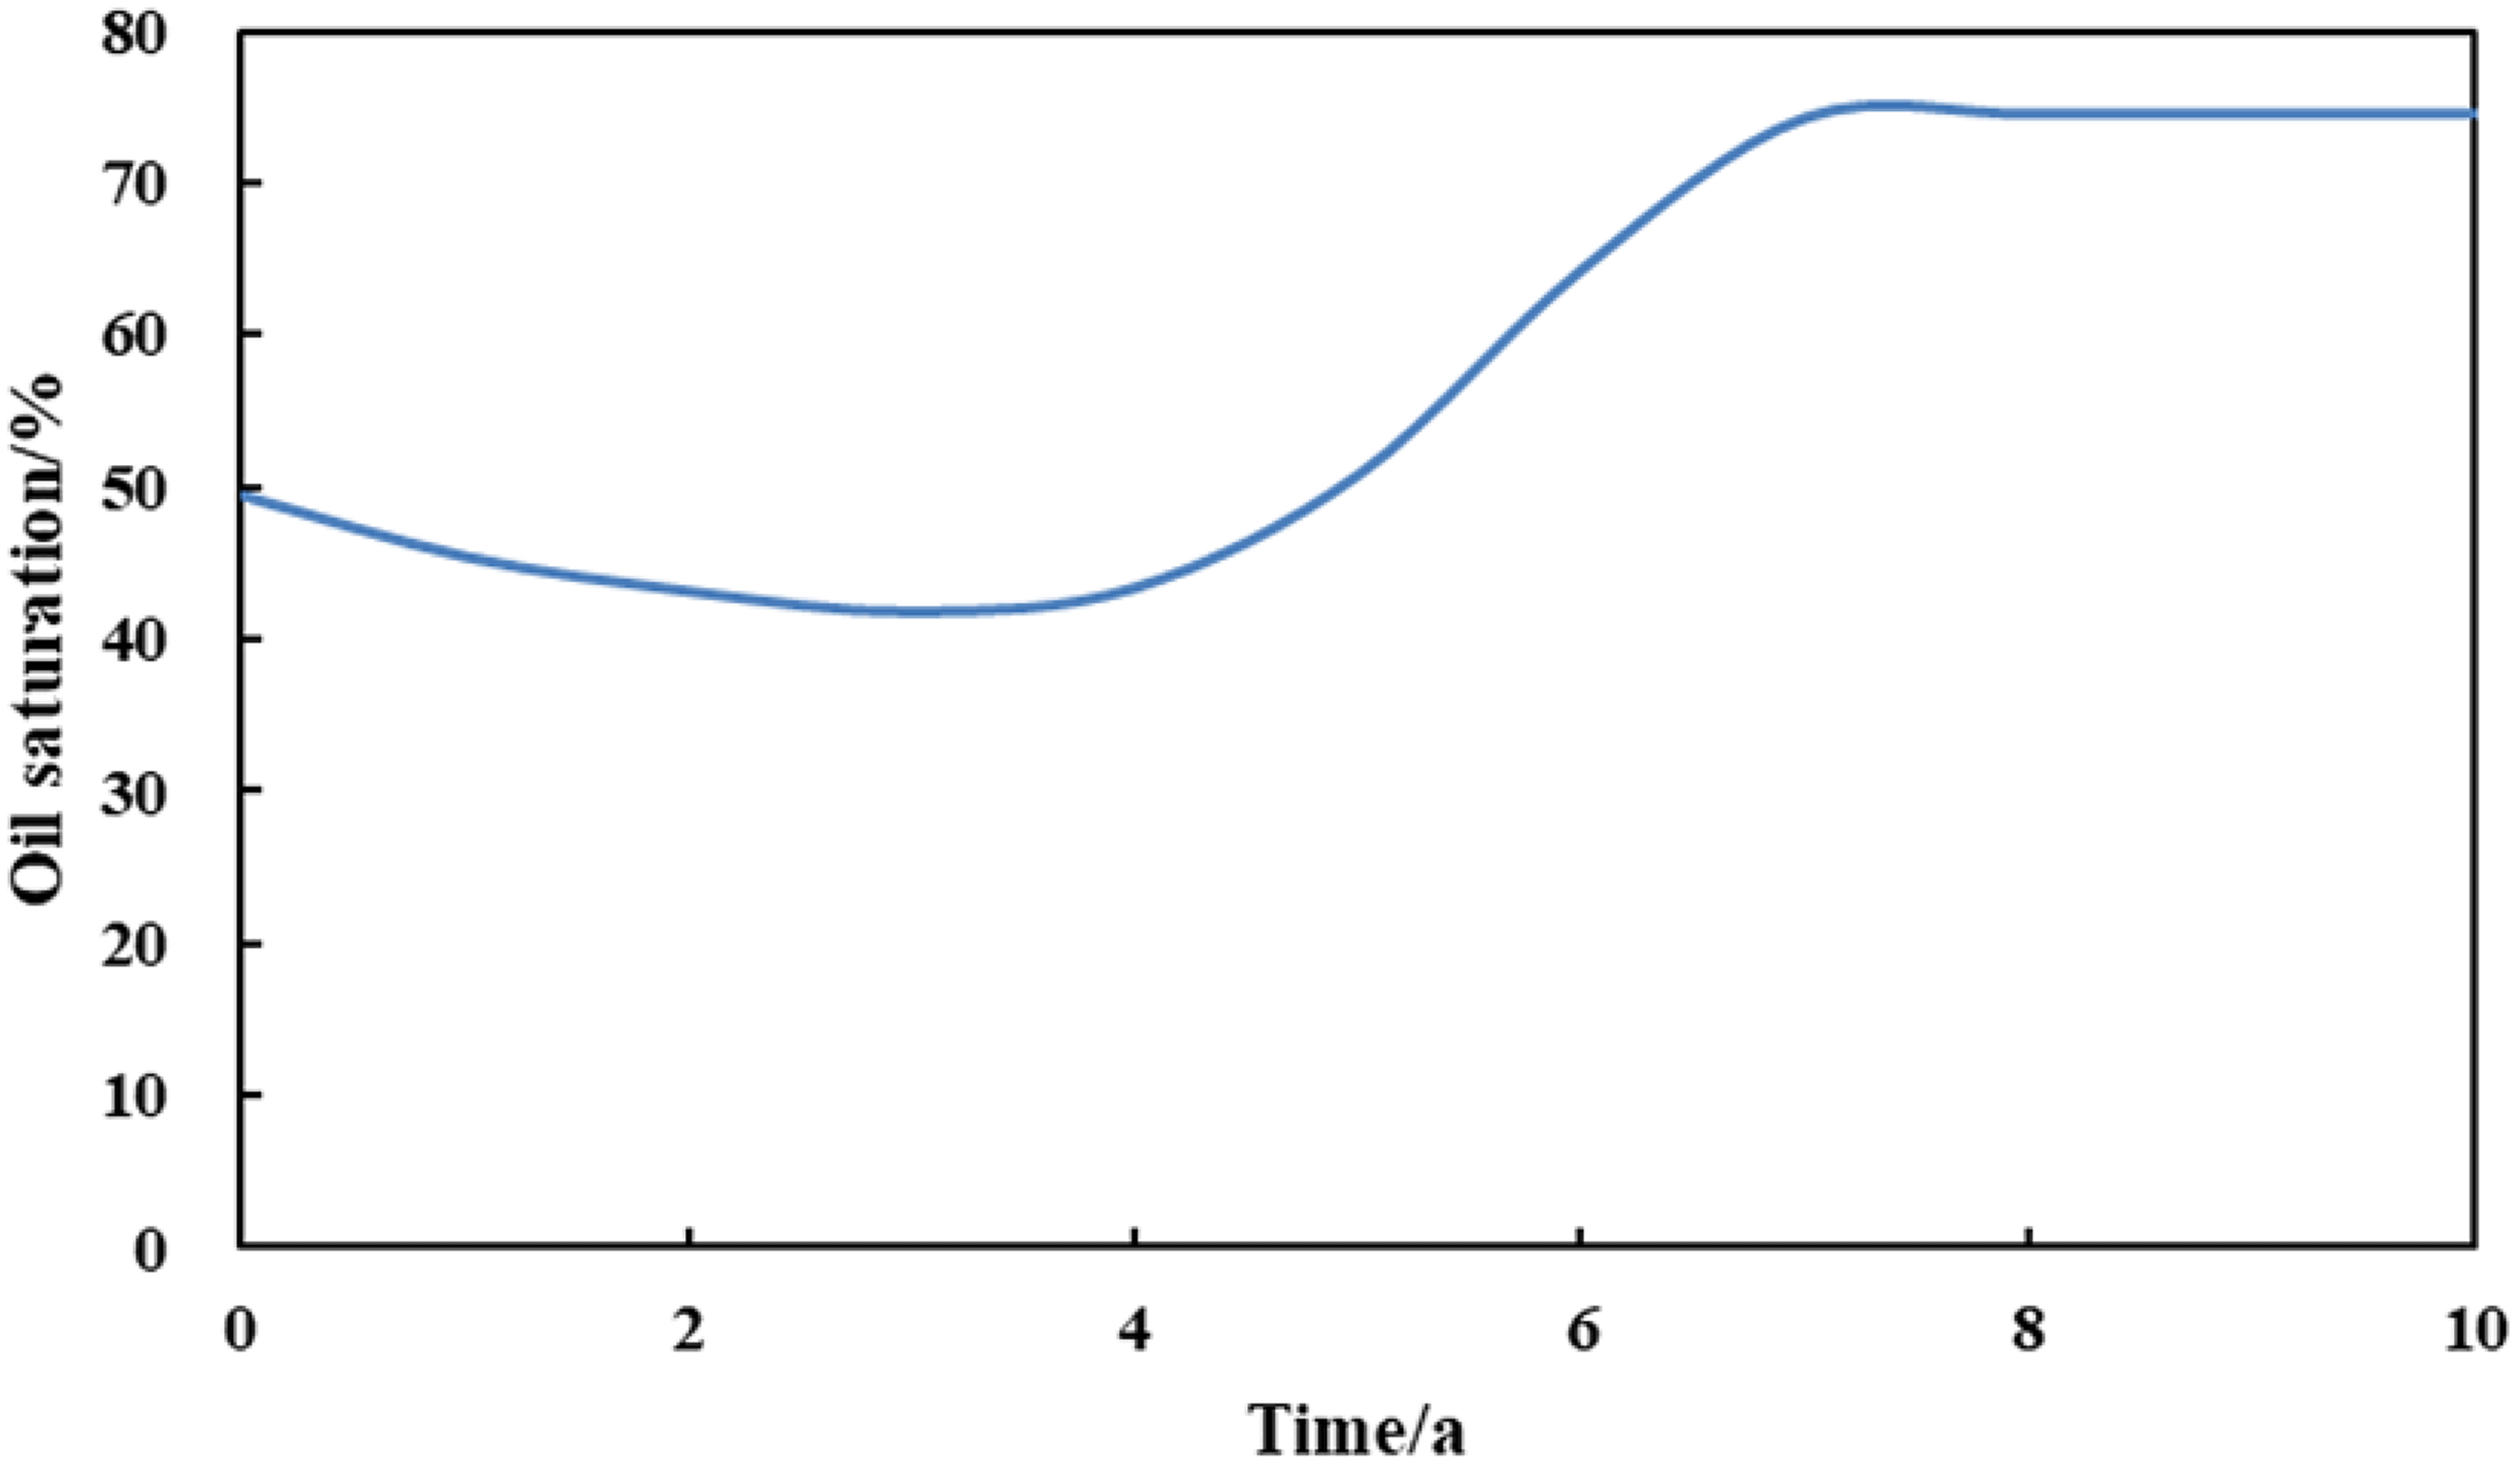
The variation curve of oil saturation at the production well point under different shut times.
In Figure 4, the X-axis is the time after the production well is shut in, and the Y-axis is the oil saturation of the production well point. According to the change curve of oil saturation at the production well point, the oil saturation decreases first, then increases, and finally tends to be gentle with increasing time after well shut-in. At the early stage of well shut-in, the remaining oil at the production well point continuously migrates to the fault at the high part. After the oil saturation at the high part reaches the maximum, the remaining oil continues to accumulate and spread downwards. After reaching the production well location, the oil saturation at the production well point continues to rise.
Mechanism of the secondary enrichment of the remaining oil
Pressure redistribution after well shut-in. The oil saturation, pressure, and pressure gradient of the model shown in Figure 3 at 0, 1, 3, and 7 years of well shut-in are plotted as the contour map of the corresponding time point, and the variation in each index with the time of well shut-in is analysed.
Figure 5 is the contour map of the oil saturation distribution of the whole zone at different well shut times. It can be seen from the figure that after the production and injection wells are closed, the remaining oil saturation on both sides of the mainstream line and the lower part of the water injection well is high. With the increase in shut-in time, the remaining oil on both sides of the mainstream will migrate and accumulate to the fault at the high part of the reservoir and spread to the production well in the middle so that the oil saturation of the production well point can be restored. The remaining oil in the lower part of the water injection well also migrates to the higher part of the water injection well with increasing shut-in time.
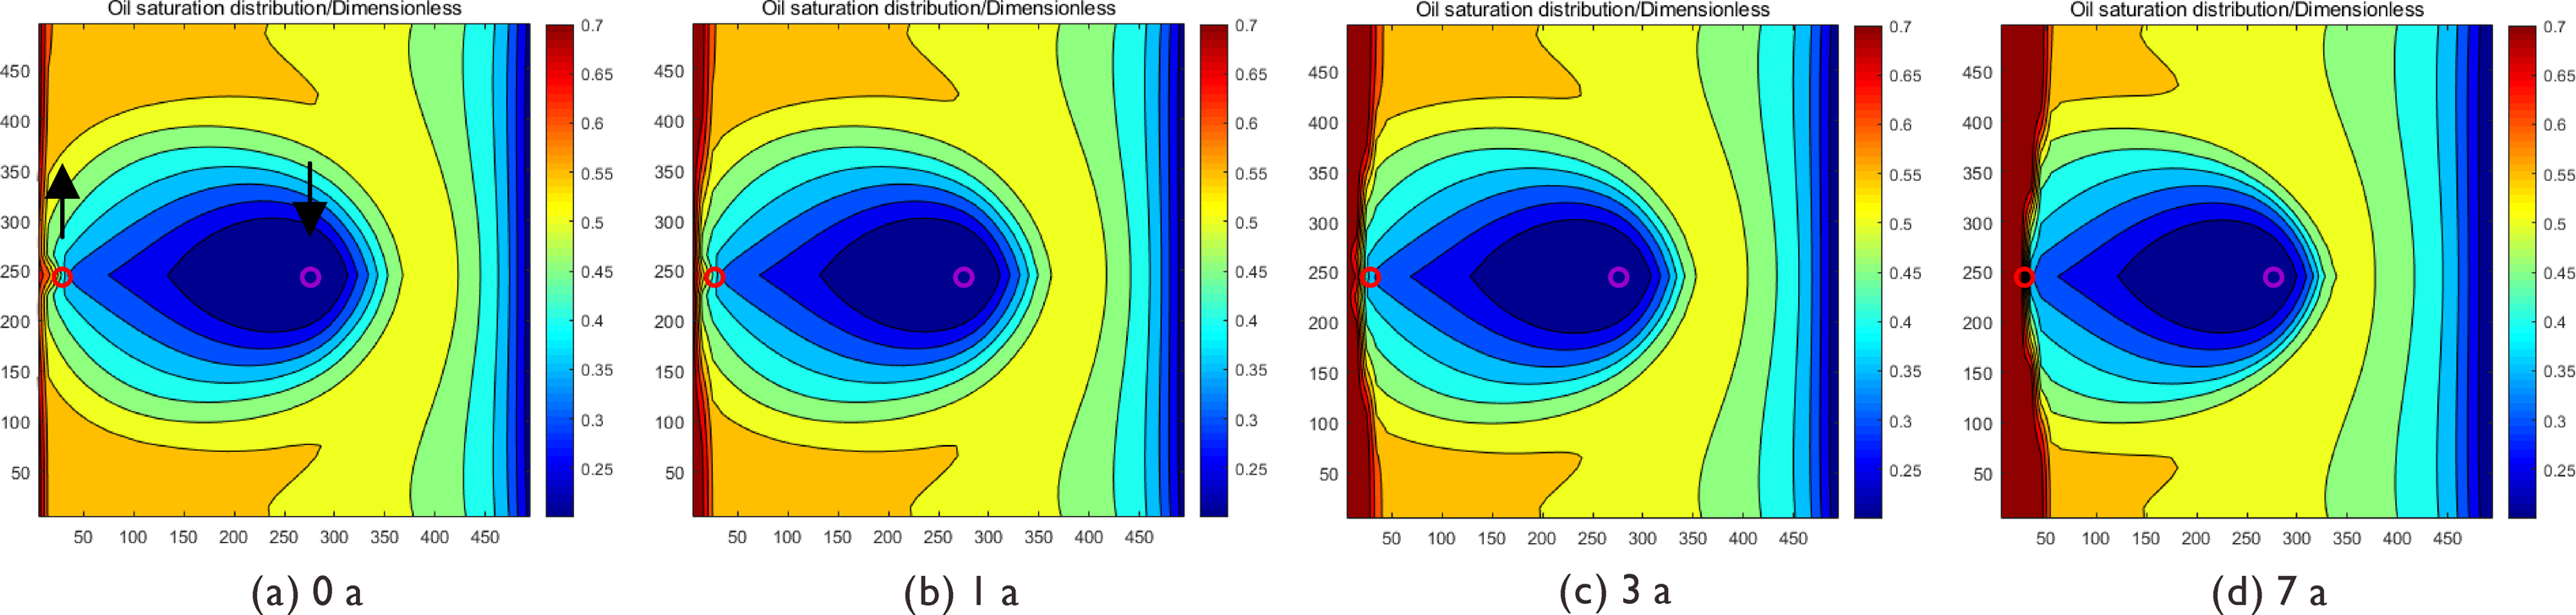
The contour map of the oil saturation distribution of the whole zone at different well shut times. Note: The left well point is production well CZ39, and the right well point is water injection well Z108.
Figure 6 is the contour map of the pressure distribution of the whole zone at different well shut times. The figure shows that when the well is shut in, the pressure from the production well to the fault boundary is the minimum, the pressure around the water injection well is greater, and the pressure at the boundary of the lower part is the maximum. After the oil and water wells are closed, the pressure is redistributed, the vicinity of the production well becomes a low-pressure area, the remaining oil migrates from the high-pressure area to the low-pressure area, and finally, the pressure in the reservoir at different heights tends to be smoothly distributed.
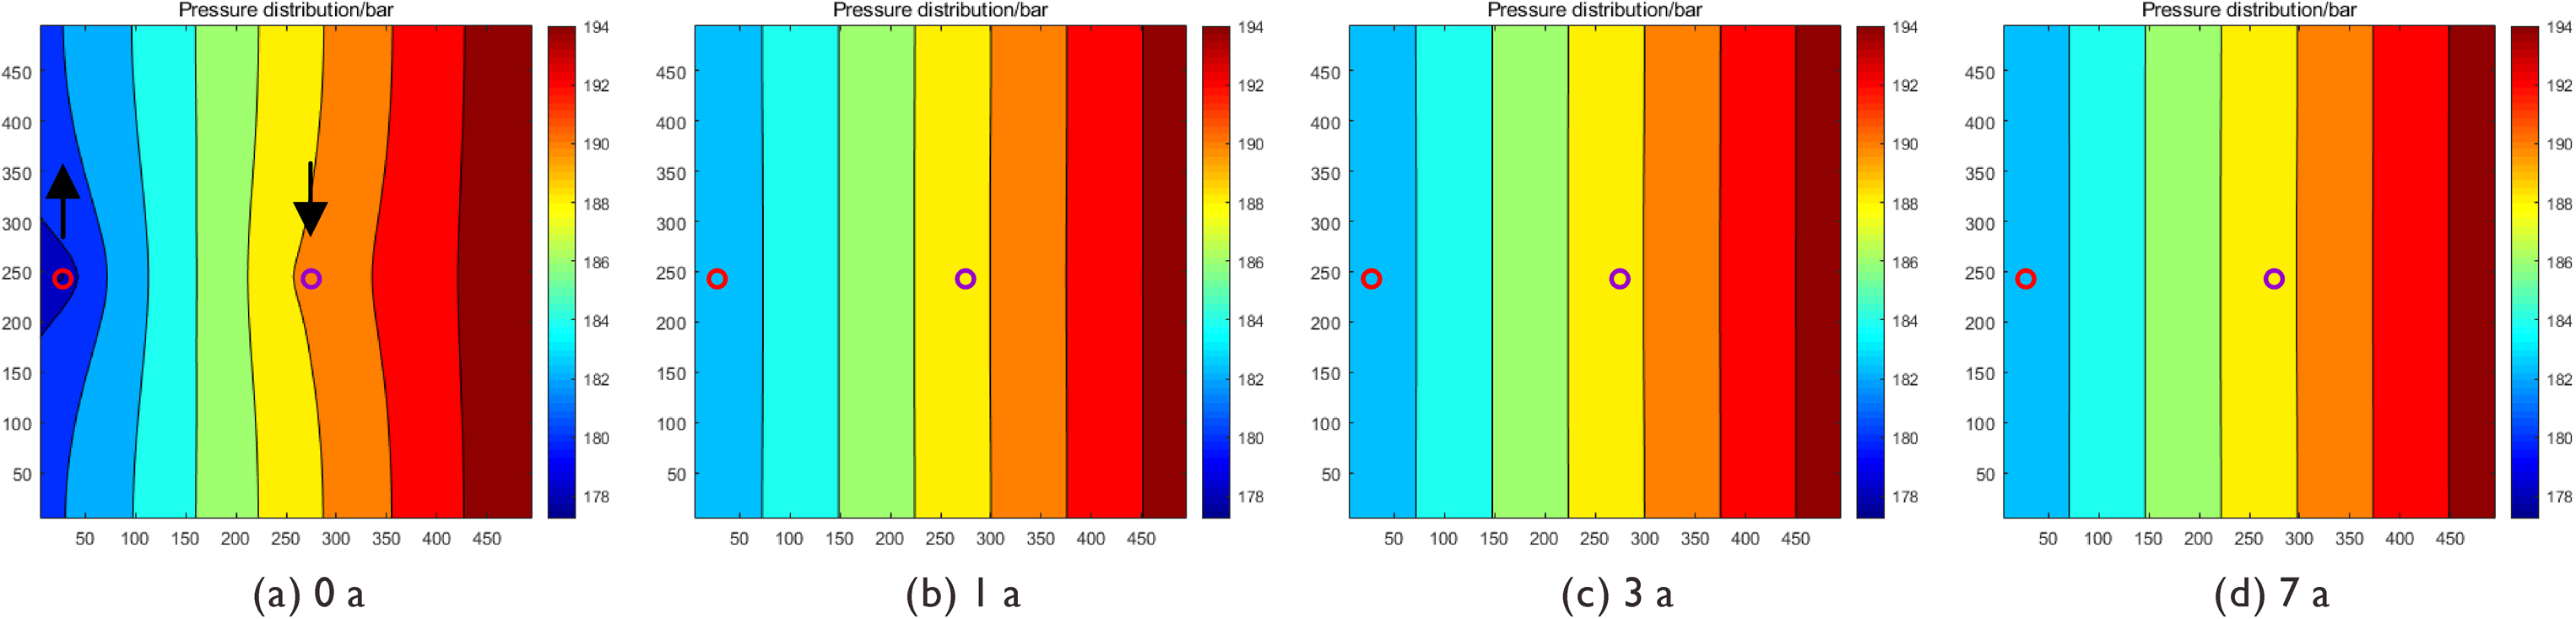
The contour map of the pressure distribution of the whole zone at different well shut times. Note: The left well point is production well CZ39, and the right well point is water injection well Z108.
Figure 7 is the contour map of the pressure gradient distribution of the whole zone at different well shut times. The figure shows that the pressure gradient at the production and injection wells is higher than that in the surrounding area when the wells are shut in, and the pressure gradient at the production wells is the largest. After the production and injection wells are closed, the overall pressure gradient in the whole area is one order of magnitude smaller than that before the wells are closed. The pressure gradient in the middle and low parts is higher than that in the high parts and spreads continuously to the high parts. The low-pressure gradient area in the high parts spreads continuously to the lower part. The pressure gradient at the production well decreases as the oil saturation increases.
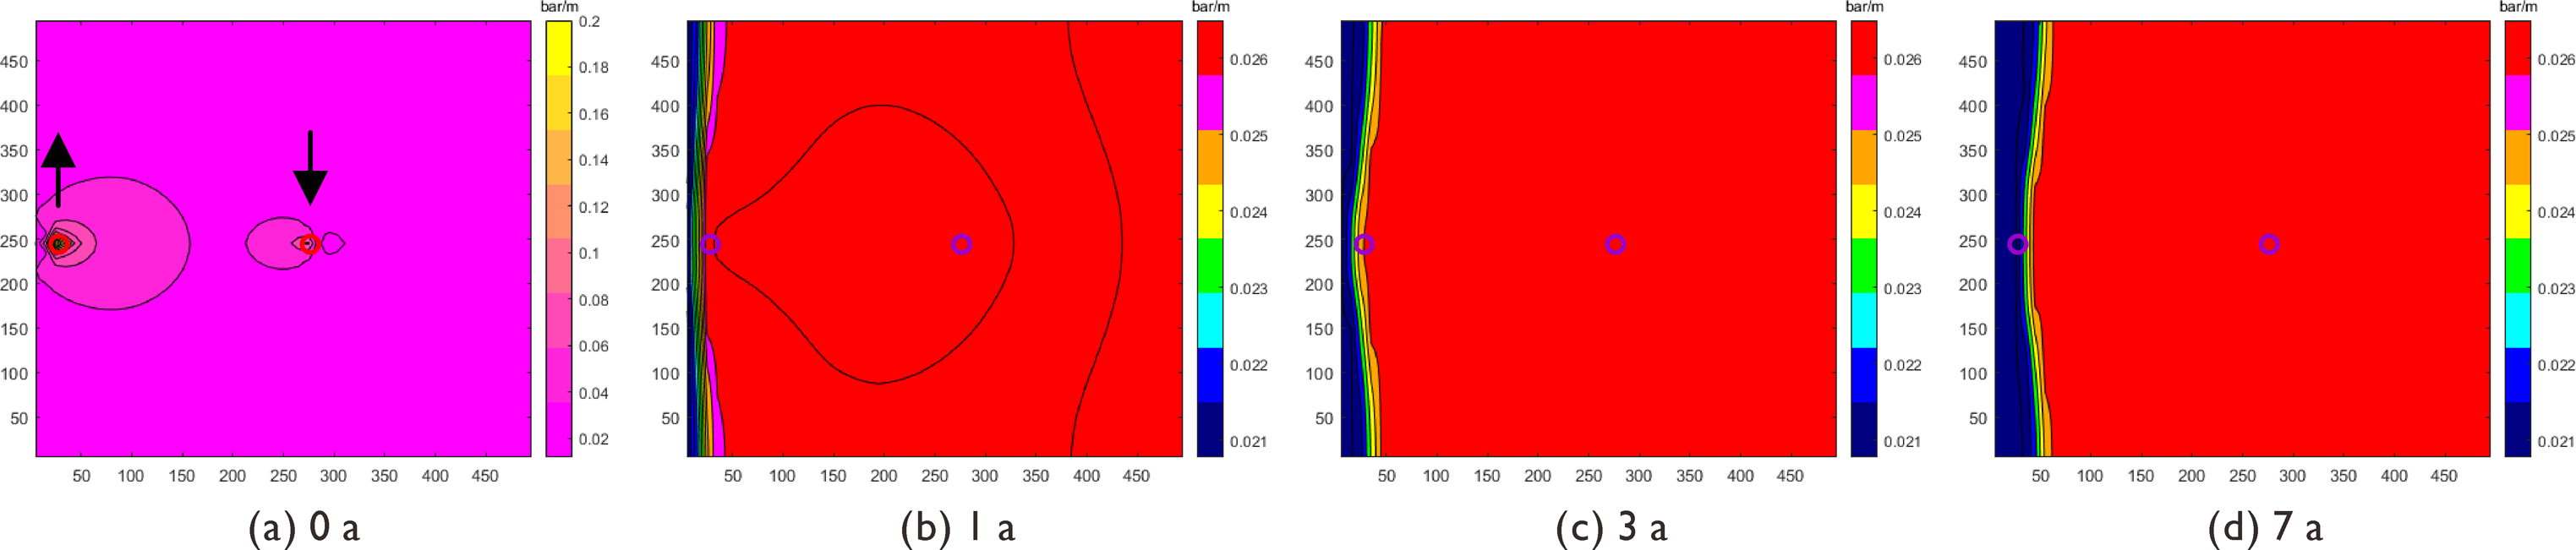
The contour map of the pressure gradient distribution of the whole zone at different well shut times. Note: The left well point is production well CZ39, and the right well point is water injection well Z108.
The gradual change in the oil saturation distribution is related to the secondary enrichment process of the remaining oil. The secondary enrichment of the remaining oil is reflected in the trend of enrichment at the high part and gradually diffuses downwards, which is consistent with the changing trend of the oil saturation distribution. The gradual change in the pressure gradient distribution is related to the flow trend of crude oil. After shutting down the well, the crude oil in the middle and low parts is transported to the high part under the effect of the pressure difference. After the crude oil is enriched in the high part, the mobility decreases, and the enriched position keeps expanding to the low part, resulting in a higher pressure gradient in the middle and low parts compared to the high part, and the low-pressure gradient area keeps expanding to the low part. The sudden change in the pressure distribution in the schematic diagram is related to the pressure redistribution after the oil and water wells are shut in. The influence of the external injection-production pressure difference is eliminated after the oil and water wells are shut in, and the formation pressure is redistributed at different depths and quickly reaches the equilibrium state. Because the time interval shown in Figure 6 is 1 year or more, it shows the sudden change in the formation pressure distribution during and after the oil and water wells are shut in.
The combined effect of microscopic forces. The remaining oil migrates in the form of small oil droplets and columns in the pores. Small oil droplets are mainly affected by the displacement force, combined force of gravity and buoyancy, and viscous force. On the basis of these forces, the remaining columnar oil is also affected by capillary forces, including wedge pressure effect resistance and hysteresis effect resistance. The single pore equal diameter capillary is selected to analyse the force on the migration of the remaining oil after secondary enrichment. The force equations for small droplet-shaped remaining oil and column-shaped remaining oil along the dip direction of the formation are shown in equations (1) and (2).

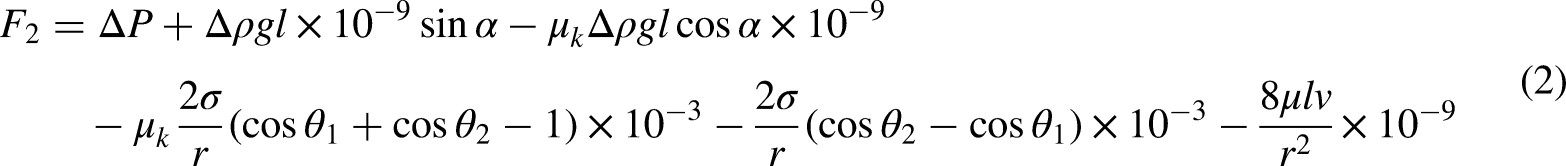
From equations (1) and (2), it can be seen that the maximum remaining oil transport resistance is 10−3 orders of magnitude, which is less than the sum of the buoyancy and gravity combined force and displacement pressure difference. Under the comprehensive force, the resultant force of the remaining oil is greater than zero, and the remaining oil can migrate to the high part along the formation dip direction independently.
To further study the secondary enrichment mechanism of the remaining oil in the vertical direction and compare it with the high permeability single layer model, a heterogeneous high injection low production model in one injection one production layer is established to analyse the vertical migration characteristics of the remaining oil after the oil and water wells are shut in.
The model grid is divided into 50 × 50 × 10. The grid step in the X direction and Y direction is 10 m, and the grid step in the Z direction is 1 m. The model porosity is 10%, the permeability in the X direction and Y direction is 20−100 mD, the permeability grade difference is 5, and the permeability in the Z-direction is taken as 2 mD, 4 mD and 6 mD for comparison. The reference depth of the model is 1800 m, the oil-water interface is 2500 m, the reference pressure is 19 MPa, the injection-production well spacing is 250 m, the formation dip angle is 15°, the crude oil density is 844 kg·m−3, the viscosity of the formation crude oil is 10 mPa·s, the crude oil volume coefficient is 1.07, the water phase density is 1000 kg·m−3, and the water phase viscosity is 0.8 mPa·s. The injection volume and production volume are both 120 m3·d−1. The vertical heterogeneity model is shown in Figure 8, and the oil-water relative permeability curve is shown in Figure 9.
The positive rhythm heterogeneous model diagram.
The oil–water relative permeability curve.
The Z-direction permeability (expressed in KZ) is selected as 2 mD, 4 mD and 6 mD to establish numerical models to compare and analyse the secondary enrichment effect of the remaining oil.
Figure 10 shows the enlarged oil saturation profile after well shut-in with different vertical permeabilities. The figure shows that the remaining oil is enriched to the high part of the reservoir and the top layer under the action of the micro force. The increase in vertical permeability will enhance the mobility and speed of remaining oil migration to the upper part. Under the same shut-in time, the greater the vertical permeability is, the larger the secondary enrichment area of the remaining oil in the middle and upper layers at the low part of the production wells and the high part above the injection wells, and the lower the oil saturation in the bottom layer.
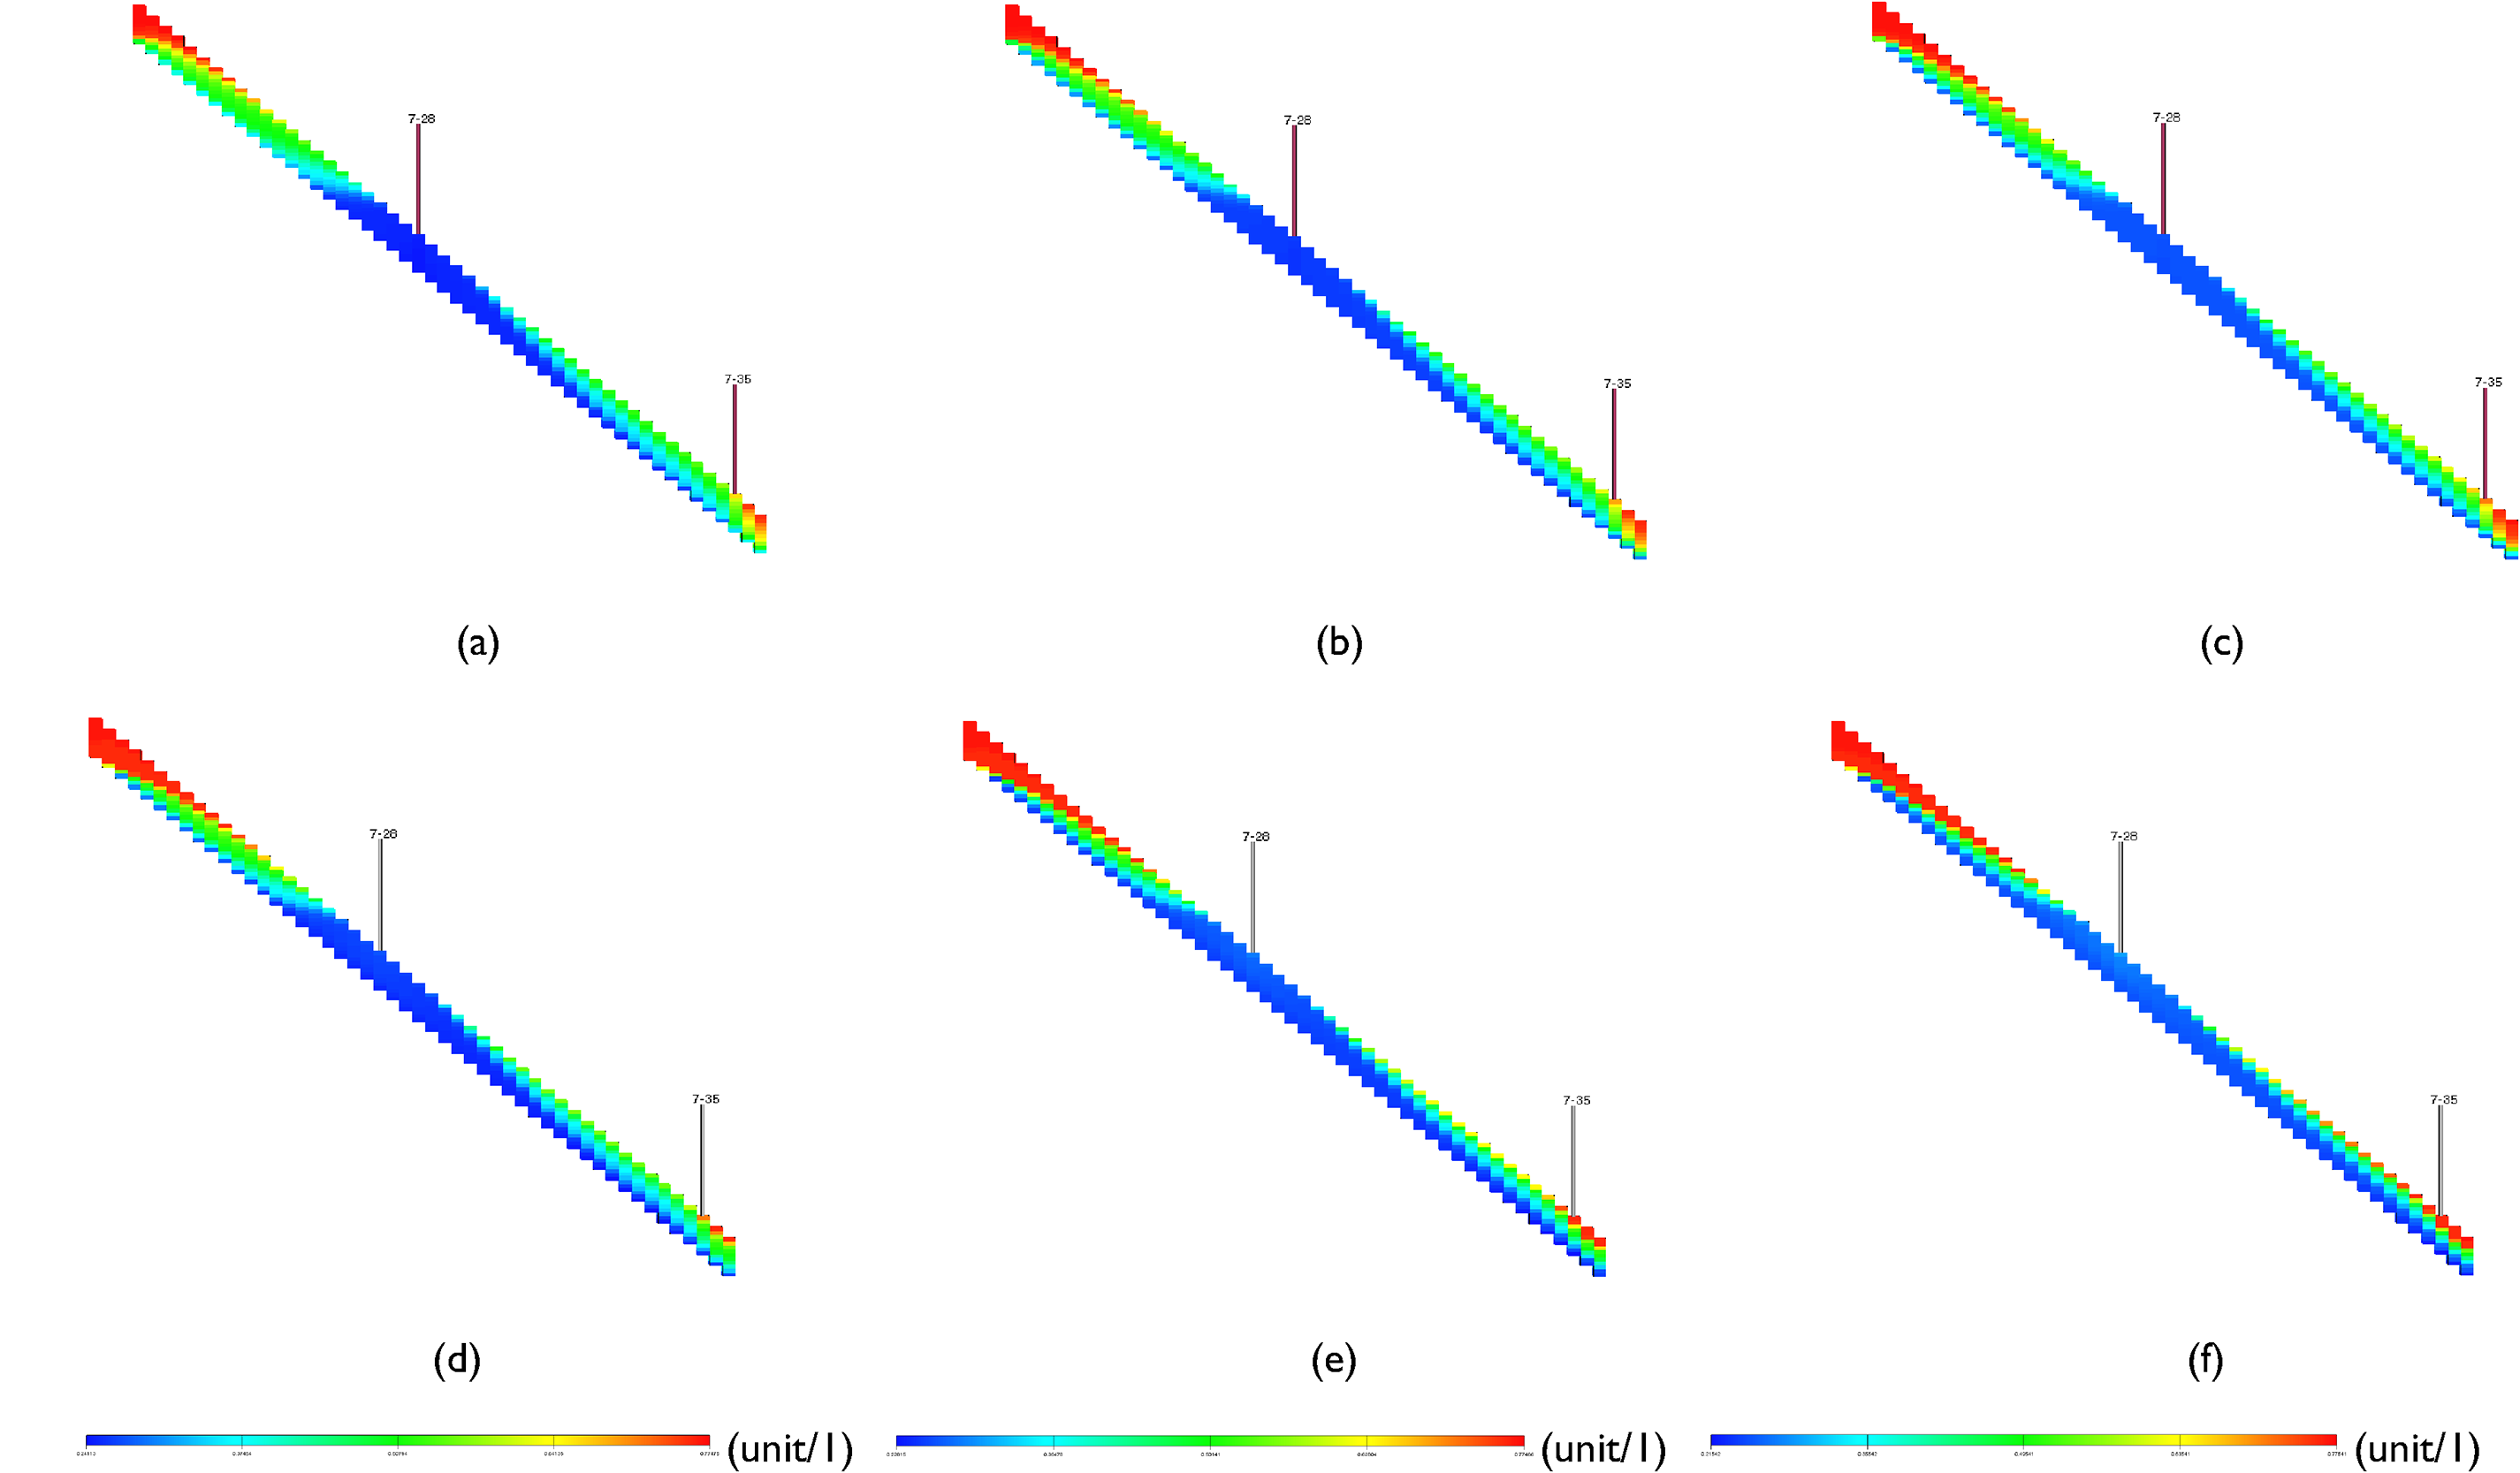
The enlarged oil saturation profile after well shut-in with different vertical permeabilities. (a) Shut in time when Kz = 2 mD; (b) shut in time when Kz = 4 mD; (c) shut in time when Kz = 6 mD; (d) shut in the well for 7 a when Kz = 2 mD; (e) shut in the well for 7 a when Kz = 4 mD; (f) shut in the well for 7 a when Kz = 6 mD. Note: The wells in the upper part on the left are water injection wells, and the wells in the lower part on the right are production wells.
Based on the calculation results of the oil saturation profile in Figure 10, the first six layers from the top down are the middle and upper layers. When the oil saturation of a grid is greater than 70%, it is considered that there is more remaining oil and forms a certain scale. After the statistics of the grid with oil saturation greater than 70% are obtained, the following results are obtained: When Kz = 2 mD, the number of grids with oil saturation greater than 70% accounts for 10.67% of the total number of grids in the profile when the oil and water wells are shut in, and the number of grids with oil saturation greater than 70% accounts for 15% of the total number of grids in the profile after 7 years of shut-in, an increase of 4.33% compared with the initial value. When Kz = 4 mD, the proportion at the time of well shut-in is 13.33%, and the proportion after 7 years of well shut-in is 21.33%, an increase of 8% compared with the initial value. When Kz = 6 mD, the proportion at the time of well shut-in is 16.67%, and the proportion after 7 years of well shut-in is 27.67%, an increase of 11% compared with the initial value.
Factors influencing the secondary enrichment of the remaining oil
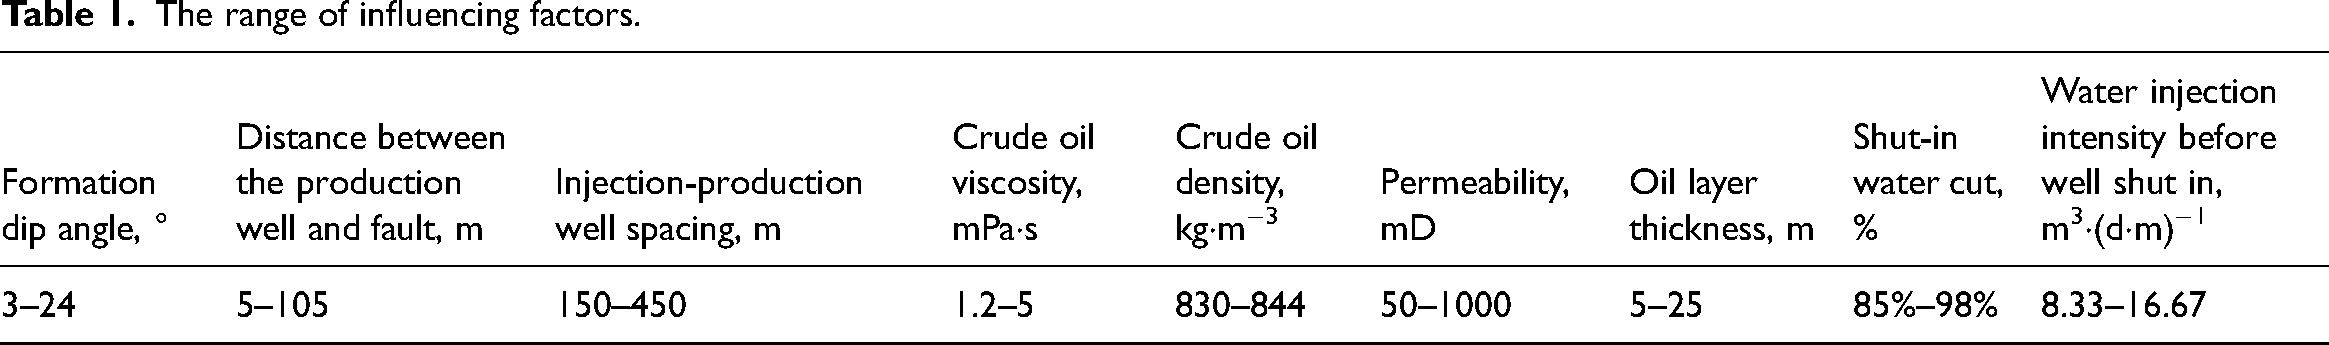
After changing the parameters of the model shown in Figure 3, the influence of different factors on the secondary enrichment law of the remaining oil was studied. Factors are selected from reservoir physical properties, fluid properties and injection-production parameters to carry out impact factor analysis. Reservoir physical properties include the formation dip angle, permeability and oil layer thickness. Fluid properties include the viscosity and density of crude oil. The injection-production parameters include the distance between the production well and fault, the injection-production well spacing, the shut-in water cut and the water injection intensity before well shut-in. The range of values of each influencing factor is shown in Table 1.
The range of influencing factors.
Effect of different permeabilities, formation dip angles and shut-in water cuts on the secondary enrichment of the remaining oil. To study the secondary enrichment rule of the remaining oil under different permeabilities, formation dip angles and shut-in water contents, numerical models are established for comparative analysis by selecting permeabilities of 50, 100, 200, 350, 500, 650, 800, and 1000 mD, formation dip angles of 3, 6, 9, 12, 15, 18, 21, and 24°, and shut-in water cuts of 85, 87, 90, 92, 95, and 98%.
Figure 11(a) shows the oil saturation variation curve under different permeabilities. It can be seen from the figure that when the permeability is greater than 100 mD, the oil saturation curve at the production well point decreases first and then increases and finally tends to be stable. When the permeability is less than 100 mD, the oil saturation has not reached the lowest point within 10 years of natural recovery. When the production and injection wells are closed, the remaining oil begins to migrate under the buoyancy of water. The greater the permeability is, the faster the migration speed is, the earlier the inflection point of the oil saturation value increases, and the greater the value in the rising period. Five years after the oil and water wells are shut in at the end of production, the oil saturation at the production well is 43.77% at a permeability of 50 mD in a homogeneous formation, 44.73% at a permeability of 100 mD, 43.69% at a permeability of 200 mD, 43.67% at a permeability of 350 mD, 50.82% at a permeability of 500 mD, 60.98% at a permeability of 650 mD, 72.50% at a permeability of 800 mD, and 74.55% at a permeability of 1000 mD, which is close to the initial oil saturation. Five years after the oil and water wells are shut in, when the permeability is greater than 500 mD, the oil saturation value at the production well will be greater than the value at the time of shut-in; that is, the increase in permeability is conducive to increasing the speed of secondary enrichment of the remaining oil.
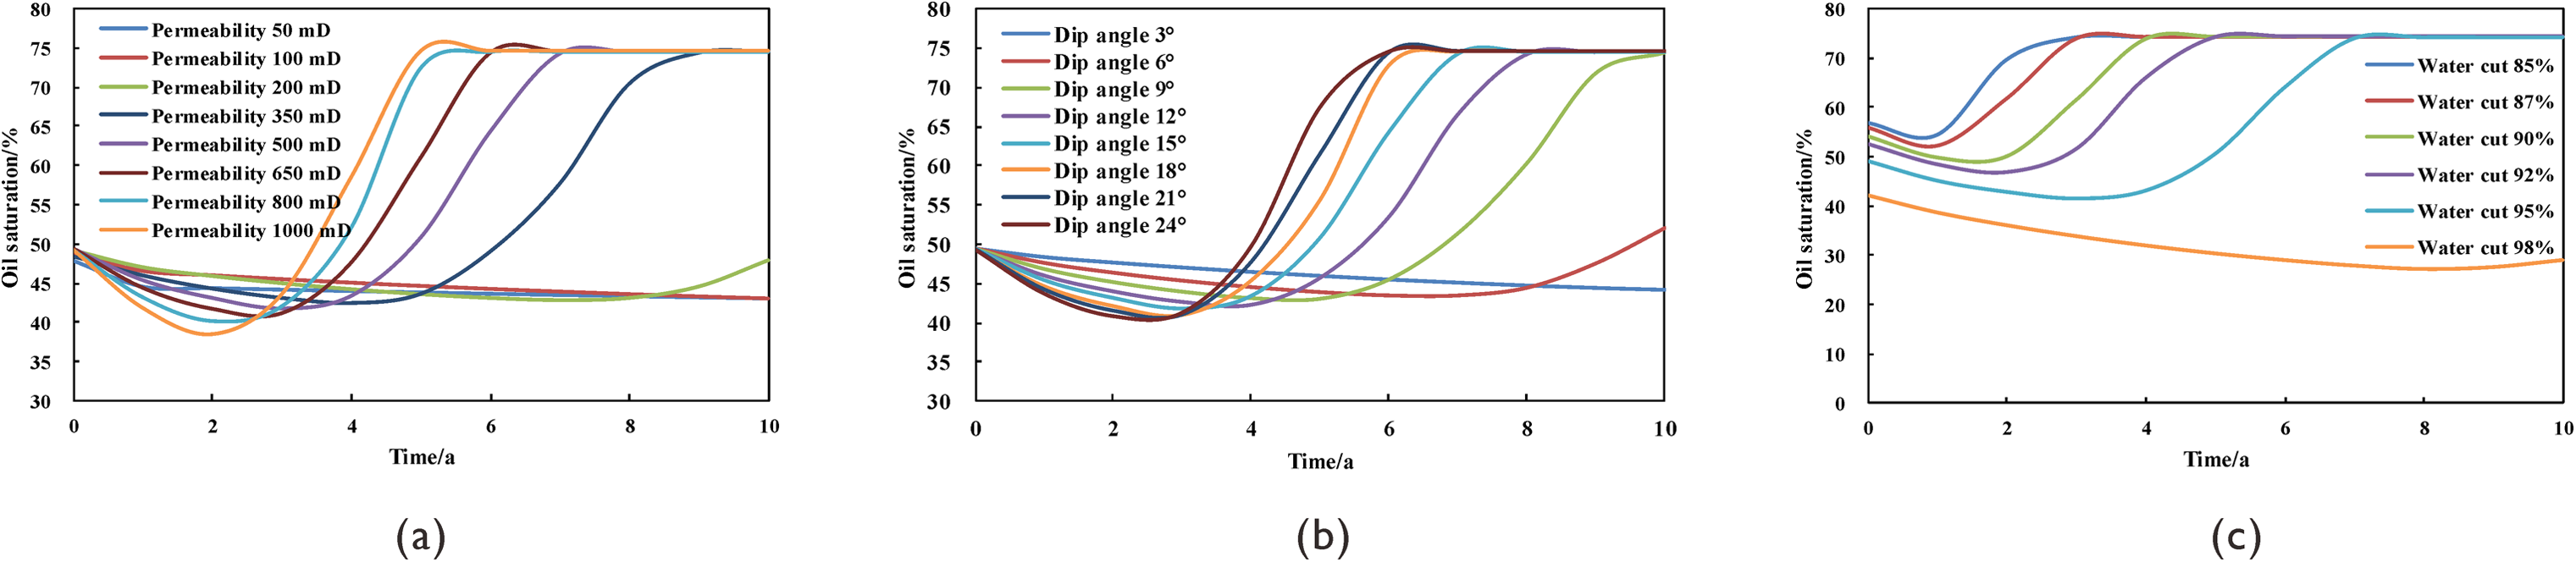
The variation curve of oil saturation at the production well point under different permeabilities, formation dip angles and shut-in water cuts. (a) Permeability; (b) formation dip angle; (c) shut-in water cut.
Figure 11(b) shows the oil saturation variation curve under different formation dip angles. It can be seen from the figure that when the oil and water wells are closed, the greater the formation dip angle is, the faster the oil saturation decreases at the initial stage of well shut-in, the greater the recovery amplitude after dropping to the lowest value, and the final curve gradually tends to be flat. Under the simulation conditions, when the production and injection wells are closed and the formation dip angle is greater than 9°, the recovery effect of oil saturation at the production well point is better. The remaining oil migrates upwards along the dip direction of the stratum under the buoyancy of water and is enriched at the fault after encountering fault shielding. The greater the formation dip angle is, the greater the component of buoyancy and gravity resultant force on the remaining oil along the formation direction is, the faster the oil saturation at the fault rises, and the shorter the time of secondary enrichment of the remaining oil at the production well. Five years after the oil and water wells are closed at the end of production, the oil saturation at the production well is 46.03% at a formation dip angle of 3°, 44.01% at a formation dip angle of 6°, 43.07% at a formation dip angle of 9°, 45.78% at a formation dip angle of 12°, 50.82% at a formation dip angle of 15°, 55.75% at a formation dip angle of 18°, 61.52% at a formation dip angle of 21°, and 67.51% at a formation dip angle of 24°. Five years after the oil and water wells are shut in, when the formation dip angle is greater than 15°, the oil saturation value at the production well will be greater than the value at the time of shut-in; that is, when the formation dip angle increases, it is beneficial to improve the secondary enrichment speed of the remaining oil.
Figure 11(c) shows the oil saturation variation curve under different shut-in water cuts. The figure shows that the oil saturation of the production well points with different shut-in water cuts first decreases, then increases, and finally tends to be flat after well shut-in. The higher the water cut is, the lower the oil saturation value at the well point when the well is shut-in, the longer the time to reduce to the lowest value, the smaller the increase amplitude, and the longer the time to reach the highest point. The increase in water cut will reduce the saturation of remaining oil and the relative permeability of crude oil, resulting in a decrease in the amount and speed of remaining oil secondary enrichment to the top of the model, thus extending the migration time of remaining oil from the top of the model to the production well. Five years after the oil and water wells are shut in at the end of production, the oil saturation at the production well is 74.60% when the shut-in water cut is 85%, 74.60% at the well point when the shut-in water cut is 87%, 74.60% at the well point when the shut-in water cut is 90%, 74.46% at the well point when the shut-in water cut is 92%, 50.82% at the well point when the shut-in water cut is 95%, and 30.44% at the well point when the shut-in water cut is 98%. Five years after the oil and water wells are shut in, when the shut-in water cut is less than 95%, the oil saturation value at the production well will be greater than the value at the time of shut-in; that is, the reduction in the shut-in water cut is conducive to accelerating the secondary enrichment of the remaining oil.
Effect of other factors on the secondary enrichment of the remaining oil. The influence of the other six factors on oil saturation at the production well points is shown in Figure 12.
Figure 12 shows the variation curve of oil saturation at the production well point under different influencing factors. The figure shows that after the well is shut in under various factors, the oil saturation curve at the production well point shows a trend of first decreasing, then increasing, and finally becoming flat.
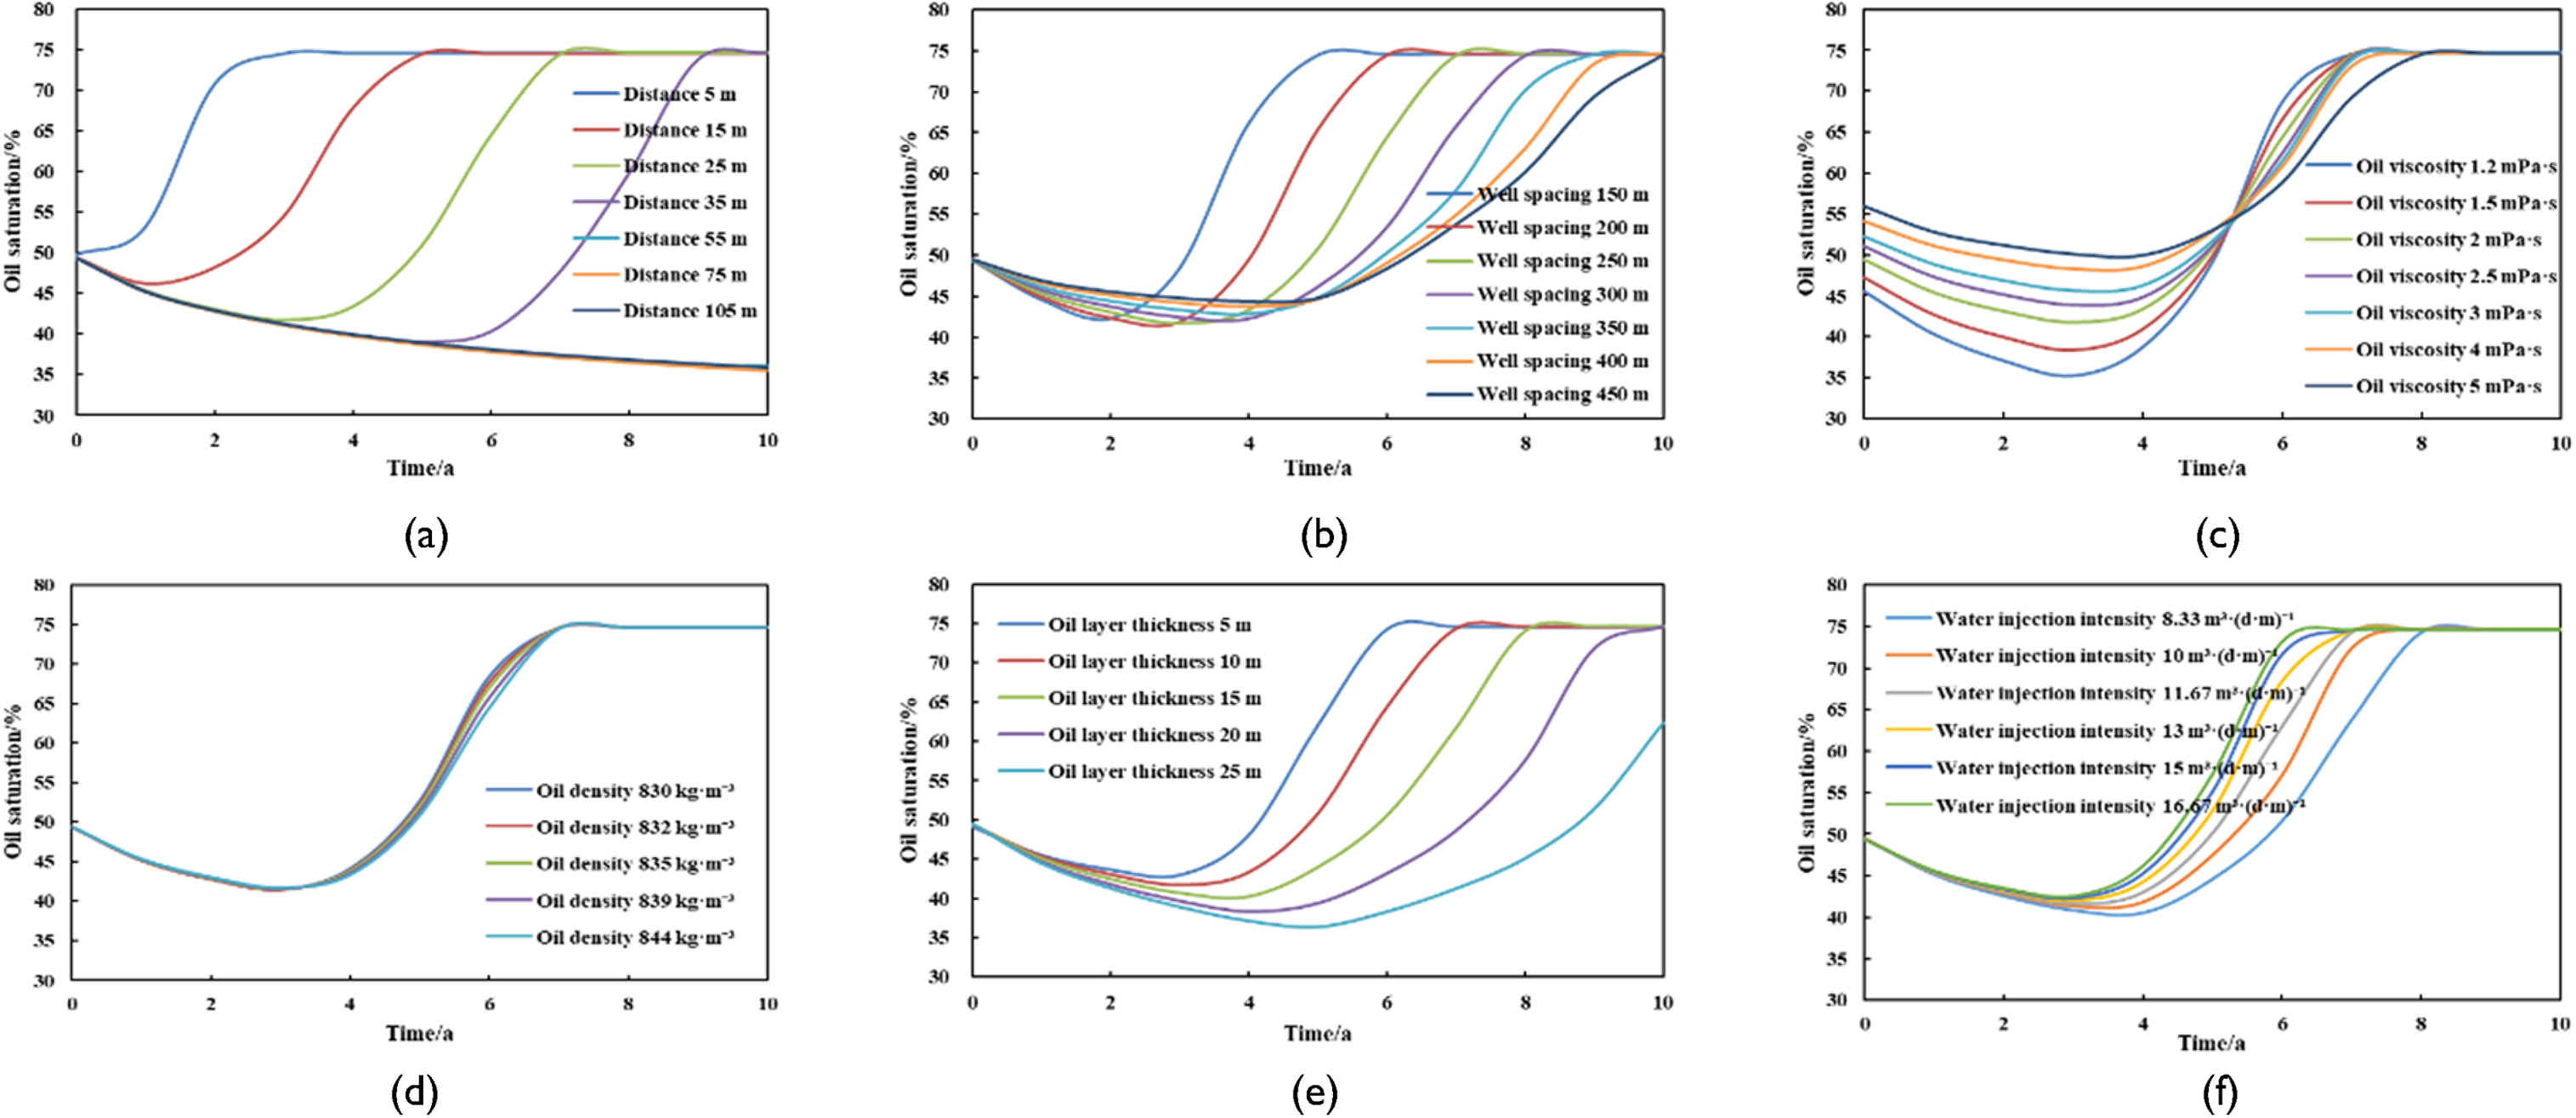
The variation curve of oil saturation at the production well point under different influencing factors. (a) Distance between the production well and fault; (b) injection-production well spacing; (c) crude oil viscosity; (d) crude oil density; (e) oil layer thickness; (f) water injection intensity before well shut-in.
When the distance between the production well and fault is less than or equal to 35 m, the oil saturation curve decreases first, then increases, and finally tends to be flat, while there is no downwards trend at 5 m. After greater than 35 m, the oil saturation at the production well point has not dropped to the lowest point within the 10 years of the natural recovery period. With the increase in well shut-in time, the remaining oil at the production well far from the fault will migrate to the fault at a higher position under the effect of water buoyancy, the oil saturation will continue to decrease, and the oil saturation recovery time at the production well point will continue to extend.
The smaller the injection-production well spacing is, the more significant the decrease in oil saturation at the production well point during the initial shut-in of the injection and production wells. When the oil saturation decreases to a certain value, an inflection point will appear. The smaller the injection-production well spacing is, the earlier the inflection point appears, and the greater the oil saturation value in the recovery period. The smaller the injection-production well spacing is, the greater the pressure gradient under the same injection rate is, and the faster the migration speed of the remaining oil after the injection and production wells are closed.
When the production well is shut in, the greater the crude oil viscosity is, the greater the remaining oil saturation value at the production well point is. The greater the viscosity of crude oil is, the slower the seepage velocity is, and the smaller the amplitude of numerical change of oil saturation in decreasing and increasing periods.
The oil saturation is slightly higher in the recovery period when the density is small, but the change is not significant due to the small range of crude oil viscosity values, and the overall recovery trend is close. The reduction in formation crude oil density will increase the combined force of gravity and buoyancy of crude oil, which is conducive to accelerating the flow of remaining oil.
The thicker the oil layer is, the longer it takes for the oil saturation at the production well point to drop to the lowest value, the smaller the recovery amplitude, and the longer it takes to reach the highest point. The increase in oil layer thickness increases the pore volume of the reservoir, and the amount of remaining oil that needs secondary enrichment from the fault to the production well also increases, resulting in the inflection point of the oil saturation value at the well point being delayed continuously.
Under different water injection intensity conditions, the oil saturation value in the falling period of the curve is close, but it is different in the rising period. The greater the water injection intensity is, the greater the pressure difference between the injection and production wells when shutting down, the faster the remaining oil transport rate, the shorter the time it takes for the oil saturation to decrease to the lowest value, and the higher the oil saturation value during the recovery period.
Discussion
Sensitivity analysis of influencing factors
Based on the numerical simulation results of the above nine influencing factors, the change rate of the remaining oil saturation at the production well point 5 years after the well is shut in under different factor change rates is counted, and the sensitivity of each factor is judged by the sensitivity coefficient formula.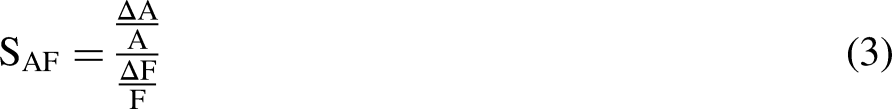
The average sensitivity coefficients of each factor under different values and the calculation results are shown in Tables 2 and 3.
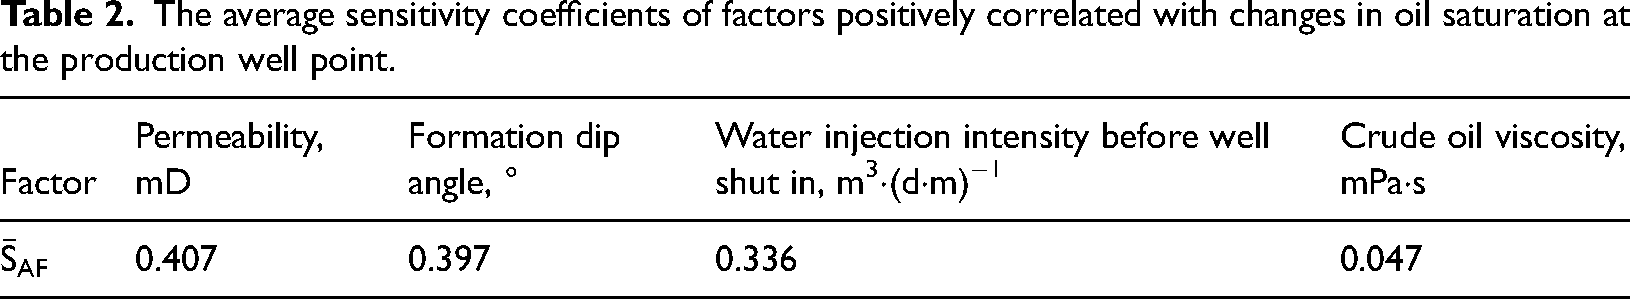
The average sensitivity coefficients of factors positively correlated with changes in oil saturation at the production well point.
The average sensitivity coefficients of factors negatively correlated with changes in oil saturation at the production well point.
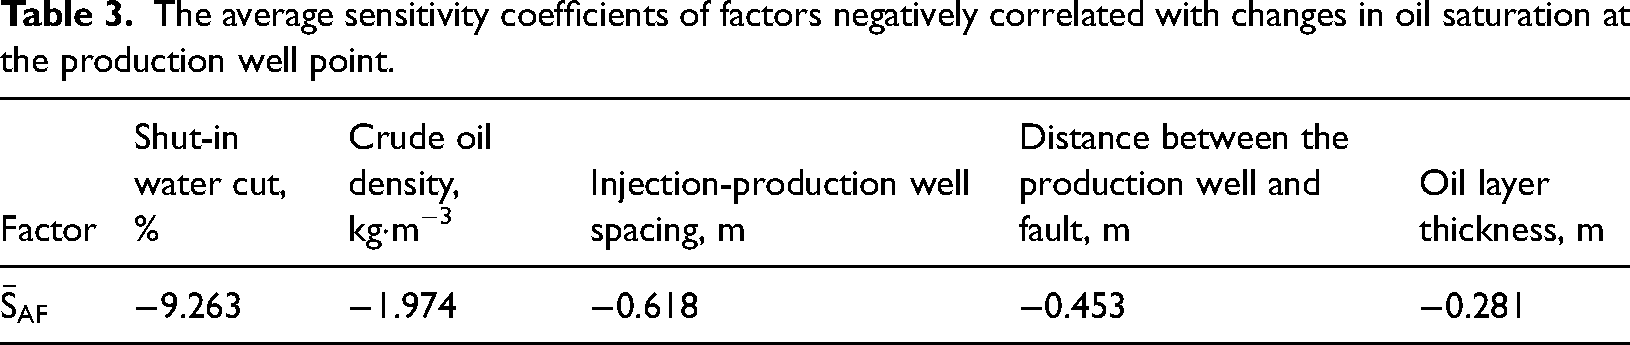
The greater the absolute value of the sensitivity coefficient is, the stronger the sensitivity of the influencing factors. As seen from Table 2, the average sensitivity coefficients of permeability and formation dip angle among the positively correlated factors have close absolute values of 0.407 and 0.397, respectively, and are more sensitive to oil saturation at the production well point than other factors. Thus, the permeability and formation dip angle are the main controlling factors. Table 3 shows that the absolute values of the average sensitivity coefficients of the shut-in water cut, crude oil density, injection-production well spacing, and distance between the production well and fault are 9.263, 1.974, 0.618, and 0.453, respectively, among the negative correlation factors. The absolute values of the average sensitivity coefficients of these four factors are greater than those in Table 2, and they are selected as the negative correlation main control factors. According to the average sensitivity coefficient values of different factors in Tables 2 and 3, the sensitivity of each factor is ranked as follows: shut-in water cut > crude oil density > injection-production well spacing > distance between the production well and fault > permeability > formation dip angle > water injection intensity before well shut-in > oil layer thickness > crude oil viscosity.
Reservoir conditions conducive to the secondary enrichment of the remaining oil
Based on the above numerical simulation results, the time taken to reach 70% oil saturation at the production well point for different parameters of each factor is counted, and the corresponding relationship curves are obtained, as shown in Figure 13. When the oil saturation at the production well reaches 70%, it is 94.59% of the original oil saturation. At this time, the remaining oil of the secondary enrichment at the production well has reached a certain scale, which is conducive to refining the scope of screening conditions for potential areas.
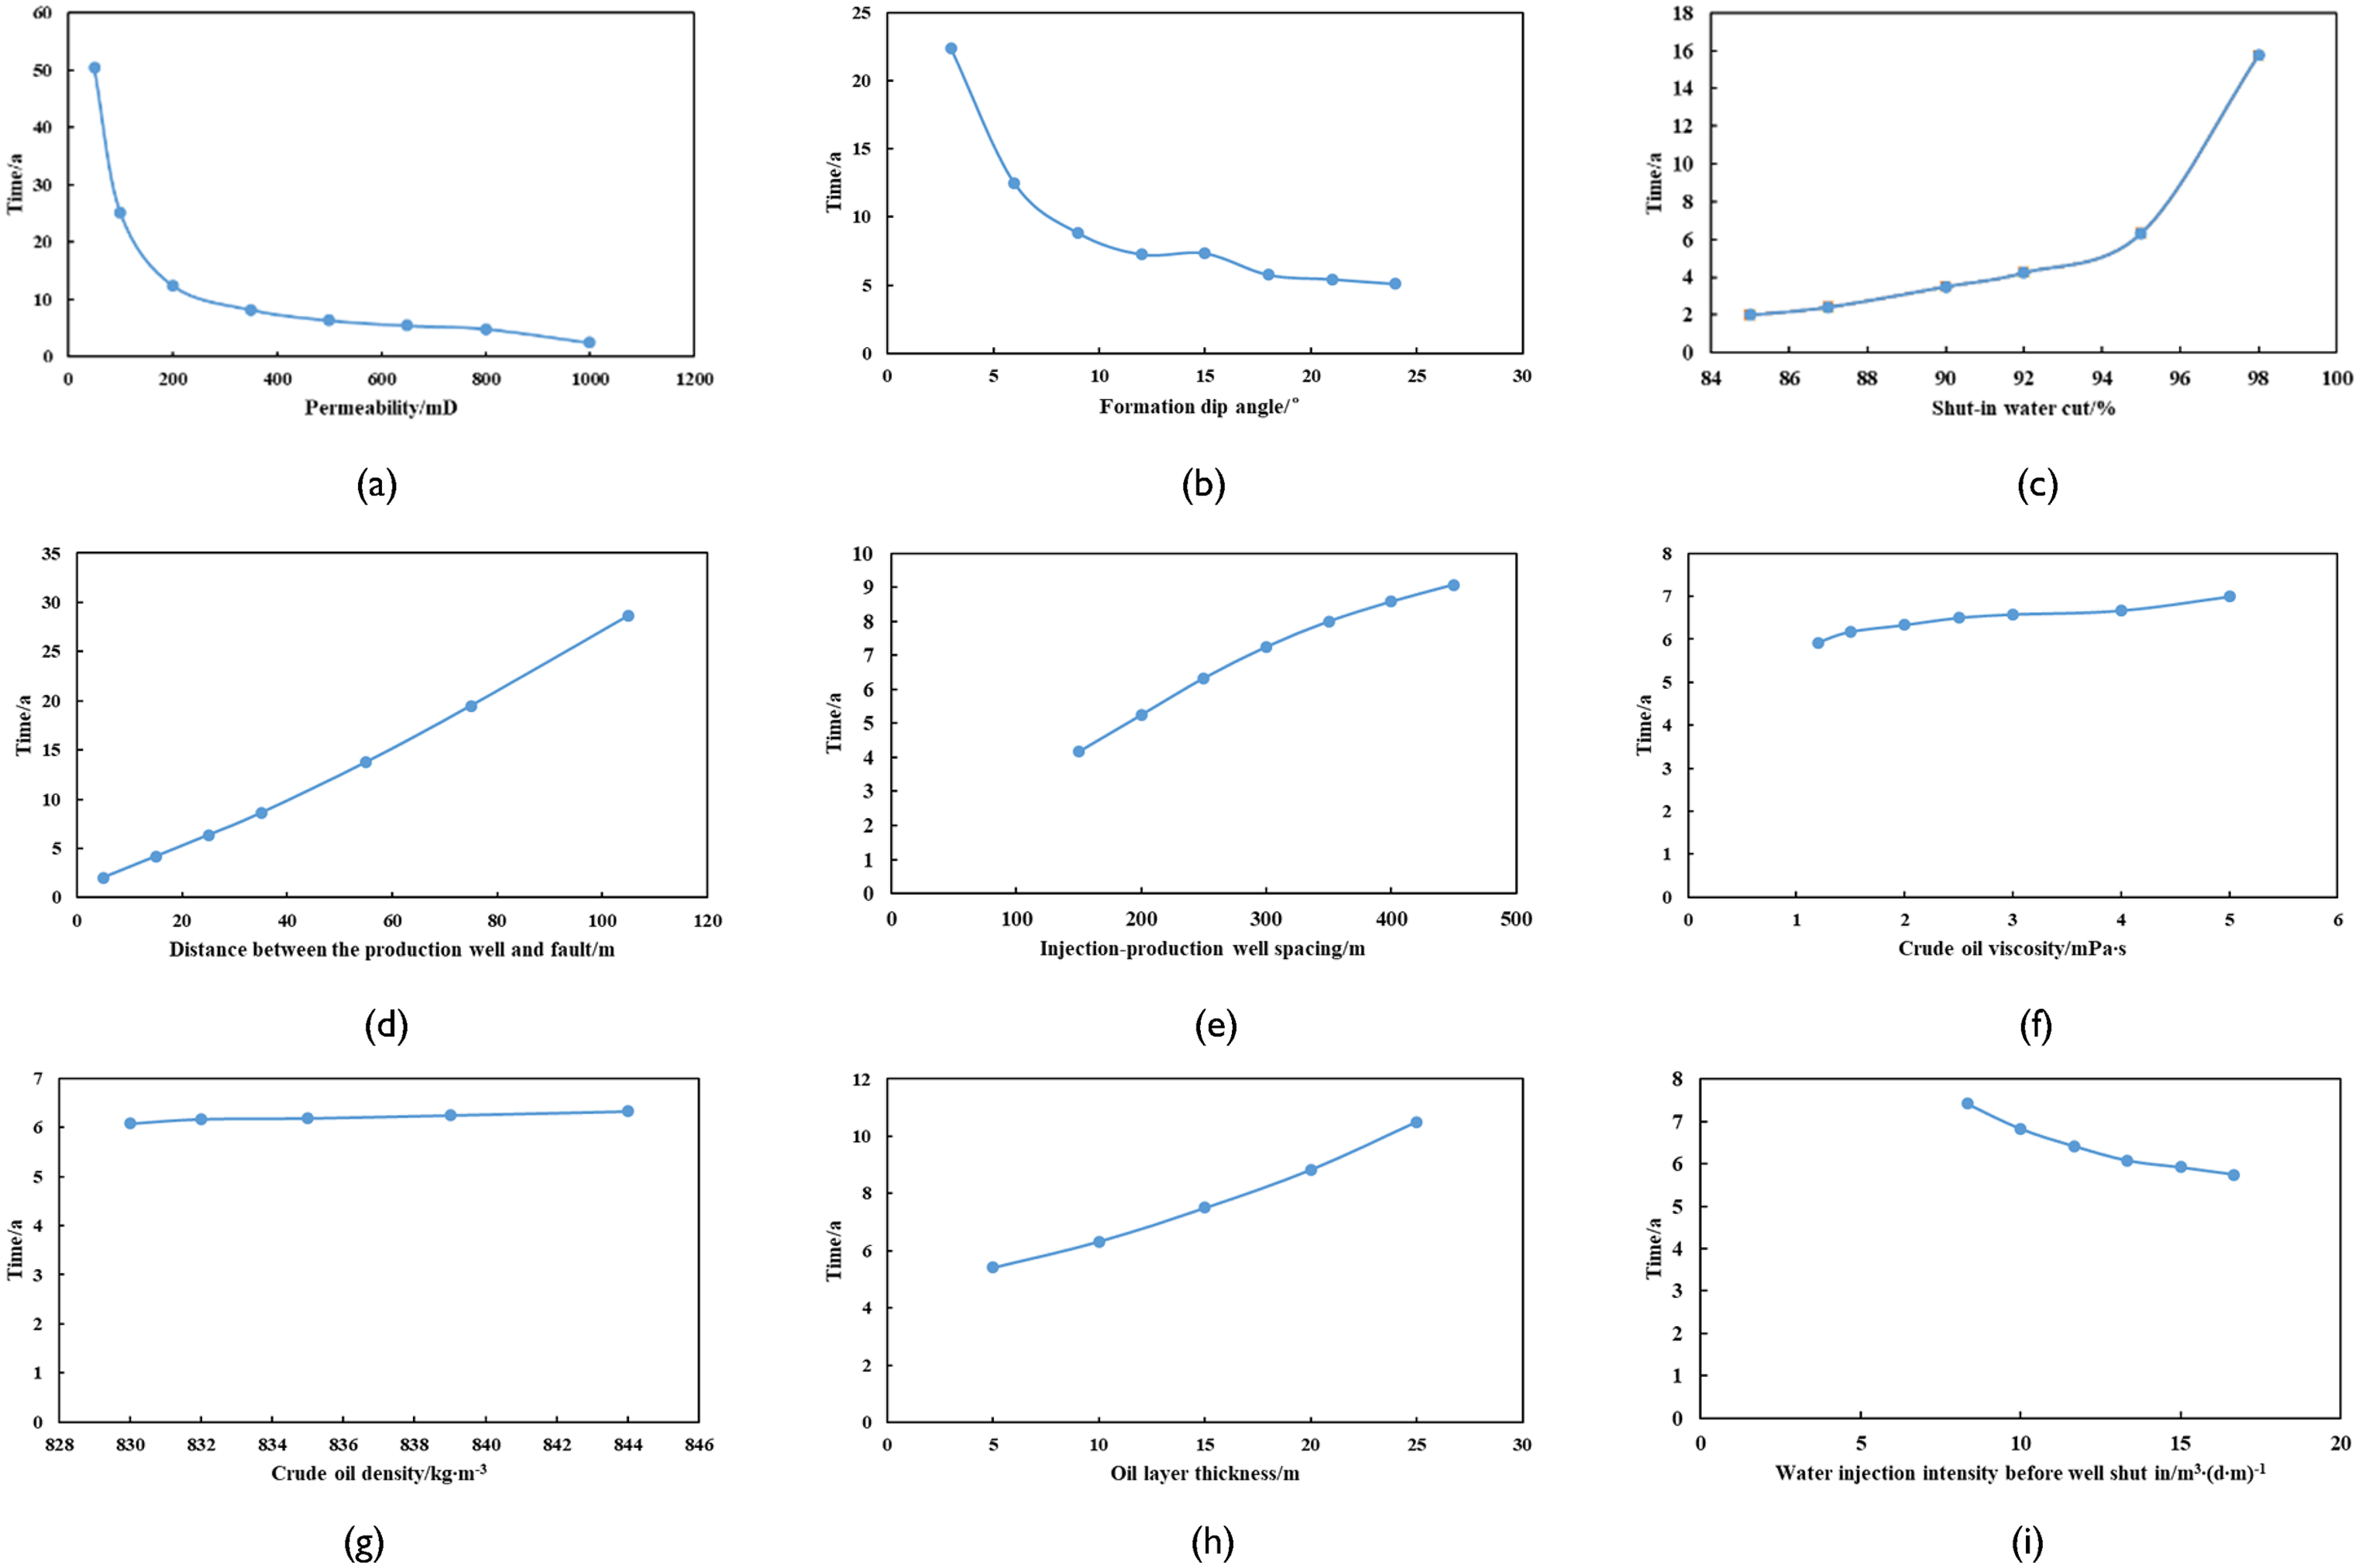
The curve chart of the time taken to reach 70% oil saturation at the point of the production wells for different influencing factors. (a) Permeability; (b) formation dip angle; (c) shut-in water cut; (d) distance between the production well and fault; (e) injection-production well spacing; (f) crude oil viscosity; (g) crude oil density; (h) oil layer thickness; (i) water injection intensity before well shut-in.
Figure 13 shows that when the permeability is greater than 200 mD, the formation dip angle is greater than 9°, the shut-in water cut is less than 95%, the distance between the production well and fault is less than 35 m, the injection-production well spacing is less than 300 m, the crude oil viscosity is less than 4 mPa·s, the crude oil density is less than 835 kg·m−3, the oil layer thickness is less than 15 m, and the water injection intensity before well shut-in is greater than 10 m3·(d·m)−1, which is conducive to the secondary enrichment of the remaining oil.
Actual production data validation
Based on the production data of Well CZ39 in block A of the L oilfield, numerical simulation verification is carried out. Well CZ39 was closed in October 2007 and opened in May 2016. At the initial stage of production, the daily liquid production was 71.8 t, the daily oil production was 12 t, and the water cut was 83.2%. Compared with the production data when the well was shut in, the daily liquid production increased by 6.8 t, the daily oil production increased by 7.2 t, and the water cut decreased by 9.4%. The above production data are consistent with the trend of the numerical simulation results.
Conclusions
Based on the Eclipse numerical simulation software, this paper establishes a typical numerical model of a fault block oilfield, analyses the migration law of the remaining oil secondary enrichment through the numerical simulation results, and clarifies the mechanism of the remaining oil secondary enrichment. Based on the analysis results of the factors influencing the secondary enrichment of the remaining oil, the main control factors are determined by using the sensitivity coefficient, and the reservoir conditions conducive to the secondary enrichment of the remaining oil are determined by taking the well point oil saturation as the evaluation criteria. Based on the above research, the following conclusions are obtained:
After the production wells at the high part of the fault are shut in with an ultrahigh water cut, the remaining oil will continue to migrate to the high part of the fault under the combined effects of differential pressure and oil–water gravity differentiation and form a secondary enrichment area. After reaching the initial oil saturation, the remaining oil will be continuously enriched along the fault in the direction of the lower production wells, and the order of enrichment will be first on both sides and then in the middle laterally, so that the oil saturation at the production wells will show a trend of first decreasing and then increasing, and finally levelling off. The mechanism of the secondary enrichment of the remaining oil includes the following: the pressure redistributes after the well is shut in, and the remaining oil migrates from the high-pressure area in the low part to the low-pressure area in the high part. Under the comprehensive action of micro forces, the remaining oil will spontaneously migrate to the high part of the reservoir and the top layer. The increase in formation dip angle, permeability and water injection intensity before well shut-in is beneficial to shorten the recovery time of oil saturation at the production well point; the increase in distance between the production well and fault, injection-production well spacing, crude oil viscosity, crude oil density, oil layer thickness, and shut-in water cut will prolong the recovery time of oil saturation at the production well point. The main controlling factors of the positively correlated factors with the change in oil saturation at the production well point are permeability and formation dip angle, and the main controlling factor of the negatively correlated factors is the shut-in water cut. Among all factors, the sensitivity of the shut-in water cut is the strongest. Among the main controlling factors, the reservoir conditions conducive to the secondary enrichment of the remaining oil are permeability greater than 200 mD, formation dip angle greater than 9°, shut-in water cut less than 95%, crude oil density less than 835 kg·m−3, injection-production well spacing less than 300 m, and distance between the production well and fault less than 35 m.
Footnotes
Acknowledgements
This research was supported by the National Natural Science Foundation of China (grant number No.51974343). We also appreciate AJE for language help.
Author contributions
Methodology and supervision were contributed by Chuanzhi Cui; calculation, data collection, and writing – original draft were contributed by Jing Li; model establishment and data analysis were contributed by Zhongwei Wu and Ran Zong; supervision and writing – review and editing were contributed by Weijun Kong and Lifeng Li; investigation was contributed by Jianning Zhang and Shuzhen Su. All authors have read and agreed to the published version of the manuscript.
Declaration of conflicting interests
The author(s) declared no potential conflicts of interest with respect to the research, authorship, and/or publication of this article.
Funding
The author(s) disclosed receipt of the following financial support for the research, authorship, and/or publication of this article: This work was supported by the National Natural Science Foundation of China (grant number No.51974343).