
Abstract
Carbon emission trading is regarded as an effective way to combine energy economy with green and low-carbon, which brings new vitality to the traditional multi-micro grid day-ahead dispatch. In this paper, a robust decentralized energy management framework is proposed for monitoring a collaborative structure of gas turbines, gas boilers, ground source heat pumps, energy storage and electrolyzers, etc for microgrid in the presence of power to gas and carbon capture systems. The price sensitivity of the power market results in the fluctuations of multi-micro grid dispatching. The worst-scenario uncertainty of multi-micro grid is managed by adopting trading prices at different conservativeness levels. The kalman filter distributed algorithm based on iteration is used to decompose the dispatch problem to minimize the total daily overhead of the multi-micro grid system while protecting microgrid data privacy. Finally, the simulation results represent the effectiveness of the proposed decentralized model of trading prices to meet the demand for electricity and heat. At the same time, the kalman filter distributed algorithm is compared with the alternating direction multiplier method algorithm to ensure accuracy and speed.
Keywords
Introduction
Power generation mainly relies on fossil fuels, and the burning of fuels brings global warming and environmental damage (Chen et al., 2021; Wu et al., 2021). The replacement of renewable energy (RE) i.e., wind and photovoltaics (PV) can effectively reduce carbon emissions. Nevertheless, the intermittency of RE and the increase in fuel cost cause fluctuations in the trading price of the electricity market Wang et al. (2020). Therefore, the combination of gas boiler (GB), ground source heat pumps (GSHPs), gas turbine (GT), energy storage (ES) systems, electrolyzers, loads, and other equipment is used to form an energy microgrid (MG) Marnay et al. (2000). When there are multiple MGs in an area, they can form multi-microgrid (MMG), which introduce a combination of several energy resources and energy users. MMG can be under the unified management and dispatch of MG service operator (MSO). Therefore, it has good research value for the electricity market trading price and the demand response (DR) for thermoelectric load in MMG.
Worldwide, through optimally coordinating generation units and engaging users through DR, MG operating costs can be minimized Jin et al. (2018). For example, from the viewpoint of the MSO, the literature (Eghbali et al., 2022; Mansour Lakouraj et al., 2022) considers the role of market price and DR in the dispatch process. In order to cope with the impact of electric vehicles joining the MG, literature (Harsh and Das, 2022) incorporates DR to reduce the burden of operators. Influenced by RE, literature (Hajiamoosha et al., 2021) proposed a random management MG DR scheme. In the scheme, only a single type of load is considered to participate in the study of DR, which is obviously insufficient with the power market of multi-energy users.
In this section, the trading price of electricity market studies on the collaborative optimization of MMG is discussed in depth. Literature (Wang et al., 2020) proposed a stochastic robust optimization (RO) model in MG, where the uncertainty of RE and energy market prices are considered. Considering several uncertainties such as electricity price, hydrogen, and electricity load, the literature (Mansour-Saatloo et al., 2021; Wu et al., 2019) establishes the stochastic dispatch model with hydrogen refueling station in the MG. Therefore, this paper adopts stochastic programming to consider the trading price of the electricity market in MMG.
Carbon emissions are closely linked to energy supplies (Evangelopoulou et al., 2019). Carbon markets may inspire goodwill toward a carbon-neutral world (Zhang et al., 2022). In order to realize the effective utilization of energy, the literature (Xu and Yi, 2023) builds a low-carbon operation economic model of MMG in the presence of power to gas (P2G) and carbon capture systems (CCS). Nash bargaining theory is used to solve the real-time trading price of carbon emissions. In order to predict carbon price series accurately, a hybrid forecasting system is designed, which includes an error correction strategy and a divide-and-conquer strategy. (Niu et al., 2022). But the literature does not show how to reduce carbon emissions in aspect of tiered carbon price.
Each individual stakeholder MG in an MMG with MSO contains a controller. Since each MG only shares part of the information with neighboring MGs due to concerns about information privacy and communication limitations, centralized optimization is not suitable for this scenario (He et al., 2017). So, multi-stakeholders should utilize limited interactive information for collaborative dispatch, thus forming a distributed optimization structure (Molzahn et al., 2017). In energy management, the widely used methods include consensus algorithm Yu et al. (2020); Wang and Liu (2020), alternating direction multiplier method (ADMM) Chen and Yang (2017), gradient method Zhang et al. (2014) and the analytical target cascading Marvasti et al. (2014). For example, consensus algorithms were used to solve the dispatch problem in islanded MGs Xia et al. (2018). Kalman filtering is an algorithm that optimally estimates the state of the system through the input and output observation data of the system (Feng and Yang, 2019; Moselimizadeh et al., 2022). Literature (Carli et al., 2008) proposes a distributed consensual-based kalman filter (KF) algorithm, where each agent performs the next fusion estimation based on its own measurements and the estimates of its neighbors. The algorithm is very similar to the selection process of distributed optimization algorithms, i.e., ADMM. Nevertheless, there is no literature using KF distributed algorithm for energy management model in MMG. Therefore, KF distributed algorithm is used in this paper to solve the fully distributed optimization of MMG containing MSO.
Table 1 compares the proposed model with the previously reviewed literature. The paper establishes an MMG robust decentralized energy management model based on electricity and heat under the condition of electricity price uncertainty. In the process of modeling, the DR of the load is analyzed, and the technology of converting P2Gis added to the CCS, so the efficiency of the system is significantly improved. The contributions of this paper are as follows:
In order to meet the DR requirements of thermoelectric load, a new MMG structure based on electric energy and thermal energy is established. The amount of carbon dioxide released is controlled by CCS system. The optimal dispatch problem of MMG system is analyzed in detail. Considering the price uncertainty, a worst-scenario robust decentralized optimization method is proposed and its performance is tested. A decentralized energy management method is proposed for efficient control of thermoelectric MG. KF was applied in modeling to disperse the model.
Comparison of the proposed model with the previous literatures.
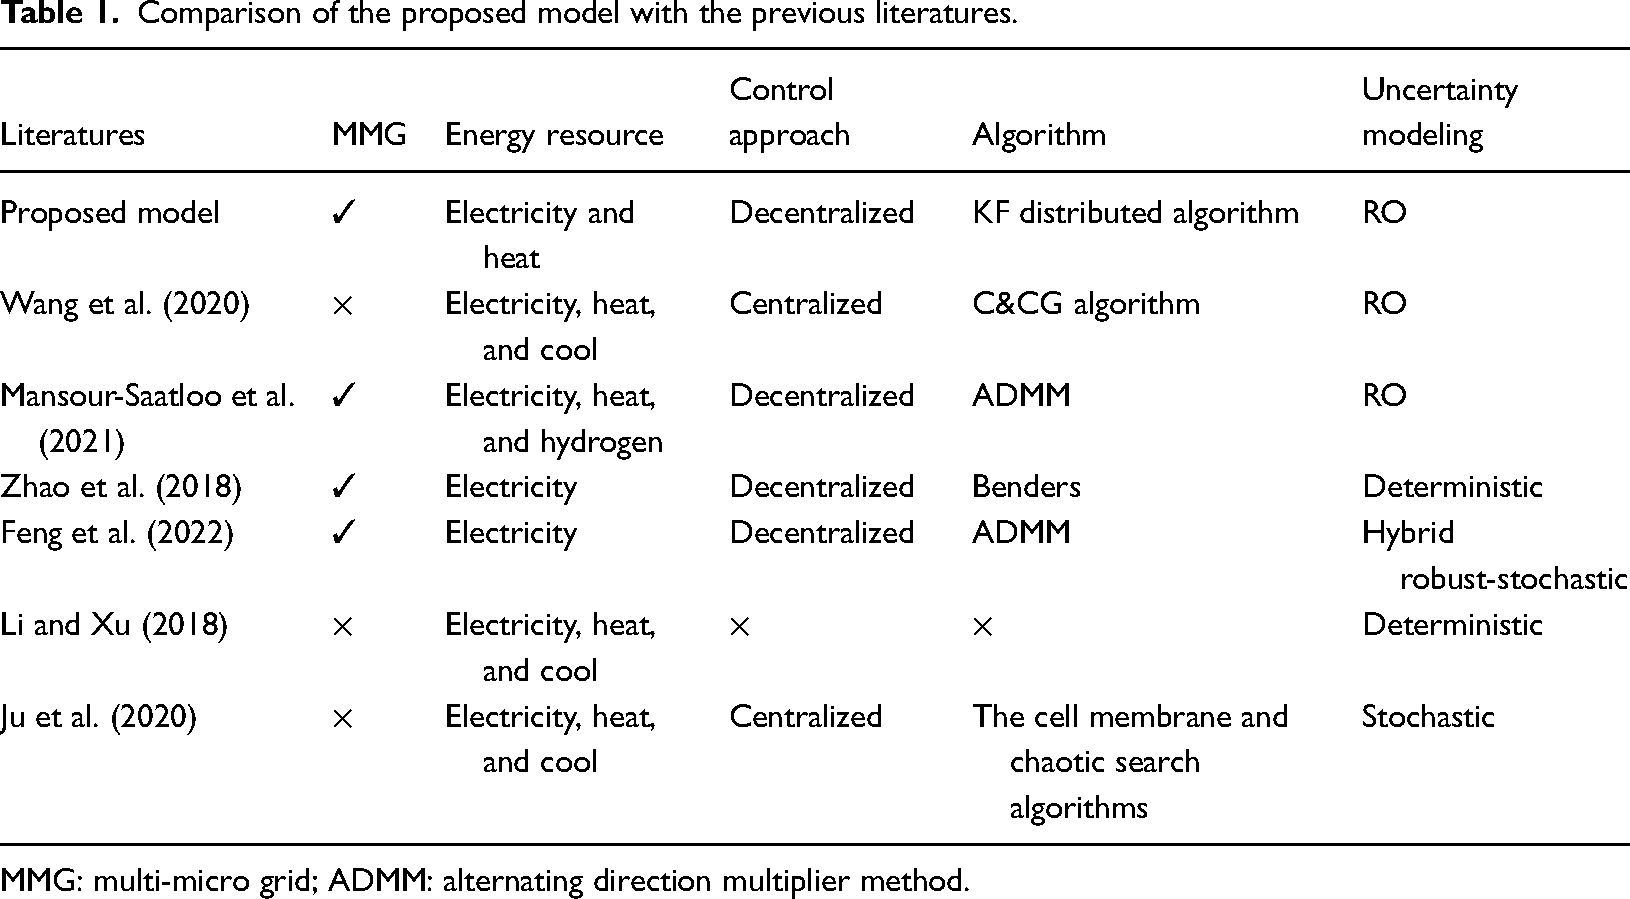
MMG: multi-micro grid; ADMM: alternating direction multiplier method.
Frame structure
In this section, the MMG system structure is introduced in detail. The MMG system comprises three MGs, and each MG is based on electrical and heat, as described in Figure 1. Load requirements of MG, i.e., electricity and heat, are met through its own generation units and the energy market. GT, GB, P2G technology, RE, ES system (electrical and thermal storage), CCS, heat, and electrical load are applied to each MG, as shown in Figure 1. In addition, the P2G technology, consisting of electrolyzer and methanator, serves as a key component to fully convert the power in each MG into gas. CCS that provide CO2 in the proposed model is coordinated operation with P2G. Noted that, carbon capture power plan, absorption tower and stripper make up the CCS system and the P2G technology consists of an electrolyzer and a methanator.
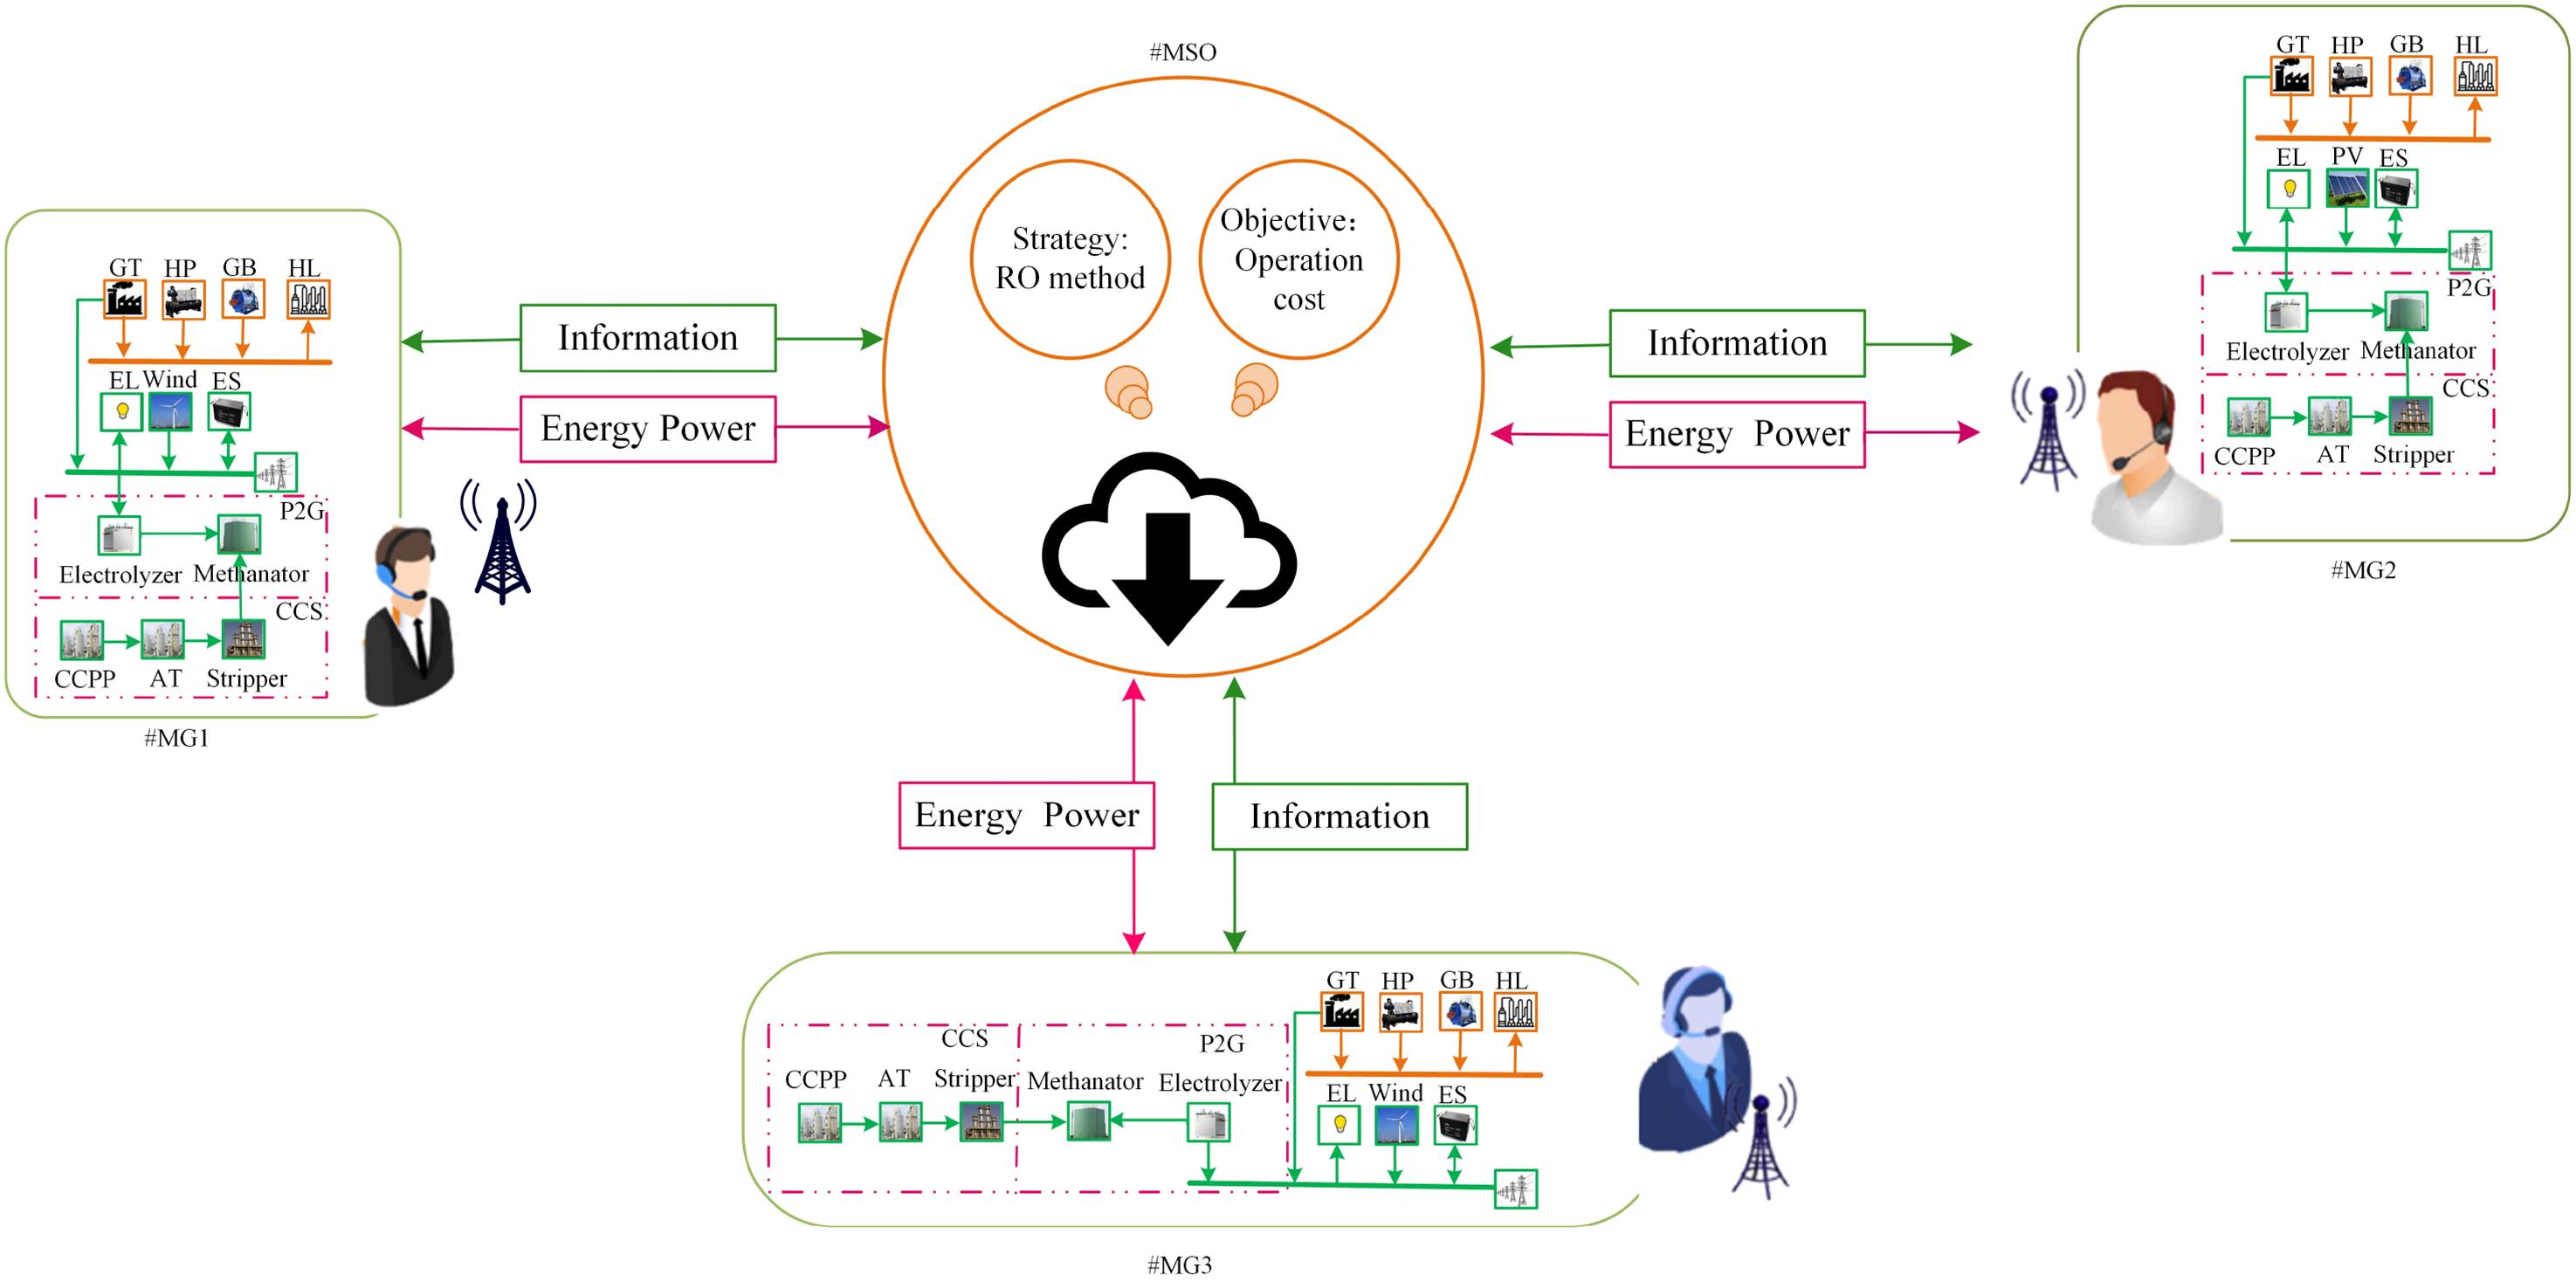
The structure of multi-microgrid (MMG).
Once the MG modeling is done, an appropriate management controller is required. Each MG is separately dispatched in decentralized model, and each MG is not informed of other MGs. Figure 2 exhibits the Bi-layer distributed framework of the MMG system. As shown in the figure, a coordinator is responsible for managing the exchange of information and energy power between MG and the energy market. Each MG dispatches optimal energy power in its control center after taking into account energy prices and local loads. First, MG operators contact MSO to submit their energy power. After trading power, MSO trade with the energy market to meet the demand of MGs. The distributed optimization in Bi-layer is mainly to protect the privacy of each MG.
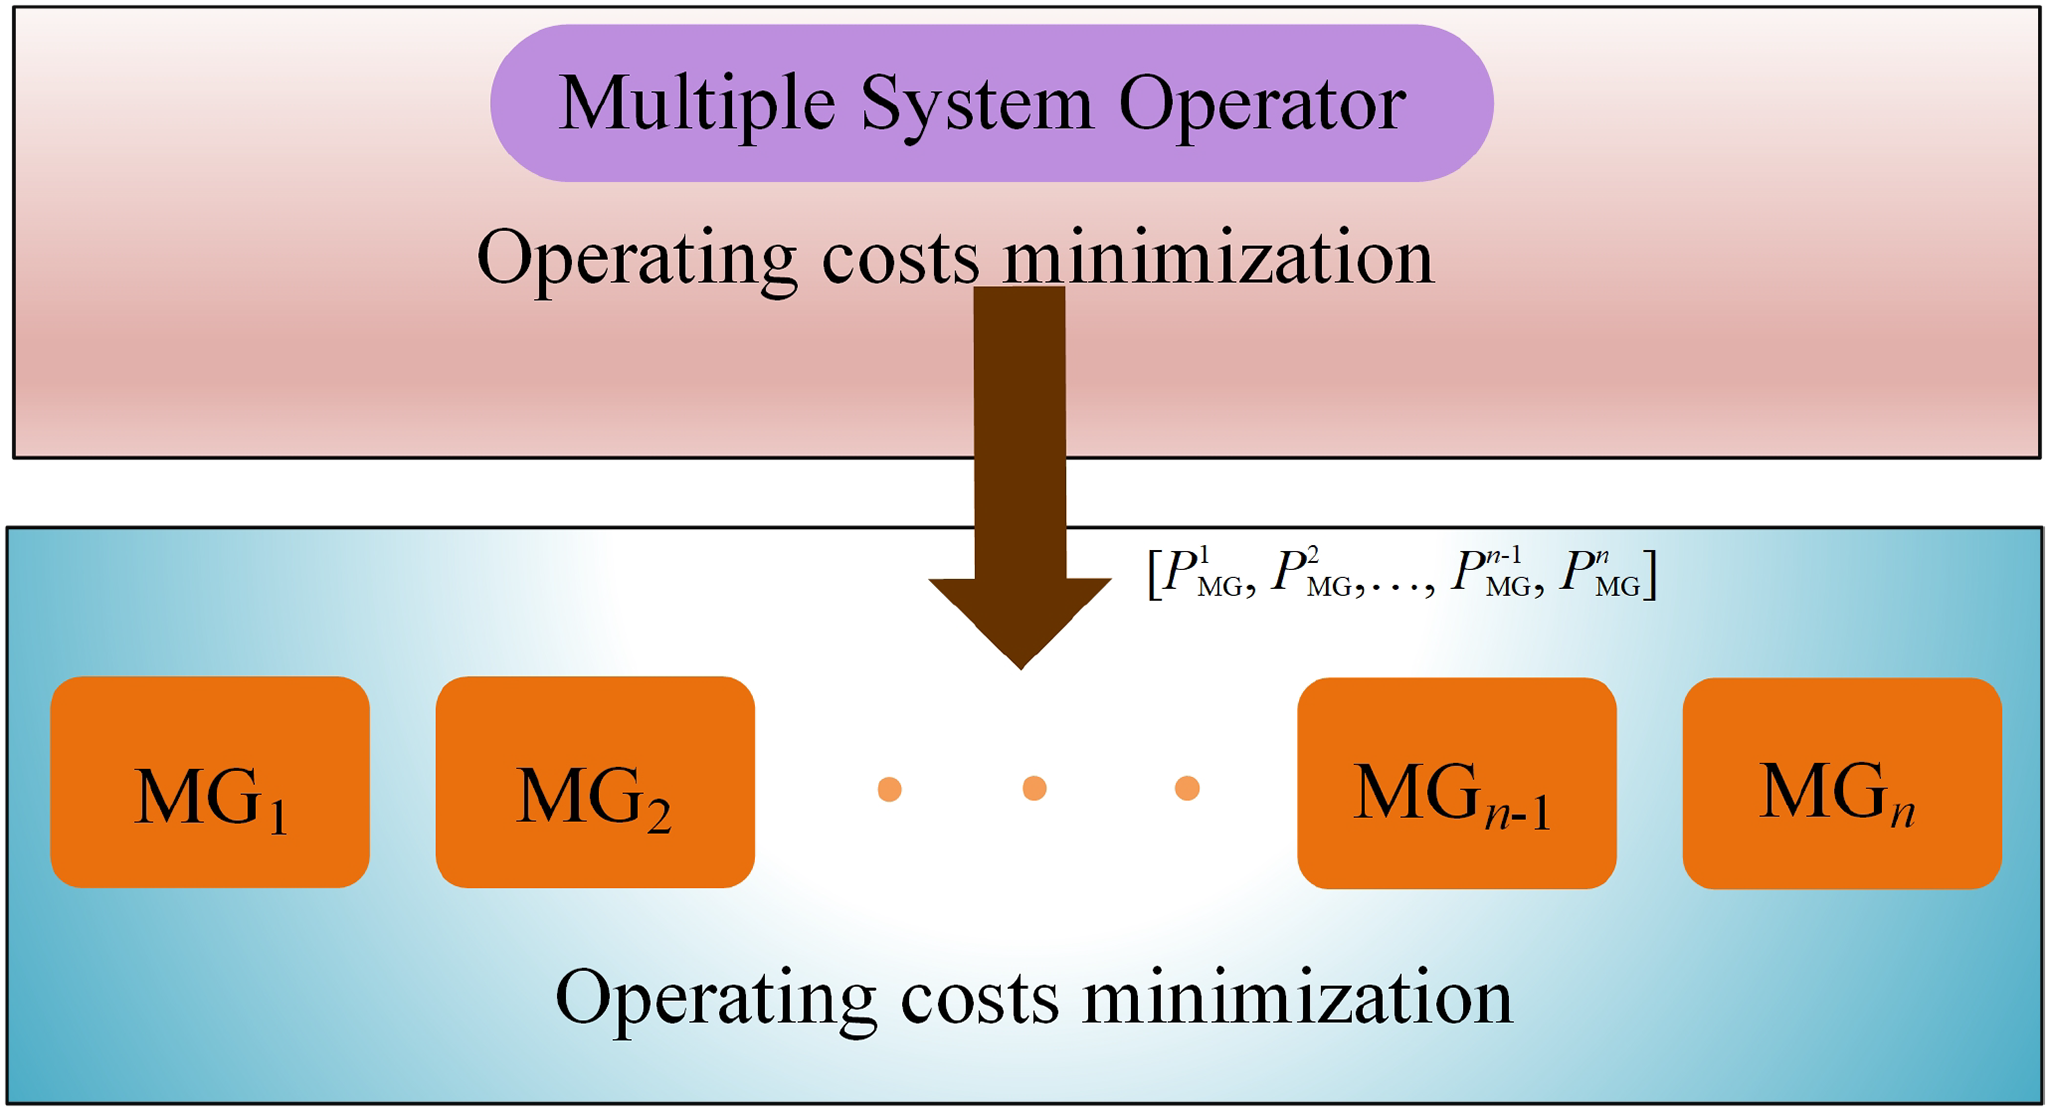
Bi-layer distributed framework.
Bi-layer problem formulation under the deterministic model
Mg model
Each MG as a unique agent contains a controller responsible for control and management for itself, optimally. For the specified MG, consider the objective function and relevant constraints when operation in grid-connected mode Feng et al. (2022); Mansour-Saatloo et al. (2021):
Objective function of each MG:

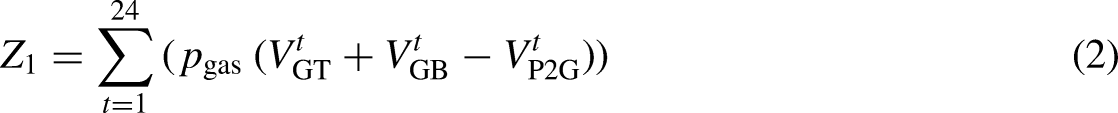
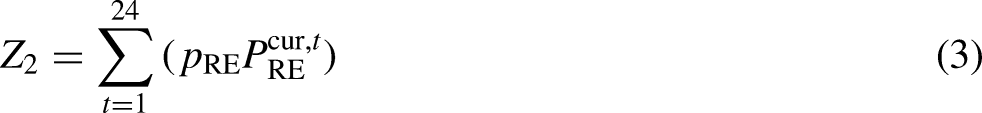
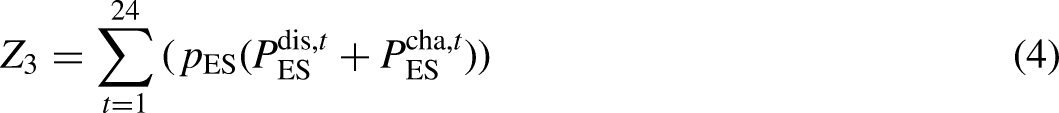
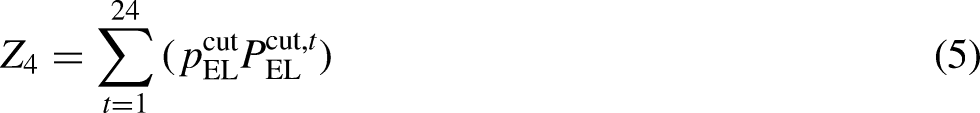
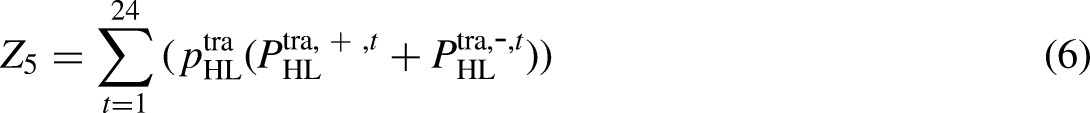
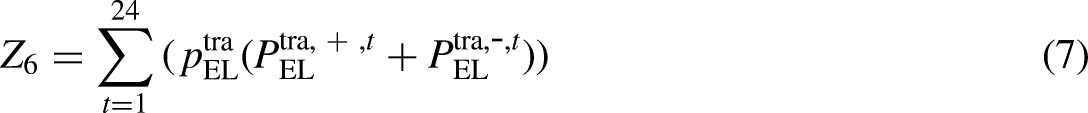

Seven terms constitute the objective function of the χth MG. Term one refers to the cost of nature gas from the GT, GB and P2G. Second and third terms are the cost of abandon RE and ES and fourth term is the cost of curtailed electrical load. Terms five and six indicate the cost of sheddable thermoelectric load. The last term illustrates carbon transaction cost. Carbon price is an important factor affecting the carbon trading market. When the emission reduction task is small, the tiered carbon price can restrain the power generation in high-emission areas and reduce the total cost of the system Hu et al. (2020). The constraints relating to each MG mechanism are as follows:
Constraints for GT, GB, and GSHP:


Equations (9)–(11) indicate the volume of natural gas required to produce thermoelectric power for GT and GB. Energy conversion constrain is used by equation (12). Equations (13)–(16) are the limitation of power output for GT, GB, and GSHP.
ES constraints:


The constraint expressing the SoC of the ES and the permissible limit is shown in equation(17). Equations (18) and (19) represent the allowable power limits for the charging and discharging states of the ES. Equation (20) holds cannot charge and discharge at the same time of ES.
P2G and CCS coordinated operation constraints:


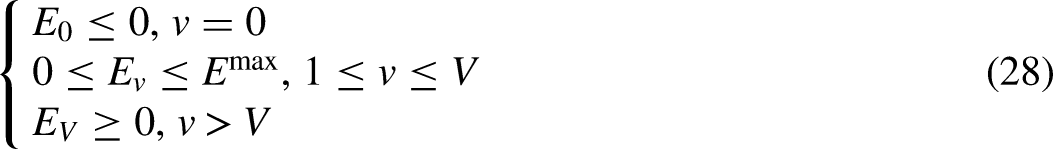

Constraints (21)–(22) indicate carbon emission and capture for P2G. Constraints (23)–(26) describe power limits for both P2G and CCS. Equations (28)–(29) are the total carbon emissions of GT and MSO.
DR constraints:


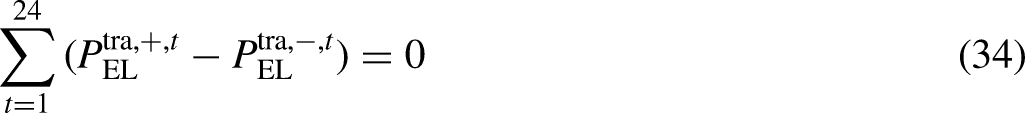


Equations (30)–(34) are shifted electrical load constraints. Equations (30)–(33) are the limits for the up and down shifted electrical load, which introduce binary variables RE and transaction power with MSO constraints:


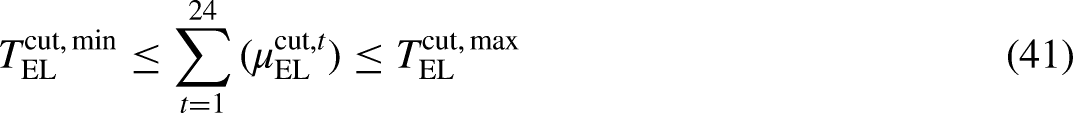
Equations (42)–(43) are the RE constraints. Equation(44) refers to the limition of transaction power with MSO.
Thermoelectric power balance constraints:


MSO model
As the medium between the power market and the MG, MSO is mainly responsible for the coordination in between them (Armendariz et al., 2017; Bendato et al., 2017). Therefore, in the case of energy trading, MSO, as the leader of MG, seems to be able to obtain more benefits by giving the transaction volume of MG participating in the market (Karimi et al., 2021). However, any time energy trading is uneconomic, it needs to be done in an optimal way from an economic and technical point of view. Therefore, the operation cost should be determined according to the objective function of the MSO.
Objective function of MSO:

The objective function of MSO includes the term referred to the cost of buying power from the electricity market. In addition, when the MG decides to sell power to an MSO, the cost of purchasing power from the MSO needs to be subtracted from the benefit in certain time periods, and it is clear that electric power cannot be bought and sold between the MG and the MSO at the same time.
Dispatchable units’ constraints: ES constraints: P2G and CCS coordinated operation constraints: DR constraints: RE and transaction power with MGχ constraints: Thermoelectric power balance constraints:
Constraints (9)–(16).
Constraints (17)–(20).
Constraints (21)–(29).
Constraints (30)–(41).
Constraints (42)–(44).
Constraints (45) and (46).
The six-part formulation is similar to the MG
χ
constraint mentioned in the previous section.
Transaction power with electricity market constraints: Equation (48) is the consistency constraint of transaction power for MGχ and MSO. Equation (49) shows the transaction power participation in the electricity market. The limits for


Solution algorithm
Robust optimization
In this paper, the electricity price is considered to be fluctuating (Lu et al., 2020; Mansour-Saatloo et al., 2021; Nikmehr, 2020). The electricity price is mainly effectively mitigated through RO, which is mainly related to its impact on decision-making, but leads to operating costs. Among these models, RO method is mainly used to analyze the fluctuation of electricity price. The RO method considers the case of low transaction price to obtain the optimal solution of this kind of problem.
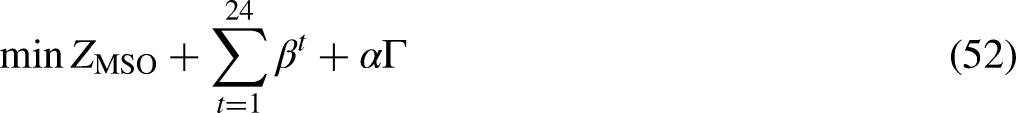
In addition, the robustness of the dispatch problem is controlled by an integer parameter Γ, called the indeterminate budget, which determines the amount of risk the coordinator wants to take. In this procedure, the RO method is applied to a specific amount of Γ, and then the number of uncertain hours in the worst-scenario is determined by optimizing Mansour-Saatloo et al. (2021). Taking εas the deviation of the trading price, the objective function can be restated as:


KF distributed algorithm
Algorithm description
The Kalman theory needs to synthesize the system state at the next moment according to the observations of two independent linear/non-linear systems. Now, The MMG containing MSO system is divided into two subsystems, i.e., the MSO and the observation system (MG). The coupling variable between the two is the energy transaction Power (57). Although MG itself cannot be linearized, its decision-making behavior and optimization process can be described by a linear system based on the KKT condition. Figure 3 shows the MMG architecture of the KF distributed algorithm. It is emphasized that the proposed KF distributed algorithm in this paper will use the KF theory in the “selection domain”, i.e., predict the k + 1th value according to the value of the kth generation:
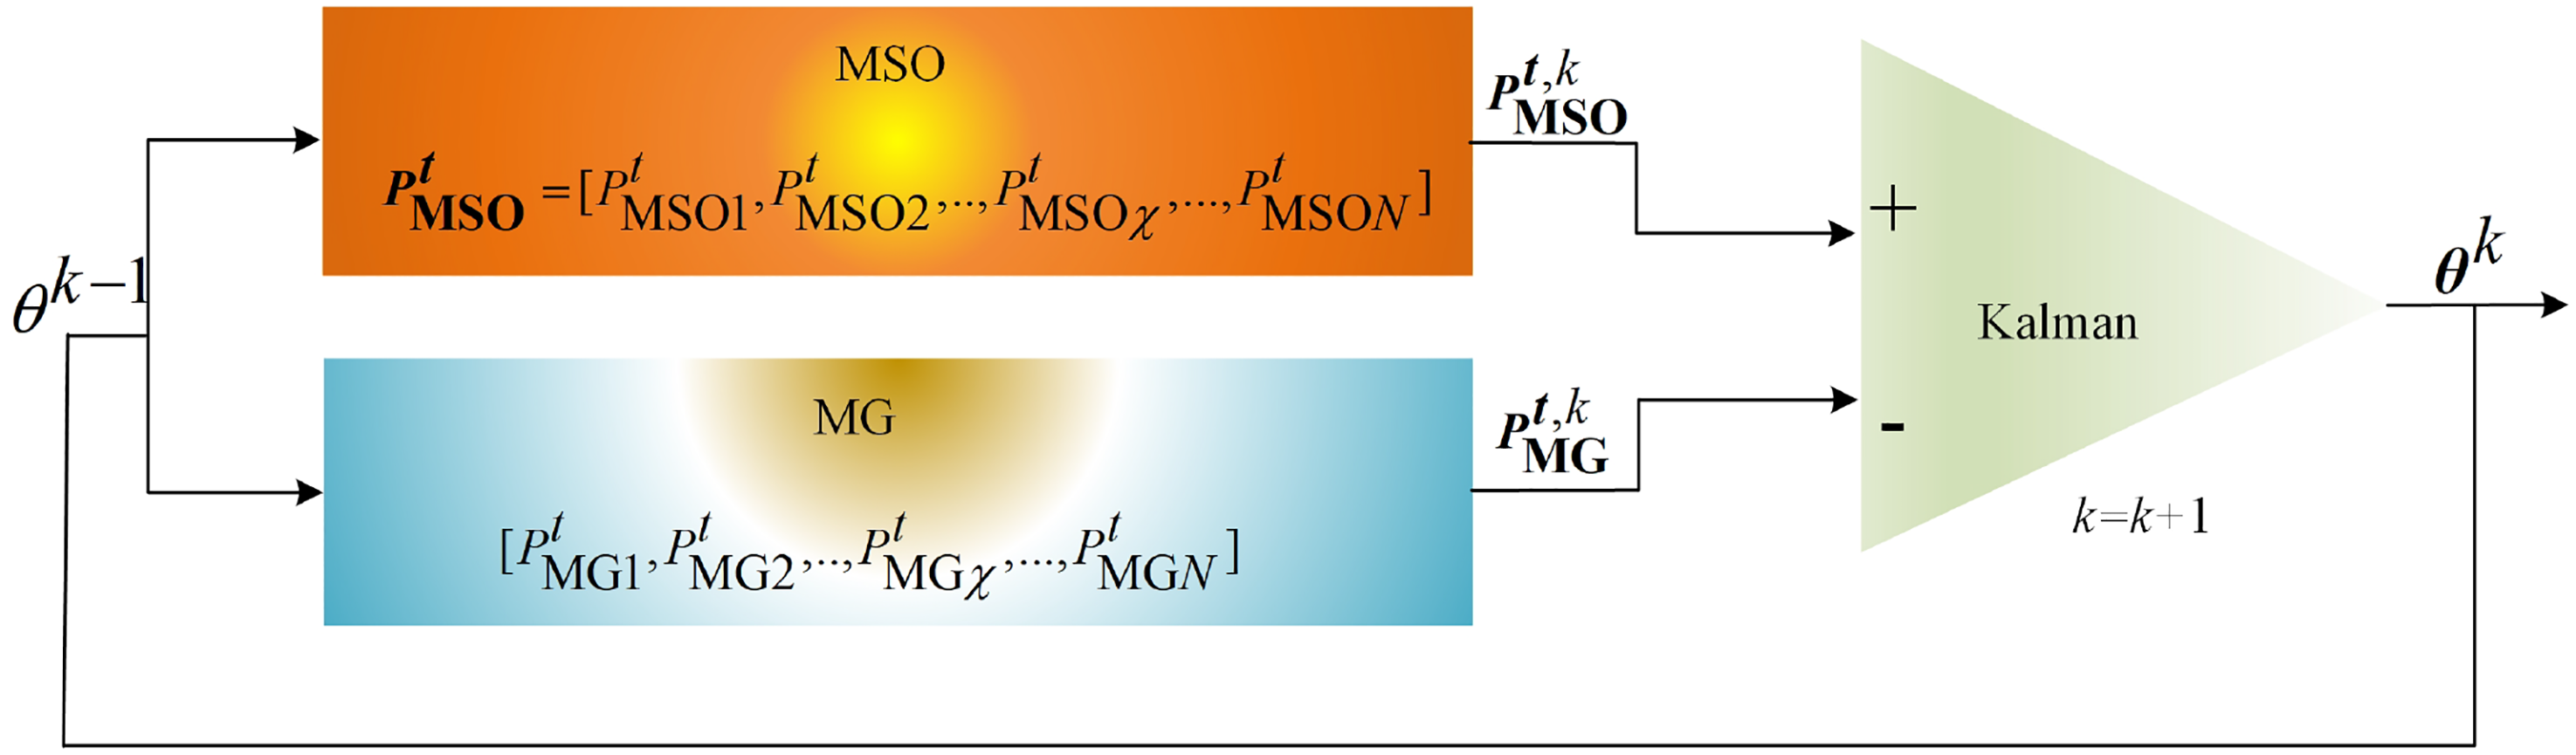
The multi-micro grid (MMG) architecture of the KFDA algorithm.
MMG based on MSO for KF distributed algorithm
In the iterative process, the initial solution 

The KF distributed algorithm continuously adjusts the Kalman gain 

When the optimal solutions of models (58) and (59) are obtained depends on the KKT conditions, the penalty terms in the objective function are 0. Models(58) and (59) are derived:

Compared with equations(60)–(61), the optimal solution is obtained with a state transition matrix: 

The Kalman gain 


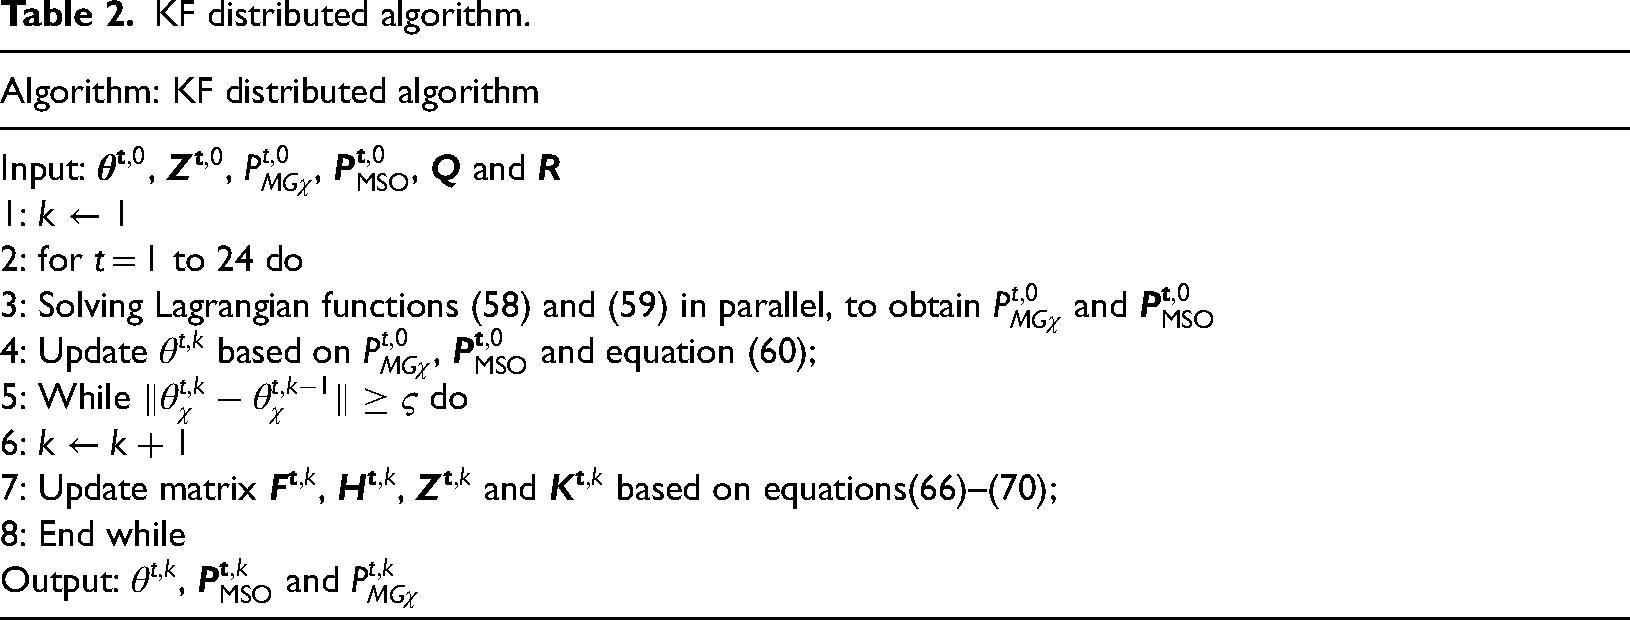
KF distributed algorithm architecture is solved by distribution in Table 2.
KF distributed algorithm.
Case study
The decentralized robust day-ahead dispatch optimization was described in multi-energy system composed of three MGs and an MSO, as shown in Figure 1. Each MG is equipped with three units for GT, GB, and HB; P2G technology; ES as energy storage system; P2G-CCS operation system; wind and PV as RE sources. Figure 4 shows the electric trading prices for the next day. The parameters of generation units and ES are referred to the literatures (Gao et al., 2017; Rueda et al., 2013).
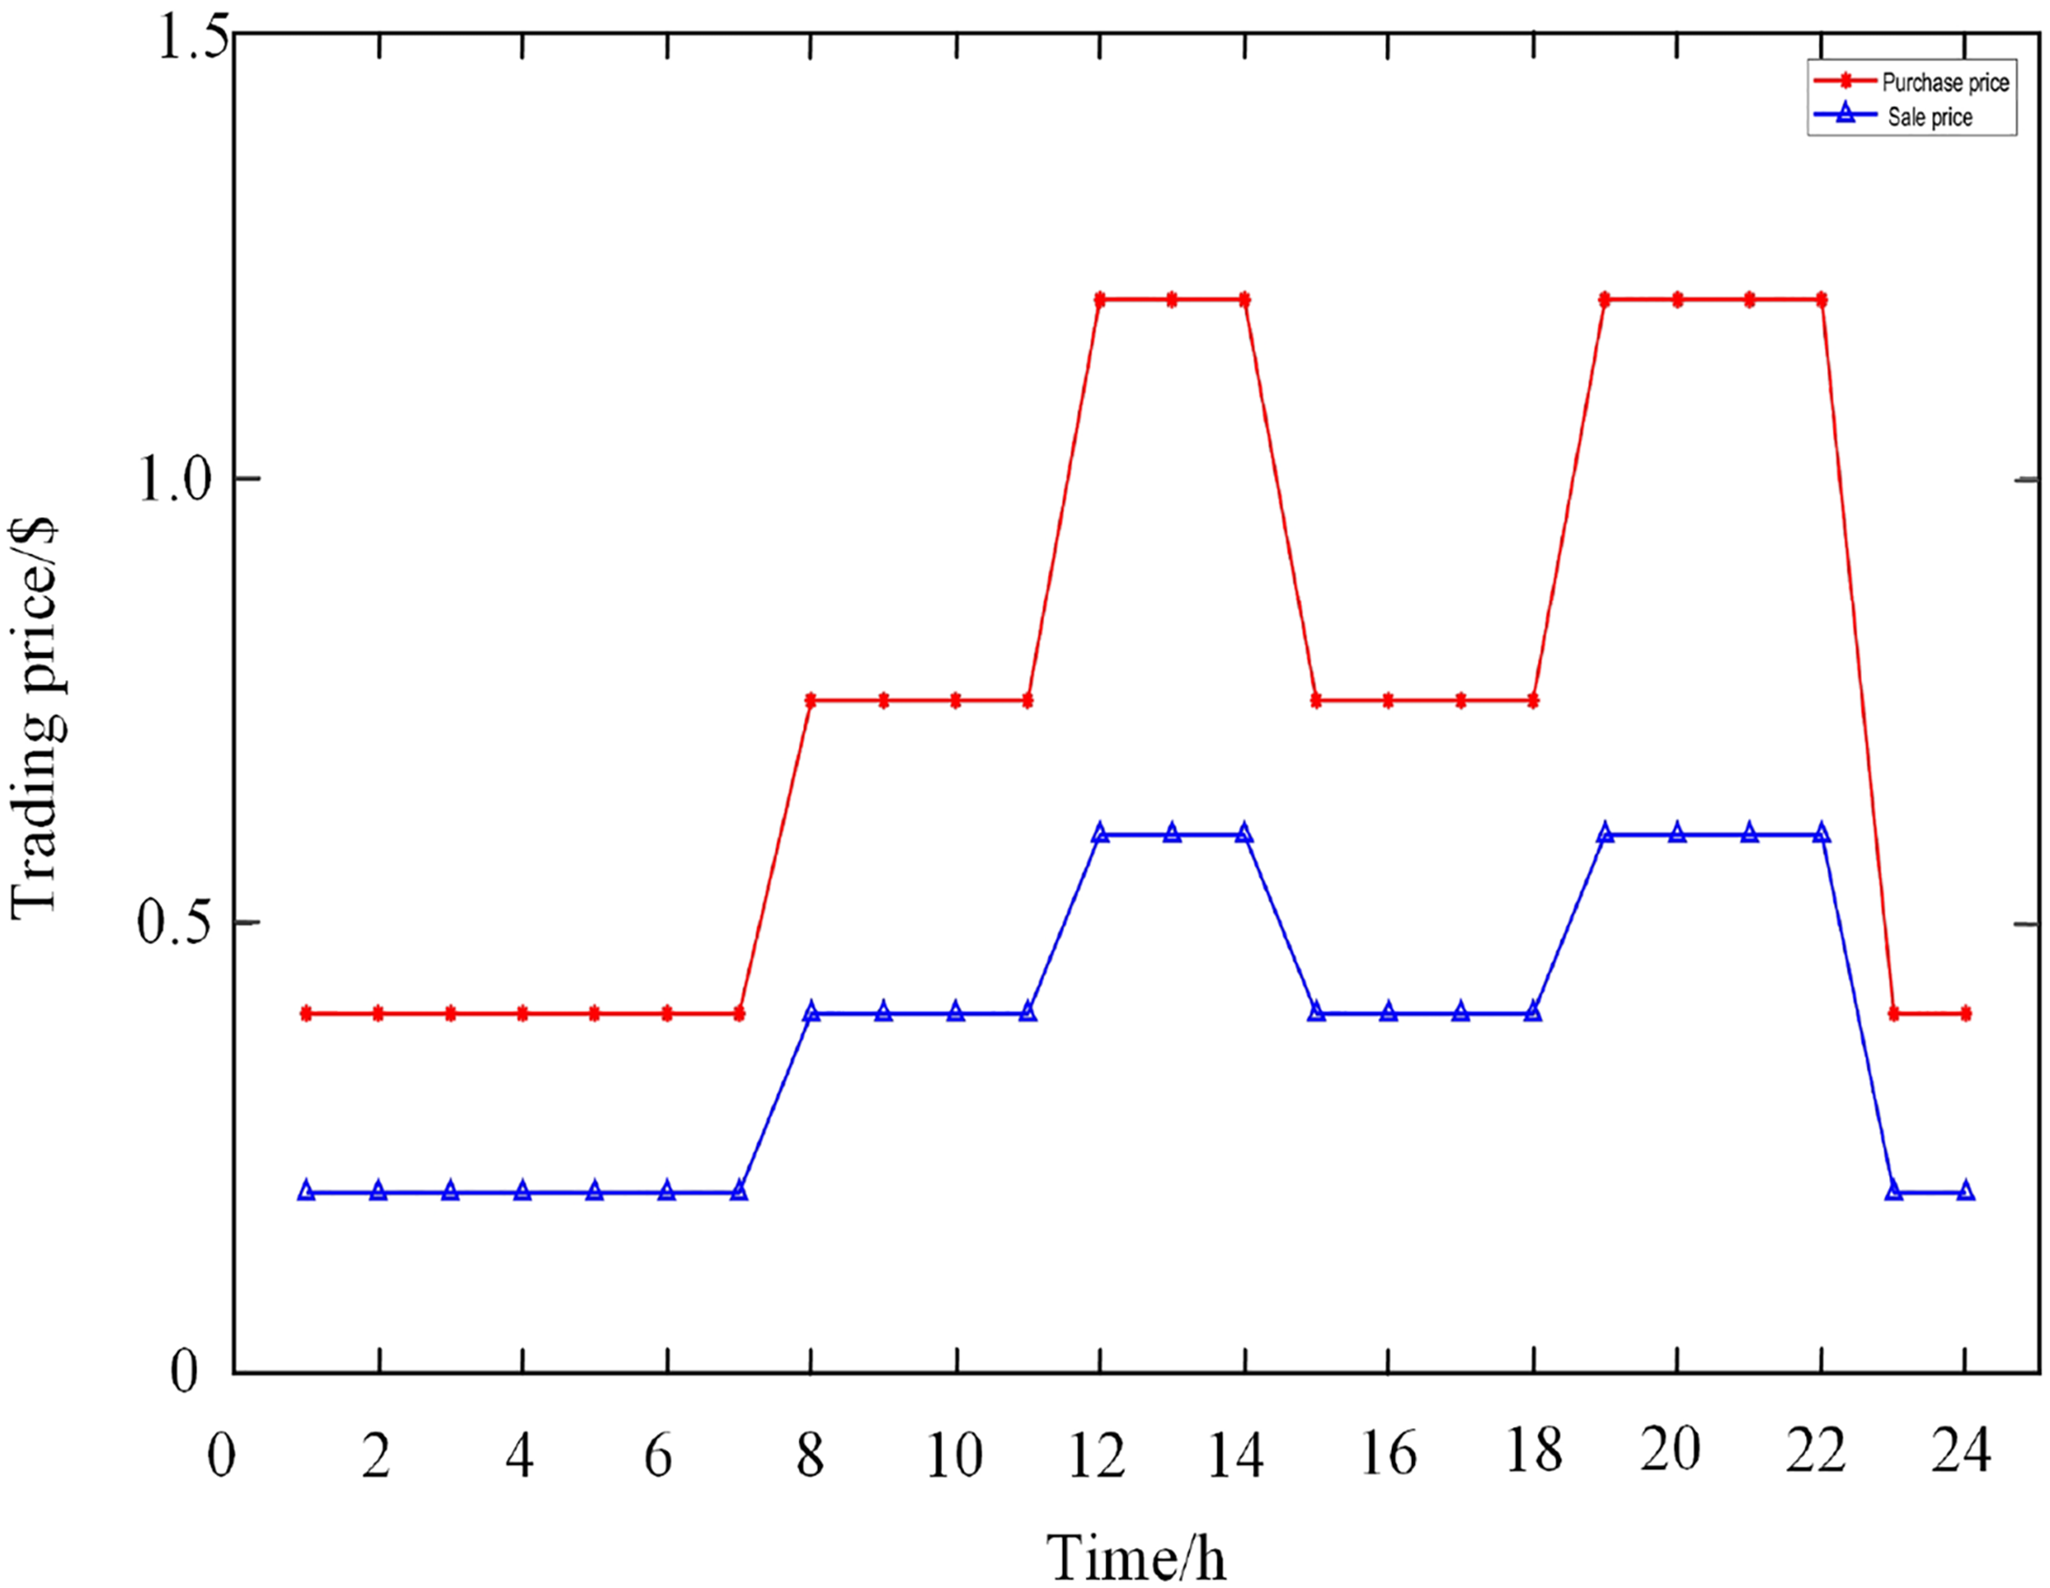
The electric trading prices between microgrid service operator (MSO) and the electric market.
The model in this paper is tested on a PC with a main frequency of 2.8GHz and a memory of 32GB using the Matlab R2020a simulation platform, and the YALMIP optimization toolbox is embedded to call CPLEX for optimization.
The day-ahead dispatch deterministic result of MMG
Figure 5 indicates the optimal dispatch of thermoelectric power for each MGs separately. Figure 5 use a deterministic method to solve optimization problem, ignoring the uncertainty of the energy market. Figure 5 (a1)–(a3) are the electric power, (b1)–(b3) are the heat power, and 1–3 are the labels of the MG. MGs 1 and 3 are equipped with wind and MG 2 is equipped with PV.
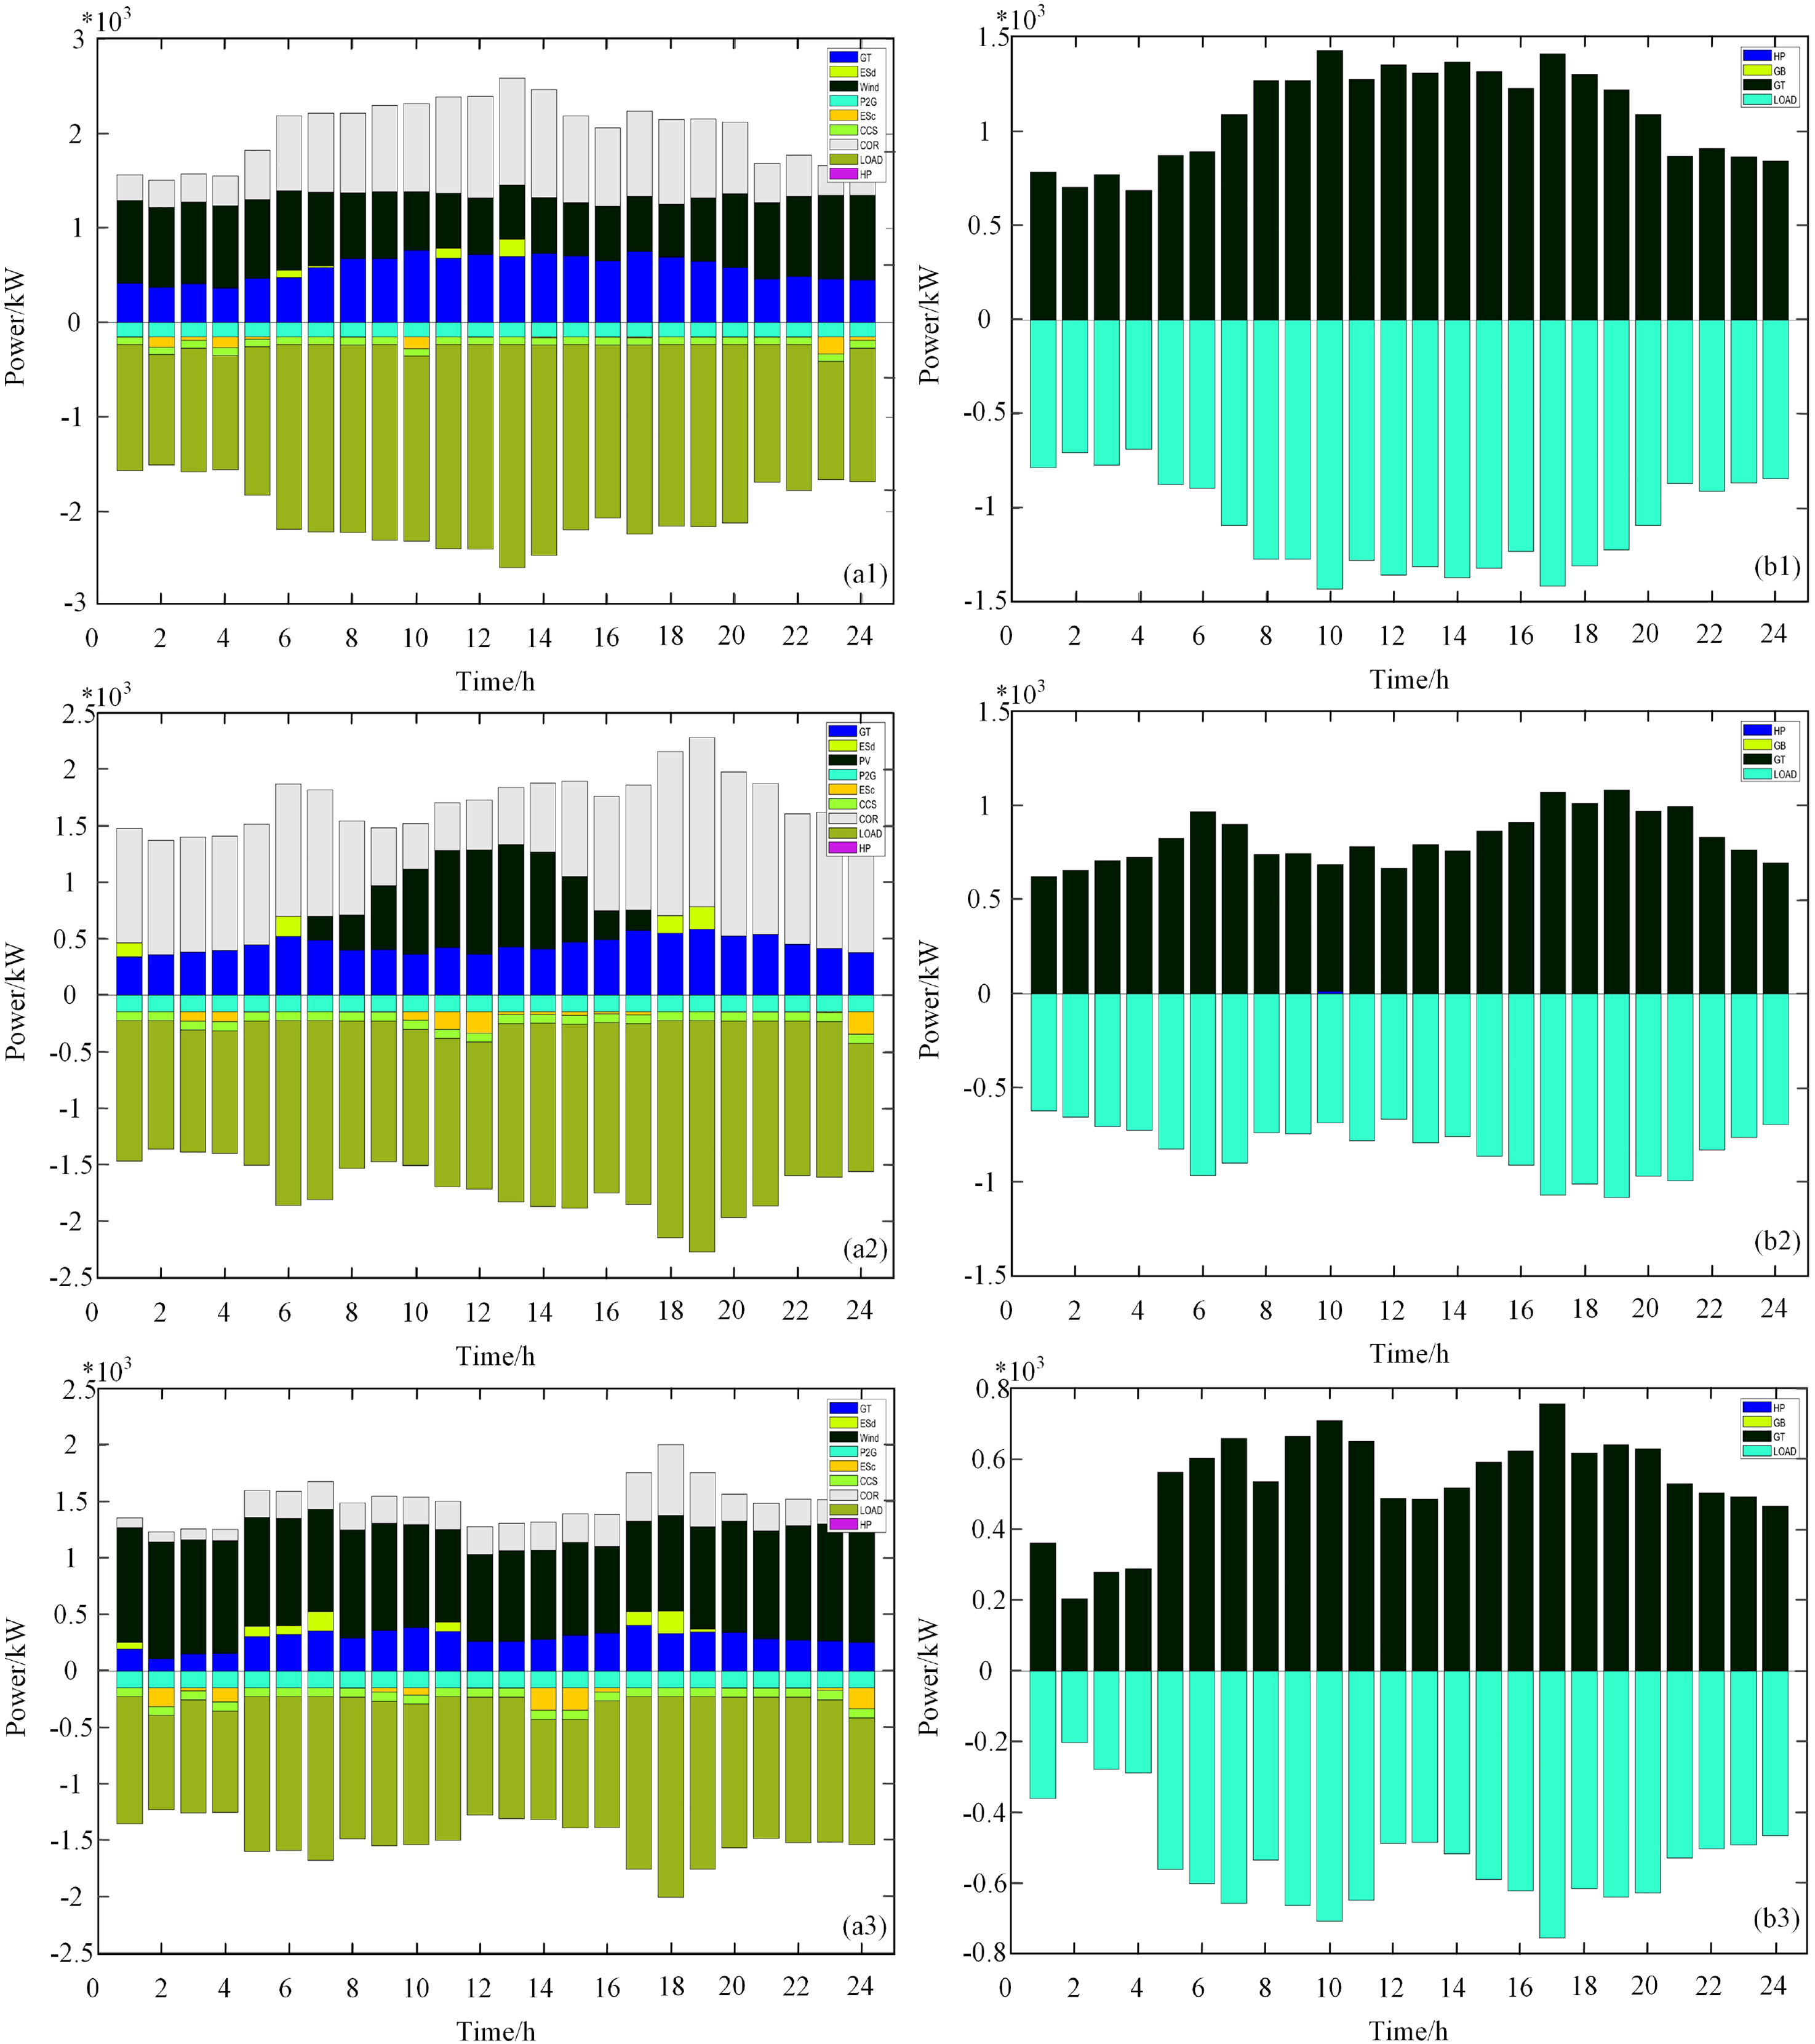
The day-ahead dispatch result of each microgrid (MG). (a1), (b1): MG1; (a2), (b2): MG2; (a3), (b3): MG3.
Due to rising electrical load, GT of MG1 is called after hour t = 6, and operators prefer to use domestic technology to supply the loads. At the same time, the buying of electrical power is also rised to the operator. The electric load of MG2 is at its peak during t = 17–21, and the operator purchases electric power from the power market. This is due to the operation cost of GT is higher than power market prices. In MG3, the output of wind in a 24-h period is relatively large, and the electricity purchased from the electricity market is 2–3 times smaller than that of MG1. Every MG operator benefits from ES because of its ability to save electrical power during low-price periods and its ability to deliver power in peak hours. According to Figure 5(a1), ES charges during t = 2–4, 20, 23–24, Where the trading price of electricity is low and discharge when the price rises, i.e., t = 6–7, 11, 13. Due to the low power purchase price, CCS mainly obtains CH4 from the electricity market and GT, and P2G produces less CH4 for each MG. Figures 5(b1)–(b3) show the heat power dispatch results. The heat load requirements for each MGs are all provided by GT.
DR analysis
Figure 6 shows the result of DR implementation for thermoelectric loads, respectively. (a1)–(a3) are the electric load, (b1)–(b3) are the heat load, and 1–3 are the labels of the MG. The operators encourage demand-side departments to play a role in DR dispatch, reducing operational costs and promoting RE utilization through peak cutting and valley filling. According to Figures 6(a1) to (a3), electricity DR to successful supply, performance during this period is positive. Take MG1 as an example, the MG shift the loads from on-peak power market hours, i.e., t = 6–19, to off-peak hours, i.e., t = 1–5, 20–24. As a result, MG can deliver a load of 5.6%at a lower cost. In addition, according to the heat DR results in Figure 6(b1), for MGl during hours t = 9–18, heat demand was shifted up, which is need to shift up the heat load at the moment.
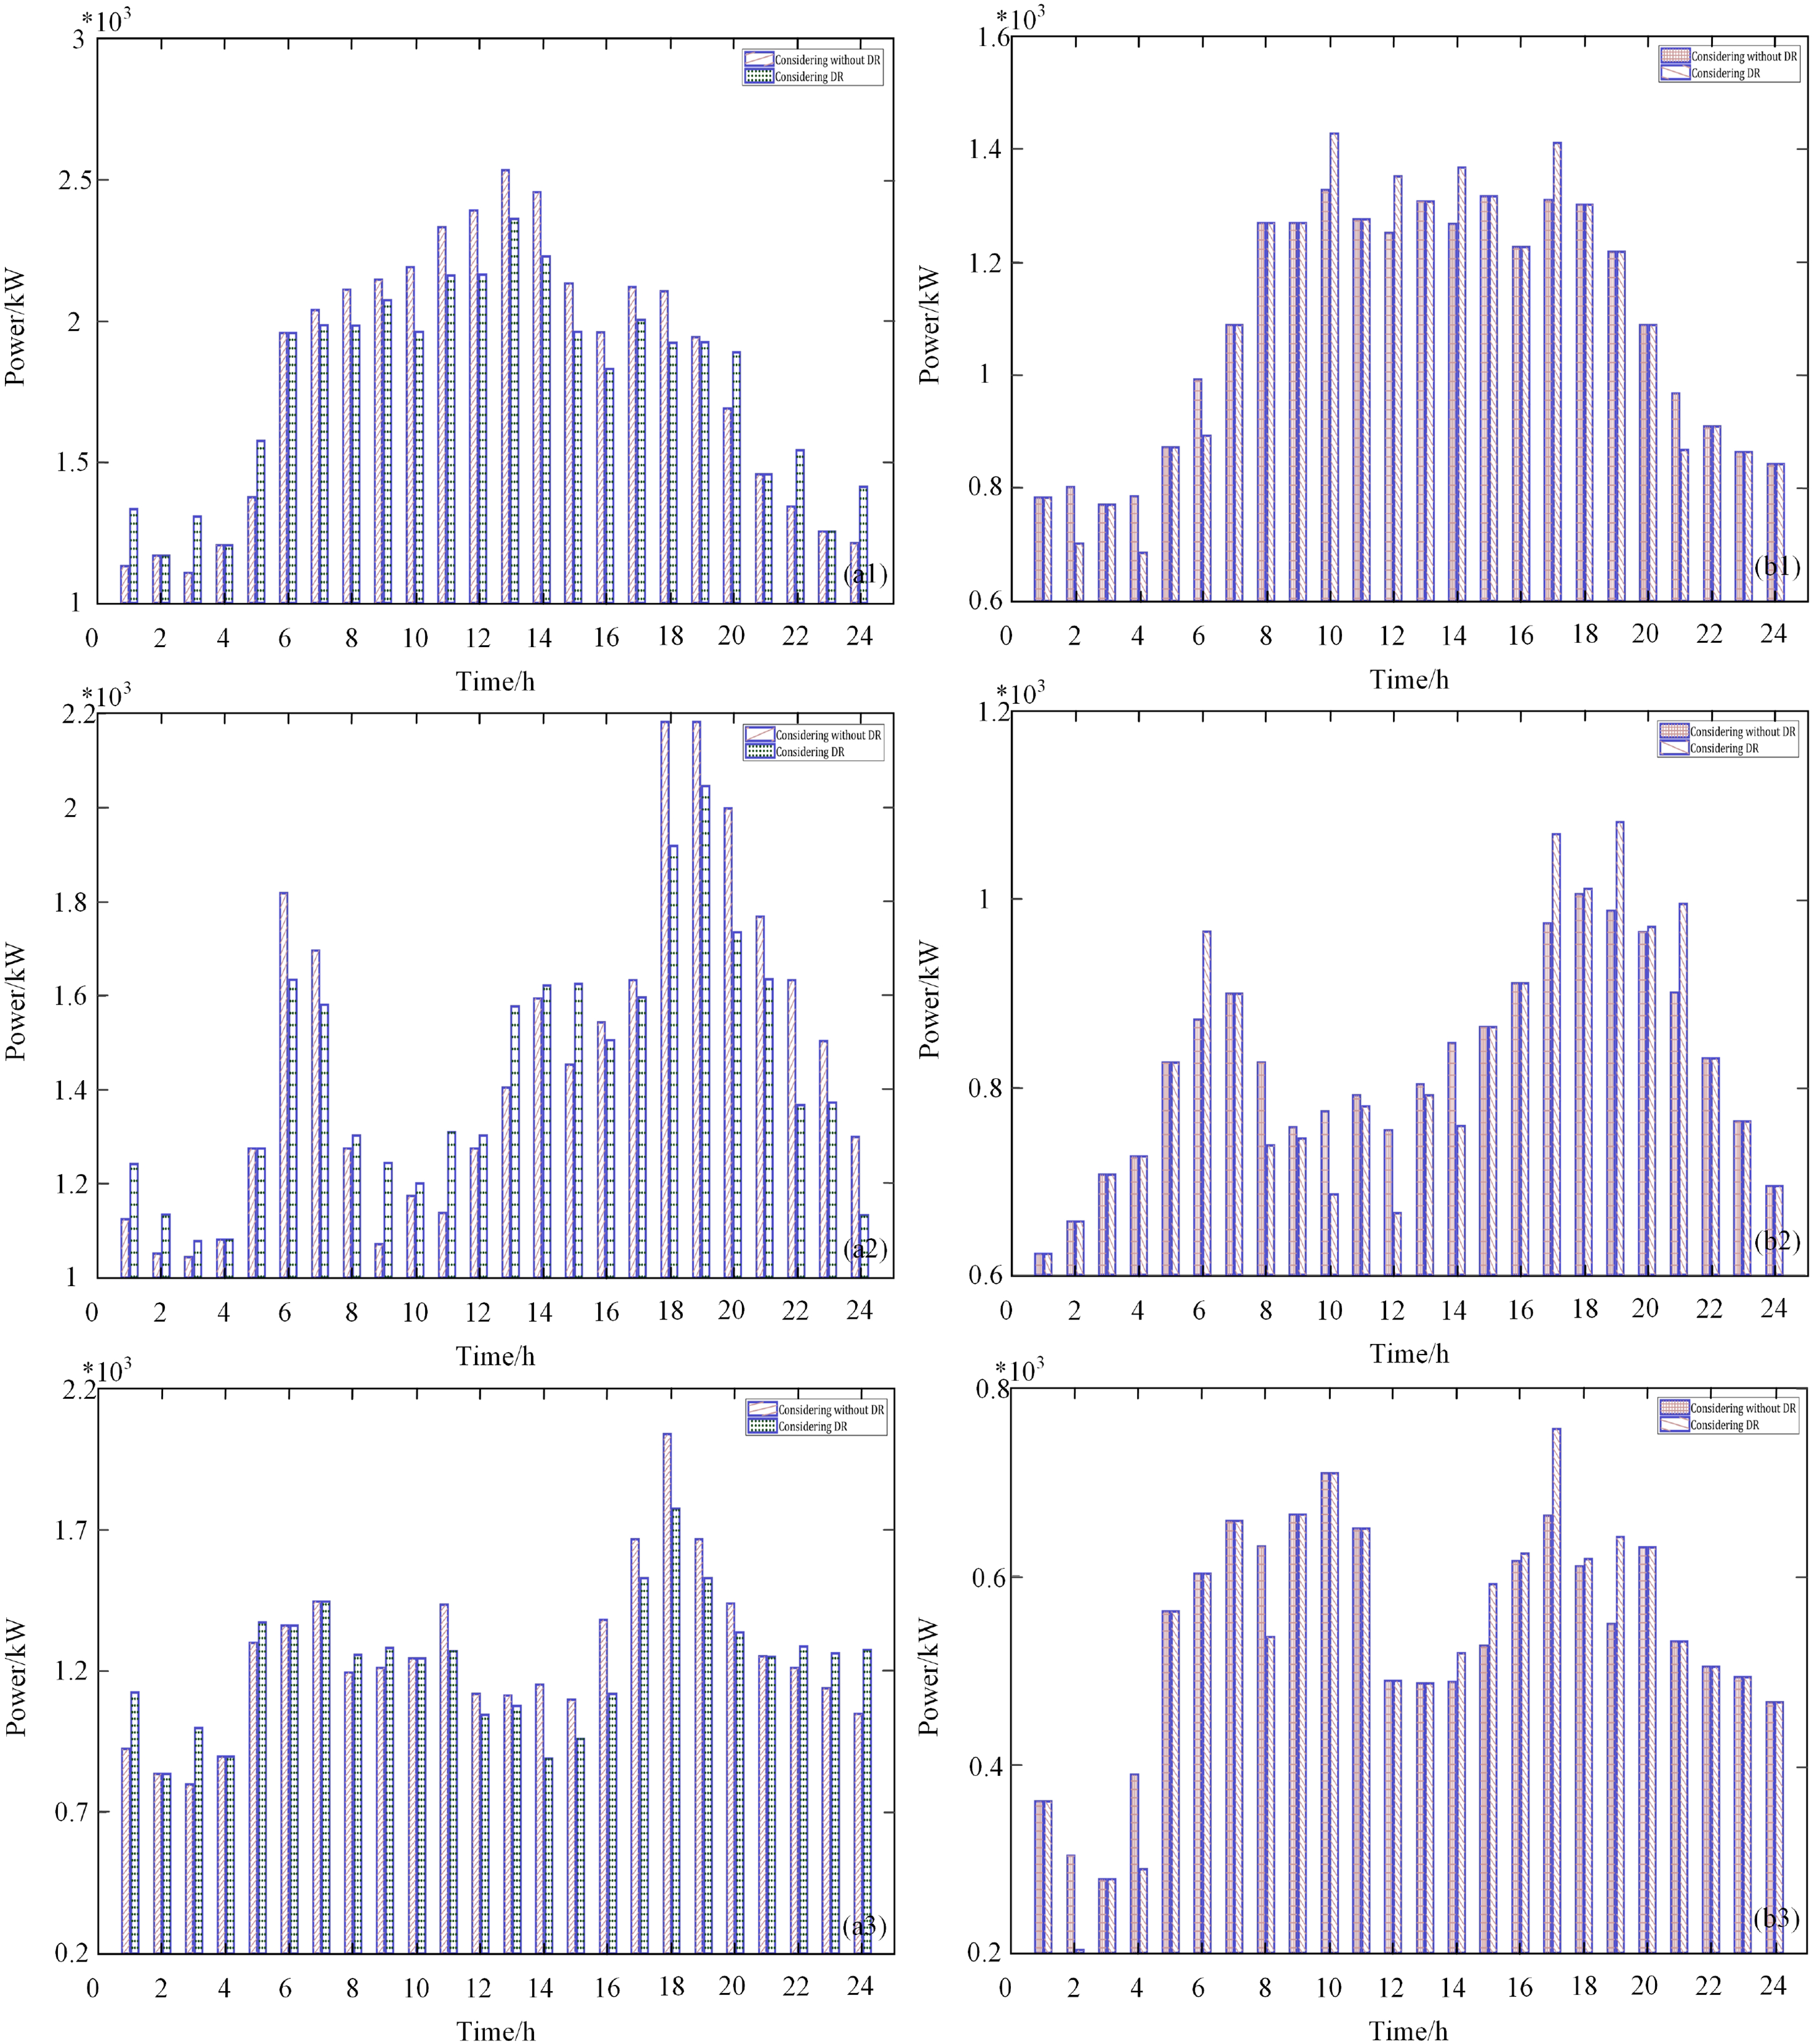
The DR result of each MG:(a1),(b1): MG1; (a2),(b2): MG2; (a3),(b3):MG3. DR, demand response; MG, microgrid.
Tiered carbon price analysis
This part compares the operating costs of carbon Price using two cases:
Case1: The tiered carbon price method mentioned considering P2G-CCS system in this article. Case2: The uniform carbon price adopted in each MG considering P2G-CCS systerm. Case3: Regardless of P2G-CCS technology in the tiered carbon price method i.e., keep CCS and P2G separately.
Figure 7 shows the carbon balance for each MG in Case 1. The CO2 required by each MGs comes from the GT, which is supplied to P2G and CCS to convert it into natural gas. Take MG as an example, the carbon required for CCS is at its peak during t = 1–7,18–24. Just in time, CO2 produced by GT is also in a peak state. At t = 10–11, CCS requires less carbon.
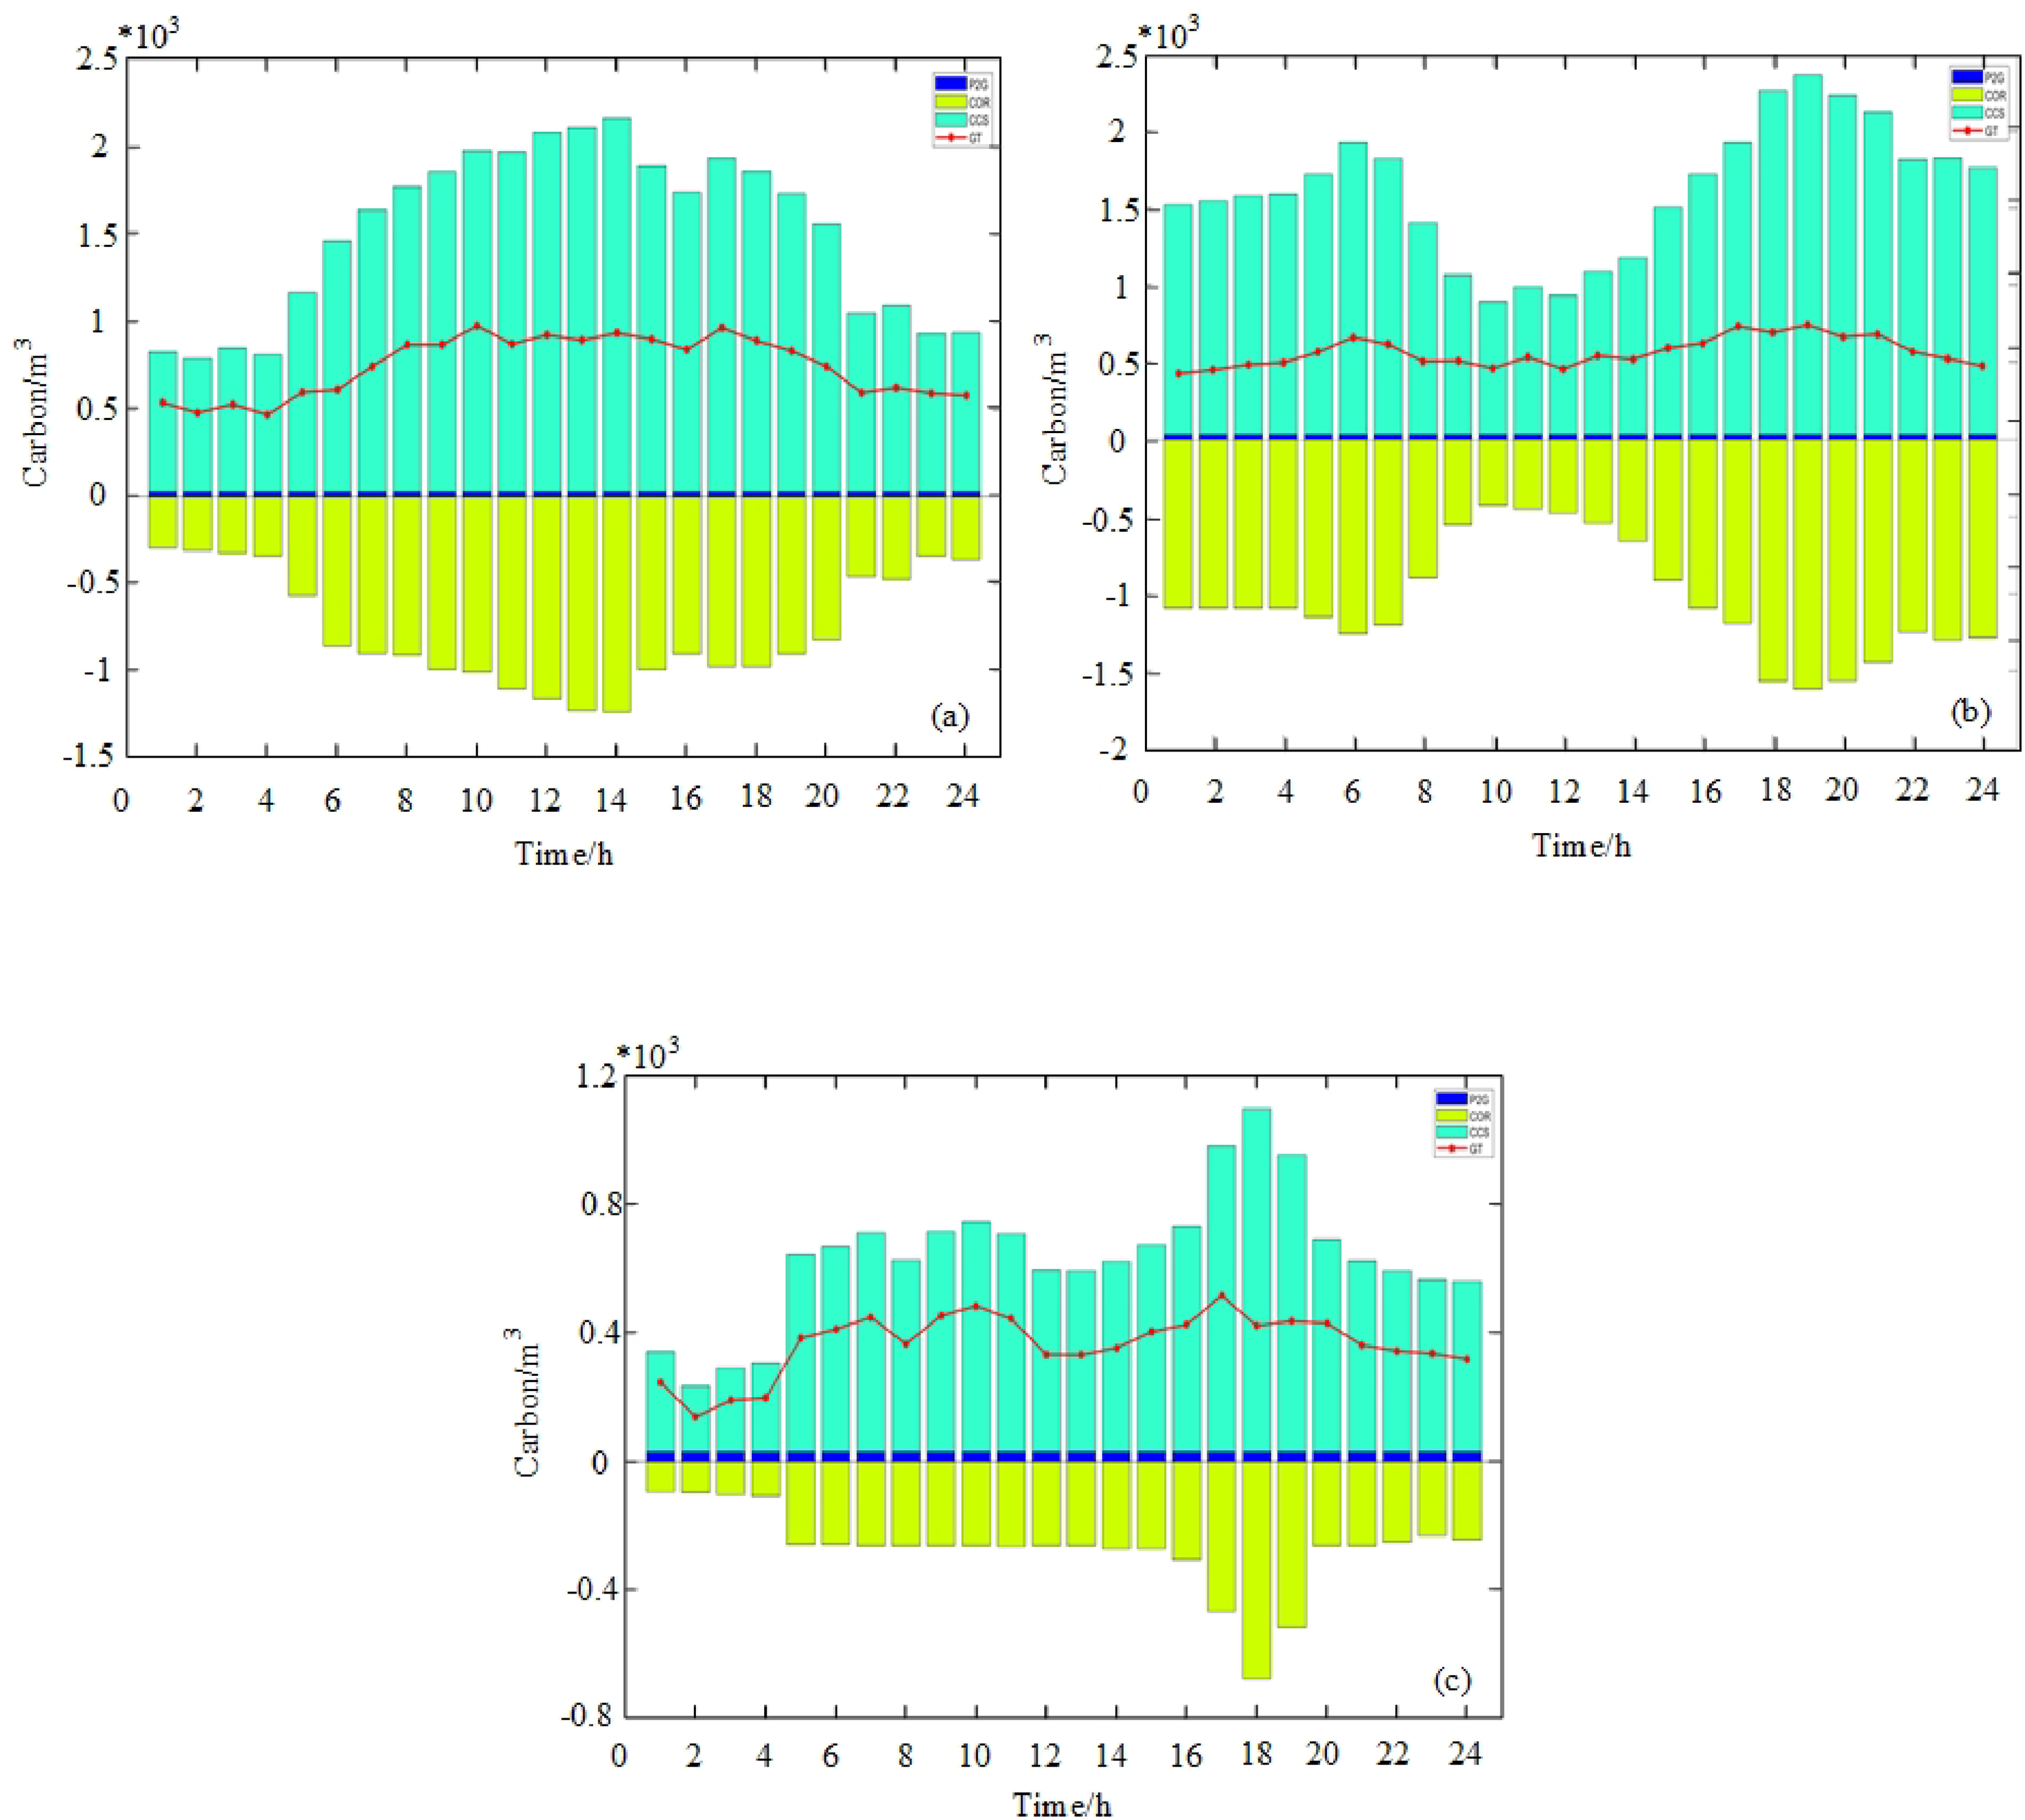
Carbon balance for each microgrid (MG).(a): MG1; (b):MG2; (c):MG3.
As can seen from Table 3 that the CO2 discharged into the air in case3 is (17914, 20948, 6828)(m3) less than (68, 81, 93.1)(m3) in case1(17846, 20867, 6734.9)(m3).However, the proportions of CO2 emissions into the air are 50.15%, 54.83%, and 46.0% in Case 1, and the proportions are 52.0%, 56.68%, and 50.34% in Case 3. It can be seen that adding CCS to the system can effectively reduce carbon emissions.
Comparison of carbon emission between Case 1 and Case 3 (m3)
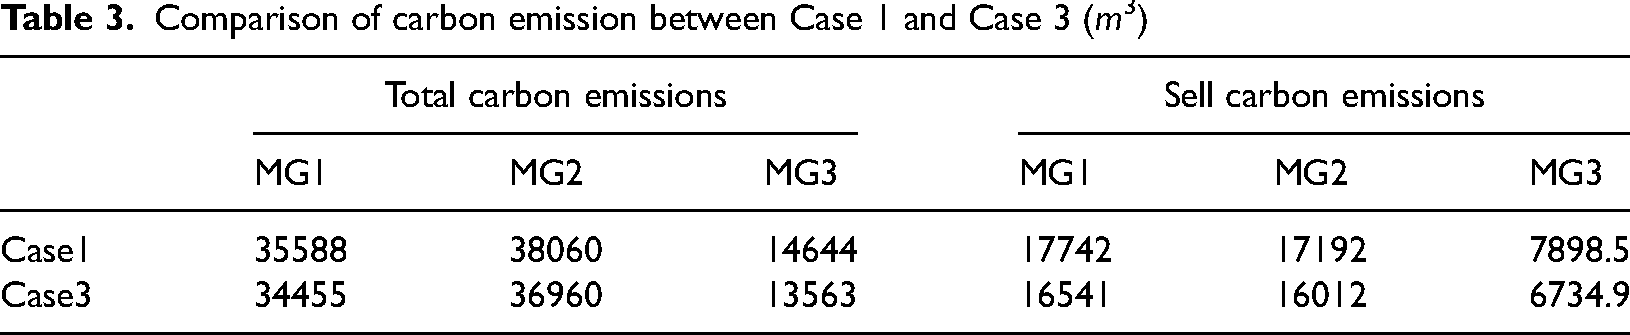
Figure 8 gives two cases about carbon price. Compared with Case1, the carbon emission of Case 2 is slightly higher by (0.37%, 0.51%, and 0.49%) for each MGs, which utilize the total carbon in 24-h. When the emission reduction task is small, compared with the uniform carbon price, the tiered carbon price can restrain the GT to reduce the total cost and carbon emissions.
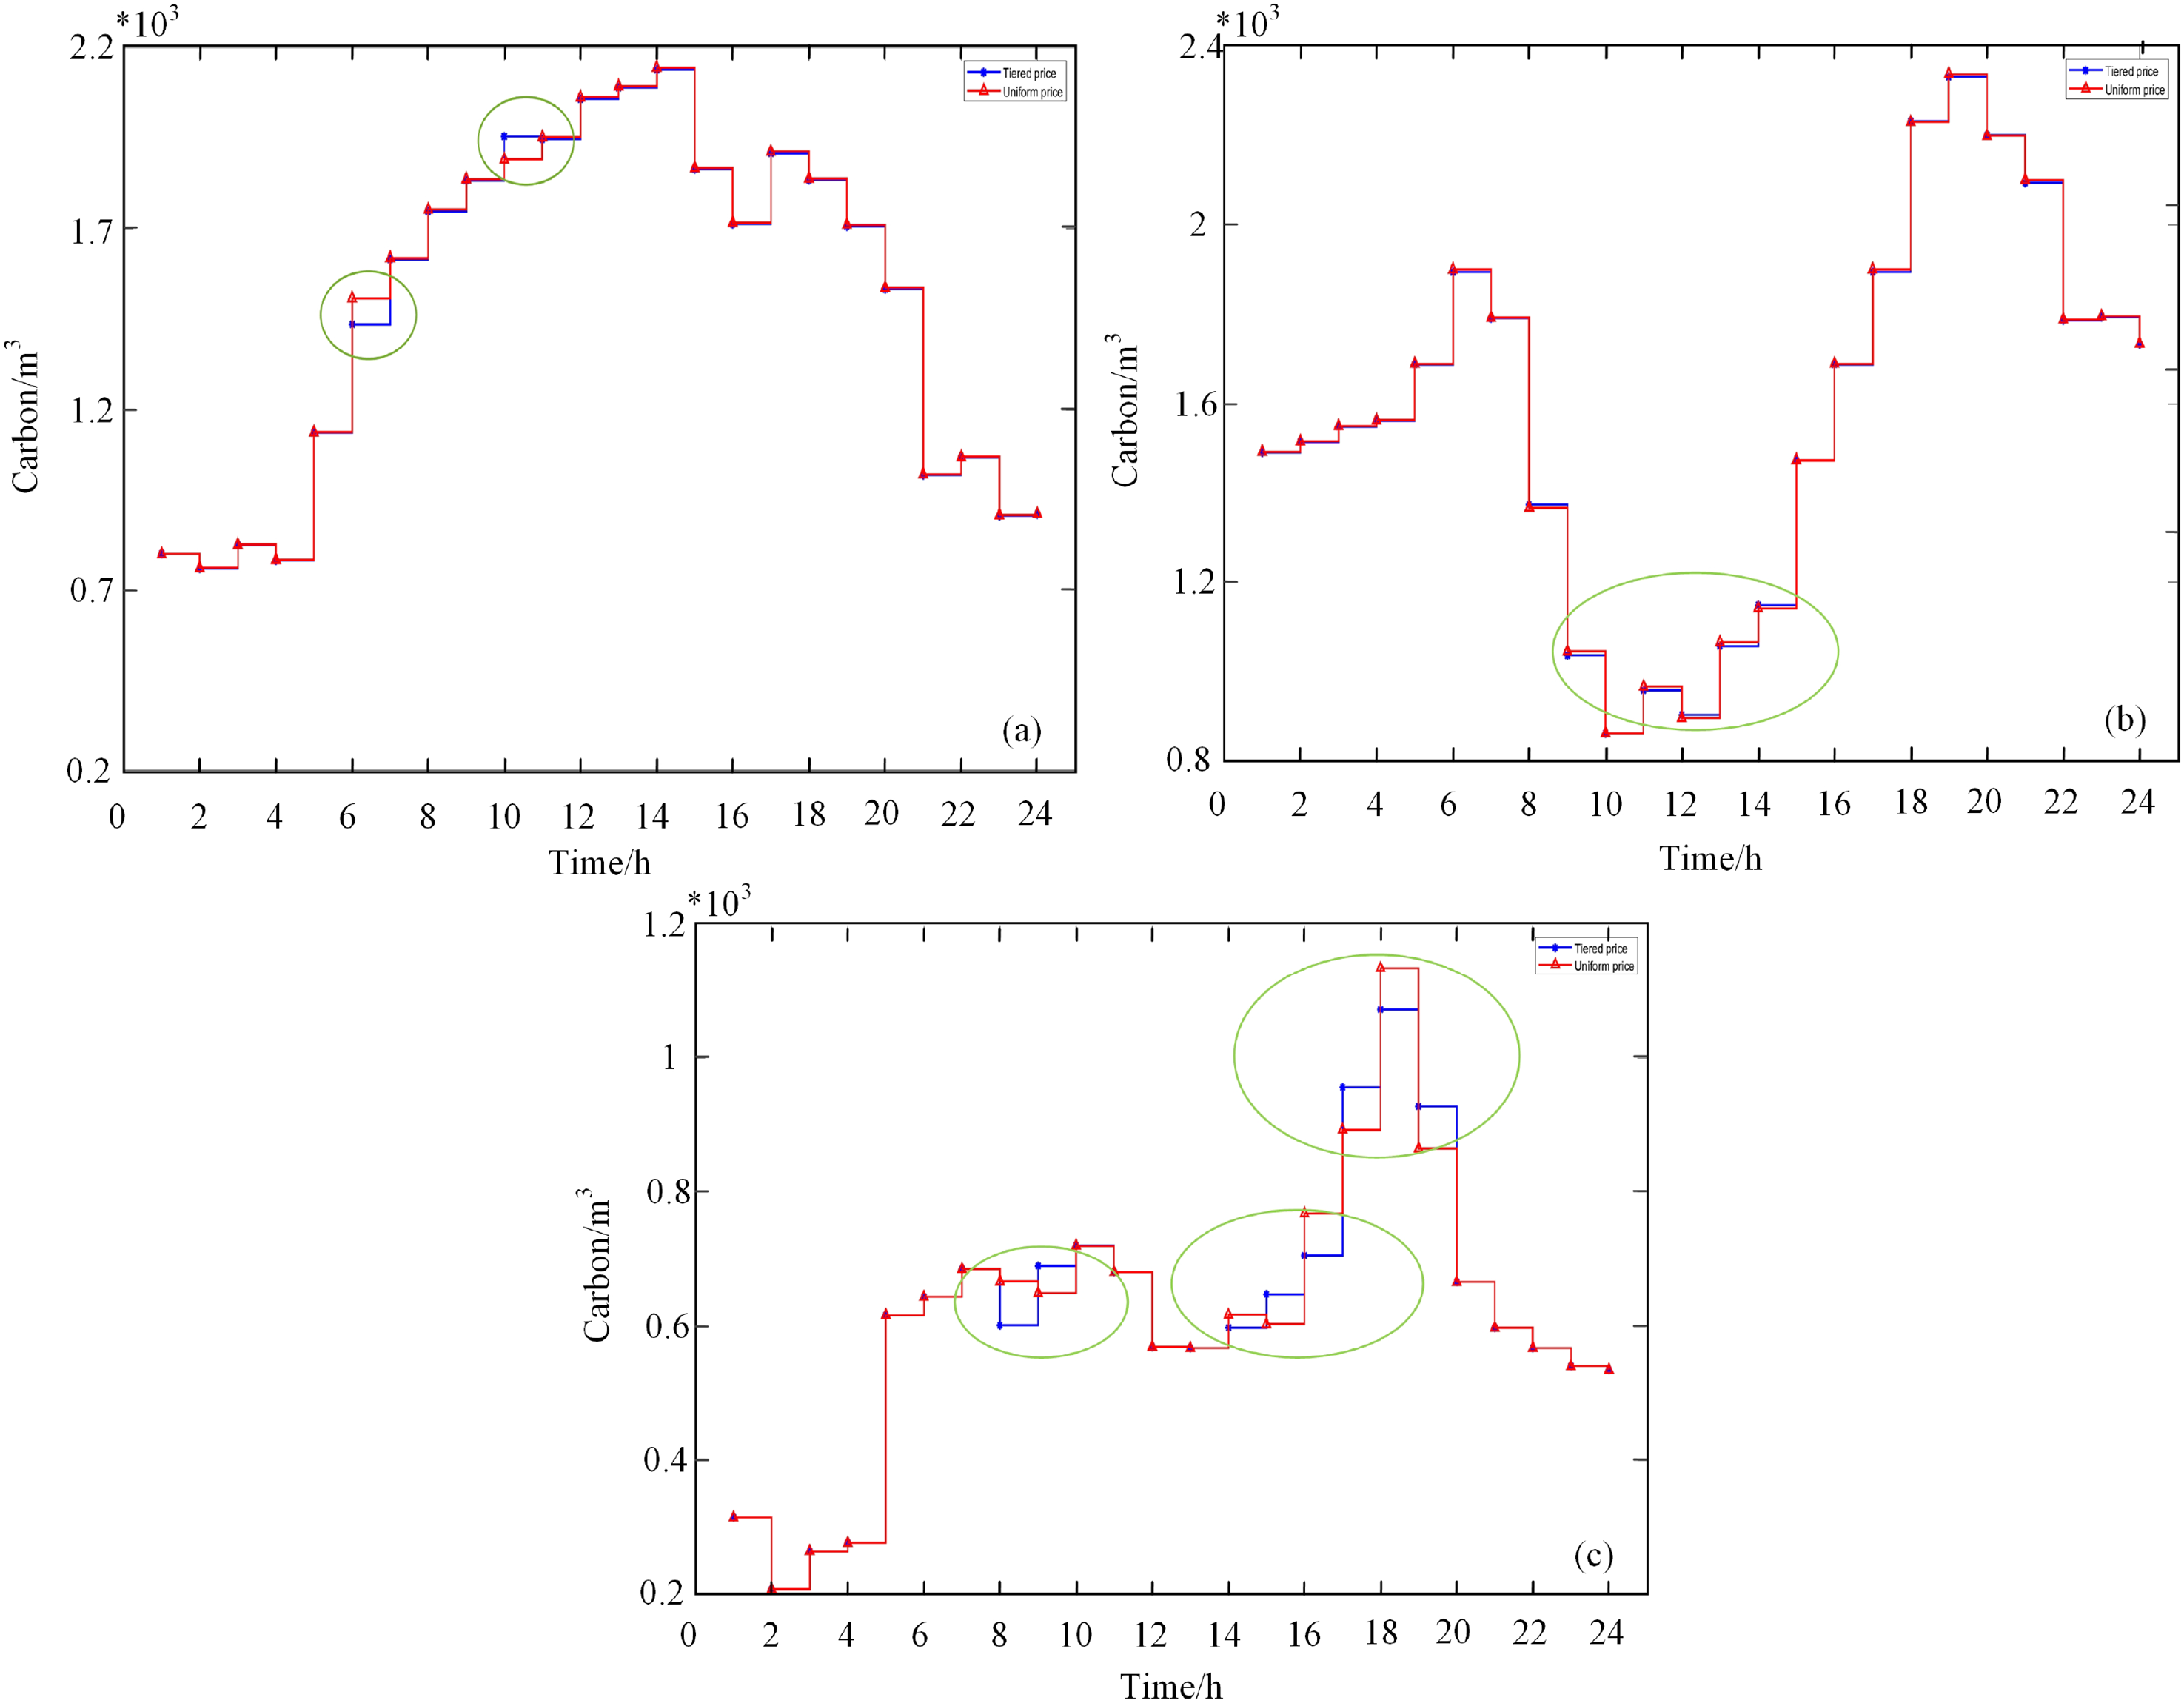
Comparison of the two price mechanisms for each microgrid (MG):(a) is MG1; (b) is MG2; (c) is MG3.
Robustness analysis of trading price
The uncertainty of energy market affects MMG trading power, as shown in Figure 9, with different deviations ɛ. During the worst-case scenarios, the larger ɛ, the larger the transaction volume of MG, i.e., t = 18–22 in MG2, t = 19 in MG3.
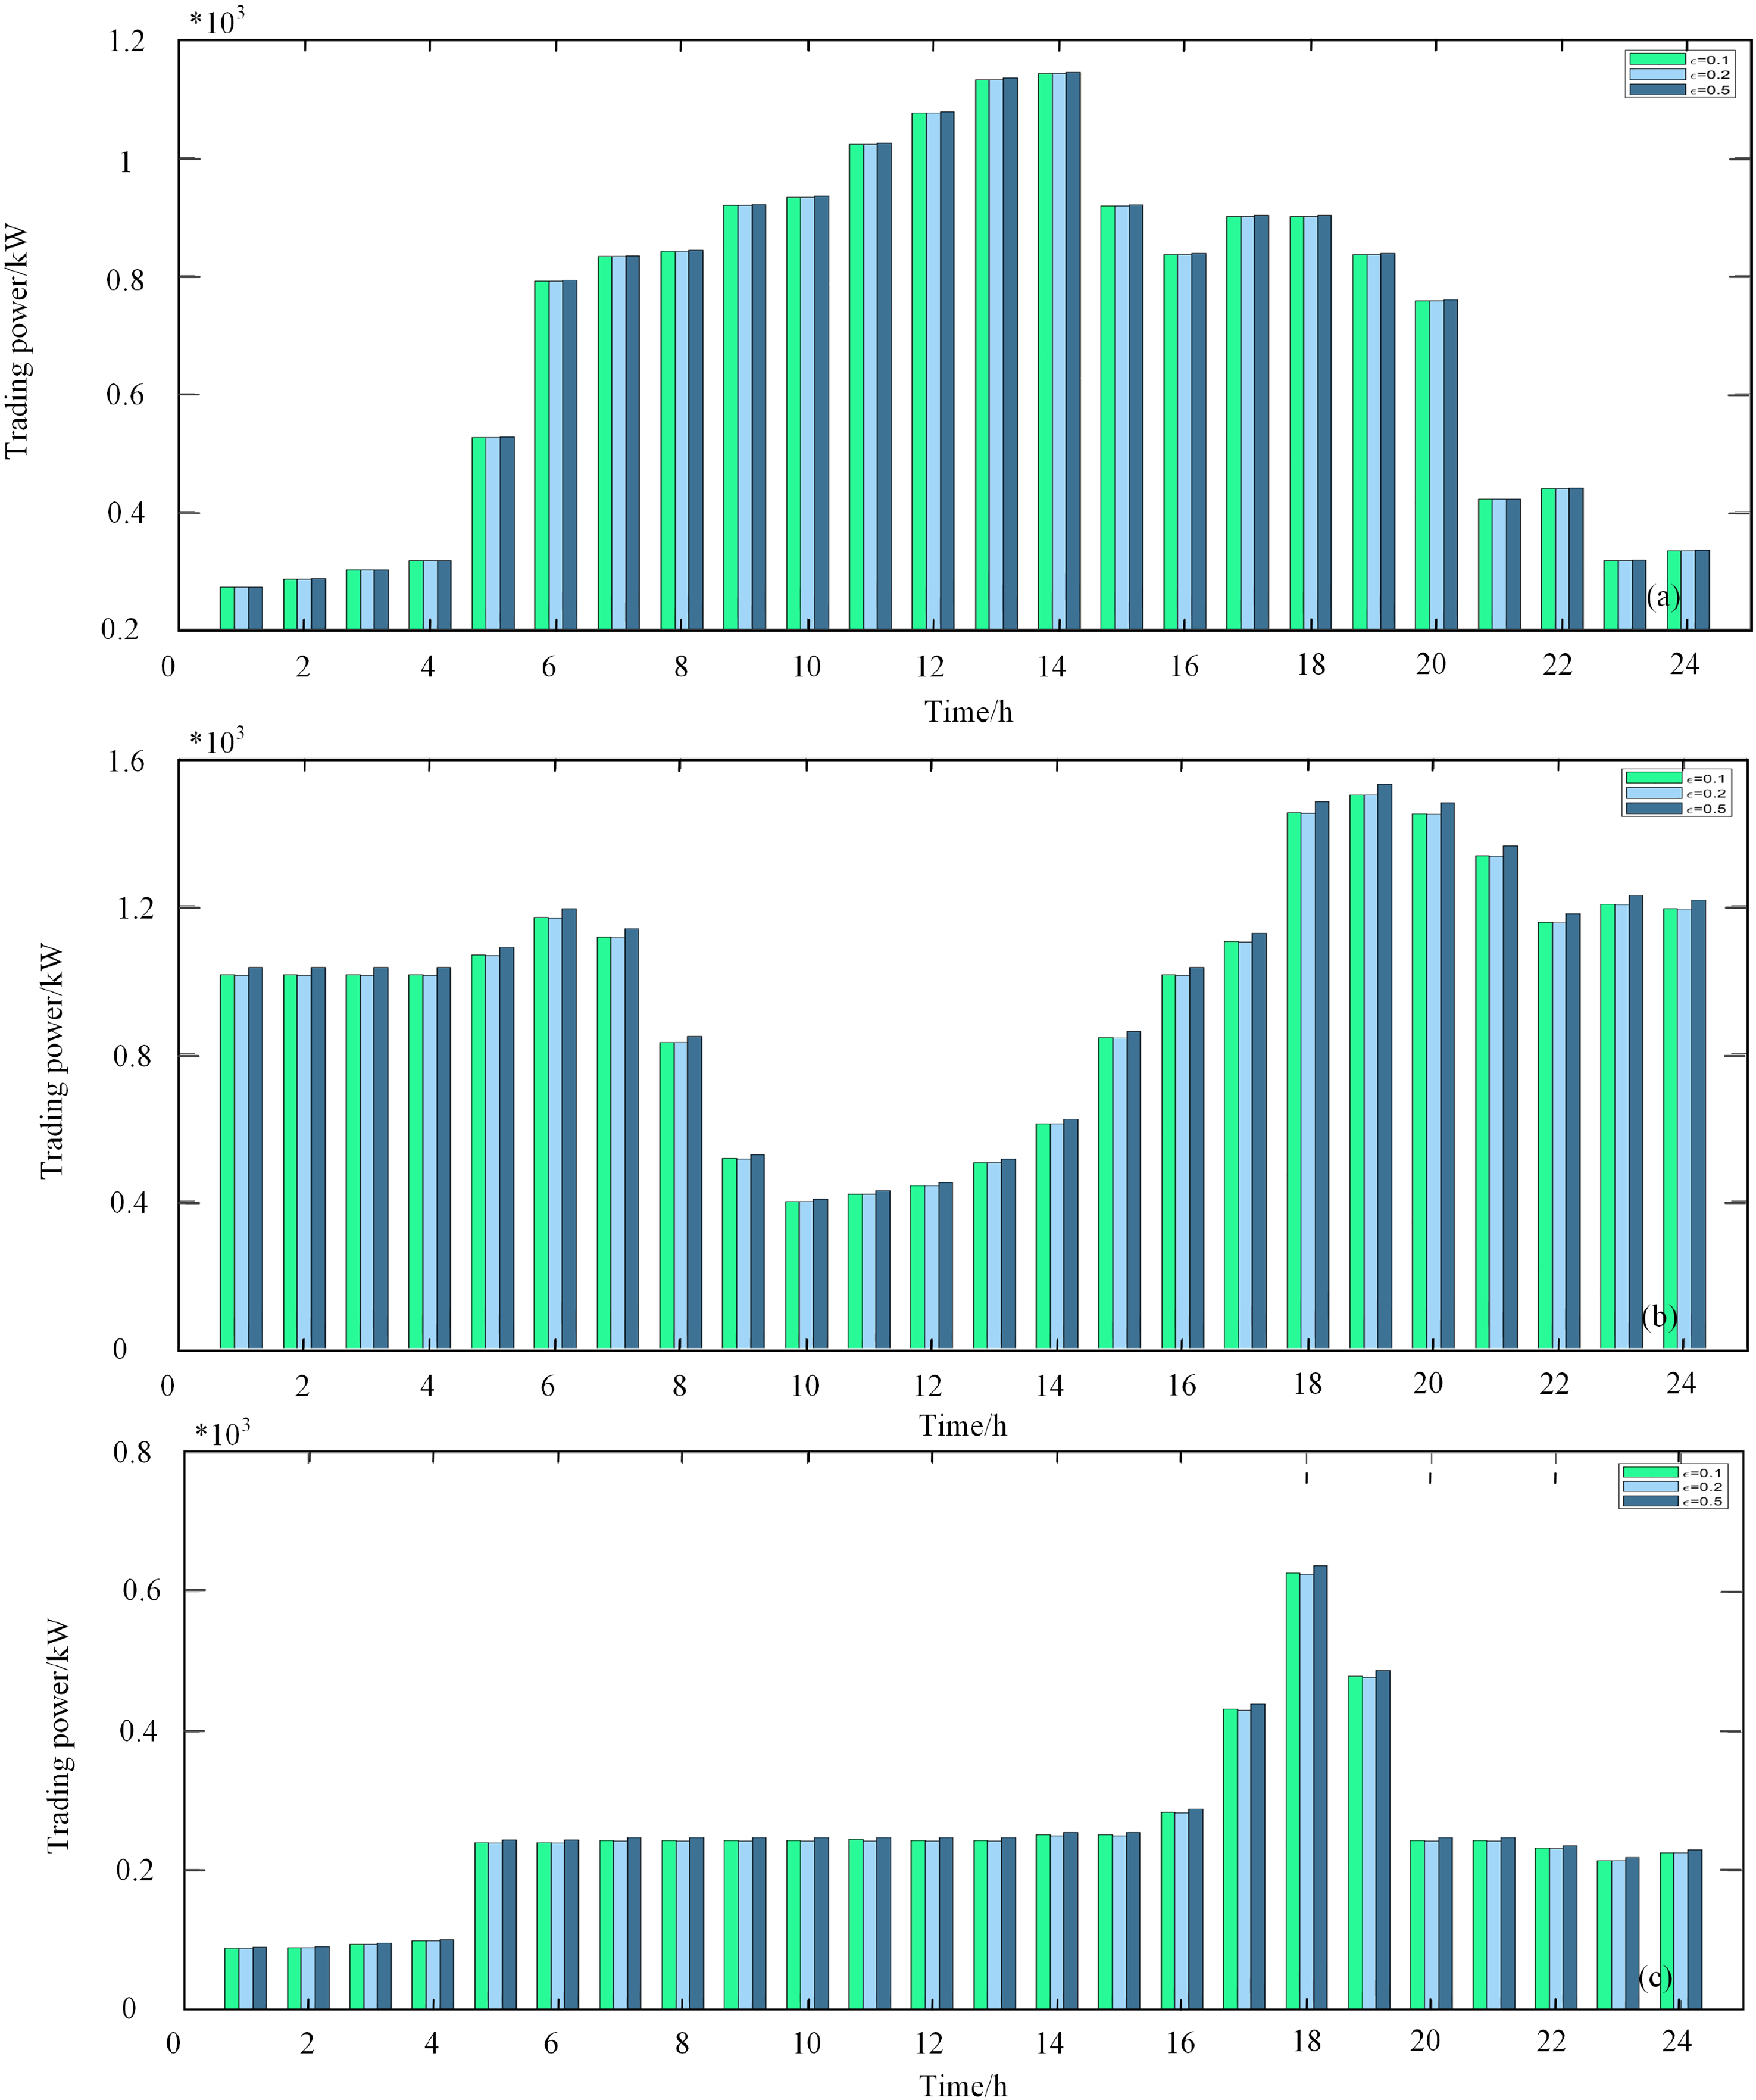
Transacted power under the three ɛ:(a) is microgrid (MG)1; (b) is MG2; (c) is MG3.
The impact of wholesale power market fluctuation on the operating cost of MGs has been analyzed, as shown in Table 4. Since operators are pessimistic about the predicted price one day into the future, handling uncertainty in a conservative manner increases operation costs in the case of RO. Consider worst-case operation costs for 24 h more than 8 h (1.5%, 1.8%, 0.6%, and 6.8%). As can be seen from the table, the more the uncertainty budget is increased, the more worst-case hours to consider the dispatch, the more operating costs are obtained.
Impact of the uncertainty on the operation costs($)
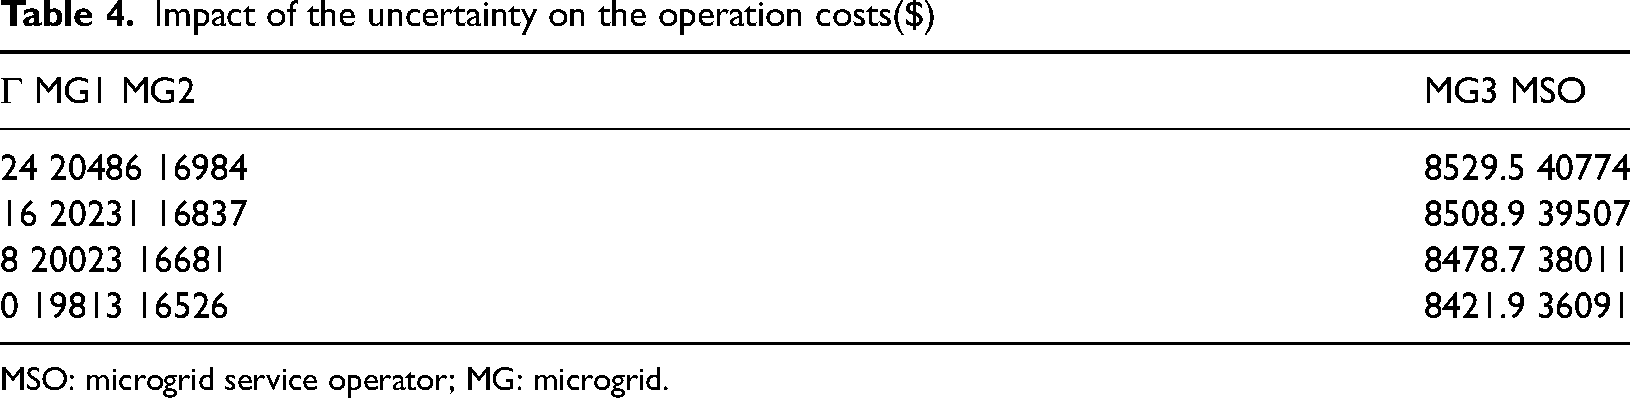
MSO: microgrid service operator; MG: microgrid.
Convergence analysis of KF distributed algorithm
In the last part of the results, the performance of the KFDA technique is analyzed. Figure 10 presents the total running cost of each iteration of MMG at Γ = 24, while comparing with the ADMM algorithm. As described below, KF distributed technology converges after 6 iterations, while ADMM requires 7, demonstrating its ability in terms of computational speed and scalability. In addition, using the centralized problem for the MMG model, its total operation cost is 88943$, which is 2.5% more than the KF distributed algorithm, which confirms the accuracy of the KF distributed algorithm.
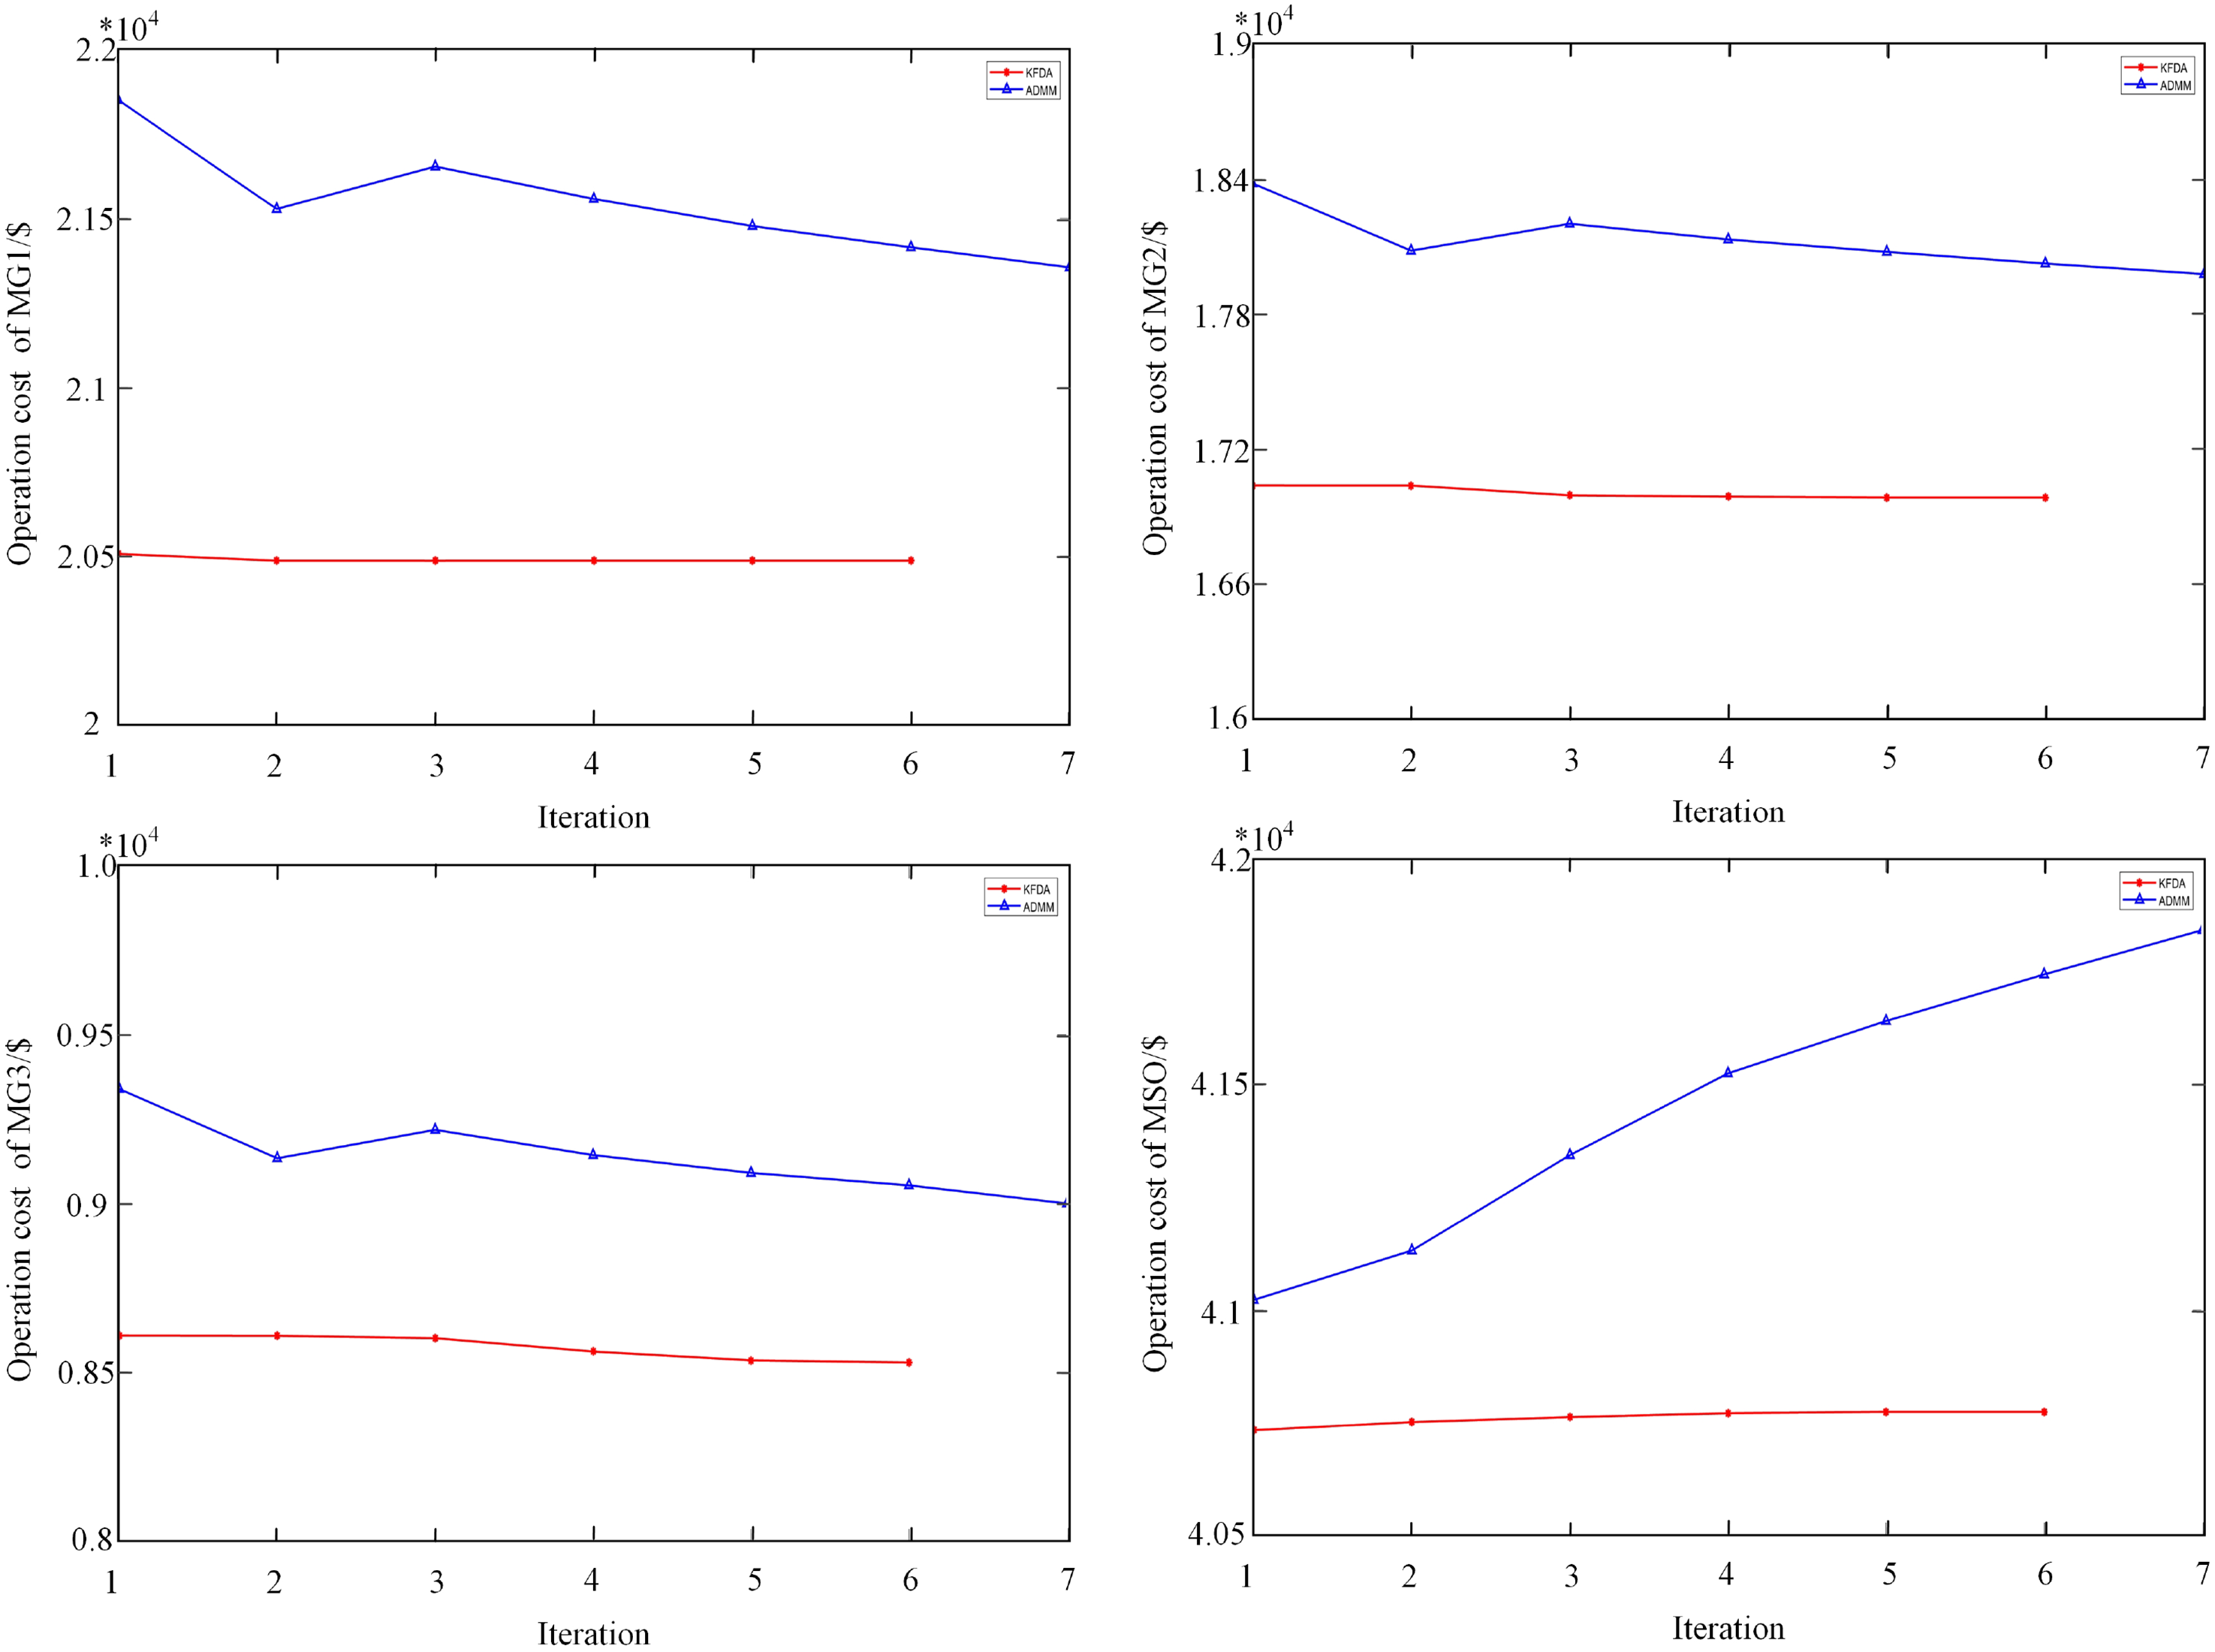
The convergence of operation cost of each subject.
Conclusions
This paper established a decentralized energy management platform based on robustness, and makes a comparative study of its performance. At the same time, it also studies the optimization of thermoelectricity-based MG dispatching when the P2G-CCS system exists. The operator of MGs can effectively control the dispatching result of the next day by using the RO method to deal with the price fluctuation problem. In addition, MG operators can reasonably distribute carbon emissions, which plays an important role in promoting community economic development. The comparative analysis results show that the MG saves 10.12%in cost. At the same time, P2G-CCS technology can also promote the MG, and the reduction of carbon emissions can reach 0.39%. Based on the RO method, the risk avoidance of the MG is carried out. The simulation results show that the KF distributed algorithm converges in a short time after it is introduced. It can be judged that it is of great significance to improve the accuracy of the model, and it is also an important object for the future development of the distributed system.
Footnotes
Data availability statement
The data that support the findings of this study are available from the corresponding author upon reasonable request.
Declaration of conflicting interests
The author(s) declared no potential conflicts of interest with respect to the research, authorship, and/or publication of this article.
Funding
The author(s) disclosed receipt of the following financial support for the research, authorship, and/or publication of this article: This work was supported by the Changzhou Science and Technology Project: Study of the control mechanism and application of constant radiation temperature prediction model under radiation cooling, the National Natural Science Foundation of China (NSFC) (grant number CJ20220178, 61873336).