
Abstract
To improve the coal recovery rate, paste backfill mining was used for 3# coal seam under the industrial square in Panji No.4 Coal Mine. Theoretical analysis, numerical simulation, and similar simulation were applied to study the underground pressure behavior and the overlying strata movement. Results demonstrate the following. (a) Caving mining exerts IV-level mining-induced damages to ground buildings, while slicing backfill mining only causes I-level mining-induced damages to ground buildings. (b) The maximum surface subsidence coefficient of backfill mining is 0.02, and the maximum surface subsidence value is only 4.12% of that under caving mining. (c) The front abutment pressure peak of the working face in caving mining is 28.31 MPa and only 17.82 MPa in backfill mining, which is only 62.95% of caving mining. The distance from the stress peak to the coal wall decreases from 11.14 to 3.04 m. Therefore, the paste backfilling mining of 3# coal seam below the industrial square of Panji No. 4 Coal Mine can effectively control the overlying strata movement and decrease the surface subsidence significantly. Compared with caving mining, backfill mining significantly relieves the strata pressure behaviors and narrows the distance of mining influence.
Keywords
Introduction
Backfill mining is a green mining mode that displaces coal resources with filling materials. Moreover, it can control surface subsidence and protect building on the ground. Backfill mining has become a major way of mining under buildings, water bodies, and railways (Liu et al., 2020). Many Chinese scholars have carried out a lot of studies on the feasibility of backfill mining, mechanical strength of the filling body, design of backfill mining system, overlying strata movement, and surface subsidence of backfill mining. Lyu (2013) proposed backfill mining in downward strips of rivers and designed the strip filling parameters through numerical simulation. Guo et al. (2010) believed that there were abundant gangues on different mine surfaces in the Datong Coal Mine and the roof of the coal seam was hard, which were beneficial conditions of backfill mining. Yu et al. (2021) replaced coal ashes with red soils and mixed it with gangues and cementing materials to prepare red soil paste filling materials. Zhao et al. (2020) discussed replacing effect of loess material in coal ash paste filling materials and its optimal mixing ratio. To solve the coal compression problem under buildings, water bodies, and railways, Xu et al. (2019) developed a partial backfill mining technology based on key stratum control by combining the overlying strata movement laws and control demands in the coal mines. Zhang et al. (2020) proposed intelligent sorting and field-filling technology in deep underground coal mines. Jia (2019) studied the overlying strata structure under different filling ratios through physical simulation test and concluded that filling ratio is an important factor that controls surface deformation. Huang et al. (2020) established a coal wall-support-filling object coupling roof control mechanical model and proposed a reasonable working resistance formula for support columns under high and low compaction rates. Sun and Chang (2017) simulated distribution laws of surrounding rock stresses, plastic zones, and displacements under different paste filling ratios, filling strengths, and advancing widths of working face by FLAC3D numerical simulation. Li et al. (2020) established and analyzed the mechanical model of temporal and spatial evolutions of pressure behaviors in compacted strata and discussed temporal and spatial evolutionary laws of strata pressure behaviors in mining areas under backfill mining conditions. Jiang et al. (2019) constructed a “filling body-coal pillar-roof” mechanical model under island backfill mining conditions and gained the estimation method of front abutment pressure on the filling working face. Zhao et al. (2020) discussed surface deformation after mining by using UDEC and a mining subsidence prediction system.
Although many scholars have carried out many studies, there are few studies on slicing backfill mining of thick coal seams. In this study, the feasibility of backfill mining below the industrial square of Panji No.4 Coal Mine was evaluated by subsidence prediction, numerical simulation, and physical simulation. Research conclusions provide references to the decision on the use of backfill mining.
Project overview
The Panji No.4 Coal Mine is located about 30 km away from northwest of Huainan City, Anhui Province. Its length from east to west is about 7.5 km and the inclined width from north to south is about 1.3–2.7 km, covering an area of 15 km2. According to the calculation of measured parameters on surface movement of Huainan Coal Mine in Regulations on Coal Pillar Setting and Coal Pillar Mining under Buildings, Water Bodies, Railways, and Major Roadways, there's a total of 75.8704 million tons of coal pillars under industrial square of the mine. According to the mining alterative plan and the idea of increasing resource recycling rate by liberating sluggish coal resources, Panji No.4 Coal Mine plans to recover the Coal 3# below the industrial square through backfill mining. Three working faces 11123, 11223, and 11323 of Coal Group A in the protection coal pillars of industrial square of Panji No.4 Coal Mine use backfill mining during recovery (Figure 1). The average thickness of Coal 3# is about 6 m and the dip of coal seam is 21–28°, with an average of 25°. The immediate roof if 2.03 m sandy mudstone and the main roof is 10.58 m siltstone.
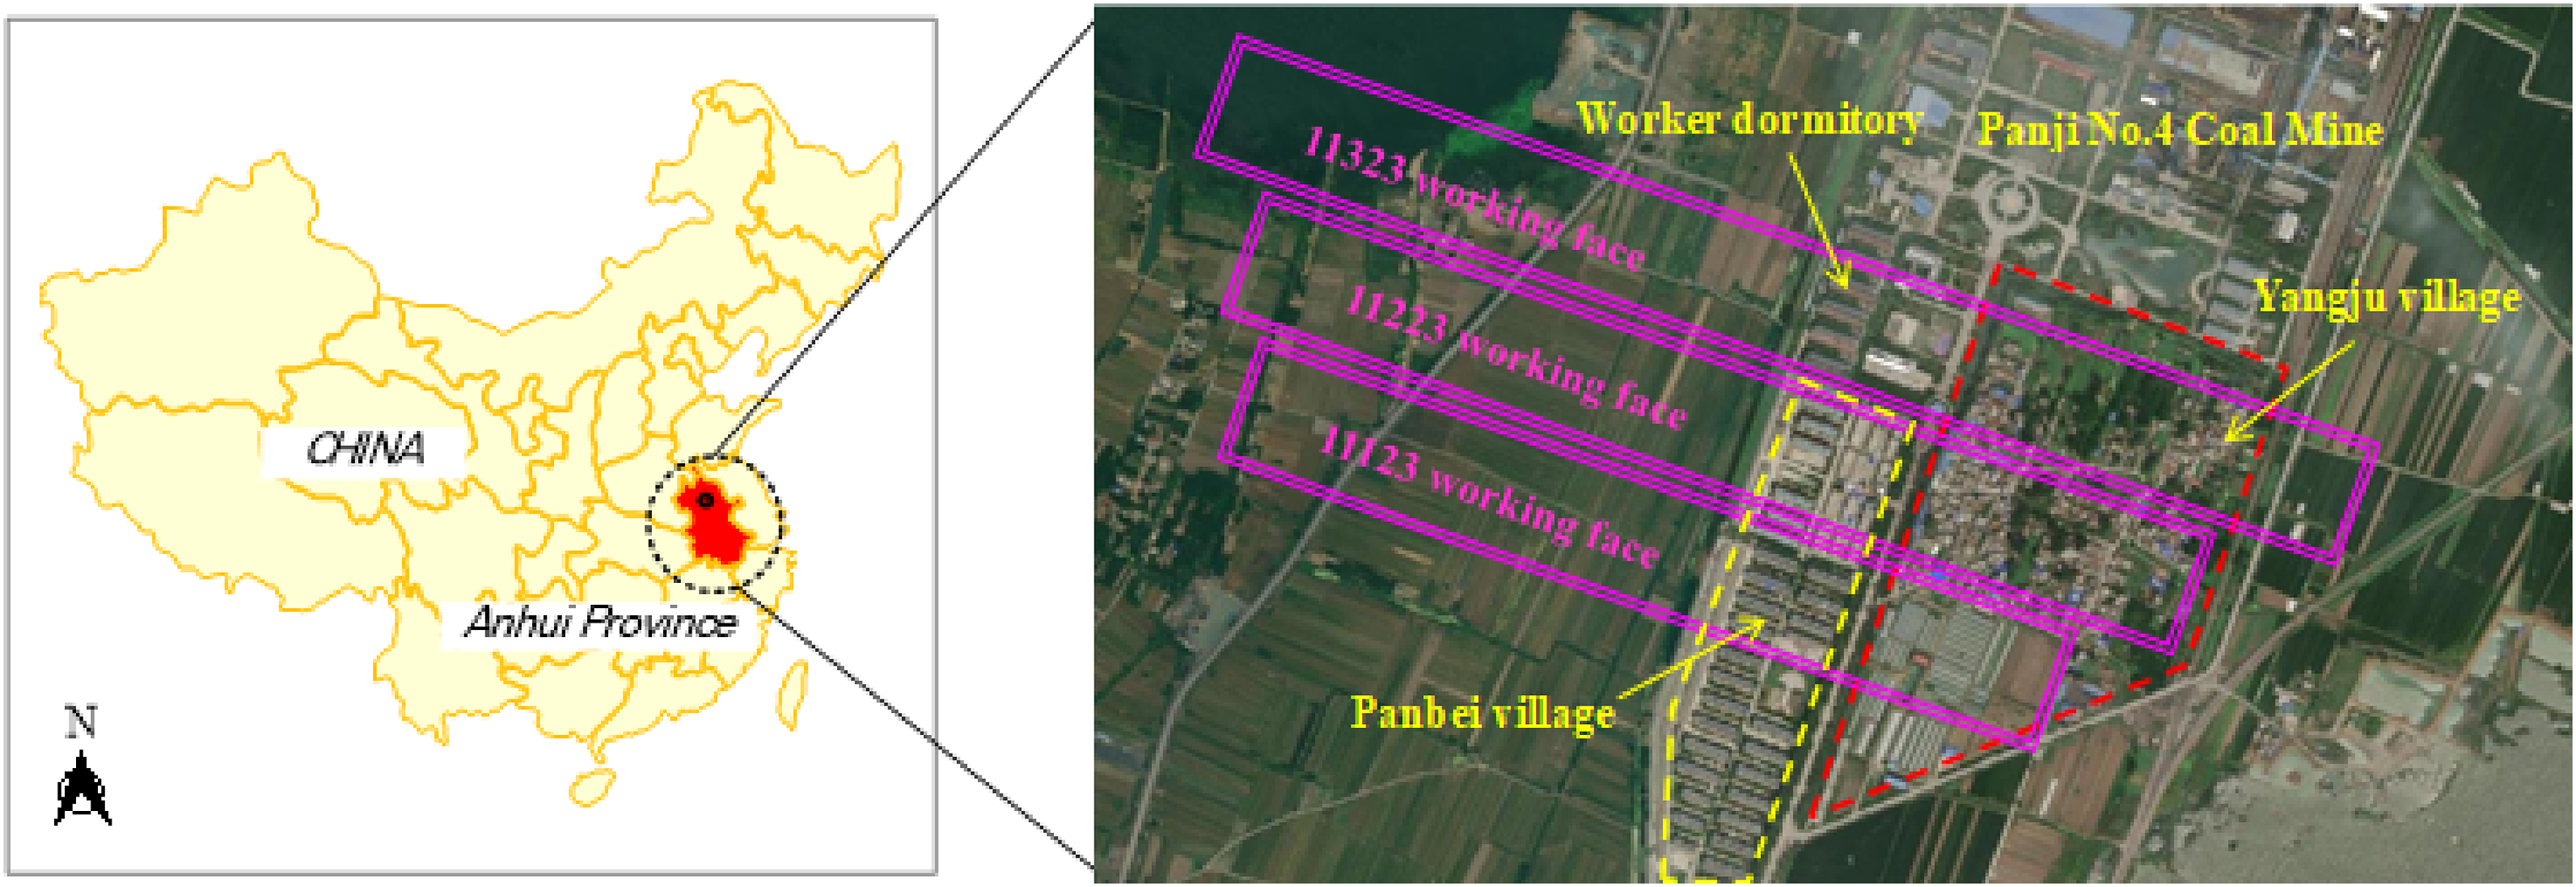
Plane of filling working face distributions.
Surface subsidence prediction, numerical simulation, and physical simulation
Prediction method and design of backfill mining-induced surface subsidence
Prediction of surface subsidence is to predict surface subsidence and deformation caused by mining in advance according to geological conditions as well as prediction functions and parameters. Typical curve method, negative exponential function method, probability integral method, and numerical calculation method are optional for the prediction of surface subsidence (Yu et al., 2015). According to the basic principle of backfill mining-induced subsidence control and simulation results, pastes in the backfill mining zone occupy the subsidence space of overlying strata, which is equal to decrease the mining height significantly. Surface subsidence caused by backfill mining is equal to surface subsidence caused by equivalent mining height after the filling materials are compacted fully. Therefore, surface subsidence caused by backfill mining can be predicted by the conventional caving method based on equivalent mining height. Empirical analysis of the conventional caving method based on equivalent mining height has been carried out in Huaibei, Yanzhou, and other mining areas. According to measurement results, it can predict surface subsidence caused by backfill mining reliably.
The equivalent mining height can be calculated according to the following formula:

After the equivalent mining height is calculated, the backfill mining-induced surface subsidence can be predicted by combining the prediction parameters of caving method of thin coal seam and equivalent mining height.
The average thickness of Coal 3# below the industrial square in Panji No.4 Coal Mine is 6 m. According to the current status of existing backfill mining technologies, the paste backfill mining height is usually not too high. Therefore, slicing mining is recommended, with a mining height of 3 m. For comparative analysis of surface subsidence characteristics of full-seam caving mining and slicing backfill mining, two schemes for surface subsidence prediction were designed.
Scheme I: The caving mining (mining height 6.0 m)
(I-1) Mining of 11123 working face.
(I-2) Mining of 11123 + 11223 working face.
(I-3) Mining of 11123 + 11223 + 11323 working face.
Scheme II: the slicing backfill mining (mining height 3.0 m)
(II-1) Backfill mining of 11123 top slicing.
(II-2) Backfill mining of 11123 + 11223 top slicing.
(II-3) Backfill mining of 11123 + 11223 + 11323 top slicing.
(II-4) Backfill mining of 11123 low slicing.
(II-5) Backfill mining of 11123 + 11223 low slicing.
(II-6) Backfill mining of 11123 + 11223 + 11323 low slicing.
During the prediction of mining-induced subsidence, with references to measured data and statistical analysis results in Huainan Coal Mine (Guo et al., 2018; Xu et al., 2015), the prediction parameters of backfill mining-induced subsidence were chosen as follows: subsidence coefficient = 0.9, horizontal displacement coefficient = 0.22, tangent of major influencing angle = 2.1, major influencing propagation angle θ=90°−0.6α and offset of inflection point S = 0.
Numerical simulation
A numerical simulation model was constructed with FLAC software by taking the engineering geological condition of 11123 working face as the background. For the comparative analysis of strata pressure behaviors and surface subsidence characteristics of the 11123 working face under caving mining and backfill mining, a model from Coal 1# to the surface was constructed. The scope of the model was 400 m × 510 m. The left and right mining boundaries were 100 m away from the model boundaries and the extraction length was 200 m to realize full mining. The model is totally divided into 300 × 290 = 87,000 cells. A Mohr-Coulomb material is applied in this model. Backfill mining mode used a compact filling of paste materials in the goaf. With references to the 920-pore column diagram on the 11123 working face, the physical and mechanical properties were determined.
Physical simulation
Two Physical simulation tests of the 11123 working face in Panji No.4 Coal Mine were designed and carried out according to some conditions. One is full caving mining and the other is paste backfill mining. In this experiment, a two-dimensional physical simulation platform with dimensions of 1.5 m × 0.1 m × 0.85 m (length × width × height) was applied. The bulk density similarity ratio, geometric similarity ratio, stress similarity ratio, and time similarity ratio were determined 1:1.6, 1:200, 1:320 and 1:10
According to the analysis of geographic strata in Panji No.4 Coal Mine, fine sand was chosen as the aggregate of the model and cementing materials used were calcium carbonate and gypsum. To meet physical and mechanical properties similar to original strata, the thickness of different strata and material mixing in the model were determined by looking up geological data and mechanical parameters of strata in the study area. Results are listed in Table 1.
Material mixing of strata in the model.
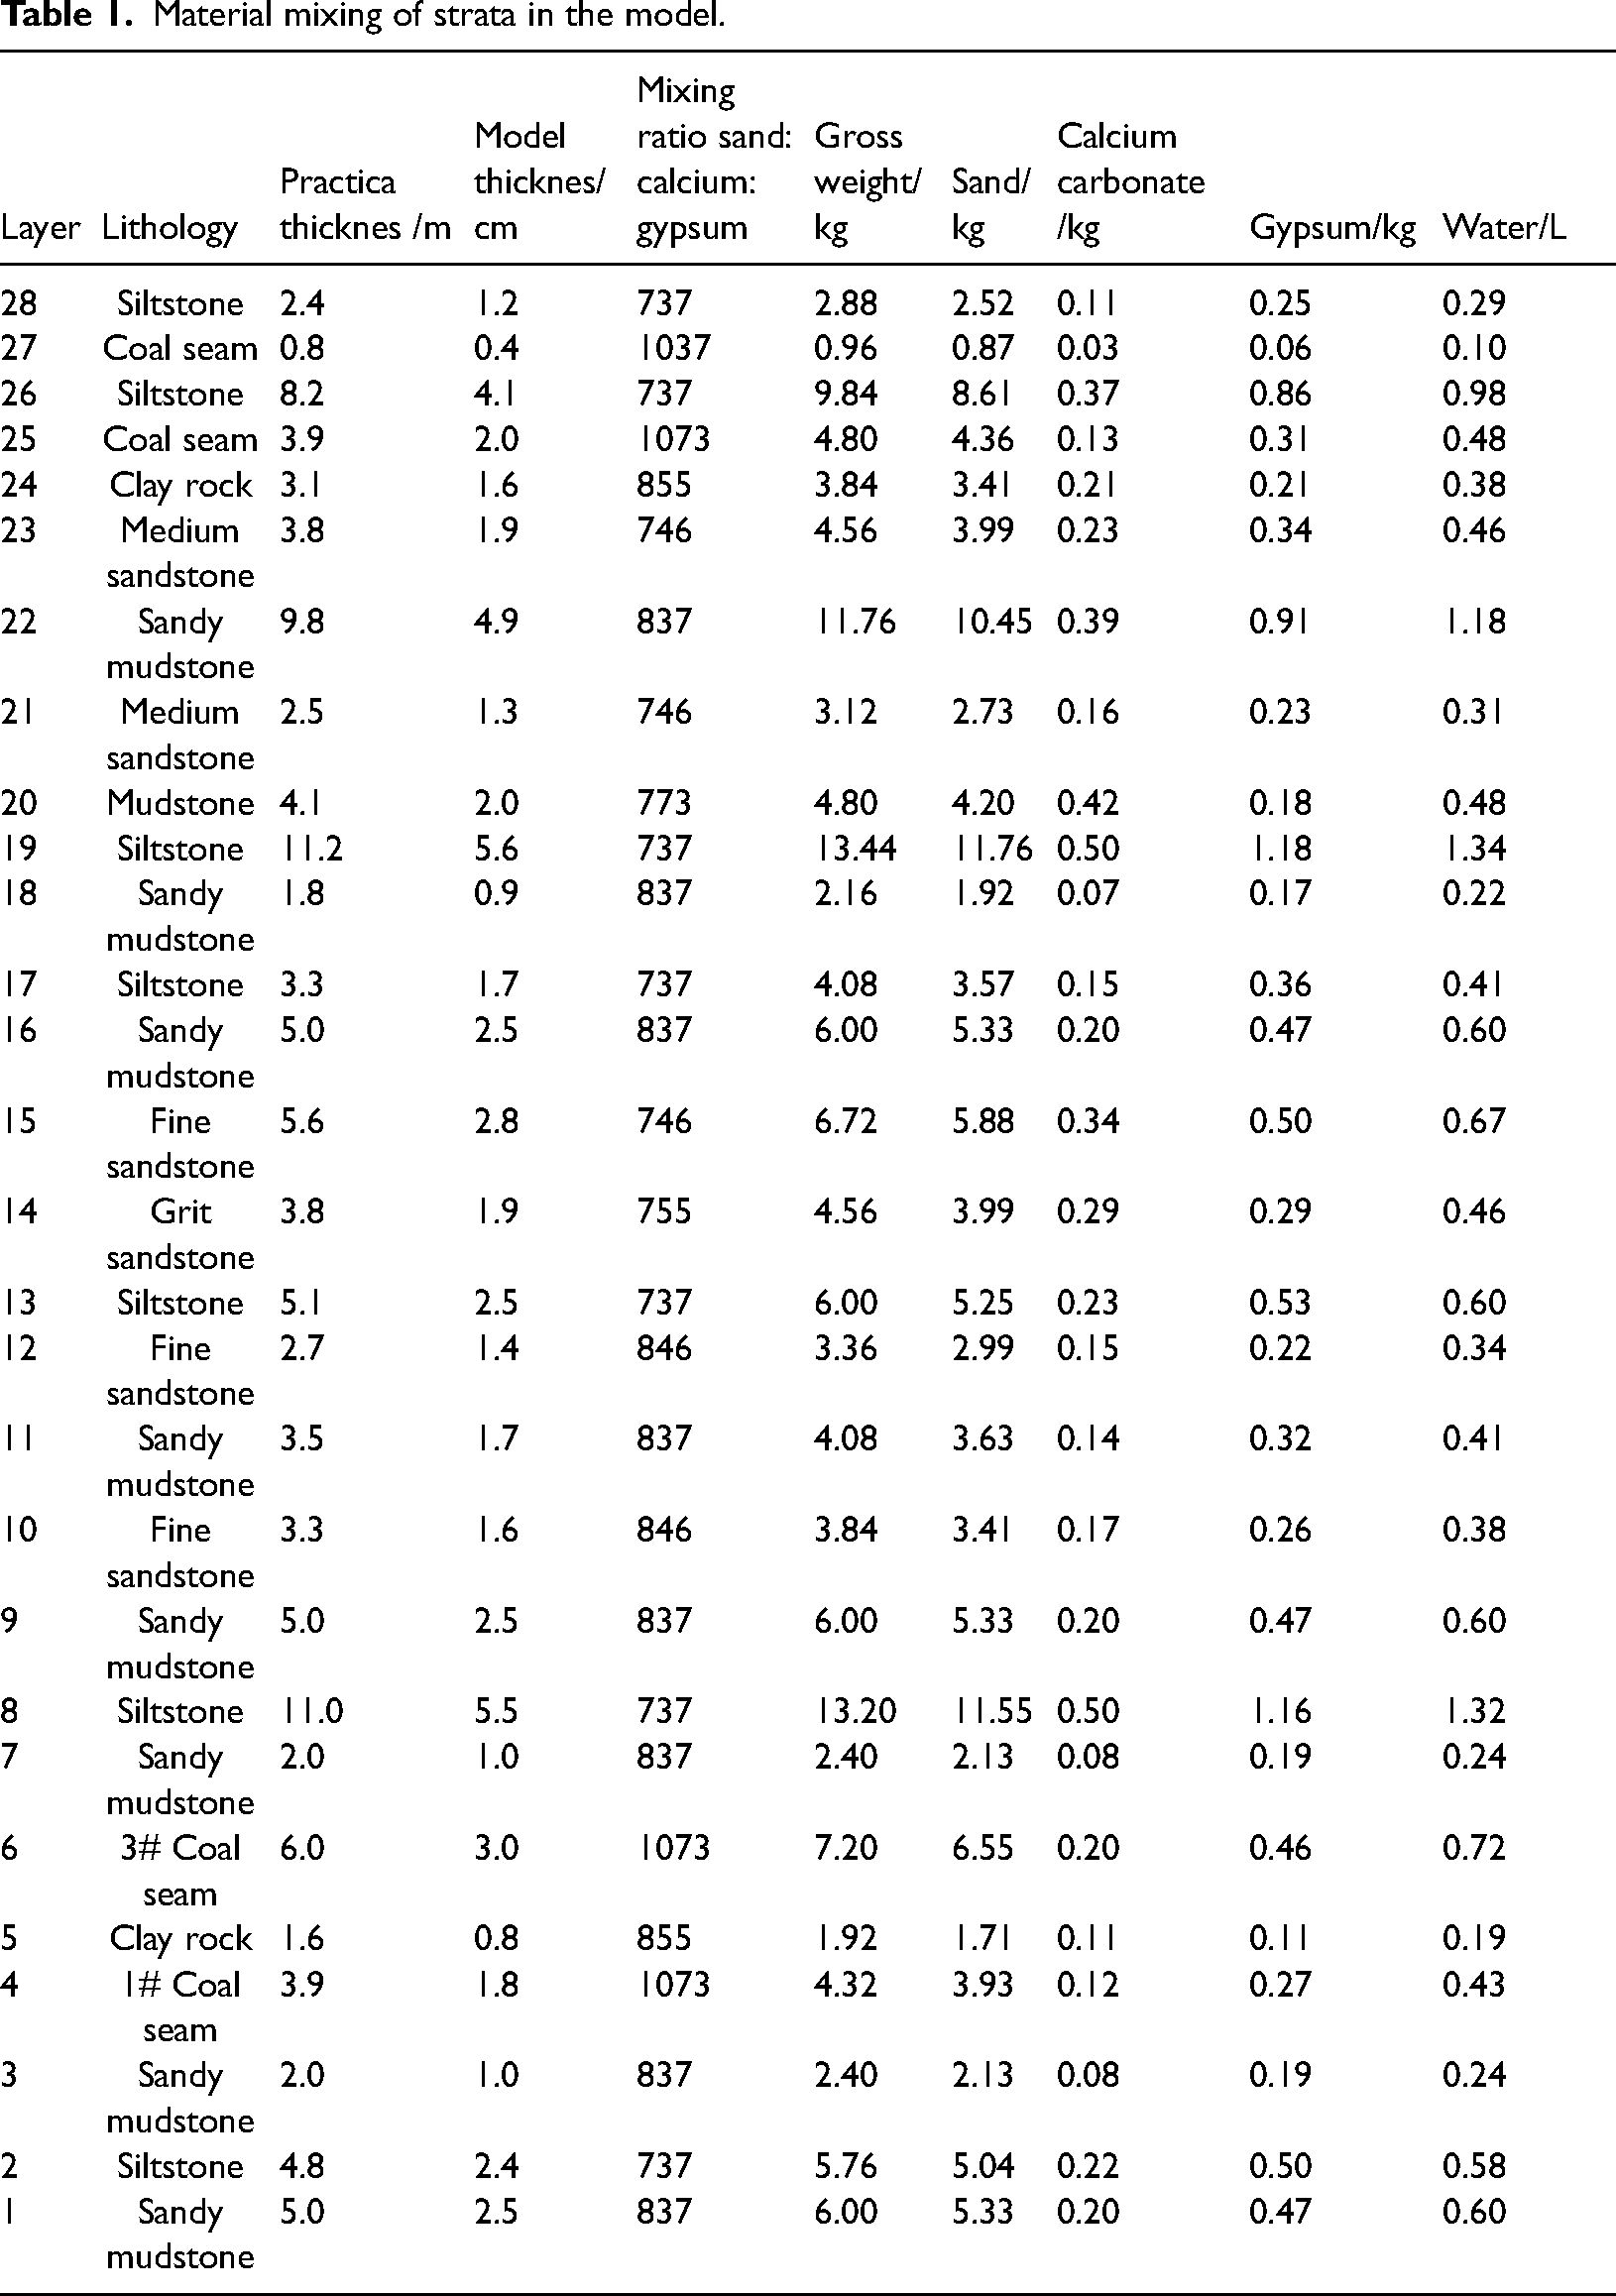
To be distinguished from other strata, black ink was mixed into the analog materials which are similar to coal seams during model pavement to darken the similar materials obviously. At the same time, the gridding cloth is paved in the middle of coal seams to simulate the metal net and produce an artificial roof. To distinguish hard strata, four layers of hard strata were set in this test through theoretical calculation of key layers. The simulation materials similar to these four strata were added with red ink. In the experiment, the total pavement height was 70 cm and the thickness above the coal seam was 51 cm. the practical buried depth of coal seams simulated in this study is 500 m. The practical thickness of rest strata which are not simulated is 400 m. According to calculation of stress similarity ratio, it has to apply a stress of 0.031 MPa on the upper position of the model to simulate weights of unpaved strata.
To investigate temporal and spatial laws of strata pressure behaviors and overlying strata movement in the process of paste backfill mining, stress, and deformation observation points were set on corresponding strata during model paving. In Coal 1# below the Coal 3#, a row of pressure boxes were set at an interval of 10 cm. Displacement monitoring used the photography method. Measuring marks were set on the model at an interval of 5 cm. According to the calculation, there are four hard strata above the coal seam (11 m siltstone, 11.2 m siltstone, 9.8 m sandy mudstone, and 8.2 m siltstone). The overlying strata movement characteristics in stopes at different layers can be gained by extracting displacements of four observation lines in these four hard strata (four observation lines are 10, 60, 70, and 90 m away from the coal seam, respectively) (Figure 2). The upper hard stratum is the major key layer and the vertical displacement of the corresponding observation line can reflect the surface subsidence value.
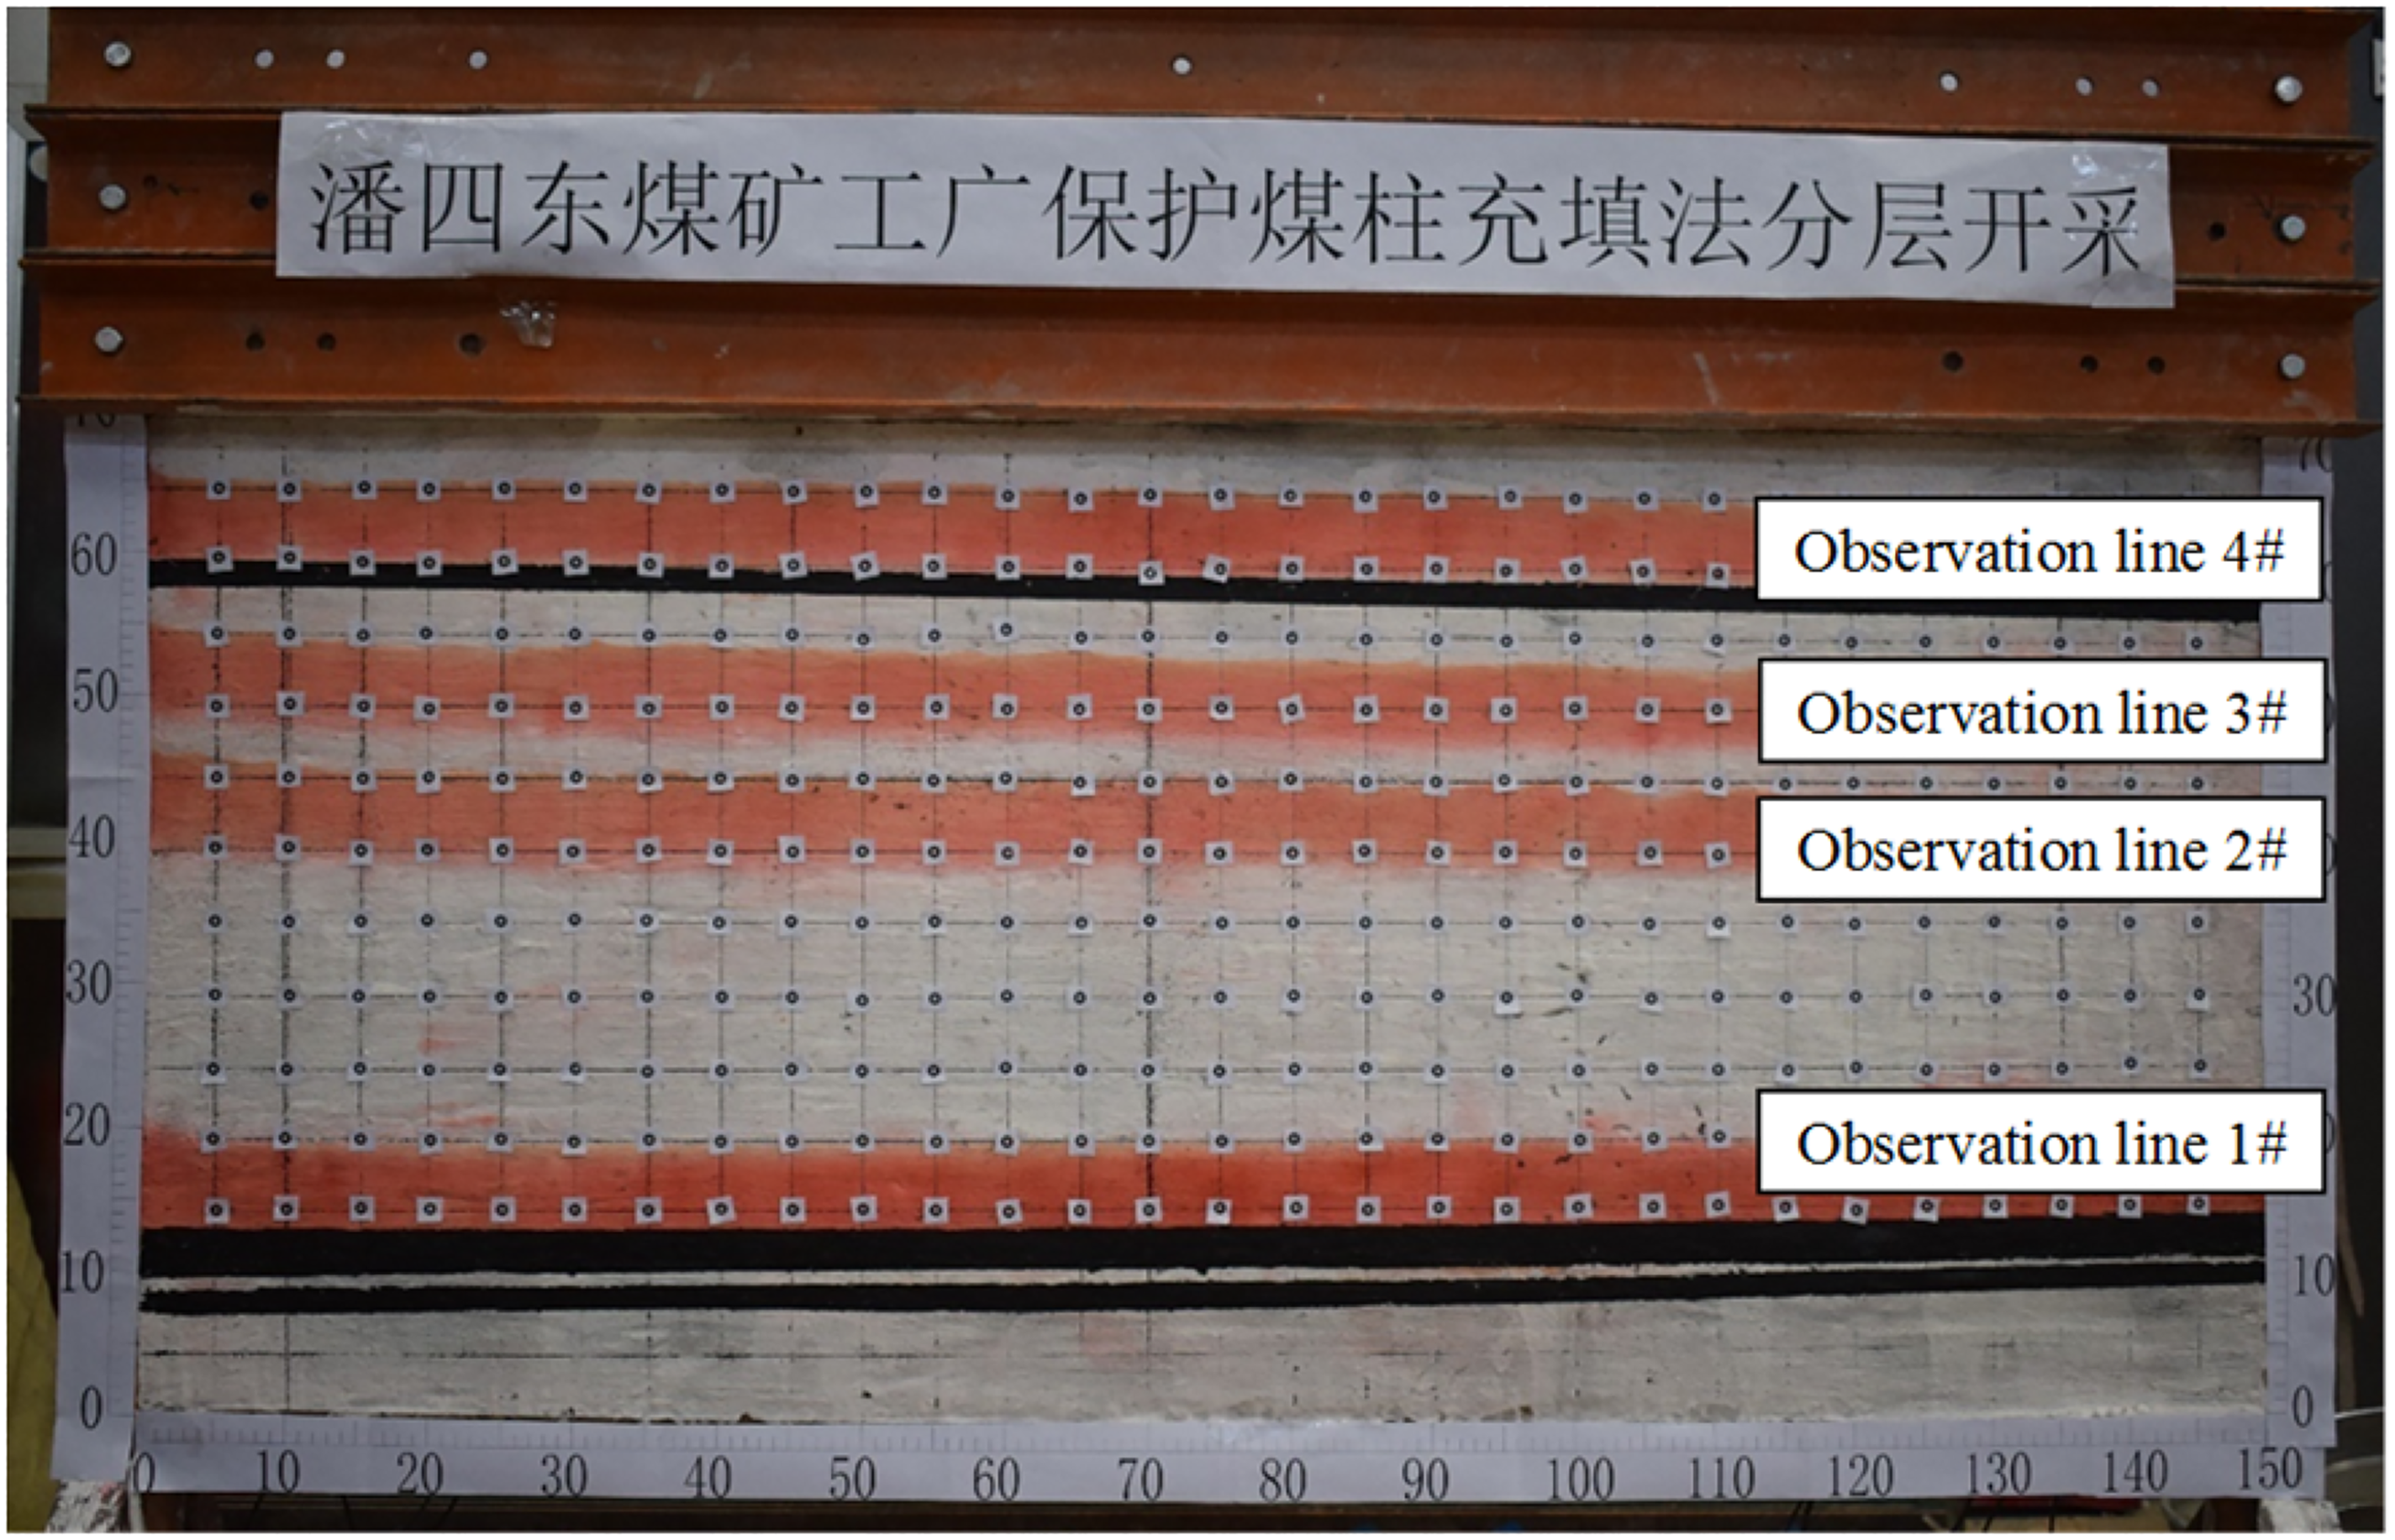
Layout of observation lines for physical simulation.
Caving mining
After observation points were set on the model, appropriate weight was applied to the top of model to simulate unpaved strata from the model to the surface. At two sides of the coal seam, 10 cm coal pillars were set. From the left coal pillar of the model, the upper layer was excavated firstly by 5 cm at each time. Before extraction, the model was put static for a period. After the stabilization of monitoring data, the next excavation began. This repeats continuously until reaching the stopping line of the upper layer. After finishing mining of the upper layer, the model was put static for 12 h to assure no subsidence of overlying strata. Next, the lower layer was extracted in the same way.
Backfill mining
The backfill mining is different from full caving mining in that it has to fill in a simulation filling body timely after each excavation of the model. In this experiment, the processed timber was used to simulate the filling body. The mining height was 1.5 cm and the timber thickness is 1.35 cm, which can simulate the filling effect when the filling coefficient is 90%.
Results and analysis
Results of surface subsidence prediction
After the above parameters are brought in, surface subsidence and displacement values under different schemes were gained. Limited by the article length, some results are shown in Figure 3.
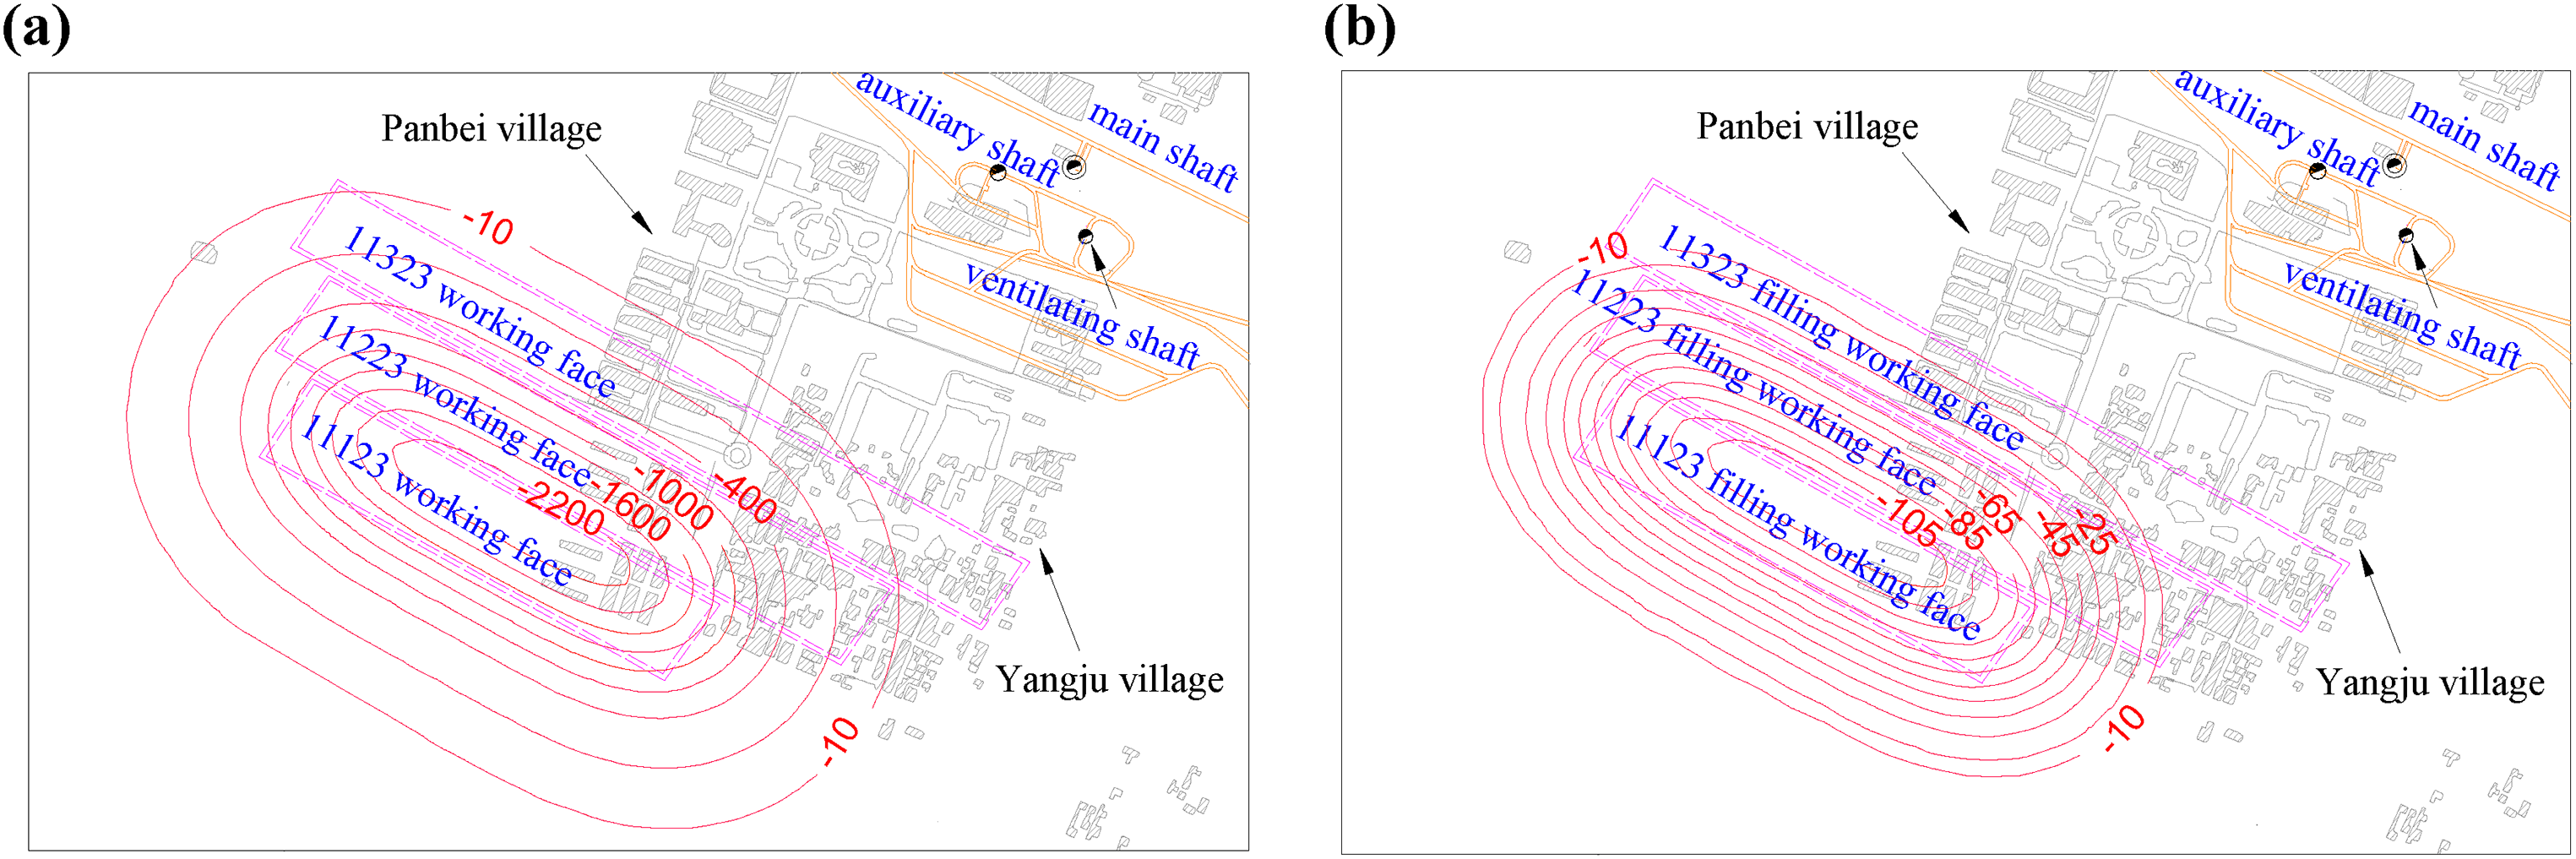
Prediction results of surface subsidence:
It can be seen from the prediction results:
After implementation of Scheme I-1 (mining of 11123 working face (mining height 6.0 m, caving method)), the maximum surface subsidence value is 2400 mm; the maximum horizontal tensile deformation, the maximum horizontal compressive deformation and maximum surface inclination are 5, −10, and 13 mm/m, respectively. It may cause IV-level mining-induced damage to ground buildings. It is estimated that no mining-induced damages are caused to the main shaft, auxiliary shaft, and air shaft. The main shaft, auxiliary shaft and air shaft can keep normal operations.
After implementation of Scheme I-2 (mining of 11123 + 11223 working face (mining height 6.0 m, caving method)), the maximum surface subsidence value is 3670 mm; the maximum horizontal tensile deformation, the maximum horizontal compressive deformation, and maximum surface inclination are 5.7 mm/m, −9.4 mm/m and 18 mm/m, respectively. It may cause IV-level mining-induced damages to ground buildings. It is estimated that no mining-induced damages are caused to the main shaft, auxiliary shaft, and air shaft. The main shaft, auxiliary shaft, and air shaft can keep normal operations.
After implementation of Scheme I-3 (mining of 11123 + 11223 + 11323 working face (mining height 6.0 m, caving method)), the maximum surface subsidence value is 4100 mm; the maximum horizontal tensile deformation, the maximum horizontal compressive deformation, and maximum surface inclination are 6 mm/m, −9 mm/m and 18 mm/m, respectively. It may cause IV-level mining-induced damage to ground buildings. It is estimated that the main shaft, auxiliary shaft, and air shaft develop mild mining-induced damages.
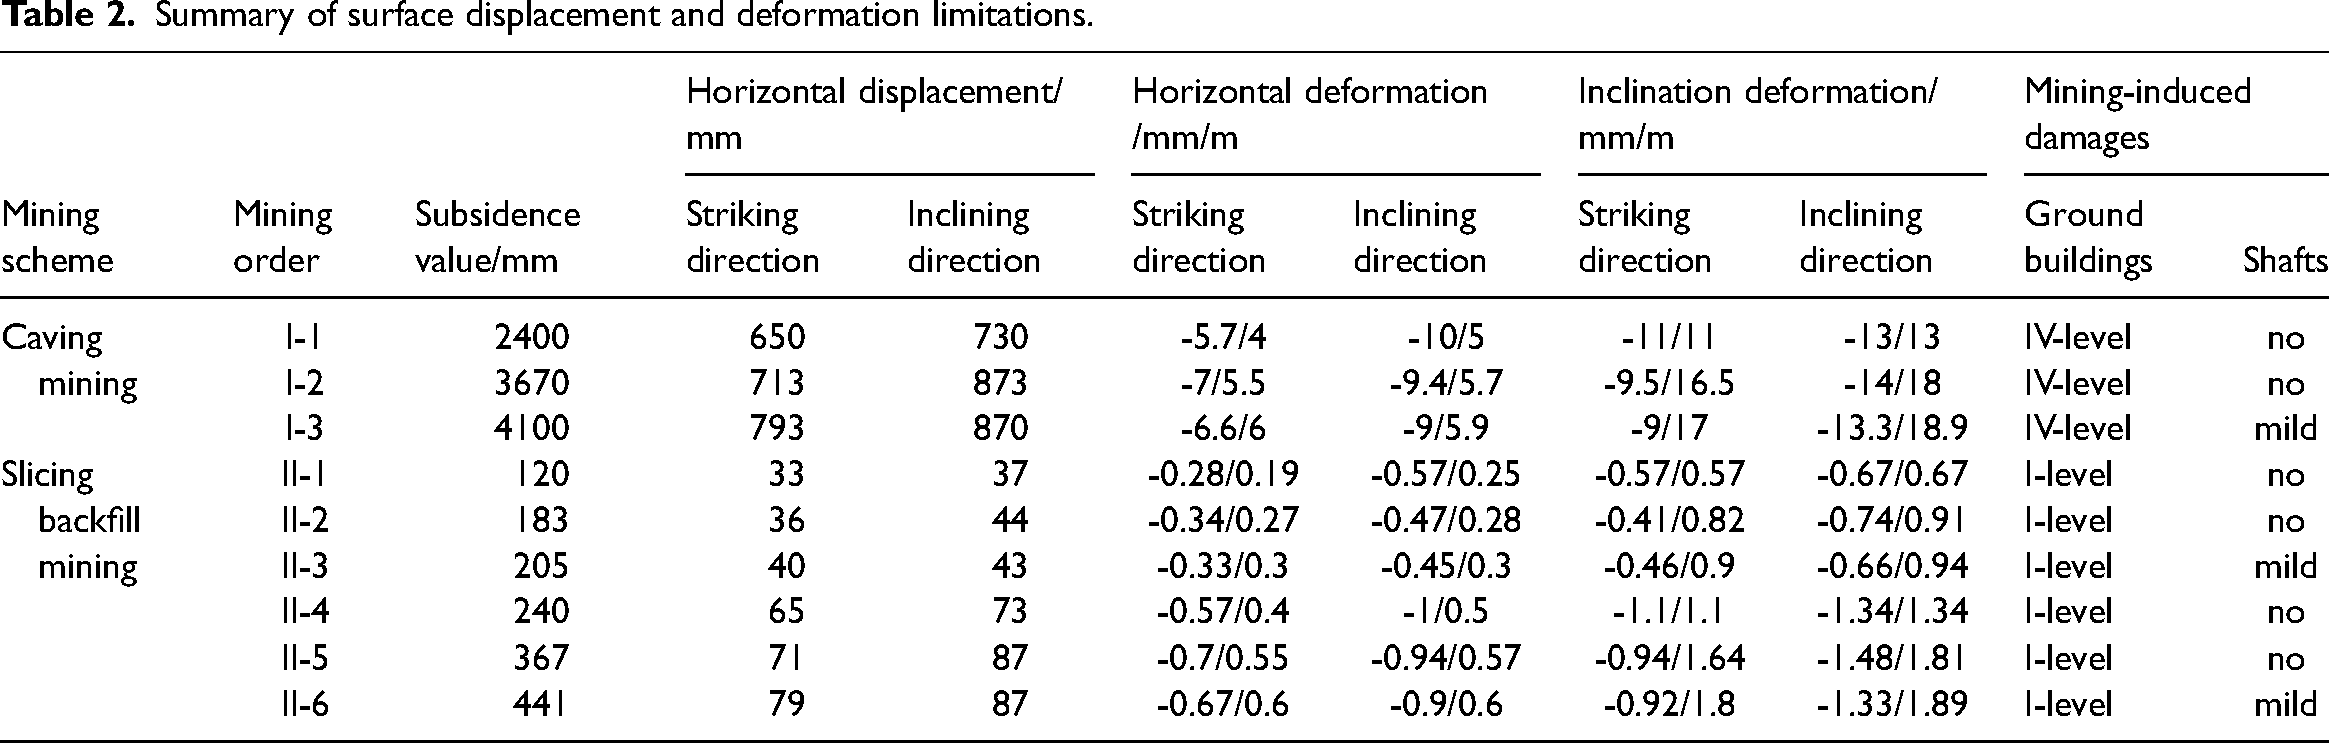
The maximum surface subsidence value, maximum horizontal tensile deformation, maximum horizontal compressive deformation, and maximum surface inclination as well as grades of mining-induced damages in ground buildings and shafts are listed in Table 2. According to prediction results, the ground buildings develop I-level mining-induced damages when paste backfilling mining is applied. During the mining of the 11323 working face, the shaft develops mild mining-induced damages.
Summary of surface displacement and deformation limitations.
Results of numerical simulation in upper slicing caving mining
Vertical stress evolutionary characteristics of working face
According to the above model, the Coal 3# was extracted first (mining height 3.0 m). To discuss evolutionary laws of strata pressure behaviors during recovery of the working face, Figure 4 shows the vertical stress distributions when the 11123 working face is advanced by 50, 100, 150, and 200 m.
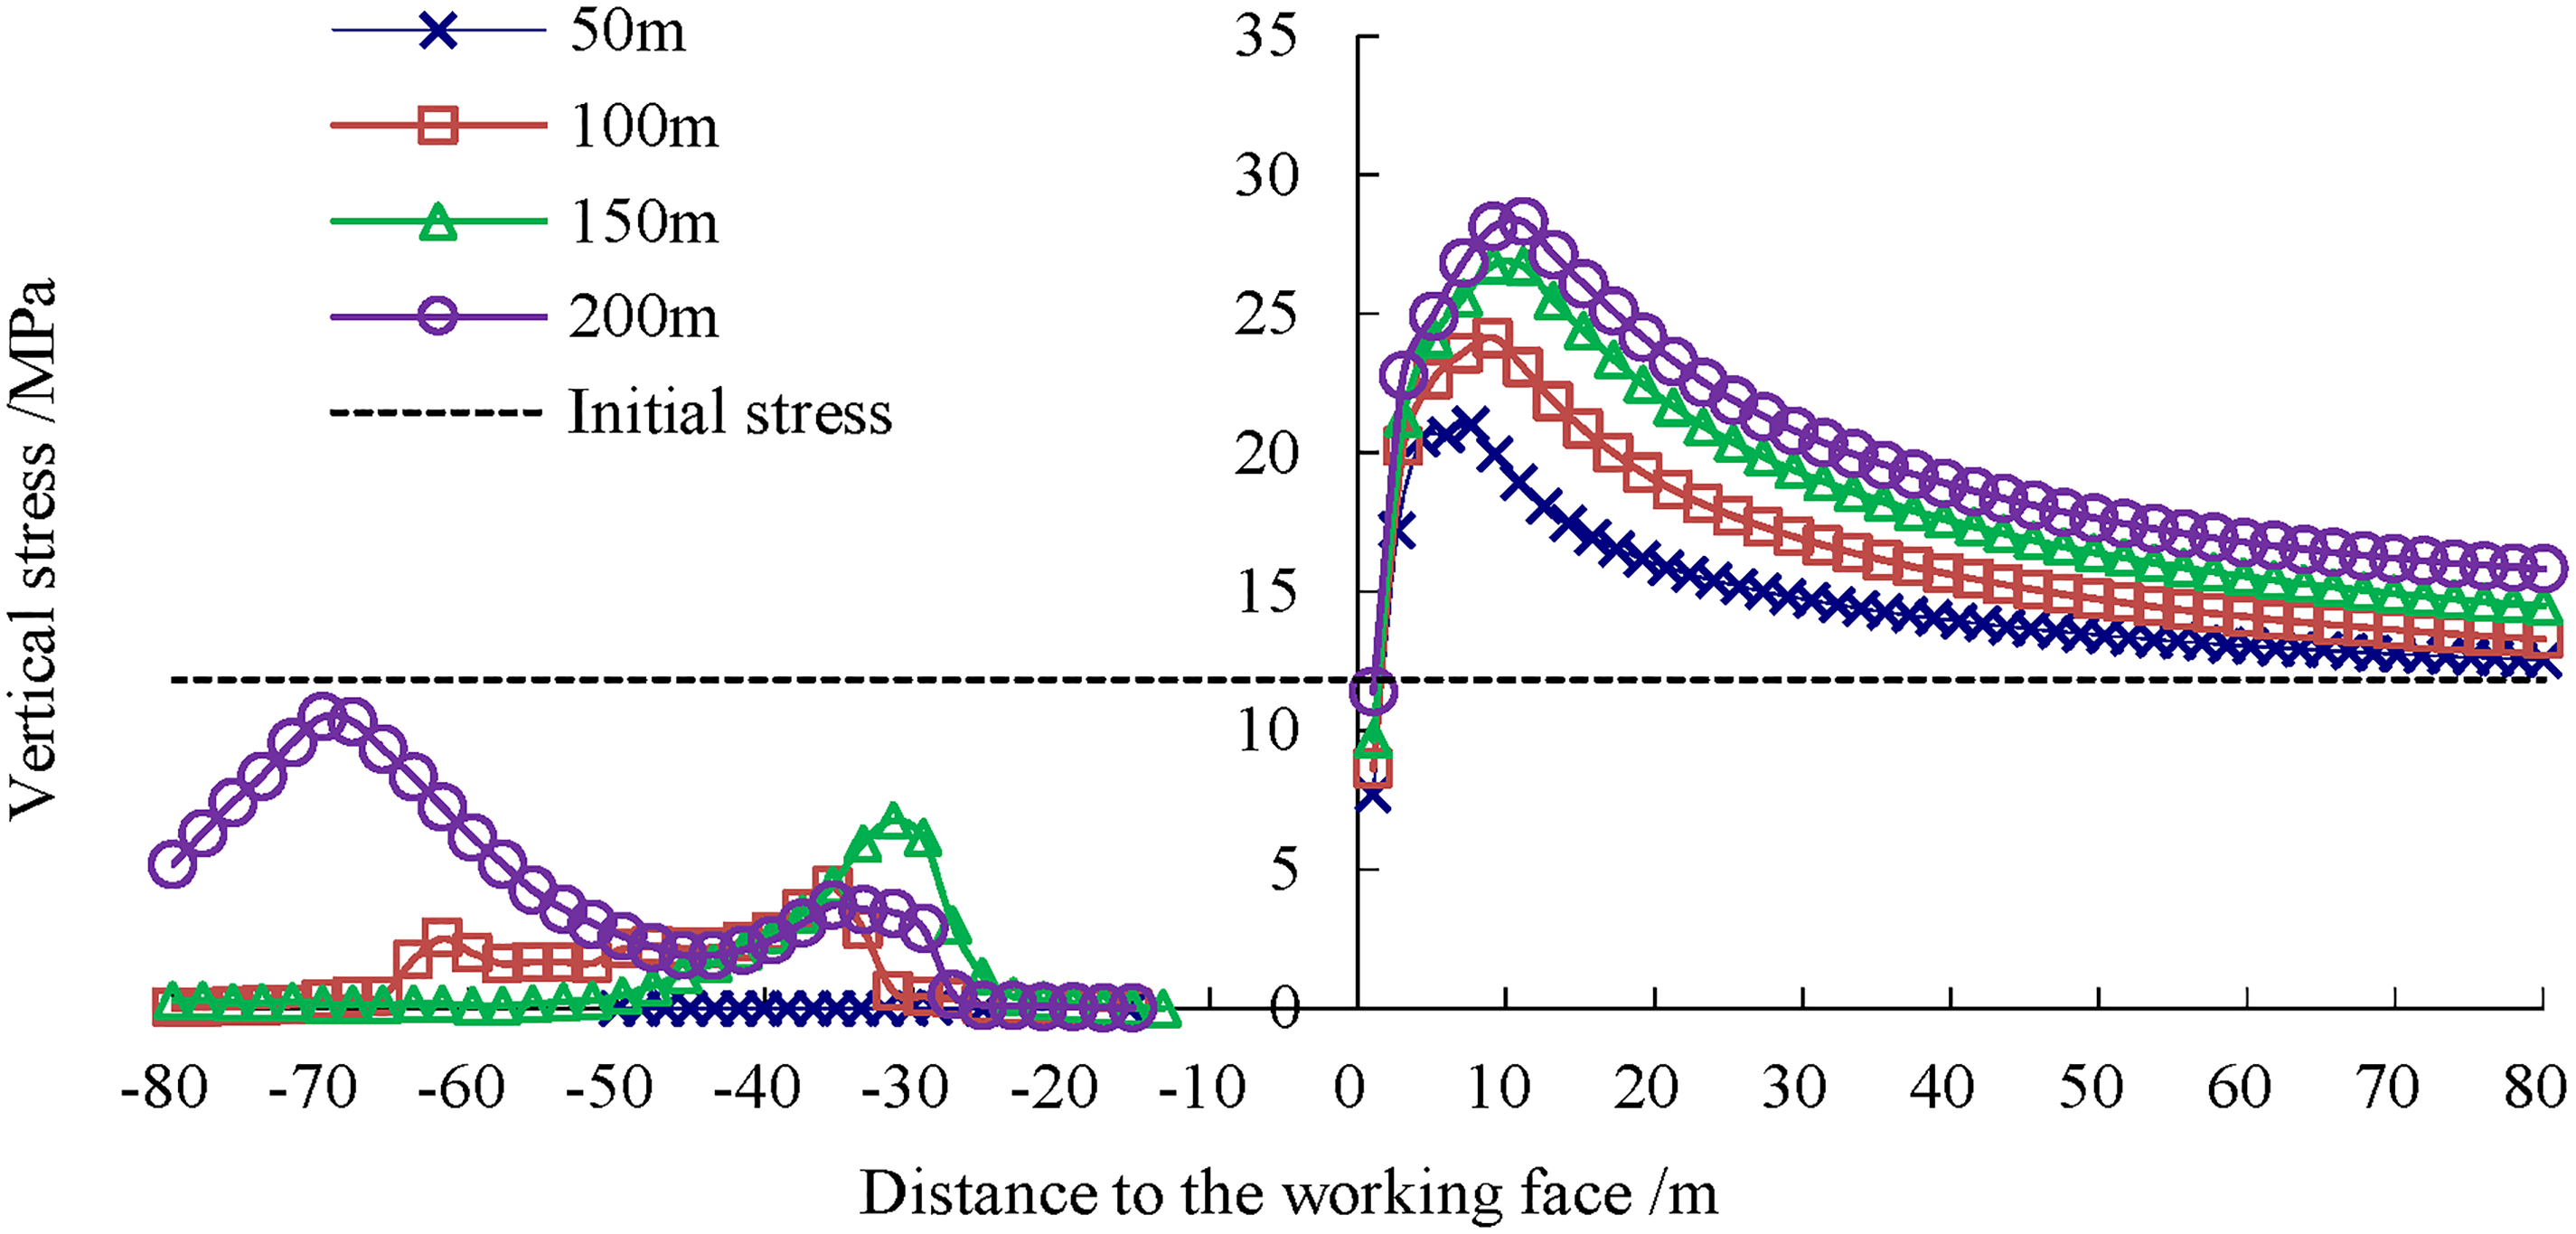
Variation curves of abutment pressure in caving mining.
The peak abutment pressure and the stress concentration factor when the working face advanced different distances are listed in Table 3.
The peak abutment pressure in caving mining (MPa).
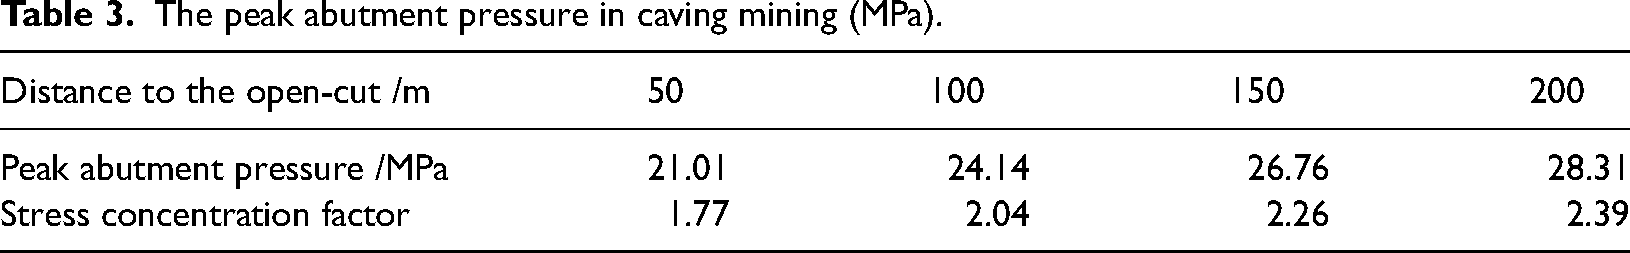
It can be seen from Figure 4 that with the advancing of working face, the peak of front abutment in caving mining increases continuously and the peak position migrates toward deep coal seams. The sphere of influence is expanding continuously. When the distance from the 11123 working face to the open-cut is longer than 200 m, the vertical stress of goaf is recovered to the stress of primary rocks since the falling gangues are compacted again. The front abutment pressure of working face tends to be stable. Stress peak reaches 28.31 MPa, stress concentration coefficient is 2.39 and the stress peak distance to coal wall is 11.14 m.
Evolutionary characteristic of plastic zones on the working zone
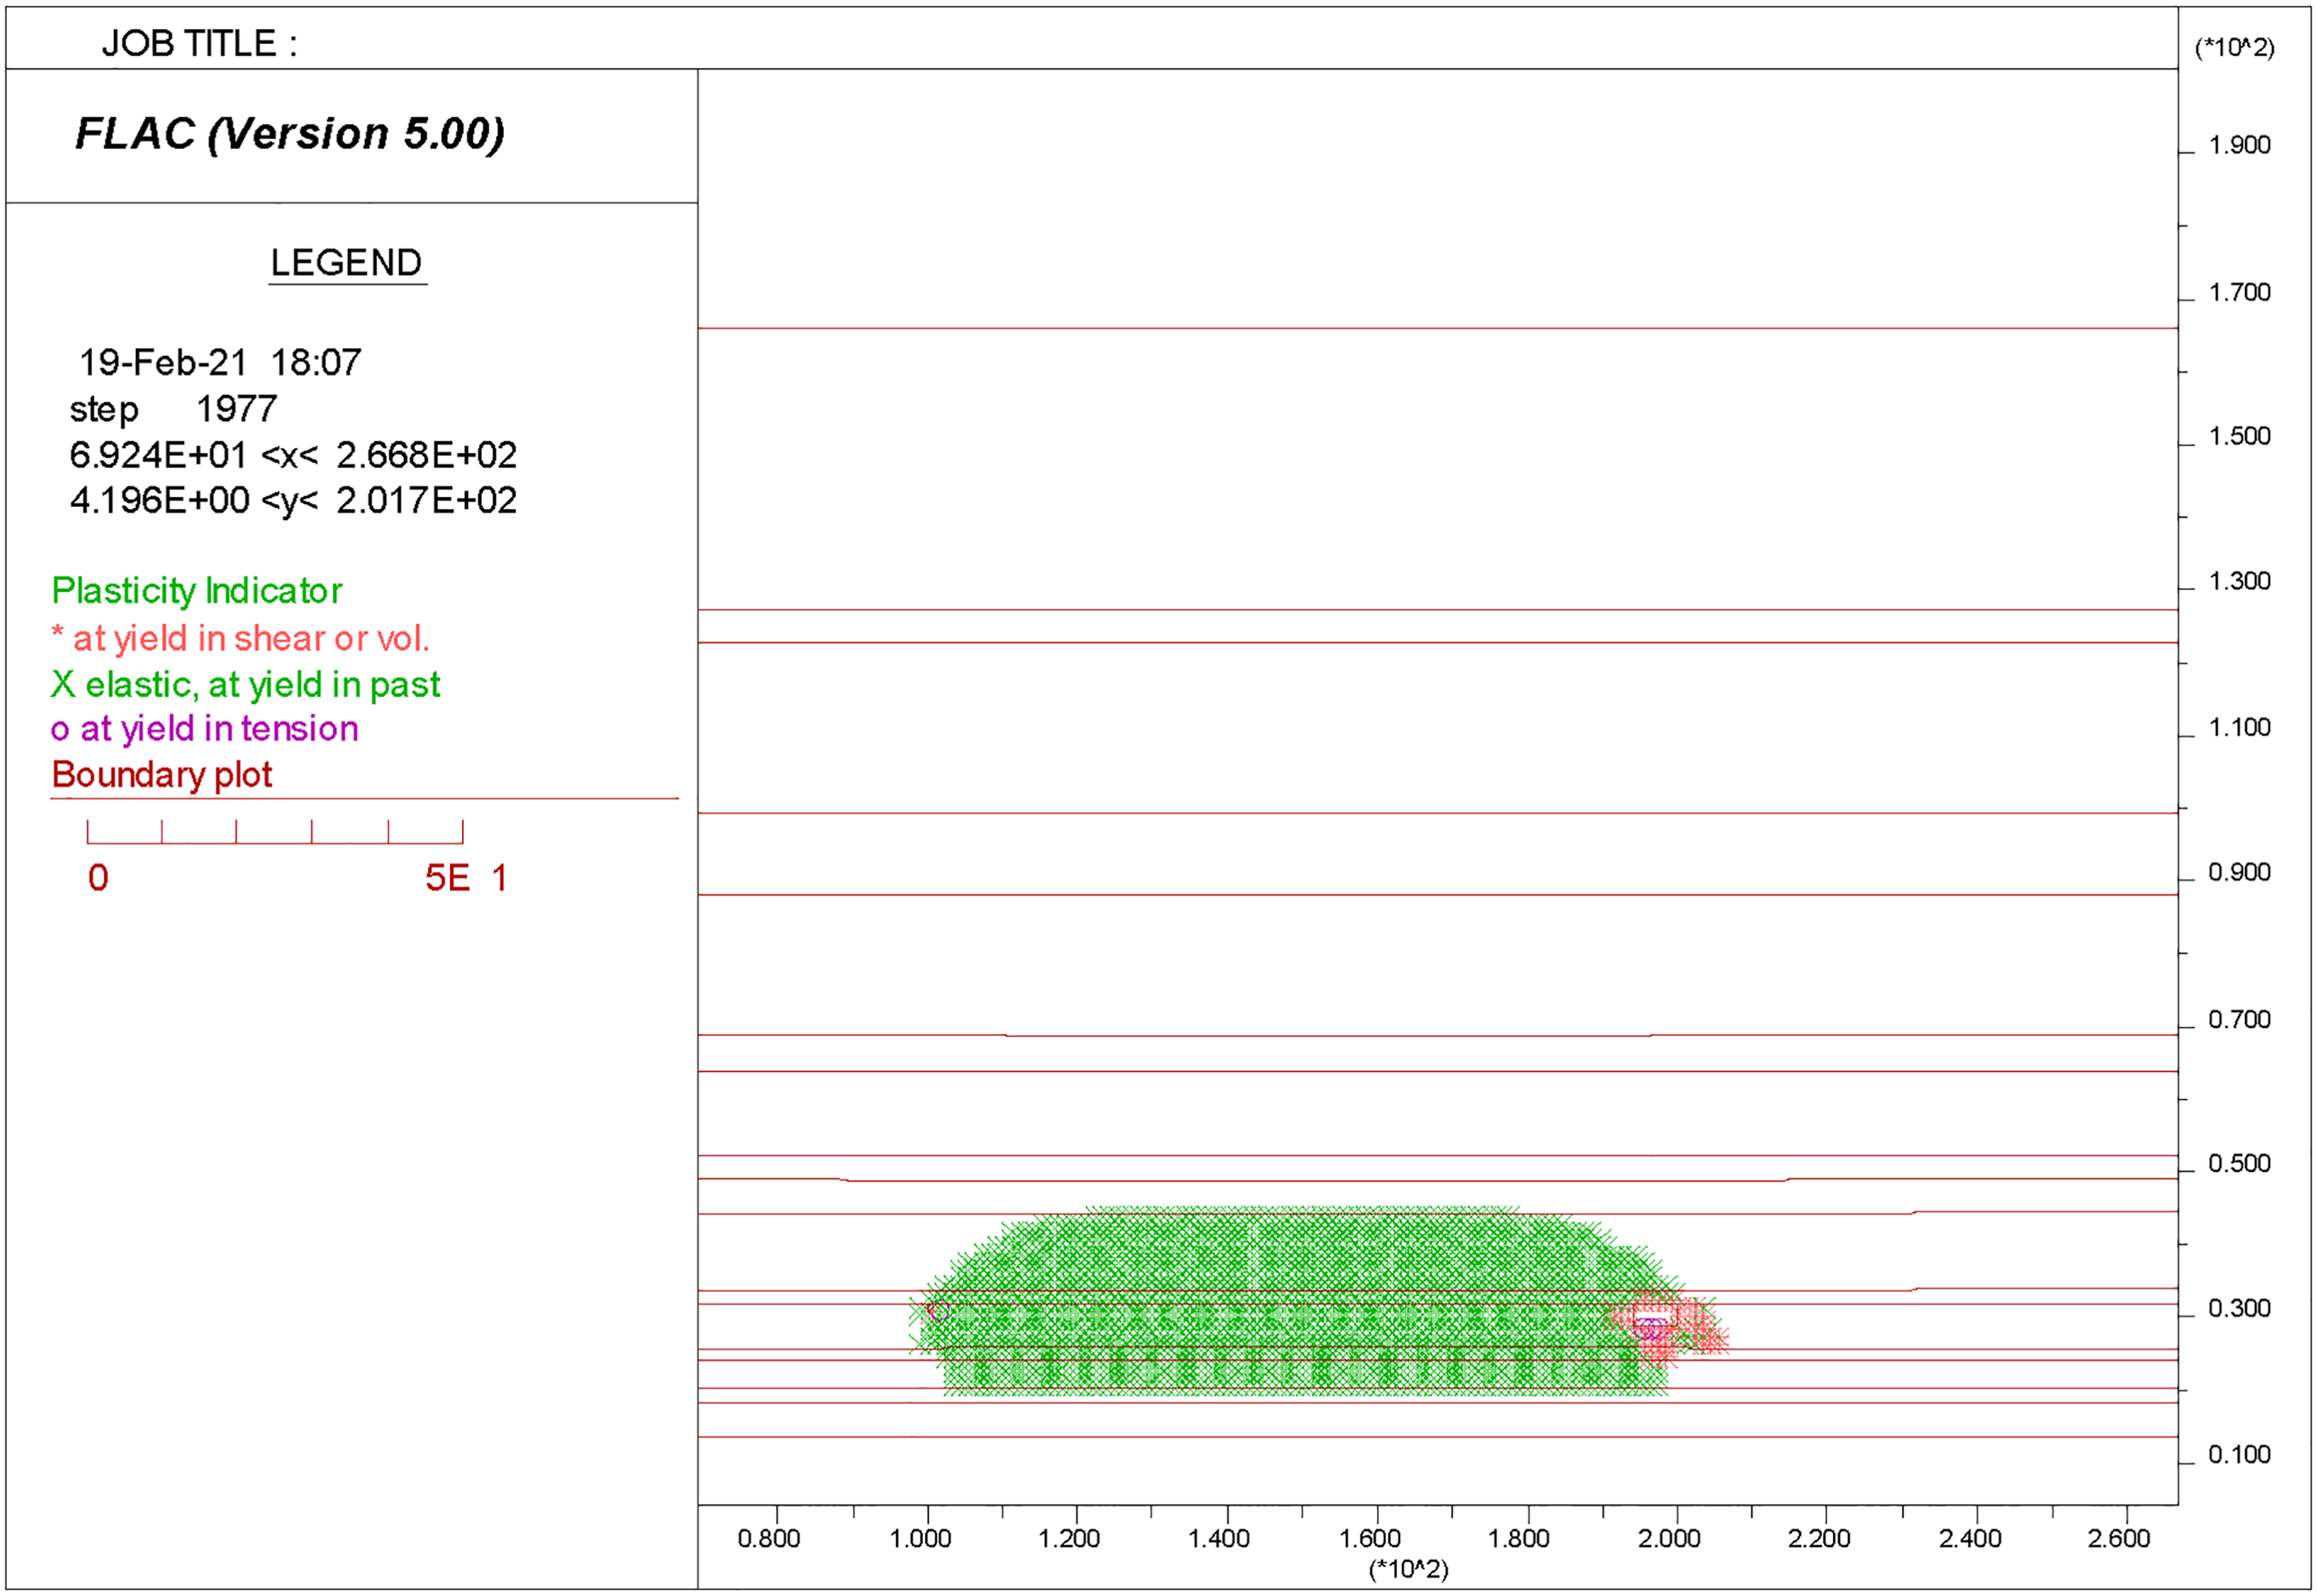
After recovery of the 11123 working face, a plastic zone is formed due to moving deformation of surrounding rocks. According to different deformation characteristics, the plastic zone can be divided into tensile failure plastic zone, plastic zone formed by volume deformation or shearing effect, and elastic state which is recovered by secondary compaction of surrounding rocks. The plastic zone distribution of surrounding rock when the working face is advanced to 100 m is shown in Figure 5.
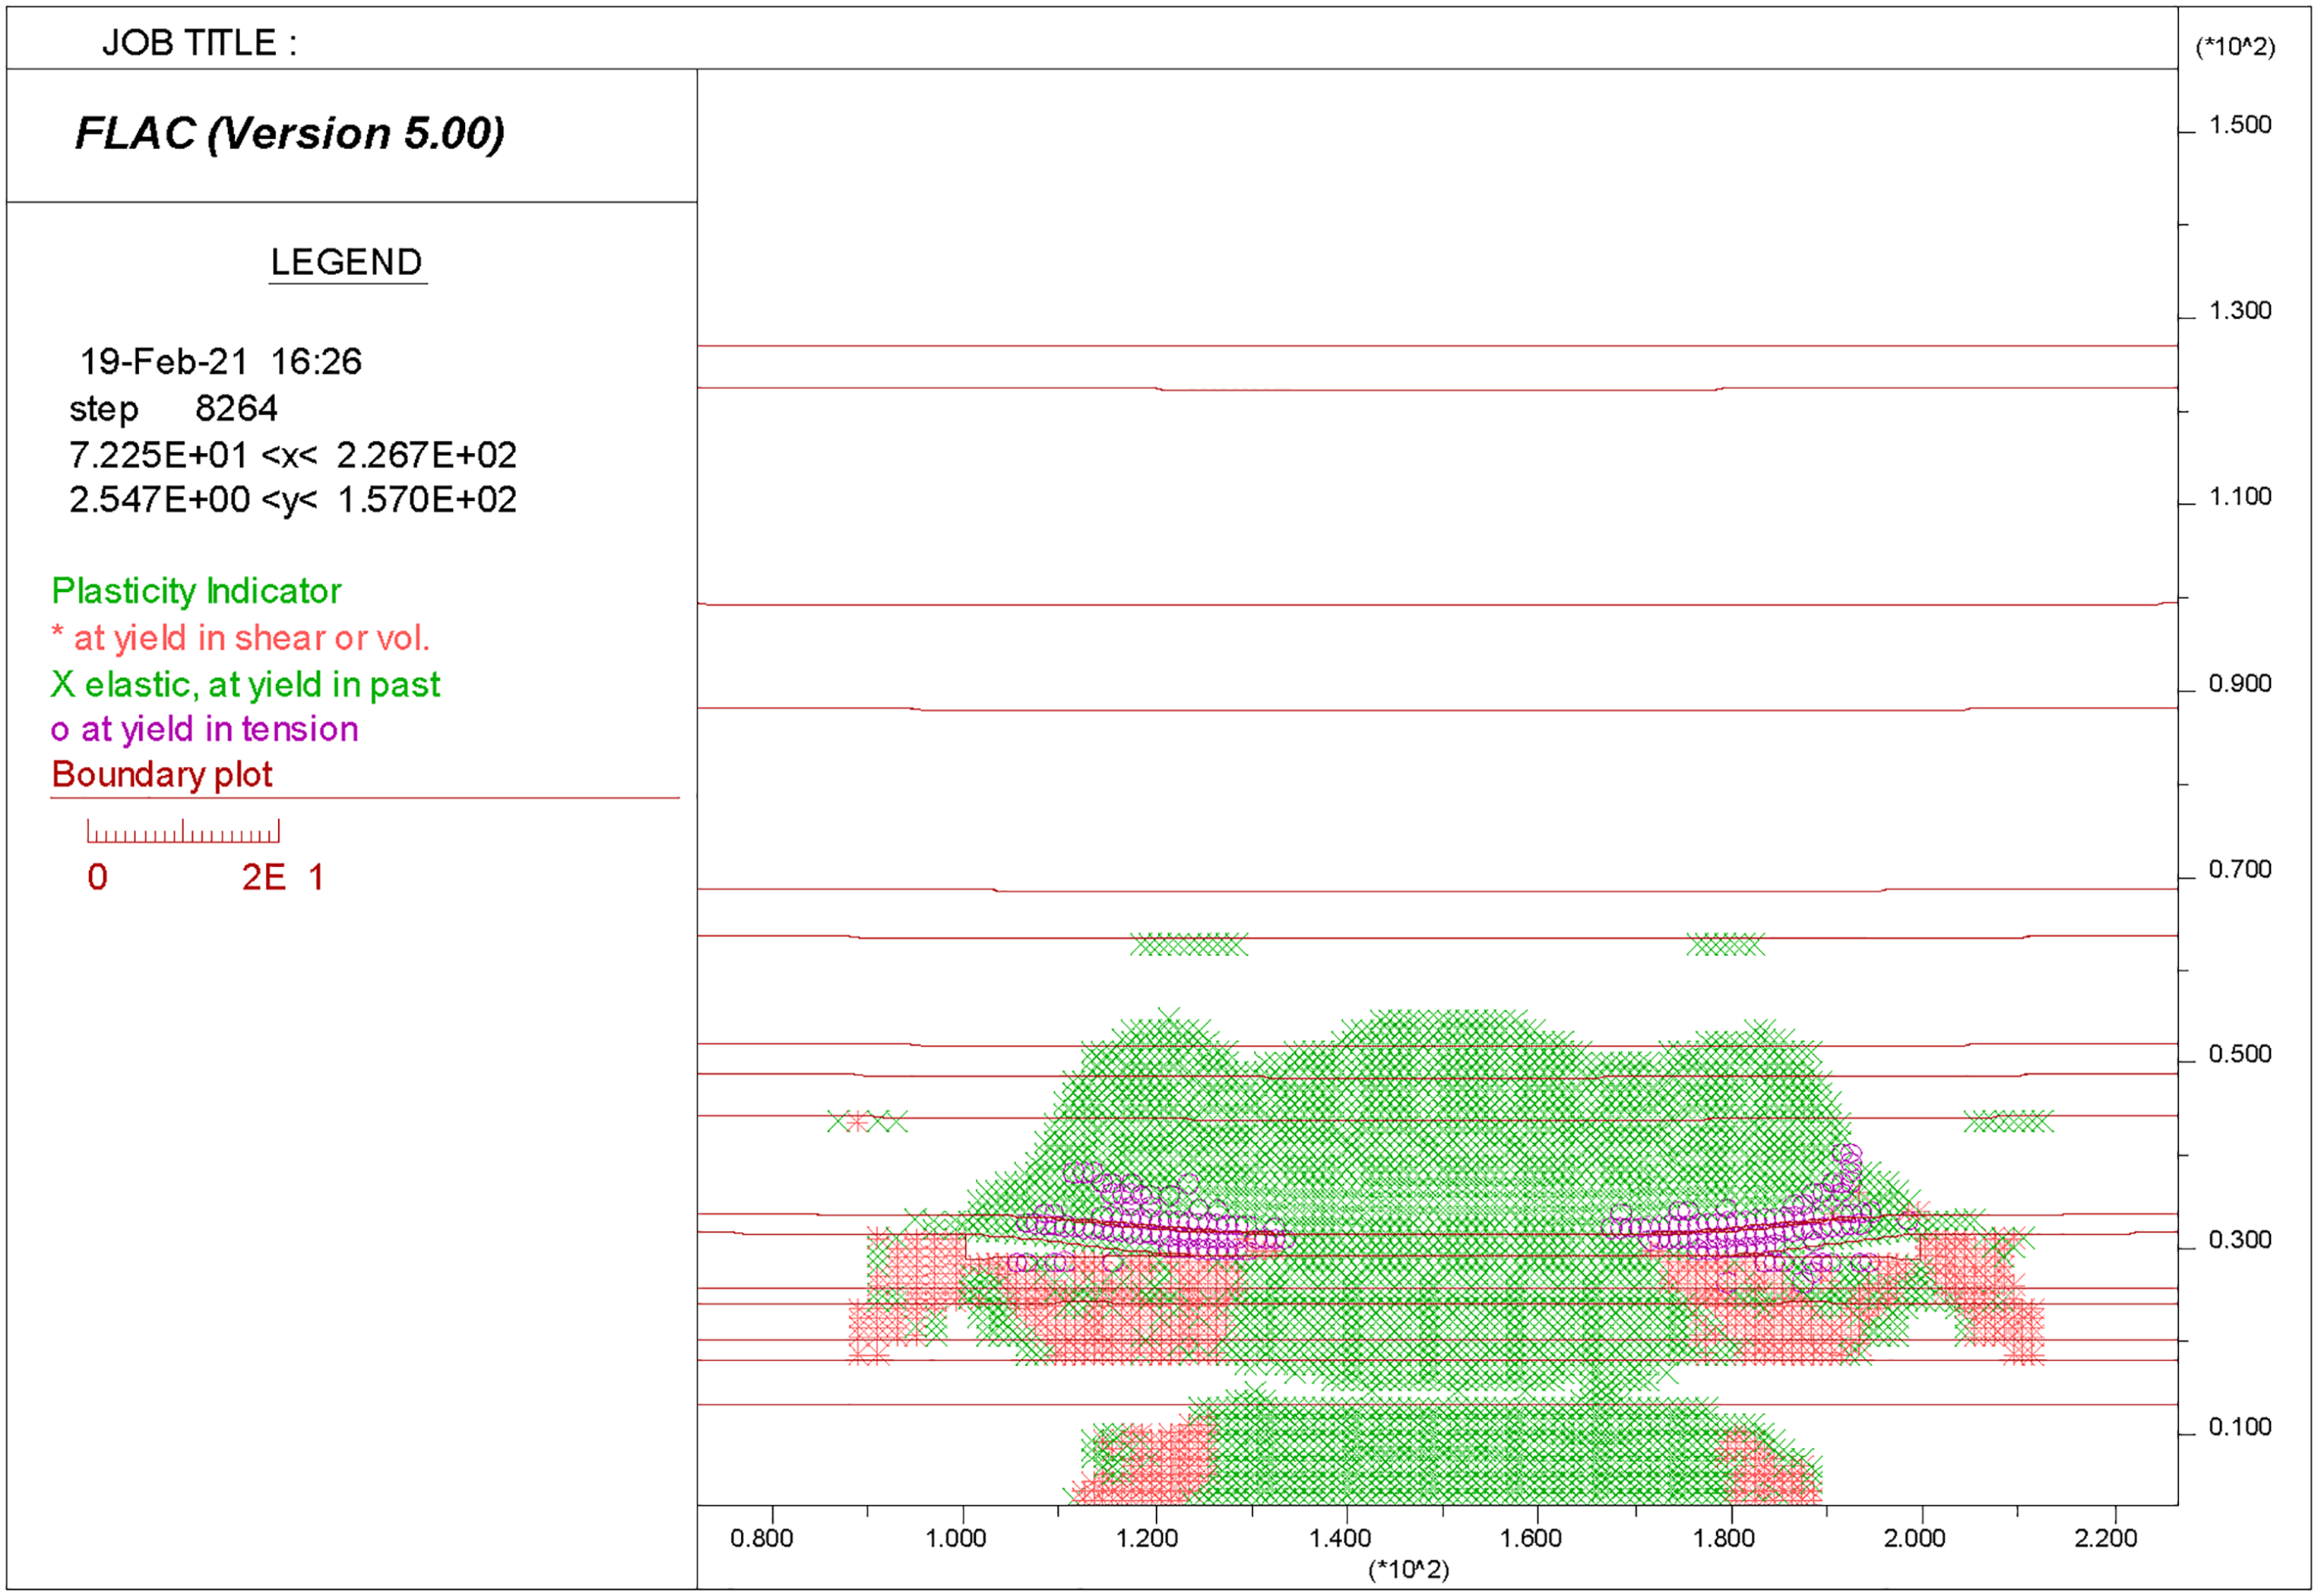
Distribution of surrounding rock plastic zones in caving mining (100 m).
When the working face is advanced by 50 m, the direct roof above the goaf mainly develops tensile failure during subsidence and a large-scale caving zone is formed. The highest position of plastic zone occurs in the middle of goaf. When the working face is advanced by 100 m, coal bodies at two sides of goaf and the bottom strata form the plastic zone of shear failure and volume expansion. Roofs on two sides of the goaf form a plastic zone of tensile failure. Subsequently, the plastic zone of goaf tends to be stable as the working face advances and it looks like a “saddle”. The development height is kept basically constant and it is about 31.91 m. During goaf processing by caving method, it not only forms a large-scaled plastic zone in the roof strata, but also can form large-scaled plastic zone in bottom strata, thus resulting in occurrence of water inrush from seam floor.
Surface subsidence characteristics
To study influences of mining on surface subsidence, an observation line is set on the upper boundary of the model, and observation points are set on the observation line every 4 m. Vertical displacement of these observation points can reflect influences of mining on surface subsidence. The surface subsidence curves in caving mining when the working face is advanced to different positions are shown in Figure 6. As the working face advances, the surface subsidence increases continuously and the maximum subsidence migrates forward continuously, locating in the middle of goaf. When the working face is advanced by 200 m, the maximum subsidence value of the observation line is −1774.40 mm and the mining height of working face is 3.0 m. The maximum surface subsidence coefficient in caving mining is 0.59. The surface subsidence does not increase any more and collapse basin occurs, indicating that mining of working face has reached full mining.
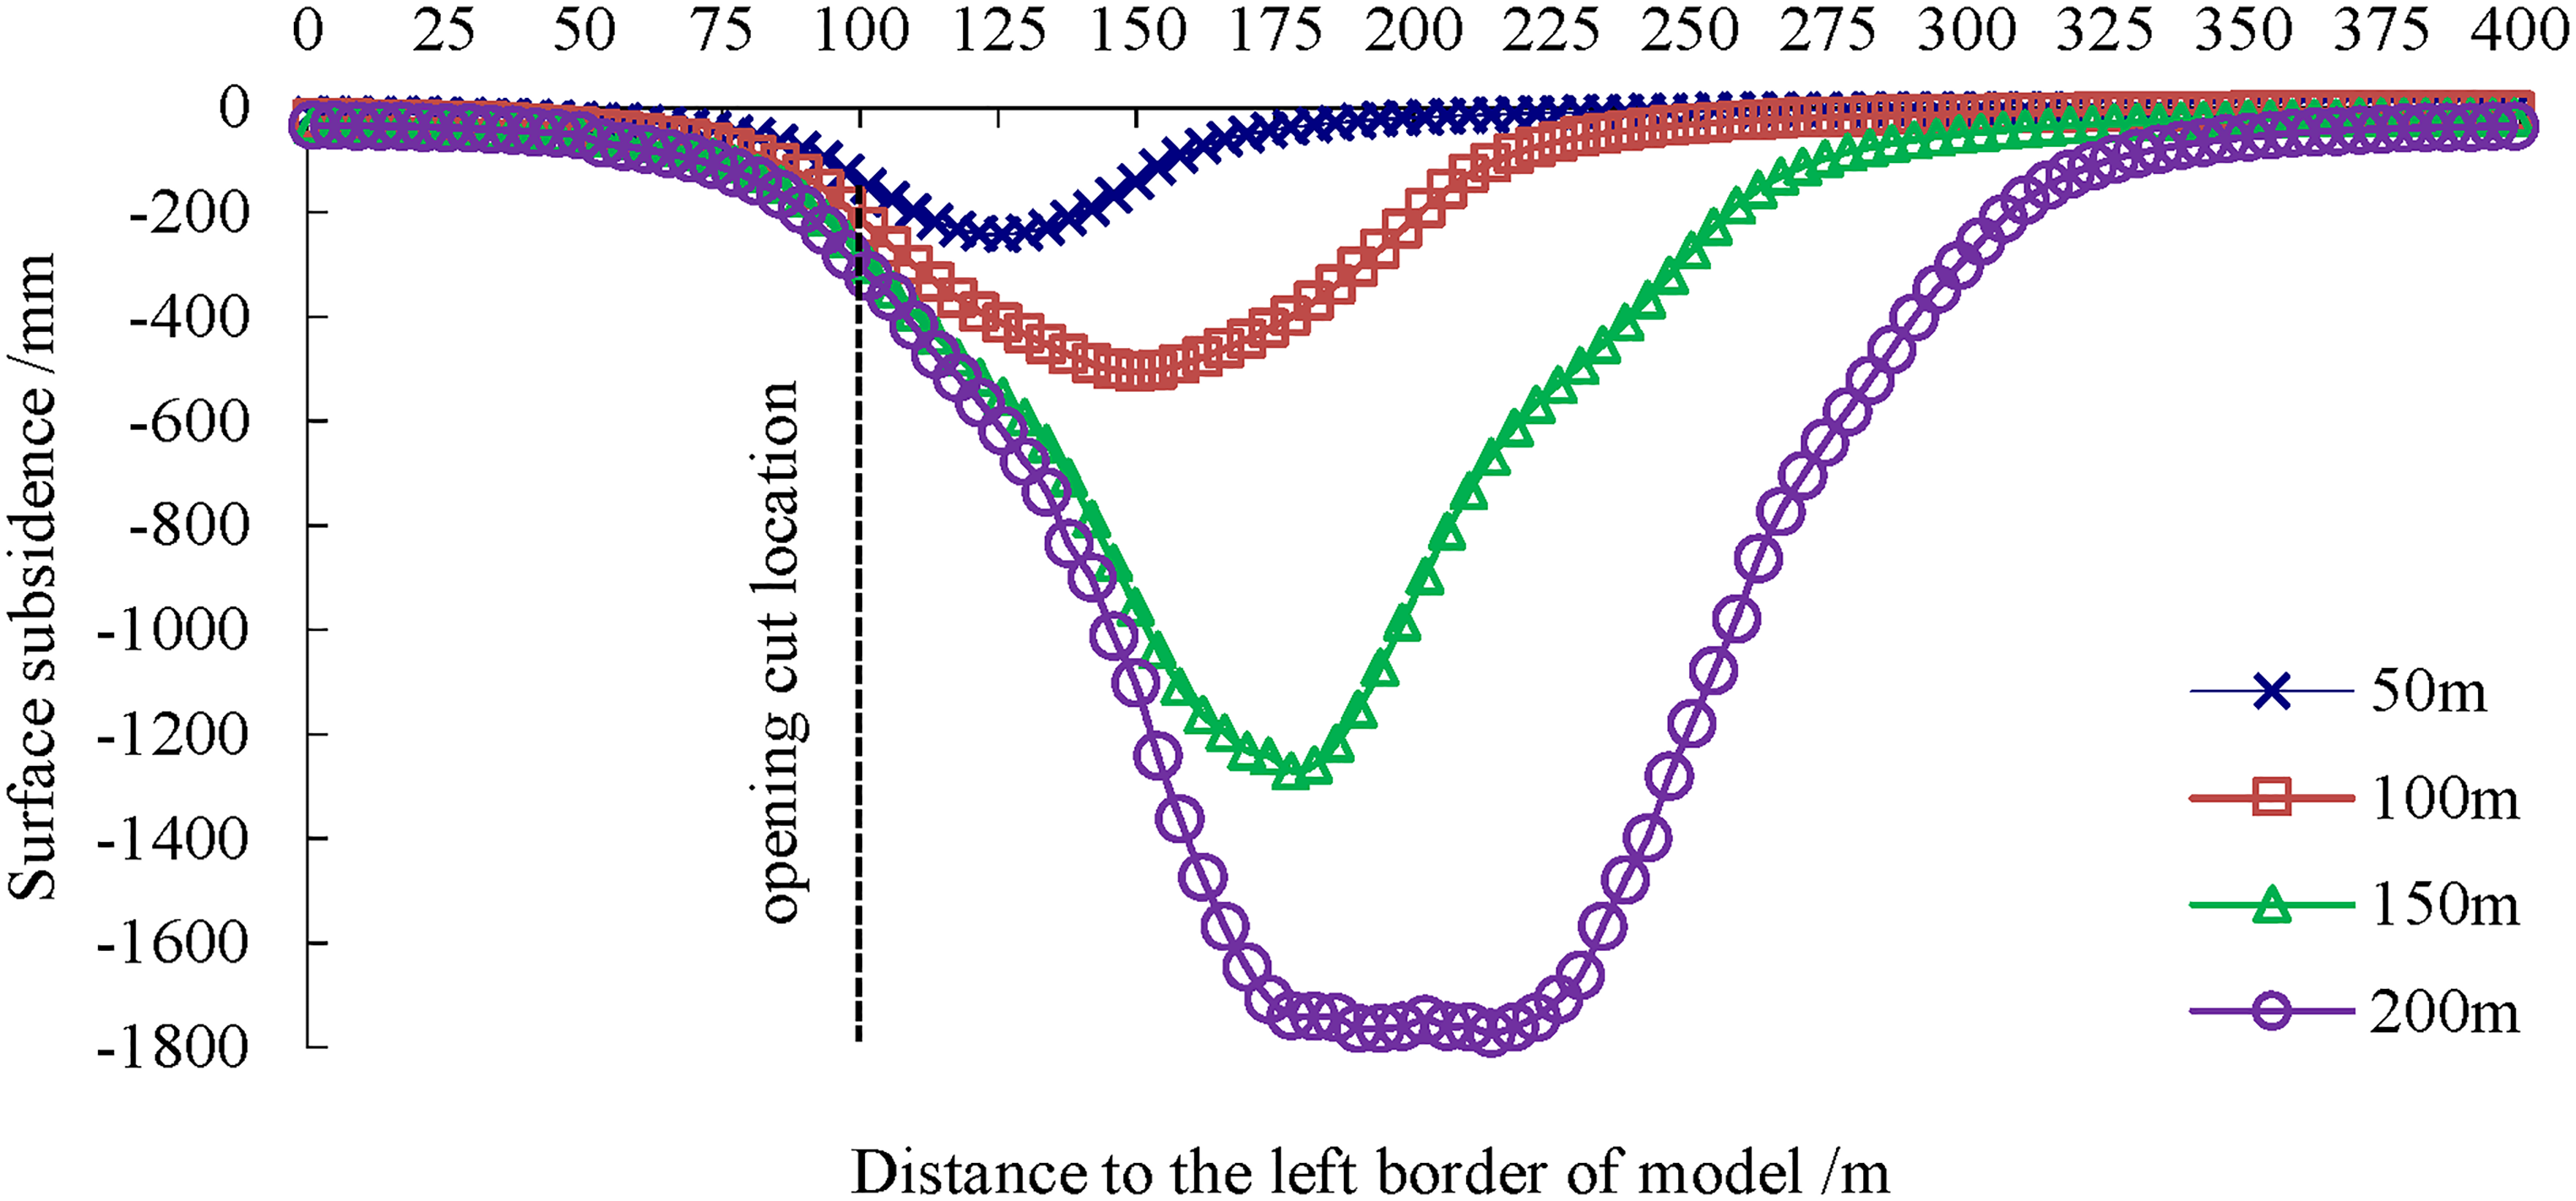
Surface subsidence curves in caving mining.
Results of numerical simulation in upper slicing backfill mining
The average thickness of Coal 3# below the industrial square of Panji No.4 Coal Mine is 6.0 m. According to the current status of backfill mining technology, slicing mining is suggested. The Coal 3# can be divided into two layers along the inclination of coal seams. Therefore, strata pressure behaviors of working face in backfill mining when the compaction filling is 100%, the compression ratio is 10%, final filling ratio is 90% and mining height is 3 m were studied. Moreover, strata pressure behaviors and surface subsidence of backfill mining and caving mining were compared.
Front and rear abutment pressure distributions of the working face
Comparison curves of abutment pressure between caving mining and backfill mining after the working face advances by 200 m are shown in Figure 7. The front abutment pressure peak of working face is 28.31 MPa in caving mining and 17.82 MPa in backfill mining, which is only 62.95% of that in caving mining. Moreover, the sphere of influence in backfill mining is narrowed significantly compared to that in caving mine and the distance from stress peak to coal wall decreases from 11.14 to 3.04 m. A stress reduction zone is formed behind the working face in caving mining. The vertical stress increases gradually at 30 m behind the working face and it only recovers to stress of primary rocks at 70 m behind the working face. Behind the working face in backfill mining, the filling body recovers to the stress of original rocks very quickly, indicating that the filling body bears most roof pressures.
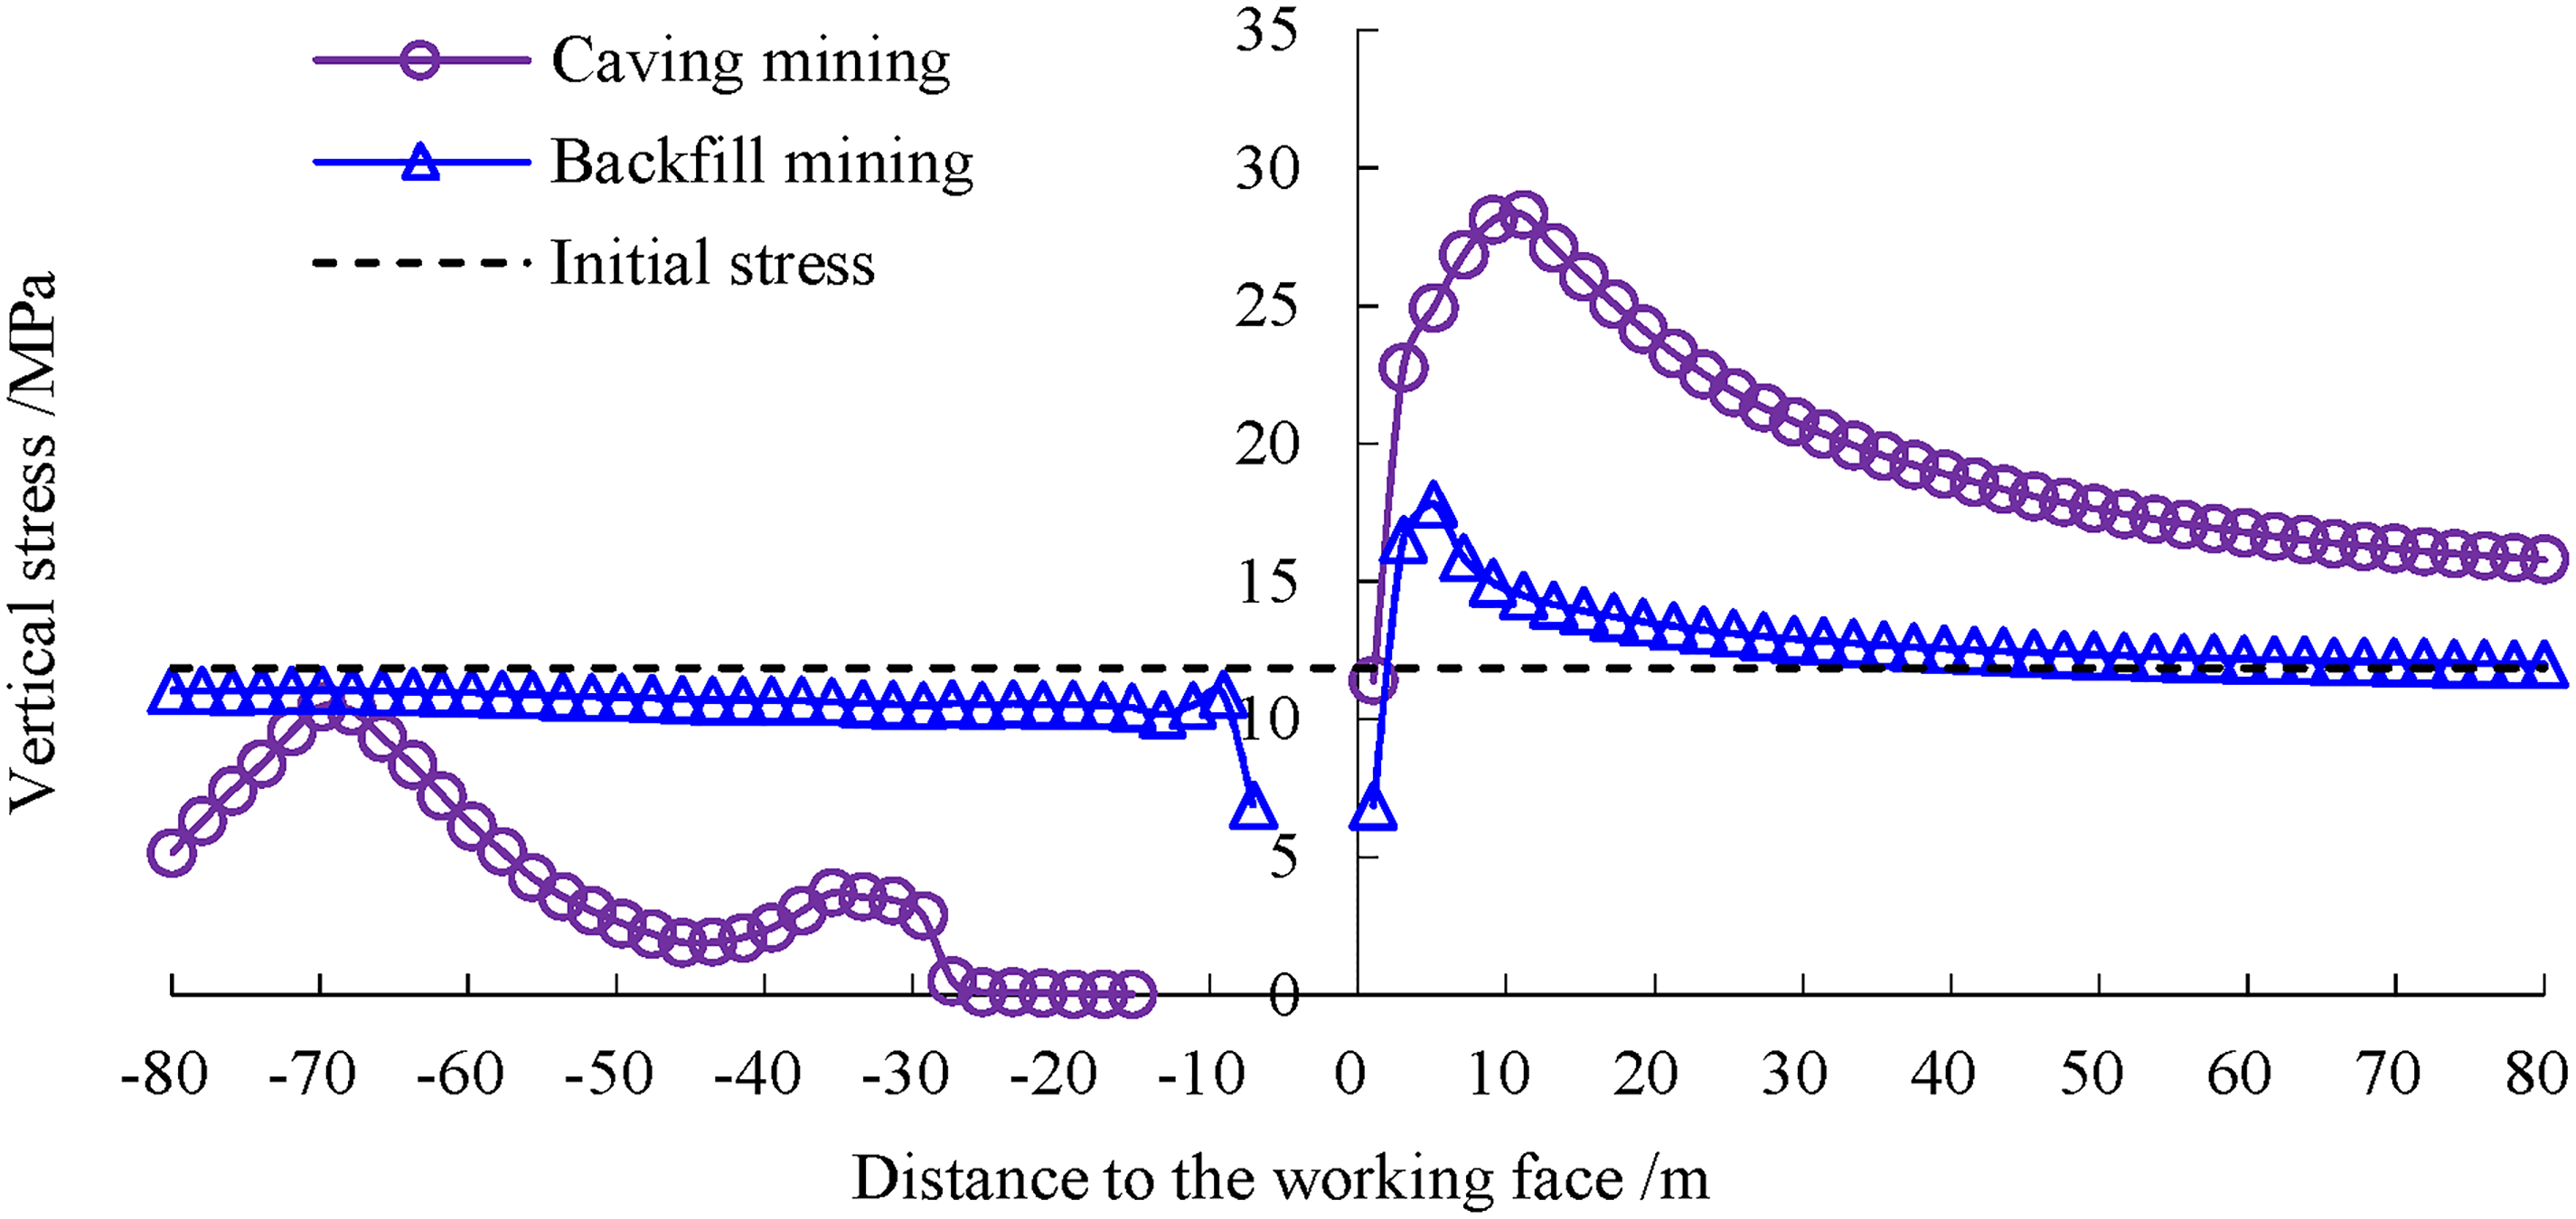
Contrast curve of abutment pressure between caving mining and backfill mining.
Evolutionary characteristics of plastic zones of working face
After the working face is advanced by 50 m in backfill mining, the sphere of influence of mining is limited since the working face uses 100% compaction filling. The height of the plastic zone in roof strata is 12.61 m and the development depth of plastic zone in bottom strata only affects Coal 1#. The depth of plastic zone is 5.56 m (Figure 8). The Panji No.4 Coal Mine has complicated hydrogeological conditions and the sphere of influence of backfill mining is small. The failure depth of bottom floor is 5.56 m. These are beneficial for water control.
Distribution of surrounding rock plastic zones in backfill mining (100 m).
Surface subsidence characteristics
Comparison curves of surface subsidence between caving mining and backfill mining are shown in Figure 9. In caving mining, the maximum surface subsidence value is −1774.40 mm and the subsidence coefficient is 0.59. In backfill mining, the maximum surface subsidence value is −73.12 mm and the subsidence coefficient is 0.02, which is only 4.12% of that in caving mining. This reveals that paste filling can control the movement of overlying strata effectively and decrease surface subsidence significantly.
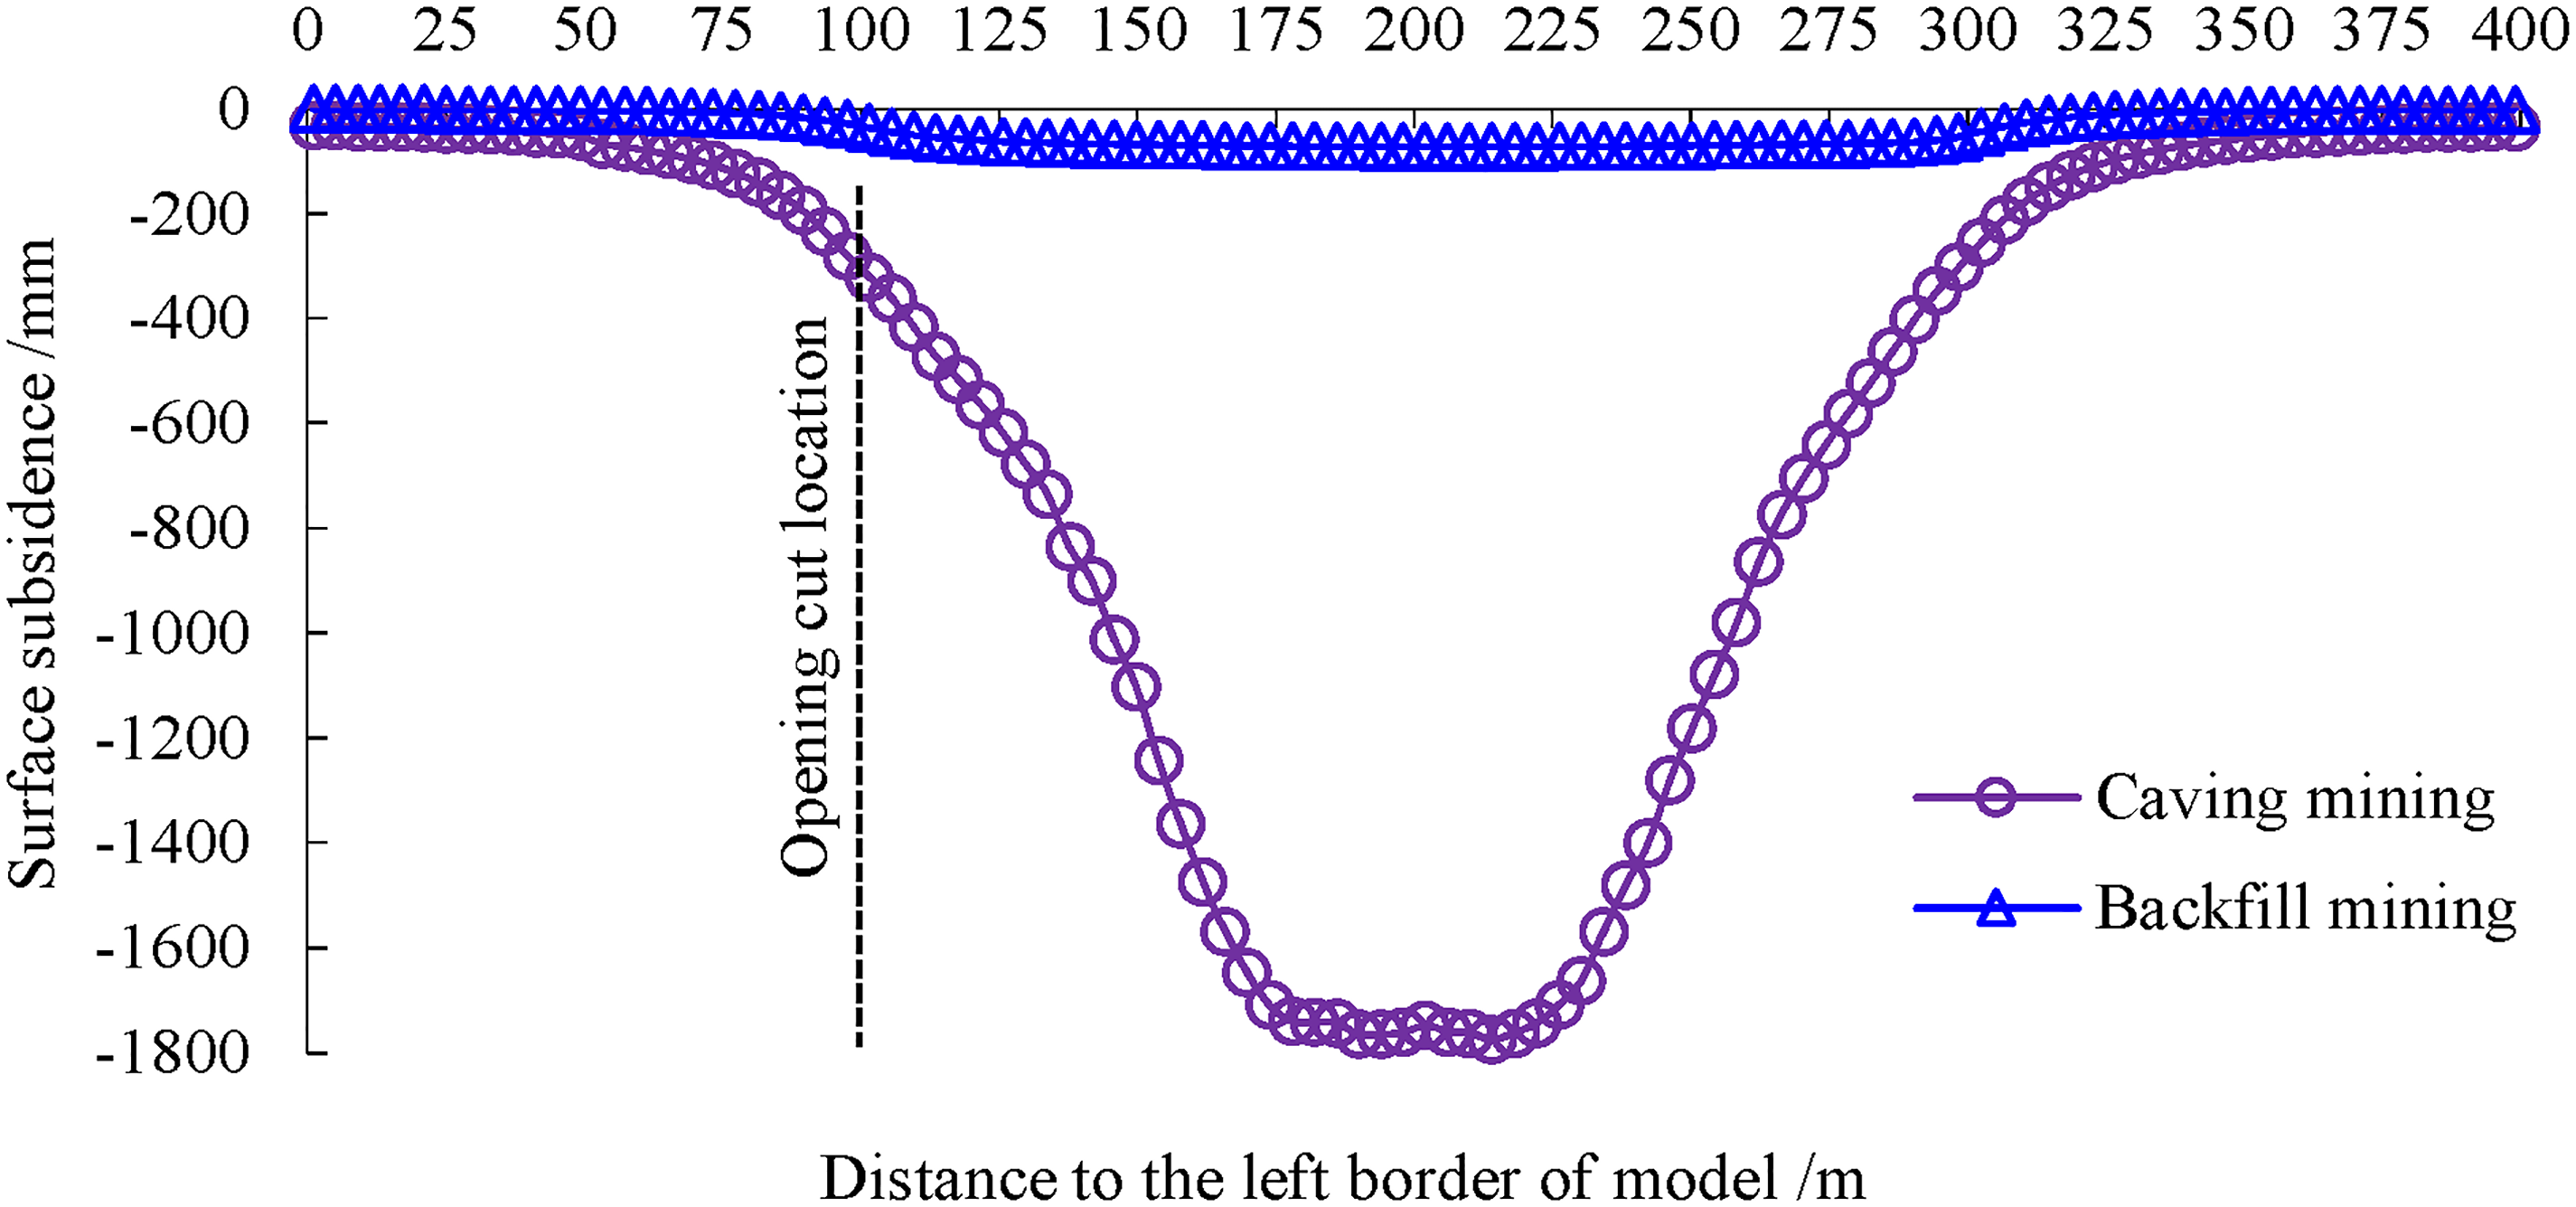
Contrast curve of surface subsidence between caving mining and backfill mining.
Results of numerical simulation in lower slicing backfill mining
The upper slicing and lower slicing were excavated in proper sequence through caving mining and backfill mining. Comparison curves of surface subsidence values by numerical simulation are shown in Figure 10.
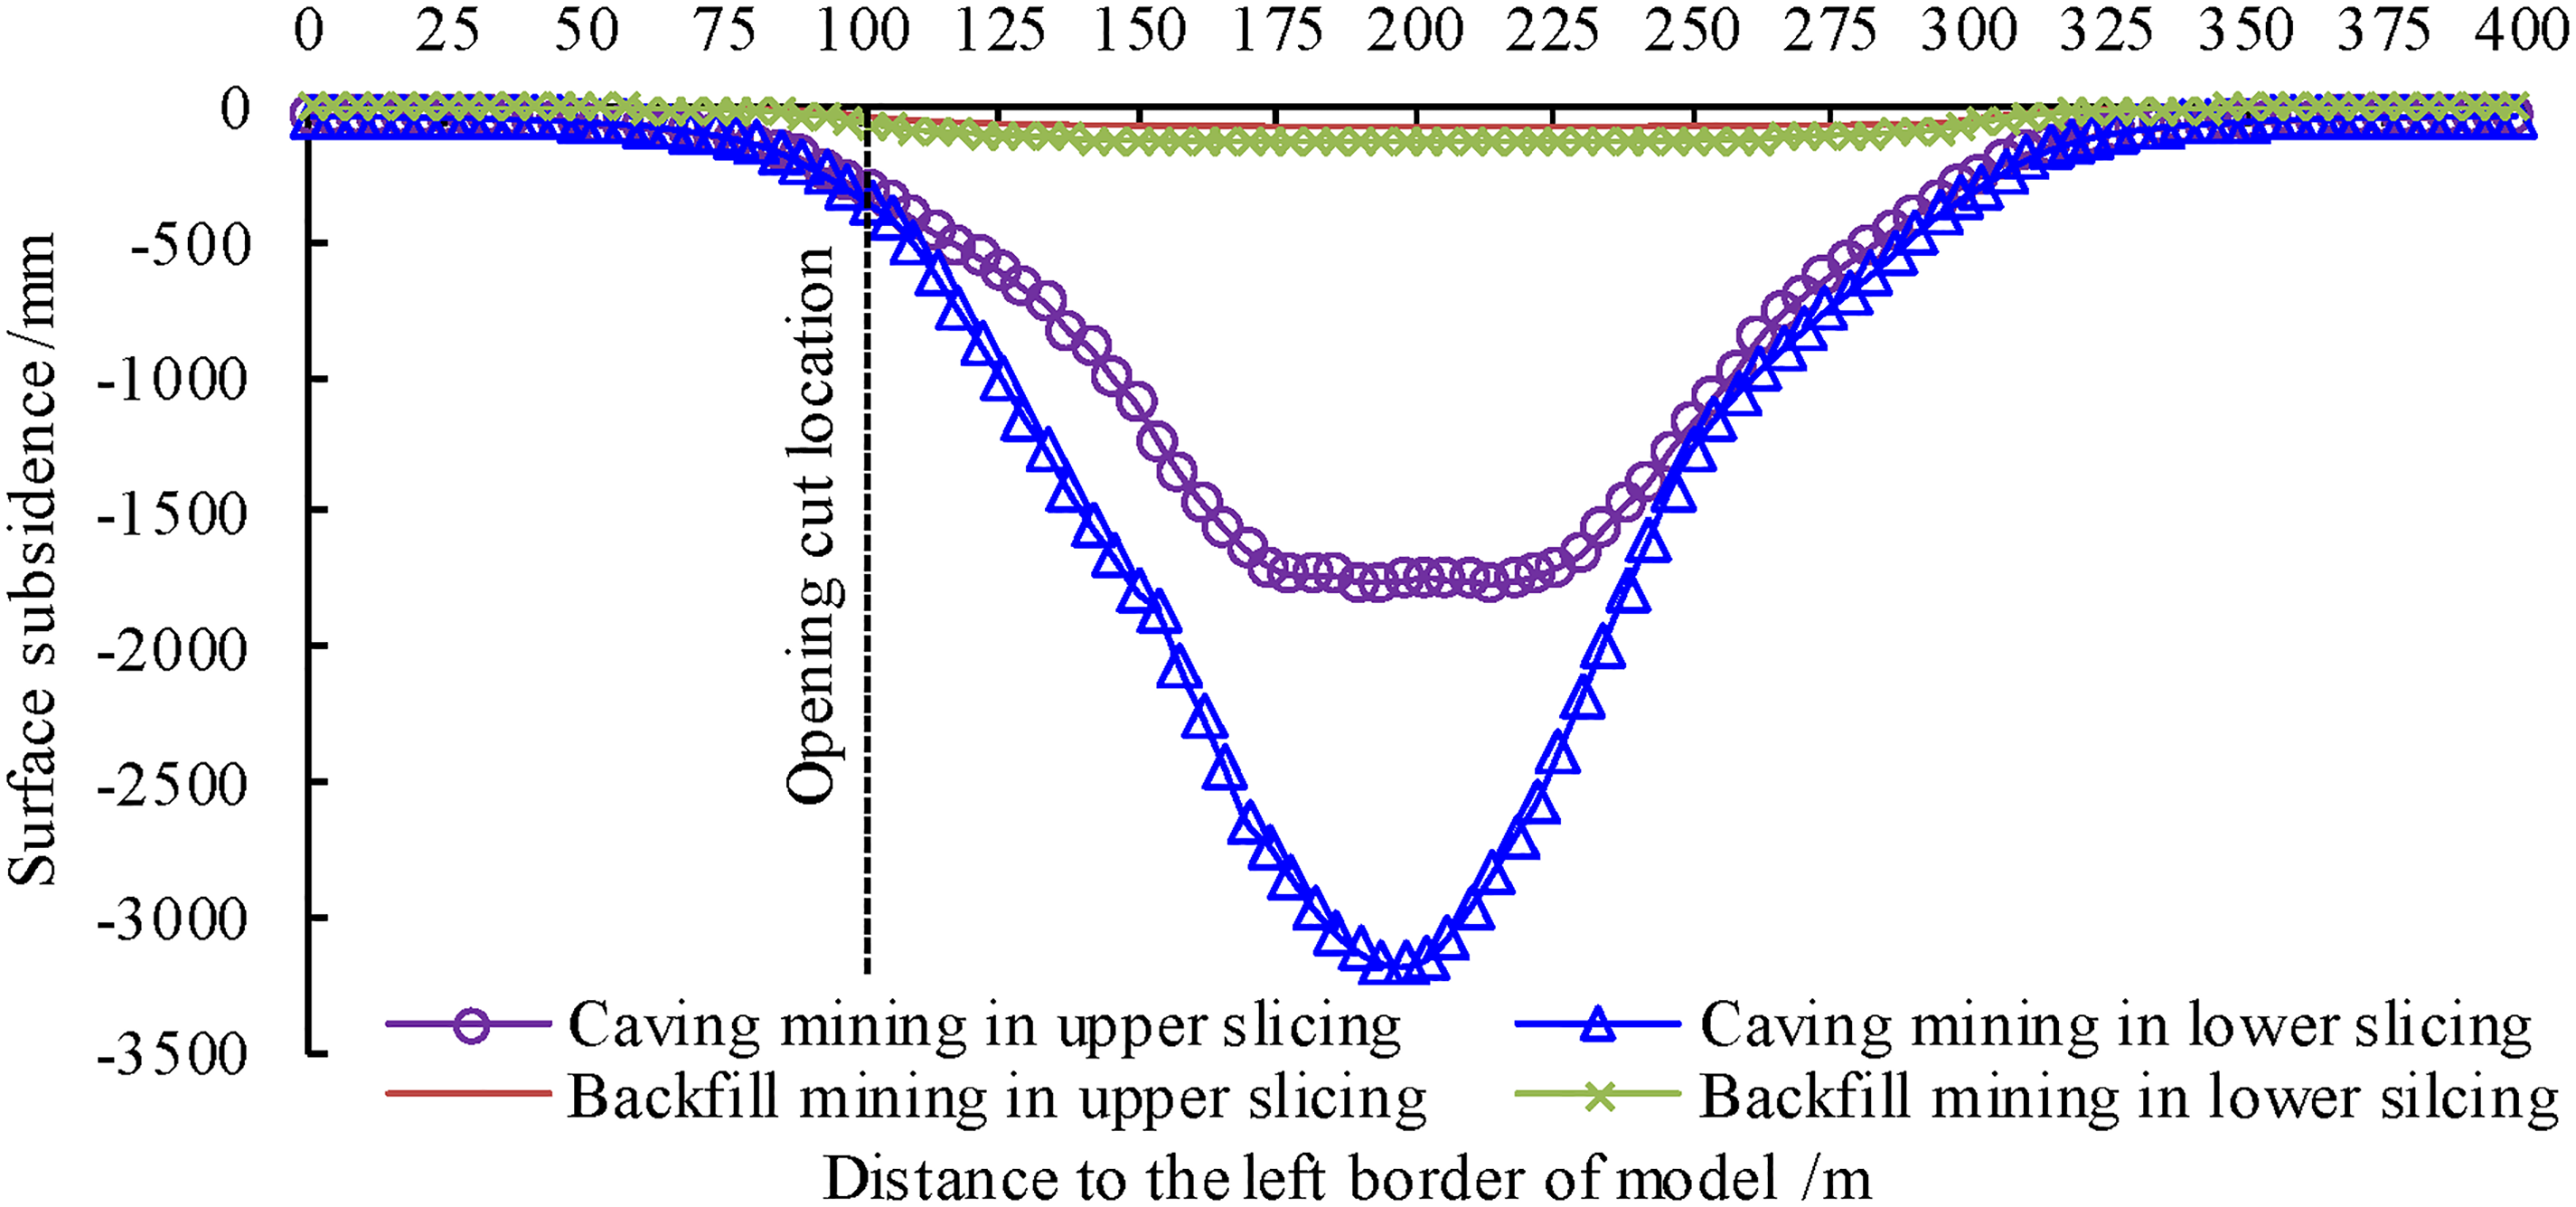
Comparison curves of surface subsidence values by numerical simulation.
It can be seen from Figure 10 that after excavation of the upper slicing, the maximum surface subsidence value is −1774.40 mm in caving mining and it is −73.12 mm in backfill mining, which is 4.12% of that in caving mining. After complete excavation of the lower slicing, maximum surface subsidence value is −3178.20 mm in caving mining and it is −131.61 mm in backfill mining, which is 4.14% of that in caving mining.
Results of physical simulation in slicing caving mining
Overlying strata deformation in slicing caving mining is shown in Figure 11. Same with the traditional caving method, a caving belt, fracture belt and bending subsidence belt are formed in the excavation process.
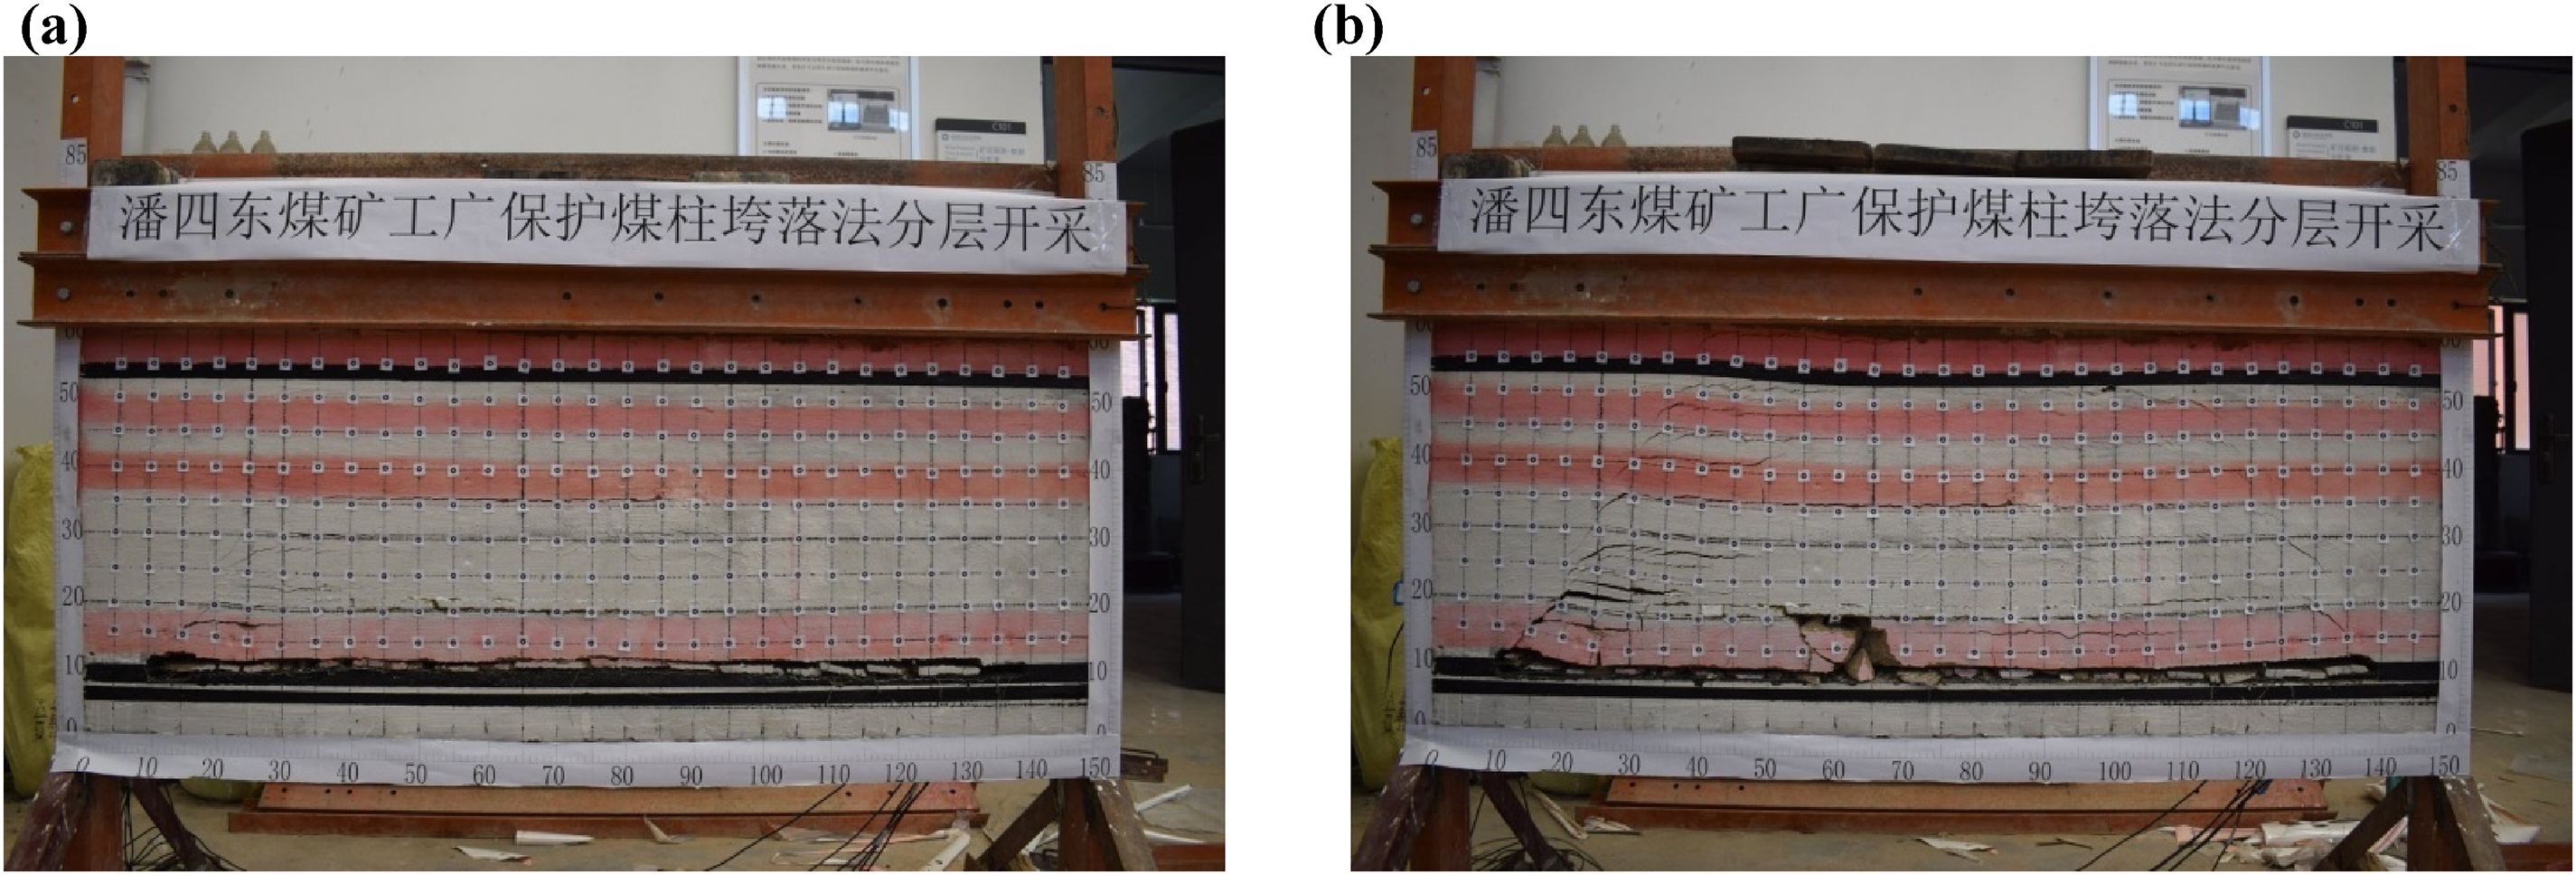
Overlying strata movement characteristics in slicing caving mining:
After excavation of the upper slicing (Figure 11(a)), the working face experiences the first collapse of direct roof, first pressure and periodic pressure of main roof. When the working face advances to the upper slicing 110 cm(220 m), the separation strata is developed to places below the second hard strata, and the beneath separation strata is closed. In the subsequent excavation of upper slicing, the separation strata stops upward development and the total development height of the upper slicing fracture is 52 m. Since the fractures have not developed to the higher strata and the direct roof collapses completely to the goaf, the goaf is filled. After the upper stratum is mined completely, no great subsidence occurs.
During the excavation of the lower slicing (Figure 11(b)), secondary mining influences are produced to the overlying structure. When the working face is advanced to the lower slicing 130 cm(260 m), near the stopping line, the separation strata develops into the fourth hard strata. After finishing excavation, the model is put static for 12 h and tiny subsidence occurs at the top of model. Under this circumstance, the development height of fractures is 98 m.
Results of physical simulation in slicing backfill mining
Overlying strata movement characteristics after excavation of upper and lower slicing in slicing backfill mining are shown in Figure 12. Different from traditional caving mining, “three belts” won’t be formed during excavation. Instead, only fracture belt and bending subsidence belt are formed. The activity intensity of overlying strata decreases significantly.
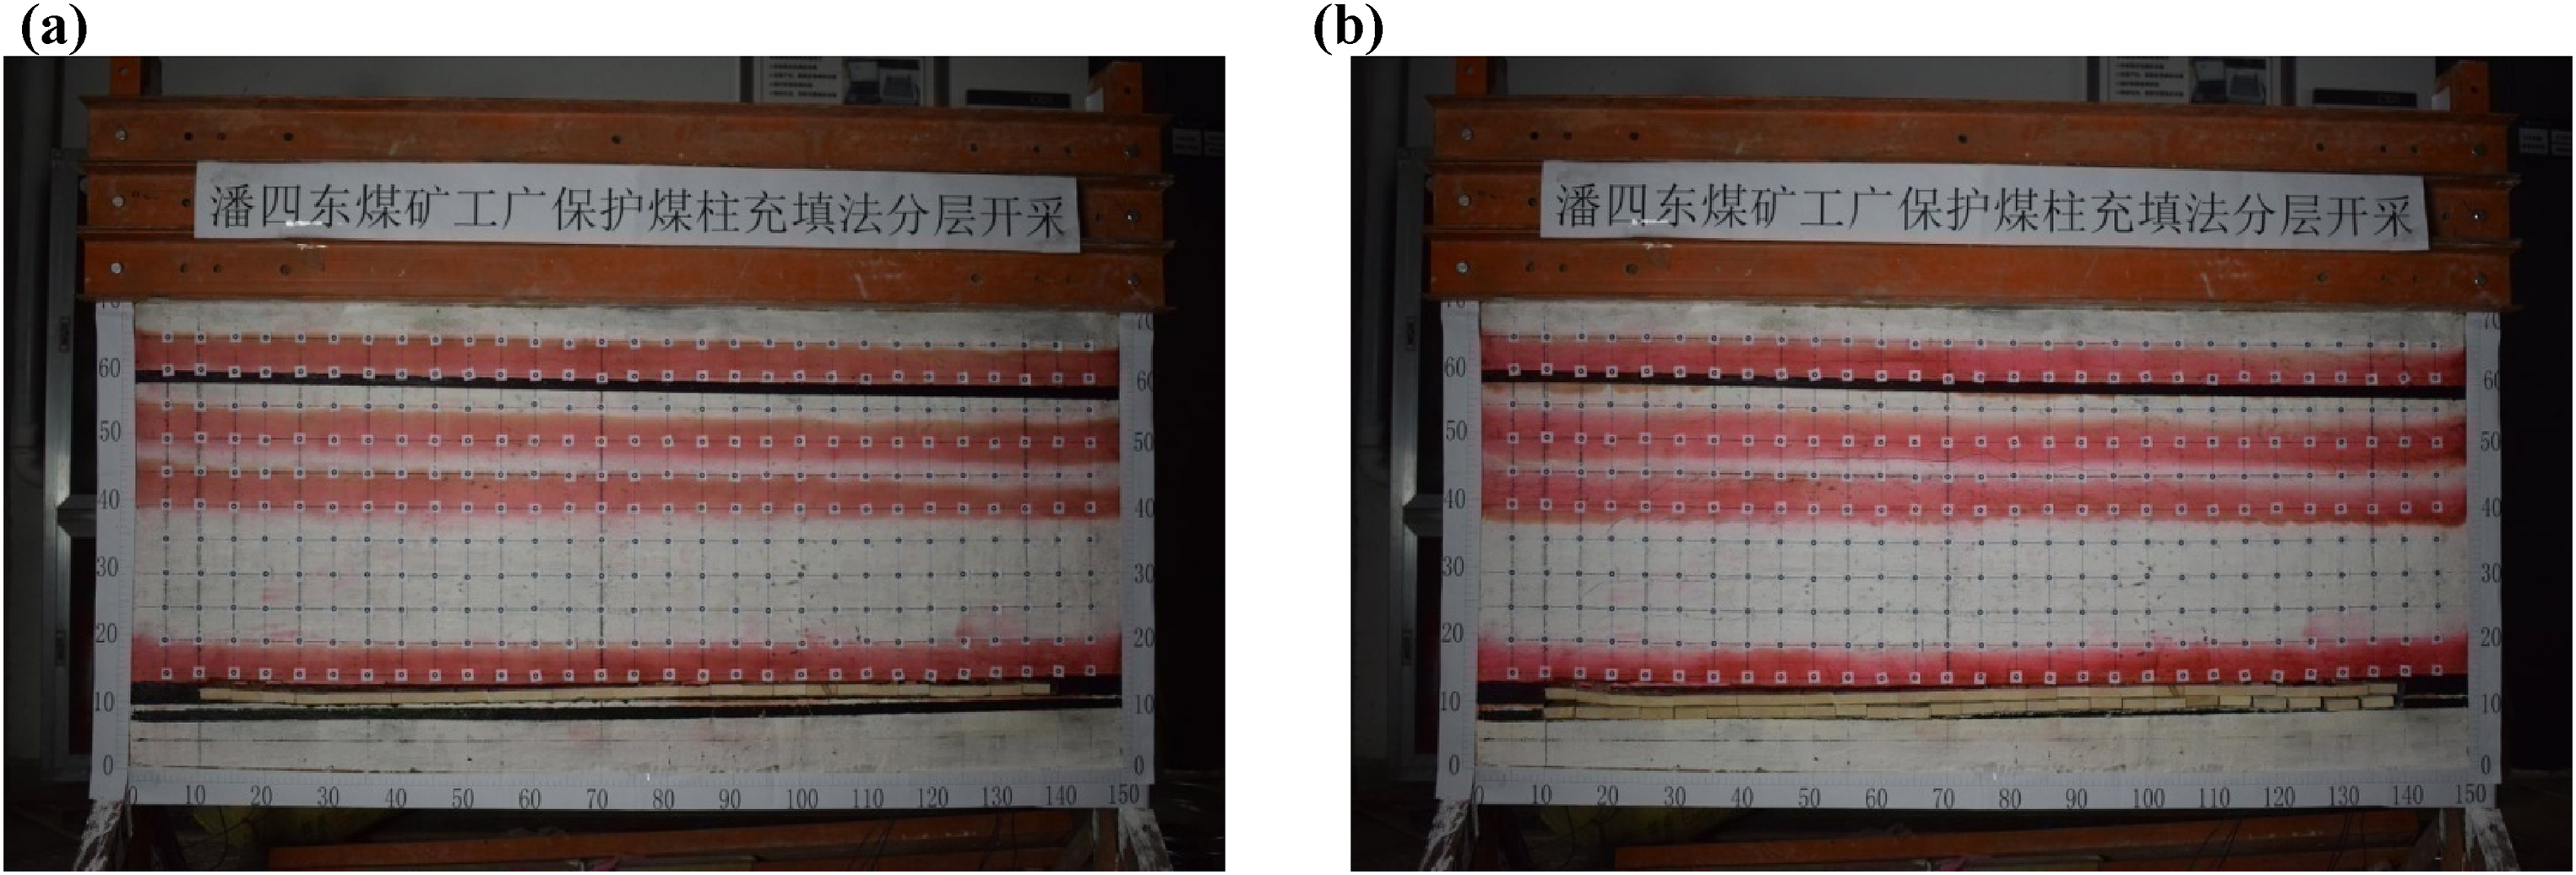
Overlying strata movement characteristics in slicing backfill mining:
After backfilling of the upper slicing (Figure 12(a)), the fracture develops to the main roof and middle of the second hard strata. The development height of fracture is about 30 m.
After backfilling of the lower slicing (Figure 12(b)), the fracture develops to the space between the second and third hard strata. At this moment, the development height of fracture is 69 m. No evident initial pressure and periodic pressure are observed throughout the backfill mining. Moreover, the development degree of fractures is small. This indicates that backfill mining can control overlying strata activities better than caving mining.
Subsidence values of four observation lines were extracted to reflect overlying strata movement characteristics. The fourth observation line reflects the surface subsidence value (Figure 13).
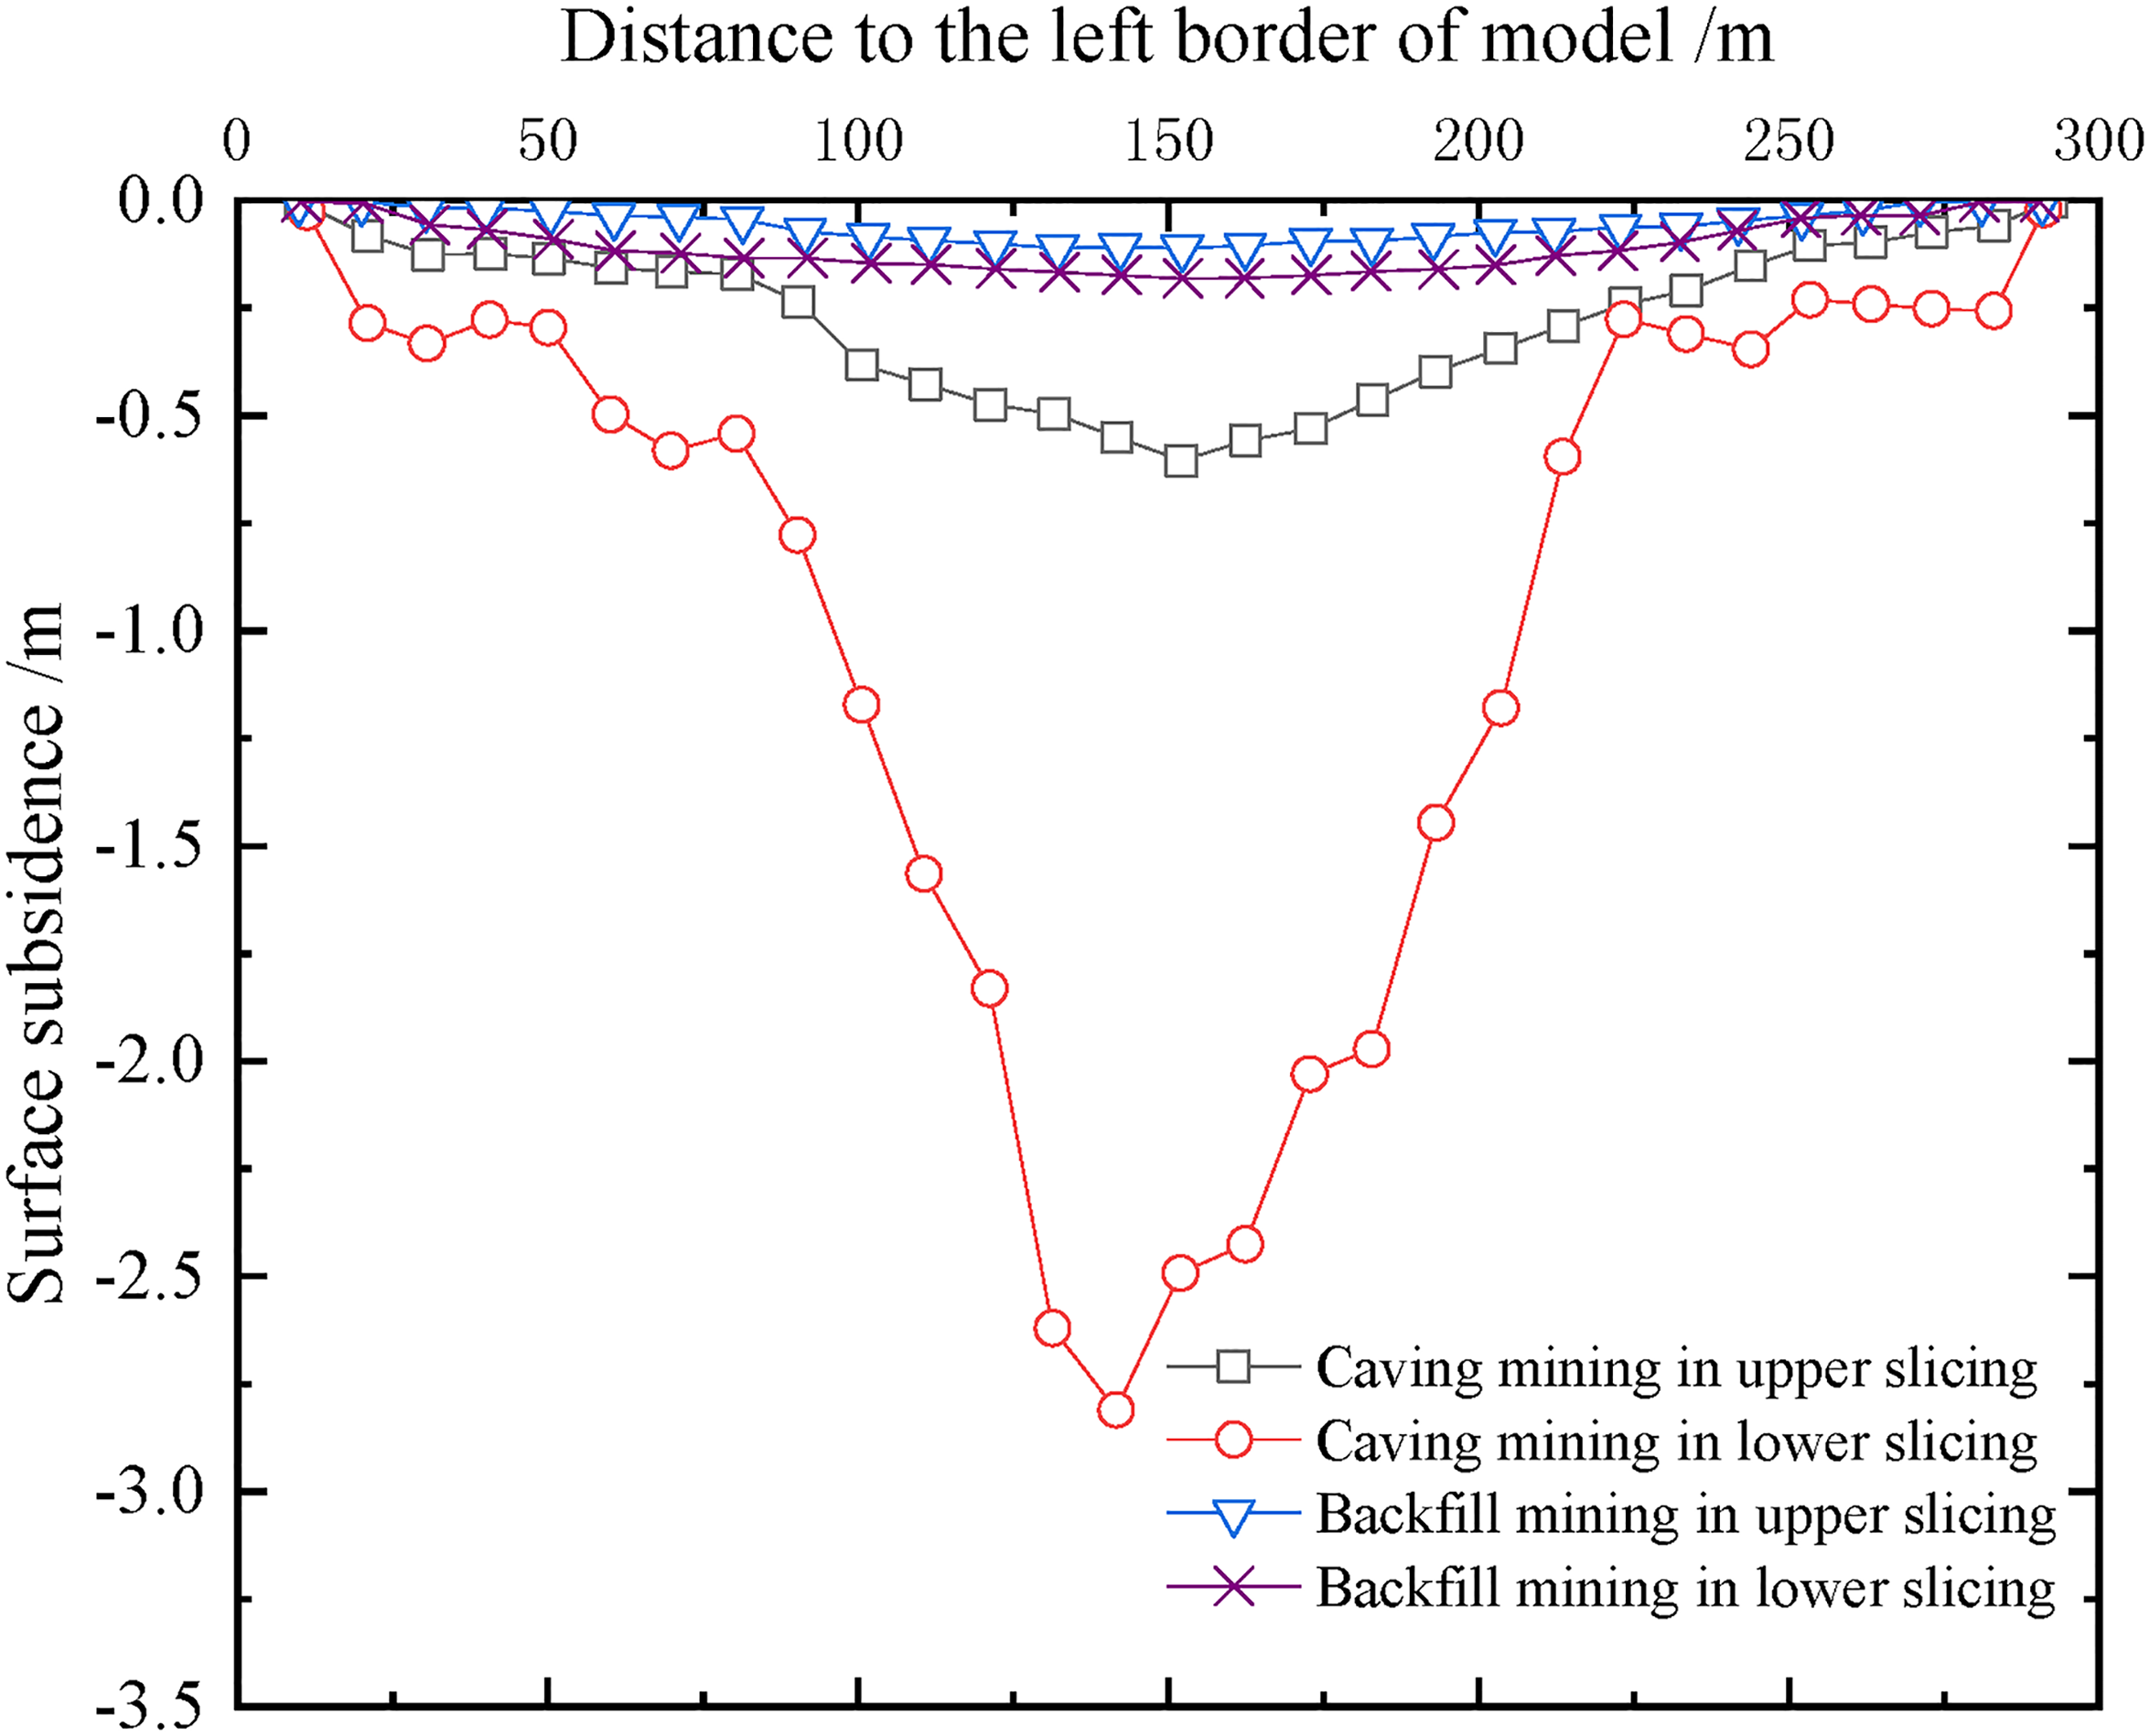
Comparison curves of surface subsidence values by physical simulation.
It can be seen from Figure 13 that after complete excavation of the upper slicing, the maximum surface subsidence value is −604.00 mm in caving mining and it is −109.63 mm in backfill mining, which is 18.3% of that in caving mining. After complete excavation of the lower slicing, maximum surface subsidence value is −2809.68 mm in caving mining and it is −180.80 mm in backfill mining, which is 6.4% of that in caving mining.
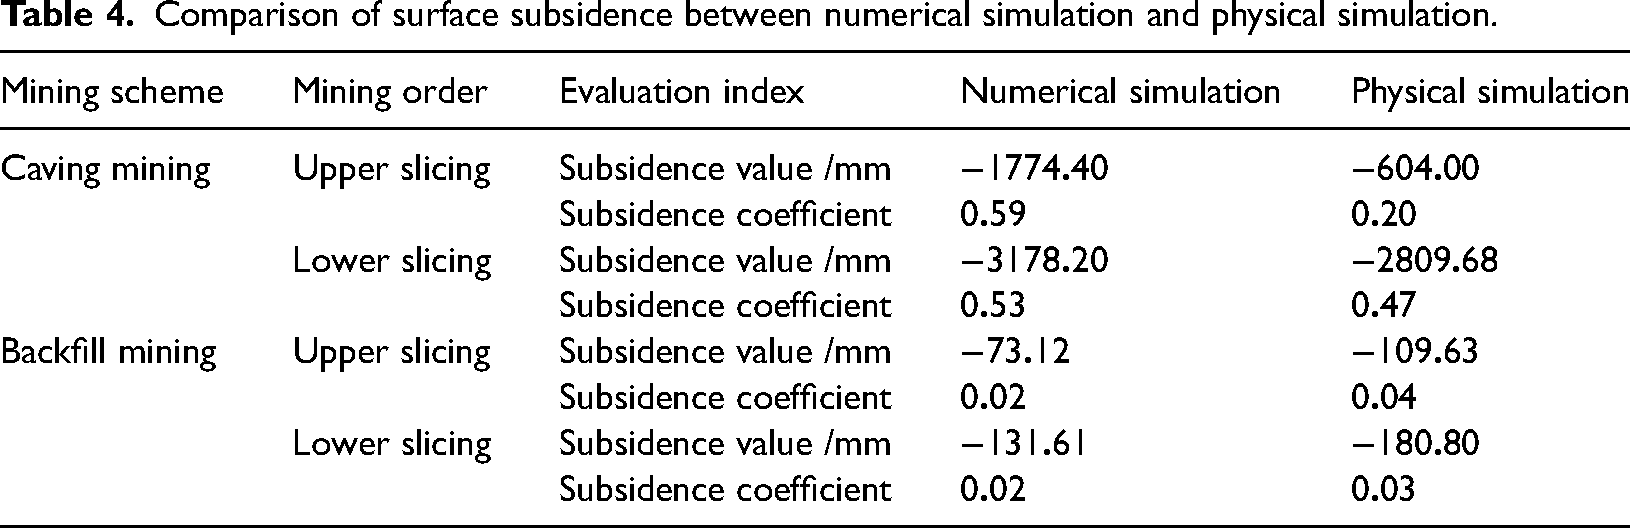
The comparison of surface subsidence between numerical simulation and physical simulation is listed in Table 4. The results of numerical simulation and physical simulation have good similarities, which proves that the research results are scientific and reliable. The surface subsidence can be effectively controlled by backfill mining whether a numerical simulation or physical simulation is adopted.
Comparison of surface subsidence between numerical simulation and physical simulation.
Conclusions
Through prediction of surface subsidence caused by mining activity of Coal 3# below the industrial square of Panji No.4 Coal Mine, caving mining causes IV-level damages to ground buildings, while backfill mining only causes I-level damages to ground buildings.
2. The maximum surface subsidence coefficient in backfill mining is 0.02 and the maximum surface subsidence value is 4.12% of that in caving mining. Paste filling can control overlying strata movement effectively and decrease surface subsidence significantly.
The front abutment pressure peak of working face is 28.31 MPa in caving mining and it is 17.82 MPa in backfill mining, which is only 62.95% of that in caving mining. The stress peak distance to coal wall decreases from 11.14 to 3.04 m. The strata pressure behaviors in paste backfill mining are relieved significantly compared with those in caving mining and the sphere of stress influence narrows.
Footnotes
Author contributions
All authors contributed to this paper. Zhihua Li prepared and edited the manuscript, Tingshuang Wei and Jianhua Miao provided technical guidance for the field. Ke Yang supports the funds needed for the publication of articles. Cheng Liu revised and reviewed the manuscript and processed the results of numerical simulation during the research process. Peng Zhou performed the physical simulation analysis.
Data availability
The data used to support the findings of this study are available from the corresponding author upon request.
Declaration of conflicting interests
The authors declared no potential conflicts of interest with respect to the research, authorship, and/or publication of this article.
Funding
The author disclosed receipt of the following financial support for the research, authorship, and/or publication of this article: This article was supported by the State Key Research Development Program of China (2019YFC1904304), the National Natural Science Foundation for Young Scientists of China (51604008), and the Institute of Energy, Hefei Comprehensive National Science Center (19KZS203).