
Abstract
Mine water disaster is closely related to the geological structure of the mine. A scientific evaluation of the complexity of the minefield structure can greatly contribute to mining safety. In this study, we optimized the fault impact index in the study area and proposed an improved local linear embedding (LLE) algorithm by investigating the Shengquan coal mine. We analyzed the fault formation age and connectivity between faults in the study area, combined with topology theory, and based on previous studies. The mechanical properties of faults and the influence of small faults on the strata can be combined to derive a quantitative evaluation model of the structural complexity of mines. Based on the evaluation model, the study area was divided into a simple structural area, a medium structural area, and a complex structural area. By comparing the location of water inrush points in recent years with the three-dimensional high-density electrical exploration of the 21,304 working face, the effectiveness and rationality of structural complexity zoning were determined.
Keywords
Introduction
North China-type coalfields are one of the key coal-producing areas in China (Kang et al., 2014; Ma et al., 2020). The geological structure in this area is complex, and the fault structures are well-developed. According to incomplete statistics, more than 75% of water disasters associated with the mining of North China-type coalfields are closely related to fault structures (Wang, 2016). The complexity of fault structures can reflect the extent to which a region is cut and destroyed by faults (Zhou, 2013). Therefore, evaluating the complexity of fault structures (Fu et al., 2022a, 2022b) can contribute to guiding mine safety production (Singh, 1986).
The core of the quantitative evaluation of the structural complexity of a mine lies in two aspects, i.e. evaluation index and evaluation model (Mohamed et al., 2021). Studies on the quantitative assessment of the structural complexity of mines have found excellent results. Xu Zhibin (Xu et al., 1996) used fractal dimensions to quantitatively evaluate the complexity of coal mine fault networks. Shi Longqing (Shi et al., 2018) introduced the fault influence factor based on the fault strength index. To quantitatively evaluate the structural complexity, Chen and Yao (Chen et al., 2010) used the grey fuzzy comprehensive evaluation method. Shu Jiansheng (Shu et al., 2010) used the grey correlation analysis method and the equal block complete index evaluation method to quantitatively assess and classify the complexity of the structure of mines. However, in these studies, the evaluation indices often disregard the basic nature of the formation age of the fault. The water-bearing capacity and conducting capacity of the fault are very different in different formation ages.
This study was conducted in the west of the Tanlu fault zone, which is a part of the Luxi block. After deposition ended in the early Permian, it was compressed in the near north-south direction and subjected to uplift and denudation in the Triassic. The nearly east-west and northwest thrust fold system was formed, and the intermountain compression depression basin was developed. During the early Jurassic, the crust and lithosphere thickened as the north-south compression in the early stage expanded laterally due to gravitational instability, resulting in North-South extensional activities and many low and medium-angle shovel normal faults. Since the Paleogene, the Pacific plate has been obliquely subducted to the northwest, giving rise to many high-angle normal faults, which are widely developed in this region. Among them, NE trending faults started moving, which together with NW trending faults near EW trending faults, controlled the crustal extension of the Luxi block in this period. The direction of extension changed from early near SN to NW-SE. Rift basins developed with high-angle normal faults as basin-controlling structures.
Taking the Shengquan coal mine as an example, we used the feature vector weighting method based on nonlinear correlation in this study to comprehensively determine the weight of each main control factor of the structural complexity of mines. Our findings might help in quantitatively evaluating the structural complexity of mines and provide a theoretical basis for predicting the risk of fault water inrush in mines.
Overview and methods
Overview of the study area
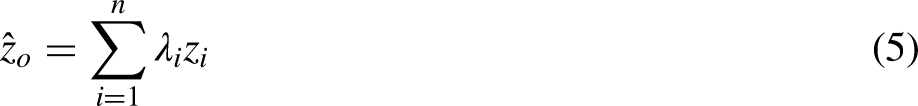
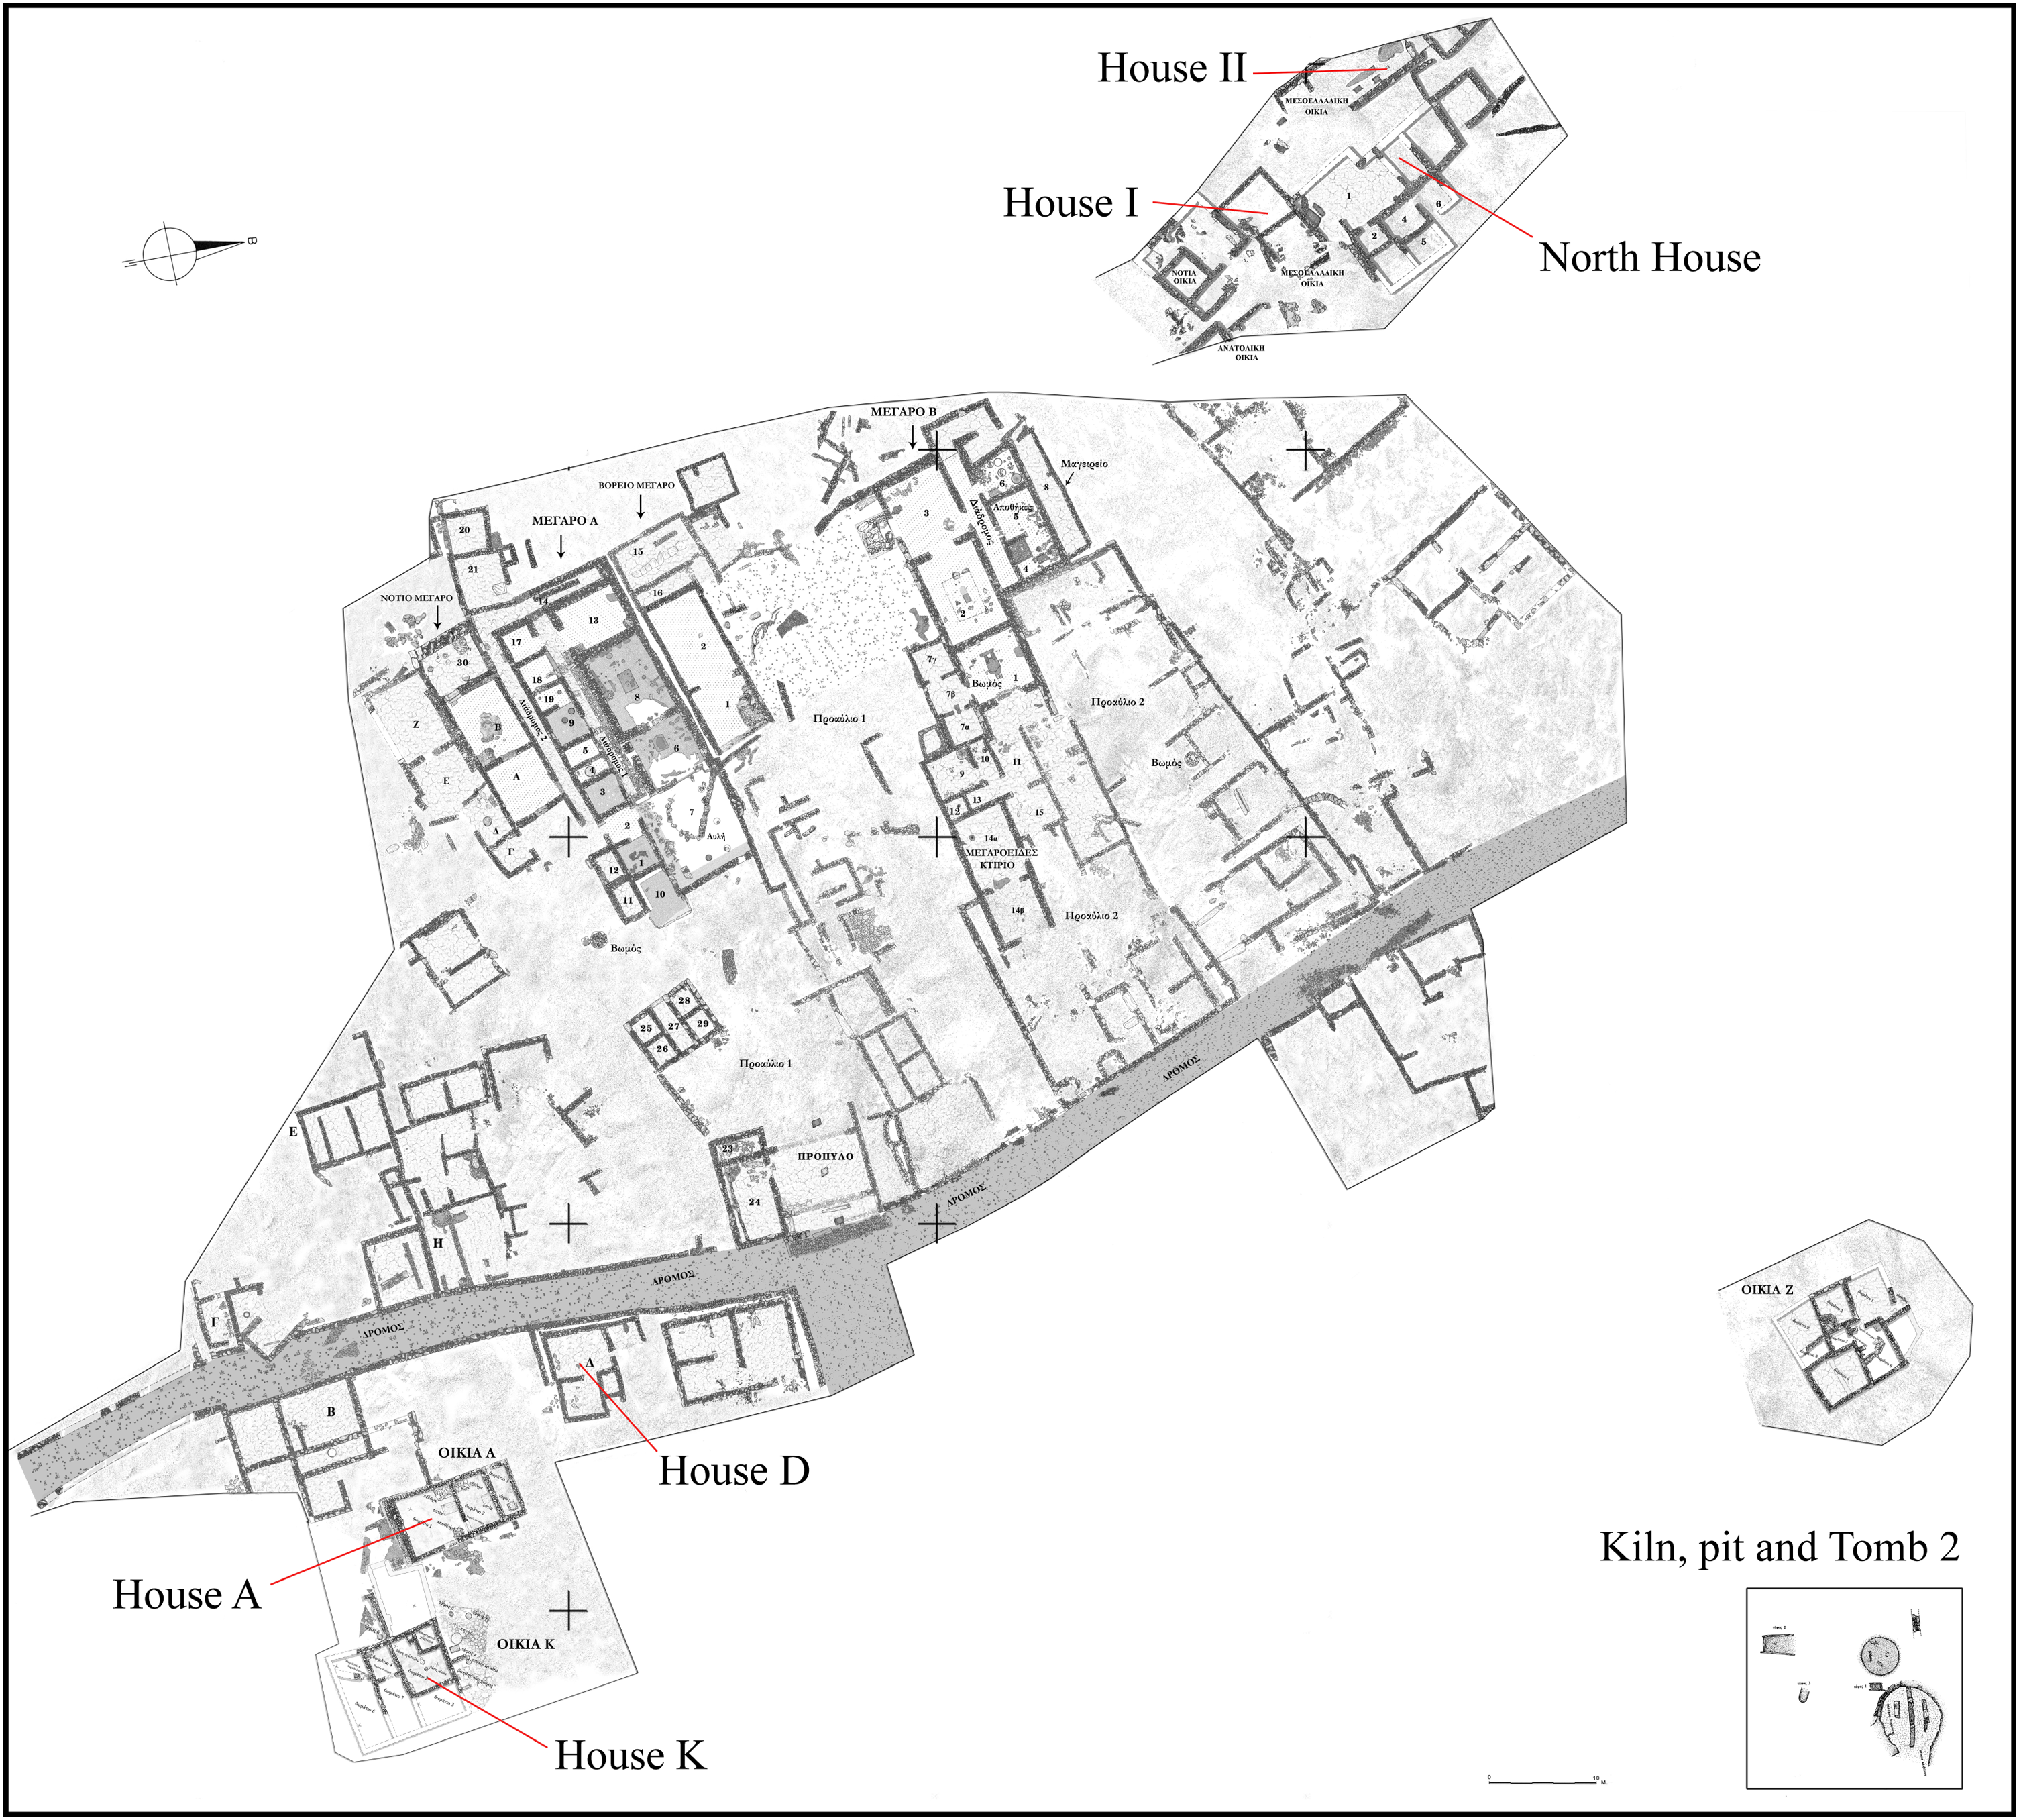
Shengquan coal mine is located in the north wing of Xinwen coalfield Syncline in Quangou Town, Xintai City, Shandong Province. The mine is a wide and gentle anticline structure dipping to the south. The anticline axis is close to the north-south, and the coal seam is curved to the south, with a strike of N30°W to N30°E. The fault structure is well-developed in the minefield, cutting the anticline into several fault blocks of different sizes (Figure 1).
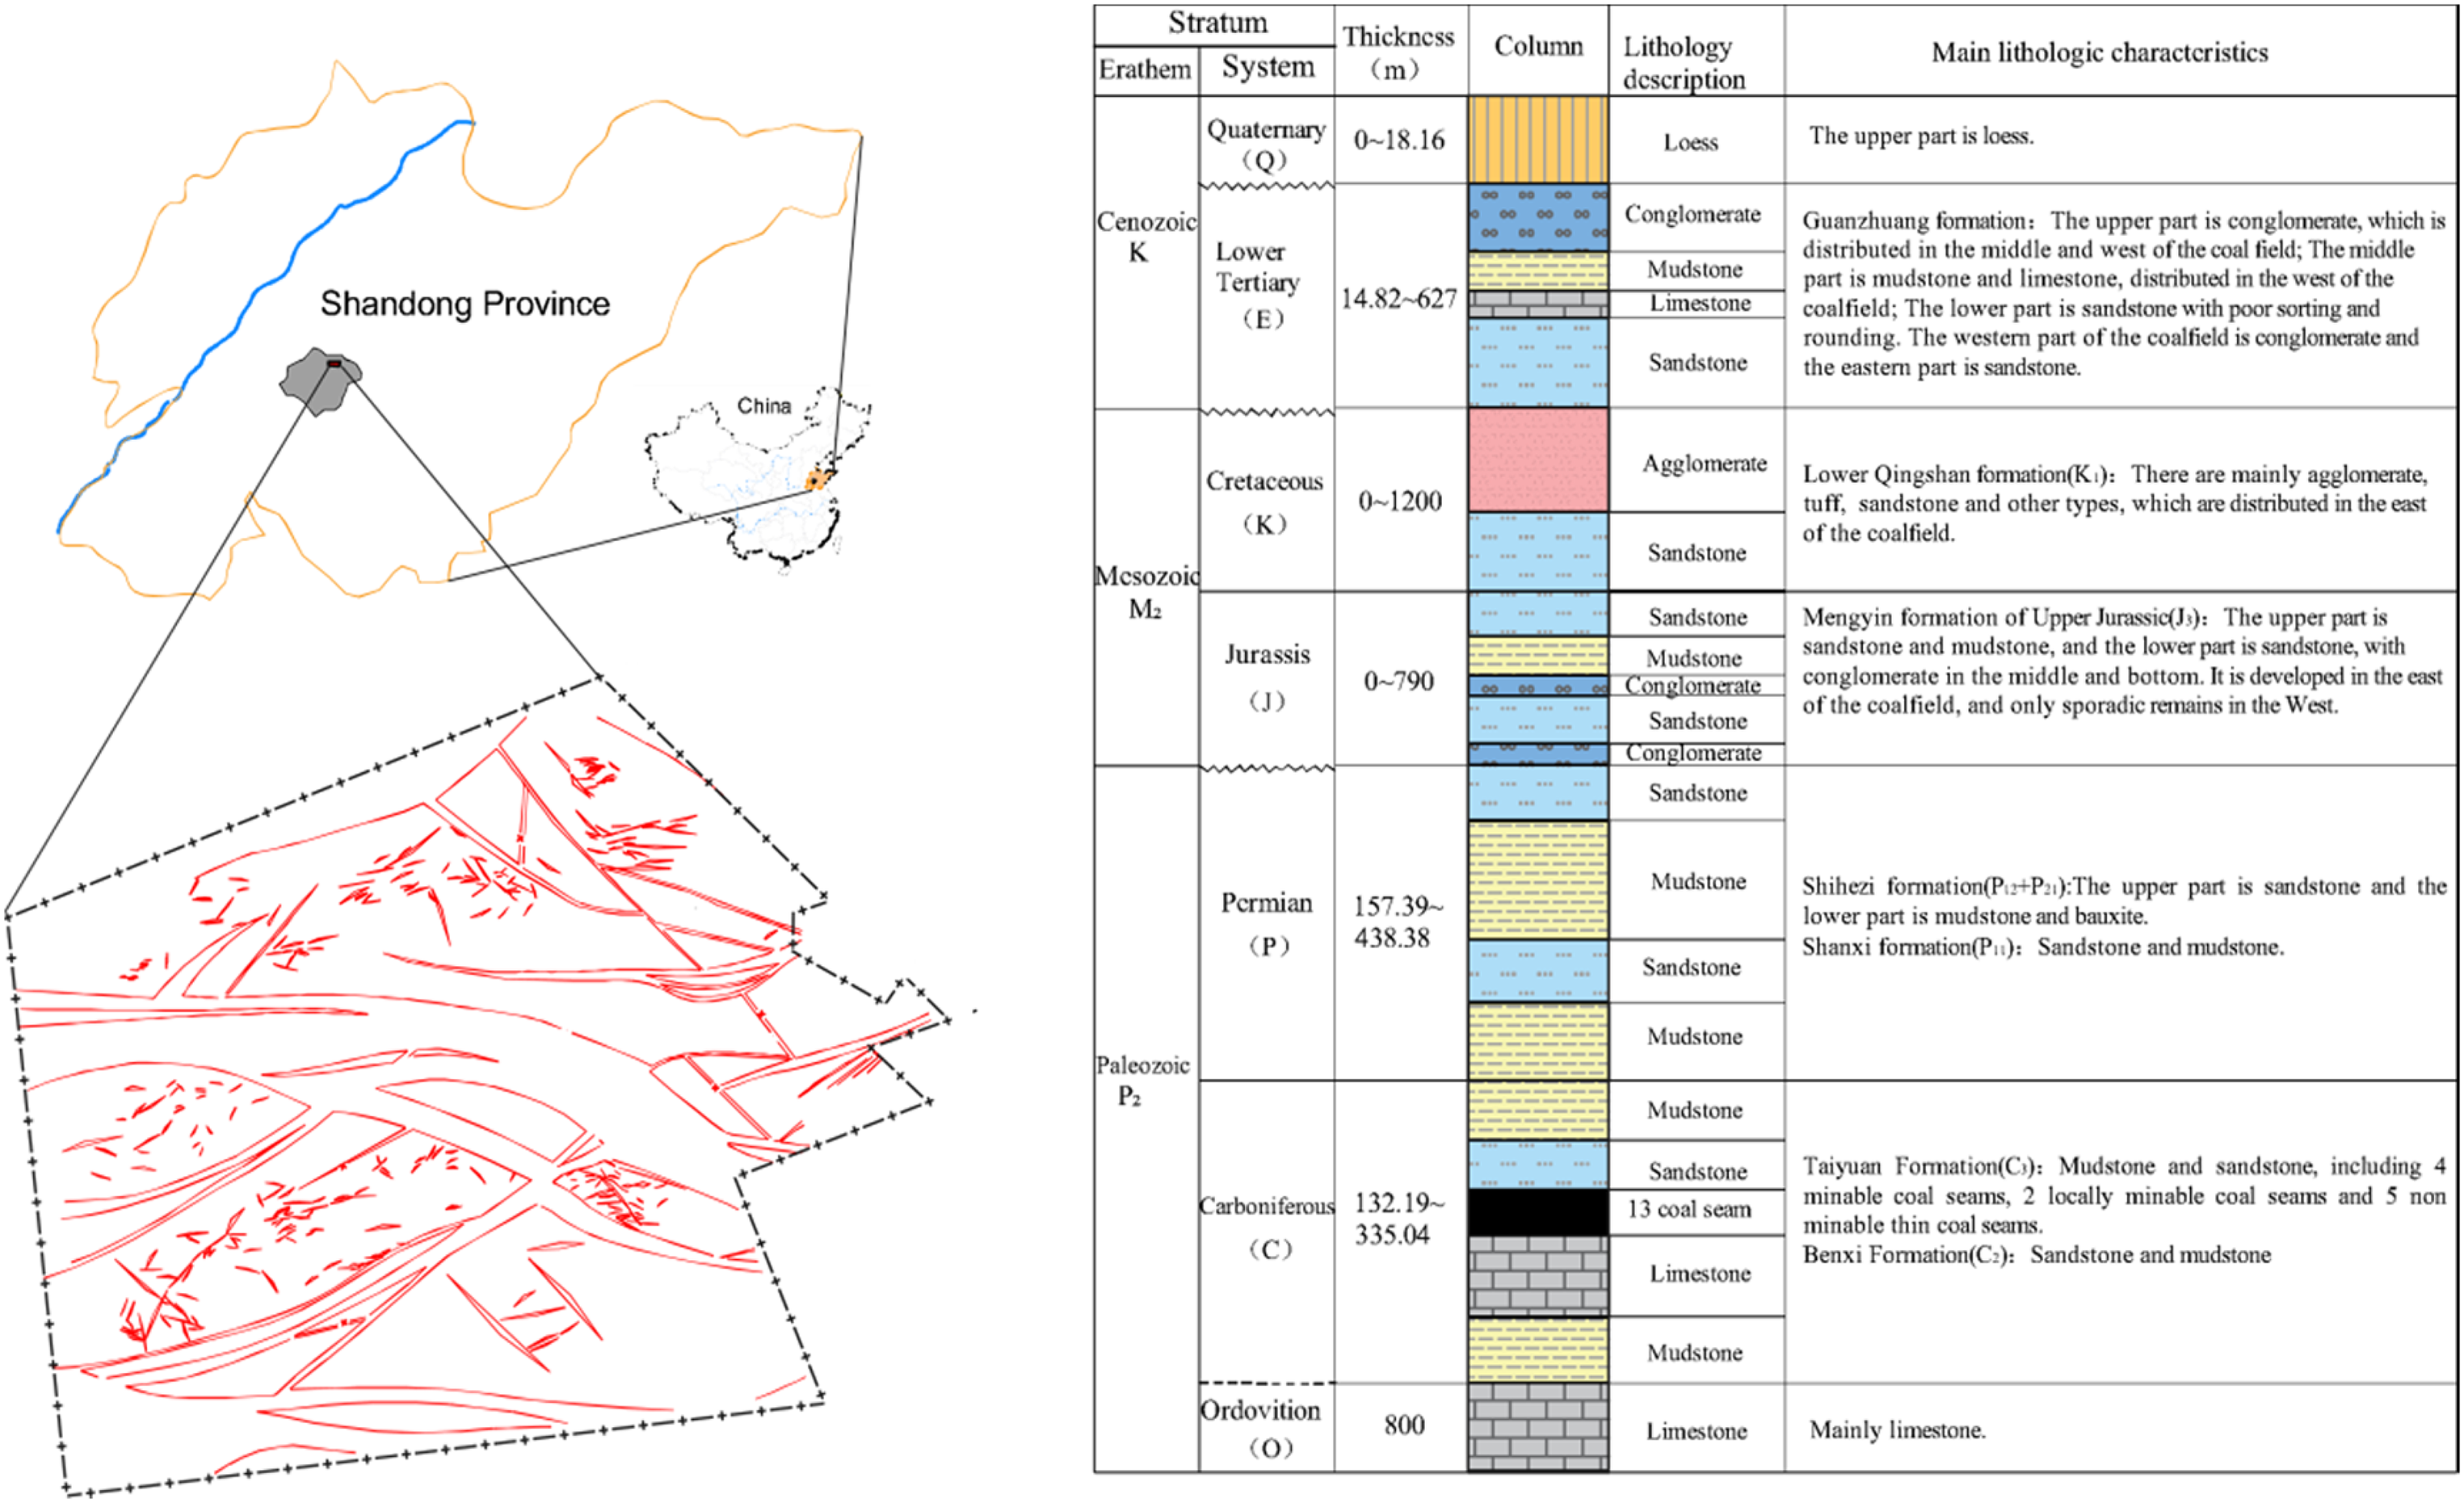
Outline of the regional structure of the Shengquan coal mine.
From top to bottom, the strata in the area comprise the Quaternary system, lower Tertiary system, Cretaceous system, Jurassic system, Permian system, Carboniferous system, and Ordovician system. Shanxi formation of the Lower-Permian system and Taiyuan Formation of the Upper Carboniferous system are the primary coal-bearing strata. The Shanxi formation is 65.31–91.80 m thick, with an average of 77.59 m. The Taiyuan formation is bounded by fine sandstone about 10 m below the floor of coal seam 4. The lithology consists of gray-white medium-fine sandstone, light gray siltstone, gray and dark gray mudstone, and coal seam. Four coal-bearing layers and two minable layers are present; Taiyuan formation, 162.00–192.80 m thick, with an average thickness of 183.61 m.
The internal structure of the coalfield is relatively complex, and overall, it has a wide and gentle anticline structure dipping to the south. There are 23 main faults, divided into the near East-West strike fault group, northeast oblique fault group, and northwest oblique fault group. The near East-West trending fault group controls the minefield, followed by the NE fault group. The NW trending fault group has a negligible impact on the minefield. Due to the difference in formation time, the primary faults in the study area are staggered, and the small faults are distributed around the large faults. This breaks the stratum and increases structural complexity and the possibility of interconnection between faults. The minefield structure type is complex.
Grey correlation algorithm
The grey correlation algorithm (GRA) was proposed by Professor Deng Julong. It is a mathematical method for evaluating the nonlinear correlation between variables (Yazdani et al., 2019). This method uses the grey system theory and grey-weighted correlation degree to evaluate the geometric similarity between different variable curves. The specific steps for analyzing the data are as follows:
Step 1: Determining the sequence of grey correlation analysis.
There are two different types of grey correlation analysis series. One is the reference series, which is the data sequence reflecting the behavioral characteristics of the system and the evaluation standard of the grey correlation system; the second is the comparison sequence, which is the data sequence of factors affecting the behavioral characteristics of the system and the evaluation object of the grey correlation system. The reference sequence can be expressed as
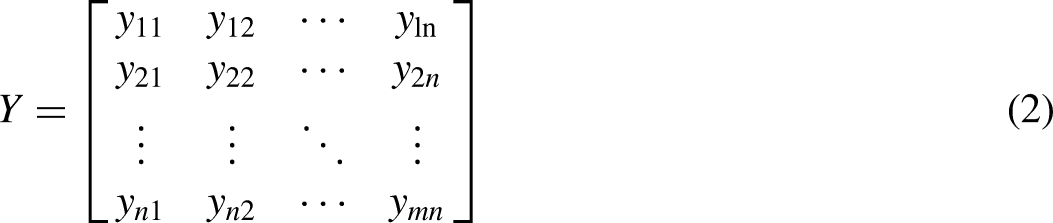
Step 2: Establishing the comparison matrix of evaluation objects.
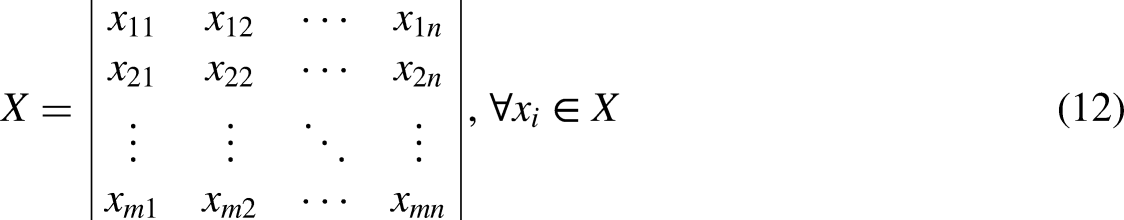
To ensure that the results of the comprehensive evaluation are reliable, the evaluation object needs to be dimensionless before the analysis, and then, the evaluation object discrimination matrix is established.
The comparison sequence
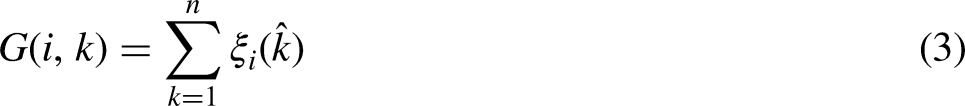
The grey correlation degree indicates the mean value of the correlation coefficient between each evaluation object and the corresponding elements of the reference sequence to reflect the correlation between each evaluation object and the reference sequence. The value of the correlation degree between the comparison series and the reference series at different positions is indicated by the grey correlation coefficient. The grey correlation degree can be calculated using the following equations:

Local spatial difference algorithm
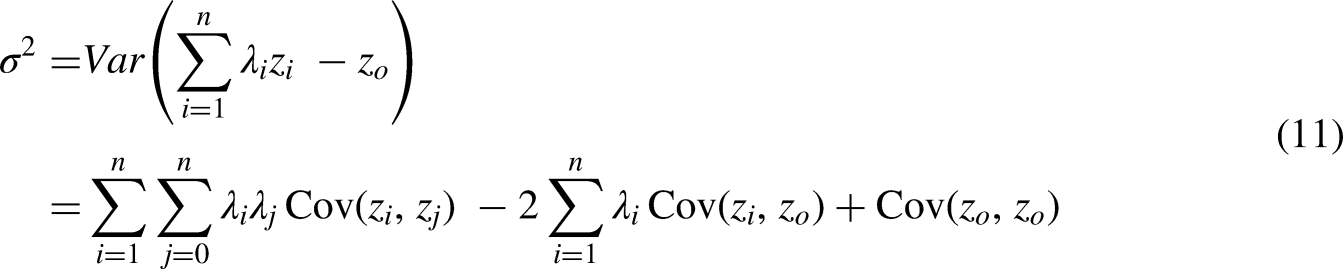
The local spatial difference algorithm uses the existing original data as the basis and the covariance function as the tool to perform linear unbiased (the expectation of deviation is zero) optimal prediction (the sum of squares between the predicted value and the measured value is the smallest) (Castaing et al., 1996). The size, shape, and spatial orientation of known points and the spatial relationship between them are considered. It is suitable for the datasets of the spatial correlation of regional variables.
Assuming that there is a discrete point


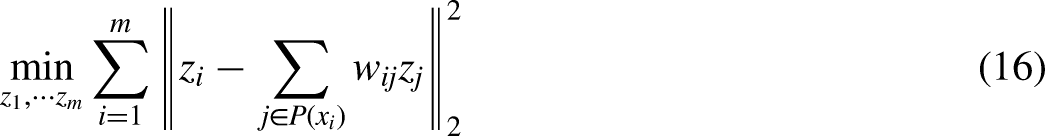
Local linear embedding algorithm
The LLE algorithm is a nonlinear dimensionality reduction algorithm used for optimizing the dimension of the nonlinear index feature vector. This algorithm can extract the eigenvalues of the data twice, map the high-dimensional data to the low-dimensional space, and maintain the original topology of the data after dimensionality reduction (Gong et al., 2020). LLE algorithm assumes a neighborhood
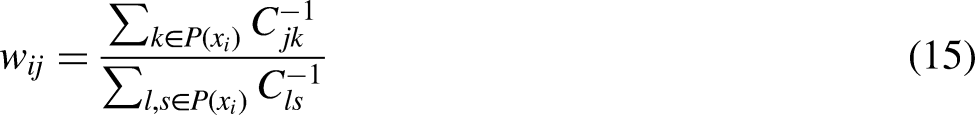
Step 1: To calculate the neighborhood


Influencing factors of fault hydraulic conductivity
Tectonic stress is the primary cause of the stratum’s uplift, deformation, fracture, and other movements. The faults formed by different tectonic movements are similar and have similar distribution laws and combination forms. The faults in the region have obvious zoning under the control of the tectonic stress field (Buttinelli et al., 2021). These faults also have certain randomness due to different conditions of the medium (rock stratum). Therefore, the most effective evaluation method involves dividing the large-scale study area into several small areas and blocks, evaluating the small sections, and then making a global evaluation from small and large. Considering the geological, structural, and hydrogeological data of the minefield, we comprehensively analyzed the water-bearing capacity of the structure in the minefield based on four aspects, including the age of fault formation, the relationship between fault-cutting, the nature of the fault, and the topological structure relationship between faults. We applied the algorithm to organically integrate them to evaluate the structural risk in the minefield.
Age of fault formation
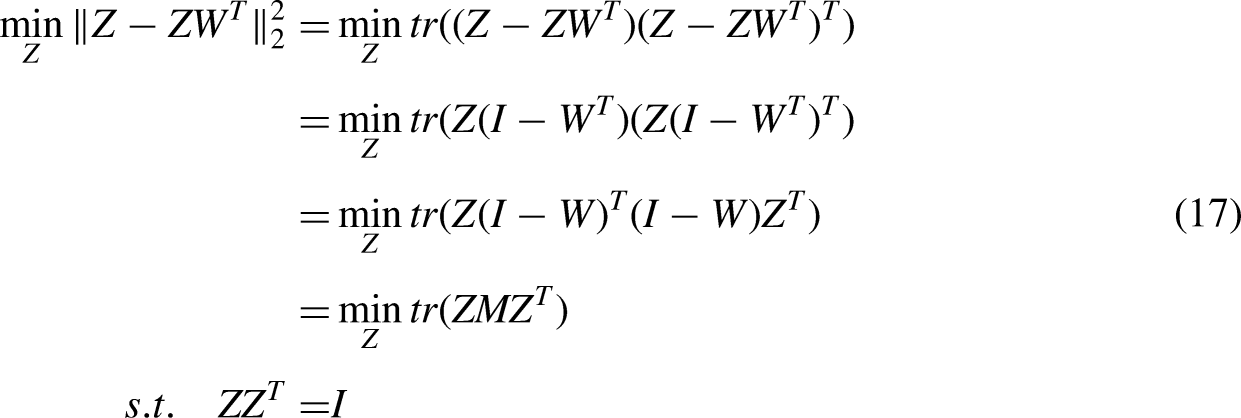
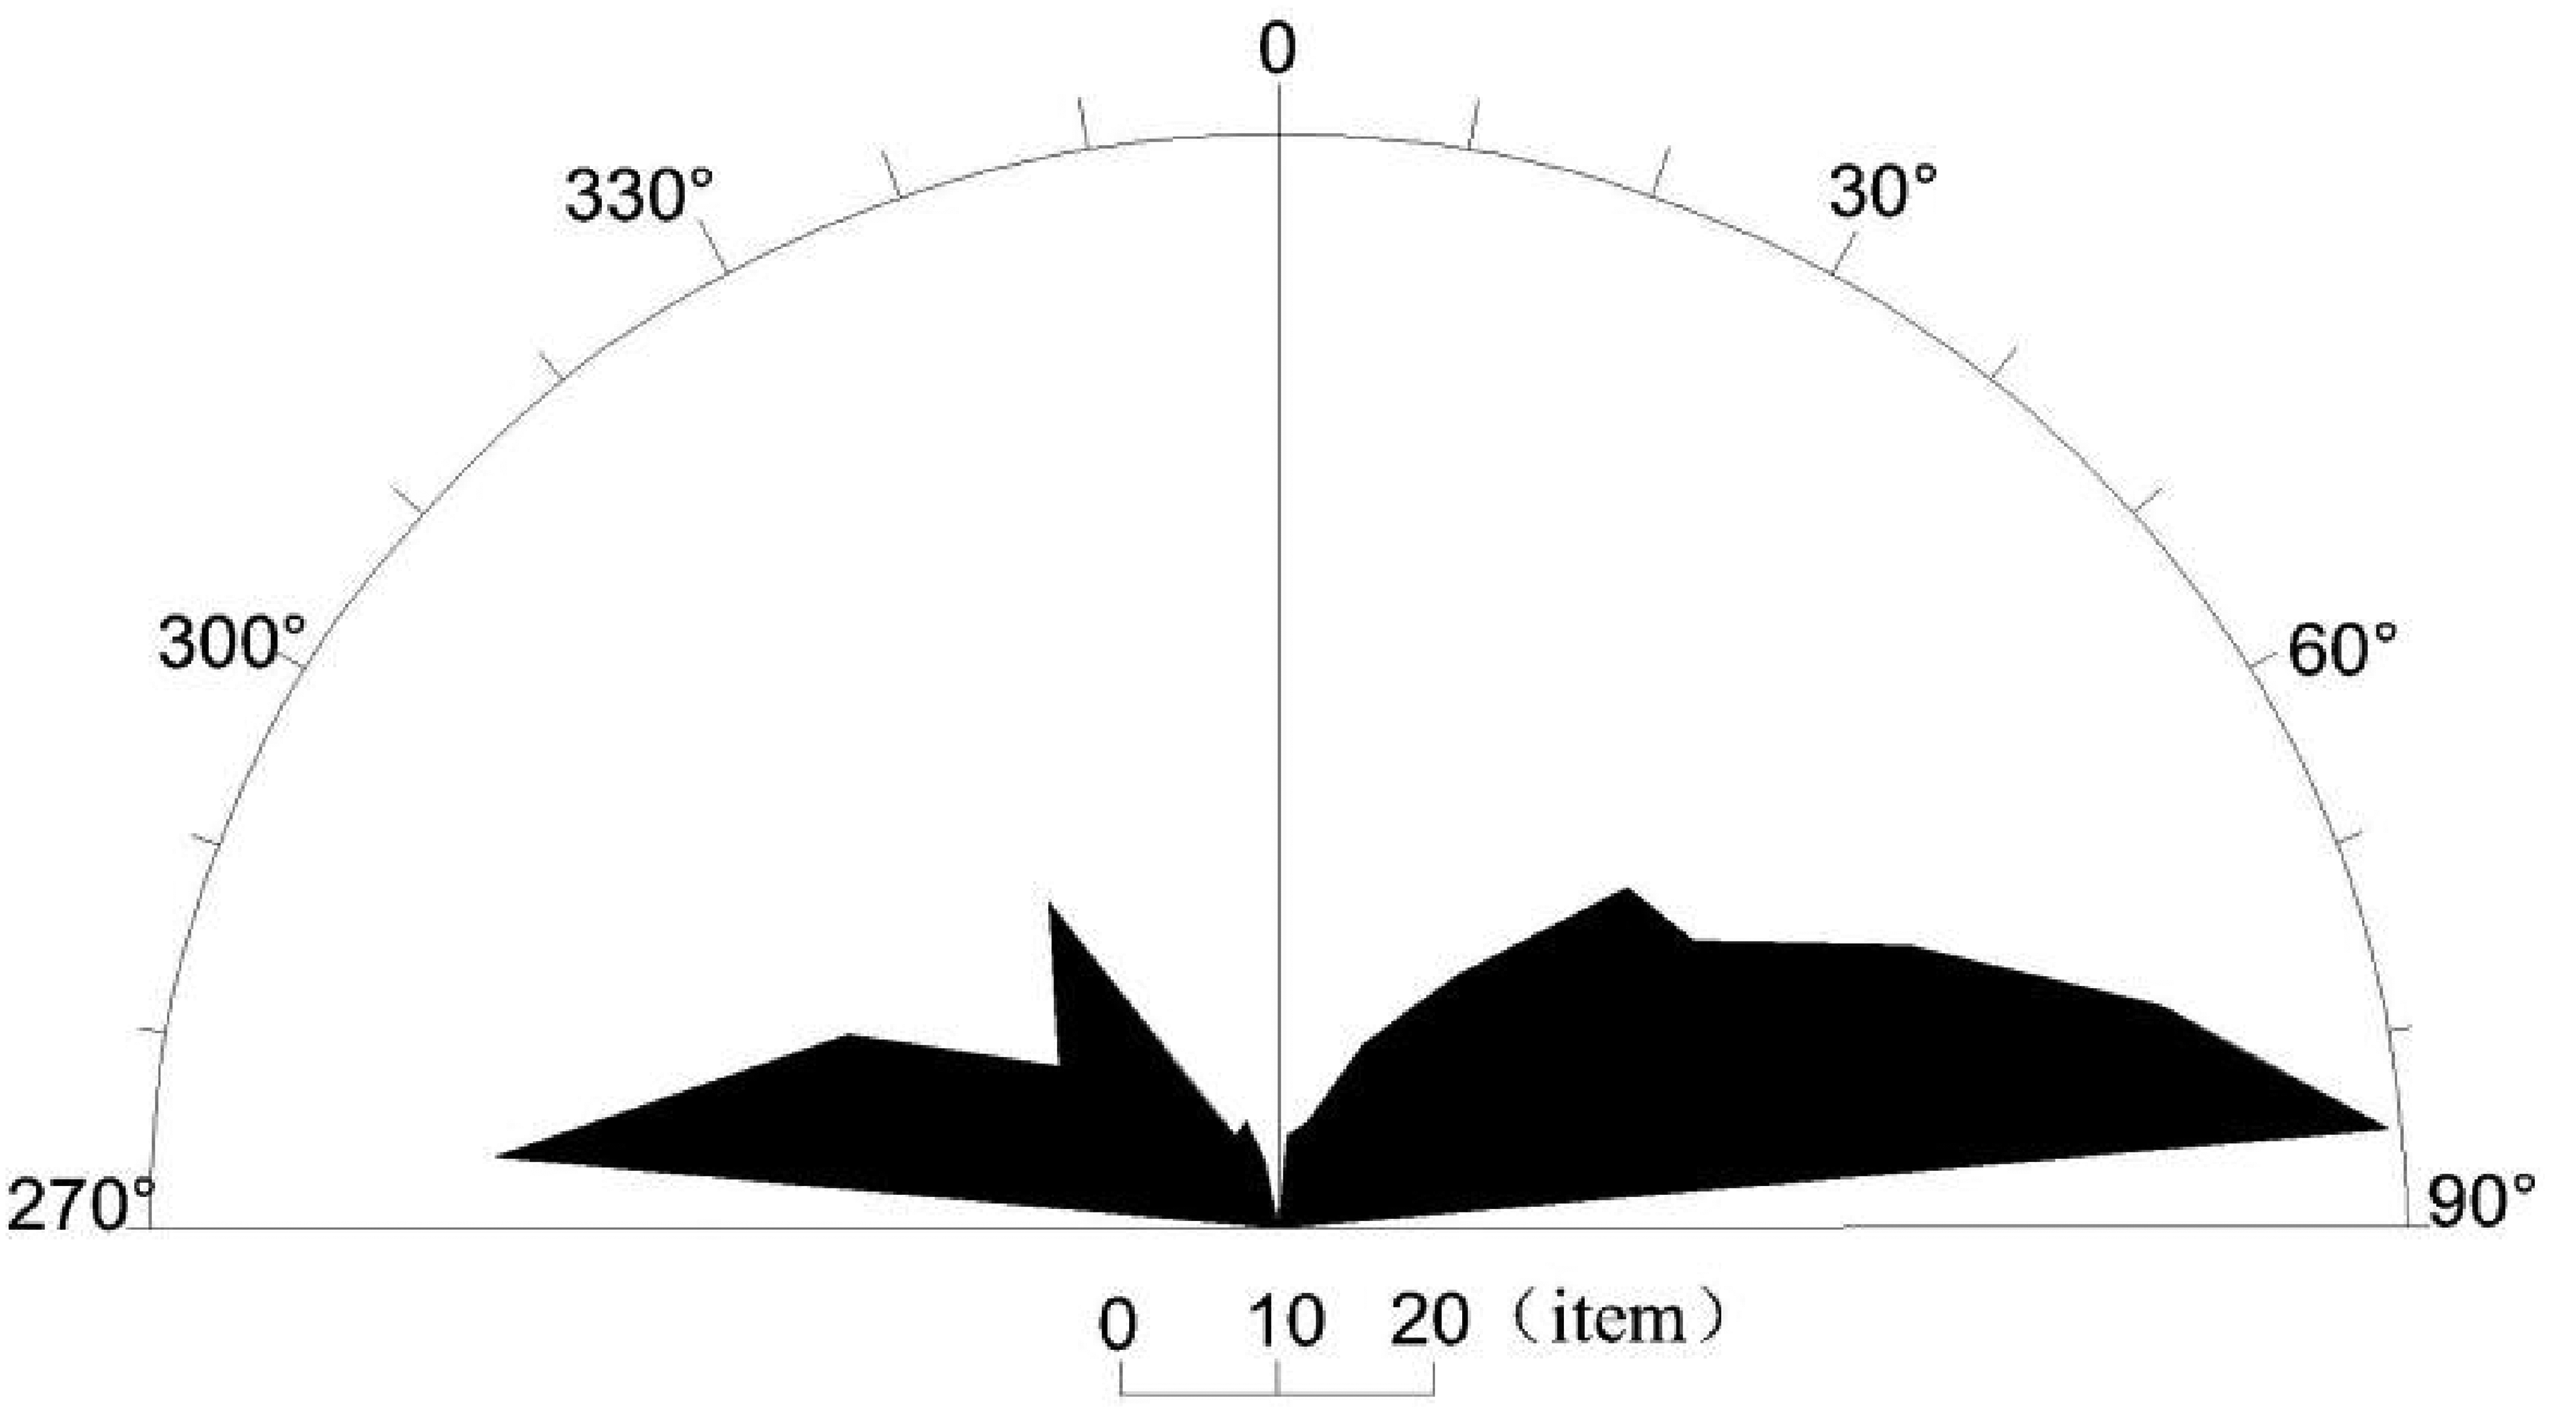
A fault has its evolutionary history, and its activity characteristics are different at different stages. Faults that form earlier have better cementation degree on their surface but lower water-bearing (conducting) capacity. In contrast, faults that form later have a better personality and connectivity between faults, lesser filling, poorer cementation on their surface, and higher water-bearing (conducting) capacity. Faults in different formation periods are produced under the action of structural stress in different directions, and thus, they have distinct occurrences (Fu et al., 2022a, 2022b). In this study, the occurrence of all strata in the study area was recorded and counted; the fault rose map of the study area was made (Figure 2), and the age of formation of the fault was estimated and divided (Table 1). Among them, the faults formed by Mesozoic and pre-Mesozoic tectonic movements, such as the Indosinian movement and Yanshan movement, were defined as “old” faults, the faults formed by Himalayan movement from Cenozoic to Holocene were defined as “middle” faults, and the faults formed after Holocene were defined as “new” faults.
Fault map of the study area.
Data of the fault formation period.
Owing to the differences in the water-bearing (conducting) capacity between the faults in different formation times, and based on the actual field experience and expert opinions, the water-bearing coefficient
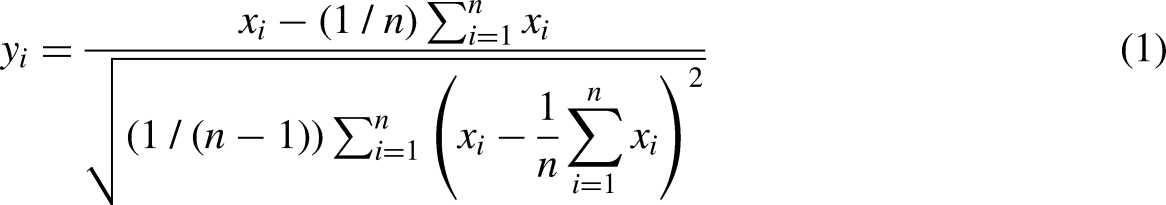
According to studies, fault density is the chief index to judge the complexity of faults in an area. It can intuitively reflect the number of faults within a certain range but cannot distinguish different water-bearing capacities and conductivity of the faults. In this study, the organic integration of the water-bearing (conductivity) coefficient and density of faults (equation 1) was performed to accurately determine the complexity of faults in a certain area.
Fault-cutting relationship
Due to the influence of multi-stage tectonic movement in the study area, a cutting relationship between faults is often found, where the new fault cuts the old fault. New tectonic stress transforms the old fault formed under the original tectonic stress system in different directions, which activates the originally closed fault or further crushes the original fractured rock mass, forming excellent water-bearing space (Figure 3).
Schematic representation of fault activation.
The staggered faults also strengthen the connection between different water conservancy units, which increases the ease of forming the dominant water inrush channel. The pinch-out fault of the stope roof communicates with the mining fracture, which also increases the ease of forming the dominant channel of mine water inrush. The fault pinch-out point and intersection density refer to the number of fault pinch points or intersections per unit area. It can be used to determine the connectivity between the faults, assess the influence of tectonic stress on the stratum when the fault is formed, and examine the fractured state of the stratum in a certain area. The fault pinch-out point can be calculated using equation (19).
Fault self-property
Structural faults control water but might not contain water. Only when the fault is tensile and has a certain scale extension length and depth (drop) can it have a certain reservoir space.
Due to the different nature of the stratum and the difference in tectonic stress during formation, the degree of damage to different strata is different, and significant differences occur in the water-bearing and hydraulic conductivity. The fall and extension length of the fault is determined by the physicochemical properties of the stratum and the strength of tectonic stress. It is also the specific manifestation of the impact of tectonic movement on the stratum. Therefore, based on the fall and extension length of the fault, the hydraulic conductivity of the fault and the degree of stratum fragmentation around the fault zone can be evaluated more accurately. The fault strength index is defined as the sum of the extension length of all faults in the unit area and their drop (equation (20)), which can objectively reflect the comprehensive complexity of fault drop and the horizontal extension length of the faults.
Topological relationship between the faults
According to the fractal theory in mathematics, the whole and part of all natural objects have statistical similarities in morphology, information, and space (Zhao et al., 2019). Assuming that a geometric object has D dimensions, N original geometries can be obtained by increasing each dimension P times.
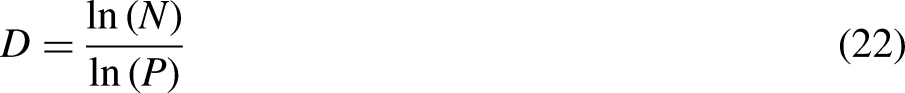

The fault fractal dimension value is a comprehensive index that reflects the degree of development of fault structures and their influence on the surrounding strata (Zhang et al., 2021). To calculate the fault fractal dimension of the mine area, the block classification method was used. First, the study area was divided into n square blocks with side length 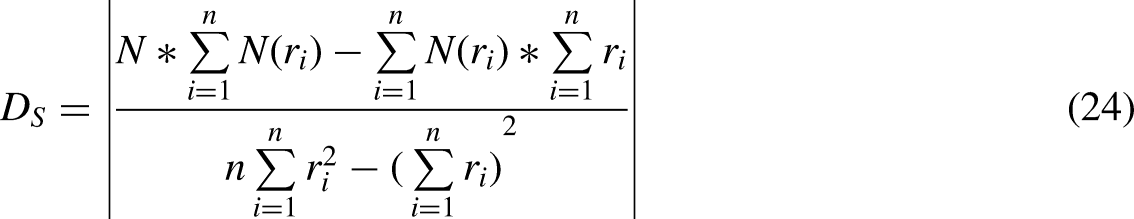
Discussion
Exploratory data analysis of the fault complexity impact Index
Exploratory data analysis was performed for constructing all other mathematical models. Exploratory analysis of quantitative fault indicators refers to the data-level analysis of different model indicators. It helps in evaluating the correlations and differences between indicators to facilitate the accurate evaluation of the overall goal.
Data correlation refers to the difference and connection between different kinds of data. Using mathematical geology, different indicators are selected to extract and collect information on the faults in the study area, perform correlation analysis, and understand the covariant trend between data, which is crucial for selecting an appropriate fusion algorithm.
The fluctuation intensity analysis diagram of all collected data in the study area is shown in Figure 4. Similar fluctuations can be seen among the indicators. Therefore, two correlation analysis methods, including Pearson's correlation coefficient (PCC) and GRA, were used to analyze different fault indicators.
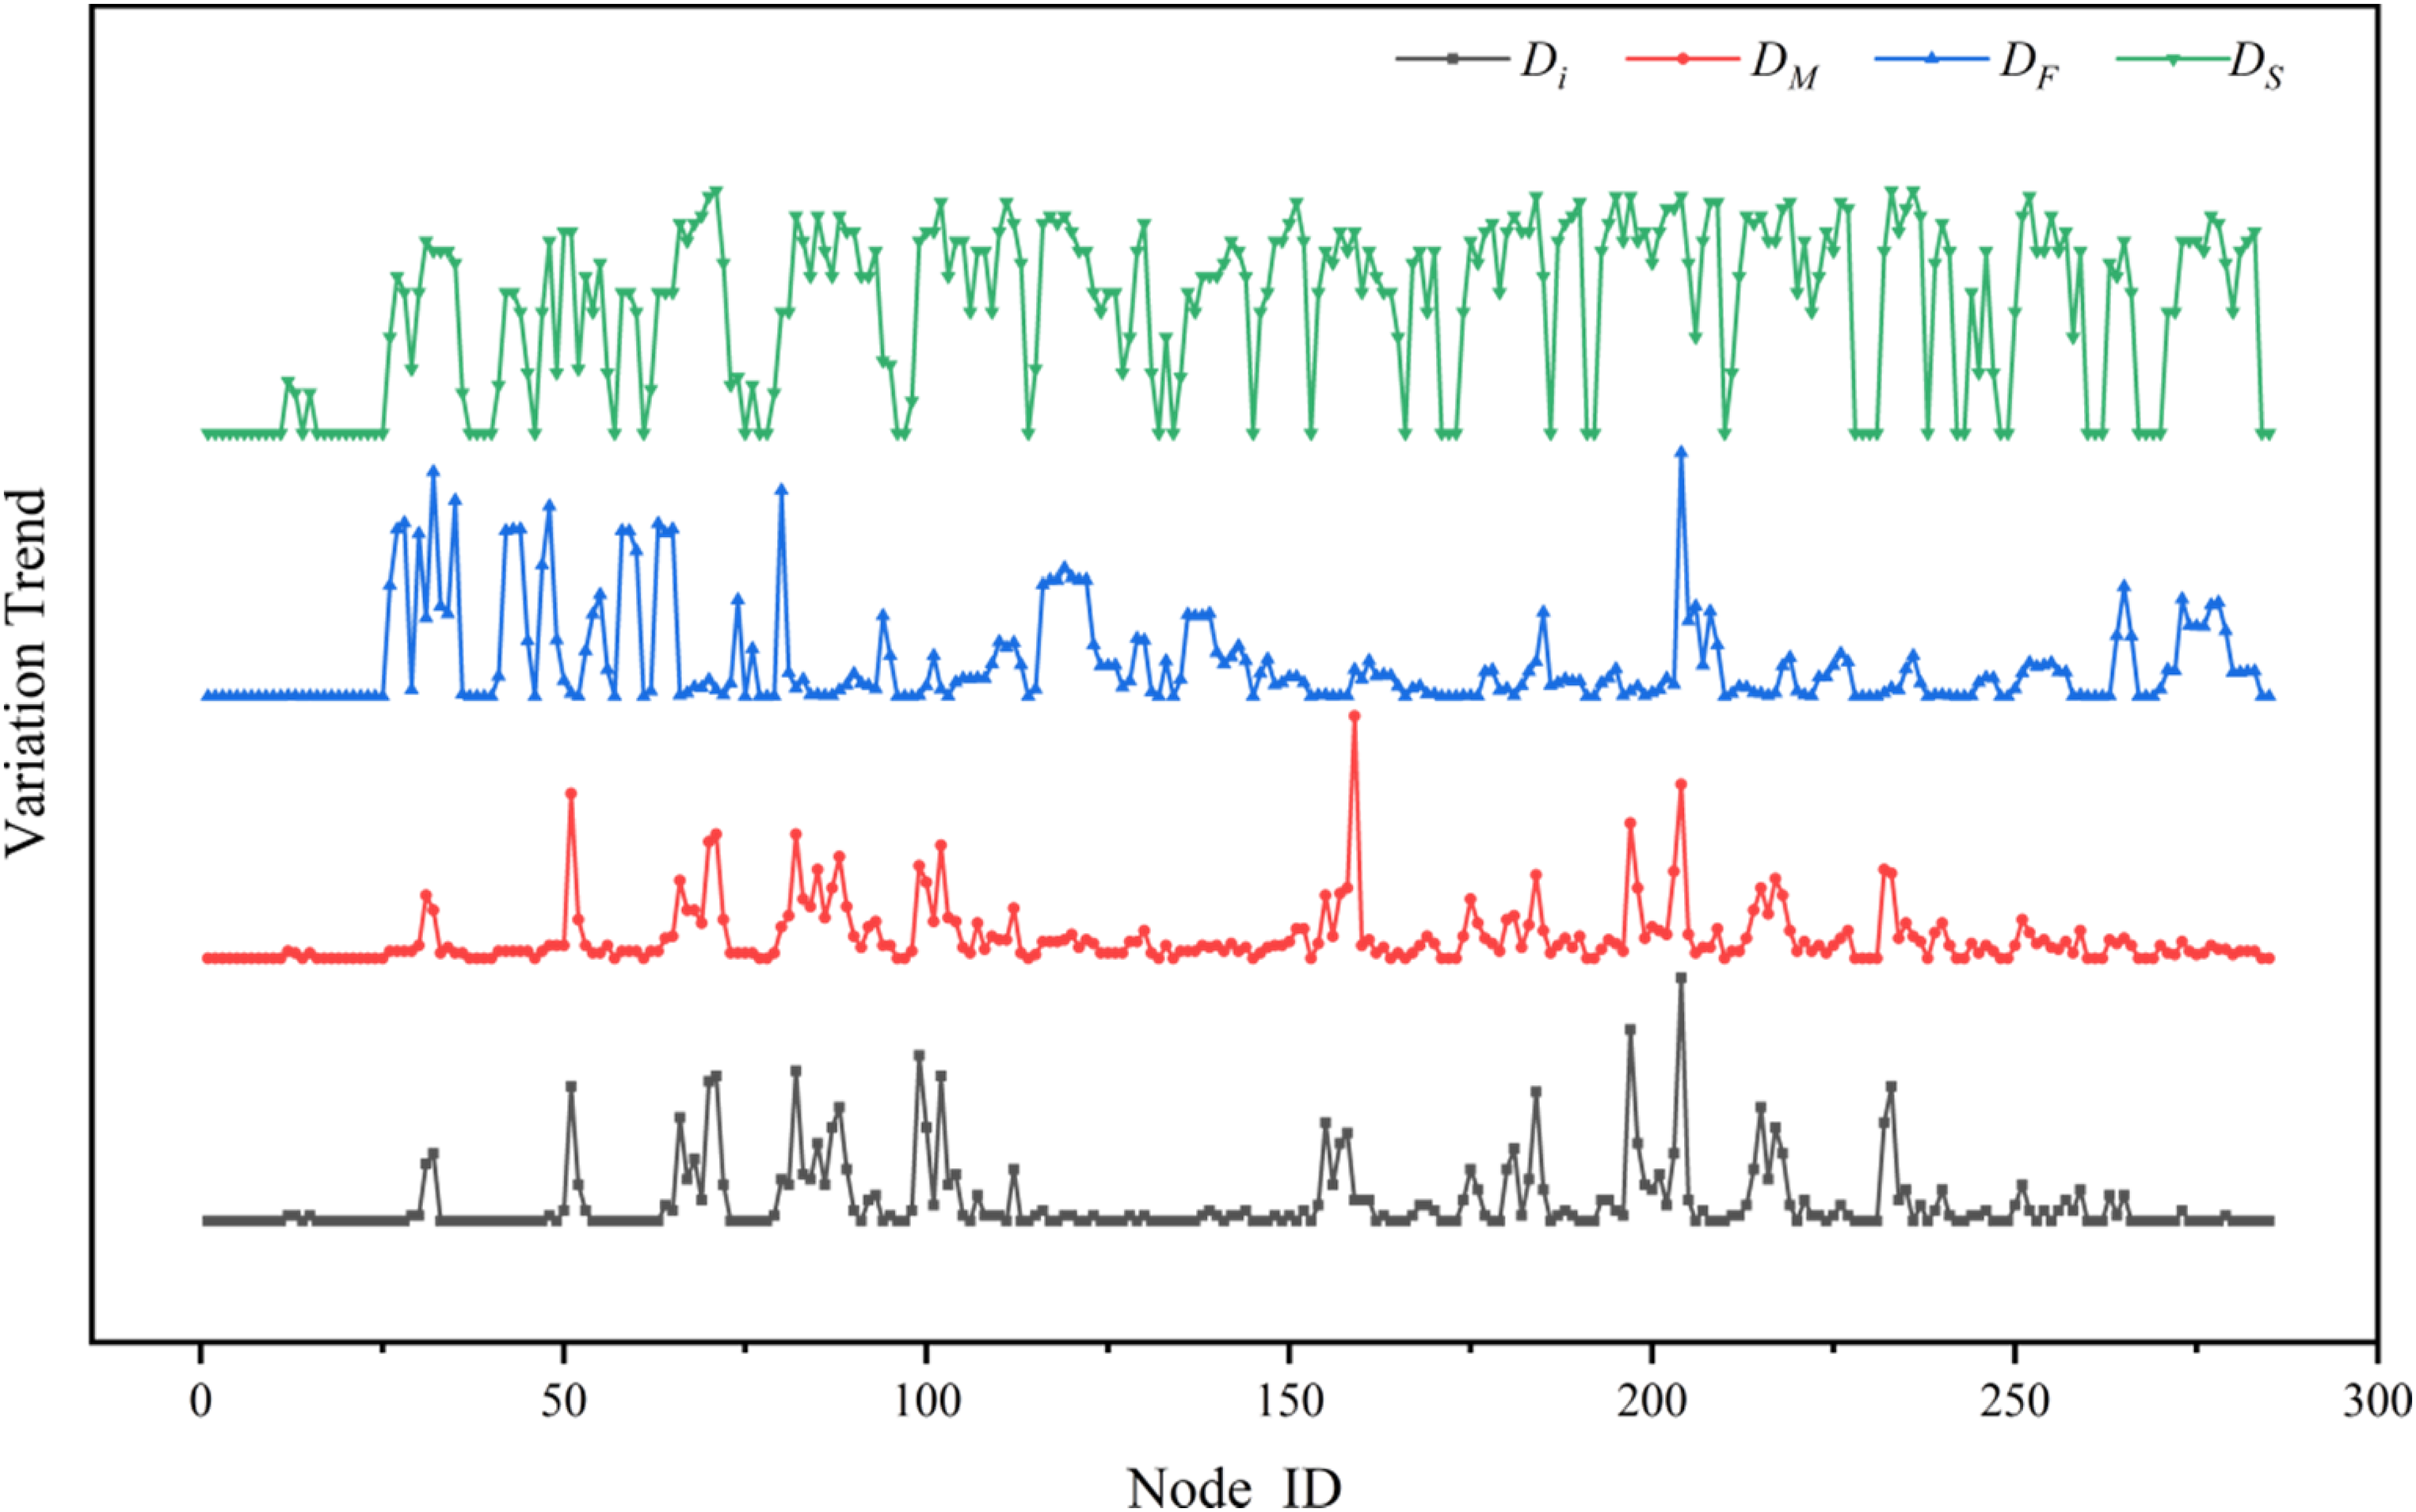
Fluctuation intensity analysis of the factors that influenced the faults in the Shengquan minefield.
In natural science, PCC method is the most widely used method to analyze the linear correlation between variables. The PCC between different X and Y variables is defined as the quotient of covariance and standard deviation between variables (equation (25)).
The data on the factors that influence faults include a group of continuous fluctuation curves, but PCC can only represent the linear correlation between variables and cannot represent the nonlinear correlation of curves. Therefore, the grey correlation coefficient was used to determine the similarities between different types of logging curves for evaluating nonlinear correlations between curves.
As shown in Figure 7, the correlation between the data was calculated using equations (4) and (5), and a heat map was constructed for the correlation analysis of the factors that influenced the faults in the Shengquan minefield.
As shown in Figure 5, PCCS and the GRA between
Correlation analysis of the factors that influenced the faults in the Shengquan minefield.
Single-factor analysis of fault complexity
Various methods are used to evaluate the fault complexity in the study area of data statistics. The values obtained by different index acquisition methods are distributed in different discrete points in the study area. According to the first law of geography, a spatial correlation occurs between various physical attributes in geography. Things that are located closer spatial have a higher similarity than those that are farther. To address this, the data of all known coordinate points in space are used to estimate the data of unknown coordinate points. To observe the overall fault development trend in the study area, the coordinates between different indicators are unified, and the information fusion analysis is performed. The spatial local interpolation method (Kriging) is used to optimally predict the changing trend of the overall fault complexity in the study area based on structural analysis and covariance function.
In this study, the discrete point
The distribution map of the study area
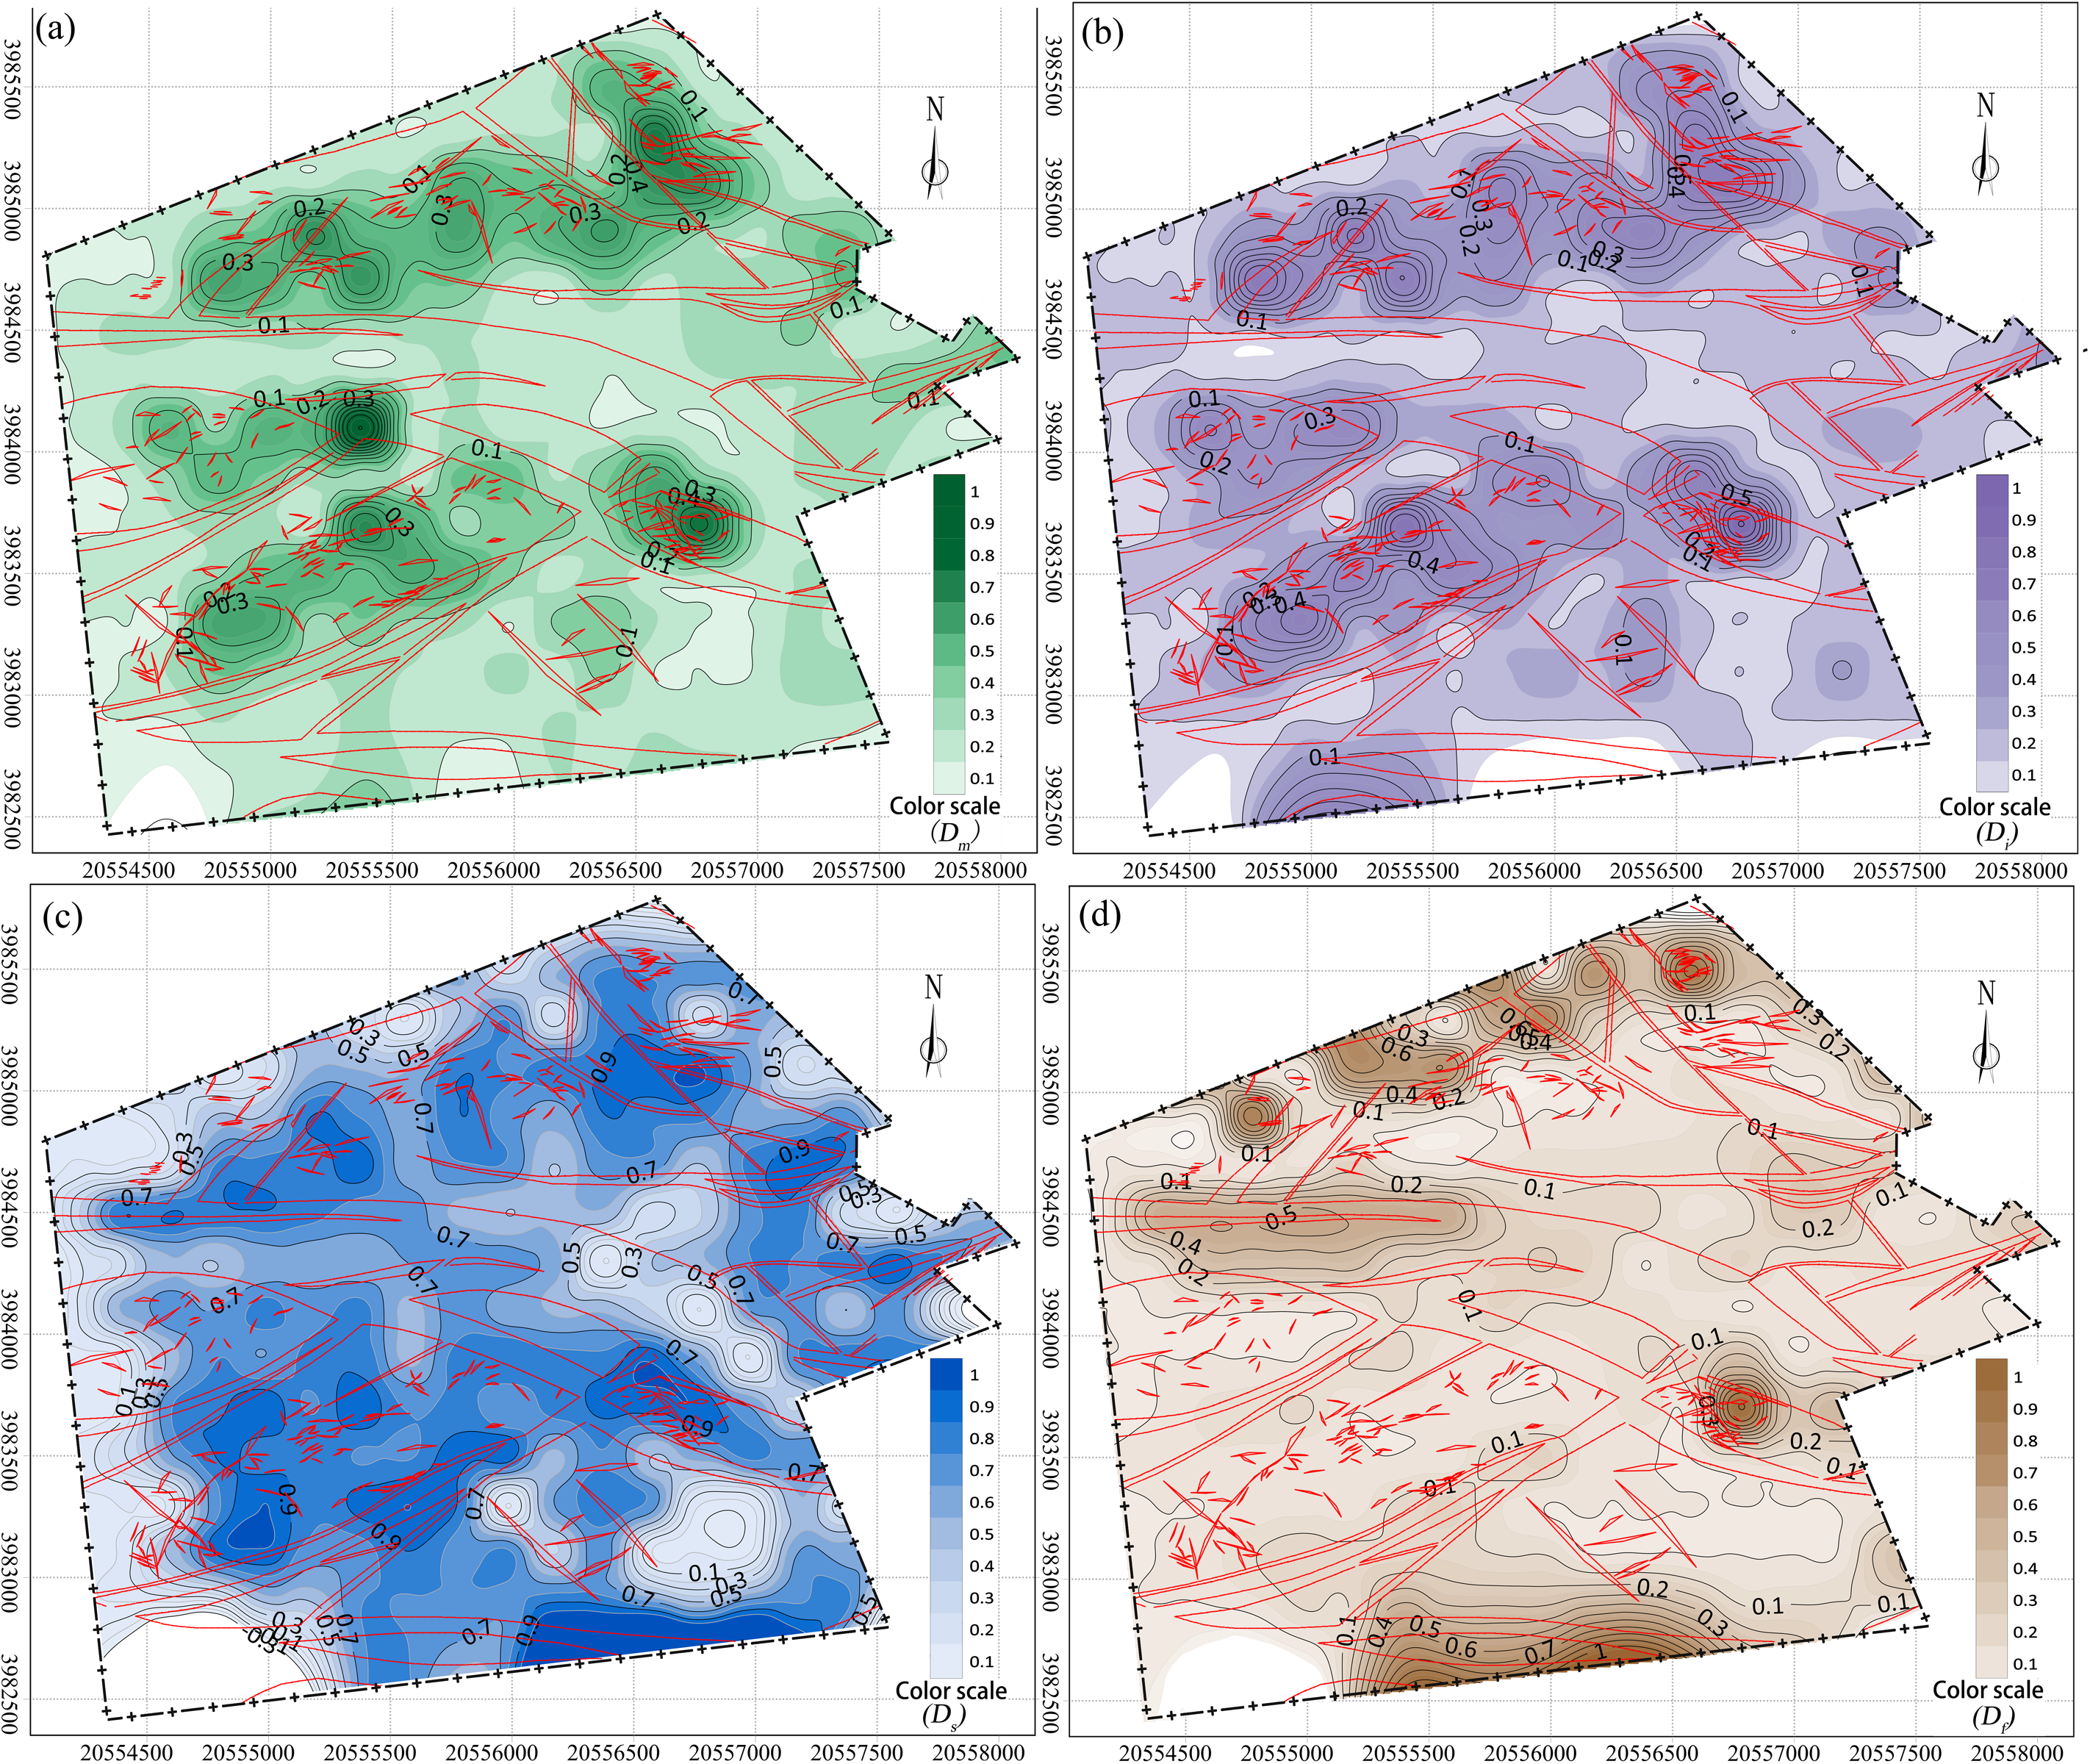
Contour maps of the factors that influenced the faults of coal seam 13 in the Shengquan minefield.
The distribution map of the study area
The distribution of
The distribution of
Fault complexity evaluation
In factor correlation analysis, the relationship between variables cannot be easily expressed through algorithms such as the PCC or GRC, especially in the field of high-dimensional data. Assuming that the linear correlation between the data was strong, and the principal component analysis and multi-dimensional scale analysis of classical algorithms had good results, a new algorithm was introduced to evaluate the spatial correlation of the four evaluation indices. This was used to extract the eigenvalues for a comprehensive evaluation that could perform information fusion while keeping the original amount of information intact. Based on the spatial correlation of different indicators, we used the LLE algorithm to fuse different indicators based on the data to evaluate the fault complexity in the study area.
In this section, NumPy and Skleran modules in Python were used for programming. Taking
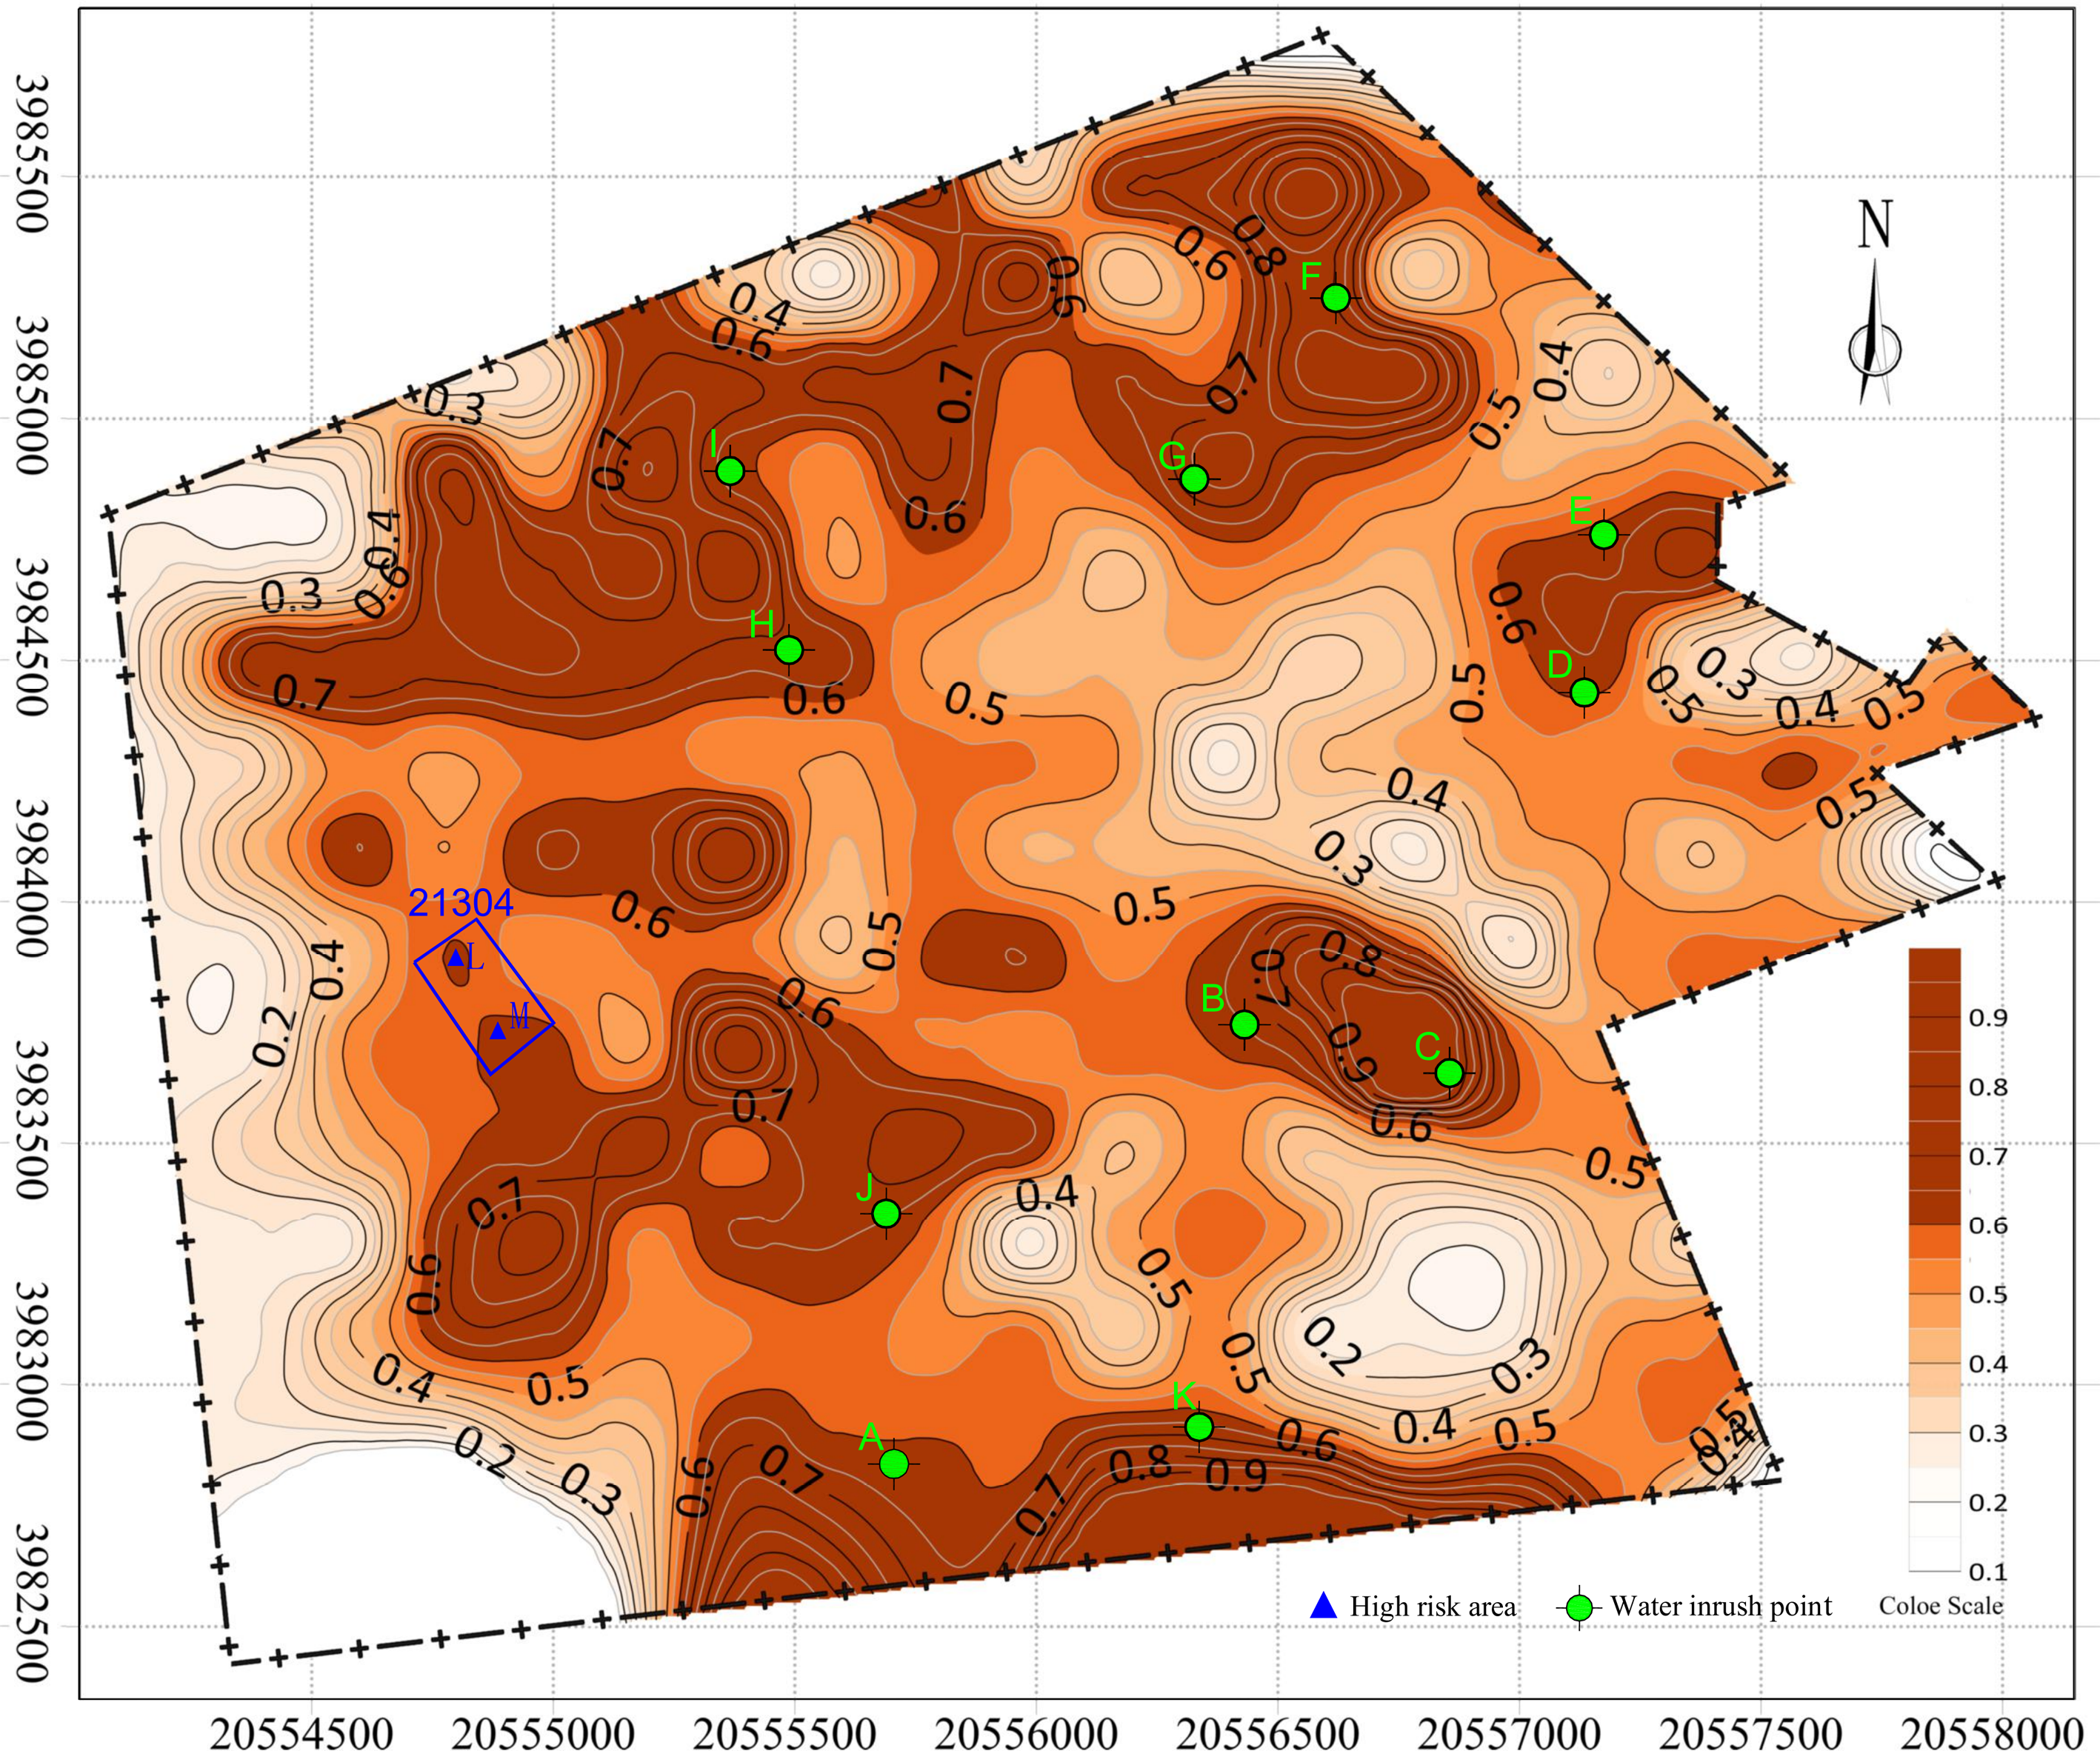
A comprehensive diagram of the evaluation of fault complexity.
Based on the principle that the higher complexity of the fault leads to a greater risk of water inrush (Chen et al., 2018) and along with Figure 7, complexity zoning was obtained.
When
Engineering example verification
The Shengquan coal mine is a typical Carboniferous Permian coalfield. The chief water inrush threat faced by mining here is floor water, and the main water inrush channel is a fault. To determine the correctness and practicability of the fault complexity evaluation model, all water inrush events that occurred in the Shengquan coal mine from 2001 to 2021 were recorded and counted, and the positions of all water inrush points were marked in Figure 9 (points A–K). Our analysis showed that all water inrush points were located in the complex structural area highlighted in Figure 7, thus, the accuracy of the evaluation model is preliminarily verified.
The above process provided a preliminary idea of the correctness of the model from a statistical perspective. To further validate the correctness of the model, the three-dimensional high-density electrical method technology was adopted. It helped to detect the untapped area before mining in the 21,304 working face of coal seam 13 (see Figure 7).
The three-dimensional high-density electrical advance detection technology is an advanced method based on the DC electrical exploration technology. It is primarily used to detect the geological conditions of the strata in front of the underground roadway excavation. The specific content of this work was at 330 m × Within the working area of 330 m, 10 m (line distance) × 33 survey lines were arranged according to the rule of 3 m (point distance) × 330 m/piece, 10,890 m measuring line length, and 3630 physical points. WDID-1 digital DC IP instrument and three pole devices (MN-B or A-MN) were selected for detection. The data recorded by the instrument were imported in the wda format into the computer, the WDAFC software was used to convert it into res format, the RES software was used to process the data, and finally, a chart showing the results was obtained (Figures 8 and 9).
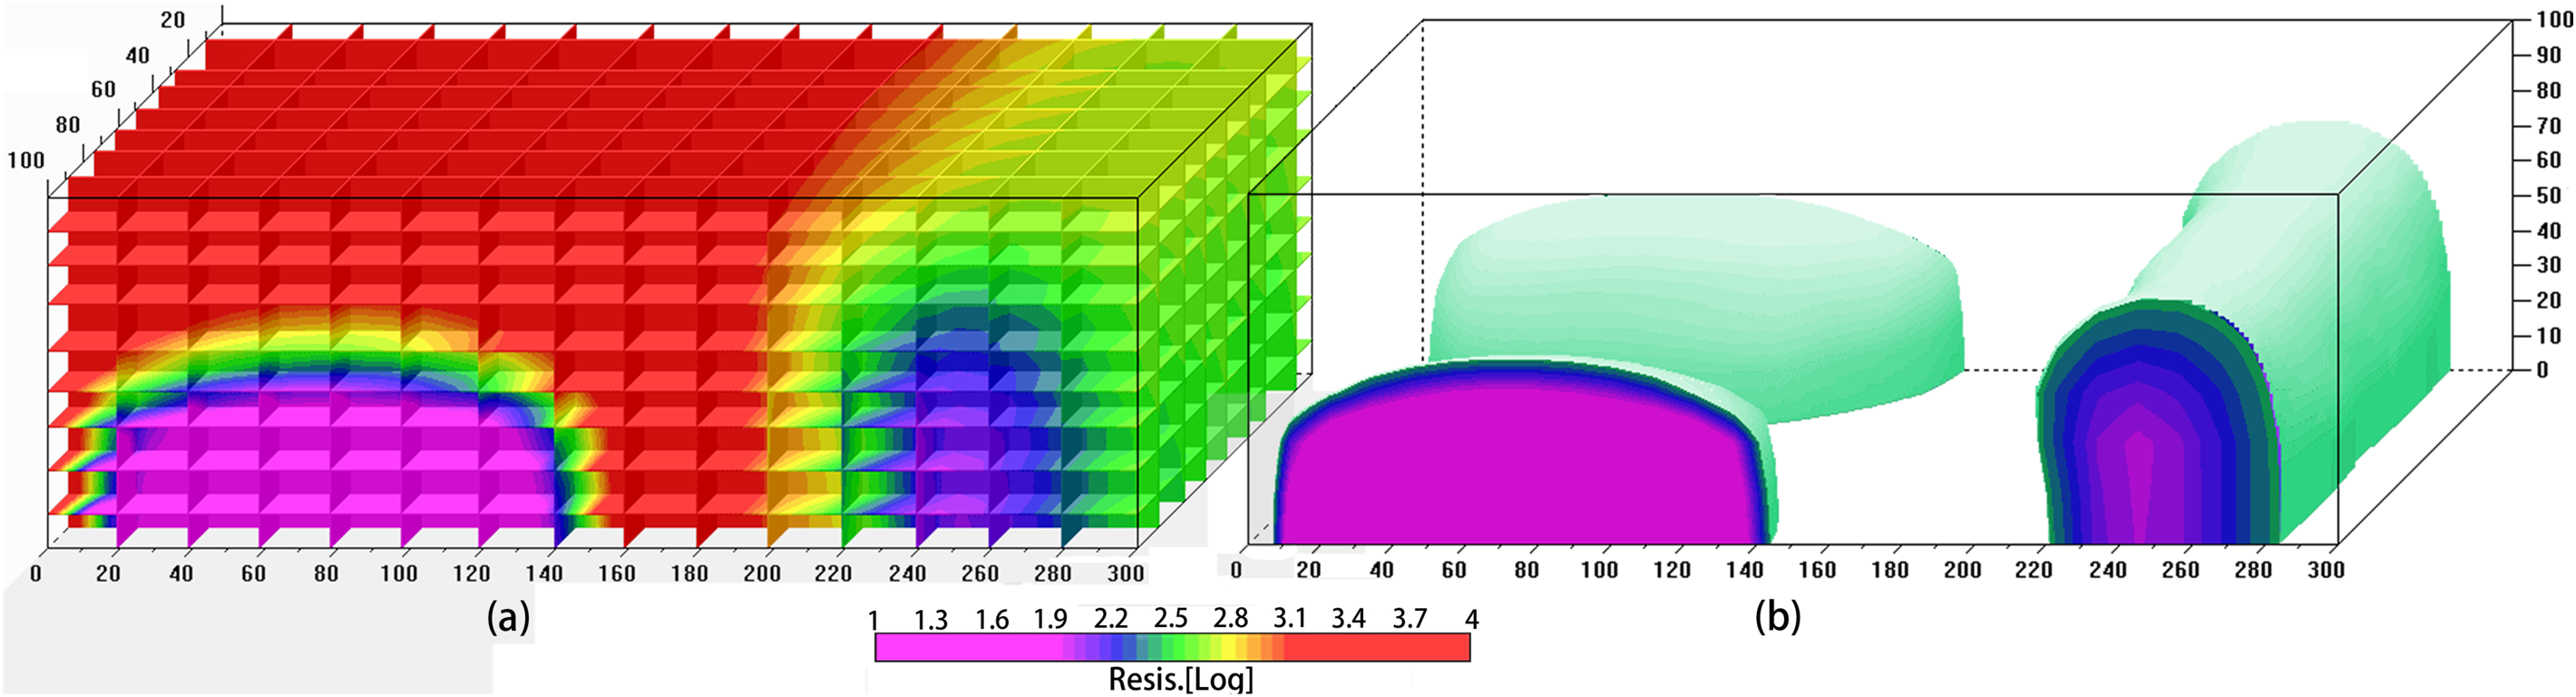
The low-resistance anomaly of the 3D data volume of roof resistivity detected in advance in the mining area.
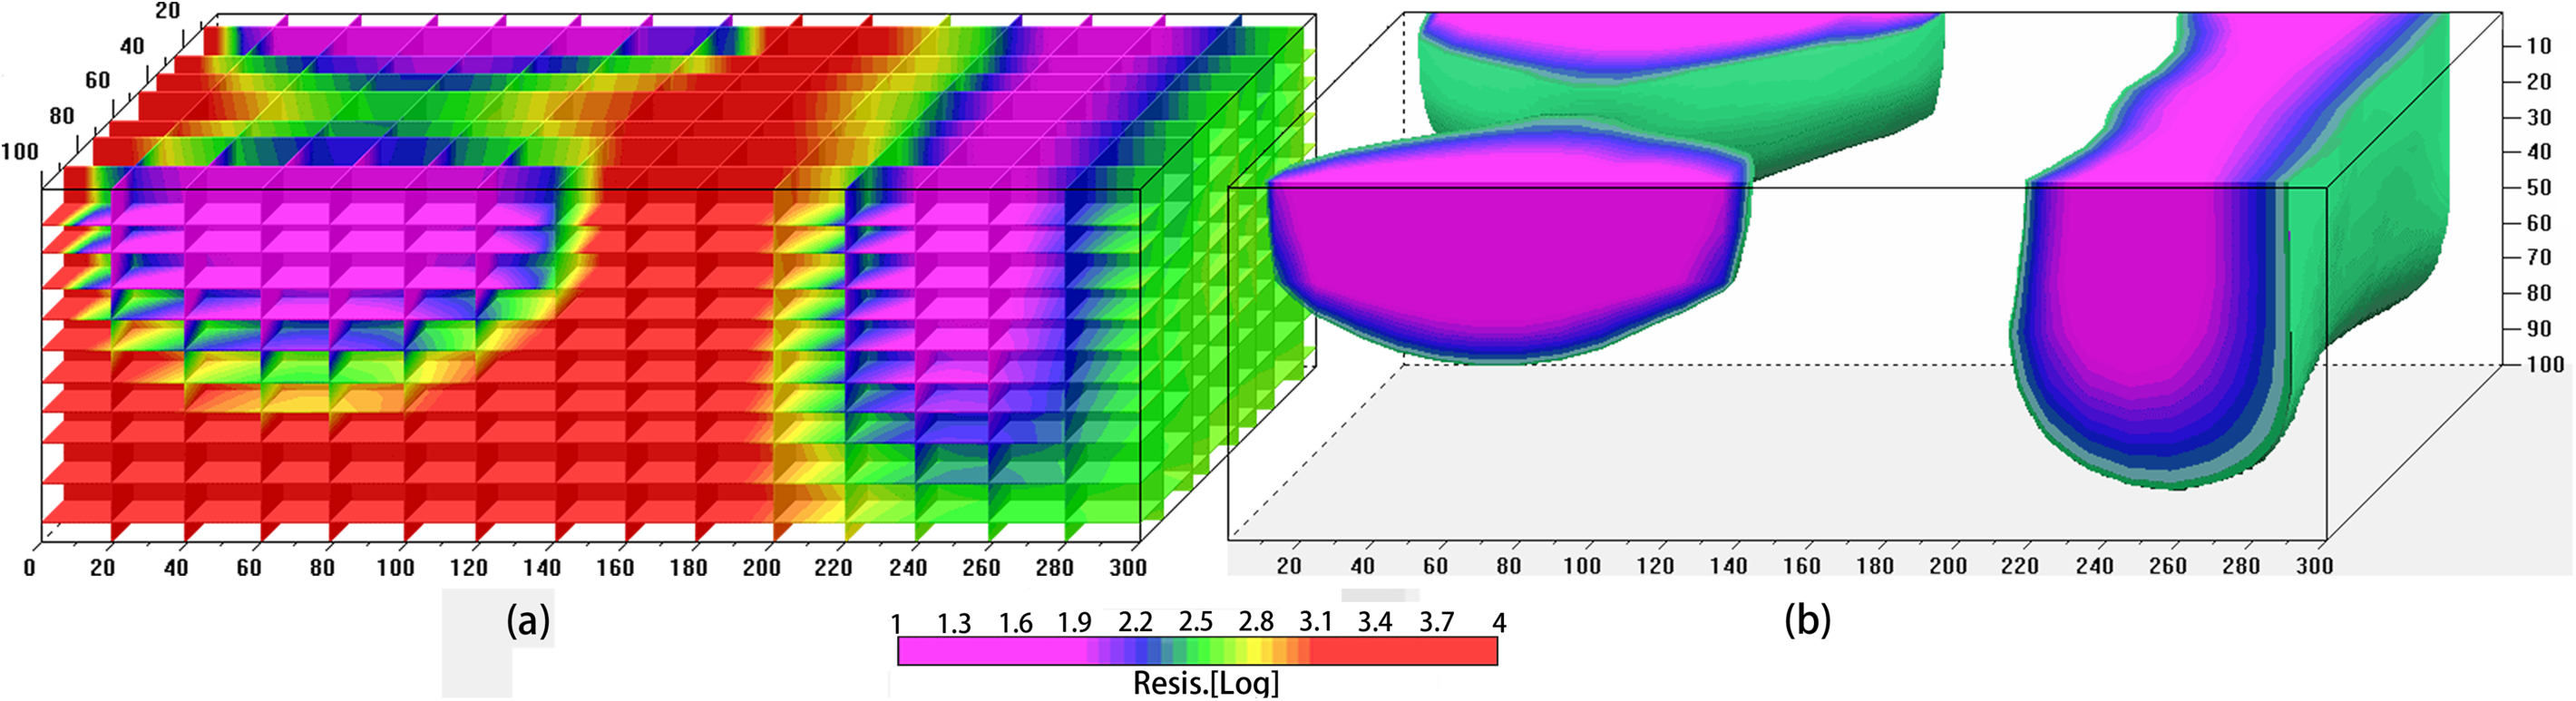
The low-resistance anomaly of the 3D data volume of floor resistivity detected in advance in the mining area.
According to the basic principle of the 3D high-density electrical method, the water abundance in the low-resistance area is strong, and that in the high-resistance area is weak. Considering the detection results, we found that there were two large low-resistivity anomaly areas in the 21,304 working face, which were located at the two ends of the working face. The total height of the anomaly area in the west of the working face was about 80 m, and that in the west of the working face was about 120 m. The overall resistivity was similar. We concluded that the stratum caused by the structural movement was relatively broken, forming a water-rich area. According to the fault complexity model, there were also two high-risk areas in the 21,304 working face (Figure 7, L, M) that were consistent with the geophysical results. Therefore, we comprehensively inferred that the L and M areas of the 21,304 working face have strong water abundance and a high risk of water inrush.
To further validate the accuracy of the results, drilling verification was performed on the working face. Through the verification results, we found that a large quantity of water was discharged from the boreholes in L and M, the maximum water inflow of the boreholes in L was 500 m3/h, and the normal water inflow was 150 m3/h. The maximum water inflow of boreholes in area M was 550 m3/h, and the boreholes with a normal water inflow of 220 m3/h did not have water. These results further verified the effectiveness and rationality of the evaluation model.
Conclusion
Four main control factors were selected that affect the structural complexity, including fault fractal dimension value, fault strength index, the number of fault intersections, and pinch points per fault density. The weight of the main control factors of the complexity of the mine structure was comprehensively obtained using the improved local linear embedding (LLE) algorithm to calculate the index weight, and the quantitative evaluation model of mine structure complexity was established.
Based on the new index weighting algorithm, the structural complexity of the whole study area was quantitatively evaluated. The cluster analysis method was used to classify the complexity of the structure of the mine, and the study area was classified into a simple structural area, medium structural area, and complex structural area according to the complexity of the minefield.
The validity and rationality of the evaluation model were confirmed by comparing the location of water inrush points in the study area and the geophysical prospecting advance detection results of 21,304 working face in Coal Seam 13 in recent years. The water inrush points were located in the complex structural area of the evaluation model. The low resistivity anomaly area of geophysical prospecting in the 21,304 working face was consistent with the complex structural area in the evaluation model.
Footnotes
Acknowledgements
The authors thanks to all experts for their careful work and thoughtful suggestions.
Declaration of conflicting interests
The author(s) declared no potential conflicts of interest with respect to the research, authorship, and/or publication of this article.
Funding
The author(s) disclosed receipt of the following financial support for the research, authorship, and/or publication of this article: This work was supported by the Natural Science Foundation of Shandong Province, National Natural Science Foundation of China (grant number ZR2020KE023, 41807283, 51804184).