
Abstract
The coal and rock mass in water-rich mines with underground waterproof coal-and-rock pillars will be inevitably eroded by groundwater. The mechanical properties and interface failure mode of coal–rock mass under high-moisture conditions directly affect the mine stability and operation safety. This study performed uniaxial compression tests of samples from coal, rock, and their combination with different water contents, the evolution law of mechanical properties and acoustic emission (AE) damage characteristics of coal–rock combinations (C-RC) with different water contents were studied. The C-RC interface failure modes at different water contents were clarified. The results showed that the deterioration of average peak strength of coal, rock, and C-RC was obvious with increased water content. The deterioration degree in the descending order was as follows: C-RC > coal mass > rock mass. The maximum AE ringing number first increased rapidly and then sharply dropped, while the AE cumulative ringing number dropped slowly and then rapidly, reflecting the internal crack propagation patterns in C-RC. The failure mechanism of water-bearing C-RC was related to coal–rock strength ratio and the water-bearing effect of coal–rock interface. When the water-bearing state of C-RC changed from dry to saturated, the macro-failure mode showed the law of only coal fracture (0%)—minor fracture at the coal–rock interface (4%)—both coal and rock fracture (8%)—only coal fracture (12%). With increased water content, the water-bearing effect of C-RC interface gradually prevailed in the C-RC failure pattern.
Keywords
Introduction
The underground environment of most coal mines, except open-pit ones, is complex and diverse due to the coupling of multiple thermos-mechanical fields and factors (Neil et al., 2021; Wang et al., 2011, 2021b, 2022; Zhang and Li, 2022). However, with gradual exhaustion of easily mined coal resources, coal mining under complex conditions became more and more topical. In the process of underground coal mining, the specific geological environment such as water-rich aquifers (Fan and Zhang, 2015), artificial dams of underground reservoir (Lyu et al., 2022) and water-resisting coal pillars (Galav et al., 2022) will act on the coal–rock mass as a water-bearing environment, harming its mechanical properties, structural integrity, bearing capacity, and stability. Eventually, this action will have a fatal impact on the large coal–rock structures, violate the overall coal–rock system stability, and pose a potential threat to coal mine production safety (Ding et al., 2021; Frenelus et al., 2022; Liu et al., 2020; Ma et al., 2018; Wang et al., 2021a; Yi et al., 2022). Therefore, it is crucial to clarify the evolution of mechanical properties and damage failure mode of coal–rock mass with different water contents.
Several scholars have studied the mechanical properties, acoustic emission (AE) damage characteristics and deformation failure modes of coal–rock mass under water-bearing conditions. Wang et al. (2018) conducted uniaxial compression tests on raw and briquette coal samples with different water contents. They introduced a segmented statistical model of coal damage and experimentally verified it. Ju et al. (2022) and Lin et al. (2022) studied the strength damage evolution characteristics of muddy siltstone samples with different water contents. Jiang et al. (2018a) conducted triaxial cyclic loading–unloading tests on saturated and natural shales under different confining pressures, analyzed their mechanical properties and hysteresis effect in two water-bearing states, and discussed the evolution law of the damping ratio based on the energy principle. Li et al. (2015) conducted conventional triaxial compression tests of sandstone samples with five water contents and studied their energy evolution mechanisms. Qin et al. (2012) constructed the full uniaxial compression stress–strain curve of coal–rock masses with different water contents. They analyzed the damage accumulation via the AE method and reported that the cumulative AE ringing number dropped with water content. Yu et al. (2019) conducted uniaxial compression and creep tests on nine groups of red sandstone samples with different water contents, producing the quantitative relation of mechanical parameters of red sandstone versus water content. Jiang et al. (2018b) performed triaxial compression tests on dried, natural, and saturated mudstone samples under different confining pressures and studied the mechanical properties and energy mechanism of mudstone with different water contents. Li et al. (2021) conducted triaxial compression tests on raw coal with different water contents, based on elastic damage mechanics. The damage variable characterizing the overall damage of coal–rock mass with different water contents was deduced, the subsection damage constitutive model of coal–rock mass under water-force coupling was established, yielding the variation law of coal–rock deformation with water content. Zhang et al. (2019) performed triaxial compression tests on muddy siltstone with different water contents, studied their deformation and failure characteristics, and established the respective damage constitutive model. Nevertheless, the properties of a single medium coal–rock mass differ from those of the coal–rock combination (C-RC). Therefore, separate studies of coal and rock masses fail to reflect the C-RC case, especially under the influence of water-bearing conditions. The water-bearing effect of coal–rock interface has a great influence on the mechanical properties, AE damage characteristics, and deformation and failure modes of C-RC.
Some scholars have conducted relevant research on the mechanical properties and damage characteristics of C-RC. Li et al. (2020) used static strain test system and RMT (rock mechanics test) system to carry out uniaxial compression test on C-RC, analyzed the dilatancy characteristics of coal body, and studied the deformation and failure law in the overall failure process of C-RC. Yang et al. (2020a) prepared “rock–coal–rock” composite samples with three height ratios in laboratory, carried out uniaxial compression test and PFC2D numerical simulation test of C-RC, and obtained the asymptotic instability characteristics and evolution law of AE energy under the influence of C-RC interface effect based on the analysis of "rock–coal–rock" combination AE signal and macro-failure characteristics. Yang et al. (2019) conducted uniaxial compression and cyclic loading–unloading tests on coal, rock and three groups of C-RC, analyzed the mechanical parameters and energy evolution law of C-RC, obtained the energy storage characteristics of different samples, established and discussed the energy driving mechanism of C-RC failure based on the mechanical response, energy evolution, and deformation failure characteristics of C-RC.
The above studies were mainly focused at single-factor analysis and ignored the water content effect on C-RC performance. However, it provided a solid foundation for the relevant research of C-RCs with different water contents. Chen et al. (2021) carried out uniaxial compression tests with different immersion times for three kinds of C-RC bonded by real coal and rock. They studied the evolution of mechanical properties and AE damage characteristics of C-RC under the water–rock action and analyzed the micro-deterioration mechanism of C-RC under the water–rock action. However, the macroscopic failure law of water content on C-RC was not considered from the perspective of coal and rock mass characteristics and C-RC interface effect. As it was difficult to obtain real C-RC samples in situ, the uniformity of structural plane prepared by gluing in the laboratory could not be ensured, and the coal–rock in situ was not simply stacking. Therefore, the coal, rock, and C-RC samples were prepared in laboratory, the mechanical properties of samples with different water contents were studied, the AE damage law of C-RC with different water contents was analyzed, and the macro-failure mode of C-RC with different water contents from the perspective of coal and rock mass was obtained. The research results could provide reference for the stability research of water-bearing coal–rock mass in specific geological environment, such as coal–rock mass in water-rich mine environment and water-resisting coal pillar setting in underground.
Experimental procedure
Sample preparation
Sample preparation was subdivided into two stages. The first stage was the pouring test of coal, rock, and C-RC, while the second stage was the preparation test of coal, rock, and C-RC with different water contents. Figure 1 shows the flowchart of sample preparation.
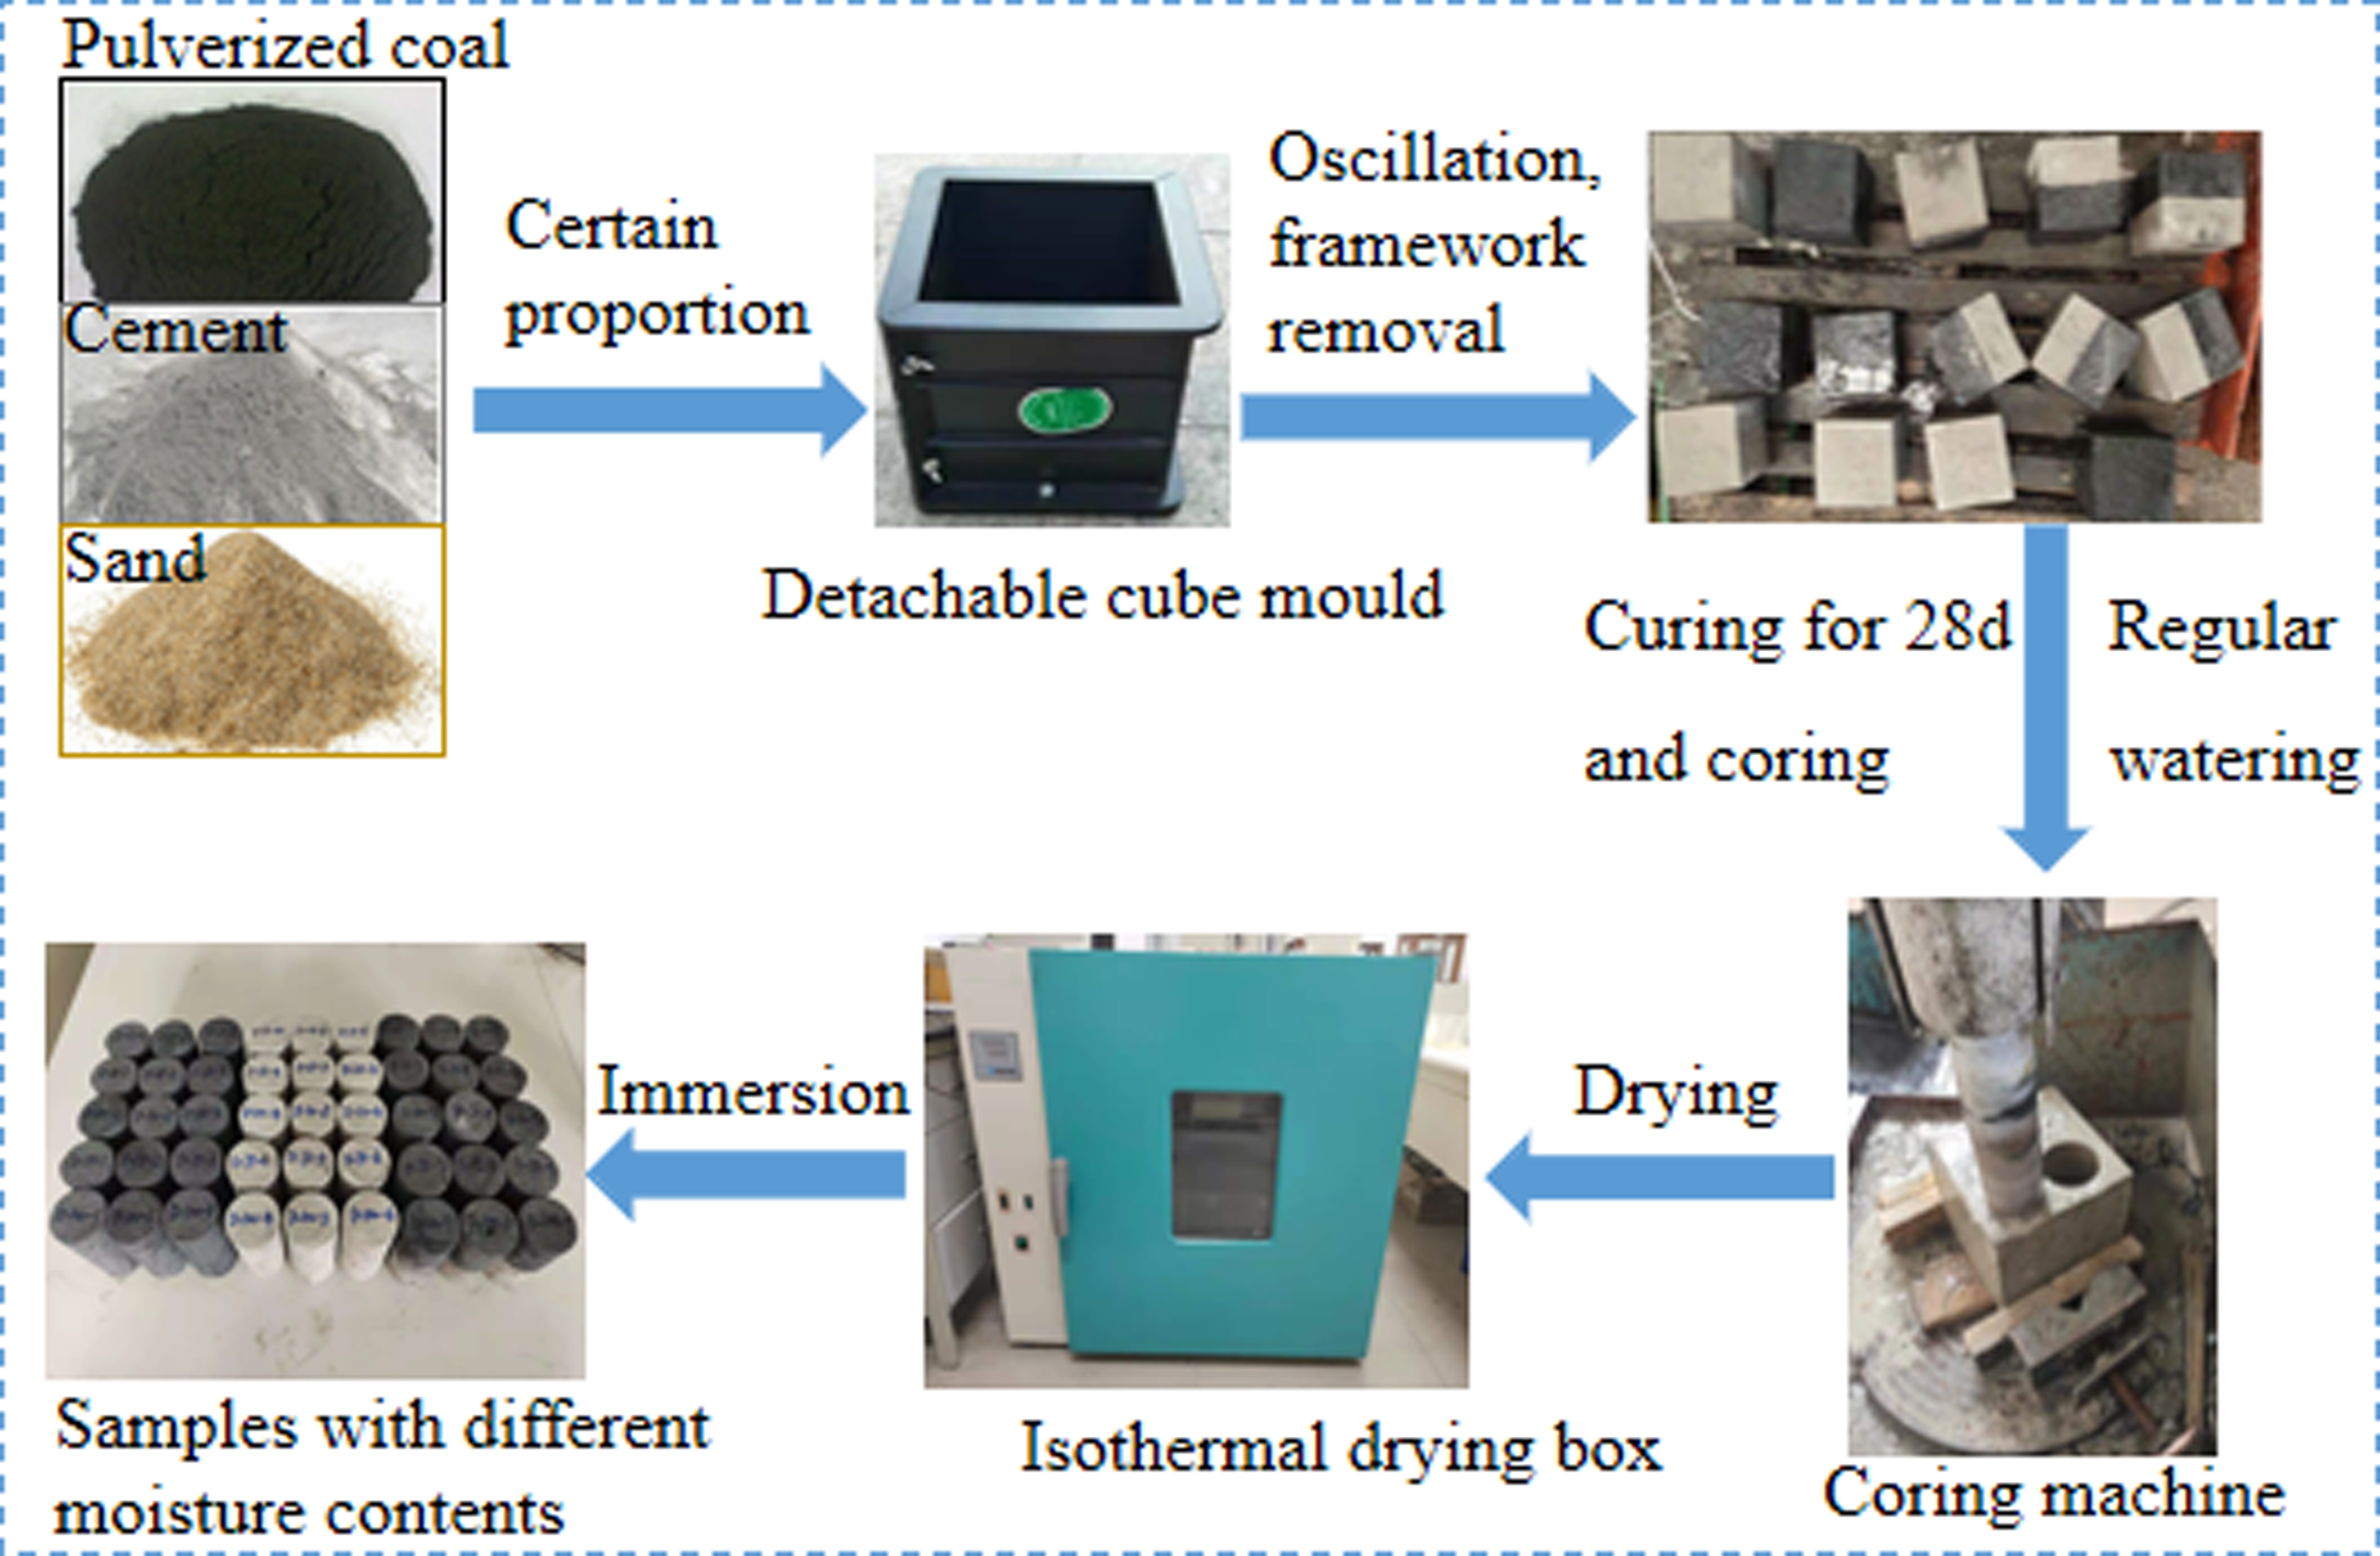
Sample preparation flowchart.
The pouring test of coal, rock, and C-RC involved preparation of 150 mm cube test blocks in the laboratory through prefabricated molds, and then a coring machine was used to cut and grind the blocks to prepare standard cylindrical samples. The pouring test steps were as follows.
Material proportioning, weighing and mixing. Referring to the sample preparation and proportioning scheme reported elsewhere (Li et al., 2020), the coal body was made of pulverized coal bonded with cement, the mass ratio was cement:pulverized coal:water = 1:2.5:1, and the screening size of pulverized coal was 1.25 mm × 1.25 mm. The rock mass was cement mortar, the mass ratio was cement:river sand:water = 1:1.5:0.5, and the sieving size of river sand was 2.5 mm × 2.5 mm. After proportioning, the mixture was fully mixed with an electric mixer.
Putting in the mold and mechanical shaking. The mixed slurry was put into the mold and shaken for 3 min on a mechanical shaking table, the separator was moved after standing for 3 min, then the test sample was preliminarily prepared. Formwork removal and maintenance, regular watering. The formwork should be removed after 24 h standing, and the test block should be watered 3 times per day for 28 d curing. Mechanical coring and preparation completion. After curing, the standard cylinder sample was prepared by coring machine. Standard cylindrical samples were placed into the drying oven for 24 h with a constant temperature of 106°C. Then, the samples were weighed and recorded. The water-saturated samples were prepared by non-destructive immersion test system, the water content was measured regularly until the data were basically stable (the error was within 0.1 g), and the samples were weighed and recorded. The water content of each gradient was determined based on the water content of the water-saturated sample, and then the mass of each sample reaching the specific water content was calculated. According to the specific mass calculated in Step 3, the unsaturated water content test sample was prepared by the non-destructive immersion test system. The samples were measured at a set interval of time, when it was close to the calculated mass, shorten the weighting time interval until it reached the set mass, weighed and recorded, and so on, the samples of each water contents were prepared. Considering the influence of external environment, once the sample was prepared, it was wrapped with protective film and used in the test as soon as possible.
The preparation steps of coal, rock and C-RC with different water contents were as follows:
Test system and scheme design
There were three groups of tests, including coal, rock, and C-RC, four gradient water contents were set for each group of tests. Three samples were set for each group of particular water content, and the mean value of test results was used, with a total of 36 samples. The four gradient water contents were dry state (D-0), unsaturated state 1 (D-33), unsaturated state 2 (D-66), and saturated state (D-100). Taking the dry state as an example, the specific numbers of each sample were as follows: coal body was (D-0-1, 2, 3), rock body was (D-0-4, 5, 6), and C-RC was (D-0-7, 8, 9).
The experimental system mainly included the mechanical testing machine system, AE monitoring system, and digital camera acquisition system. As shown in Figure 2, the prepared C-RC samples with different water contents were subjected to uniaxial compression test on the mechanical testing machine. The displacement-control loading mode was adopted in the test process, and the loading rate was set to 0.002 m/s until the sample fracture. The main amplifier of the AE monitoring system was set at 40 dB, and the probe frequency was set at 100–600 kHz to monitor the elastic wave of sample instability and failure in the whole test process. In order to ensure a good contact between the AE probe and the sample surface and reduce the experimental error, Vaseline was placed in the contact zone between the AE probe and the sample during the test A digital camera was used to record the macro-failure law of the sample during the test.
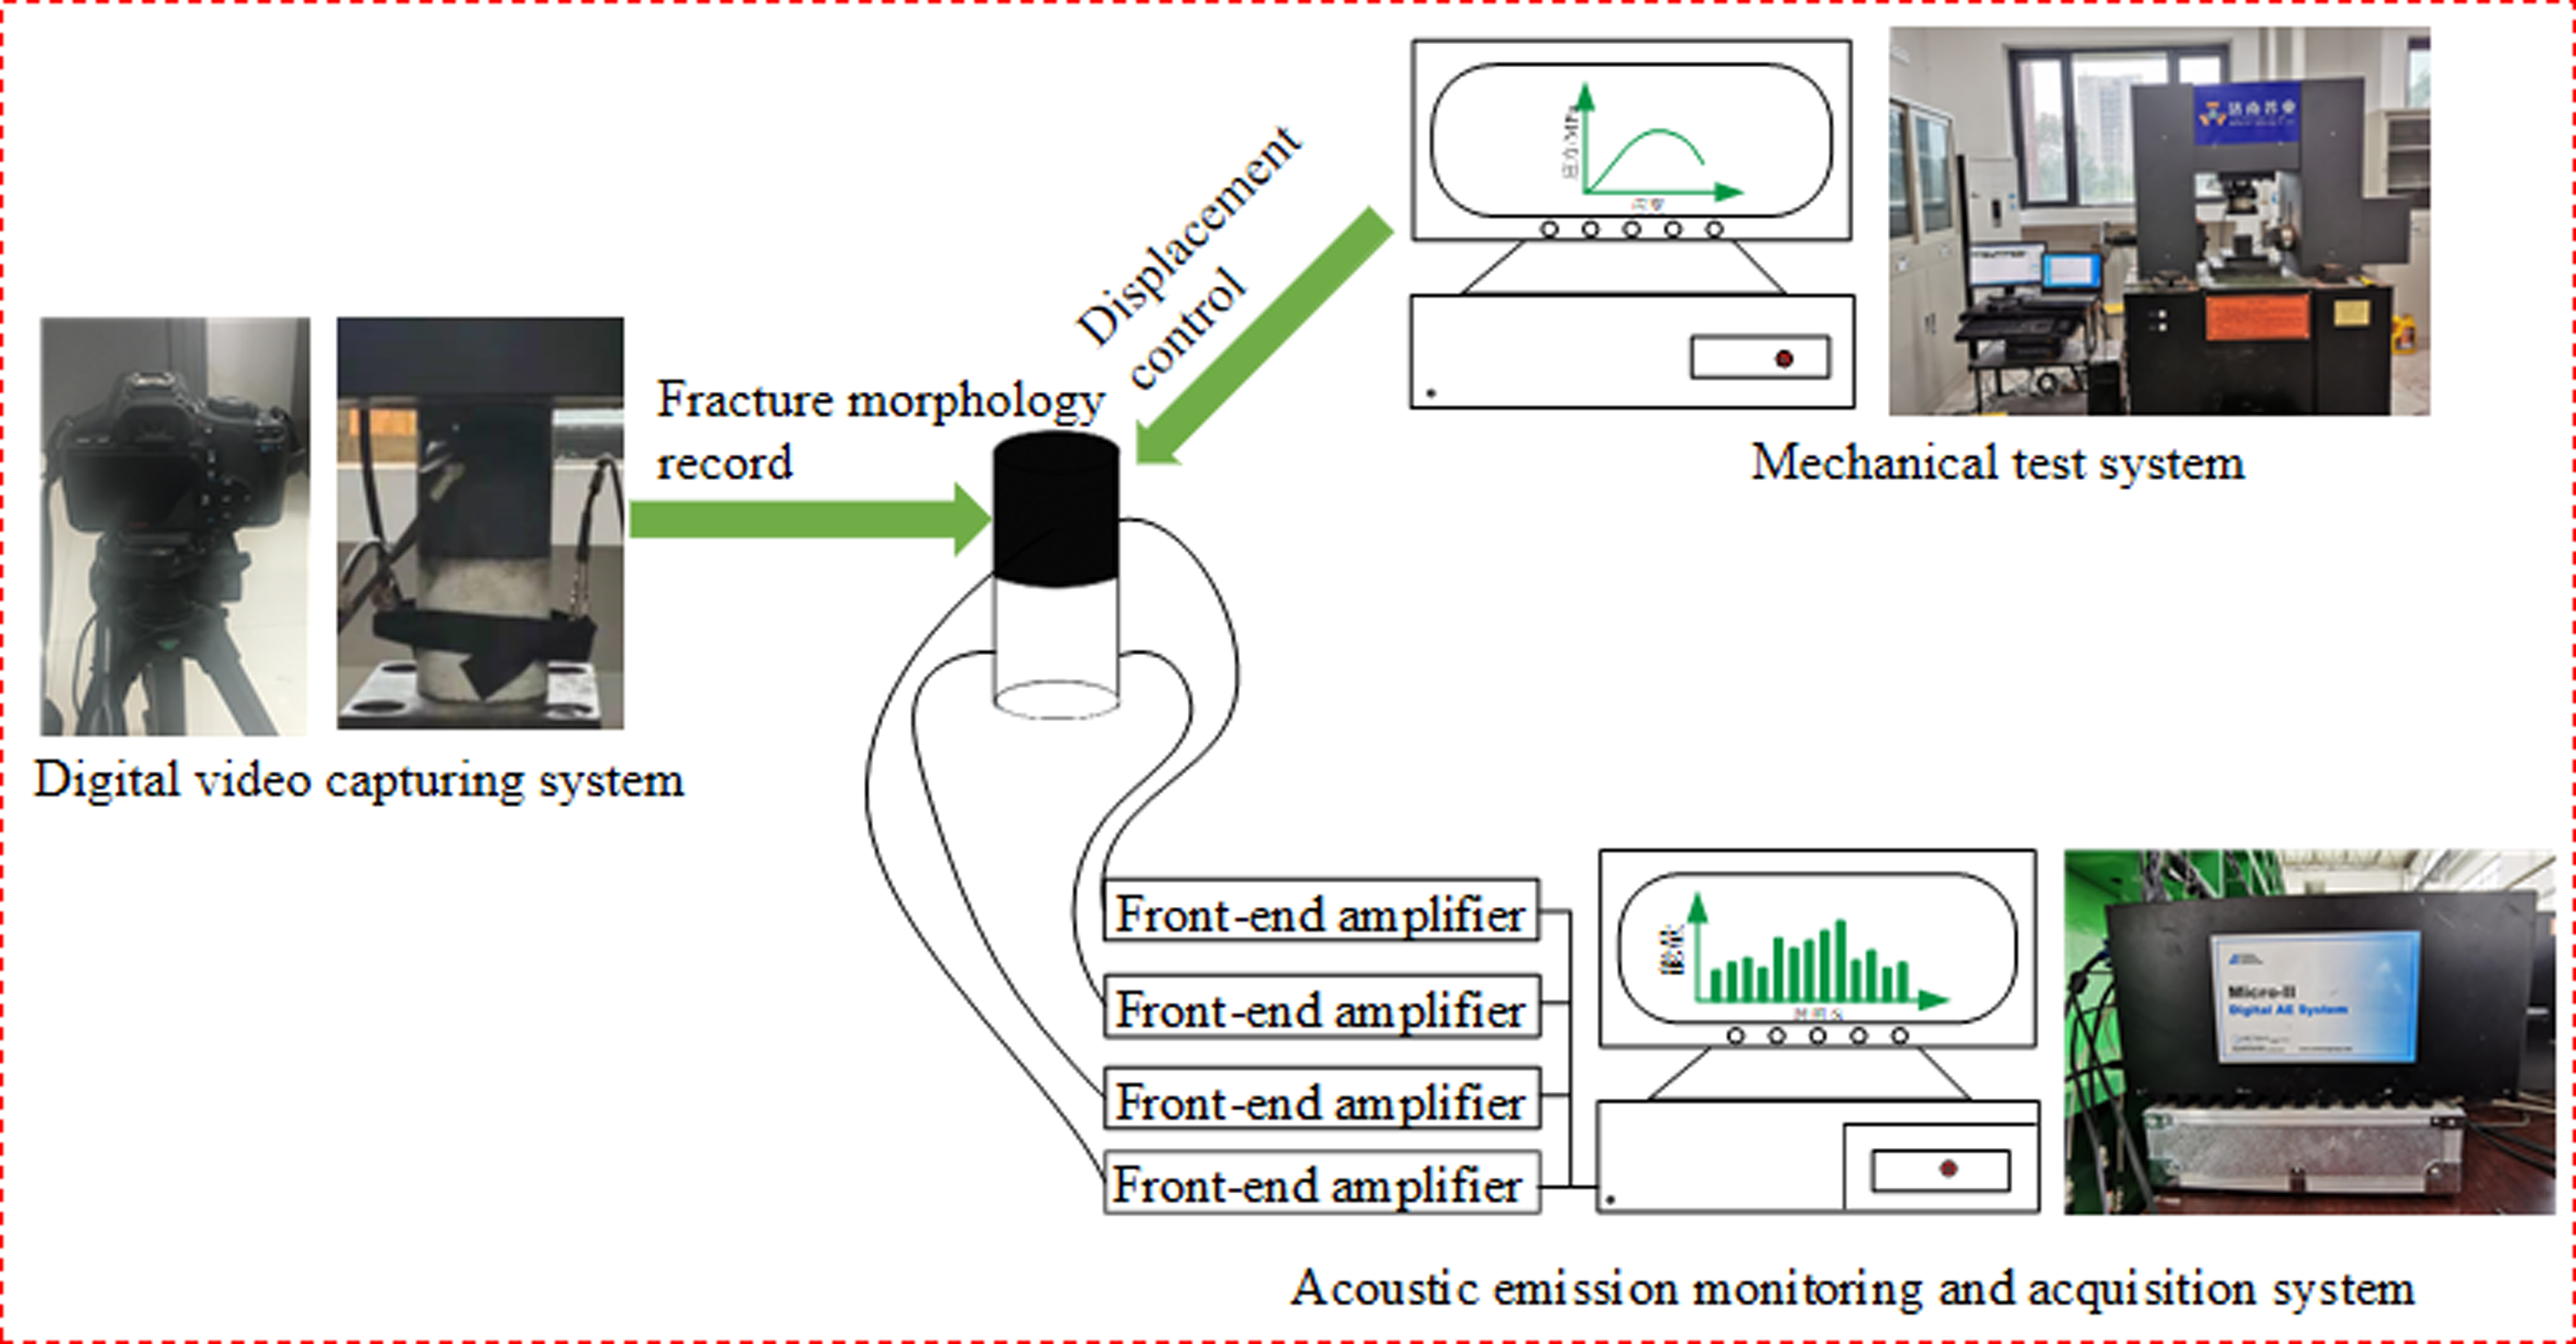
Schematic of the experimental system.
Experimental results and analysis
Stress–strain curve characteristics of water-containing samples
According to the uniaxial compression test data of coal, rock, and C-RC samples, their axial stress–strain curves were constructed, as shown in Figure 3. As observed, stress–strain curves of all three samples experienced four stages: compaction, elastic deformation, plastic deformation and post-peak failure. It showed a high uniformity of samples prepared in the laboratory, which ensured the test reliability (Li et al., 2020). For coal, rock, and C-RC samples, the peak strength decreased gradually with the water content. As observed, water had the water wedge, dissolution, and lubrication effect on the internal micro-pores and cracks, promoting their coalescence and sample damageability. With increased water content, the three samples gradually transformed from brittle to ductile state.
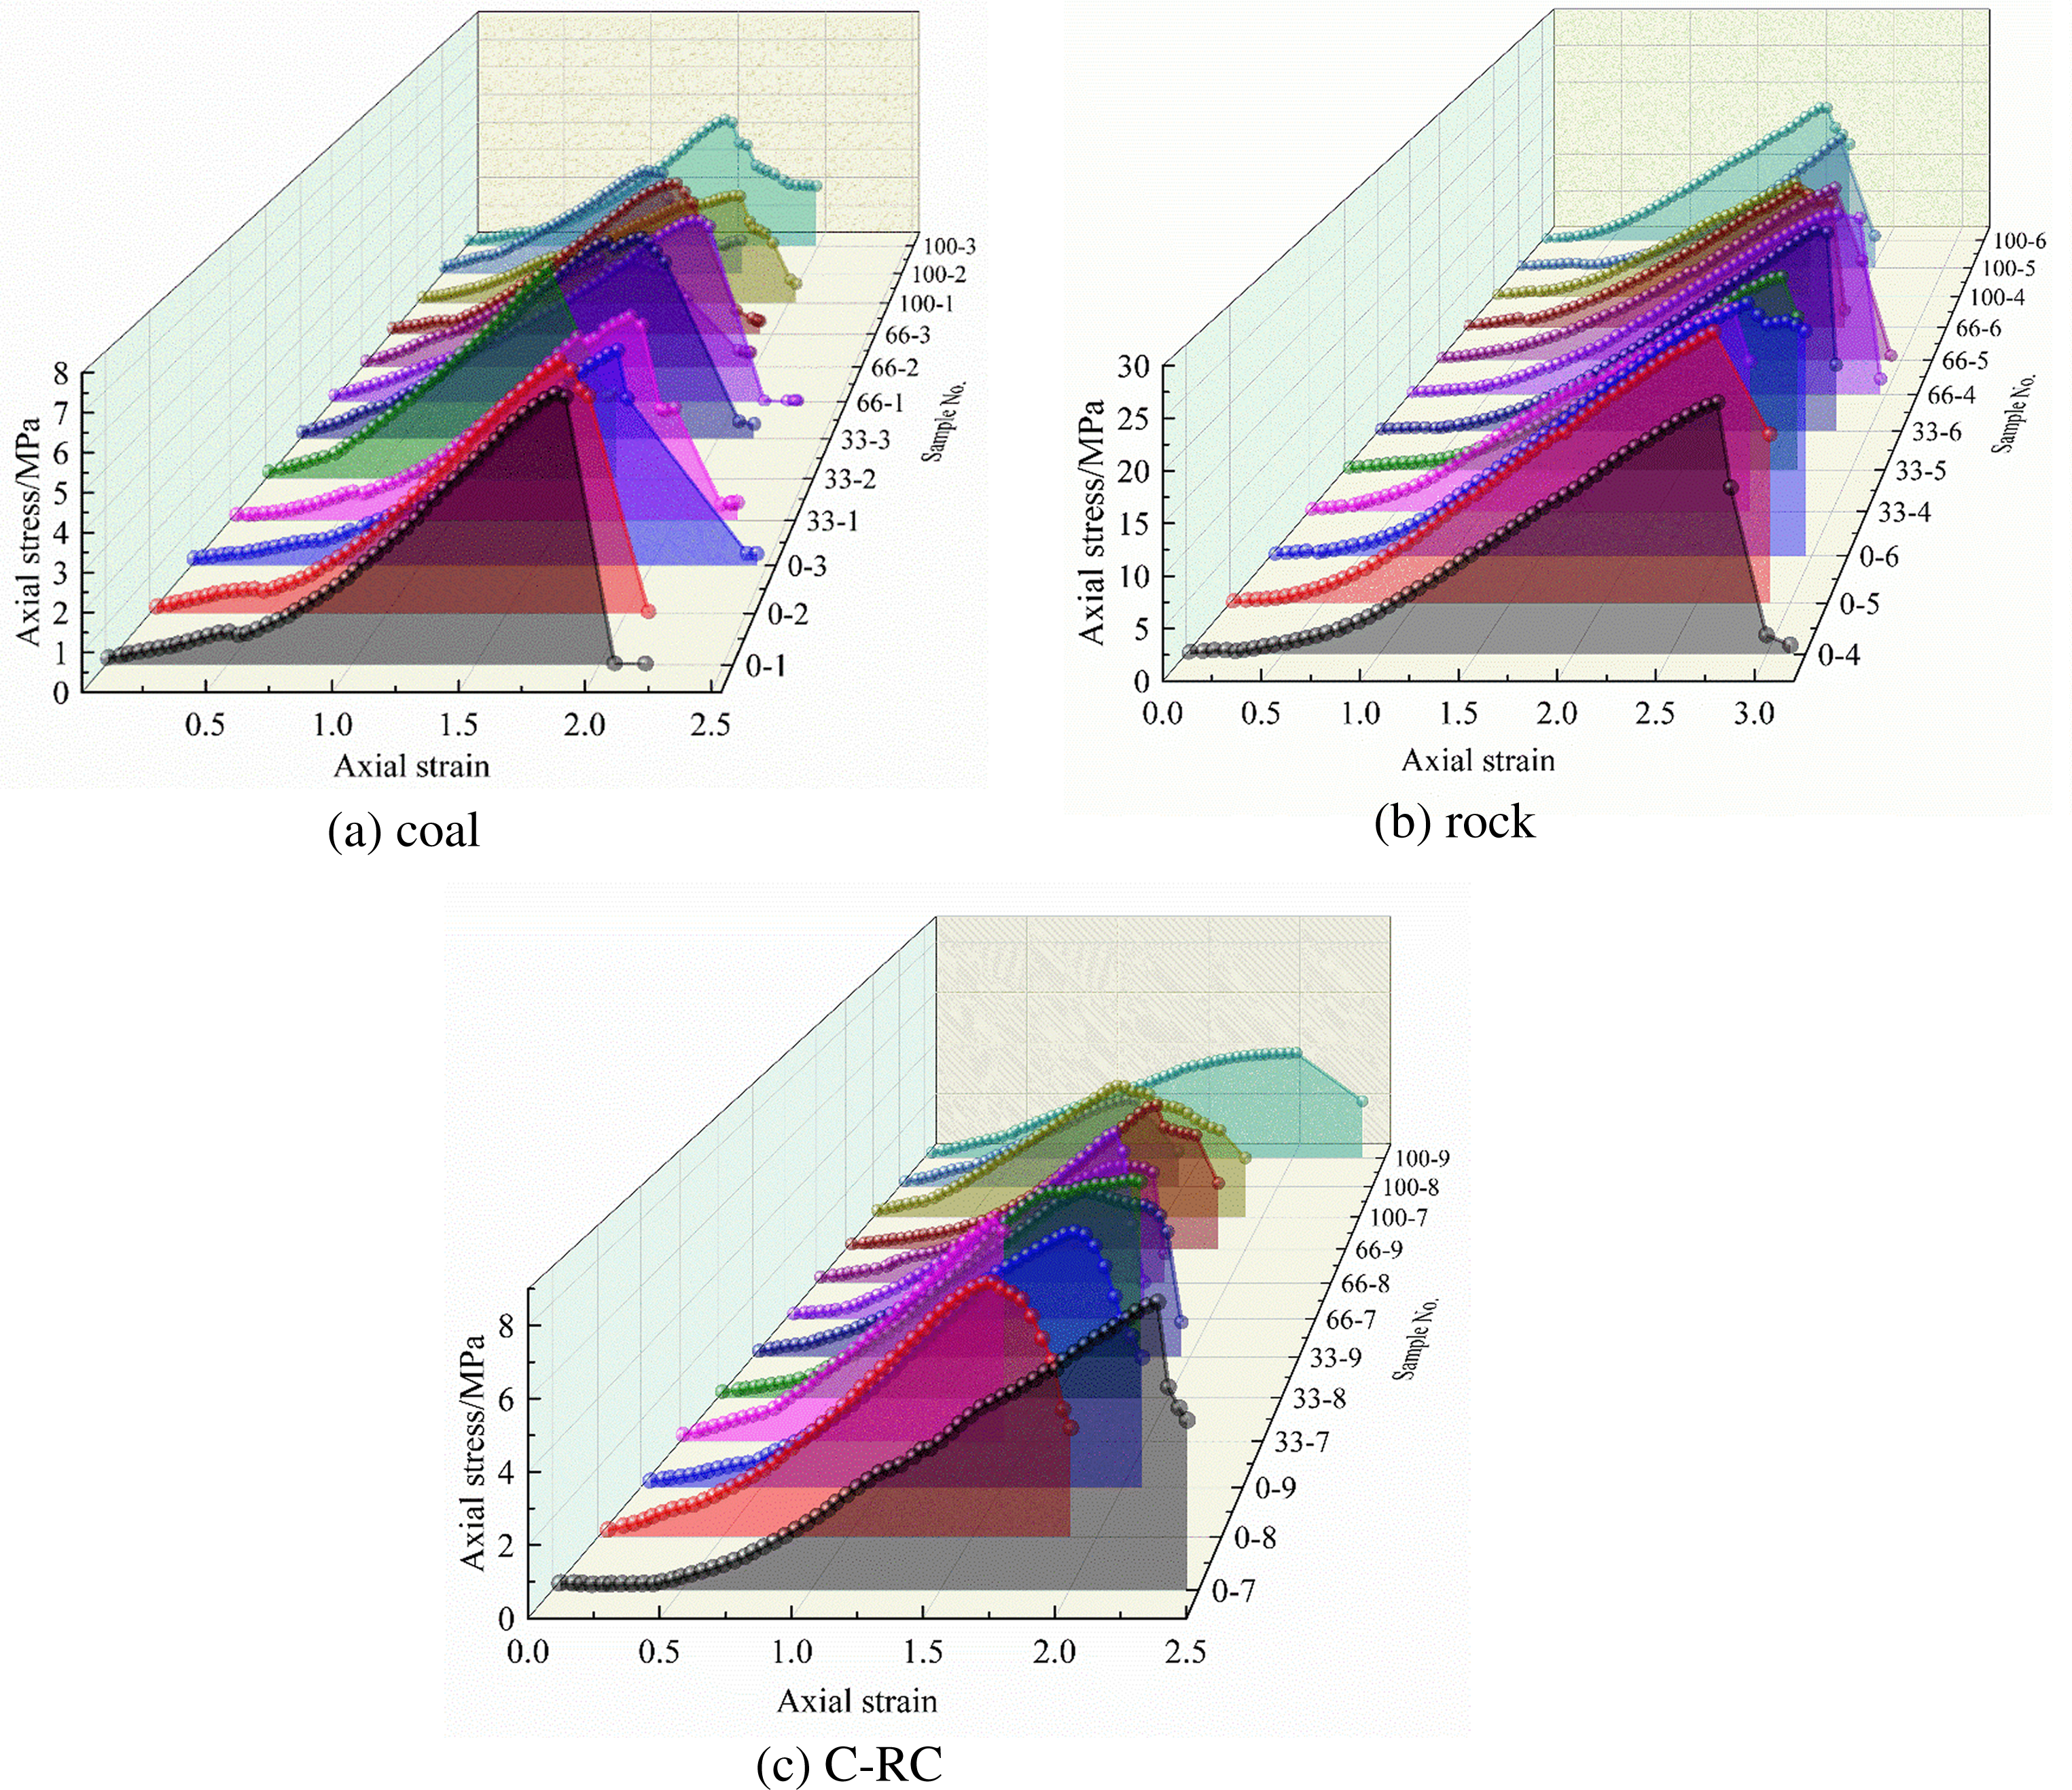
Uniaxial compressive stress–strain curves of samples with different water contents: (a) coal; (b) rock; (c) C-RC.
Strength characteristics of samples with different water contents
The deterioration degree of mechanical parameters of samples with different water contents (namely, peak strength, peak strain, and elastic modulus) varied.
Figure 4 shows the variation law of coal, rock, and C-RC peak strength with water content, and Figure 5 shows the relationship between the average peak strength and water content of the three samples. The following designations were used: D-1 in the figure represents four water-containing samples of No. 1, and so on. According to Table 1, the average peak strength of coal, rock and C-RC samples with different water contents significantly dropped. With increased water content, the average peak strength values of coal dropped to 6.53, 6.03, 4.68, and 3.93 MPa, respectively, that is, up to 2.6 MPa below that in a dry state, and the overall deterioration degree was 39.82%. The average peak strength values of rock mass were 26.06, 22.24, 20.10, and 16.78 MPa, respectively, being 9.28 MPa lower than that in a dry state, and the overall deterioration degree was 35.61%. The C-RC average peak strength values were 7.67, 6.46, 5.22, and 4.11 MPa, respectively, being 3.56 MPa lower than that in a dry state, and the overall deterioration degree was 46.41%. Thus, at the same water content, the average peak strengths of the three samples had the following decreasing order: rock mass > C-RC > coal mass. Meanwhile, the C-RC peak strength slightly exceeded that of rock mass, indicating that the rock mass with higher strength in C-RC provided a certain support, and the C-RC damage depended on the coal mass with a lower strength. With increased water content, the decreasing order the average peak strength was as follows: C-RC > coal mass > rock mass. The analysis showed that the weakening effects of water on the C-RC interface, such as lubrication, water wedge and erosion, promoted the strength deterioration of the overall C-RC structure.
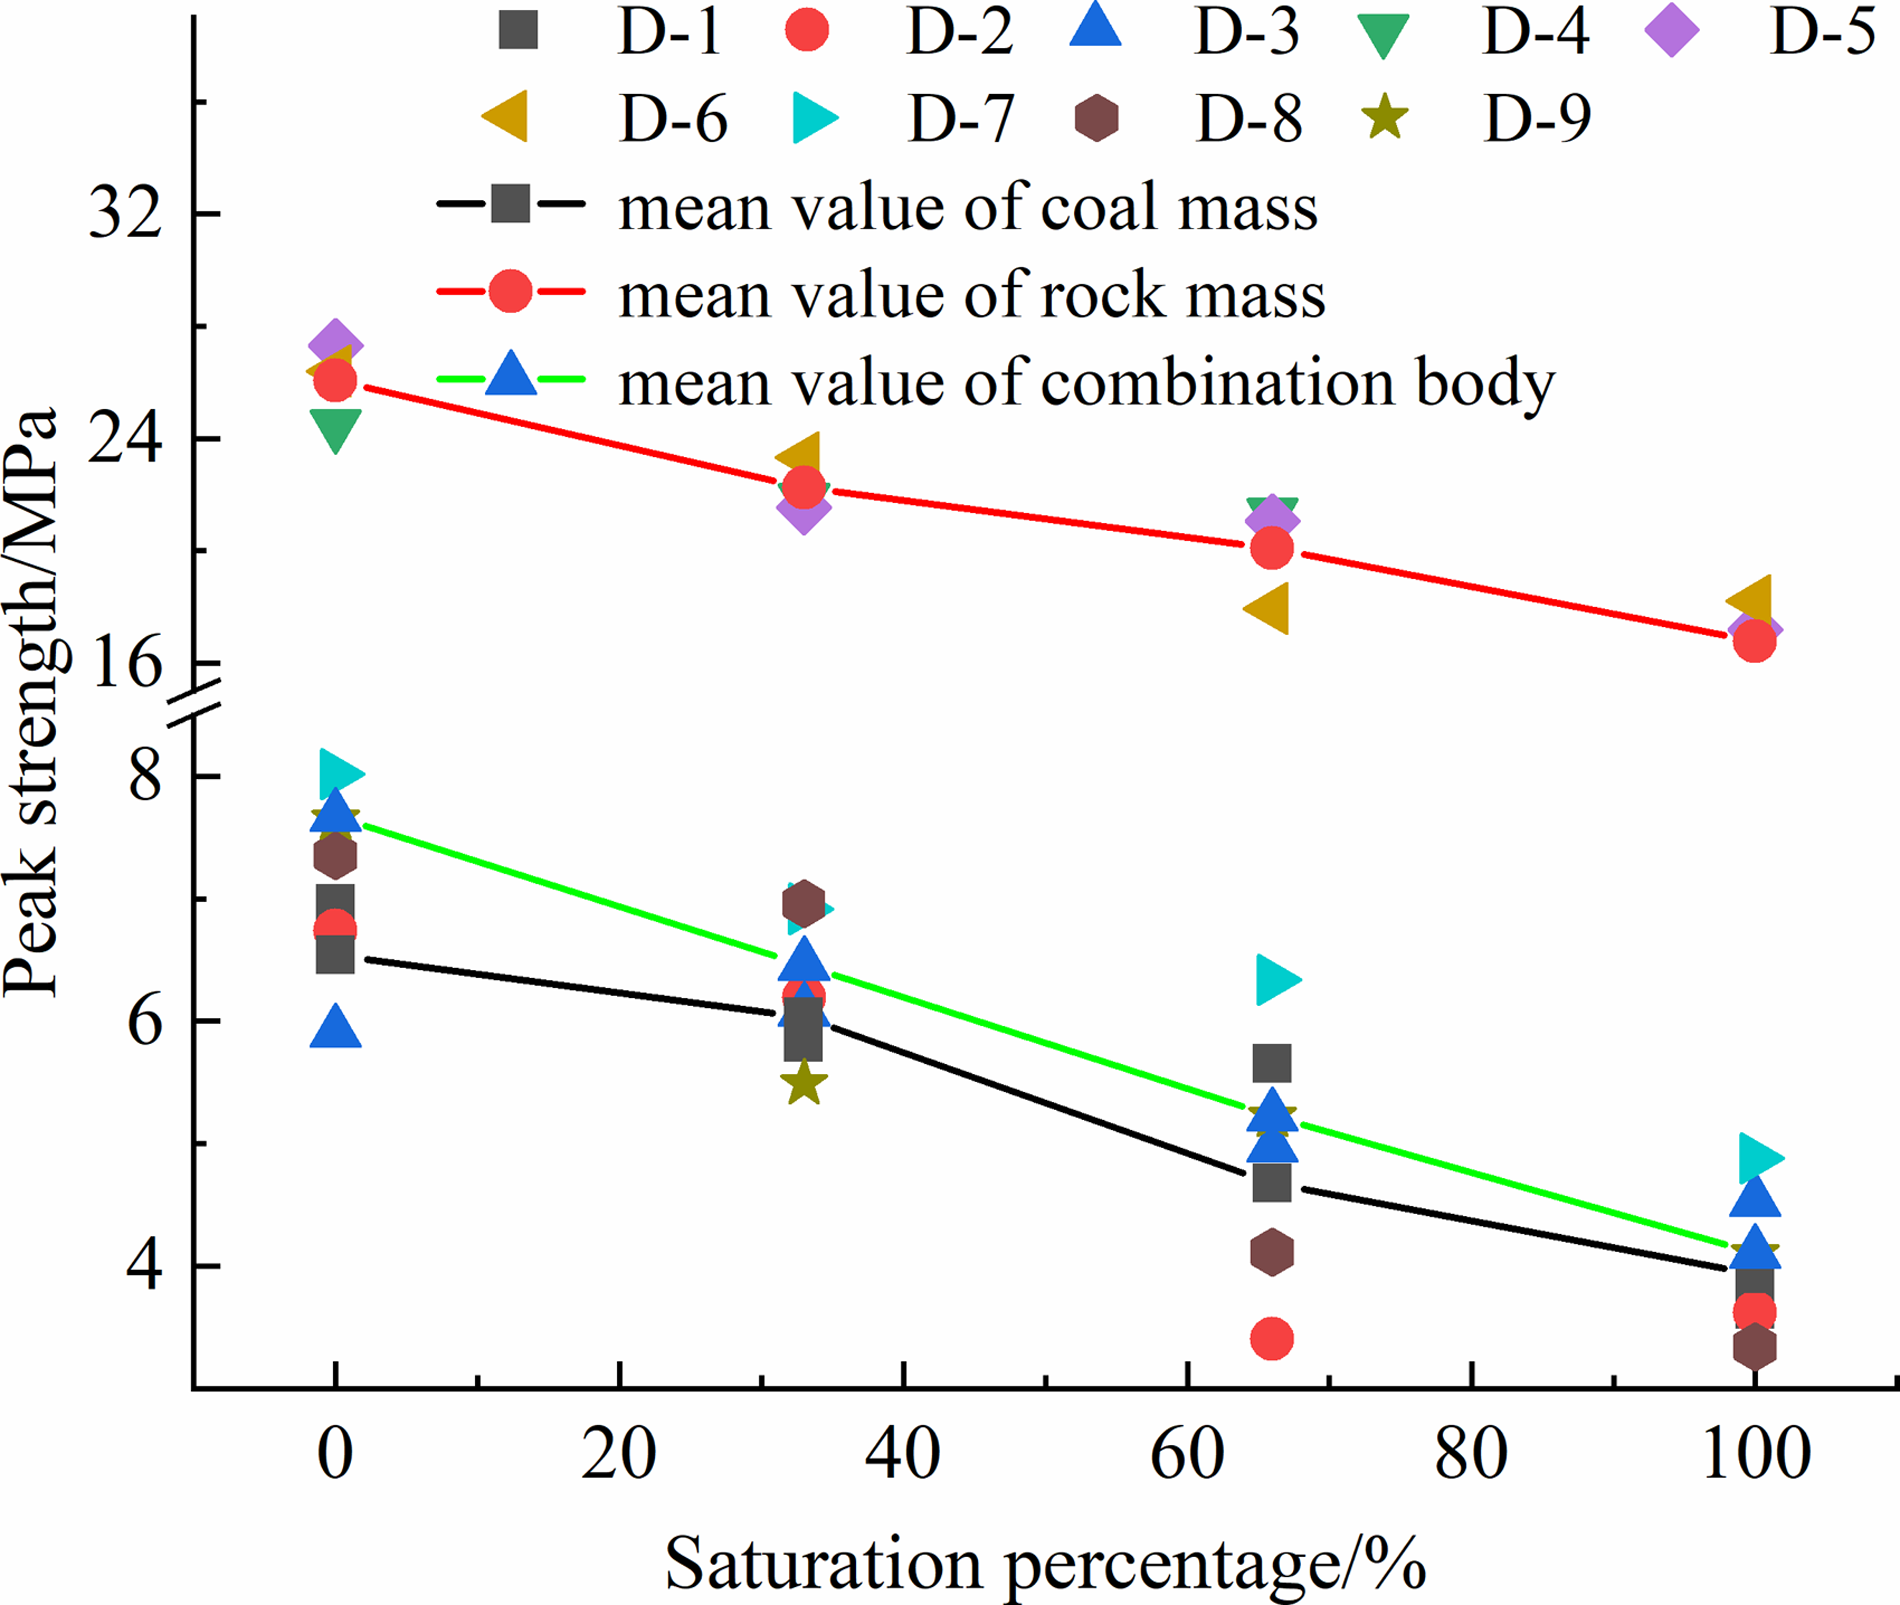
Peak strength versus water content of coal, rock, and C-RC samples.
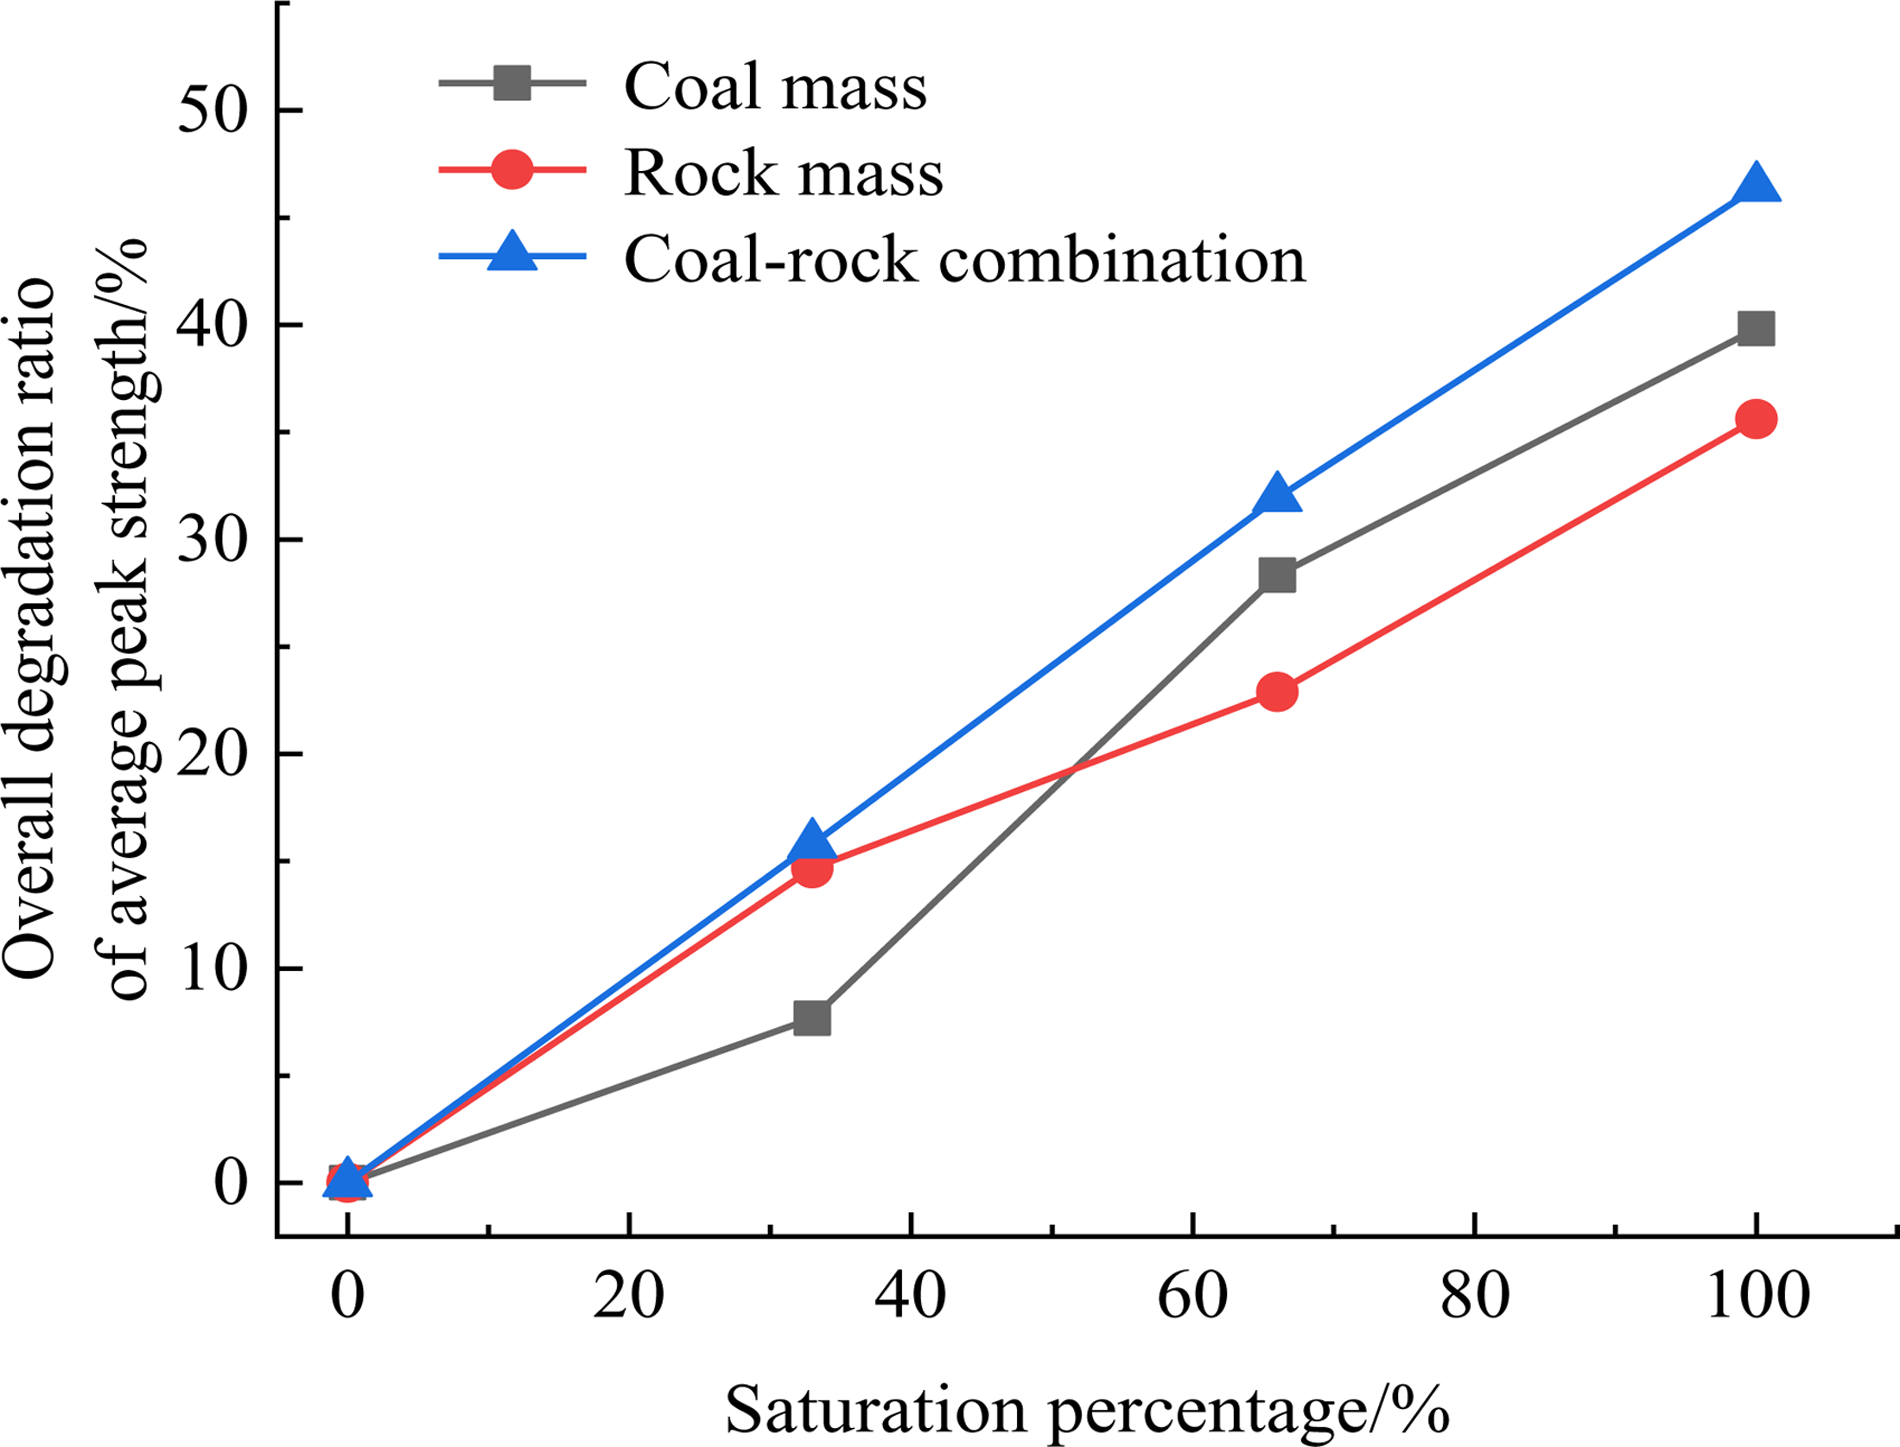
Overall deterioration degree of the average peak strength versus water content of coal, rock, and C-RC samples.
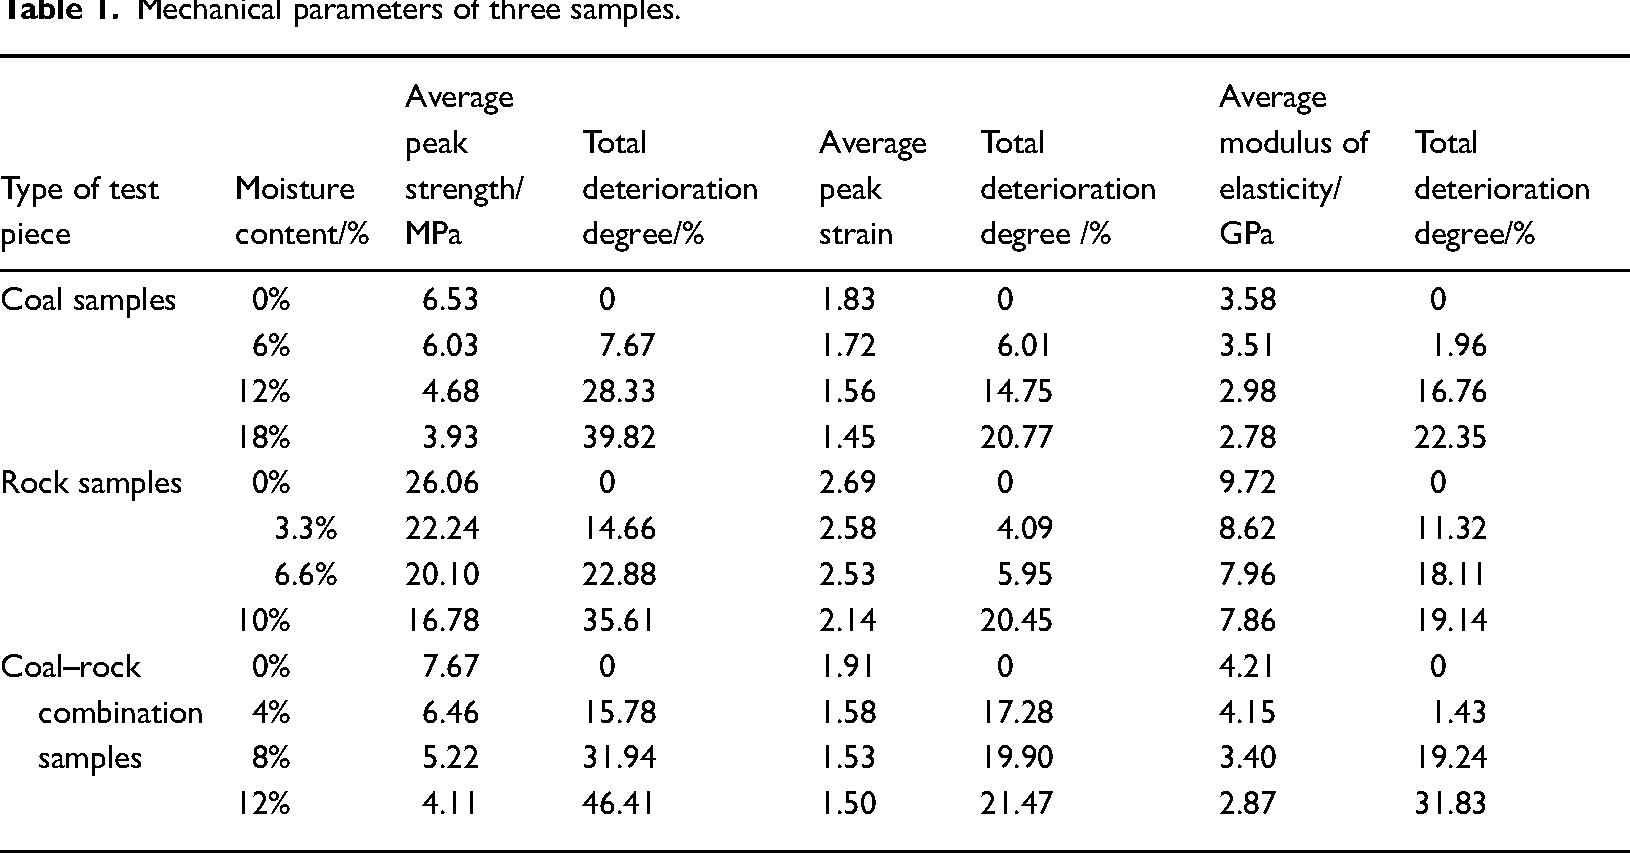
Mechanical parameters of three samples.
Peak strain characteristics of water-containing sample
Figure 6 shows the variation law of coal, rock and C-RC peak strain with water content, and Figure 7 shows the relationship between the overall deterioration degree of average peak strain and water content of the three samples. According to Table 1, the average peak strain of coal, rock and C-RC with different water contents was significantly degraded, specifically, with the increase of water content, the average peak strain of coal were 1.83, 1.72, 1.56, and 1.45, respectively, which was 0.38 lower than that in dry state, and the overall deterioration degree was 20.77%; the average peak strains of rock mass were 2.69, 2.58, 2.53, and 2.14, respectively, which was 0.55 lower than that in a dry state, and the overall deterioration degree was 20.45%; the average peak strain of C-RC were 1.91, 1.58, 1.53, and 1.50, respectively, which was 0.41 lower than that in a dry state, and the overall deterioration degree was 21.47%. It can be seen that with the increased water content, the average peak strain deterioration of coal, rock and C-RC was ranked as follows: C-RC > coal > rock. The analysis showed that with the increased water content, pores and fissures at the coal–rock interface and inside the sample were gradually filled with free water. Under the axial load action, the pore water pressure in the pores and fissures had a certain degree of inhibition on the axial strain, and the peak axial strain decreased gradually. Water-containing C-RC sample was more severely eroded by water at the coal–rock interface than separate coal and rock masses, and its overall deterioration degree of the peak strain was deepened.
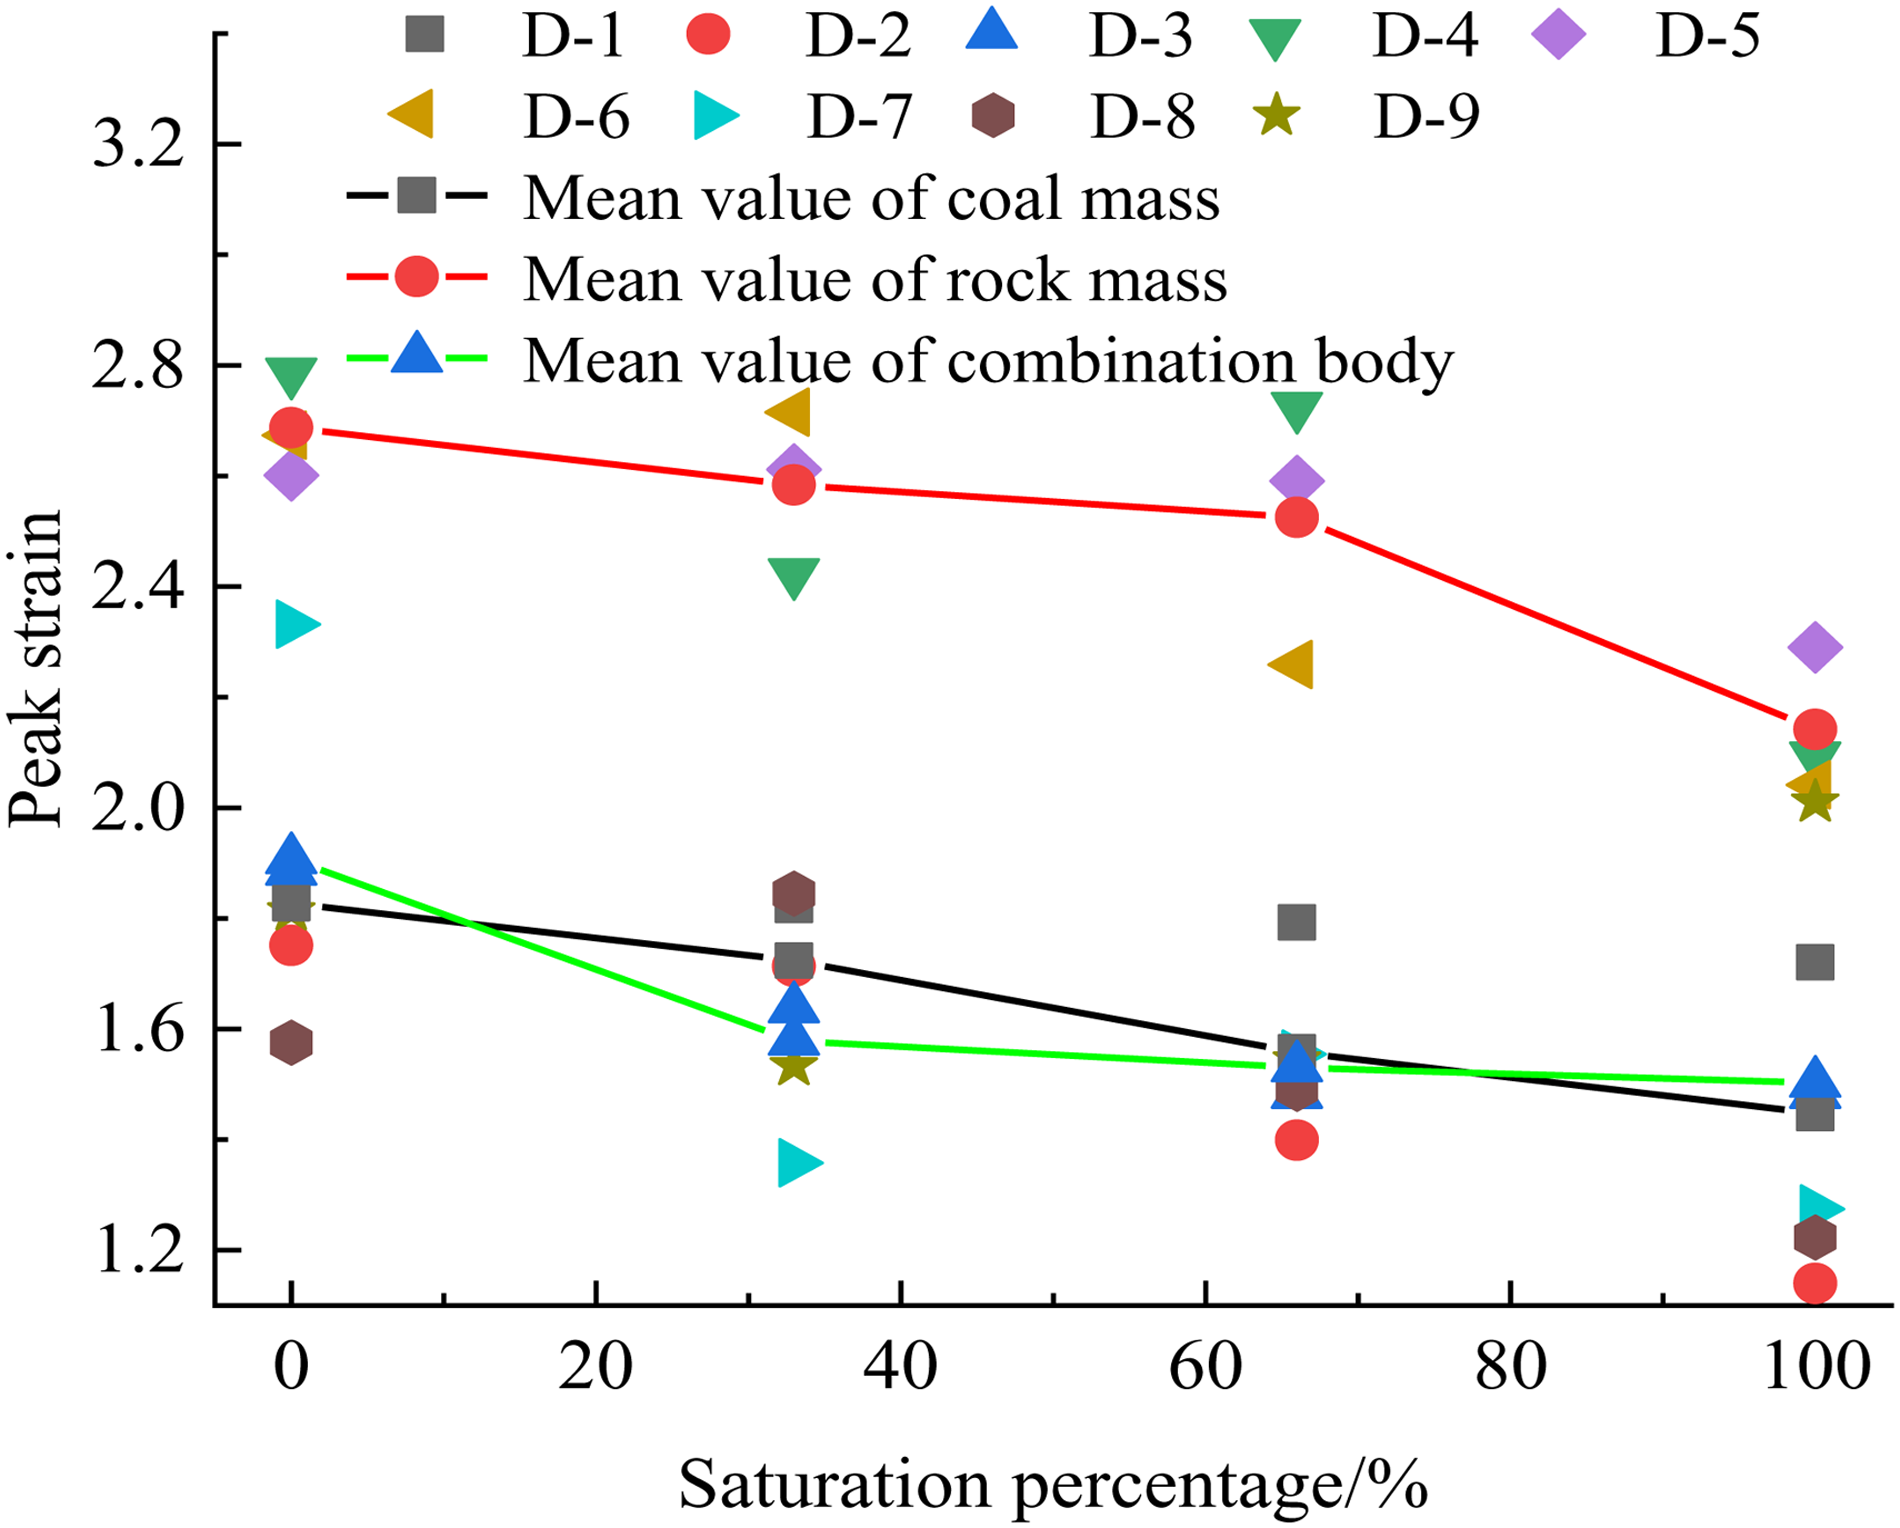
Peak strain and water content in coal, rock, and C-RC samples.
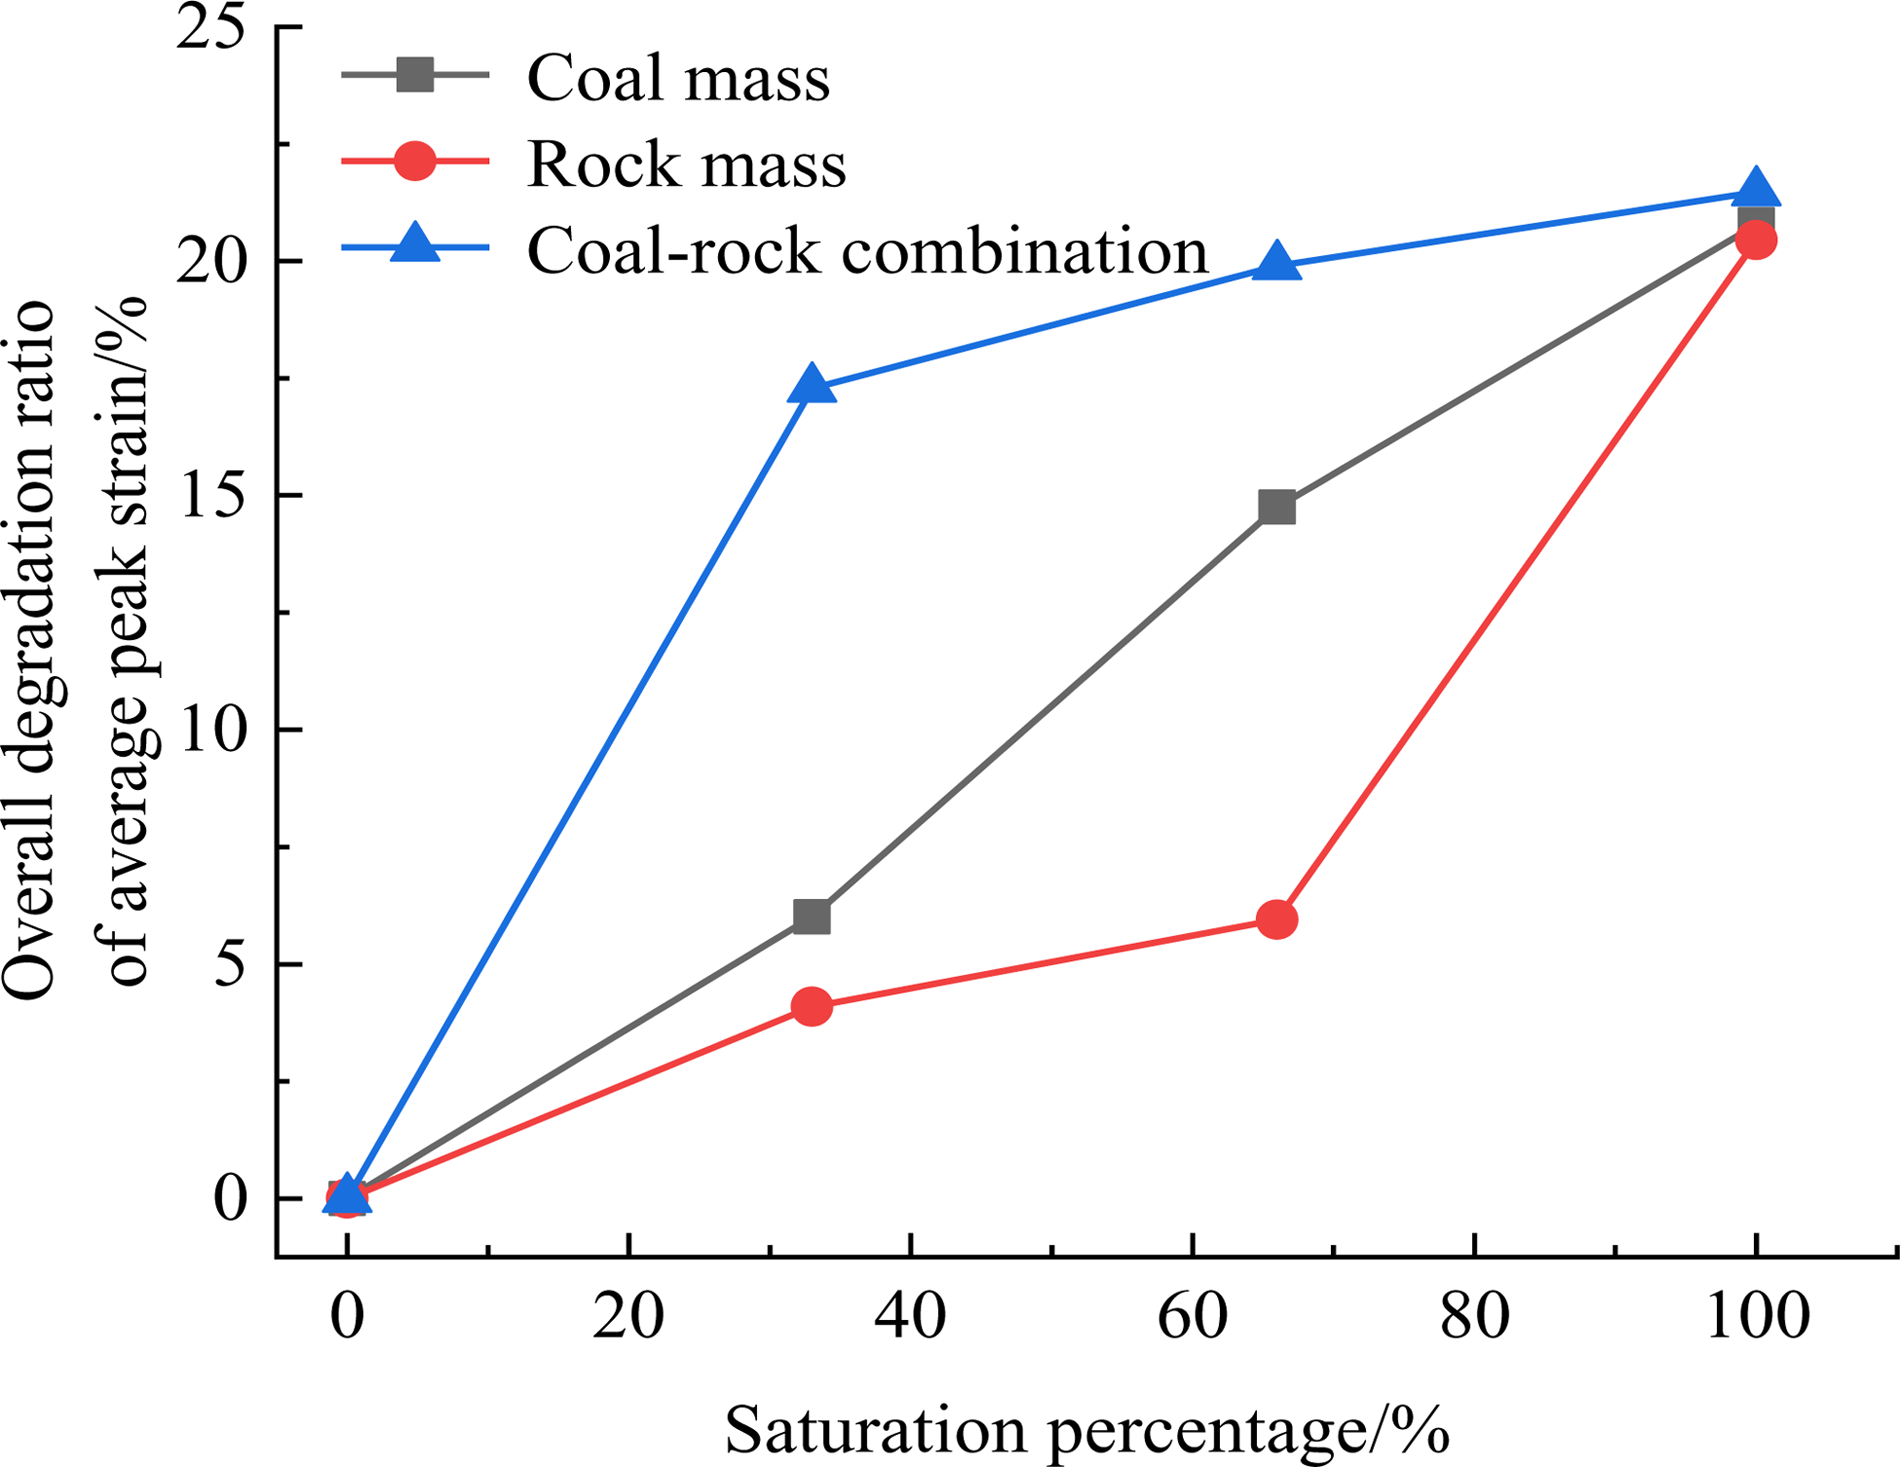
Overall deterioration degree of the average peak strain versus water content in three samples.
Elastic moduli of water-containing samples
Figure 8 shows the variation law of the average elastic moduli of coal, rock, and C-RC versus water content, and Figure 9 shows the relationship between the overall deterioration degree of the average elastic moduli and water content of the three samples. According to Table 1, average elastic moduli of coal, rock, and C-RC samples with different water contents were significantly deteriorated. With the increased water content, the average elastic moduli of all samples dropped down, reaching 3.58, 3.51, 2.98, and 2.78 GPa in coal samples, 9.72, 8.62, 7.96, and 7.86 GPa in rock mass samples, versus 4.21, 4.15, 3.40, and 2.87 GPa in C-RC samples. Compared to samples in a dry state, these values dropped by 0.8, 1.86, and 1.34 GPa in water-saturated coal, rock, and C-RC samples, respectively. The overall deterioration degrees of coal, rock, and C-RC samples were 22.35, 19.14, and 31.83%, respectively. The deterioration of average elastic moduli of coal, rock and C-RC was as follows: C-RC > coal > rock. The analysis showed that the water-containing C-RC sample was more severely eroded and lubricated by water at the coal–rock interface than coal and rock samples, aggravating the overall deterioration degree of the C-RC average elastic modulus.
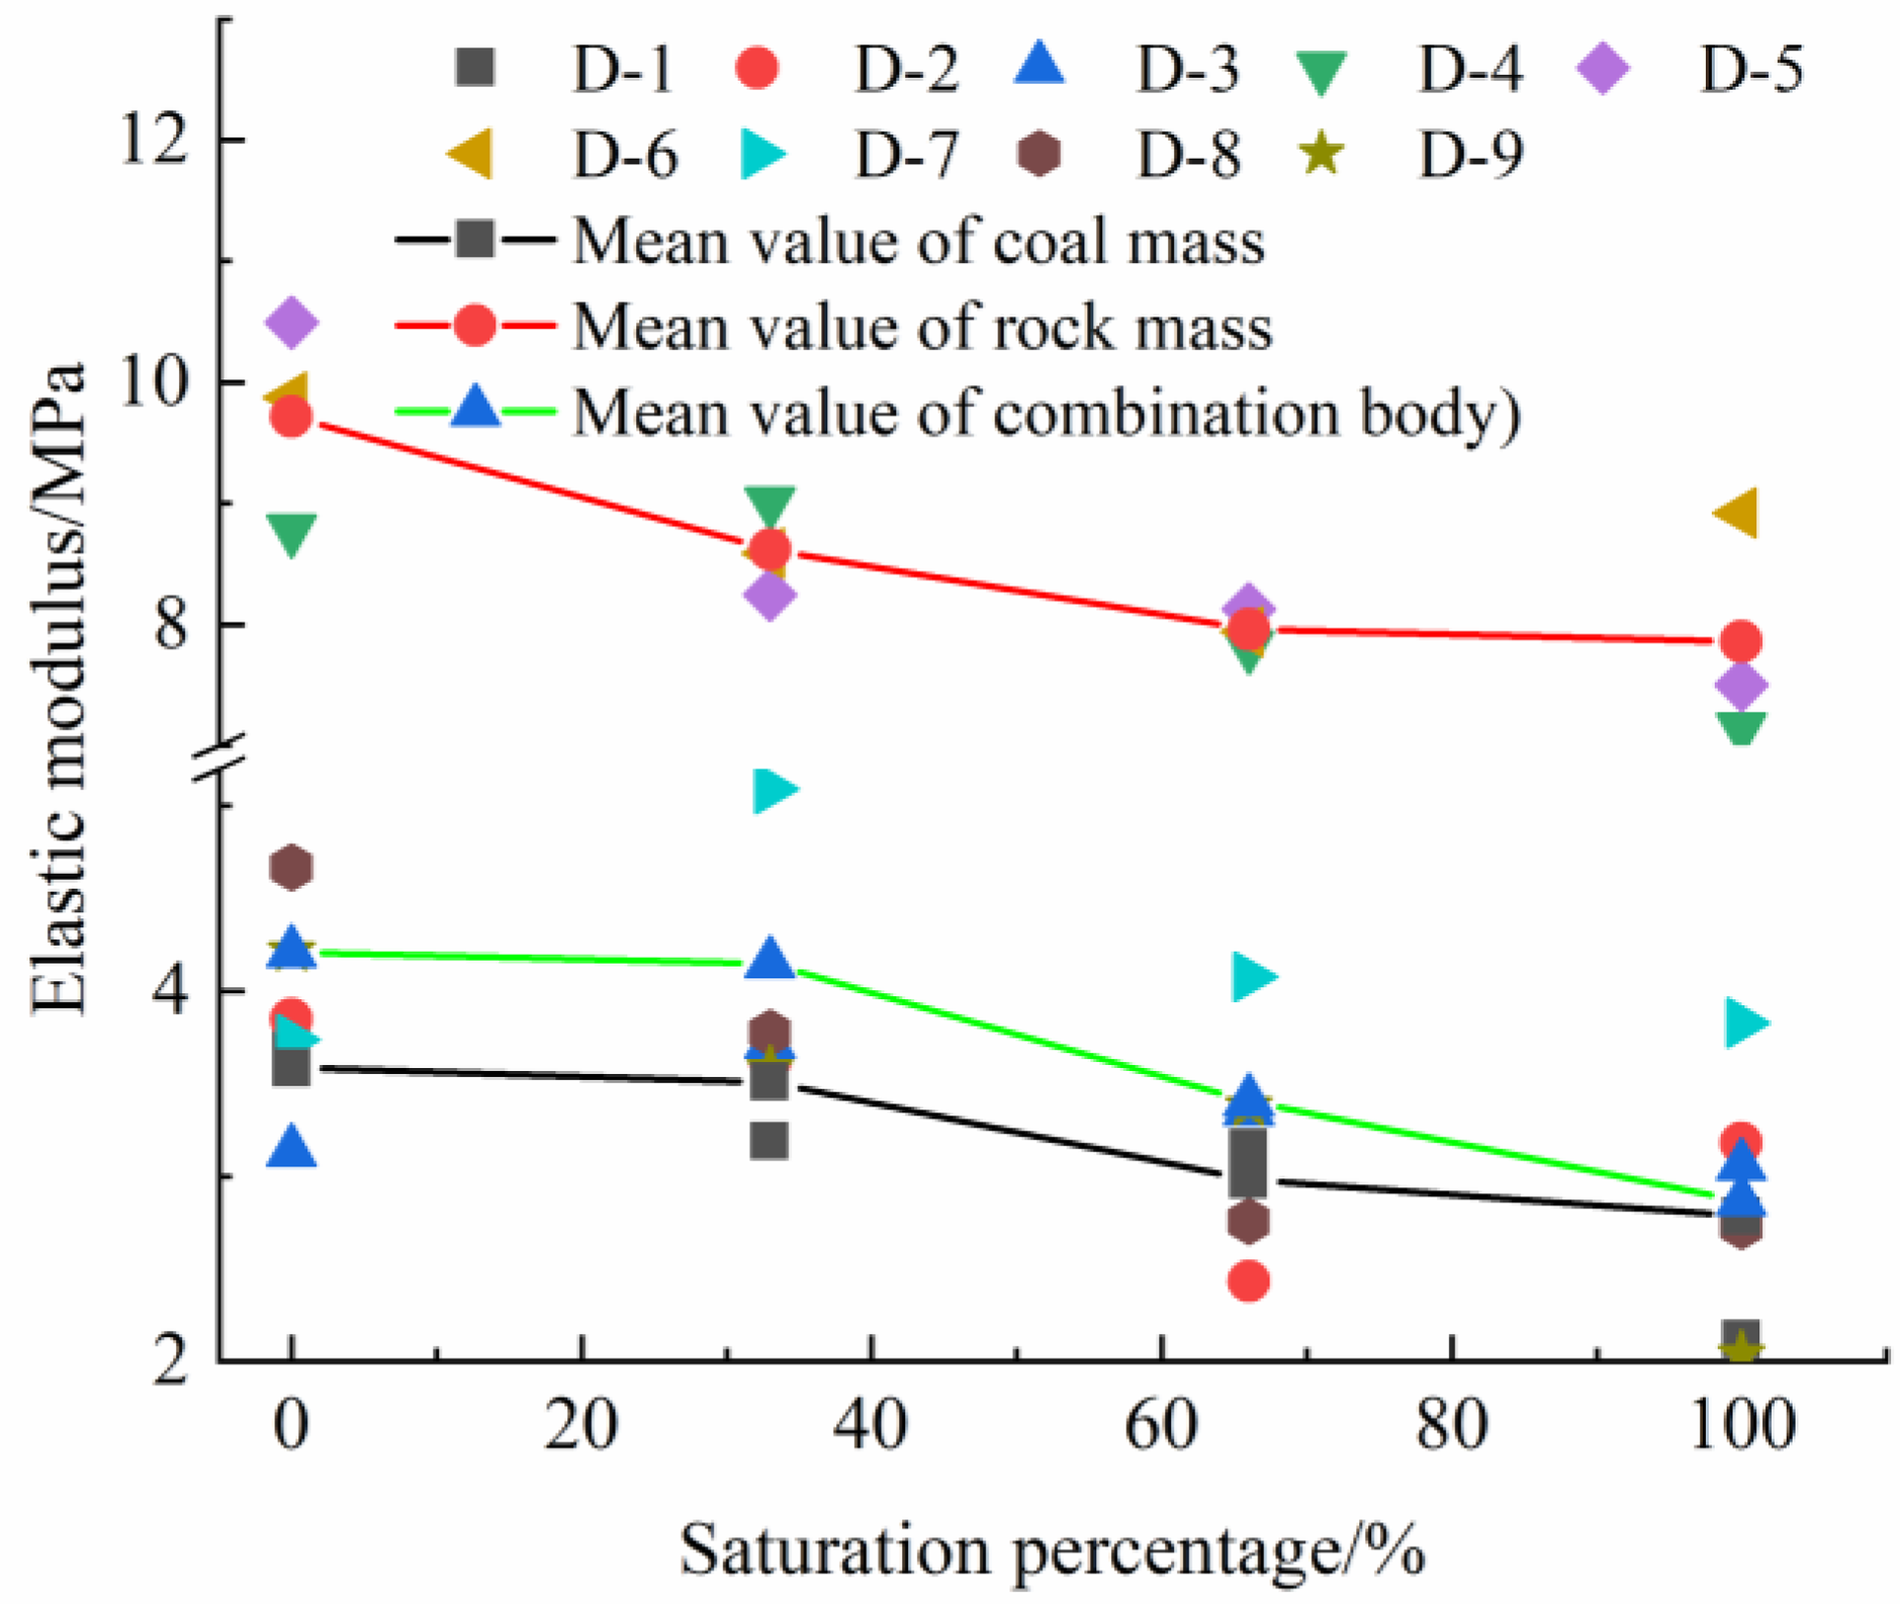
Coal, rock, and C-RC elastic moduli versus water content.
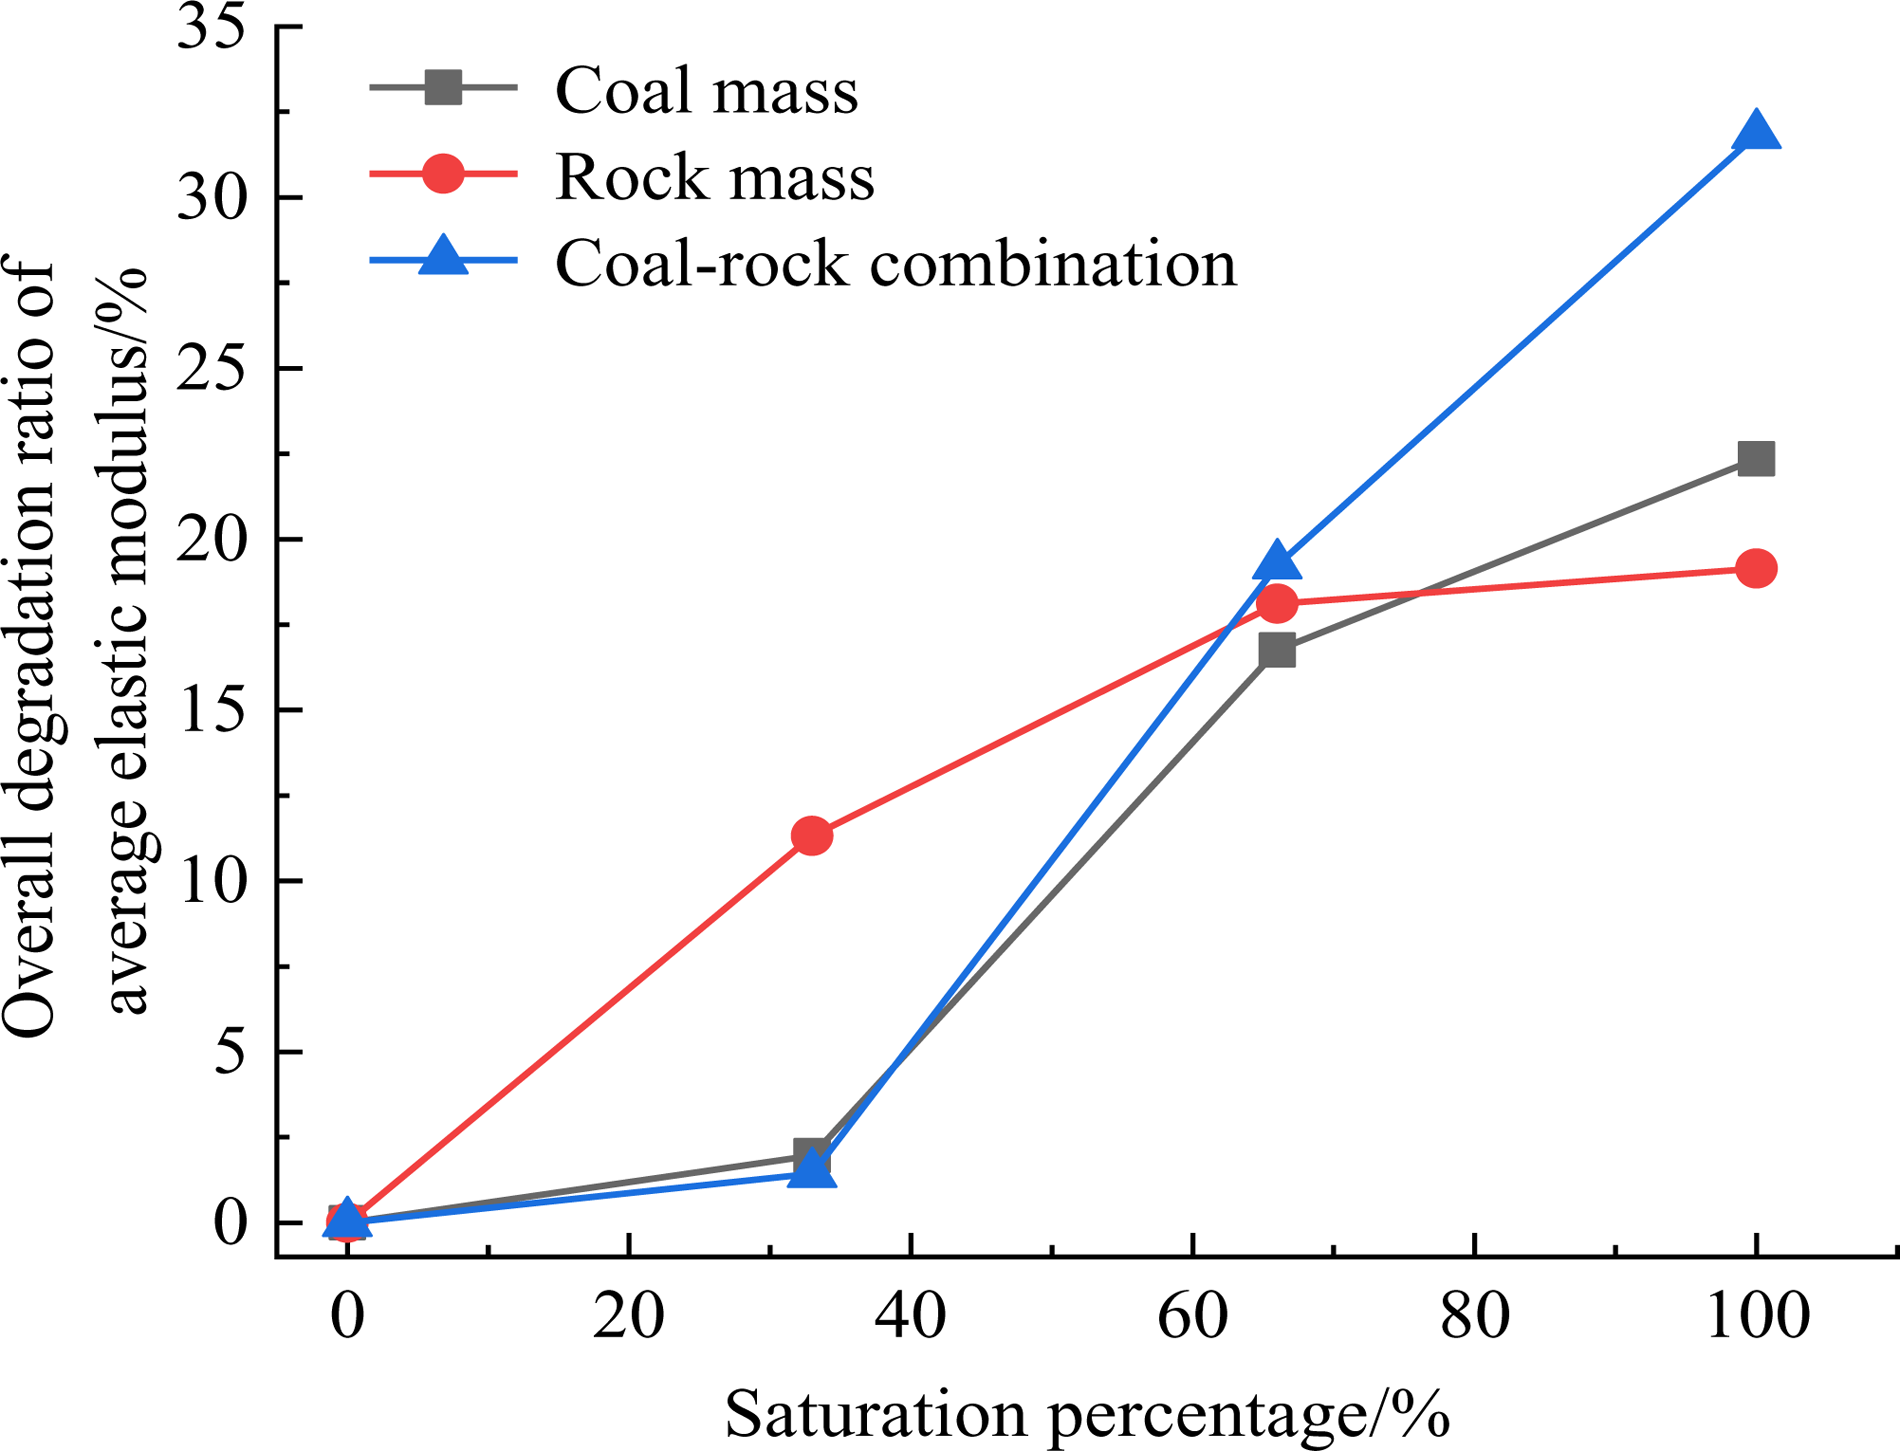
Overall deterioration degree of the average elastic moduli of coal, rock, and C-RC samples versus water content.
Analysis of water-bearing effect on C-RC crack evolution and AE characteristics
Three typical combinations (D-0-7, D-66-7, and D-100-8) were selected to study the evolution of stresses, AE ringing numbers, and AE cumulative ringing numbers. The respective curves were constructed, as shown in Figure 6. The crack evolution law of C-RC and the water-bearing effect on the AE characteristics were analyzed.
It can be seen in Figure 10(a) that during the compaction stage (6s), the primary fissure and coal–rock interface in the C-RC were gradually compacted, with a small number of AE signals. Thus, C-RC samples underwent only slight axial compression. Then, C-RC entered the elastic deformation stage, with a very small AE ringing number. In the stage of plastic deformation (22.5 s), the surface of low-strength coal in the C-RC took the lead in the occurrence of macro-cracks, accompanied by numerous AE signals and slight radial expansion. When the axial load was applied to C-RC, there was no limited external force in the horizontal direction, and the sample could expand with the increased axial force. With the gradual increase of axial load (22.9 s), the main fissure 2 in C-RC's coal body appeared and expanded. The AE ringing number increased rapidly, the maximum AE ringing number reached 527. At this time, the instability failure of the C-RC was about to occur, and the radial expansion was obvious. In the post-peak stage (24s), the C-RC was unstable and damaged, the AE cumulative ringing number reached 19859, and the C-RC sample was damaged only in the coal body.
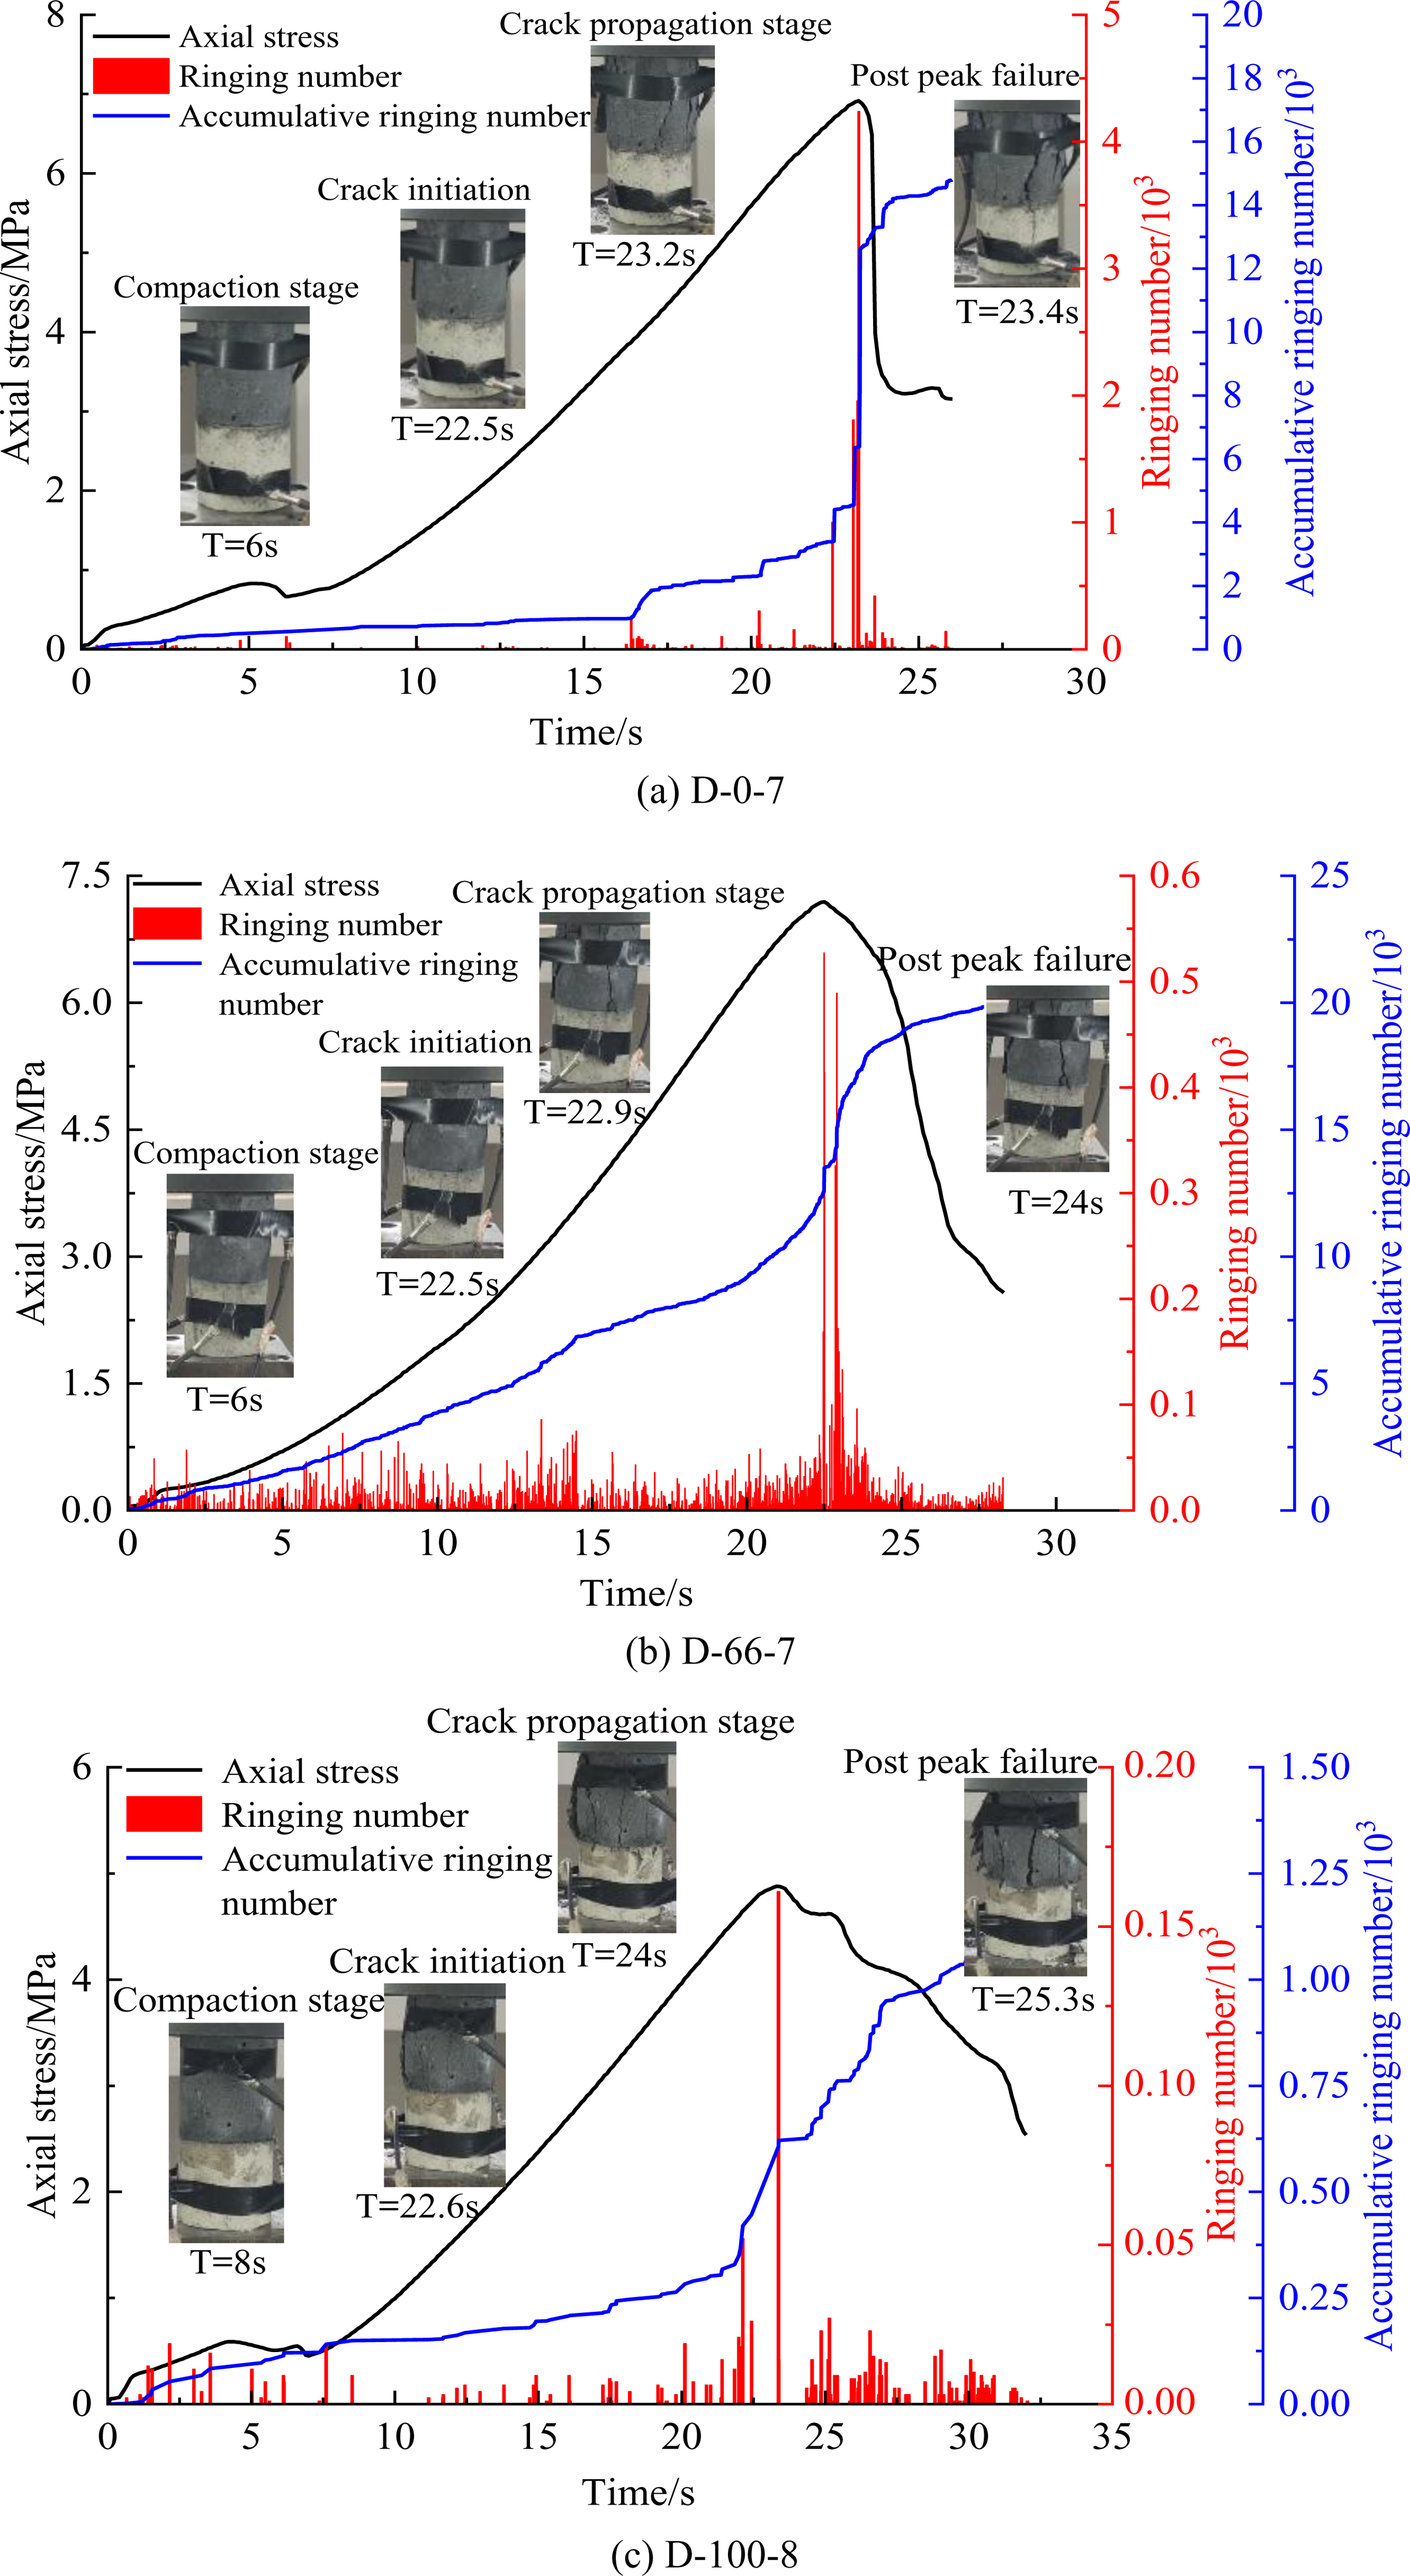
Stress, ringing number, and cumulative ringing number curves as a function of time of the C-RC under different water contents.
As shown in Figure 10(b), during the initial compaction stage (6s), the primary fractures and coal–rock interface in the C-RC were gradually compacted, and the C-RC ringing number was small than that in a dry state. Next, it entered the elastic stage, and the AE ringing number was small. In the plastic deformation stage (22.5s), the surface of low-strength coal in C-RC featured macro-cracks, accompanied by obvious AE signals, and there was slight radial expansion. Then, the crack in the coal body started to propagate at 23.2s, reaching the rock part of the coal–rock interface at 23.4 s; the main fissure developed rapidly in the rock part, and the macro main fissure did not penetrate the coal–rock interface. In this case, the AE ringing number rapidly increased to 4238, and a vertical crack appeared in the coal–rock interface, with obvious radial expansion. In the post-peak stage, the C-RC was unstable and damaged. At this time, the number of AE signals decreased sharply, the AE cumulative ringing number reached 14819, and the coal and rock parts in the C-RC were damaged. The weakening of the coal and rock mass near the coal–rock interface due to the water-bearing effect of the micro-pores and fractures at the coal–rock interface were important factors causing the fracture penetration into the rock mass.
As shown in Figure 10(c), during the compaction stage (8s), the primary fissure and coal–rock interface in C-RC were gradually compacted, with a small number of weak AE signals. In the elastic stage, elastic deformation mainly occurred in C-RC, and the AE ringing number was small. In the plastic deformation stage (22.6s), macro-cracks first appeared in the low-strength coal body in C-RC, accompanied by strong AE signals, and there was slight radial expansion. With the increased axial stress, fractures in the coal body in the C-RC gradually developed (24s). With the penetration of the main fracture in the coal body, the sample became unstable and damaged: there were many secondary fractures around the main crack, the AE ringing number increased rapidly, and the maximum AE ringing number reached 161; the phenomenon of radial expansion was obvious. In the post-peak stage (25s), the C-RC underwent instability and failure. At this time, there was only a small number of weak AE signal, the AE cumulative ringing number reached 932, and the C-RC sample was damaged only in the coal body.
Figure 11 shows the variation law of the maximum and cumulative AE ringing numbers of C-RC samples with different water contents. With the increased water content, the maximum AE ringing number first increased rapidly and then sharply dropped. In view of the C-RC failure characteristics, the macro-failure in C-RC samples (D-0-7, D-100-8) sample occurred only in the coal body, while in D-66-7 sample, it occurred both in the coal and rock parts. No matter whether the C-RC contained water or not, the maximum AE ringing number of coal body at the moment of failure was smaller than that of rock mass, which was why the maximum AE ringing number increased first and then decreased. The maximum AE ringing number of the dry sample (D-0-7) was larger than that of the water-saturated one (D-100-8). The accumulated AE ringing number first decreased slowly and then rapidly, indicating that whether the coal part of rock part of the C-RC was damaged or not, the presence of water would weaken its AE activity. Even if the rock part of the C-RC (D-66-7) was damaged, the AE activity was not as frequent as in the dry coal.
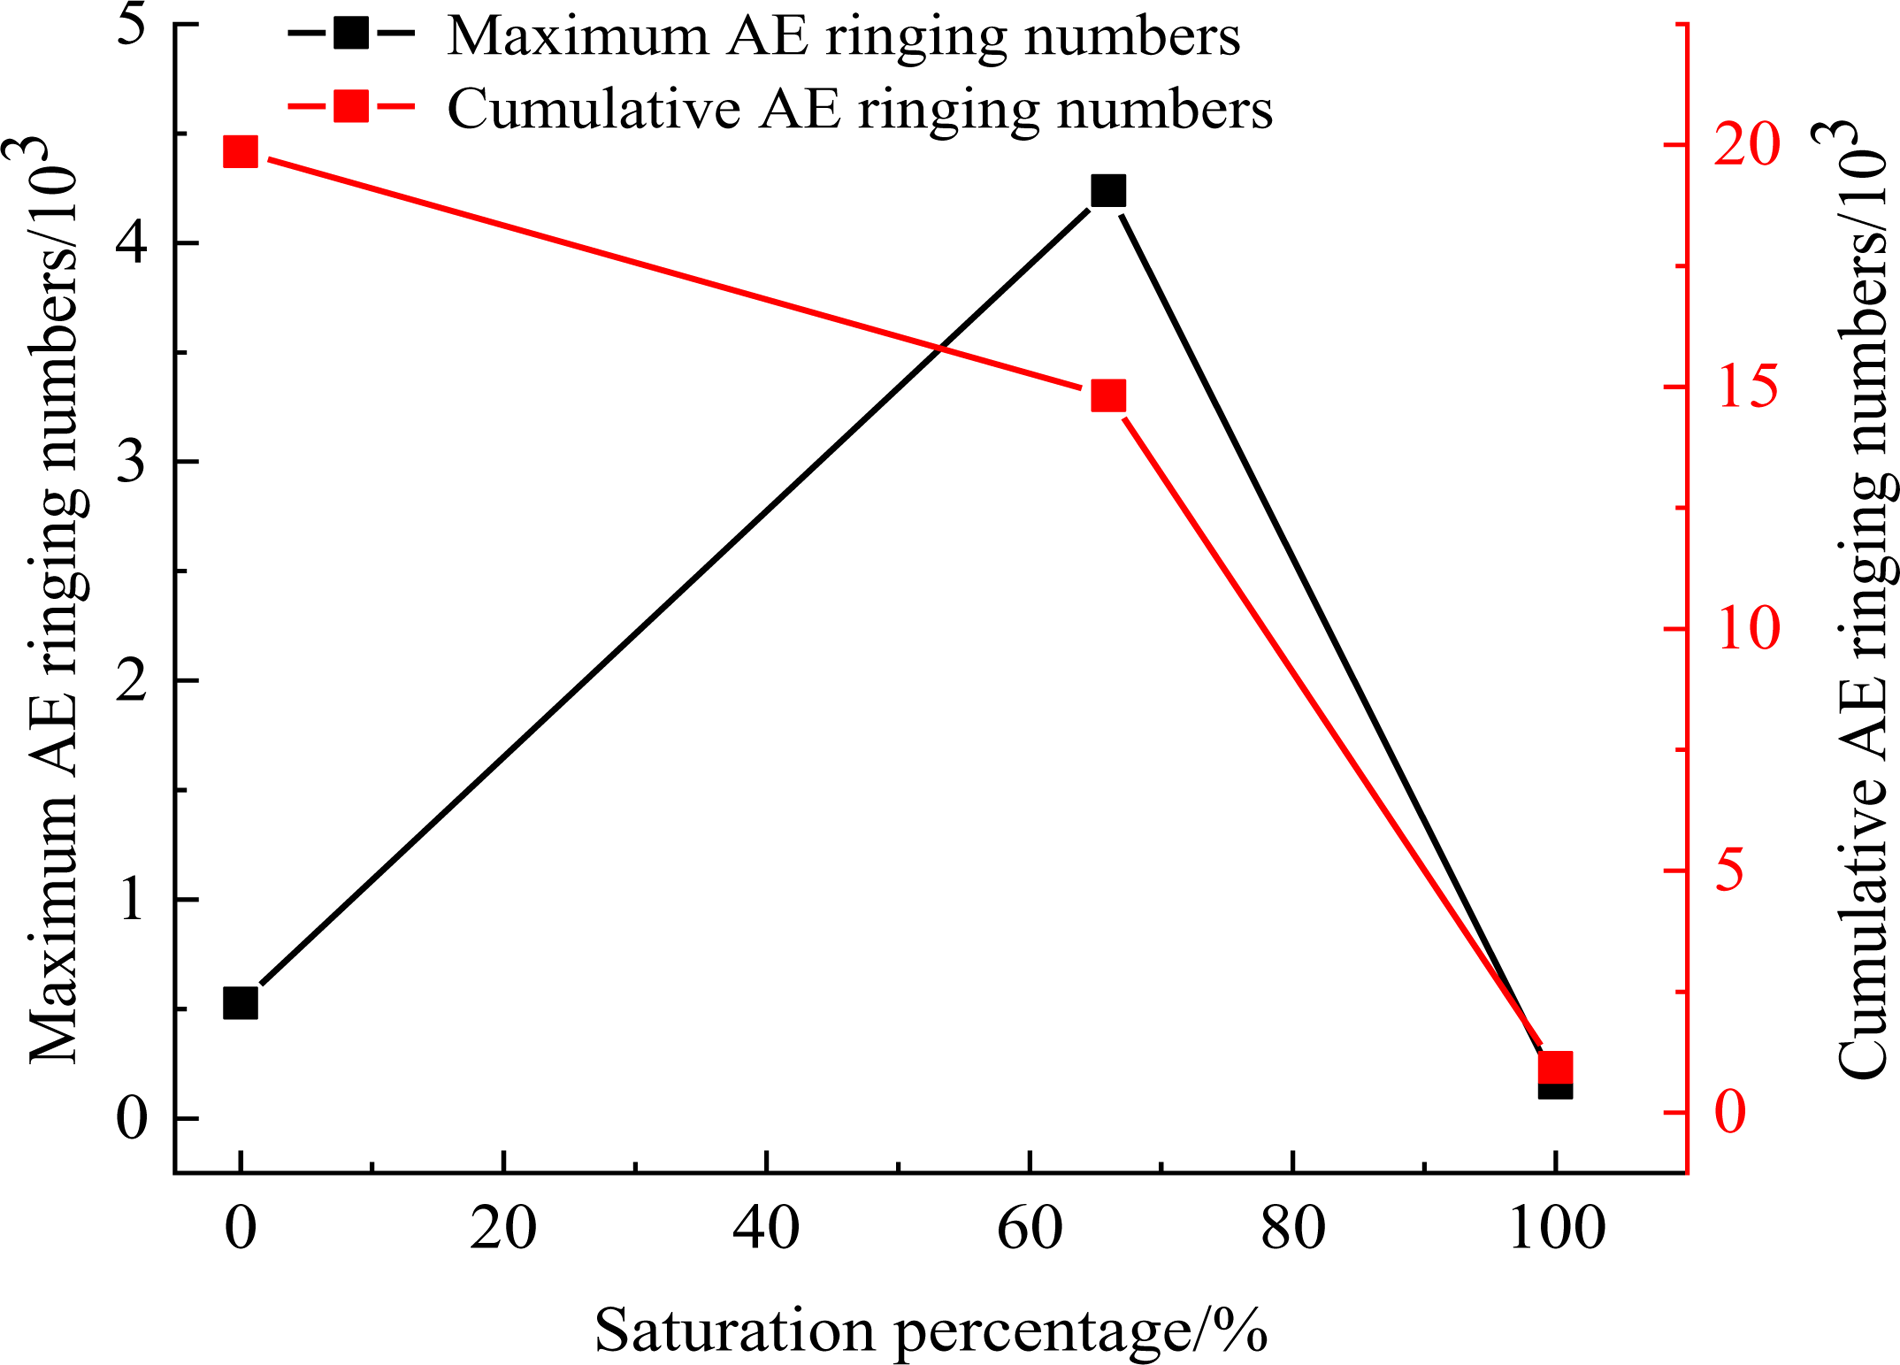
Maximum and cumulative AE ringing numbers versus water content in C-RC samples under different water contents.
Analysis of water-bearing effect on the C-RC failure mode
C-RC immersion characteristics
Figure 12 shows water content curves of the three samples as a function of immersion time. As observed, with the increased immersion time, the water content increment first exhibited a sharp rise and then gradually saturated. This process can be subdivided into the following three stages: (i) accelerated growth zone, transition zone, and saturation zone. In the saturated state, the water content of coal was the highest, followed by the C-RC, and the rock mass was the lowest In the initial stage of immersion (0–40 min), the water contents of the three samples increased rapidly. In the second stage of immersion (40–90 min), the growth rate of water content in the three samples decreased gradually but was large. In the last stage of immersion (90–400 min), although the water content in the three samples increased slightly, it became saturated and remained basically unchanged.
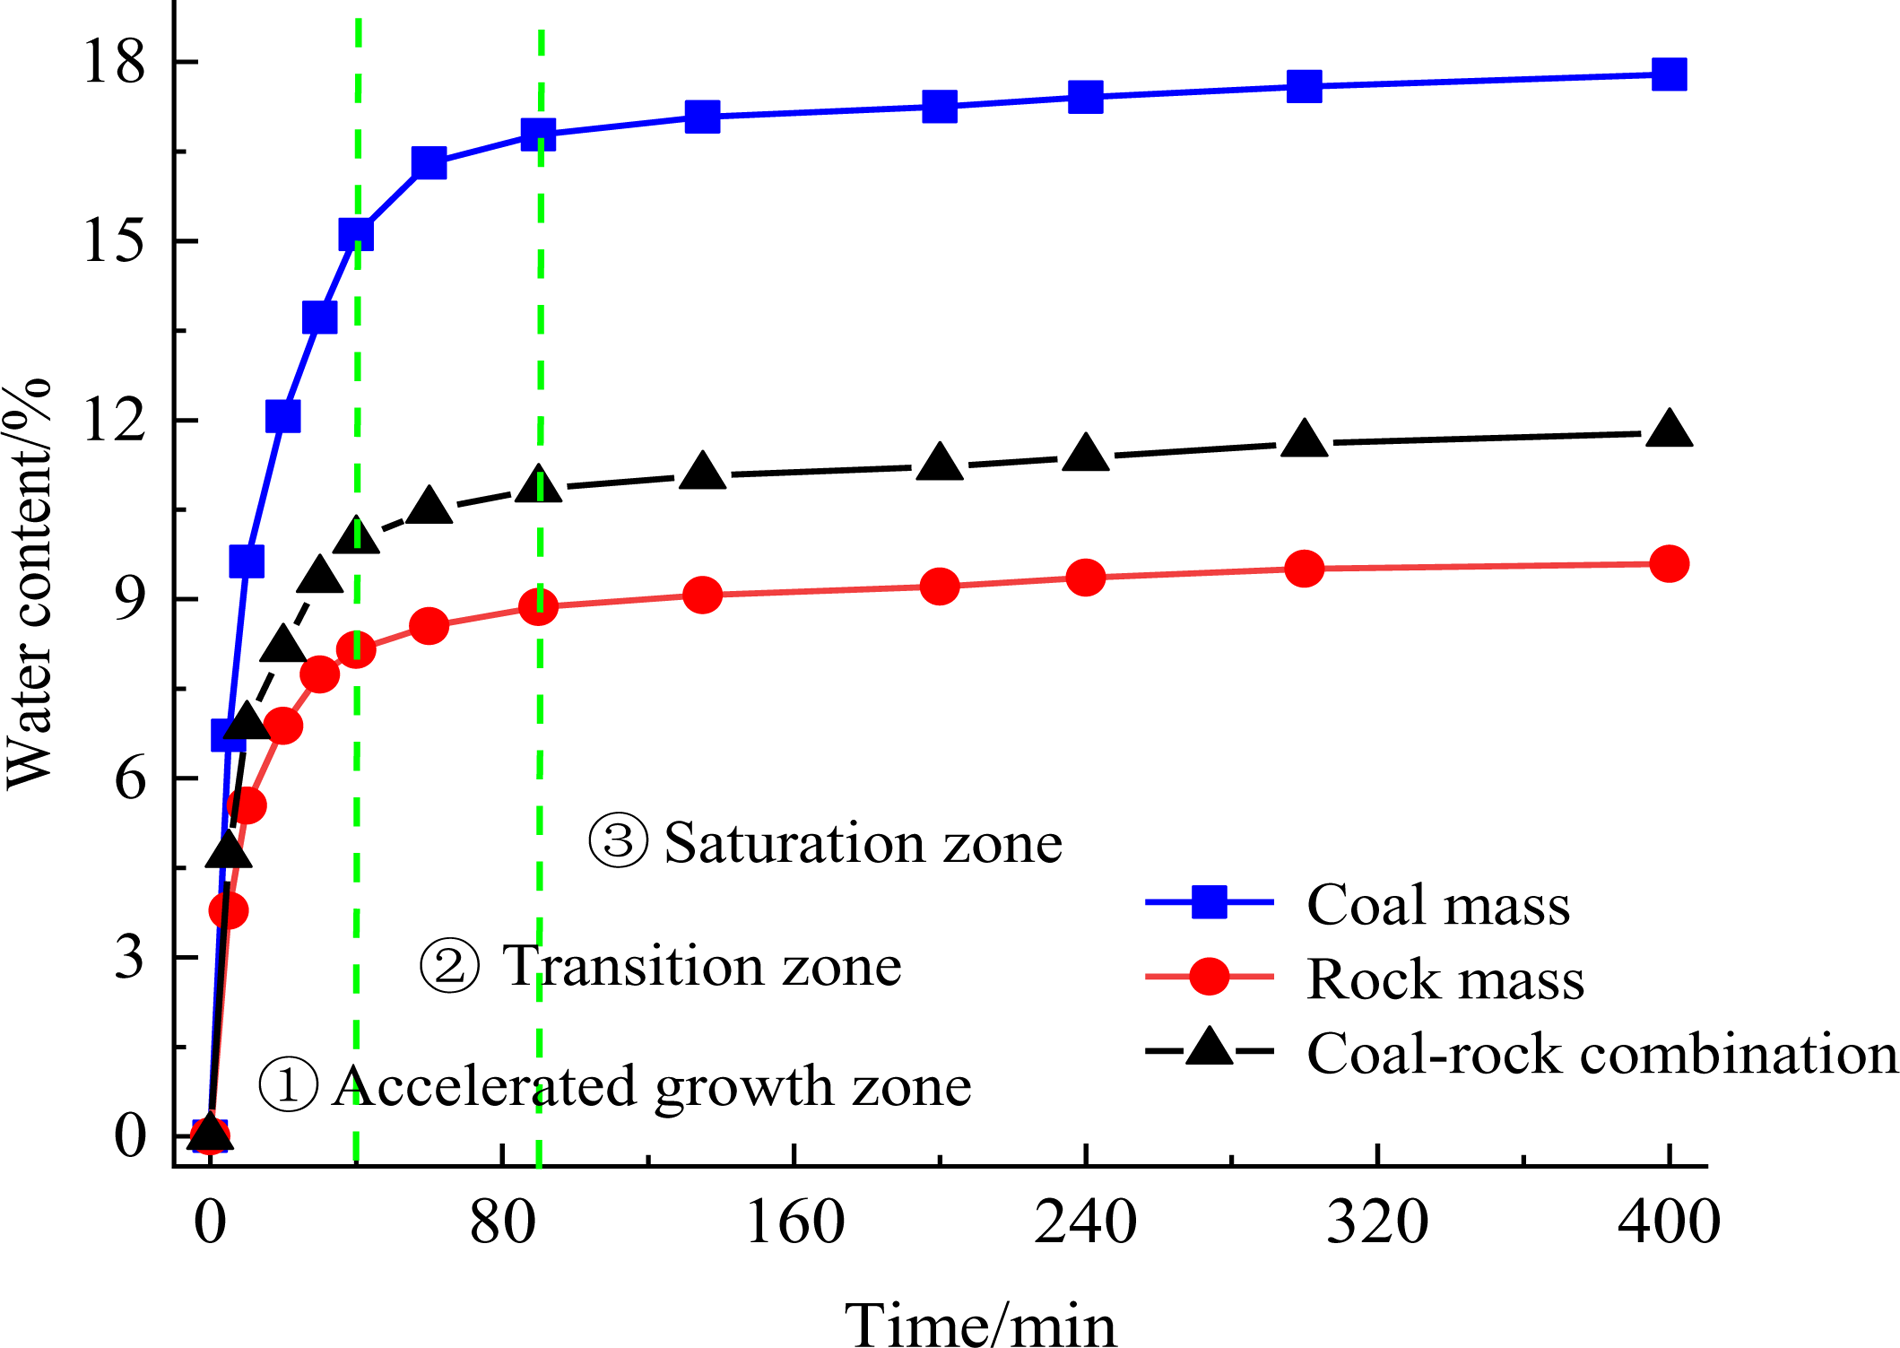
Trend of water content evolution in the three samples as a function of immersion time.
Based on the time effect of water content growth in coal and rock masses, in the first stage, the water content in coal was greater than that in the rock mass at the same immersion time. The water absorption capacity of coal was greater than that of rock mass, and the water absorption amount was larger. Under the same immersion time, the percentages of absorbed water in coal and rock in their respective saturated states were approximately equal, which showed that the mechanical parameters of coal and rock in C-RC were consistent with those of coal and rock mass.
Analysis of failure and instability mechanism of C-RC
Due to the complexity and diversity of coal and rock structures in the actual coal mine, the interface fissures were inevitable. When preparing C-RC sample under laboratory conditions, the formation of the coal–rock interface was naturally bonded by means of pouring and oscillation in the mold. Therefore, there must be some parts similar to the real C-RC structure at the coal–rock interface. Therefore, relevant research is instrumental in exploring the instability and fracture mechanism of underground water-containing C-RC.
Figure 13 shows the failure diagram of water-bearing coal–rock interface. When the water content increased and there was free water between micro-pores and fractures, the squeezing effect of axial load on free water in the connecting area of the coal–rock interface induced the pore water pressure in the adjoining area.
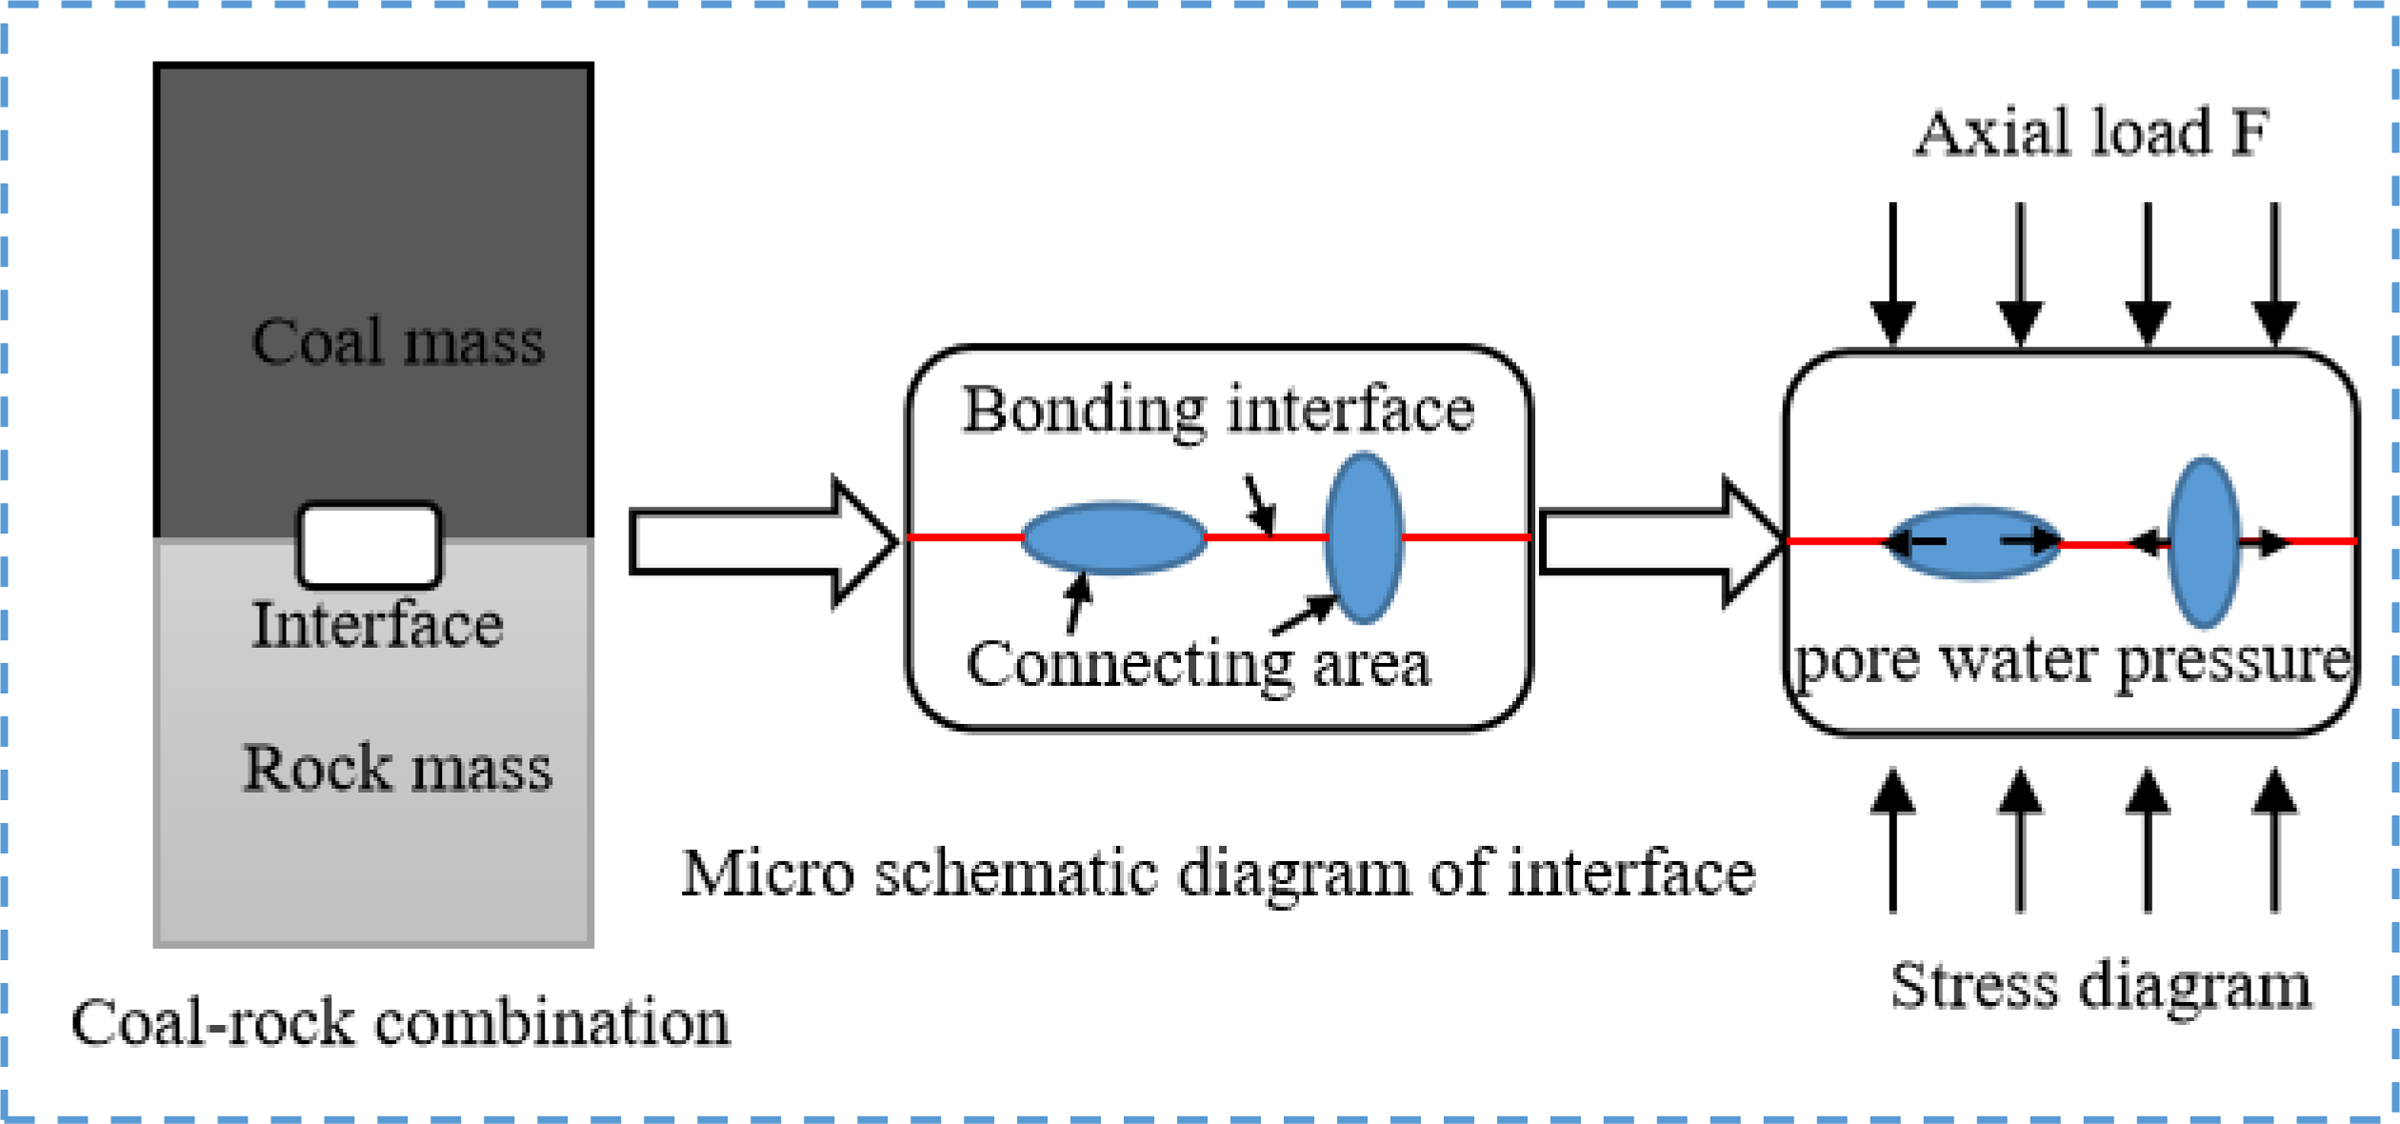
Stress failure of water-saturated coal–rock interface (non-real scale).
At the same time, considering the coupling effect of water content on the weakening of the bonding interface, the coal–rock interface was more fragile. Therefore, it was believed that the water content effect of coal–rock interface was one of the main factors affecting the instability mechanism of C-RC.
Figure 14 shows the physical drawing and sketch drawing of final damage characteristics of C-RC samples with different water contents. Yang et al. (2020b) analyzed the failure characteristics of C-RC with different coal-/rock strength ratios, and considered that a coal–rock strength ratio of 0.25 corresponded to the threshold value at which the rock mass could be damaged. At lower ratios (less than 0.25), only the coal mass was damaged, while the rock mass remained undamaged. In summary, the authors claimed that the failure mechanism of water-containing C-RC was related to the two factors: coal–rock strength ratio and coal–rock interface effect. The current study revealed the following patterns.
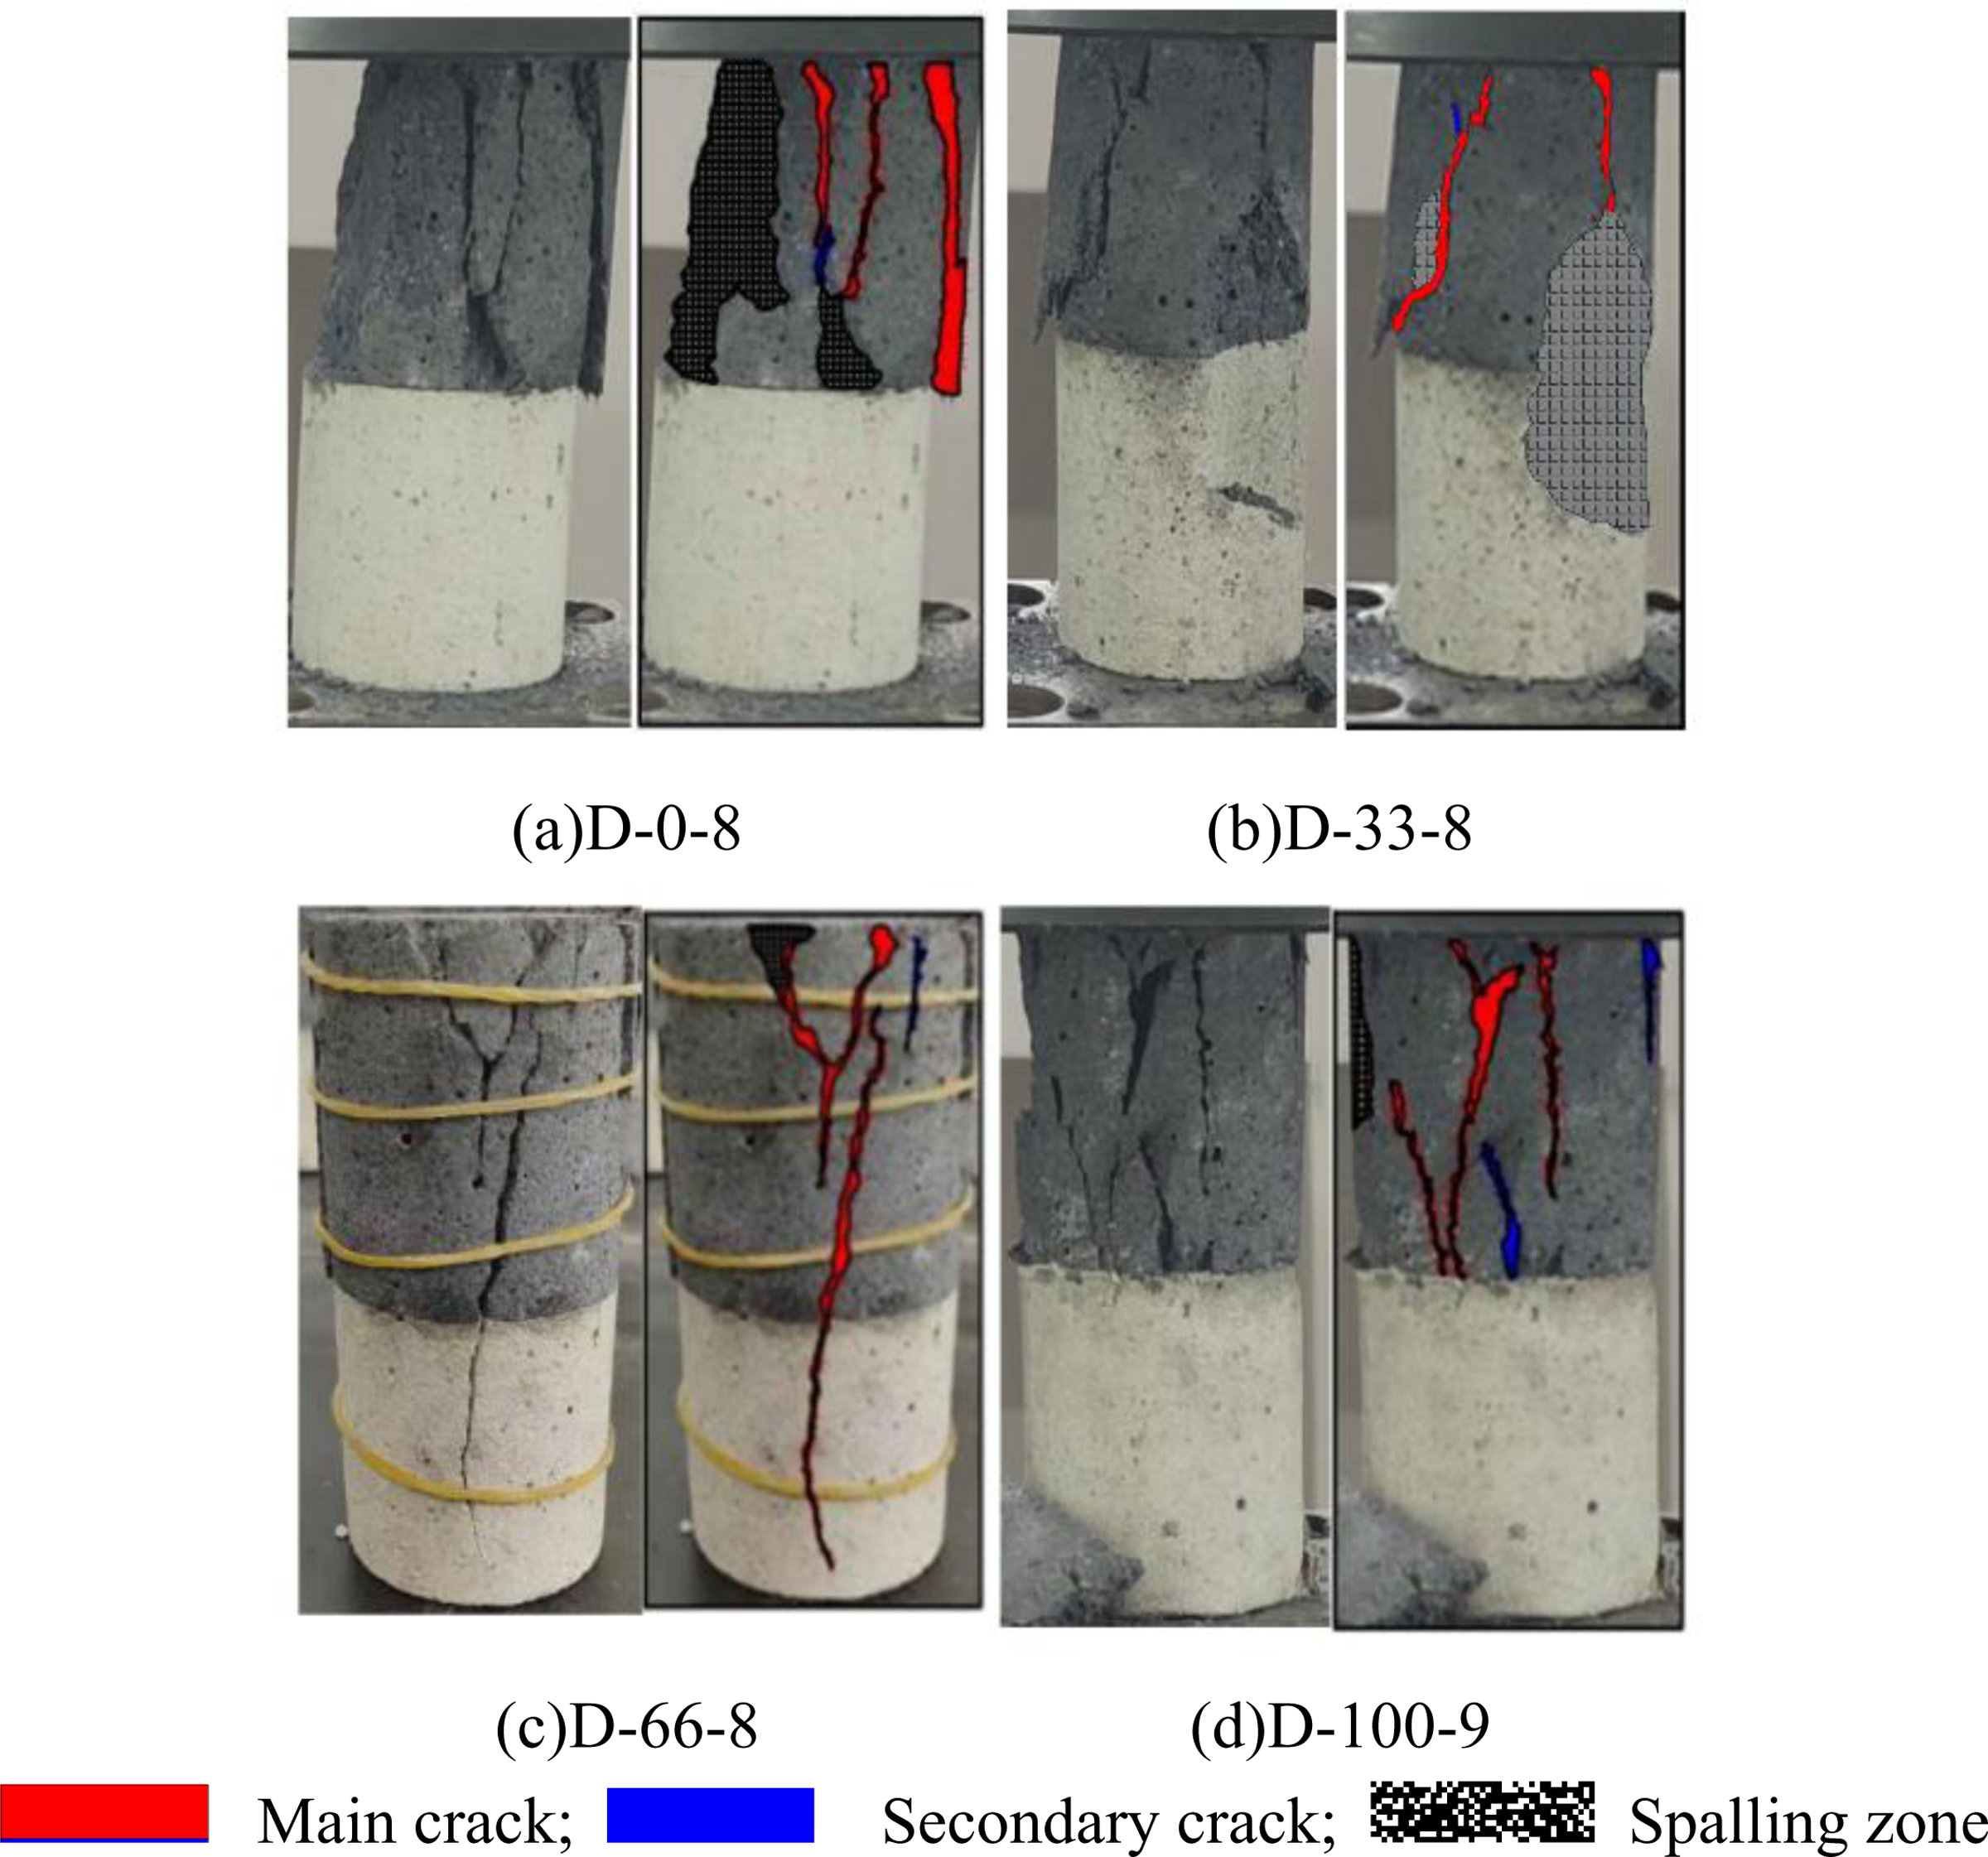
Image and sketch of ultimate failure characteristics of C-RC in different water-bearing states.
In the dry state (D-0-8), the coal body of C-RC first experienced the initiation and propagation of vertical macro-cracks. When these cracks reached the coal–rock interface, no cracking in the rock body was observed yet, and only horizontal collapse occurred at the coal body at the coal–rock interface. When the axial load reached the peak strength of the coal body, it was not enough to cause the macroscopic failure of the rock mass, so the failure of C-RC only occurred in the coal body, indicating that the weakening degree of the coal–rock interface effect on the C-RC was less than the coal–rock strength ratio effect. At this time, the strength ratio of coal and rock mass was about 0.25 (critical value of rock mass failure), which was consistent with the research results of Yang et al. (2019) on the failure law of C-RC under different strength ratios.
At a water content of 4% (D-33-8), the C-RC was mainly damaged in the coal part; small fracture occurred when the crack extended to the rock part, and some rock fragments peeled off. When the coal body was damaged by the axial load, the water in the cracks and coal–rock interface micro-pores existed in the form of bound water; the interface was weakened to a certain extent by water-bearing effect, resulting in a slight spalling of the rock body. At this time, the strength ratio of coal and rock mass was 0.271 > 0.25 (critical value of rock mass failure), and the strength evolution was consistent with the failure pattern, which indicated that the coal–rock strength ratio was the leading factor of the failure of C-RC.
At a water content of 8% (D-66-8), the C-RC first experienced a Y-shaped shear crack failure in the low-strength coal body, and then a shear crack in the coal expanded into the rock mass through the coal–rock interface, gradually developing into a vertical crack in the rock mass. When the low-strength coal body was damaged by the axial load, the crack penetrated through the interface and produced macro-cracks in the rock mass; the degree of weakening of the interface was further enhanced by the water-bearing effect. At this time, the coal–rock strength ratio was 0.279 > 0.25 (critical value of rock mass failure), which was similar to the C-RC sample (D-33-8) with a water content of 4%, and the strength evolution was consistent with the failure pattern. At this time, the coal–rock strength ratio was still the dominant factor controlling the C-RC failure.
In the saturated state (D-100-9), the C-RC failure occurred only in the coal body. Compared with the dry state, the difference was that the vertical crack and shear crack existed alternately, and there were more secondary cracks around the main crack. The main reason was that the degradation effects such as dissolution, lubrication and water wedge occurred in the sample under the condition of water saturation, resulting in the occurrence of shear cracks. At this time, the strength ratio of coal and rock mass was 0.512 > 0.25, reaching the maximum value compared with the previous water-bearing states. According to the strength law, the coal and rock parts should be damaged at this time. It can be seen that the strength evolution pattern inconsistent with the failure pattern of the sample. The reason was that in the water-saturated state, the coal–rock interface micro-pores, cracks were full of free water, under the action of axial load, the compaction process of micro-pores and cracks caused the free water to be squeezed, and the micro-pores and cracks expanded along the transverse weak joint surface of coal and rock, resulting in the secondary damage of the coal–rock interface, and the transverse sliding failure of the coal body at the interface. At this time, the water-bearing effect of the coal–rock interface in coal rock C-RC was the dominant factor controlling the C-RC failure.
Conclusions
With the increase of immersion time, the increase rate of water content in coal, rock, and C-RC samples gradually decreased. This process can subdivided into three stages: accelerated increase zone, transition zone, and saturation zone. In the water-saturated state, the water content of coal body was the highest, followed by the C-RC, and the rock mass was the lowest Under the same immersion time, the percentages of water absorbed by coal and rock mass in their respective saturated states were approximately equal, indicating that the mechanical parameters of coal and rock in C-RC were consistent with those of separate coal and rock masses.
Stress–strain curves of coal, rock, and C-RC samples contained the following four stages: compaction, elastic deformation, plastic deformation, and post-peak failure. With the increased water content, the average peak strengths, average peak strains, and average elastic moduli of coal, rock, and C-RC samples showed an obvious deterioration, which could be ranked as follows: C-RC > coal body > rock mass.
With the increased water content, the maximum AE ringing number first increased rapidly and then sharply dropped, while the AE cumulative ringing number decreased slowly and then rapidly, indicating that the presence of water would weaken the AE activity in both coal and rock parts of C-RC. Even if the rock part of water-containing C-RC (D-66-7) was damaged, the cumulative AE activity was less pronounced than in a dry-state C-RC sample.
The failure mechanism of water-bearing C-RC was related to the coal–rock strength ratio and rock and the water content effect of coal–rock interface. During the transition from dry-state to water-saturated state, the macroscopic failure mode of C-RC showed the law of only coal fracture (0%)—small fracture at coal–rock interface (4%)—both coal and rock fracture (8%)—only coal fracture (12%). With the increased water content, the water-bearing effect of C-RC interface gradually became dominating factor controlling the C-RC fracture.
Footnotes
Acknowledgment
We are very grateful to the reviewers and editors for their valuable comments and suggestions.
Declaration of conflicting interests
The author(s) declared no potential conflicts of interest with respect to the research, authorship, and/or publication of this article.
Funding
The author(s) disclosed receipt of the following financial support for the research, authorship, and/or publication of this article: The key projects of the joint fund of the National Natural Science Foundation of China (U21A20110), the Major Special Projects of Science and Technology in Shanxi Province (20191101016) and the Institute of Energy, Hefei Comprehensive National Science Center (Anhui Energy Laboratory).