
Abstract
The rapid rise of glacioeustatic change is the most extreme paleoenvironment alteration in the aftermath of Snowball Earth. Although geologists conducted a lot of multi-subdiscipline research on this issue previously, there still exists the potential room for further discussions of the process in detail. For decades, the practice proved that the Fischer plot is a simple and robust tool to illustrate the fluctuations of accommodation patterns v.s. cycle sets or strata depth which could be interpreted as relative sea-level changes. This research simulates the Fischer plot to unravel the sea-level change in the aftermath of Marinoan glaciation by measuring the lower Ediacaran Doushantuo Formation in Shennongjia, South China. The result shows that 131 fifth-order cycles and nine third-order cycles help us propose a completed second-order cycle variation of ice melting-forced sea-level change, i.e., (1) early high-frequency and slow to rapid stepwise rising, and (2) followed by a stable decrease in the latter. In addition, the vertical sedimentary facies of the lower Doushantuo Formation display, in ascending order, (1) intertidal carbonate rock, (2) subtidal clastics with turbidite, and (3) intertidal lagoon fine clastics, indicating the process of the relative waxing and waning of sea-level. Such interpretation of the Fischer plot and the sedimentary facies’ vertical evolution is beneficial for studying the high-frequency sea-level change and paleogeographic reconstruction of post-Marinoan deglaciation.
Introduction
The Earth system has experienced dramatic transformations through the most significant perturbation in the aftermath of Snowball Earth (Allen and Hoffman, 2005; Benn et al., 2015; Creveling and Mitrovica, 2014; Mitchell et al., 2021). The global ice-sheets melting forced a substantial rise in eustatic change (Hoffman et al., 1998; Hoffman and Schrag, 2002; Hoffman et al., 2007; Hoffman and Macdonald, 2010; Hoffman, 2011; Hoffman et al., 2017; Myrow et al., 2018; Yang et al., 2017). Aiming to reveal the post-deglaciational sea-level change, previous scholars divide the Marinoan deglacial epoch into three phases, e.g., pre-, syn-, and post-melting stages, by the effects of glacial eustasy (global mean sea level), the glacio-isostatic adjustment (GIA), hydro-isostatic adjustment, and ocean warming thermal expansion on our rotating planet, which well summarised and discussed by Hoffman et al. (2017). According to GIA theory, Creveling and Mitrovica (2014) suggested that the strata capping Snowball-earth glaciogenic units may reflect a complicated sea-level change, including syn-deglacial sea-level fall or stillstand and post-deglacial sea-level rise. By interpreting several cap dolostone physical models, Irie et al.(2019) believe that post-deglacial relative sea-level first drops and then rises in the aftermath of the Marinoan (635 Ma) snowball Earth. Based on the research of the ripples and tidal cross-beddings preserved in Elatina formation, South Australia, Myrow et al. (2018) proposed that the sea level has risen at an astounding rate of 20 to 27 cm per year in the aftermath of snowball Earth.
In addition, as a significant window for unraveling the paleo-environment alteration during the late Neoproterozoic, the Ediacaran Doushantuo Formation (635–551 Ma) in South China has become one of the research highlights (Wang et al., 1999, 2001; Condon et al., 2005; Yin et al., 2005; Zhang et al., 2005; Zhu et al., 2007, 2013; Mcfadden et al., 2008; Liu et al., 2009; Li et al., 2010; Jiang et al., 2011; Zhou et al., 2017). The Doushantuo formation was subdivided into four members and could be correlated well regionally, according to the relationship between sedimentary evolution and stratigraphic succession, which is mainly controlled by sea-level change (Wang et al., 1999; 2001; Wang and Li, 2001, 2003; Mei et al., 2006; Zhu et al., 2007, 2013; Jiang et al., 2011; Liu et al., 2012a; Zhou et al., 2021). The rising sea-level change in the early Doushantuo stage came to be a wide agreement, which led to the formation of the carbon-bearing, phosphatic, shale-dominate, starved or condensed sections and composed of several sets of transgressive system tract and highstand system tract (Wang et al., 2001; Wang and Li, 2003; Mei et al., 2006; Zhu et al., 2007, 2013; Jiang et al., 2011). In recent years, based on the Astro-cyclostratigraphic results, researchers proposed that the sedimentary rates were variable during the depositional period of Doushantuo Formation, which reflected the complex relative sea-level change (Gong et al., 2017, 2019; Sui et al., 2018; Liu et al., 2020; Xue et al., 2020; Li et al., 2022).
While there is still a fuzzy understanding of the early Ediacaran eustatic changes in details, e.g., cyclic or monoclinal, high- or low-frequency, slow or fast? Besides the research methods mentioned, the dacades practice proved that the Fischer plot is a simple and practical tool to illustrate the fluctuations of accommodations which could be interpreted as relative sea-level changes (Appendix 1 Table Spl. 1) (Liu et al., 1999, 2012b; Mei et al., 2001; Meng and Ge, 2004; Tucker et al., 2009; Peng et al., 2013; Lin and Hou, 2014; Cho and Hong, 2021).
Besides the significance of the foresaid glacial-postglacial paleoenvironments, microfossil assemblage, geological events and stratigraphy, the Doushantuo Formation is also an important ore producing strata, e.g., phosphate or manganese, etc. (e.g., Zhang et al., 2019; Gao et al., 2021). Especially deserve to indication, recent explorations and researches have made breakthroughs that the Neoproterozoic provides an important geological record of organic carbon cycling, and hydrocarbon accumulation in the upper Yangtze craton (e.g., Wang et al., 2019; Zhai et al., 2020; Xiao et al., 2021). The stacking pattern of lithofacies and tectonic evolution is the basic controlled factors for the carbon or hydrocarbon and reservoirs by the theoretical understanding of shale gas accumulation (Zhao et al., 2017, 2020; Wang et al., 2019; Xiao et al., 2021). This study, for sea-level change and sedimentary model of the lower Doushantuo Formation in Shennongjia, is a piece of important jigsaws for the lithofaices paleogeographic pattern during the Late Neoproterozoic.
In Shennongjia area, the Mahuanggou section has rhythmic characteristics of the lower strata of the Doushantuo Formation. It is an excellent object to study the extreme sea-level change process of drastic environmental transformation in the aftermath of the Marinoan glaciation. We simulate the Fischer plot by measuring the low Doushantuo Formation at Mahuanggou section, Shennongjia, south China. This study would provide primary geological evidence for understanding the extreme transition from the icehouse to greenhouse after the Marinoan deglaciation.
Geological setting
The Shennongjia area is located at the northern margin of the Yangtze block (Figure 1A). It is geographically in the eastern part of Daba mountain, adjacent to the southern margin of the Qingling tectonic belt (Li et al., 2009; Bai et al., 2020). Shennongjia is a tectonic dome comprising the Mesoproterozoic Shennongjia Group in the core unconformably overlain by the Neoproterozoic to the Phanerozoic (Li and Leng, 1987; Ye et al., 2017; Bai et al., 2020; Kuang et al., 2022), which is distributed zonally around the dome (Figure 1B). In ascending order, the Neoproterozoic strata in Shennongjia are the Tonian Liantuo Formation, the Cryogenian, and the Ediacaran Doushantuo and Dengying formations (Figure 1C). The Liantuo Formation is purplish-red and greyish green coarse sandstone with cross-bedding. The Cryogenian Gucheng (Sturtian glaciation) and the Nantuo (Marinoan glaciation) Formations consisted of glacial diamictites, which is intercalated with interglacial shale/mudstone of Datangpo Formation (Bai et al., 2020; Chen et al., 2021). The Doushantuo Formation is a series of mixed deposited succession, including carbonate and fine clastics layers. The Dengying formation is mainly composed of dolomite and black argillaceous siltstone.
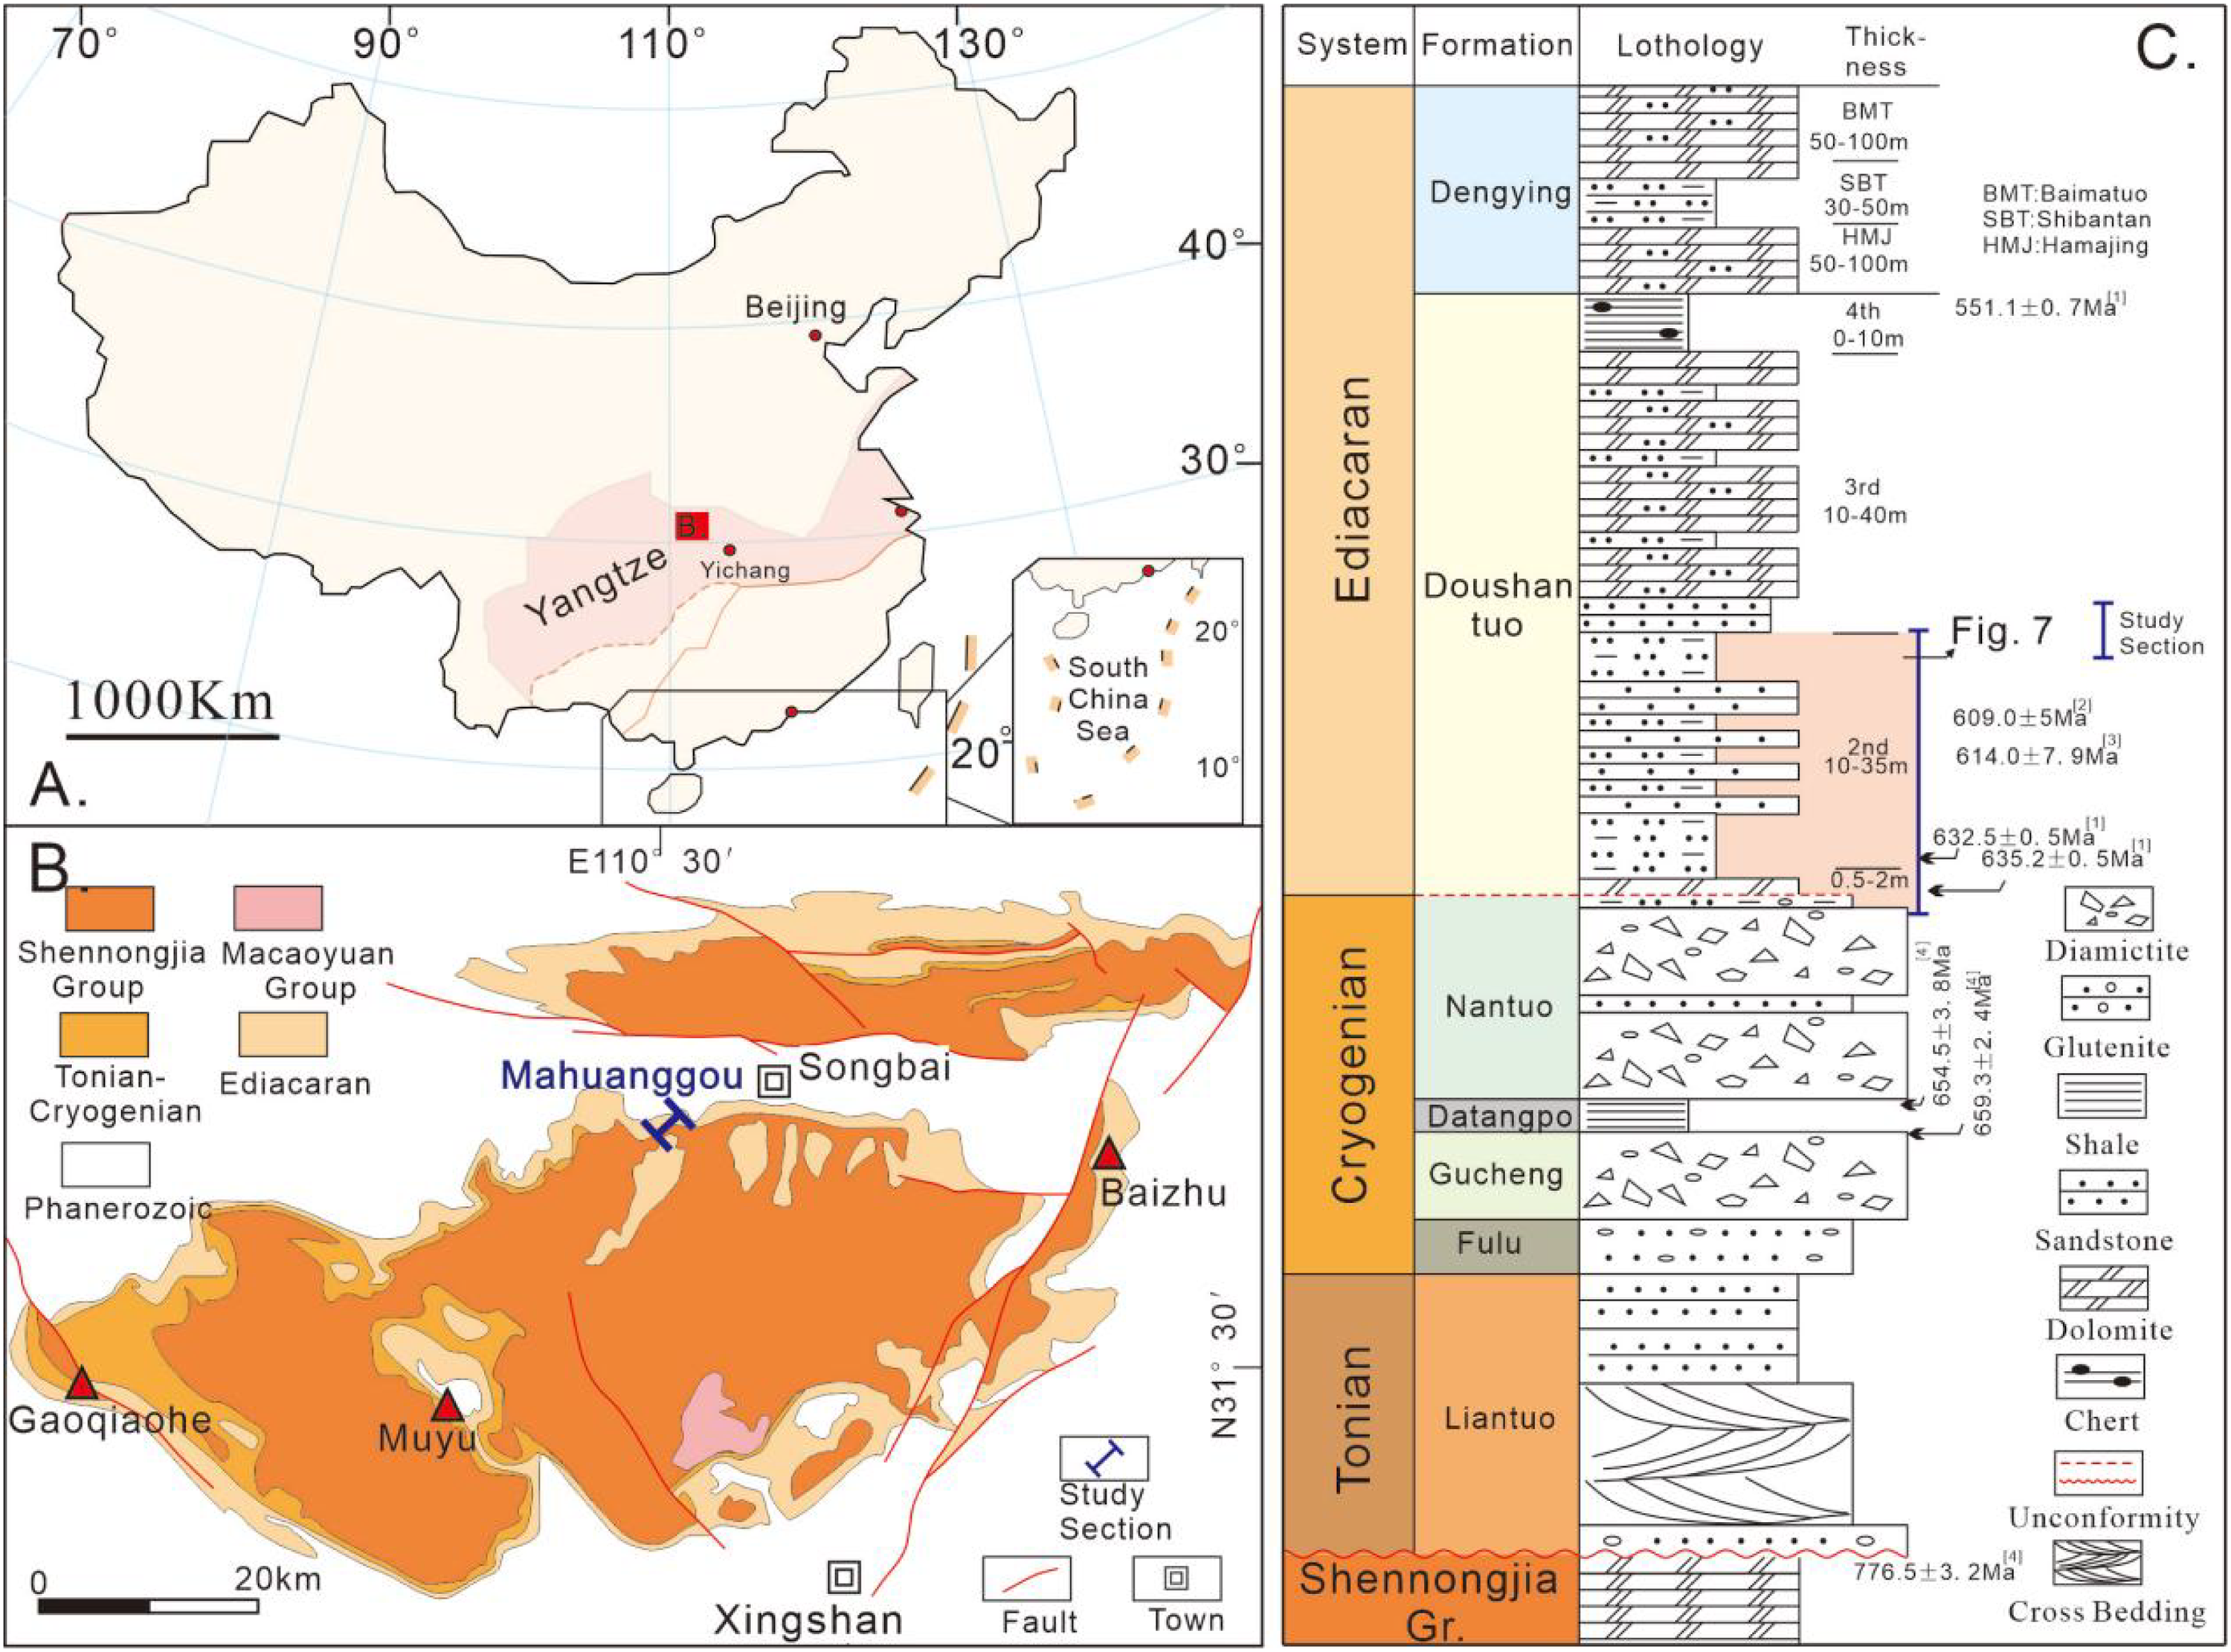
Shennongjia district sites in China (A), geological map of Shennognjia area (B), and histogram for stratigraphic of the Neoproterozoic in Shennongjia (C) age data from [1] Condon et al., 2005; [2] Liu et al., 2009; [3] Zhou et al., 2017; [4] Chen et al., 2021 and cited references therein.
The Doushantuo Formation was subdivided and correlated by four members in the three Gorges region, Yangtze craton (e.g., Zhu et al., 2007; Jiang et al., 2011; Liu et al., 2012a). The first member is cap dolomite, and its carbon isotope curve shows first negative excursion (EN1/ CAPNCE). The lower second member comprises black shale, siliceous phosphorous nodules, and phosphorite. Dolomite gradually develops upward, and the carbon isotope curve shows the second negative excursion (EN2). The third member consists of dolomite, containing phosphorus or siliceous nodules/bands, and the carbon isotope curve shows the third negative excursion (EN3/ DOUNCE/ Shuram Excursion). The fourth member is black shale, which usually develops “lenticular limestone”.
The overall Doushantuo Formation in the Shennongjia area can be compared with the three Gorges area, but it has some east–west differences. The eastern part of the Shennongjia area shows the characteristics of the first, second, and third members of the Doushantuo Formation, which are the same as those in the Three Gorges area, especially the second member of the Doushantuo Formation produces high-grade phosphorus deposits. The characteristics of the second and third members of the Doushantuo Formation are different from those in the west Shennongjia and the Three Gorges region. They are cyclic superimposed sequences composed of shale, silty shale, and red-green dolomitic siltstone. In the Shennongjia area, the black mud shale in the fourth member of the Doushantuo Formation is thick in the middle and be thin or thinning-out in the east and west. The grey-black carbonaceous silty mudstone or dolomite in the middle gradually thins from east to west It progressively pinches out in the Wushan-Baizhu area (the eastern Shennongjia area) and the Dajiuhu-Lianghekou area (the western Shennongjia area). The Doushantuo Formation of the Maguangou section is essential for studying the facies-transitional region from the east to west of Shennongjia.
The Doushantuo Formation is well exposed along the country road at the Mahuanggou (MHG) section, near Songluo town in Central Shennongijia (Figure 1B) (Kuang et al., 2019; Zhou et al., 2020). According to the vertical combination of lithofacies, it could be divided into four members, of which the first member is cap dolomite, the second member is a high-frequency cyclic sedimentary sequence by clastic rocks and interbedded thin layer dolomite, the third member is a succession of thin-medium silty or dolomitic sandstone or dolostone, and the fourth member is black carbonaceous shale (Figure 1C) (Zhou et al., 2020; Ye et al., 2017; Gu et al., 2020). The lower part of Doushantuo Formation at the Mahuanggou section is well exposed. It has high-frequency rhythmic cycle characteristics, which is an ideal section for studying the sea-level change during the post-melting Marinoan deglaciation. Zhou et al. (2020) briefly described the sequence of the Doushantuo Formation in the Songluo section(equivalent to the Mahuanggou section). They proposed two sea-level rise cycles by interpretation from lithofacies associations. Gu et al. (2020) cited Zhou et al. (2020) and presented the Mahuanggou section as a transitional facies from carbonate to slope/basin during the Doushantuo Formation in Shennongjia.
Methods
This paper mainly utilises Fischer plot, combined with the description and division of the sedimentary facies and sequences, to explore the sea-level change in the aftermath of the Marinoan deglaciation. We log the lower part of Doushantuo Formation at 1:10 scale from the outcrop and microphotos in terms of lithology, sedimentary structures, textures, and divide facies.
The metre-scale cycles are mostly controlled by the changes in accommodation space; therefore, the criterion of identifying individual cycles becomes the key to sequences division (e.g., Goldhammer et al., 1990, 1993; Osleger and Read, 1993; Chen et al., 2001). We used the definition of shallowing-upward cycles (Tucker, 2003; Chen and Tucker, 2003; Anderson, 2004), which correspond to metre-scale cycles representing multiple sequences of fifth-order, which also is a powerful tool in high-frequency analyses mainly to identify system tracts and consequently sea-level fluctuations.
After observation under the petrographic microscope, 32 mudstone samples were selected for major and trace elements tests. Major and trace elements were determined by inductively coupled plasma mass spectrometry (ICP-MS) using a Bruker Aurora M90 instrument and following the method by Qi and Grégoire (2000) and Bai et al. (2020). Approximately 0.0500 g of powdered sample was placed in a poly tetra fluoroethylene (PTFE) bomb, and 1 mL of HF and 1 mL of HNO3 were added. The sealed bombs were then placed in an electric oven and heated to 185°C for approximately 36 h. After cooling, the bombs were heated on a hot plate to evaporate to dryness. Then, 500 ng of Rh was added as an internal standard, and 2 mL of HNO3 and 5 mL of water were added. The bomb was again sealed and placed in an electric oven at 135°C for approximately 5 h to dissolve the residue. After cooling, the final dilution factor was approximately 3000 for trace element measurement by ICP-MS and major elements by ICPOES (Agilent 720). SiO2 was measured by the traditional gravimetric method. The sensitivity of the instrument was adjusted to approximately 350,000 cps (counts per second) for one ng mL−1 115In and 150,000 cps for one ng mL−1 of 232Th using the normal sensitivity mode. The accuracies of the ICP-MS analyses were estimated to be better than ± 5%–10% (relative) for most elements.
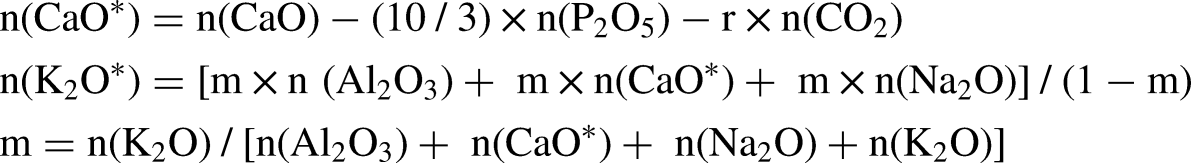
In the process of chemical weathering of the upper crust Ca, Na, and K elements are gradually weathered and precipitated from feldspar, resulting in the increase of the ratio of alumina to alkali metals in mudstone. Based on this, the chemical alteration index (CIA), which Nesbitt and Young (1982) first proposed, its calculated equation is expressed as follows:

These study results show a simple correlation for Th/Sc and Zr/Sc ratios in cross plot, and this relationship is interpreted to be due to compositional variation s of provenance. And the index of compositional variability (ICV) is also calculated (Cox et al., 1995). If ICV > 1, then most the samples are primary sediments and suitable for CIA calculation.


Results
The vertical evolution of sedimentary facies
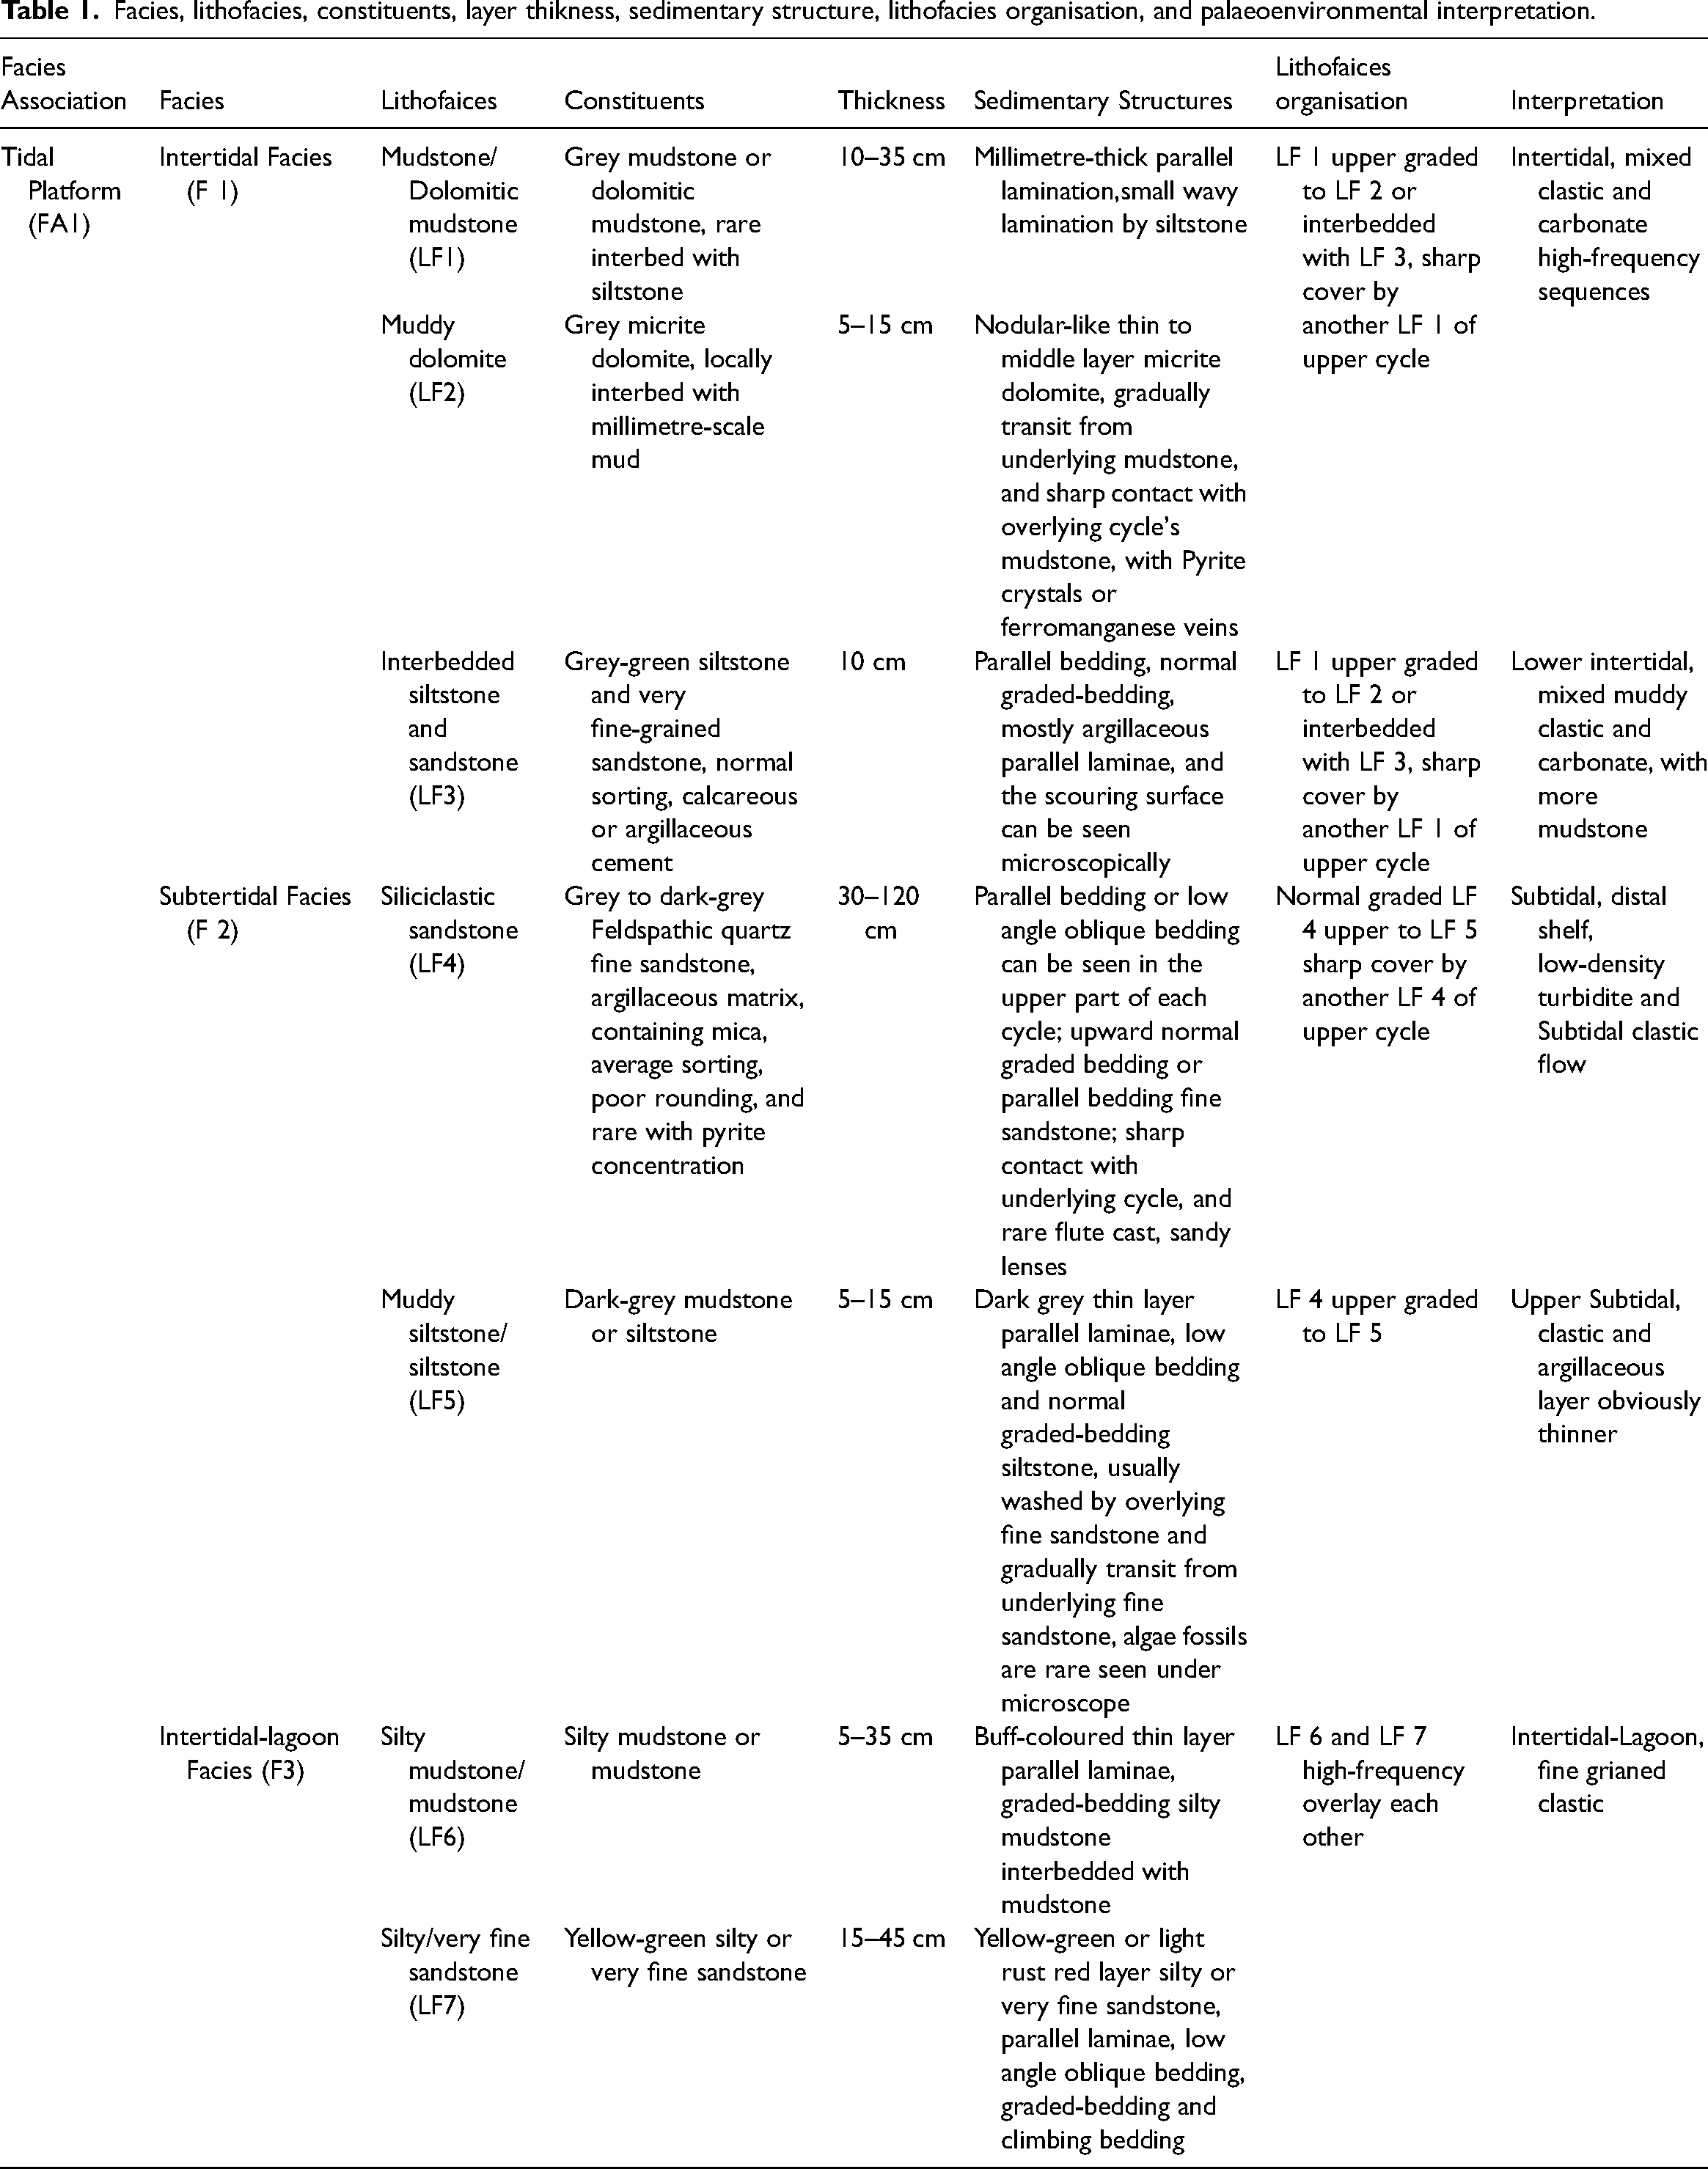
This study is based on the colour alternations, lithology, texture, and sedimentary structure, which led to the division of 7 Lithofacies (LF1 to 7, Table 1) during the investigating of the lower part of Doushantuo Formaiton at the Mahuanggou section. Then, according to the superimposed sequence of the lithofacies associations, we summarised three facies (F1 to 3) from the tidal platform facies association (Table 1), as a result, the vertical evolution of these facies is clearly separated from each other. Their characteristics and environmental interpretations are given in detail in Table 1. Typical outcrops and thin sections are illustrated in Figure 2–5. The facies description and interpretation are as follows:
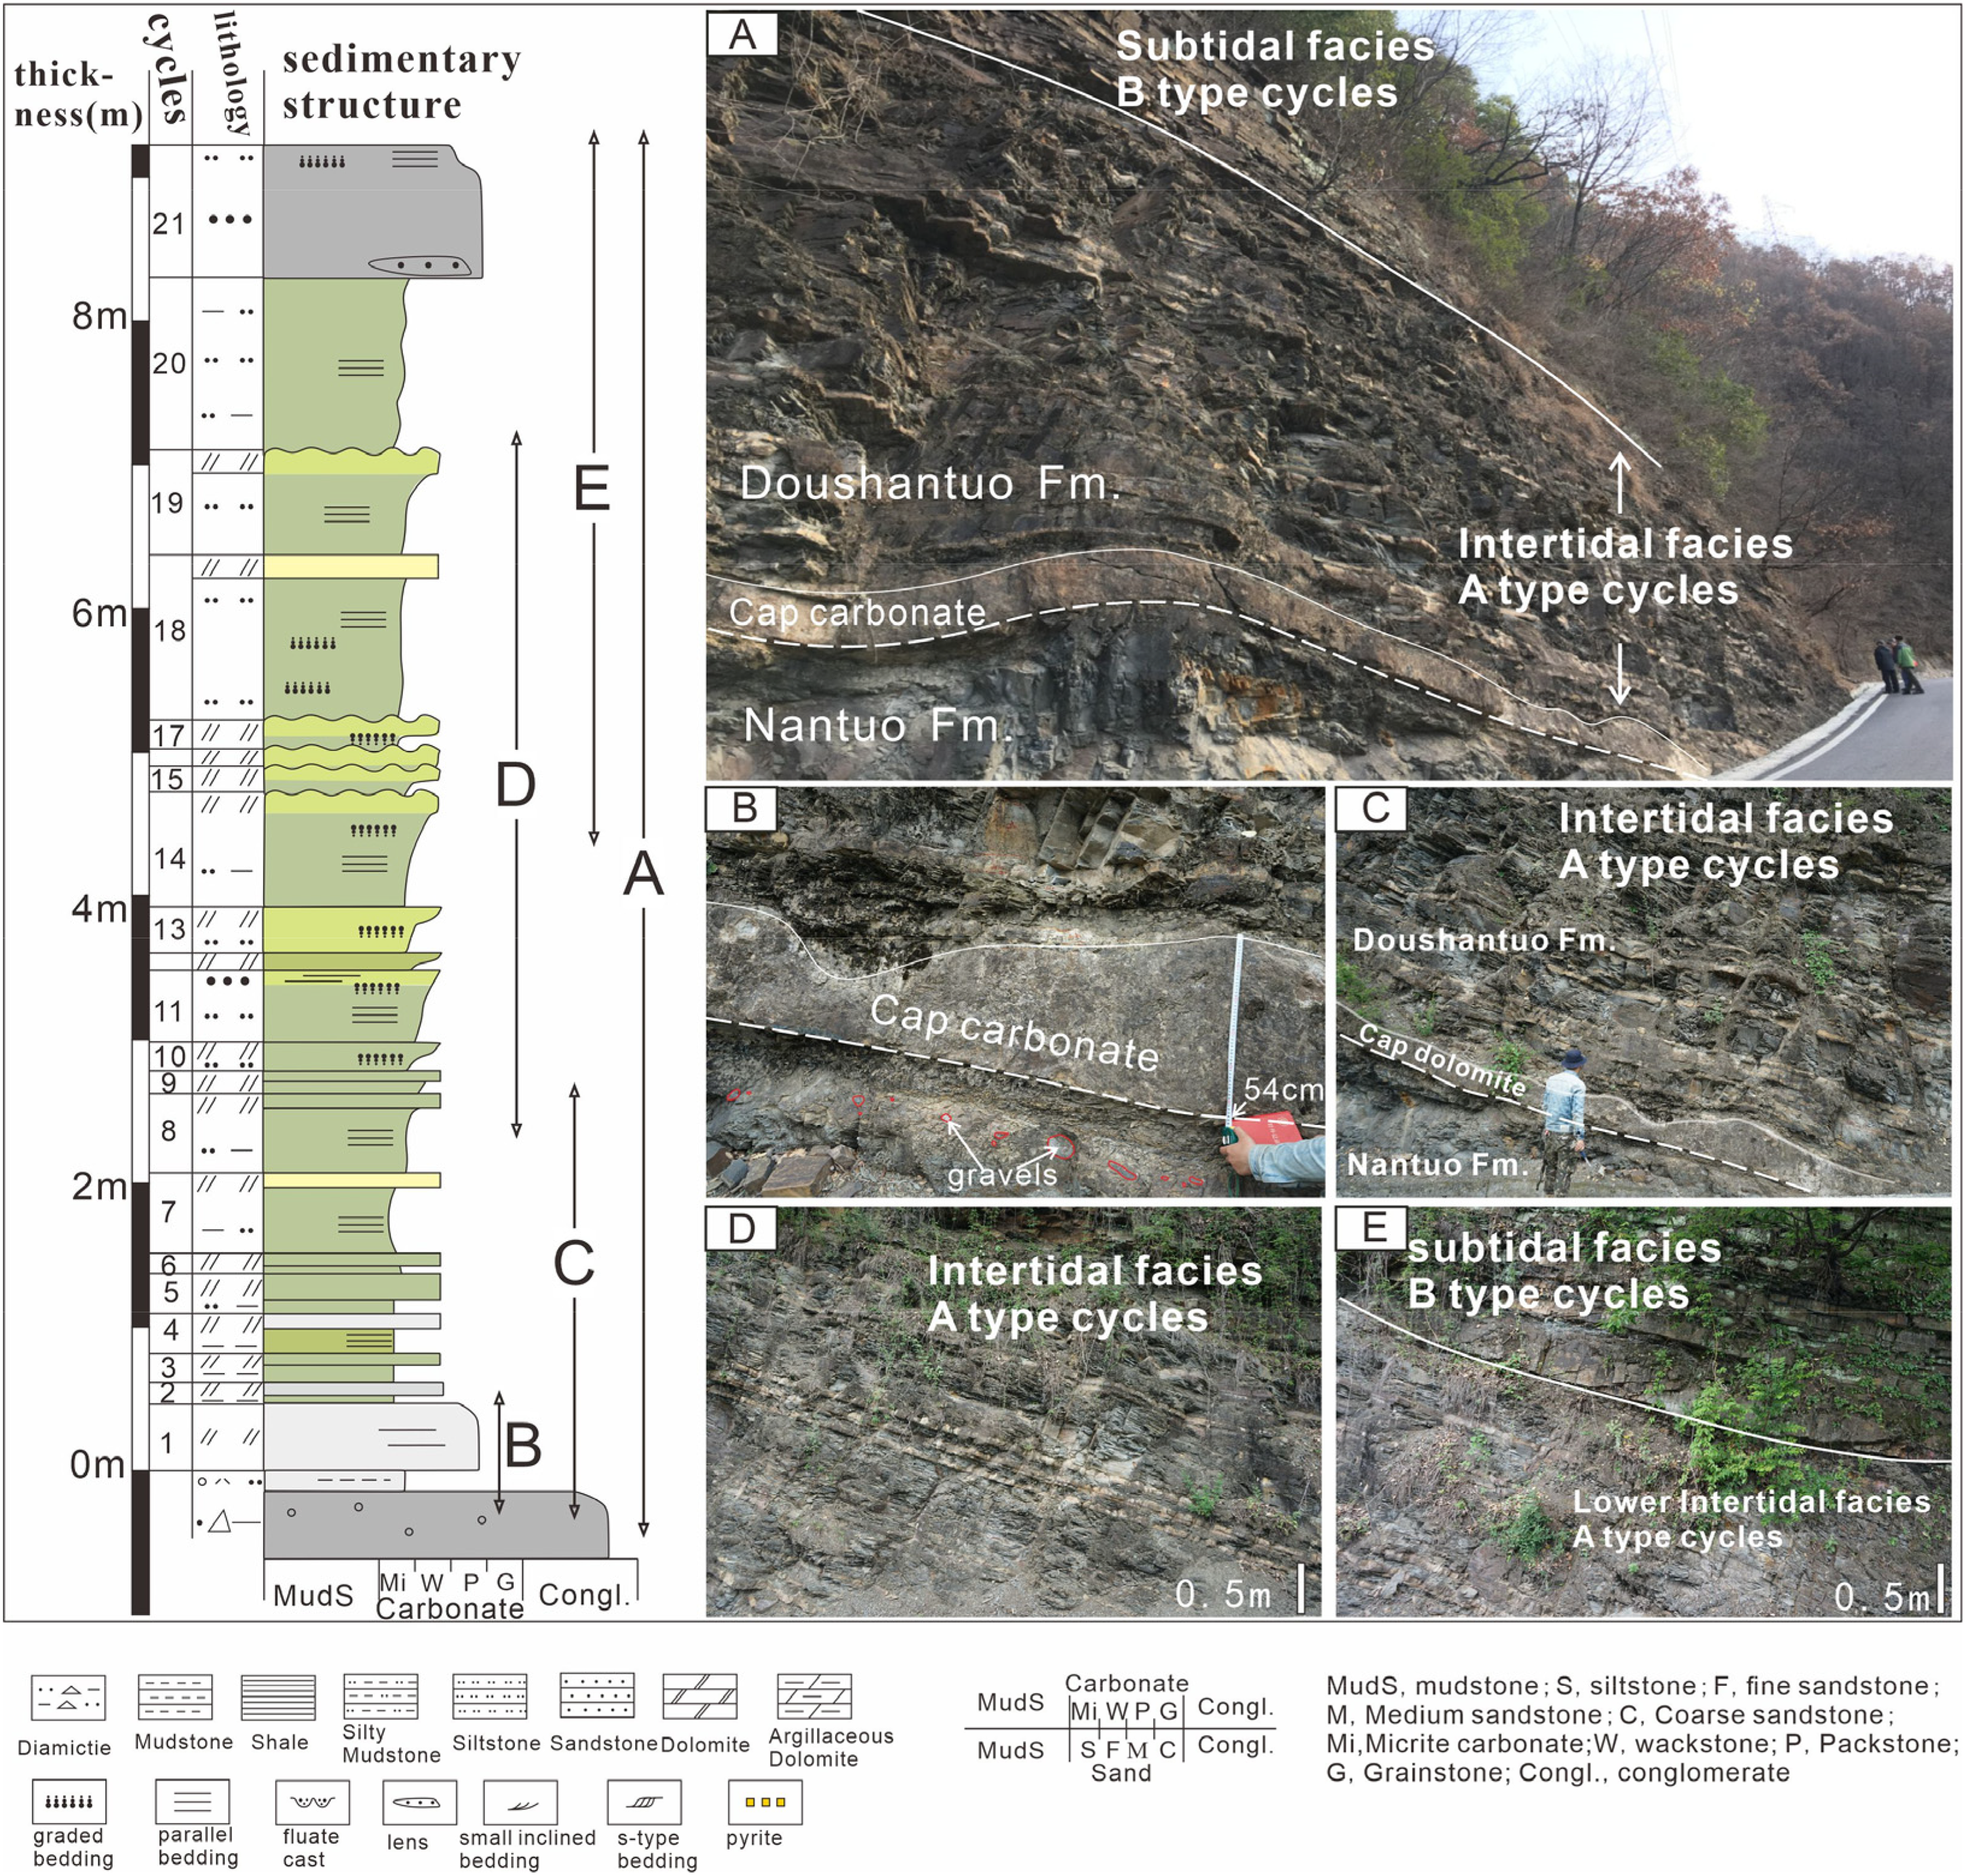
Outcrop pictures of intertidal facies. A-the Boundary of Doushantuo and Nantuo Formation; B- Cap dolomite and tillite bearing dropstone; C- Interbedding of sheet dolomite and mudstone or argillaceous siltstone overlie the Cap carbonate; D- Interbedding of thin layer dolomite and muddy siltstone, underlying thin-middle mudstone upward gradual transit into dolomite and dolomite sharply contacts with above argillaceous siltstone; E- Thick laminae muddy siltstone upward gradual transit into dolomite, the boundary of A and B type cycles.
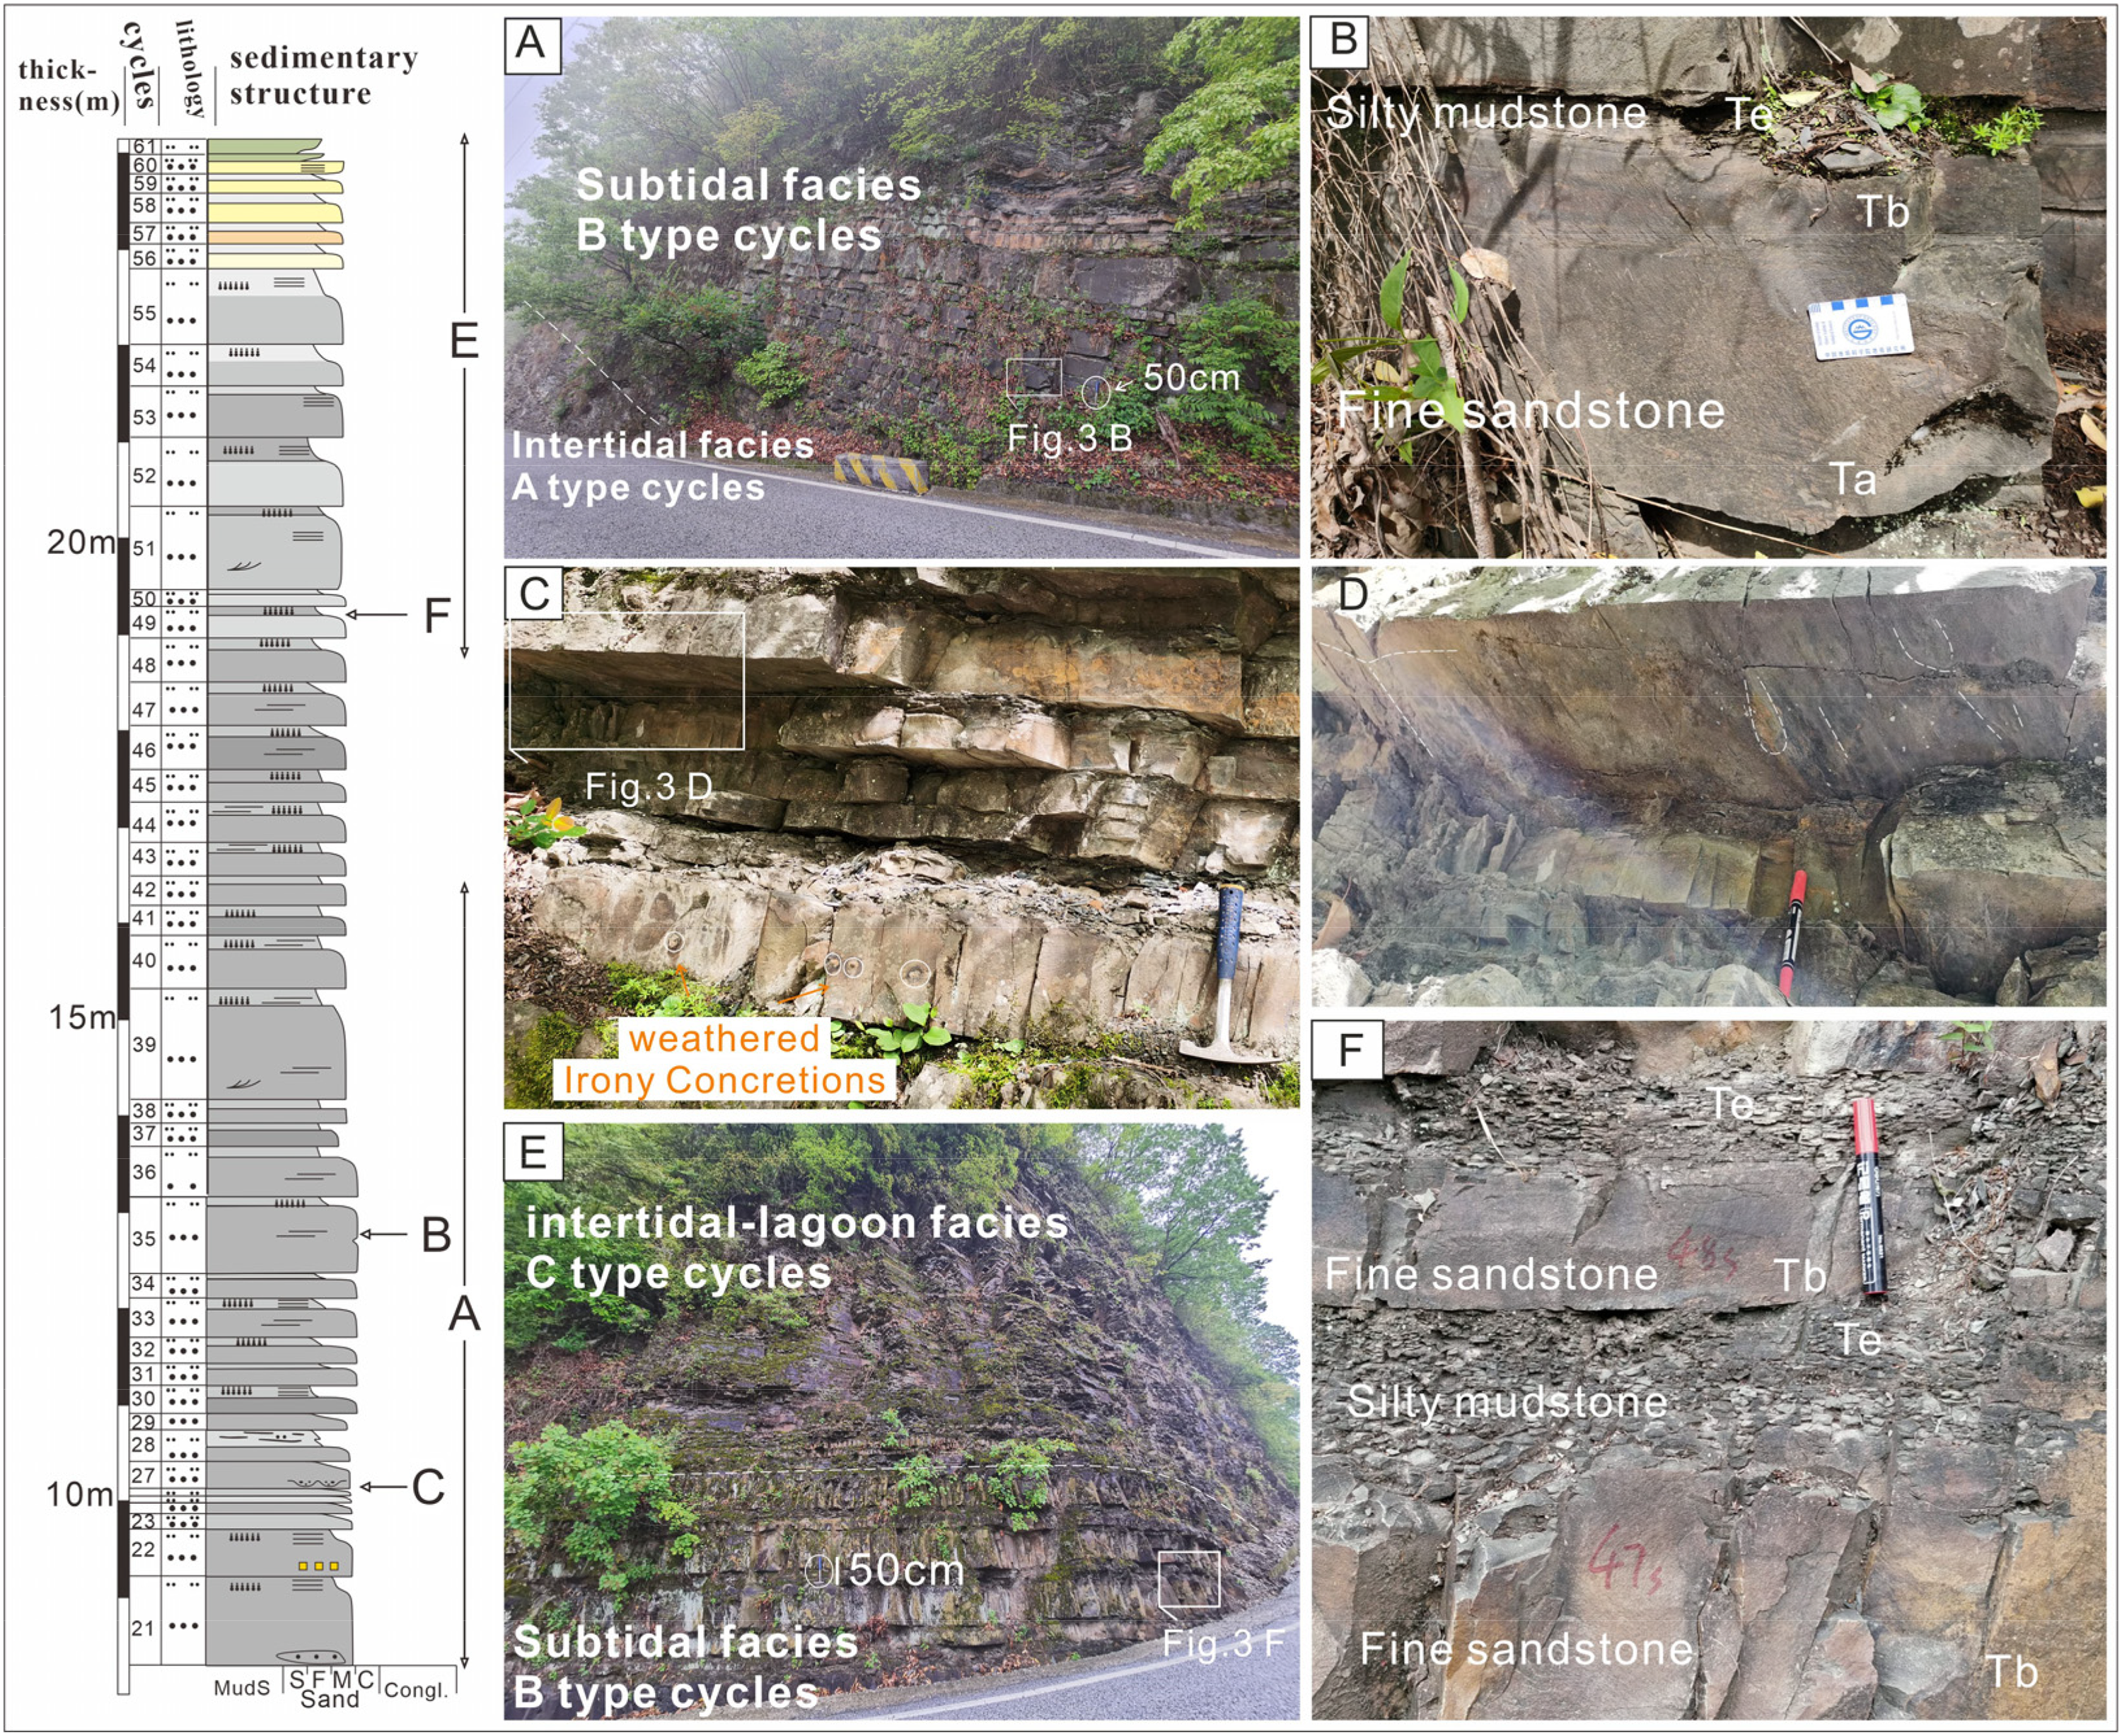
Outcrop pictures of subtidal facies.A- the Boundary between a unit and b unit; B- thick massive fine sandstone and upward gradual transit into parallel bedding mudstone, incomplete Bouma sequence; C-Interbedding of thick- middle bedded sandstone and thin bedded mudstone, developed graded bedding cycles; D-Flute cast set at the bottom of thick-bedded sandstone; E- the Boundary between b unit and c unit, fining-upward clastics; F-Cycles of thick-bedded sandstone gradually upward transit into argillaceous siltstone and mudstone.
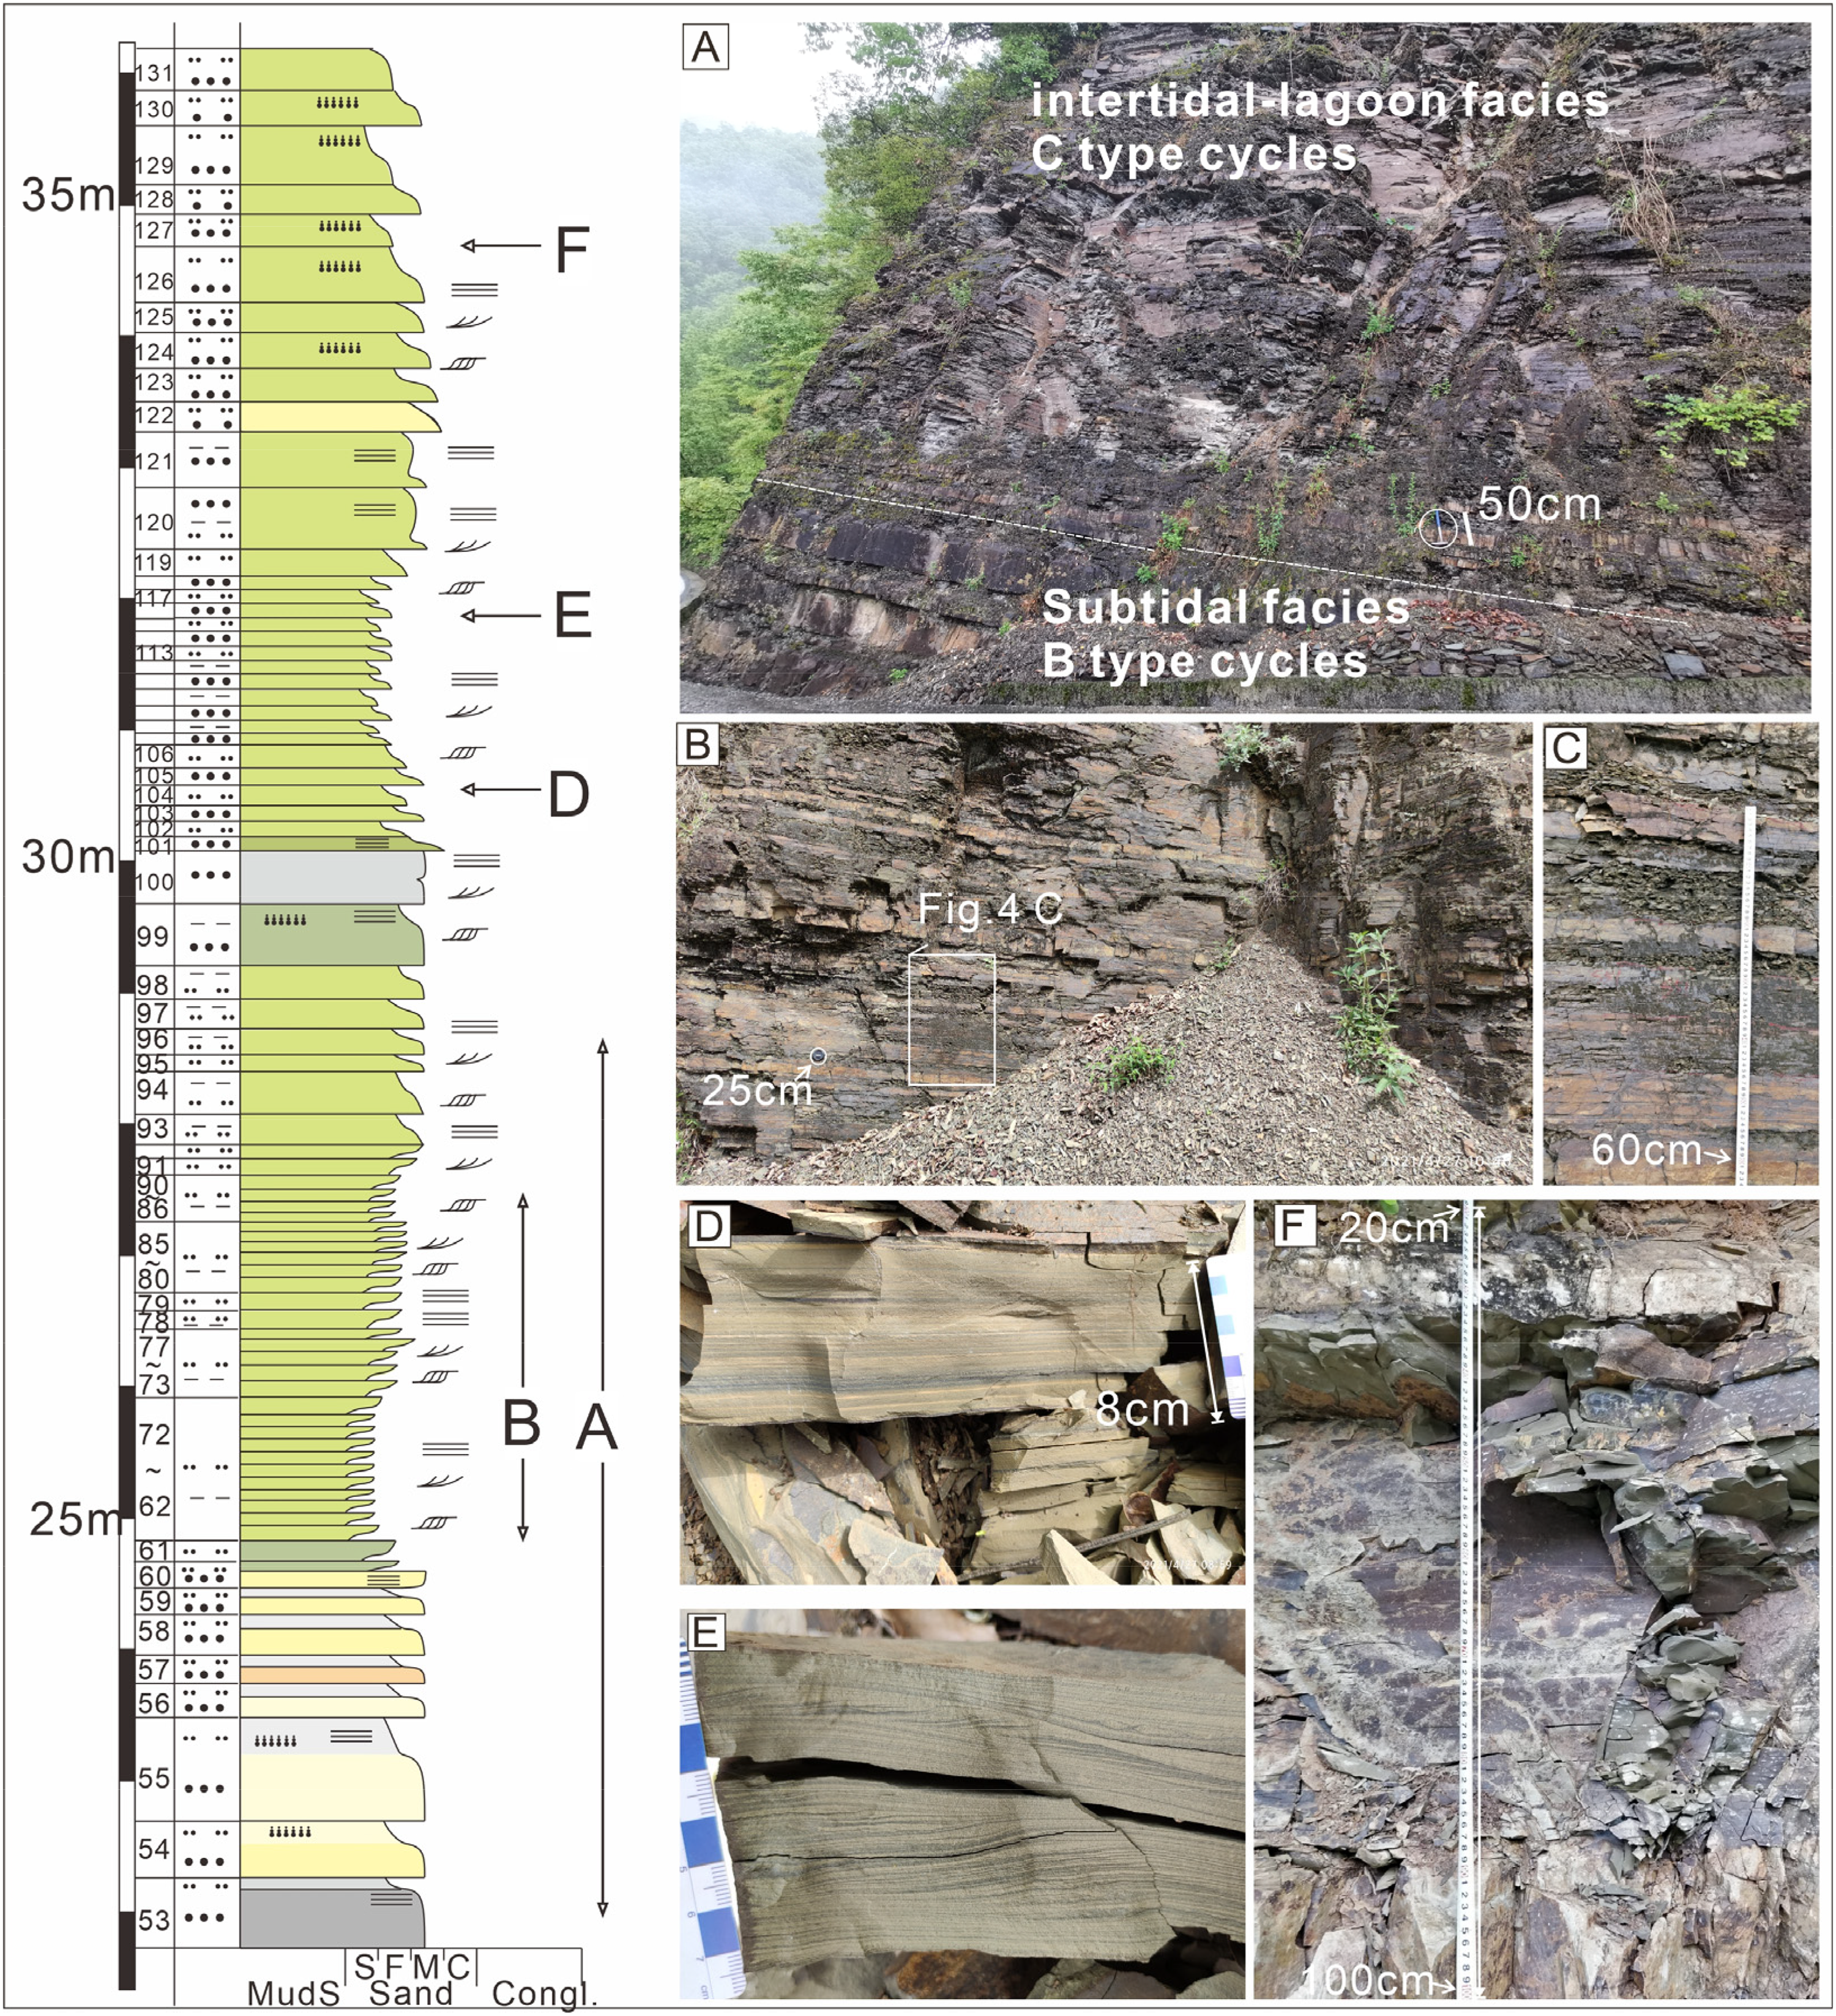
Outcrop characteristics of intertidal-lagoon facies. A-Boundary of b and c unit, and the lower part of c unit; B- and C- High frequent rhythmic cycles of thin-bedded siltstone and mudstone; D- Mudstone with horizontal bedding and wavy bedding; E- Climbing Cross laminae siltstone, F-Buff-green fine sandstone normal guardedly upward to light-red laminated silty mudsonte.
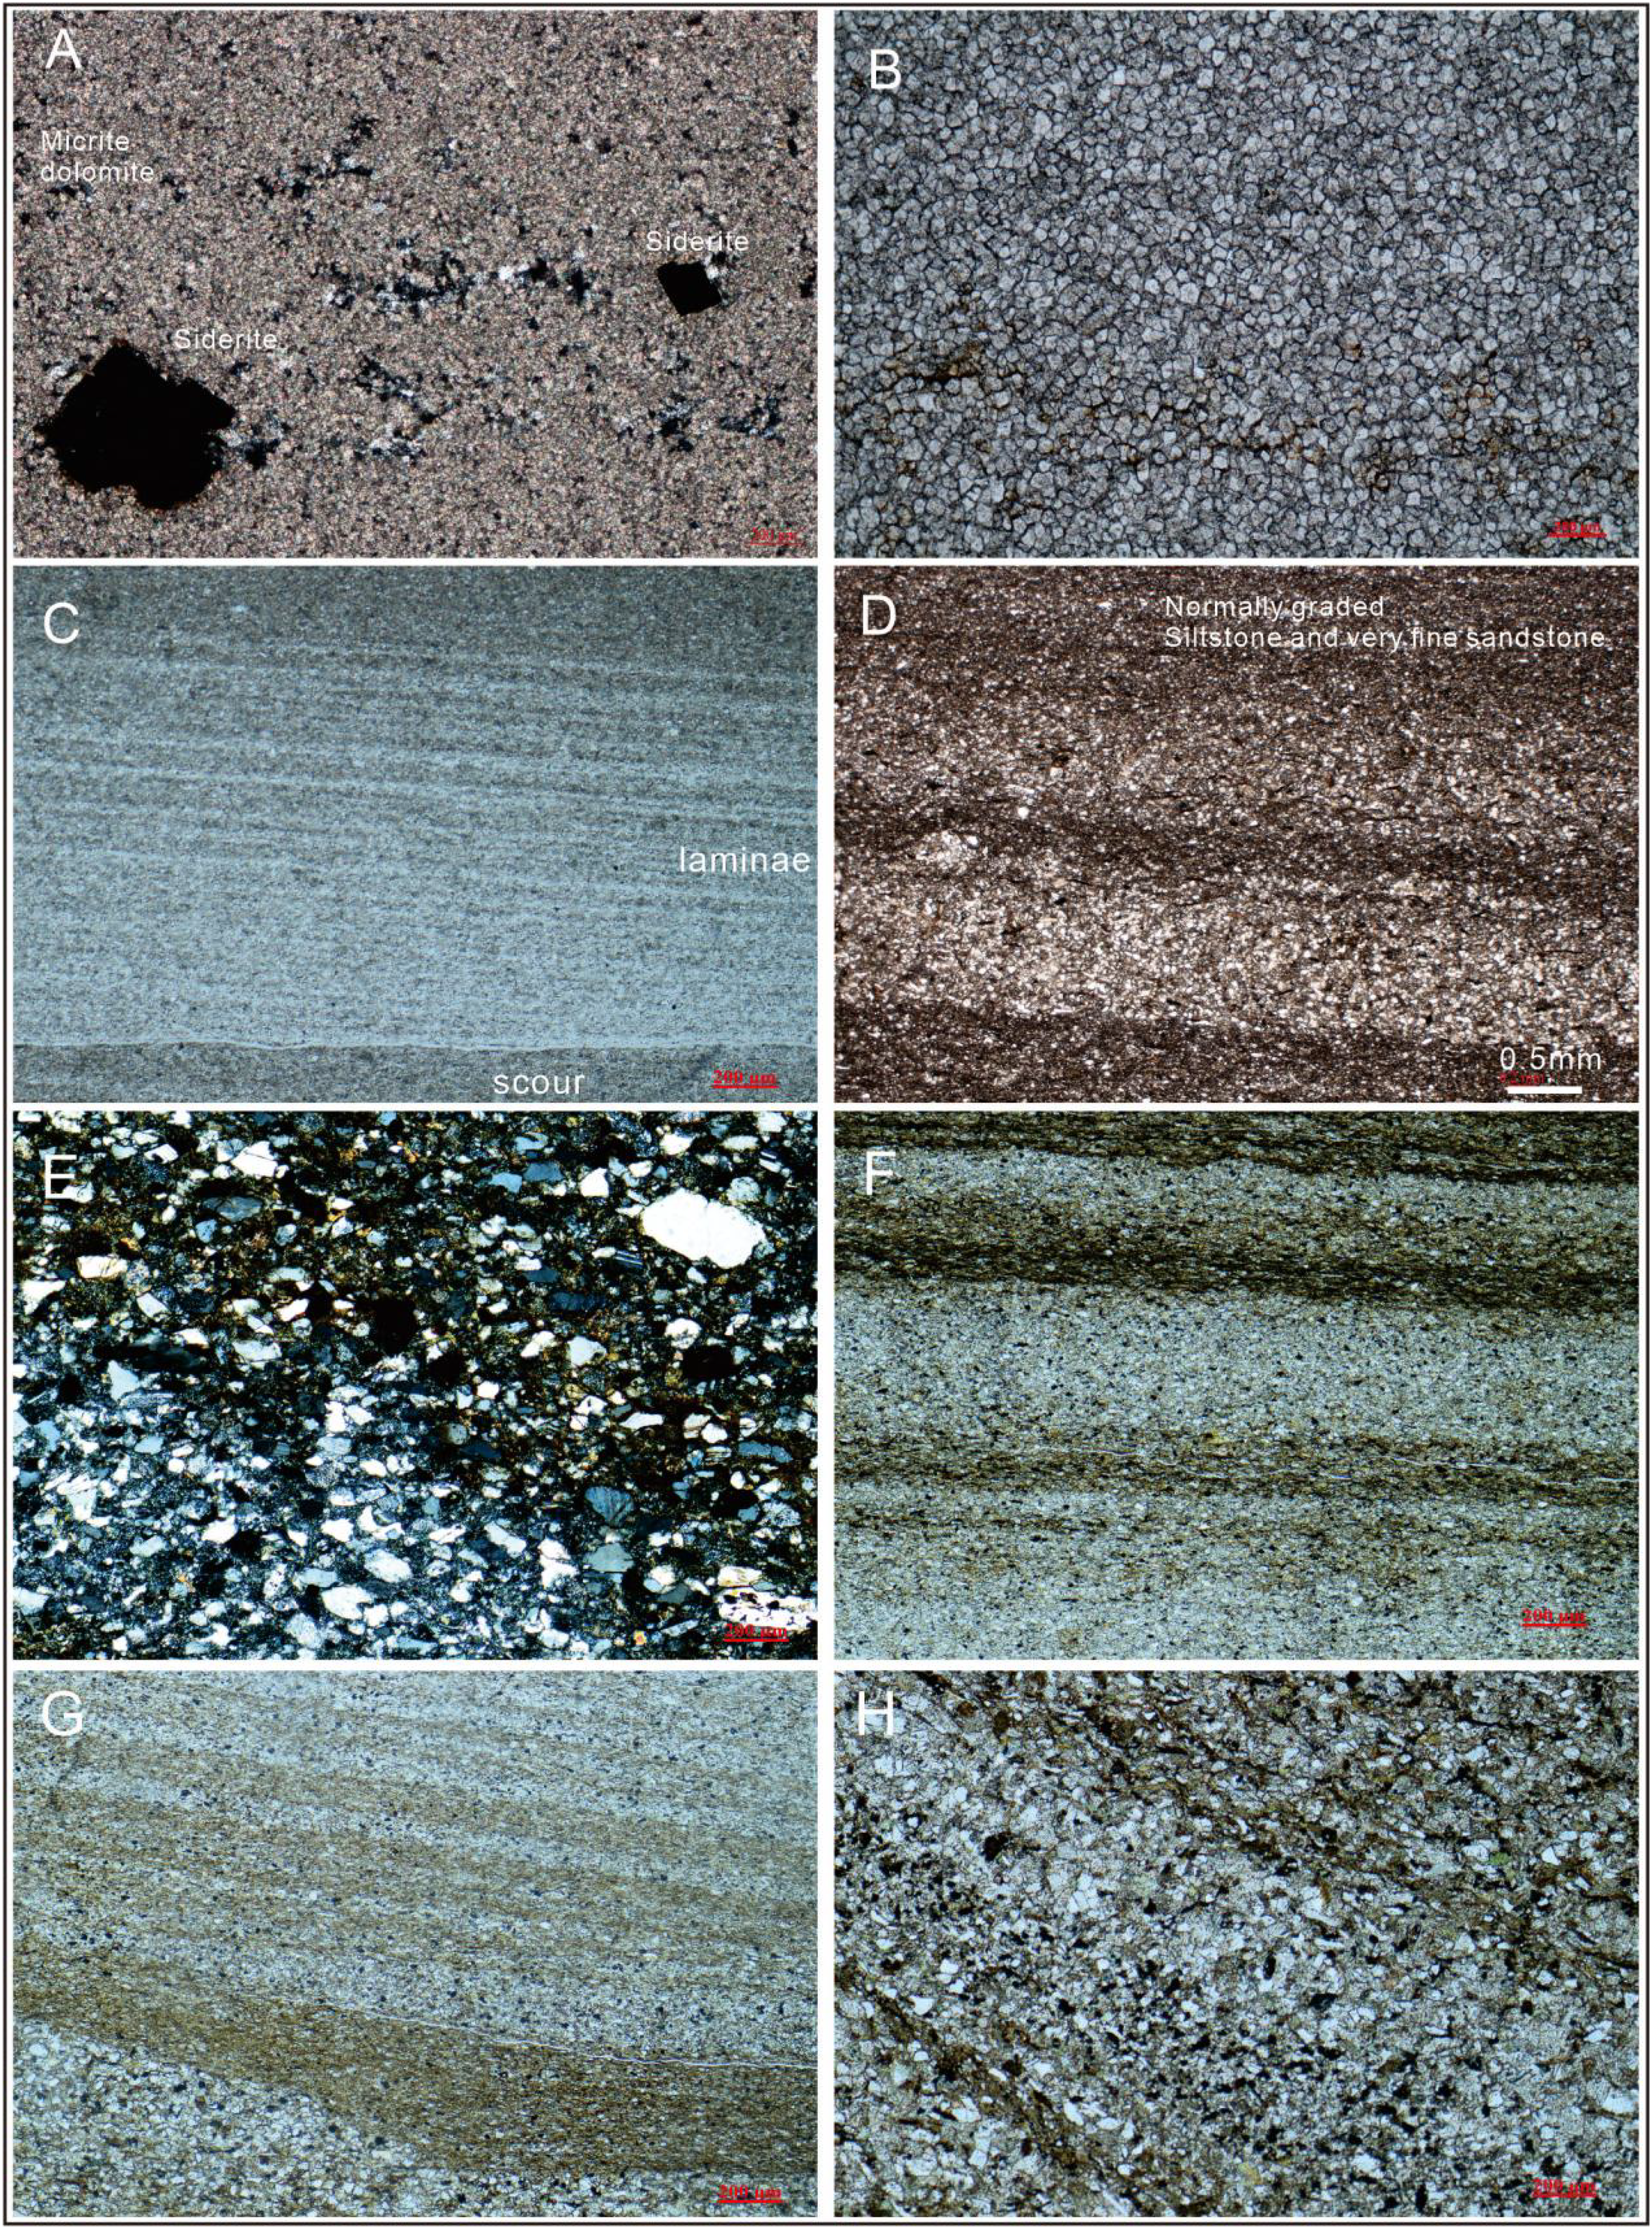
Micrograph characteristics . A- Micrite dolomite with fine-grain euhedral siderite(LF 1); B- Micrite dolomite with cluster irony infections(LF 1); C- Mudstone with scour and laminae(LF 2); D- Normal graded siltstone and vary fine sandstone(LF 3); E- Poor sorting, sub-round, matrix-supported fine sandstone(LF 4); F- Graded bedding laminae slitstone and mudstone(LF 5); G, Silty Mudstone with soure and oblique bedding(LF 6); H-Silty fine sandstone with oblique bedding(LF 7).
Facies, lithofacies, constituents, layer thikness, sedimentary structure, lithofacies organisation, and palaeoenvironmental interpretation.
Intertidal facies
Description: The A type cycles of carbonate-clastic stratum in the lower part of the Doushantuo Formation are exposed along the roads in mountains, by monocline and stable distribution, with a total thickness of 8.13 m (Figure 2A). According to the characteristics of rock colour, lithology, structure, and sedimentary structure, there are three types of lithofacies developed here, including LF1 grey medium thin thick (10–35 cm) mudstone and dolomitic mudstone, with parallel lamination and wavy silica sandstone lamina occasionally (Figure 2C). LF2 grey thin layer (5–15 cm) microcrystalline fine crystalline dolomite, siderite particles or iron infected veins can be seen under the microscope (Figure 2A,B). LF3 is a greyish-green thin layer (10 cm) of fine silty sandstone (Figure 2D), which develops primarily argillaceous parallel laminae and normal graded bedding, and the scouring surface is occasionally seen under the microscope. The cap dolomite is greyish-yellow ca. 40 cm thick equigranular micrite dolomite (Figure 2B) at the bottom of Doushantuo Formation. The rhythmic A-type cycles are gradually increasing-upward (Figure 2C, D) in the lower part. Silty fine sandstone (LF3) is developed in the middle mixed sediment. Multilayered dolomite (LF2) is formed in the upper part (Figure 2D). The top is thicking-upward mudstone (LF1) with a thin layer of dolomite (Figure 2E). The top surface of each minimum cycle is a lithological catastrophe surface, which is in direct contact with the mudstone of the overlying cycles. The dolomitic or sandy composition gradually increases from the mudstone layer upward, changing progressively into the thin-layer dolomite or fine silty sandstone in the lower and middle part of these cycles.
Interpretation: the lower part of this profile belongs to a typical multi-rhythm cycle sequence, which is controlled by frequent sea-level fluctuations: transgression carried fine-grained materials to the lower part of the cycle for accumulation, and then the sea level fell steadily and deposited shallow-water carbonate rocks, occasionally mixed with fine clastic rock. With the increase of sea-level rise, the upward mudstone is thicking-upward. The sedimentary structure in this part is dominated by parallel bedding and graded bedding, with occasional wavy silty fine sandstone laminae, indicating that the hydrodynamic energy is weak. The structural maturity and compositional maturity of fine siltstone are low, and the argillaceous/micrite dolomite is fine, with siderite particles, and the colour of each cycle is mainly grey and greyish-green. Therefore, the sedimentary environment can be interpreted from intertidal to lower intertidal zones (Read, 1985; Flügel, 2004).
Subtidal facies
Description: The sandstone stratum in the B type cycles succession is stably distributed at the outcrop of the Maguangou section, but this set of sandstone with cycle characteristics is not seen in the Doushantuo Formation section of several kilometres adjacent, with a total thickness of 16.45 m (Figure 3A, E) Lithofacies types include: LF4 grey, dark grey thick massive (30–120 cm) micaceous feldspathic quartz fine sandstone, which is microscopically characterized by matrix support, poor rounding, and general sorting (Figure 3E); LF5 dark grey thin-bedded (5–1 5cm) silty mudstone and mudstone (Figure 3F), the shale content gradually increases upward, and horizontal bedded is developed. Mudstone usually develops parallel bedding and grain sequence bedding (Figure 3B, F). The weathered irony concretions formed along the layers (Figure 3C) and the flute cast structures at the bottom (Figure 3D) can be seen locally in the thick massive sandstone layer. The lower massive sandstone and the upper silty mudstone or mudstone of each small cycle show positive grain sequence transition (Figure 3B, F), and the top boundary of each small cycle is also a lithologic catastrophe surface, which is diametrically opposed to the sandstone contact surface at the lower part of the overlying cycle.
Interpretation: the sandstone cycle sequence of this set develops a typical normal grain sequence, which may be an incomplete Baoma sequence (Ta, Tb, Te; Tb, Te) (Figure 3B, F). Then, the massive sand, sharp contacts, floating clast, normal graded sequence, and scouring structures are typical characteristics of simulated sandy debris flow deposition (Postma et al., 2014; Shanmugam, 2000, 2021), which could be interpreted as sandy debris flow or turbidite deposits in subtidal facies. Sedimentary structures in high-energy water environments are lacking, such as conglomerate with a clas-support fabric, cross-bedding, strong scouring surface or deformation structure. And its thickness distribution is stable, so we explain that it is the distal depositions of debris flow or turbidity current in the low-energy subtidal zone (Flügel, 2004; Shanmugam, 2000, 2021).
Intertidal-Lagoon facies
Description: The upper stratum is yellow–green siltstone. Although some local and small-scale faults developed, this succession is stably developed along the roadside. The C type cycles thickness varies from 0.1 to 0.5 m, with obviously thinning-upward from B to C type cycles (Figure 4 A,B,C), with a total thickness of 11.58 m. The lithofacies are majored by LF6 buff-green coloured thin laminated mudstone, with parallel laminae or grain sequence bedding, and LF7 thin to middle layers argillaceous silty to very fine sandstone, with developing horizontal bedding, low angle oblique bedding or climbing lamination, and occasionally lenticular bedding (Figure 4 D,E, Figure 5 G,H). Reverse and positive grain order cycles are superimposed in high-frequency rhythm.
Interpretation: this set of high-frequency rhythmic mudstone, argillaceous siltstone to very fine sandstone developed with irregular bedding and rhythmic thinning to the upper layer is the product of episodic fall of sea level stability. The lithologic mutation of the upper and lower layers of each cycle is not obvious, and it is formed by the deposition of fine-grained clastic material carried by tidal reflux. The water environment gradually becomes shallower, reflecting that the difference in rock colour is small. It is mainly yellow-green, and gradually light red upward, indicating that the transition state from redox to oxidation gradually changes. Therefore, the environment can be interpreted as very-fine clastic rock intertidal-lagoon sedimentation (Flügel, 2004).
Thus, the lower part of Doushantuo Formation in the Maguangou section, from bottom to top, shows the evolution law from intertidal carbonate clastic rock, subtidal sandstone back to intertidal lagoonal very fine clastic rock (Figure 9).
Distribution of geochemistry
Major and trace elements
The major elements analysis of the Mahuanggou samples from Shennongjia area are presented in Appendix 4 S1. As shown in Table 2, the relative contents of major elements are represented by the counterparts of their oxides. While, SiO2 has the relative content (48.97%–64.80%), followed by Al2O3 (13.99%–25.27%) and others. The SiO2/Al2O3 ratio is (1.96–4.59, av. = 2.95), indicating medium-high maturity chemical components. According to the diagram of classification (Herron, 1988), the Mahuanggou samples principally consist of shale (Figure 6).
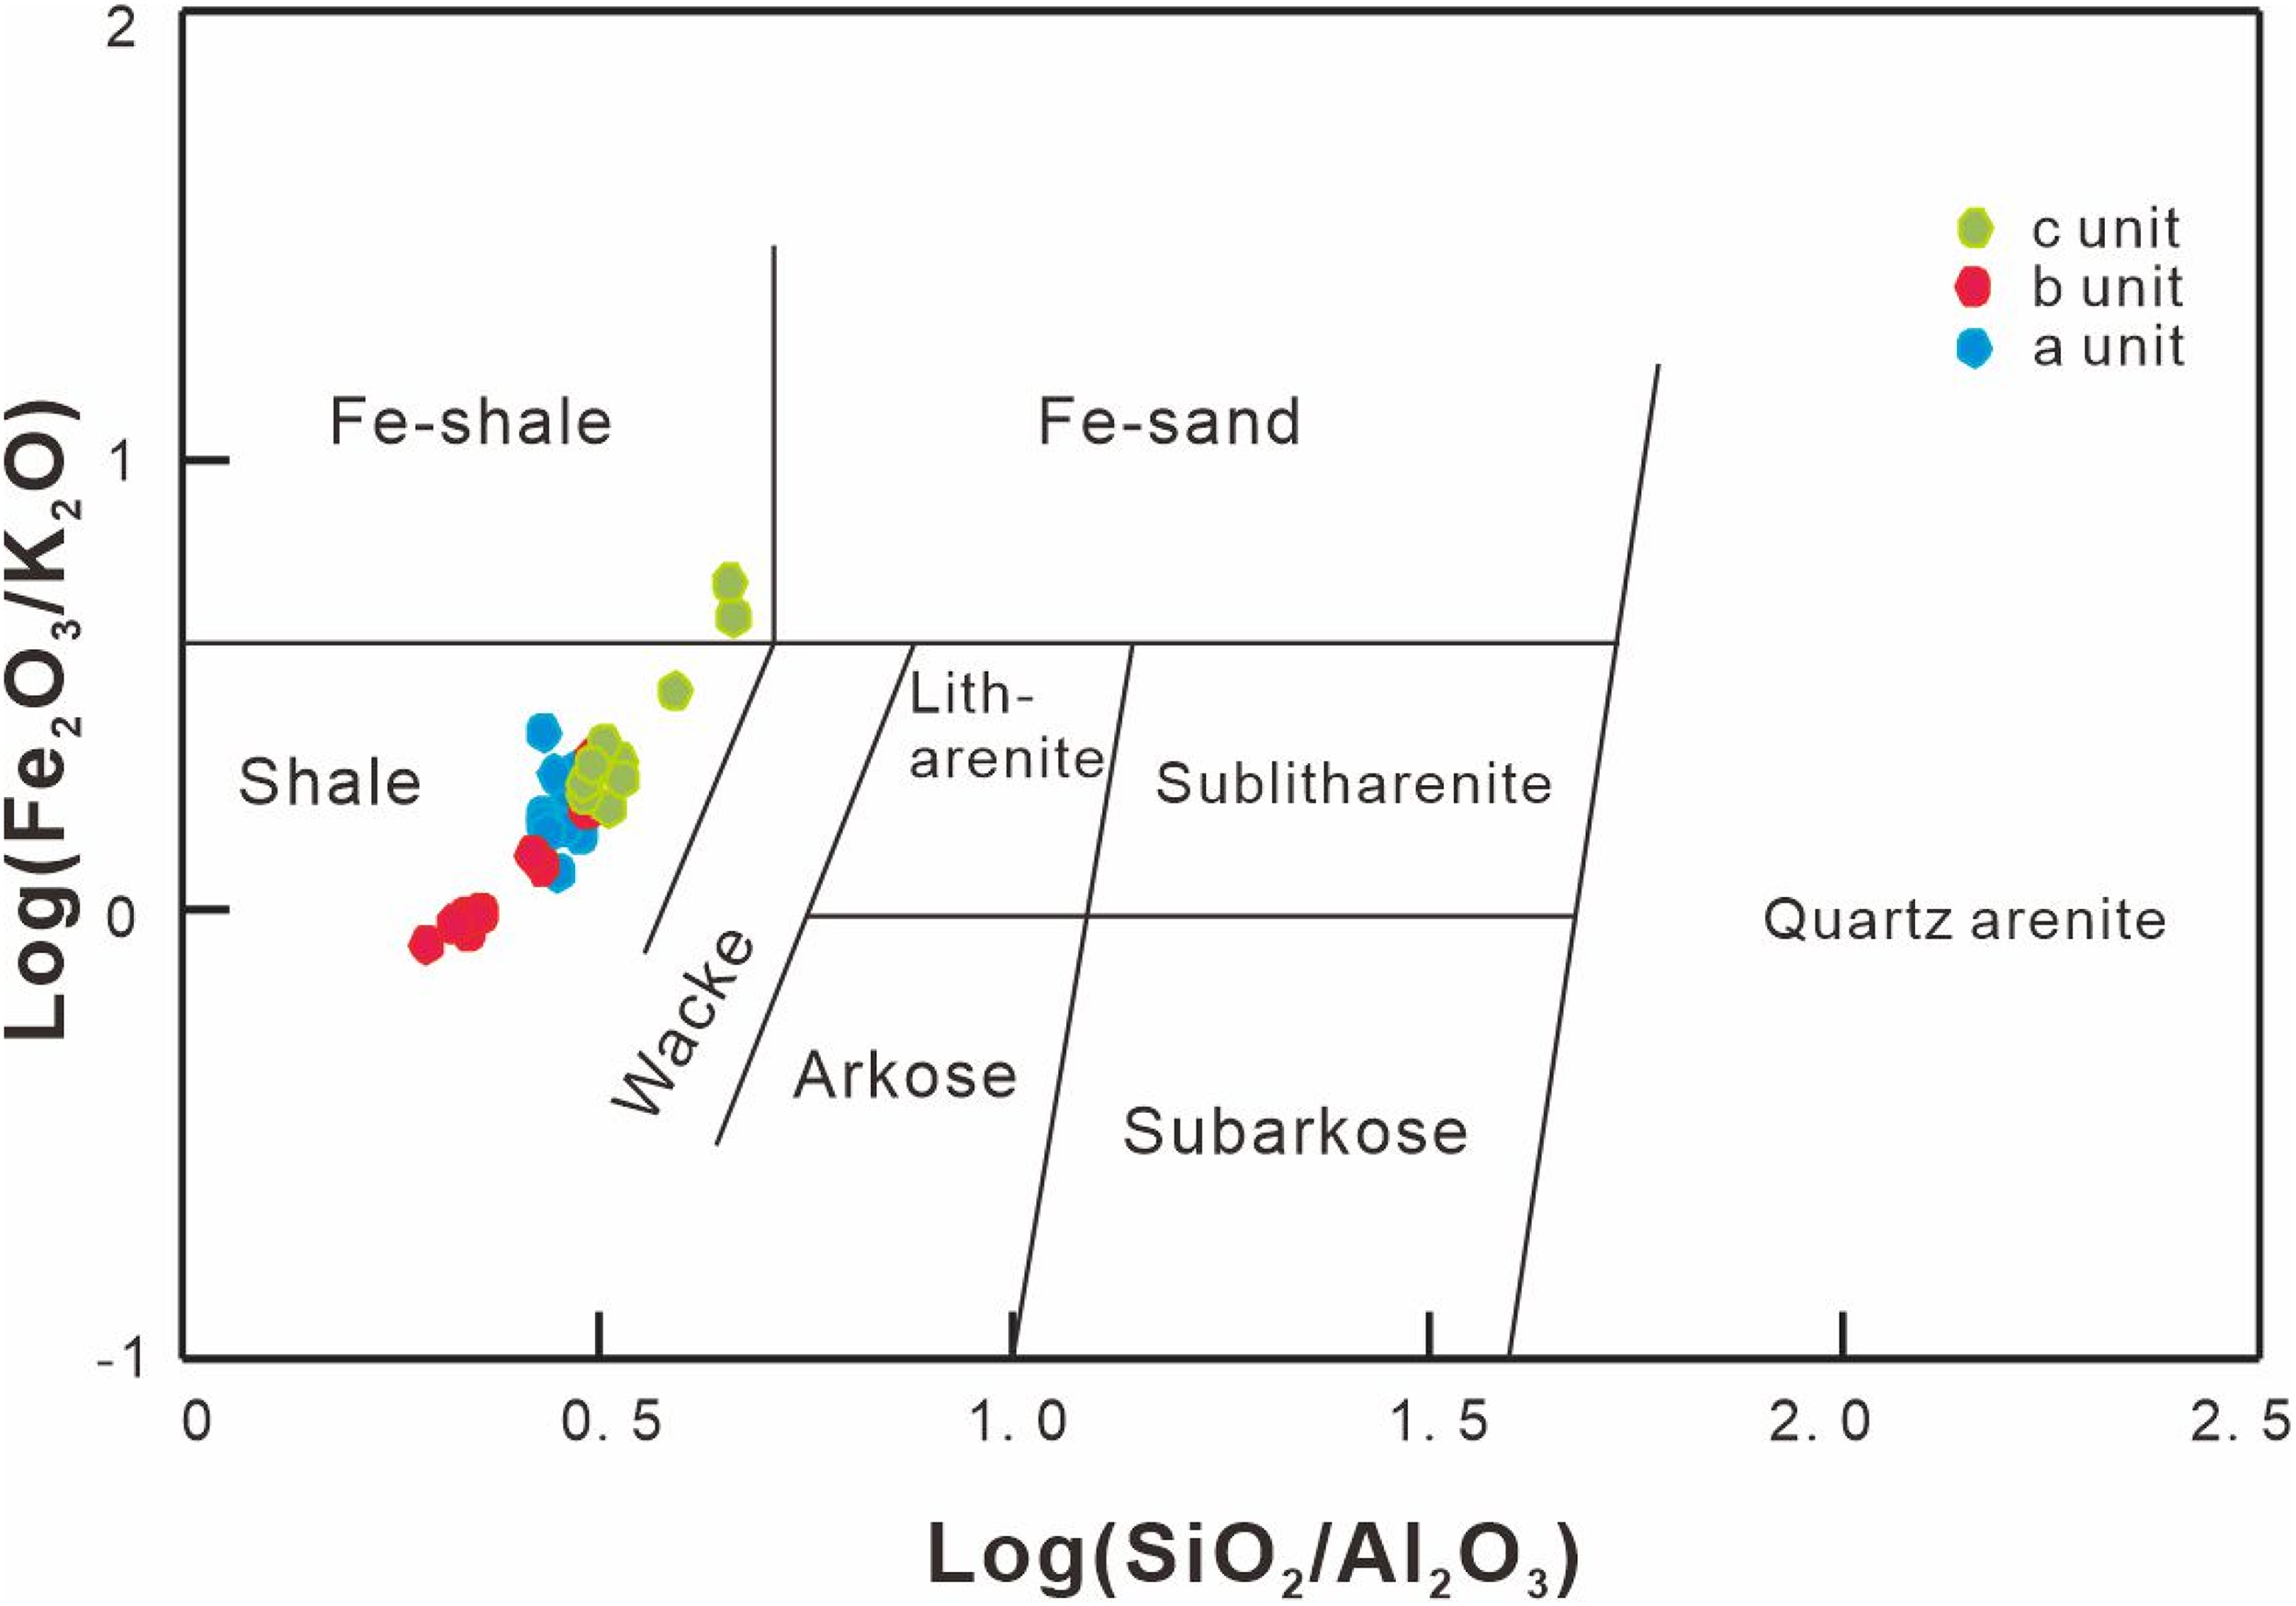
Chemical classification diagram for discriminating siliclastic sediments by their logarithmic ratios of SiO2/Al2O3 versus Fe2O3/K2O after Herron (1988).
Average, maximum, and minimum selected element composition of all samples from the Mahuanggou section
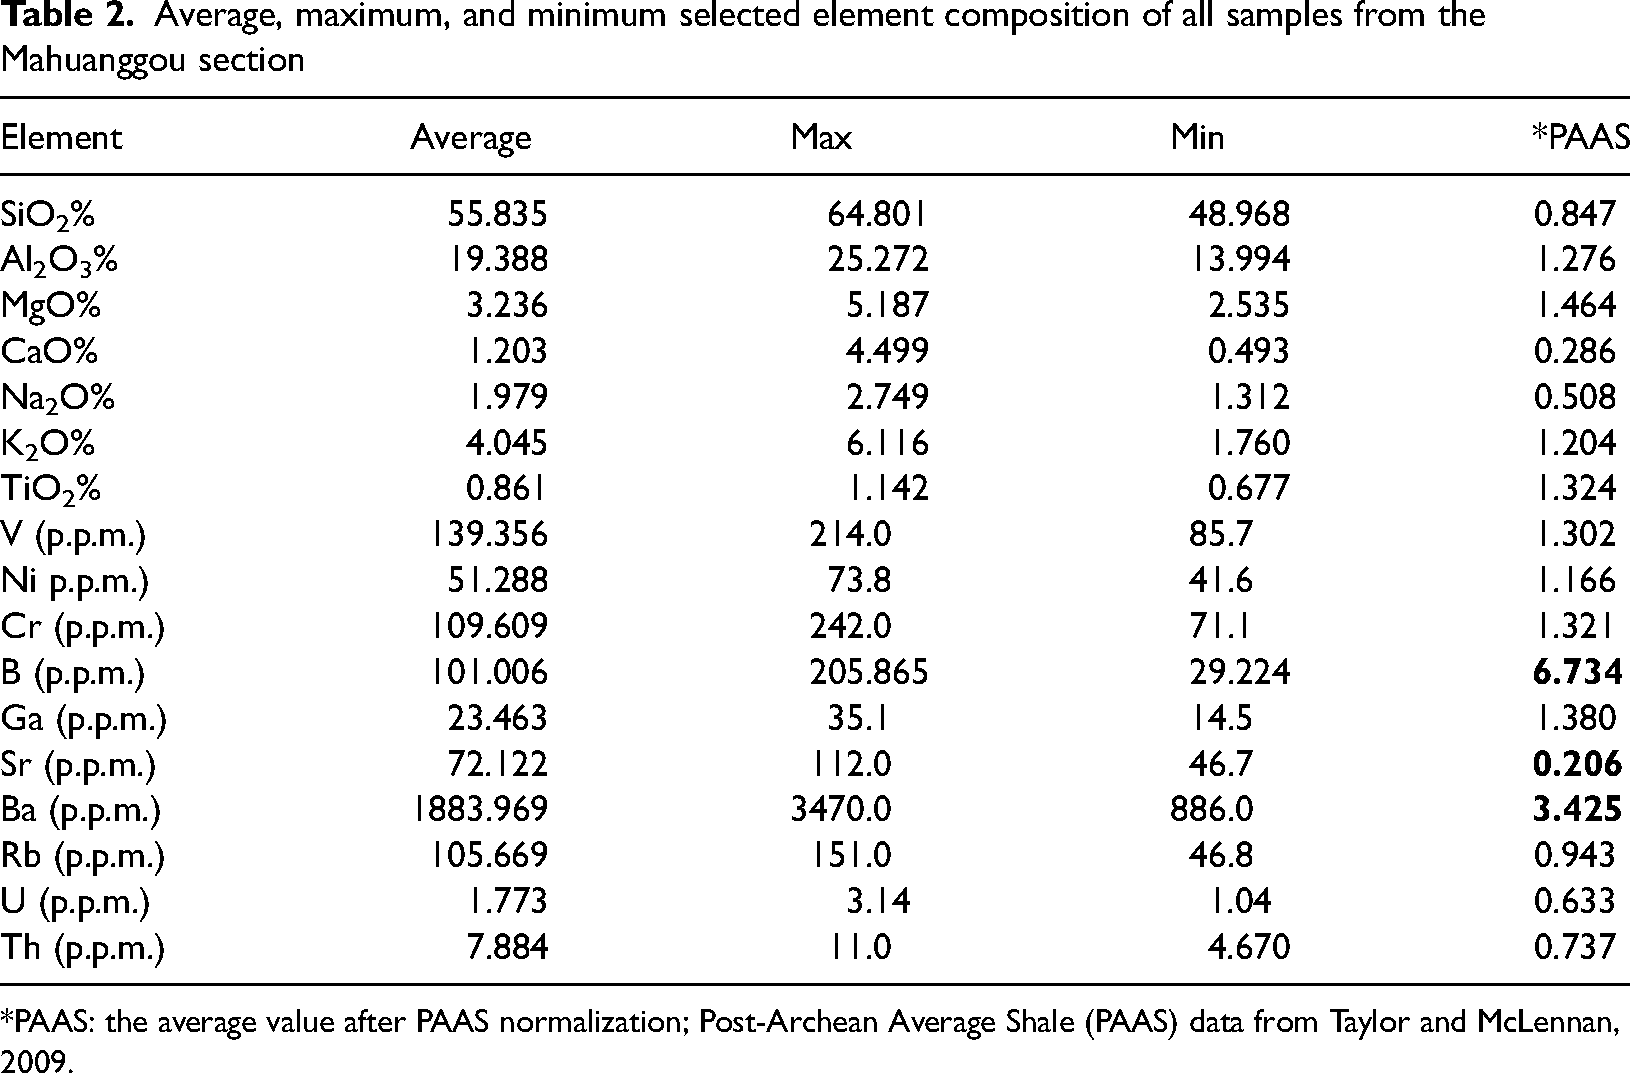
*PAAS: the average value after PAAS normalization; Post-Archean Average Shale (PAAS) data from Taylor and McLennan, 2009.
The trace elements analysis of the Mahuanggou samples from Shennongjia area are presented in Appendix 4 S2. In terms of trace elements, B and Ba have relatively enriched normalized values (the *PAAS of B is 6.734, Ba is 3.425) (Table 2). In contrast, Sr has the lowest normalized values (the *PAAS of Sr is 0.206), which probably indicates unique characteristics of the marine sedimentary environment during the late Neoproterozoic (Wu et al., 1999).
Elemental ratios
The B and V elements (Walker and Price, 1963; Potter et al., 1963; Walker, 1968; Swihart et al., 1986) and the ratios of B/Ga (Thompson, 1968) and V/Ni (Cruse and Lyons, 2004; Teng et al., 2005) are selected as palaeosalinity proxies in this research. This study shows a rational B, Ga, V, and Ni demarcation. The B element content varies between 29.2 and 205.9 p.p.m., with an average of 101 p.p.m.; V content varies in 85.7∼214 p.p.m., with an average of 139.4 p.p.m., Ni content fluctuates in 41.6∼73.8p.p.m., average 51.288p.p.m., Ga element 14.5∼35.1 p.p.m., average 23.5 p.p.m. (Table 2). While the B/Ga ratio waved in 2∼6.4, with an average of 4.1; the V/Ni ratio fluctuated in 1.44∼4.93, an average of 2.84 (Table 3, Figure 7 and 8).
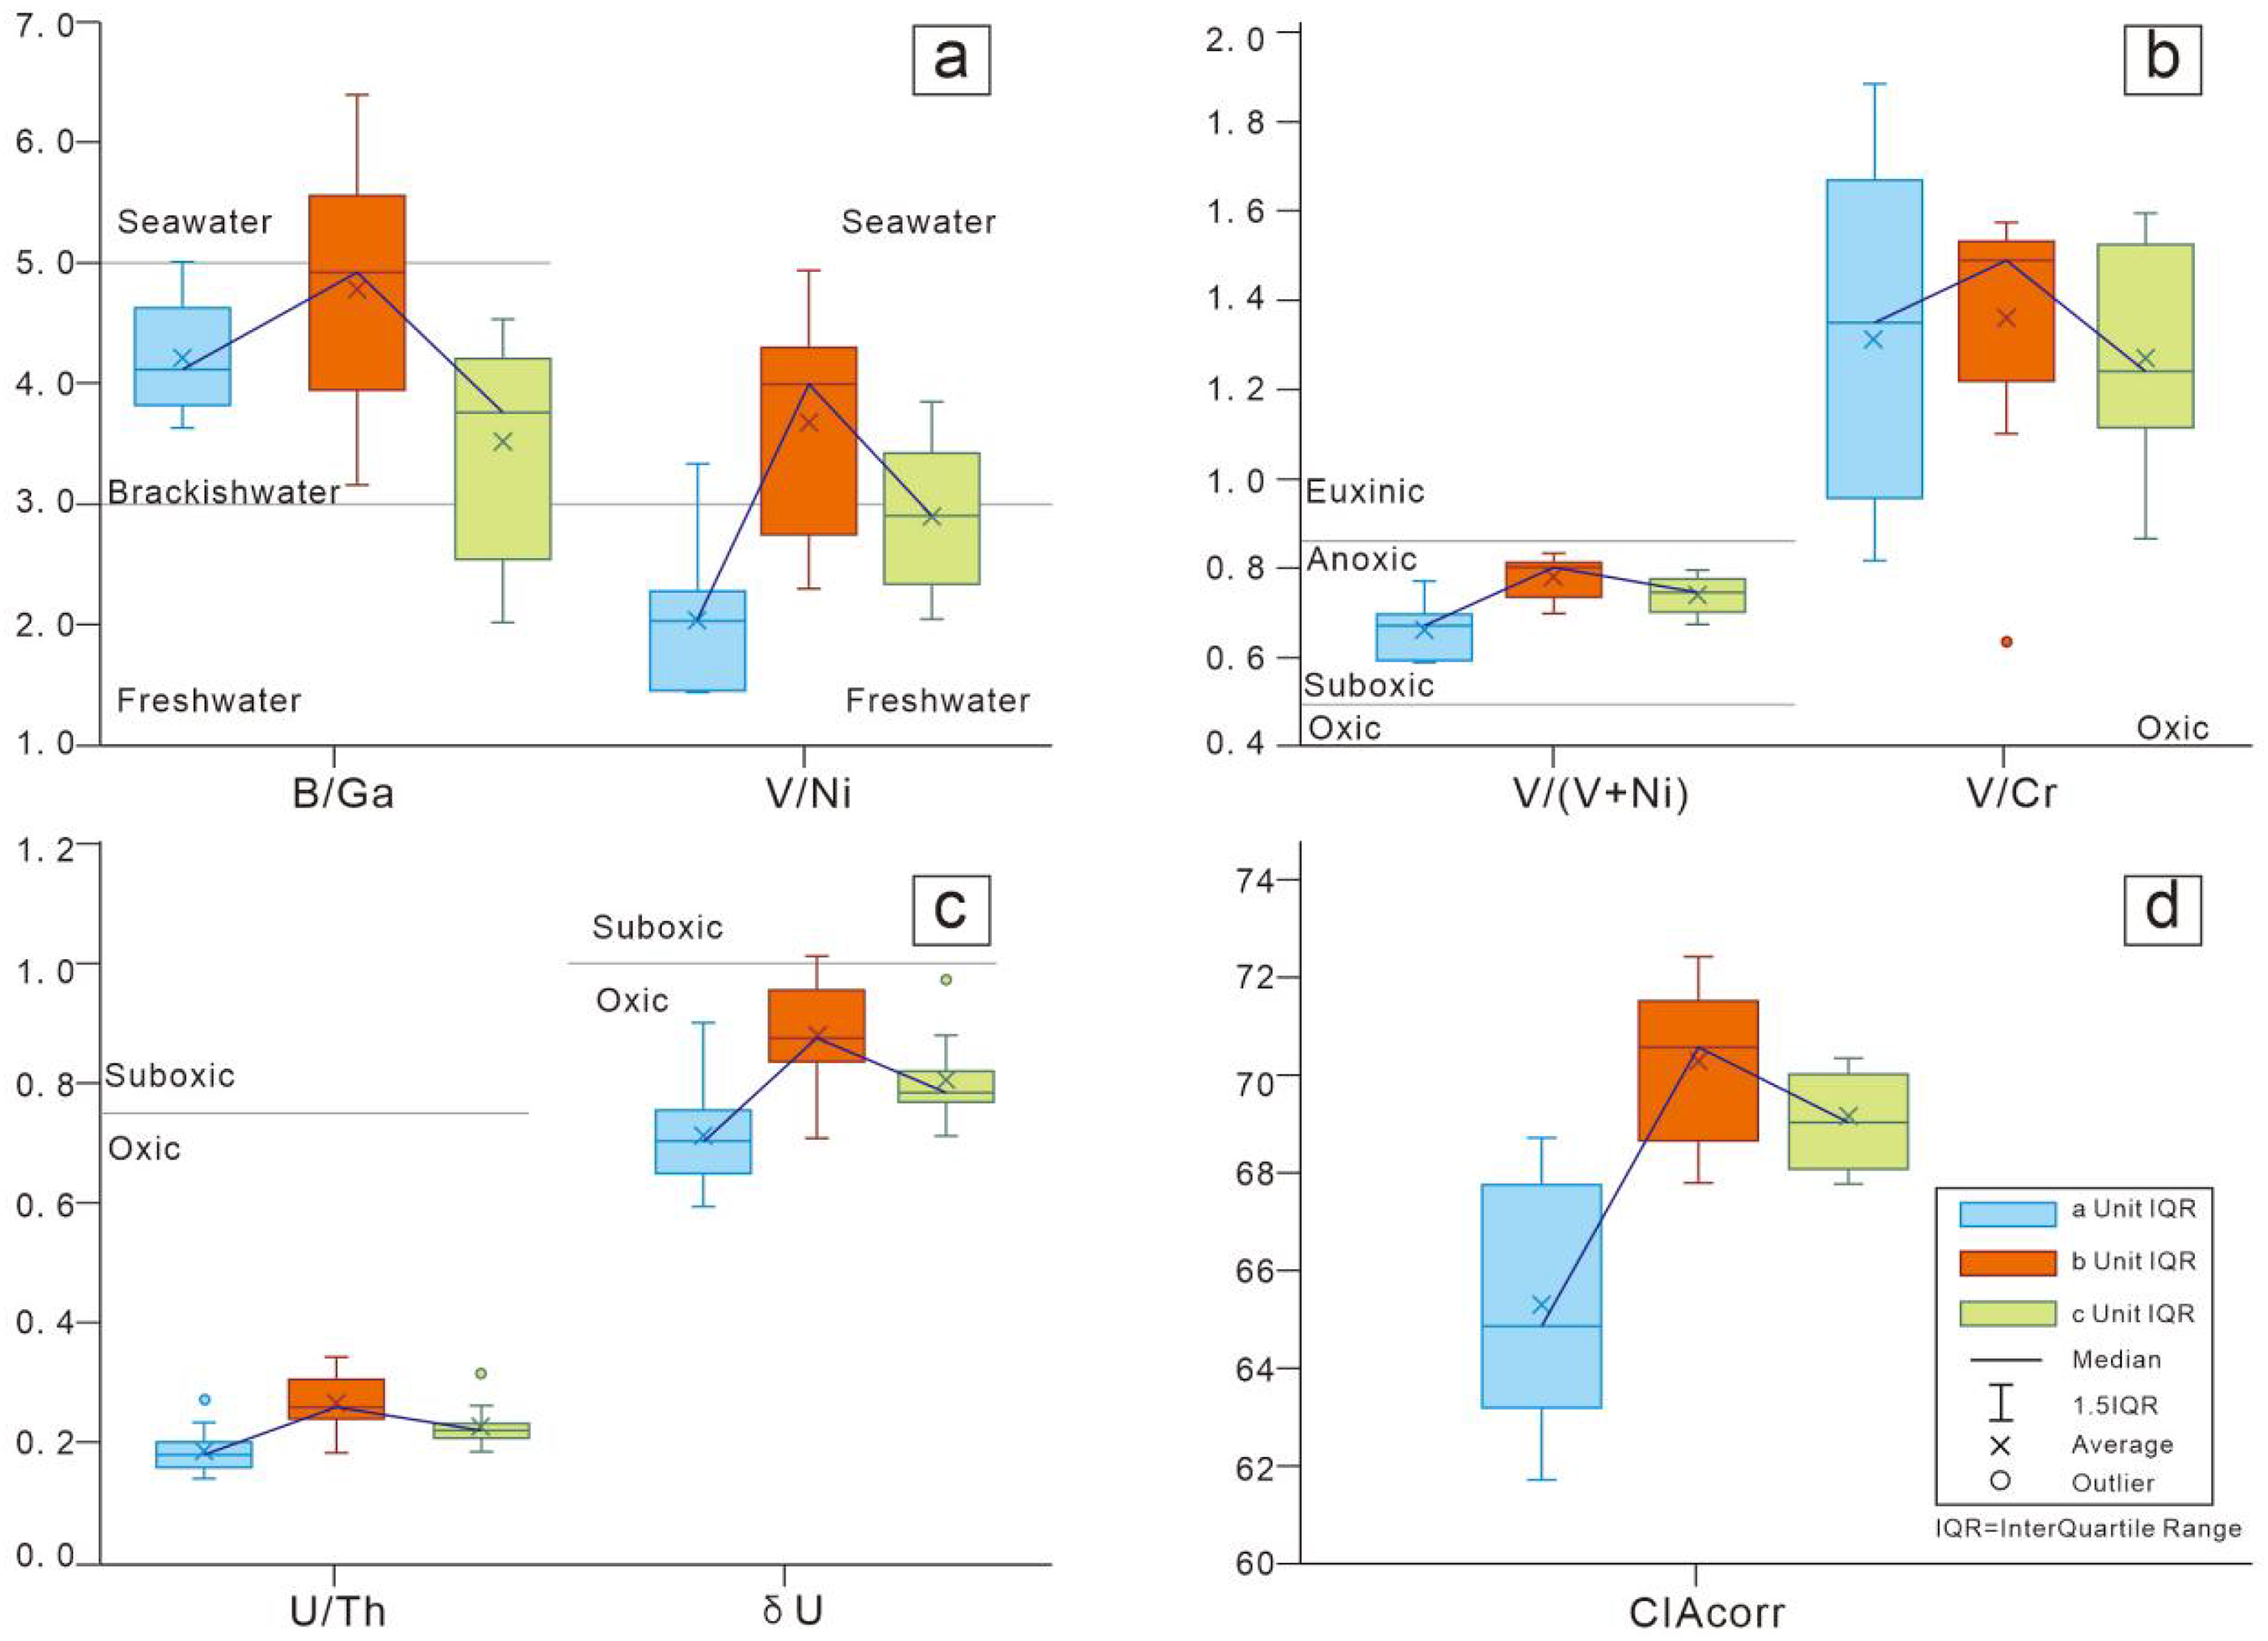
Box-plots of the B/Ga, V/Ni, V/(V + Ni), V/Cr, U/Th ratios, δU and CIAcorr proxies from Mahuanggou section, including the IQR (interquartile range) of each unit (the boxes), median (the horizontal lines), 1.5IQR (the whiskers), average (X points), and outlier(O points).
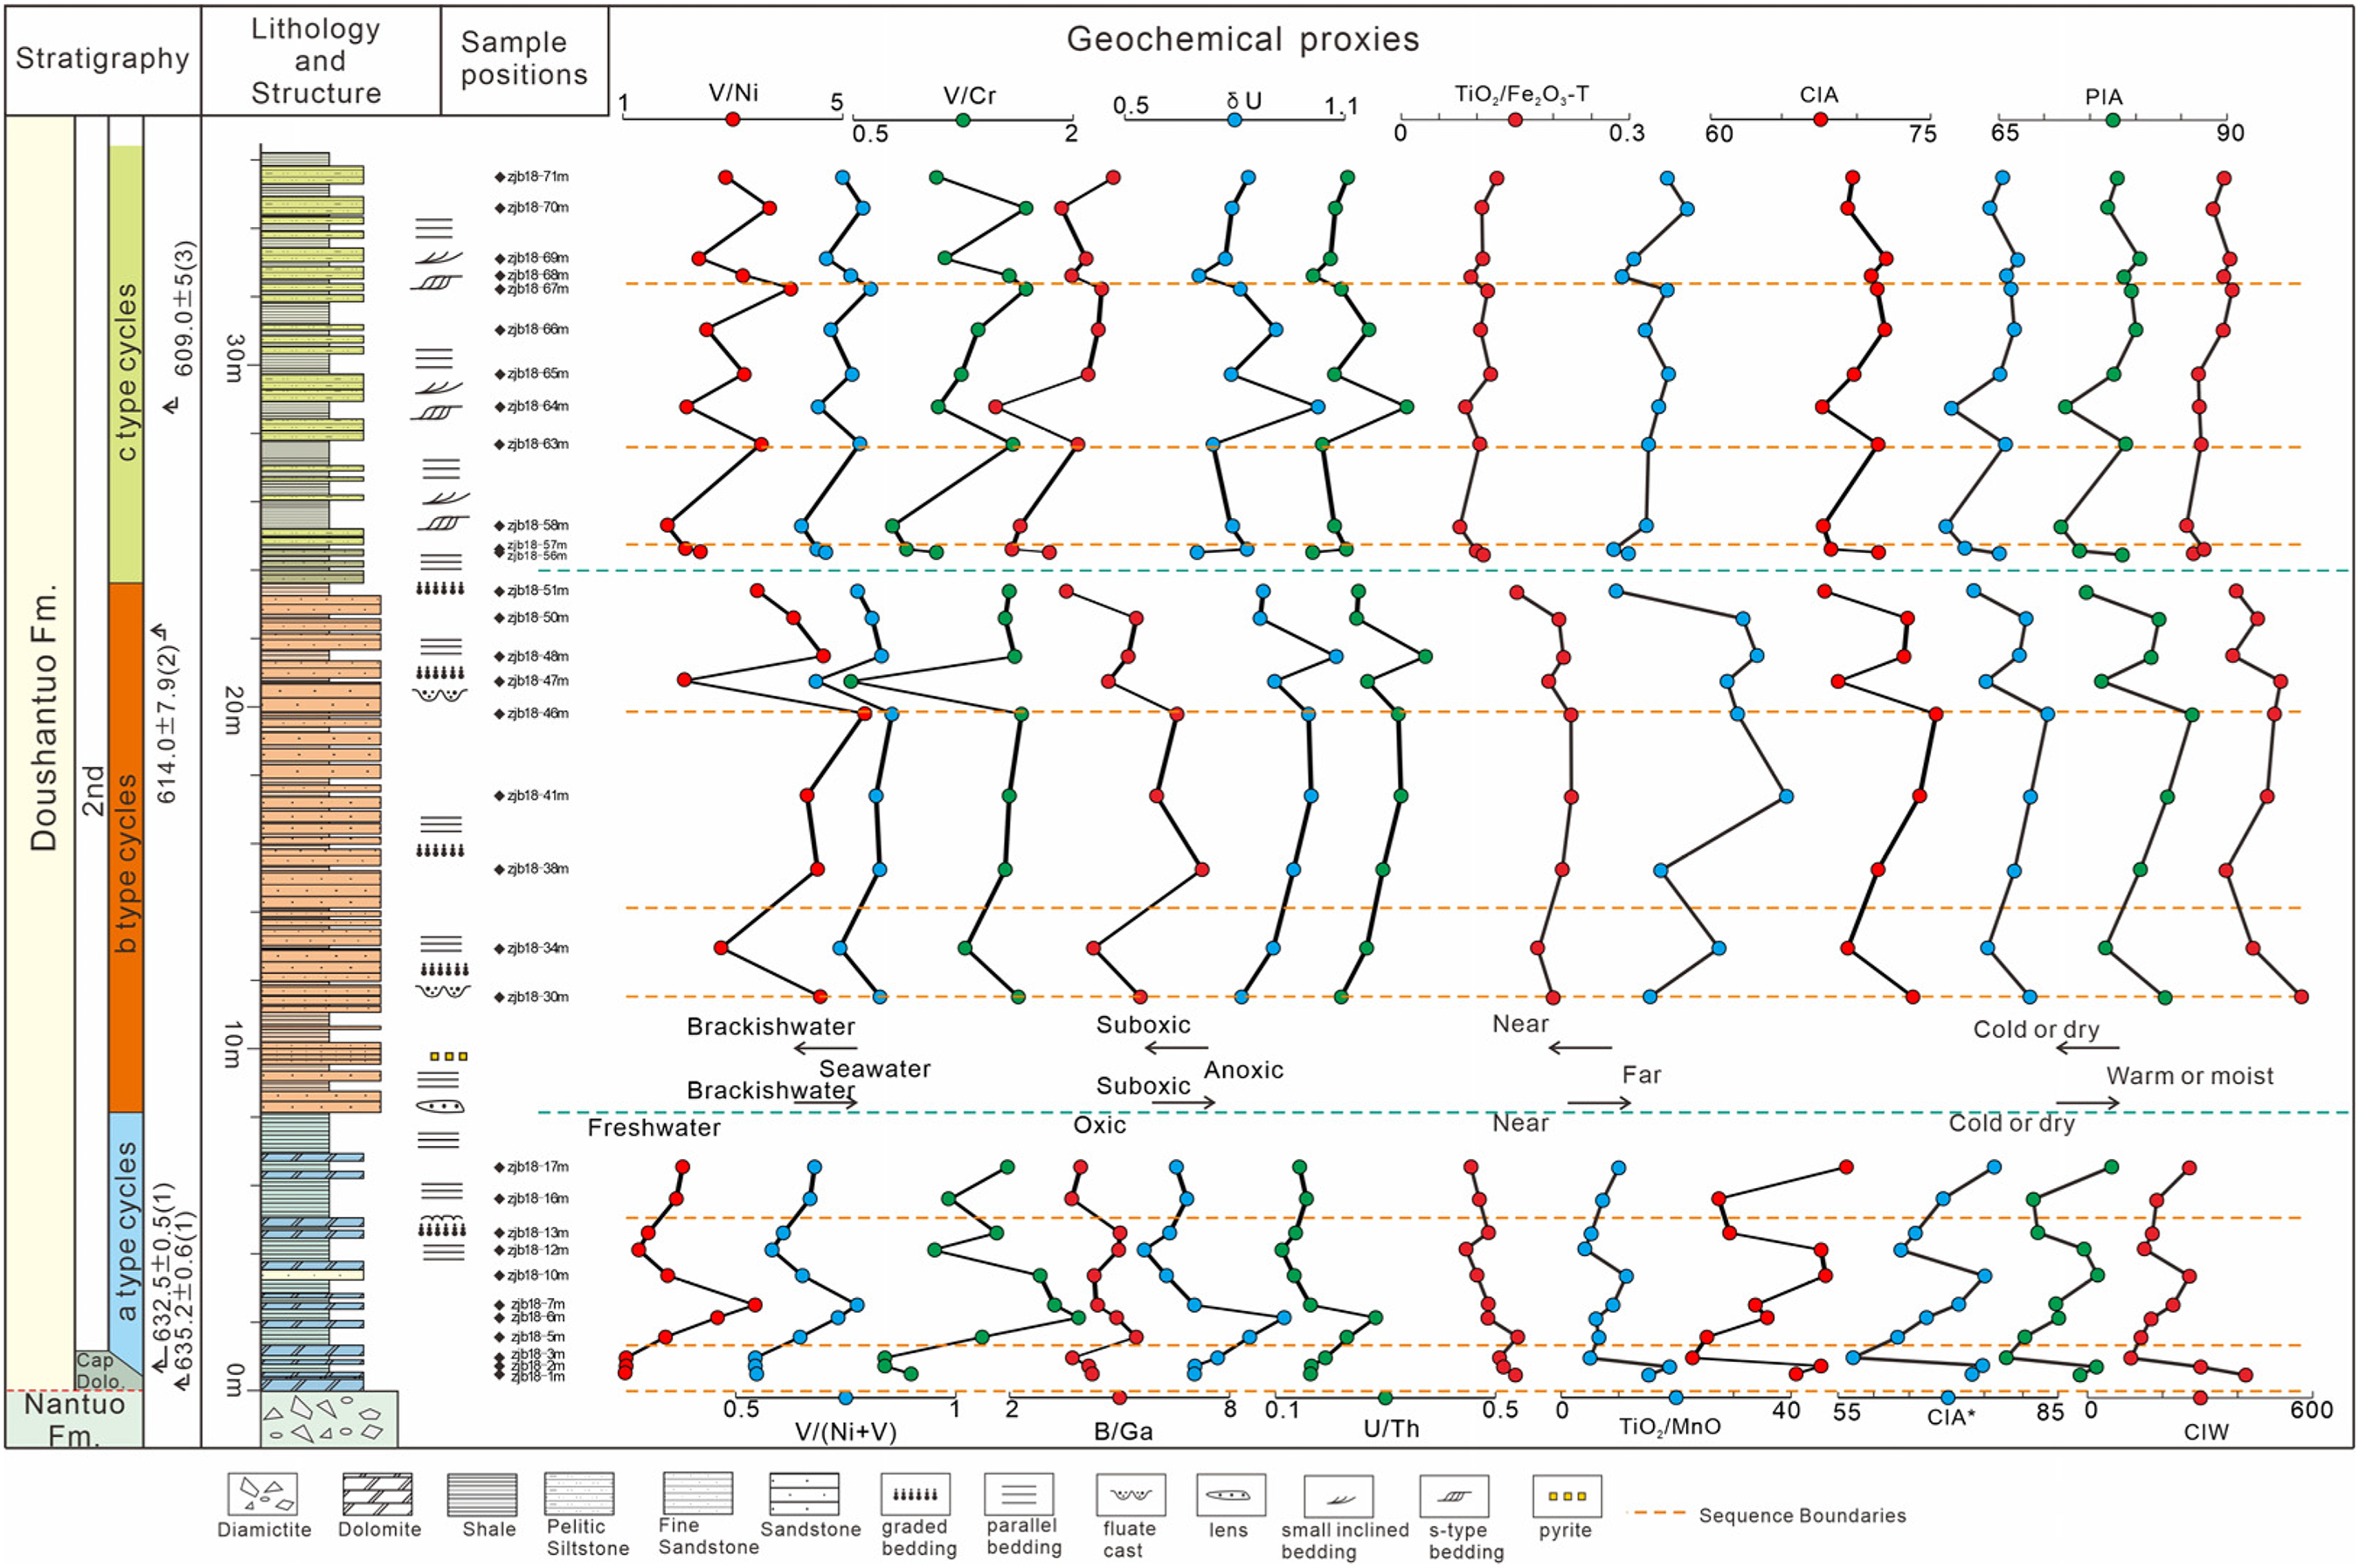
The geochemical proxies vertical variation sequence of the lower Doushantuo formation at Mahuanggou section.
Elemental ratios for paleoenvironment
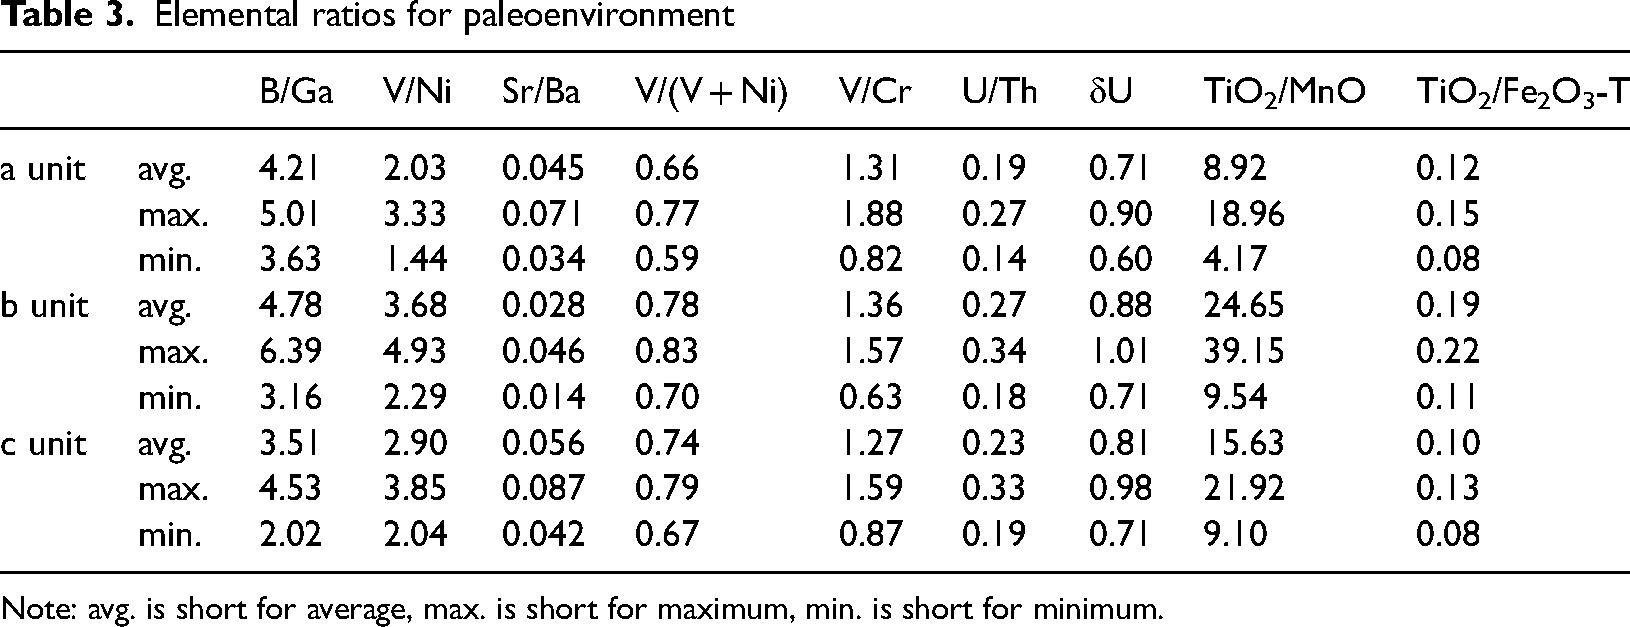
Note: avg. is short for average, max. is short for maximum, min. is short for minimum.
The ratios of V/(V + Ni) and V/Cr (Dill et al., 1988; Hatch and Leventhal, 1992; Jones and Manning, 1994; Tian and Zhang, 2016), U/Th and δU value (Jones and Manning, 1994; Wu et al., 1999; Teng et al., 2005) are employed as the main paleoredox proxies here (Deng and Qian, 1993; Chang et al., 2009; Tian and Zhang, 2016). Among them, the calculation formula of δU value is δU = 2U/(Th/3 + U) (Jones and Manning, 1994; Wu et al., 1999; Teng et al., 2005). The Cr element content varies between 71.1 and 242.0 p.p.m., with an average of 109.61 p.p.m., U element content 1.04∼3.14 p.p.m., average 1.77 p.p.m., Th element content 4.67∼11.0 p.p.m., average 7.88 p.p.m.(Table 2). The V/(V + Ni) ratio has fluctuated in 0.59∼0.83, an average of 0.72. The V/Cr ratio varied from 0.63∼1.88, average 1.31. The U/Th ratio wave in 0.14∼0.34, average 0.23. The δU fluctuates in 0.59∼1.01 (Table 3, Figure 7 and 8).
Additionally, the elemental ratios related to the TiO2 are also often used to discuss the offshore distance of sedimentary water bodies (Sugisaki et al., 1982, 1991). Here, the TiO2/MnO ratio has varied from 4.17∼39.15, and the TiO2/Fe2O3-T ratio has fluctuated from 0.08∼0.22. They also show that the fluctuated rise from a unit to b unit, then fall to c unit (Table 3, Figure 8).
CIA*, CIW and PIA
CIA values
As shown in Appendix 1 and Figure 7 and 8, the CIA* varied from 57.04–83.59, with an average of 74.31, and the CIA* of a unit oscillated between 57.04 and 76.31, for b unit it waved between 73.49 and 83.59, and for c unit it varies between 69.66 and 79.45. Vertically, CIA first rise from a unit to b unit, then fall from b unit to c unit, overall. Meanwhile almost in each of third-order sequences, CIA* also started with a low value and increased successively.
CIW and PIA values
CIW and PIA values of this study samples are shown in Appendix 4 S1 and Figure 8, its variation patterns also present periodic changes and just fit the discussion. The CIW and PIA values fluctuate from a unit to b unit, then fall to c unit.
Related to freezing or melting glaciation, the climate variation will lead to the ascending or declining eustatic change (Hoffman et al., 2017; Yang et al., 2017; Creveling and Mitrovica, 2014). Wang et al. (2017) reported that the potential cold paleoclimatic implications by the Silicified Glendonites in the upper Doushantuo second member (lower than EN2, and upper than WANCE). Petrographic evidence suggests that these silicified glendonites formed at near-freezing temperatures. This shows that a record of localized frigid period unrelated to the known Ediacaran glaciation in south China.
To sum up, it is not difficult to see the first rise and then fall changes in various element contents and ratios in this study of the Doushantuo Formation in the Mahuanggou section. From the bottom to the top, first from the oxidation transitional, brackish and near shoal shallow water environment (a unit) to the suboxic and bathyal water environment (b unit) where seawater salinity increases gradually, and then returns to the fresh-shallow water, and oxidation transitional environment (c unit). A variety of chemical weathering indexes all indicate that the early Ediacaran chemical weathering intensity varies in a completed transgressive-regressive cycle, and three units can be recognized.
Fischer plot and sequences
Based on the regional and isochronous stratigraphic framework, the characteristics of the sequence boundary, the stacking patterns of lithofacies and Fischer plots, we proposed the sequences division.
A series of precise zircon ages of tuffs have been found in the Doushantuo Formation on the northern margin of the Yangtze River, and their sedimentary duration is limited to 635–551 Ma, about 84 Ma (Condon et al., 2005; Yin et al., 2005; Zhang et al., 2005). In combination with the geological overview of the Upper Doushantuo Formation in the Yangtze region, the Doushantuo formation can be divided into two and a half second-order sequence/supersequences (30∼40 Ma) during this early Ediacaran Doushantuo period (Wang and Shi, 1998; Zhu et al., 2007; Yang et al., 2015). In addition, the biostratigraphy, carbon isotope chemical stratigraphy and isotopic age data of the Doushantuo formation are the major or auxiliary indicators, which have a brilliant mutual verified to the above sequence division and stratigraphic correlation (Liu et al., 2009, 2012a; Zhou et al., 2017, 2019, 2021; Zhu et al., 2019).
In recent years, several isotopic age data have been reported in the middle and lower strata of the Doushantuo Formation. For example, Liu et al. (2009) and Zhou et al. (2017) reported two zircon age of 614.0 ± 7.6 Ma and 609 ± 5 Ma at the Zhangcunping area (Figure 1 and Figure 6). However, these ages do not accurately define the boundary age limit between the second and third members of the Doushantuo Formation (also supersequence 1 and 2). Therefore, some scholars have conducted astrocyclostratigraphic research and discussion on the depositional time limit from different sections of the Doushantuo Formation (Gong et al., 2017, 2019; Sui et al., 2018; Xue et al., 2020; Li et al., 2022).
Xue et al. (2020) used the gamma curve from a complete Doushantuo Formation (214.34m thick in total) drilling at the southern Huangling anticline to study astronomical cycles. They established a time scale for astronomical cycle calibration by spectral analysis and filtering. Then based on the reliable zircon dating data of 635 Ma, they set the time boundary of the second and third members of the Doushantuo Formation at 591 Ma. We agree with the time limit of the second/third member of the Dou Formation (supersequence 1/2). The sedimentary time of the study intervals Doushantuo first to second is 635–591 = 44Ma, so 9–14 third-order sequences can be identified in this study (third-oder sequence, 2–5 Ma, e.g., Wang and Shi, 1998).
According to the above division basis and identification characteristics, each lithological layer in the lower Doushantuo Formation of the Maguangou section was observed and counted in detail. Each cycle's boundary is divided by the lithologic abrupt interface and the shallowing-upward progradation. The lower layer of the cycle is often composed of lithofacies representing relatively deep water, while the upper layer is formed in shallowing-upward water. According to the internal structural differences and separated facies of each cycle, the types of microcycles are divided into three types: A, B, and C type cycles.
The A-type cycle sets are mainly deposited in the intertidal facies (Figure 7). With the rising of sea-level, the sedimentary environment gradually transits into lower intertidal facies (Read, 1985; Flügel, 2004). In the intertidal facies strata, the lower layer of the cycle is LF1 grey–green medium thin layer thick layer (10–35 cm) mudstone and dolomitic mudstone, and the upper layer of the cycle is LF2 grey thin layer (5–15 cm) micrite to finely crystalline dolomite or LF3 grey green thin layer (10cm) silty fine sandstone, forming a complete A-type fifth order cycle (Figure 2C, D). The argillaceous sediments of the next cycle of transgression are covered again, forming the abrupt interface of lithologic A-type cycles. And in the lower intertidal facies strata, the top of cycle sets (Figure 2E) is composed of LF1 grey thicking-upward mudstone mixed with thin LF2 micrite dolomite.
The B-type cycle sets are mainly deposited in the subtidal facies. The lower layer of the cycle is LF4 grey and dark grey thick massive (30–120 cm) quartz fine sandstone, and the upper part of the cycle is composed of LF5 dark grey thin laminated (5–15 cm) siltstone and mudstone, forming a complete B-type fifth order cycle (Figure 7). These B type cycles constitute incomplete Boma sequence (Figure 3B, F), develop by low-density turbidite sequence and clastic flow deposits (Figure 3C, D) (Flügel, 2004; Postma et al., 2014; Shanmugam, 2000, 2021).
The C-type cycle sets deposited in the intertidal-lagoon facies. LF 6 yellow green thin bedded mudstone and LF 7 thin medium argillaceous siltstone fine sandstone (Figure 7). It is a high-frequency different graded bedding in cycles succession. First C cycle sets overlaps with coarse-upward bedding and then C cycles sets turns to normal graded bedding (Figure 4A). In the ascending order, it could alter from subtidal faciese into intertidal-lagoon facies (Flügel, 2004).
According to the above cycle types and divisions, a total of 131 m-scale cycles (0.04–1.28m) are identified, with an average thickness of 0.276m. First, there are four cycles with cycle thickness (ct.) of more than 1m (cycle number, cn. 18,19,41,53), among which the cycle thickness of cycle numbers 23–26, 62–96 and 105–116 has maintained a stable low value (less than 0.2 m). Secondly, there are 39 cycles with cycle thickness at 0.1–0.2 m in total, accounting for 29.8% of the total. The cycles, with thickness in the range of 0.5–0.6 m, are followed by 13 cycles, accounting for 9.9%. The number of cycles exceeding 0.8–1.3 m accounts for a small proportion of the whole cycles.
Then through the rise and fall changes of Fischer plot, combined with the results of filtering denoise, 34 paraSQ and 9 SQ are divided from bottom to top. In the second member of Doushantuo Formation, there are usually 3–5 (average 3.8) fifth-order cycles (i.e., microcycles) to form a fourth-order cycle; Each third-order cycle is also composed of 3–5 (average 3.7) fourth-order cycles (Figure 7).
According to the respective thicknesses of 131 m-scale cycles, the Fischer plot (Figure 7 right part) of the Doushantuo Formation in the Maguangou section is drawn. The Fischer plot as a whole shows an asymmetric rise fall complete cycle, but the rise stage is accumulated by a series of frequent oscillation three-stage cycles (SQ1–6), reaching the highest at SQ6 (corresponding to fourth-order cycle 15, micro cycle 57–59) and then declining steadily (SQ7–9).
Discussion
Fischer plot and relative sea-level change
According to previous studies, the types, lithofacies and thickness of meter scale cycles in sedimentary strata often change regularly, and it is considered that they are controlled by the changes in accommodation space caused by long-term third-order relative sea level changes (Chen et al., 2001; Meng and Ge, 2004; Fischer et al., 2009; Catuneanu, 2019). When the tectonic movement is relatively stable, the accommodation space changes with the change of relative sea level, that is, the change of relative sea level directly controls the increase (corresponding to the rise of relative sea level) or decrease (corresponding to the decline of relative sea level) of sediment accommodation space (e.g., Posamentier and Vail, 1988; Cross and Lessenger, 1998; Zheng et al., 2000; Zhu, 2000; Catuneanu et al., 2009; Catuneanu, 2019). Therefore, the change law of Fischer plot can semi qualitatively reflect the change of relative sea level, that is, when Fischer plot rises, the relative sea level rises, and when it falls, the relative sea level falls (Sadler et al., 1993; Goldhammer et al., 1993; Chen et al., 2001; Mei et al., 2001; Meng and Ge, 2004; Tucker et al., 2009; Lin and Hou, 2014; Cho and Hong, 2021).
Previous studies have suggested that moraines in the Nantuo Formation of the Yangtze craton represent the products of Forced Regression deposition. After the melting of glaciers, two periods of significant transgressions were formed, that is, after the first period of the glaciation of the Nantuo Formation, the sea level of the Doushantuo Formation rose rapidly to the highest level, resulting in the formation of the carbon bearing, phosphoritic, shale dominant, starred or condensed section, and then until the Cambrian, Another stage of transgression formed extensive carbonate rocks in the Dengying Formation, and the corresponding formation of the bathyal abyssal carbonaceous shale and siliceous rocks in the liuchapo formation or Laobao formation (Liu, 1991; Wang et al., 1999; Wang and Li, 2001; Wang and Li, 2003) Later, other scholars summarized the characteristics of Doushantuo Formation and its corresponding strata, considered the lower, middle and top black carbonaceous argillaceous rock series as the sedimentary product of rapid sea-level rise, and took the sharp contact interface between moraine and cap dolomite of Nantuo Formation and the lithofacies conversion surface or erosion surface related to granular dolomite and gypsum salt layer in Doushantuo Formation as the sequence boundary (SB) formed by sea-level decline, combined with the precise zircon age of volcanic ash, the dushantuo formation of the Yangtze craton is divided into two semi second-order sequences (SS) (Zhu et al., 2007; Yang et al., 2015).
Based on the rising and falling rules of Fischer plot in this study and the results of denoise filtering (Appendix 1,2), combined with the known age data with high confidence, 34 para sq cycles and 9 sq cycles are divided from bottom to top. This time, the fine disassembly of Marinoan's high-frequency sea-level change law after ice is obtained through Fischer plot. The sea-level change after ice (Figure 9) is shown as follows:
First of all, on the short-term cycles (fifth-order cycles), the intertidal mixed sediments A-type cycles and subtidal sandstone B-type cycles show a complete rhythmic combination of stepped lower transgression and upper sea level slow decline, while the intertidal lagoonal facies C-type cycles sedimentary sequence is the product of episodic decline of sea level stability, and the lithologic mutations in the upper and lower layers of each cycle are not obvious. It is formed by the deposition of fine-grained clastic material carried by tidal reflux.
Secondly, the law of medium-term cycles (third order cycles) is shown as (1) the relative sea level first decreases slowly (SQ1); (2) the relative sea level begins to rise slowly in a step-by-step manner, but the change range is small (SQ2); (3) the relative sea level begins to rise rapidly and substantially, and then slowly falls back (SQ3); (4) the relative sea level is relatively stable and slowly rises (SQ4); (5–6) the relative sea level first continues to rise, After reaching the peak value of the rising phase, it began to fall (SQ5–6); (7) the relative sea level fell rapidly and steadily (SQ7); (8) the relative sea level fell again after a short period of stagnation and slight rise, and fell to the lowest value (SQ8); (9) the relative sea level tended to fluctuate and stabilize (SQ9).
Finally, we propose a two-stage (long-term cycles, second-order cycles) variation of ice melting-forced sea-level change, i.e., (1) early high-frequency and slow to rapid stepwise rising, and (2) followed by stable decreasing in the latter.
On the one hand, this understanding confirms the previous understanding of stratigraphic sequence division and relative sea level change, on the other hand, it expands and extends people's understanding of the law of sea level change during the early Ediacaran period. First, the rise of relative sea-level in the early stage of post-deglaciation is not achieved overnight, but by stage and stage. Second, the relative sea-level change is not rising continuously, but there is a period for relative sea-level decline.
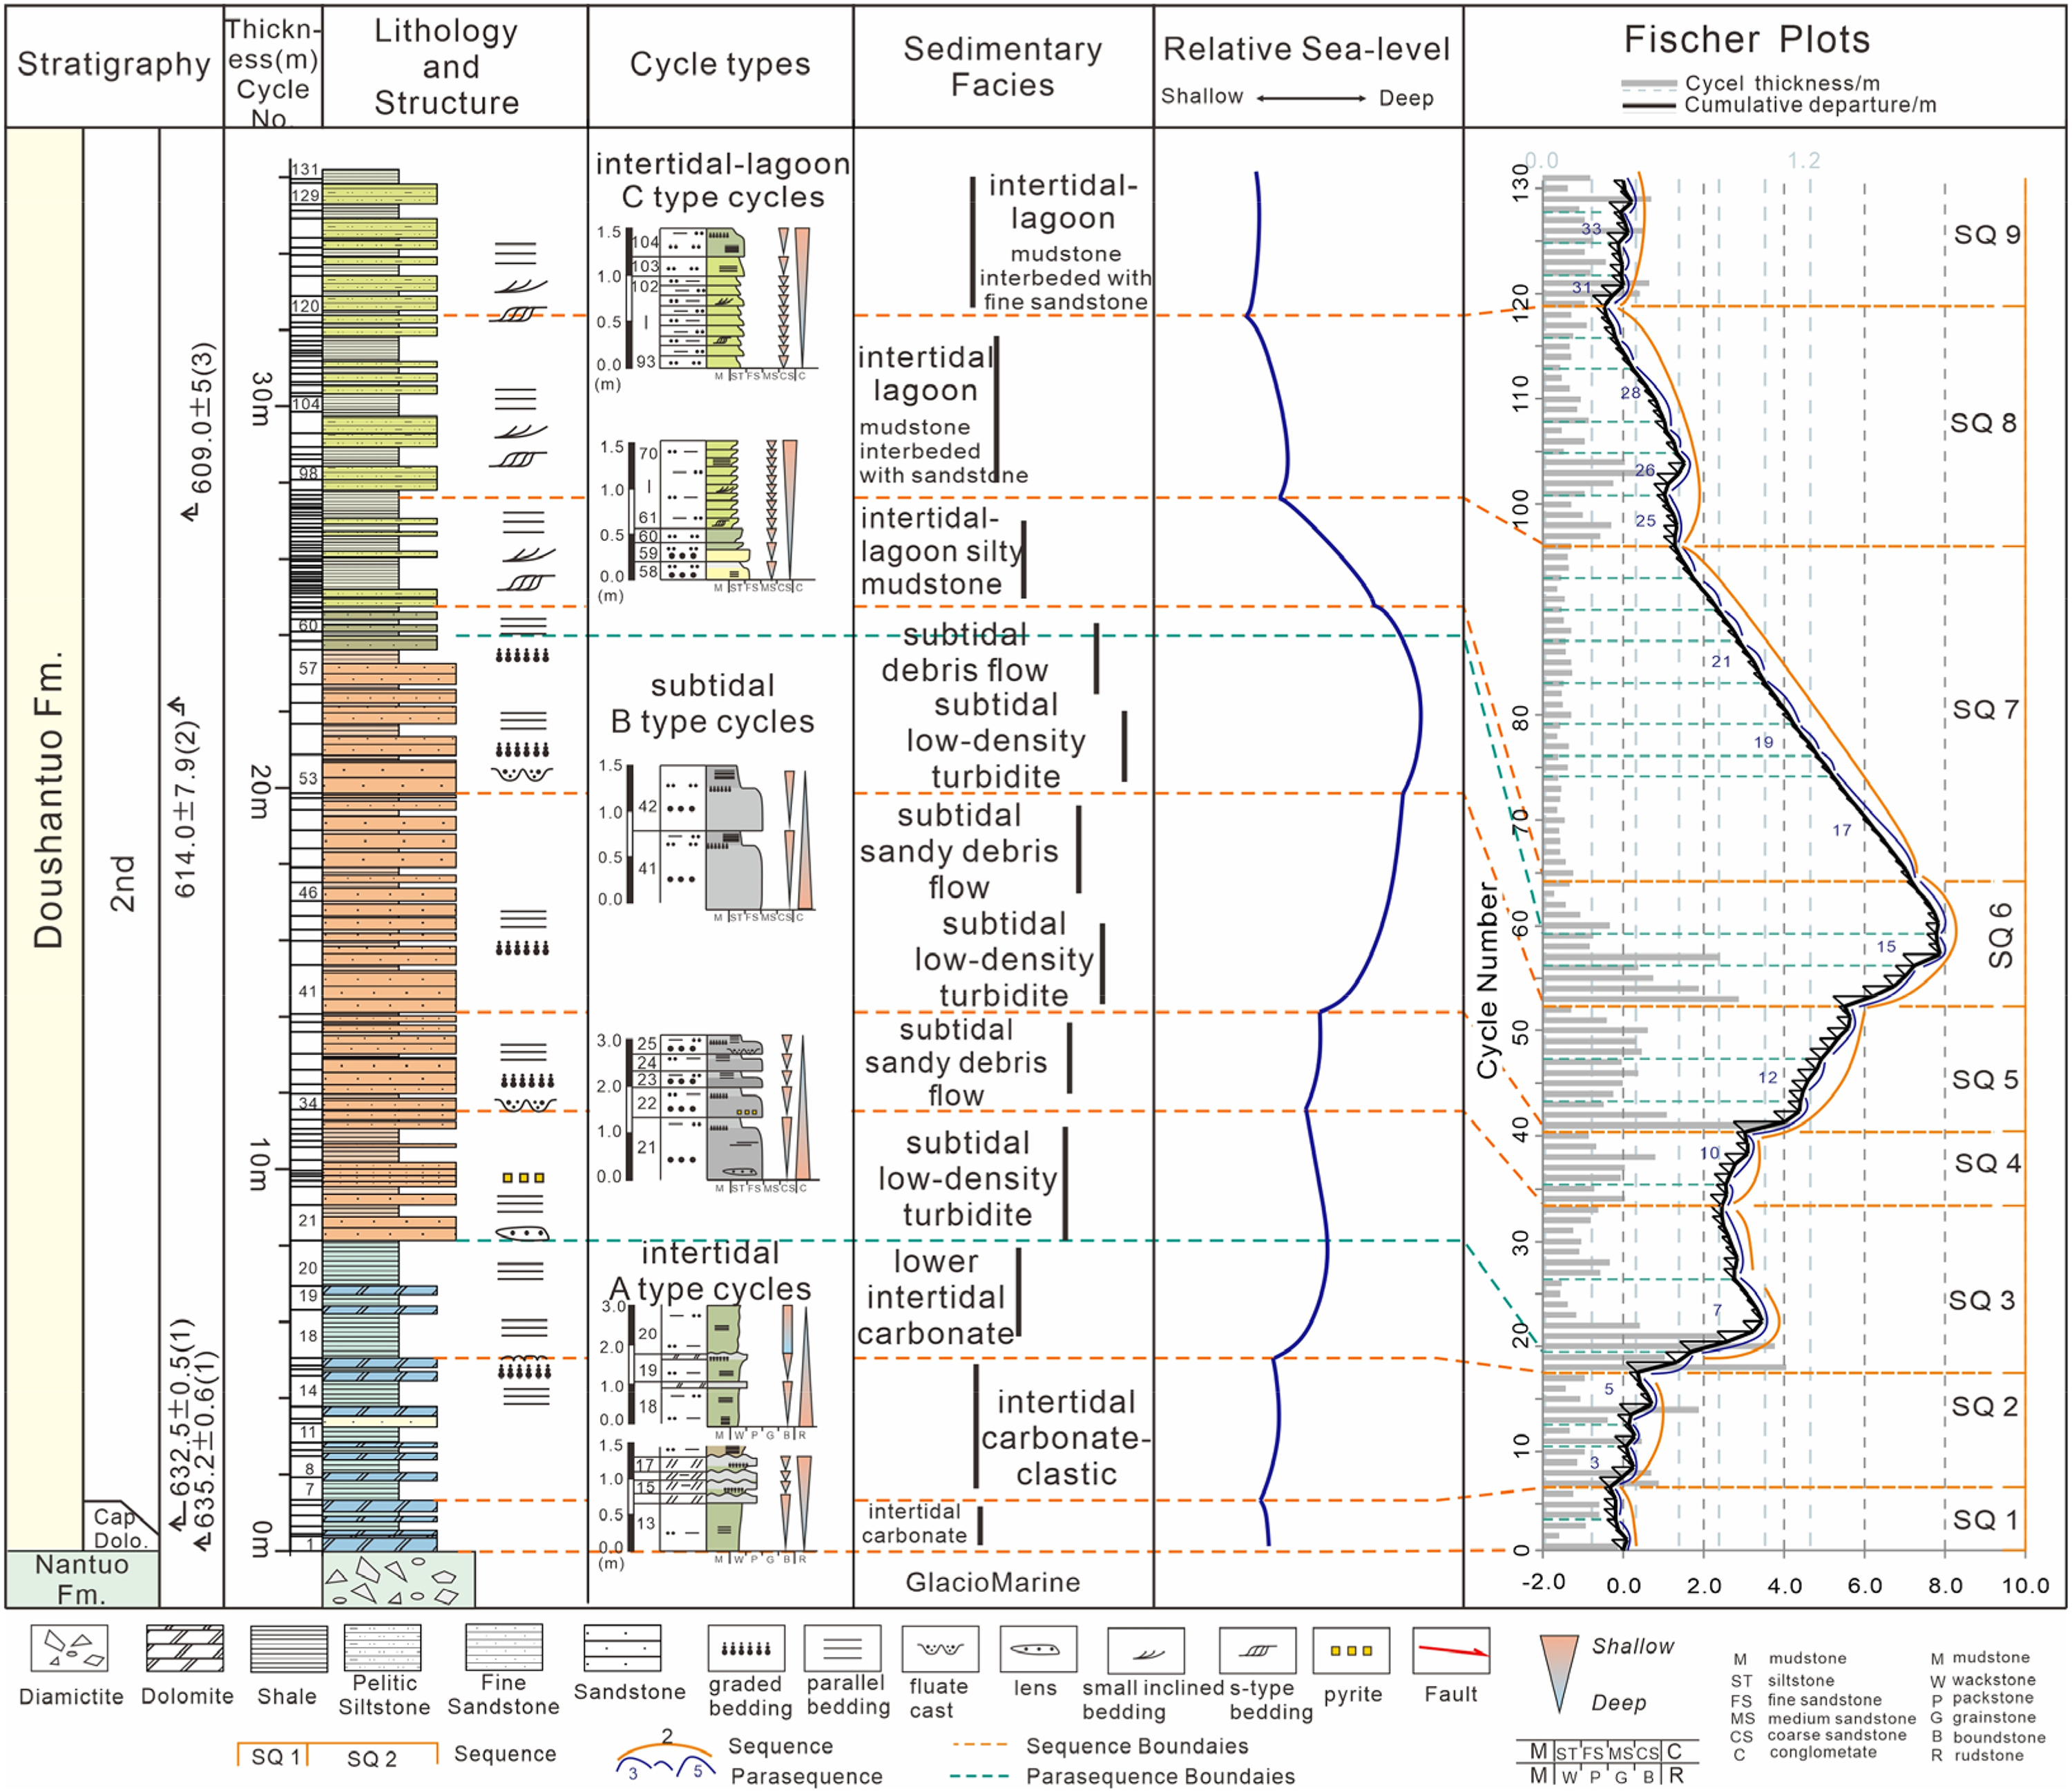
Fischer plot and cyclic strata of the lower Doushantuo formation at Mahuanggou section. The ordinate in the Fischer plot is the number of cycles, corresponding to the Maguangou section from the boundary of Nantuo formation Doushantuo Formation to the top stratum of Doushantuo second member; The abscissa is cycle thickness (grey bar chart) and cumulative Department (black zigzag line). The dark blue curve shows the relative sea-level changes interpreted by Fischer plot, matched well with the sedimentary facies (black bar chart). Age data from [1] Condon et al., 2005; [2] Liu et al., 2009; [3] Zhou et al., 2017.
The vertical evolution of sedimentary facies response to relative sea-level change
Based on the interpretation of the vertical stacking pattern of facies, geochemistry, and Fischer plot, we propose that during the early Ediacaran period the Mahuanggou section was in a tidal platform sedimentary face (Figure 10).
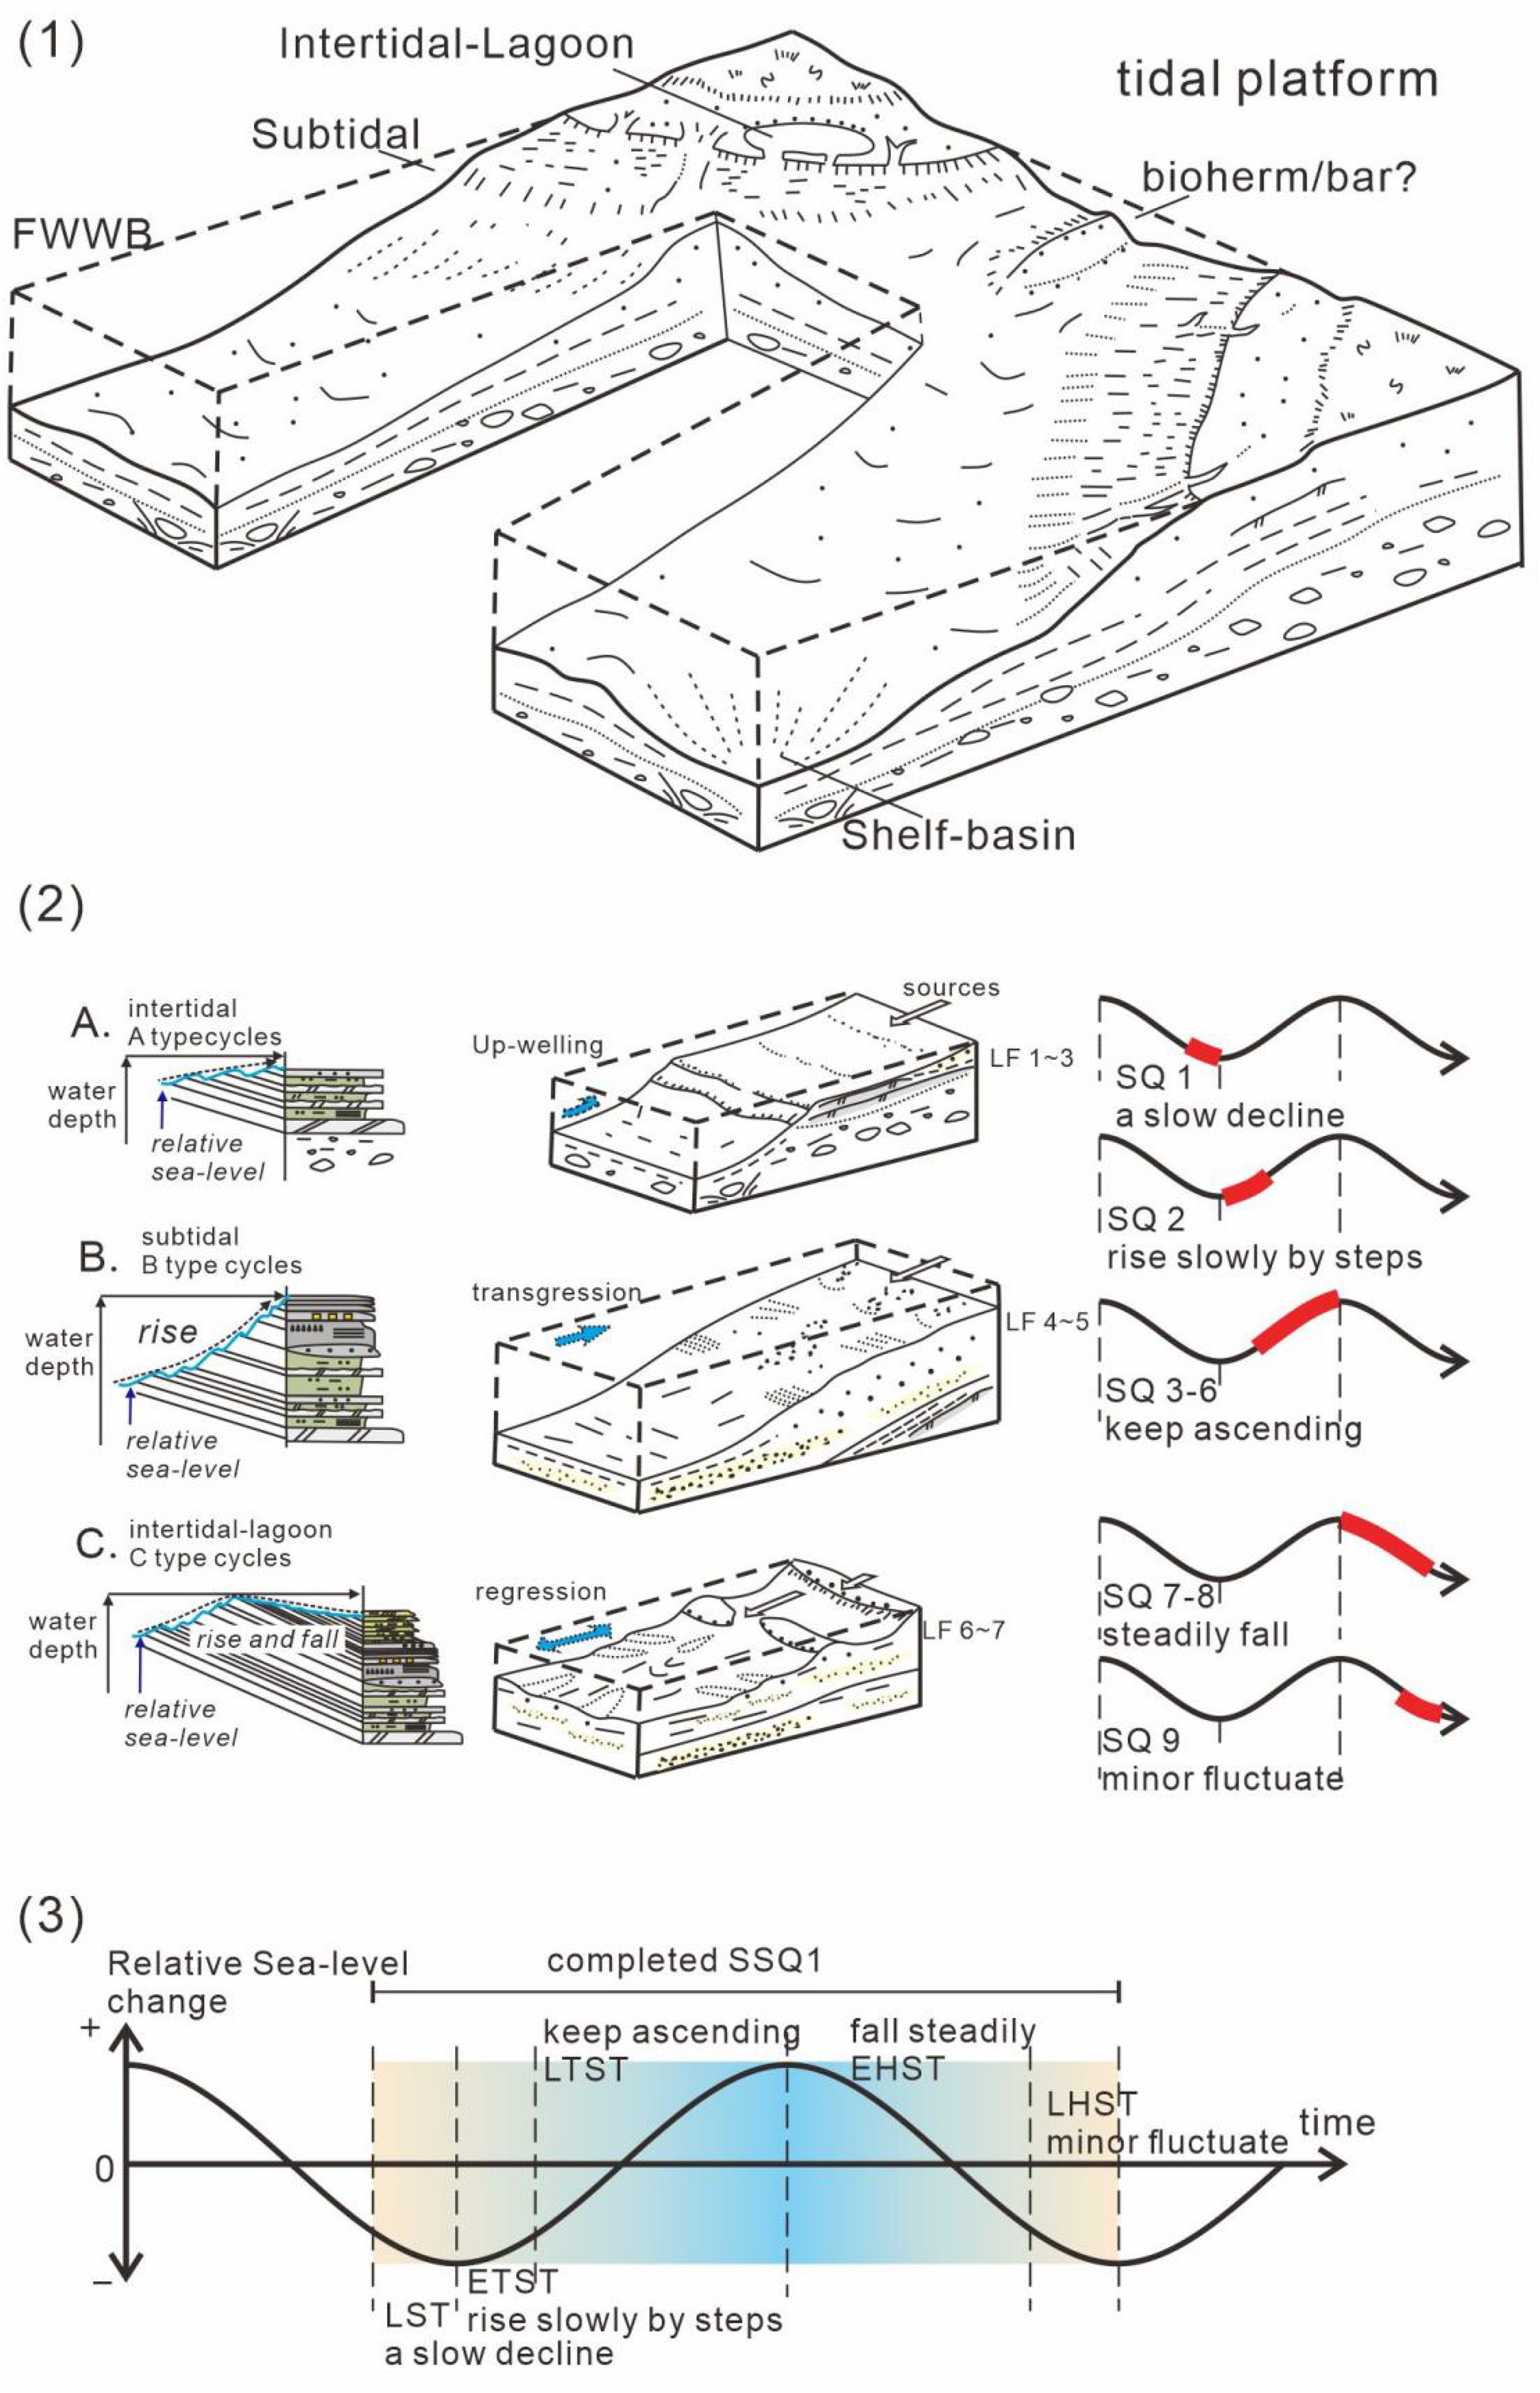
Facies model and evolution of the lower Doushantuo formation at Mahuanggou section, (1) tidal platform model of the Doushantuo formation, (2) facies evolution of the lower Doushantuo formation, and (3) the relative sea-level change match with different system tracts of the SSQ1 during the Doushantuo stage.
In the aftermath of Marinoan glaciation, the early stage of the post-deglaciation, the sea-level change shows the slow decline (LST) and rise slowly by steps (ETST) (Figure 10 (3)). The SQ1 is composed of middle-layer cap micrite dolomite (Figure 2B) and the sedimentary units of calcareous mudstone and normal graded upward transit thin-layer dolomite, which belongs to intertidal carbonate facies deposition. After the occurrence of mudstone layer (cycle 3, 0.2 m thick mudstone) (Figure 2C), the sea level began to decline slowly, and it showed two fourth-order cycles of relative decline on the Fischer curve (cycle numbers 1–6). This shows that the deposition process of cap dolomite is not a marine transgression process caused by post deglacial rapid sea level rise, but also a relative sea level decline process. This can also be compared with the three-component model of South China cap carbonate summarized by predecessors, that is the basal part of cap carbonate with brecciated structures (C1 of Jiang et al., 2003, 2006) can be interpreted as a LST at the beginning of deglaciation. Then the middle part of cap carbonate with Tepee-like structures (C2) can represents a TST at the sea level rapid rising epoch. Last the upper laminated carbonate layers of cap carbonate (C3) can be discussed as a HST at the end of cap carbonate sedimentary epoch (Zhu et al., 2007). In the SQ2, the sea-level slowly rose rhythmically, depositing a series of shallowing-upward cycles of normal graded carbonate or clastic rocks(Figure 2C,D, Figure 5A,B,D) in the intertidal zone, which showed a three episode oscillation and slow rise in the Fischer curve (paraSQ3–5, cycle numbers 7–17), and the thin-layer dolomite was covered by the overlying mudstone to form a lithologic abrupt interface (Figure 2D). Then in SQ3 (paraSQ6–8, cycle numbers 18–33), as the sea level began to rise rapidly, the sedimentary environment changed from the thin carbonate rock and thick mudstone cycle in the lower intertidal zone (Figure 2E) to the clastic rock sedimentary cycle in the subtidal zone (Figure 3A). It shows that in the process of sea-level rise (SQ2–3) after cap dolomite deposition, sea-level rises slowly in an episodic manner, and then rises rapidly. The formation is characterized by gradual thickening of the thickness of A-type cycles in a single cycle and thickening of argillaceous strata (Figure 2D,E). The carbonate sedimentary sequence in the upper intertidal subtidal zone after cap dolomite deposition is similar to some typical sections of Huangling anticline, such as Xiangerwan section (An, 2016), Tianjiayuanzi section (Wang et al., 2001; Liu et al., 2003; Yin et al., 2007), etc.
With the continuing transgression, the sea level rises and water depth increases, the facies transit to the subtidal facies and the sea level change keeps ascending quickly and by steps (LTST) (Figure 10 (3)). In the SQ4–6, it is filled with debris flow and low-density turbidite fine sandstone of B-type cycles set in the subtidal facies (Figure 3B,C). In the Fischer diagram, the sea level first slowly recovers and rises (SQ4, paraSQ9–10, cycle numbers 34–40), and then further rapidly and significantly rises in episodic patterns SQ5–6, paraSQ1–13 and 14–16, cycle numbers 41–50, 51–64), reaching the peak, corresponding to the positive sequence of low-density turbidite cycles, covered by fine sandstone with sharp connected interfaces (Figure 3E,F). Here, the rapid rise of sea level reflected by Fischer curve reaches the peak of the whole curve, which can correspond to the fast transgressive black carbonaceous argillaceous series sequence in SS1 sequence of Doushantuo Formation (Zhu et al., 2007; Jiang et al., 2011; Yang et al., 2015).
After crossing the peak point, the sea water begin regression, and the sea level change also shows two stages that it falls steadily (EHST) and minor fluctuates (LHST) (Figure 10 (3)). In SQ7–9, C-type cycles sets are filled with fine-grained clastic deposits in the intertidal zone lagoon. In the Fischer diagram, the sea level first decreases steadily for a long time (SQ7, paraSQ17–24, cycle numbers 65–96) (Figure 4A,B), and then continues to decline steadily after a shock to reach the bottom value of the whole curve (SQ8, paraSQ25–30, cycle numbers 97–119), Finally, the sea level shows a multi episodes of stable fluctuation (SQ9, paraSQ31–34, cycle numbers 120–131). The stable decline process of sea level reflected by Fischer curve here can correspond to the HST slow regression sequence in which shallow water sedimentary units such as upward dolomite layer gradually increase in the previous SS1 sequence (Zhu et al., 2007; Jiang et al., 2011; Yang et al., 2015).
The mixed deposition of carbonate rocks and clastic rocks in the intertidal zone at the lower part of this profile (Read, 1985; Flügel, 2004) (Figure 10) forms multiple A-cycle stacking sequences. This stacking pattern shows that it is controlled by the high-frequency vibration of sea level. Combined with the above-mentioned characteristics of this part, such as sedimentary structure, lithology, pyrite particles and sedimentary colour, it belongs to low-energy water body, indicating that this part of the sedimentary period was invaded and submerged in shallow water environment for a long time. With the transgression, fine-grained materials were carried to the lower part of the cycle for accumulation, and then the sea level fell steadily and shallow water carbonate rocks were deposited. With the increase of sea level rise, the upward mudstone thickness increases. The B-type cyclic superimposed sequence of sandstones in the central subtidal zone (Flügel, 2004; Shanmugam, 2014) extends stably in the Maguangou section, and the above-mentioned sequence has incomplete Baoma sequence and sandy debris flows typical sedimentary structure (Figure 10). It shows that at this time, the sea level should rise by large-scale, rapid and high-frequency oscillation, and each large-scale transgression not only provides accommodation space, but also carries these clastic materials. The upper intertidal lagoon faces are a set of yellow-green argillaceous siltstone and mudstone mixed with fine sandstone class C cycle successions (Figure 10), and the high-frequency rhythmic mudstone, argillaceous siltstone to very fine sandstone that thickens and thins towards the upper layer is the product of the episodic fall of sea level stability. In each cycle, the lithological mutation of the upper and lower layers is not obvious, and the sedimentary water environment gradually becomes shallow, which is formed by the deposition of fine-grained clastic materials carried by tidal reflux. This obvious vertical sedimentary environment evolution and the change law reflected by Fischer plot illustrate the change process of relative sea level after ice from high-frequency slow and small amplitude to fast and large amplitude rise, and then stable decline.
The significance of sea-level change for exploration
The sea-level fluctuation and oceanic upwelling during the transgression stage played an important role in the organic matter accumulation in the Marinoan postglacial source rocks, which are wide but not ubiquitous global distribution(e.g., Xiao et al., 2021). The deglaciation release the continental weathering nutrition into the ocean and the frequent sea-level change help the disturbation of stratified water masses, leading to high primary productivity(e.g., Lang et al., 2018). So there are several of biota in the Doushantuo Formation, e.g., Weng'an biota and Lantian biota are developed in the lower layer of the Doushantuo Formation, which represent the early Doushantuo Formation with fossils such as spinosaurus, macroalgae and multicellular embryos. Macroalgae and Ediacaran type animal fossils are preserved in the black carbonaceous shale of Miaohe section at the top of the Doushantuo Formation (Xiao and Narbonne, 2020; Zhou et al., 2017, 2021). While, these Ediacaran micro- or macro- organism should be restricted to oxidized and photic faciese conditions (Narbonne et al., 1997; Xiao and Narbonne, 2020), which is undoubtedly related to the relative sea-level change.
Besides the hydrocarbon Exploration & Exploitation of the Ediacaran and Cambrian system in west Hubei, South China (e.g., Wang et al., 2019; Zhai et al., 2020), the black shale or silty claystones of the late Neoproterozoic strata in Pakistan/India, Oman, Siberia, Australia had also explored oil or gas production (the references in Xiao et al., 2021). Affected by the late stage of the Rodinia supercontinent breakup, the middle and upper Yangtze areas were in extensional to stable tectonic environment during the late Neoproterozoic postglacial period (Li et al., 2008; Zhao et al., 2018; Li et al., 2019;Wang et al., 2019; Yang et al., 2020). Based on the sea-level fluctuation, the evolution of carbonate platform controlled the tectonic-sedimentary differentiation and lead to the wide distribution and great exploration potential platform margin and intra-platform across the whole Yangtze craton (e.g., Wang et al., 2019; Yang et al., 2020; Zhou et al., 2020). The recent researches on the lithofaices paleogeographic pattern reveal that the very high-quality source rocks are found mainly in platform margin slope, restricted-semirestricted platform shelf, which is well developed in south Shaanxi, northeast Sichuan, west Hubei and Hunan-Guizhou-Chongqing area (Yang et al., 2020; Zhou et al., 2020). A thick set of carbonaceous/siliceous shale successions are developed in the Lantian formation (equivalent to Doushantuo Formation) in the Lower Yangtze craton (Zhejiang-Anhui province), which is worthy of attention for the source rock.
Conclusion
The lower part of Doushantuo Formation (members I and II) at the Mafanggou section in the middle of Shennongjia area is characterized by grey thin-layer dolomite and grey-green mudstone, dark grey thick-layer sandstone, and yellow-green thin-layer siltstone and mudstone. In ascending order, sedimentary sequences developed from the intertidal facies to the subtidal facies and back to the intertidal-lagoon facies.
Based on the detailed observation and measurement from outcrops, we identified 131 fifth-order cycles at Mahuanggou section, then we visualize the Fischer plot. According to the law of the relative sea-level waxing and waning curve, and combined with data denoised processing and published age data, we summarized 34 fourth-order level cycles and 9 third-order cycles.
The chemical proxies and Fischer plot reveal that the characteristics of relative sea-level change in the early depositional stage of Doushantuo Formation: (1) the relative sea level first fell slowly (SQ1); (2) the relative sea level began to rise slowly in a ladder, but the change range was small (SQ2); (3) the relative sea level began to rise rapidly and sharply, and then fell slowly (SQ3); (4) the relative sea level was relatively stable and slowly rising (SQ4); (5–6) the relative sea level first continued to rise, After reaching the peak value of the rising phase, it began to fall (SQ5–6); (7) the relative sea level fell rapidly and steadily (SQ7); (8) the relative sea level fell again after a short period of stagnation and slight rise, and fell to the lowest value (SQ8); (9) the relative sea level tended to fluctuate and stabilize (SQ9).
The vertical evolution of sedimentary facies and the consistent change of Fischer plot neatly confirmed each other, which help us propose a two-stage variation of ice melting-forced sea-level change, i.e., (1) early high-frequency and slow to rapid stepwise rising, and (2) followed by stable decreasing in the latter. This paper is beneficial to the study of sea-level change and paleographic reconstruction in the afterpath of Marinoan glaciation.
Supplemental Material
sj-docx-2-eea-10.1177_01445987221149221 - Supplemental material for The high-frequency sea-level change in the aftermath of the Marinoan snowball Earth: Evidence from the Doushantuo formation in the northern margin of the Yangtze Craton, South China
Supplemental material, sj-docx-2-eea-10.1177_01445987221149221 for The high-frequency sea-level change in the aftermath of the Marinoan snowball Earth: Evidence from the Doushantuo formation in the northern margin of the Yangtze Craton, South China by Kening Qi, Hongwei Kuang, Yongqing Liu, Nan Peng, Yuchong Wang, Xiaoshuai Chen, Mingming Cui, Dawei Qiao, Shuangying Li, Tianhu Chen, Zhixian Wang, Quan Zhong and Jinxin Chen in Energy Exploration & Exploitation
Supplemental Material
sj-xls-3-eea-10.1177_01445987221149221 - Supplemental material for The high-frequency sea-level change in the aftermath of the Marinoan snowball Earth: Evidence from the Doushantuo formation in the northern margin of the Yangtze Craton, South China
Supplemental material, sj-xls-3-eea-10.1177_01445987221149221 for The high-frequency sea-level change in the aftermath of the Marinoan snowball Earth: Evidence from the Doushantuo formation in the northern margin of the Yangtze Craton, South China by Kening Qi, Hongwei Kuang, Yongqing Liu, Nan Peng, Yuchong Wang, Xiaoshuai Chen, Mingming Cui, Dawei Qiao, Shuangying Li, Tianhu Chen, Zhixian Wang, Quan Zhong and Jinxin Chen in Energy Exploration & Exploitation
Supplemental Material
sj-xls-4-eea-10.1177_01445987221149221 - Supplemental material for The high-frequency sea-level change in the aftermath of the Marinoan snowball Earth: Evidence from the Doushantuo formation in the northern margin of the Yangtze Craton, South China
Supplemental material, sj-xls-4-eea-10.1177_01445987221149221 for The high-frequency sea-level change in the aftermath of the Marinoan snowball Earth: Evidence from the Doushantuo formation in the northern margin of the Yangtze Craton, South China by Kening Qi, Hongwei Kuang, Yongqing Liu, Nan Peng, Yuchong Wang, Xiaoshuai Chen, Mingming Cui, Dawei Qiao, Shuangying Li, Tianhu Chen, Zhixian Wang, Quan Zhong and Jinxin Chen in Energy Exploration & Exploitation
Supplemental Material
sj-xls-5-eea-10.1177_01445987221149221 - Supplemental material for The high-frequency sea-level change in the aftermath of the Marinoan snowball Earth: Evidence from the Doushantuo formation in the northern margin of the Yangtze Craton, South China
Supplemental material, sj-xls-5-eea-10.1177_01445987221149221 for The high-frequency sea-level change in the aftermath of the Marinoan snowball Earth: Evidence from the Doushantuo formation in the northern margin of the Yangtze Craton, South China by Kening Qi, Hongwei Kuang, Yongqing Liu, Nan Peng, Yuchong Wang, Xiaoshuai Chen, Mingming Cui, Dawei Qiao, Shuangying Li, Tianhu Chen, Zhixian Wang, Quan Zhong and Jinxin Chen in Energy Exploration & Exploitation
Footnotes
Acknowledgements
Thanks to professor Yi Haisheng (Chengdu University of Technology) and his team for helping to the statistical analysis for the Fischer plot. The authors owe gratitude to the reviewers and editors for their helpful comments and suggestions. This study was financially supported by the National Natural Science Foundation of China (42072135), the Peking International Innovation and Resource Cooperation Program (Z201100008320007), and the China Geological Survey Program (DD20221649).
Declaration of conflicting interests
The author(s) declared no potential conflicts of interest with respect to the research, authorship, and/or publication of this article.
Funding
The author(s) disclosed receipt of the following financial support for the research, authorship, and/or publication of this article: This work was supported by the China Geological Survey Program, National Natural Science Foundation of China, Peking International Innovation and Resource Cooperation Program, (grant numbers DD20221649, 42072135, Z201100008320007).
Supplemental material
Supplemental material for this article is available online.
References
Supplementary Material
Please find the following supplemental material available below.
For Open Access articles published under a Creative Commons License, all supplemental material carries the same license as the article it is associated with.
For non-Open Access articles published, all supplemental material carries a non-exclusive license, and permission requests for re-use of supplemental material or any part of supplemental material shall be sent directly to the copyright owner as specified in the copyright notice associated with the article.