
Abstract
Electrolytic hydrogen storage technology of renewable energy is considered as one of the important measures to realize the high proportion of renewable energy. However, developing this technology has been slow due to the cost. This study proposes highlighting the environmental advantages of renewable power combined with a carbon tax at the national level to expand the application space of hydrogen storage technology. First, the economy and technical characteristics of hydrogen storage technology and conventional energy-storage technology were compared. Then, Japan's top 10 power companies, which account for 90% of the power supply, were taken as the research objects. The proportion of change in renewable power after introducing a carbon tax was studied, taking the weighted minimum of the feed-in tariffs as the optimization objective. The contribution of hydrogen storage technology to the change in renewable power share was analyzed. Next, a sensitivity analysis was conducted on the fossil energy price and cost of renewable power equipment that affects the research. Finally, the contribution of a carbon tax and hydrogen storage technology to Japan's emission reduction target was calculated and analyzed. The results showed that the characteristics of long-distance transportation of hydrogen energy and making renewable energy have economic advantages under the current carbon tax (5–6 JPY/kg-CO2). The cost of liquified natural gas (LNG) and the investment of photovoltaic (PV) have a significant impact on the weighted minimum feed-in price, which can make the development of hydrogen storage technology no longer rely on the setting of carbon tax. The results obtained in this study provide a theoretical reference for the application of hydrogen storage technology in the high proportion of renewable energy consumption. At the same time, it can also provide data reference for large-scale construction of renewable energy in regions where solar and wind energy resources are not excellent.
Keywords
Introduction
Significance of the development of hydrogen energy technology
An important source of pollution is the production, transport, and use of energy (Davis et al., 2018). Currently, the energy trading and production supporting society remain largely dependent on fossil-fuel energy (Zhang et al., 2017). Fossil-fuel energy consumption has caused many environmental problems and substantial environmental governance costs (Liu and Lin, 2019). The globally recognized solution is to promote renewable energy vigorously. Compared with hydropower generation, wind and solar power with a more flexible layout is expected to become the dominant energy system (Sinsel et al., 2020; Wang et al., 2019). Most countries worldwide have implemented laws to support the development and use of renewable energy (Carley et al., 2018; Robert et al., 2018). For example, in the photovoltaic (PV) (Jewell et al., 2018) and wind (Wiser et al., 2016) industries, high investment ensures their rapid development (Best and Burke, 2018).
However, after a long development time, the proportion of renewable energy in the energy system has become bottlenecked, making further breakthroughs challenging. This problem is primarily due to the power generation timing and volatility of renewable energy (Chang and Wang, 2017). For example, solar energy can only be used when solar irradiance is high, and wind energy depends entirely on changeable outdoor wind speeds. Such uncertain generation output strongly influences the power grid system and greatly increases the dispatching pressure of the power system (Sandano et al., 2017). In addition to planning and design based on uncertainty and output prediction based on various methods (Drechsler et al., 2017), energy-storage technology can also alleviate this situation well (Zhao et al., 2020). However, the unit capacity, floor area, and storage time of energy-storage limit the development of this technology (Dehghani-Sanij et al., 2019). Hydrogen energy has the qualities of controllable storage time, long-distance transportation, and low pollution and is considered the most promising energy-storage technology for the future. Table 1 compares common energy-storage and hydrogen energy-storage technologies.
Comparison of storage for hydrogen energy and common energy [16] (Zakeri and Syri, 2015; Tong et al., 2020).
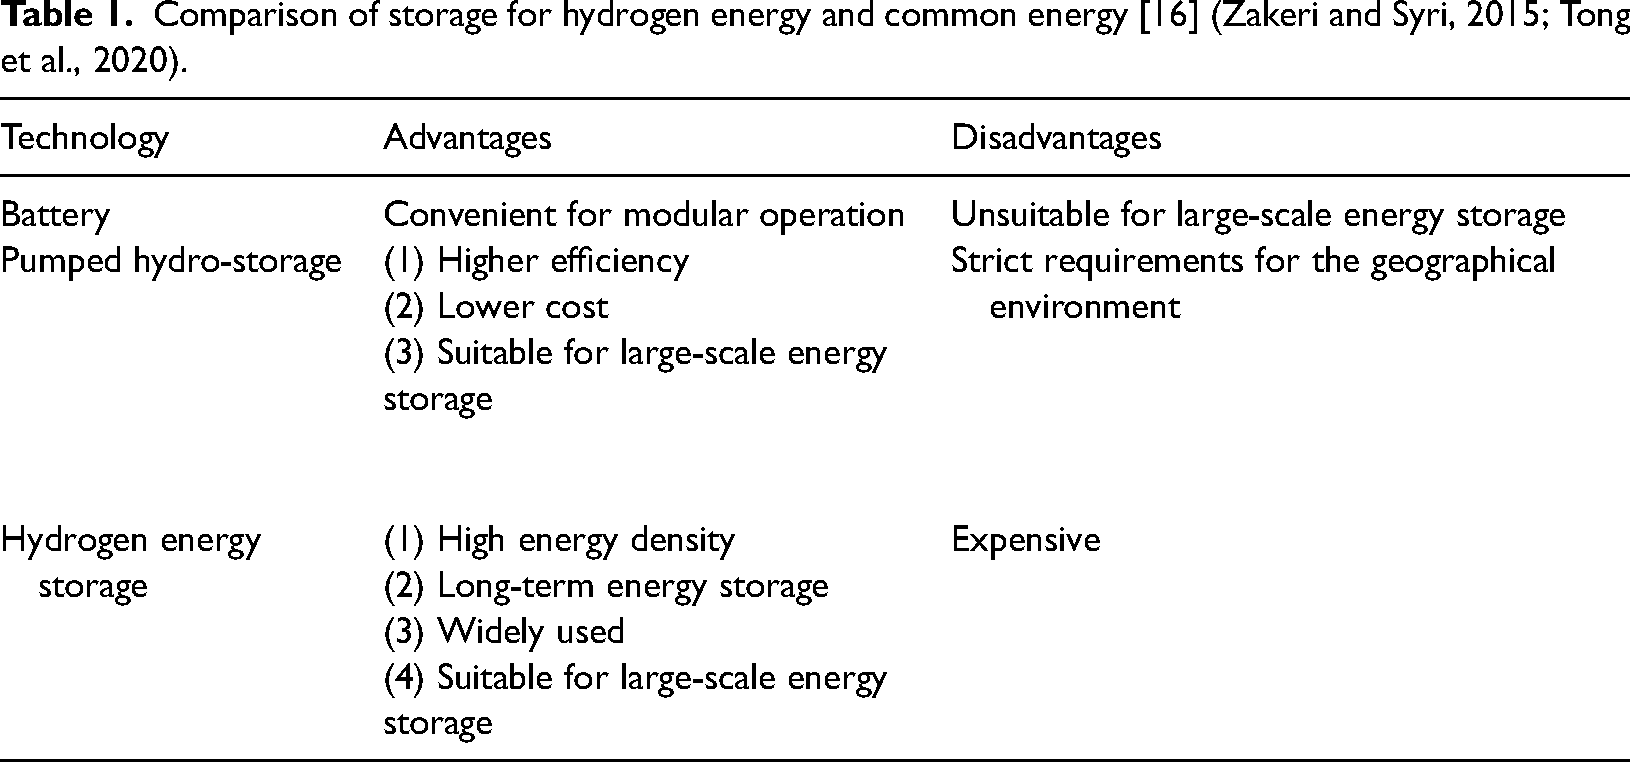
As presented in Table 1, despite the high cost, hydrogen energy has obvious advantages in other aspects. Hydrogen energy costs greatly reduce with large-scale production. In addition to promoting renewable energy (Glenk and Reichelstein, 2019), hydrogen energy is widely used in many fields, such as electric power, industry, and transport. However, hydrogen energy applications are currently in the initial stages due to the high price and slow development of a foundational support system (Bela et al., 2022).
Research and applications of hydrogen energy systems
In terms of increasing the proportion of renewable energy in urban and national power systems, the main research includes the flexible output of equipment, the optimal dispatching and regulation of the power system, and the application of energy-storage technology (Dujardin et al., 2017; Østergaard, 2015). In the application of energy-storage technology, scarce research on hydrogen storage technology (Wang et al., 2018) has been conducted, most of which assesses pumped storage technology combined with hydropower (Javed et al., 2020).
Reference Xu et al. (2022) analyzed the acceptance capacity of PV and wind power generation in four regions of Japan and explained that if the application of energy-storage technology is not conducted, the maximum import rate of renewable energy would be 25% to 60% due to the influence of the objective environment and energy consumption characteristics of the studied regions. Although some regions still hope to achieve a high renewable-energy import rate, achieving 100% renewable energy use is challenging without employing energy-storage technology. For example, Li et al. (2019) studied the Kyushu region of Japan concerning the effect of hydrogen storage technology on improving the utilization rate of renewable energy and found that large-scale electrolytic hydrogen production improves this rate by 15%.
In terms of what may occur in the future concerning the hydrogen-production potential of renewable energy, analyses in Venezuela, Algeria, South Africa, Ecuador, and Pakistan (Posso and Zambrano, 2014; Rahmouni et al., 2017; Abdalla et al., 2018; Posso et al., 2016; Gondal et al., 2018) indicate that hydrogen production from renewable energy is a good answer to the current energy problem. However, low-efficiency hydrogen production and high investment into business result in no advantage in price (Abdalla et al., 2018). Most research has focused on how to produce hydrogen energy from renewable energy more efficiently (Mraoui et al., 2018). Among them, electrolytic hydrogen production is currently the most stable (Rahim et al., 2016). Bailera and Lisbona (2018) assessed the application potential of electrolytic hydrogen production in Spain and obtained the corresponding renewable power surplus of 1.4 to 13.5 TWh, requiring an electrolytic hydrogen production capacity of 7 to 19.5 GWh.
In the application research for electrolytic hydrogen production, some researchers have focused on operation management and equipment operation strategy (Gutierrez-Martin et al., 2015; Grube et al., 2018), and others have focused on the decarbonization effect (Suciu et al., 2018). Lisbona et al. (2018) analyzed the technical potential of renewable energy and application of electrolytic hydrogen-production technology, concluding that 80 to 90 GW is required in Spain to realize the complete decarbonization of power generation. Compared with the work by other reference (Bailera and Lisbona, 2018), the capacity of the electrolytic hydrogen-production device increased by three times. This difference is primarily due to the difference in the forecast of the renewable power surplus and power demand. Tschiggerl et al. (2018) evaluated the whole life cycle of electrolytic hydrogen-production technology and found that the most significant factor is the energy source used for hydrogen production; that is, electrolytic hydrogen-production technology depends on the front end.
Content
According to the literature review, few studies have assessed the combination of renewable power and hydrogen storage technology. Even for the targeted research on electrolytic hydrogen-production technology, conducting a horizontal comparison is challenging due to the differences in scene settings. As a result, although some studies have verified the potential of electrolytic hydrogen production, it is still impossible to quantify the economic or policy support required to promote hydrogen storage technology. Moreover, few studies have investigated the decarbonization effect of hydrogen storage technology for long-term storage and long-distance transmission. This research plan analyzes the application potential of hydrogen storage technology in the power system in combination with a carbon tax to expand the price advantage of renewable power and the application space of hydrogen storage technology.
This study aims to analyze and obtain a carbon tax price suitable for the future promotion of hydrogen storage technology, to quantify the explicit or implicit financial input required by the policy for renewable power and hydrogen storage technology. The contributions of this study are as follows. First, the economic benefits of various renewable power and energy-storage technologies under different equipment utilization rates are compared and analyzed. Second, the long-term storage and long-distance transmission characteristics of hydrogen storage technology are compared and analyzed to increase the proportion of renewable power. Third, the power and energy structure changes and corresponding carbon dioxide (CO2) emission reduction effects with a renewable-power price advantage when introducing pumped hydro-storage (PHS) and hydrogen storage technology are analyzed for Japan.
The remainder of the paper is structured as follows. The first section is the background, explaining the importance and research status of hydrogen energy and storage technology. The second section describes the methodology, explaining the mathematical model and optimization method. The third section is the basic research, which makes a preliminary analysis of renewable power, energy-storage technology, carbon tax and thermal power generation that need to be used in the follow-up research. The fourth and fifth sections are the core of the study, respectively studying the impact of carbon tax and hydrogen storage technology on the introduction of high proportion of renewable energy, and the impact of energy prices and equipment investment on the research results. The sixth section is the conclusion, summarizing the prospects of the research.
Methodology
This study is to analyze the contribution of hydrogen storage technology to the introduction of high proportion of renewable energy and CO2 emission reduction under the scenario of carbon tax. The methodology and logic of this study are shown in Figure 1 below. First, the advantages and disadvantages of hydrogen and conventional energy-storage technology were compared by analyzing the coupling of four renewable energy sources and three energy-storage technologies. Thus, the matching strategy of energy-storage technology suitable for large power systems was obtained. Then, with the introduction of carbon tax, the minimum feed-in tariffs of coal-fired and gas-fired power plants under different carbon taxes were analyzed. Then, with ten power companies in Japan as the research object, the optimal output configuration of thermal power generation, hydropower generation, PV and wind power generation was carried out with the weighted minimum feed-in tariffs as the target. According to the optimization results, the impact of the characteristics of long-distance transportation of hydrogen storage technology on the introduction of high proportion of renewable energy was analyzed. Subsequently, the sensitivity analysis of energy price and energy equipment investment was carried out to study the application potential of hydrogen storage in different future scenarios. Finally, compared with Japan's long-term CO2 emission reduction target, the effect of carbon tax and hydrogen storage technology on CO2 emission reduction was obtained.
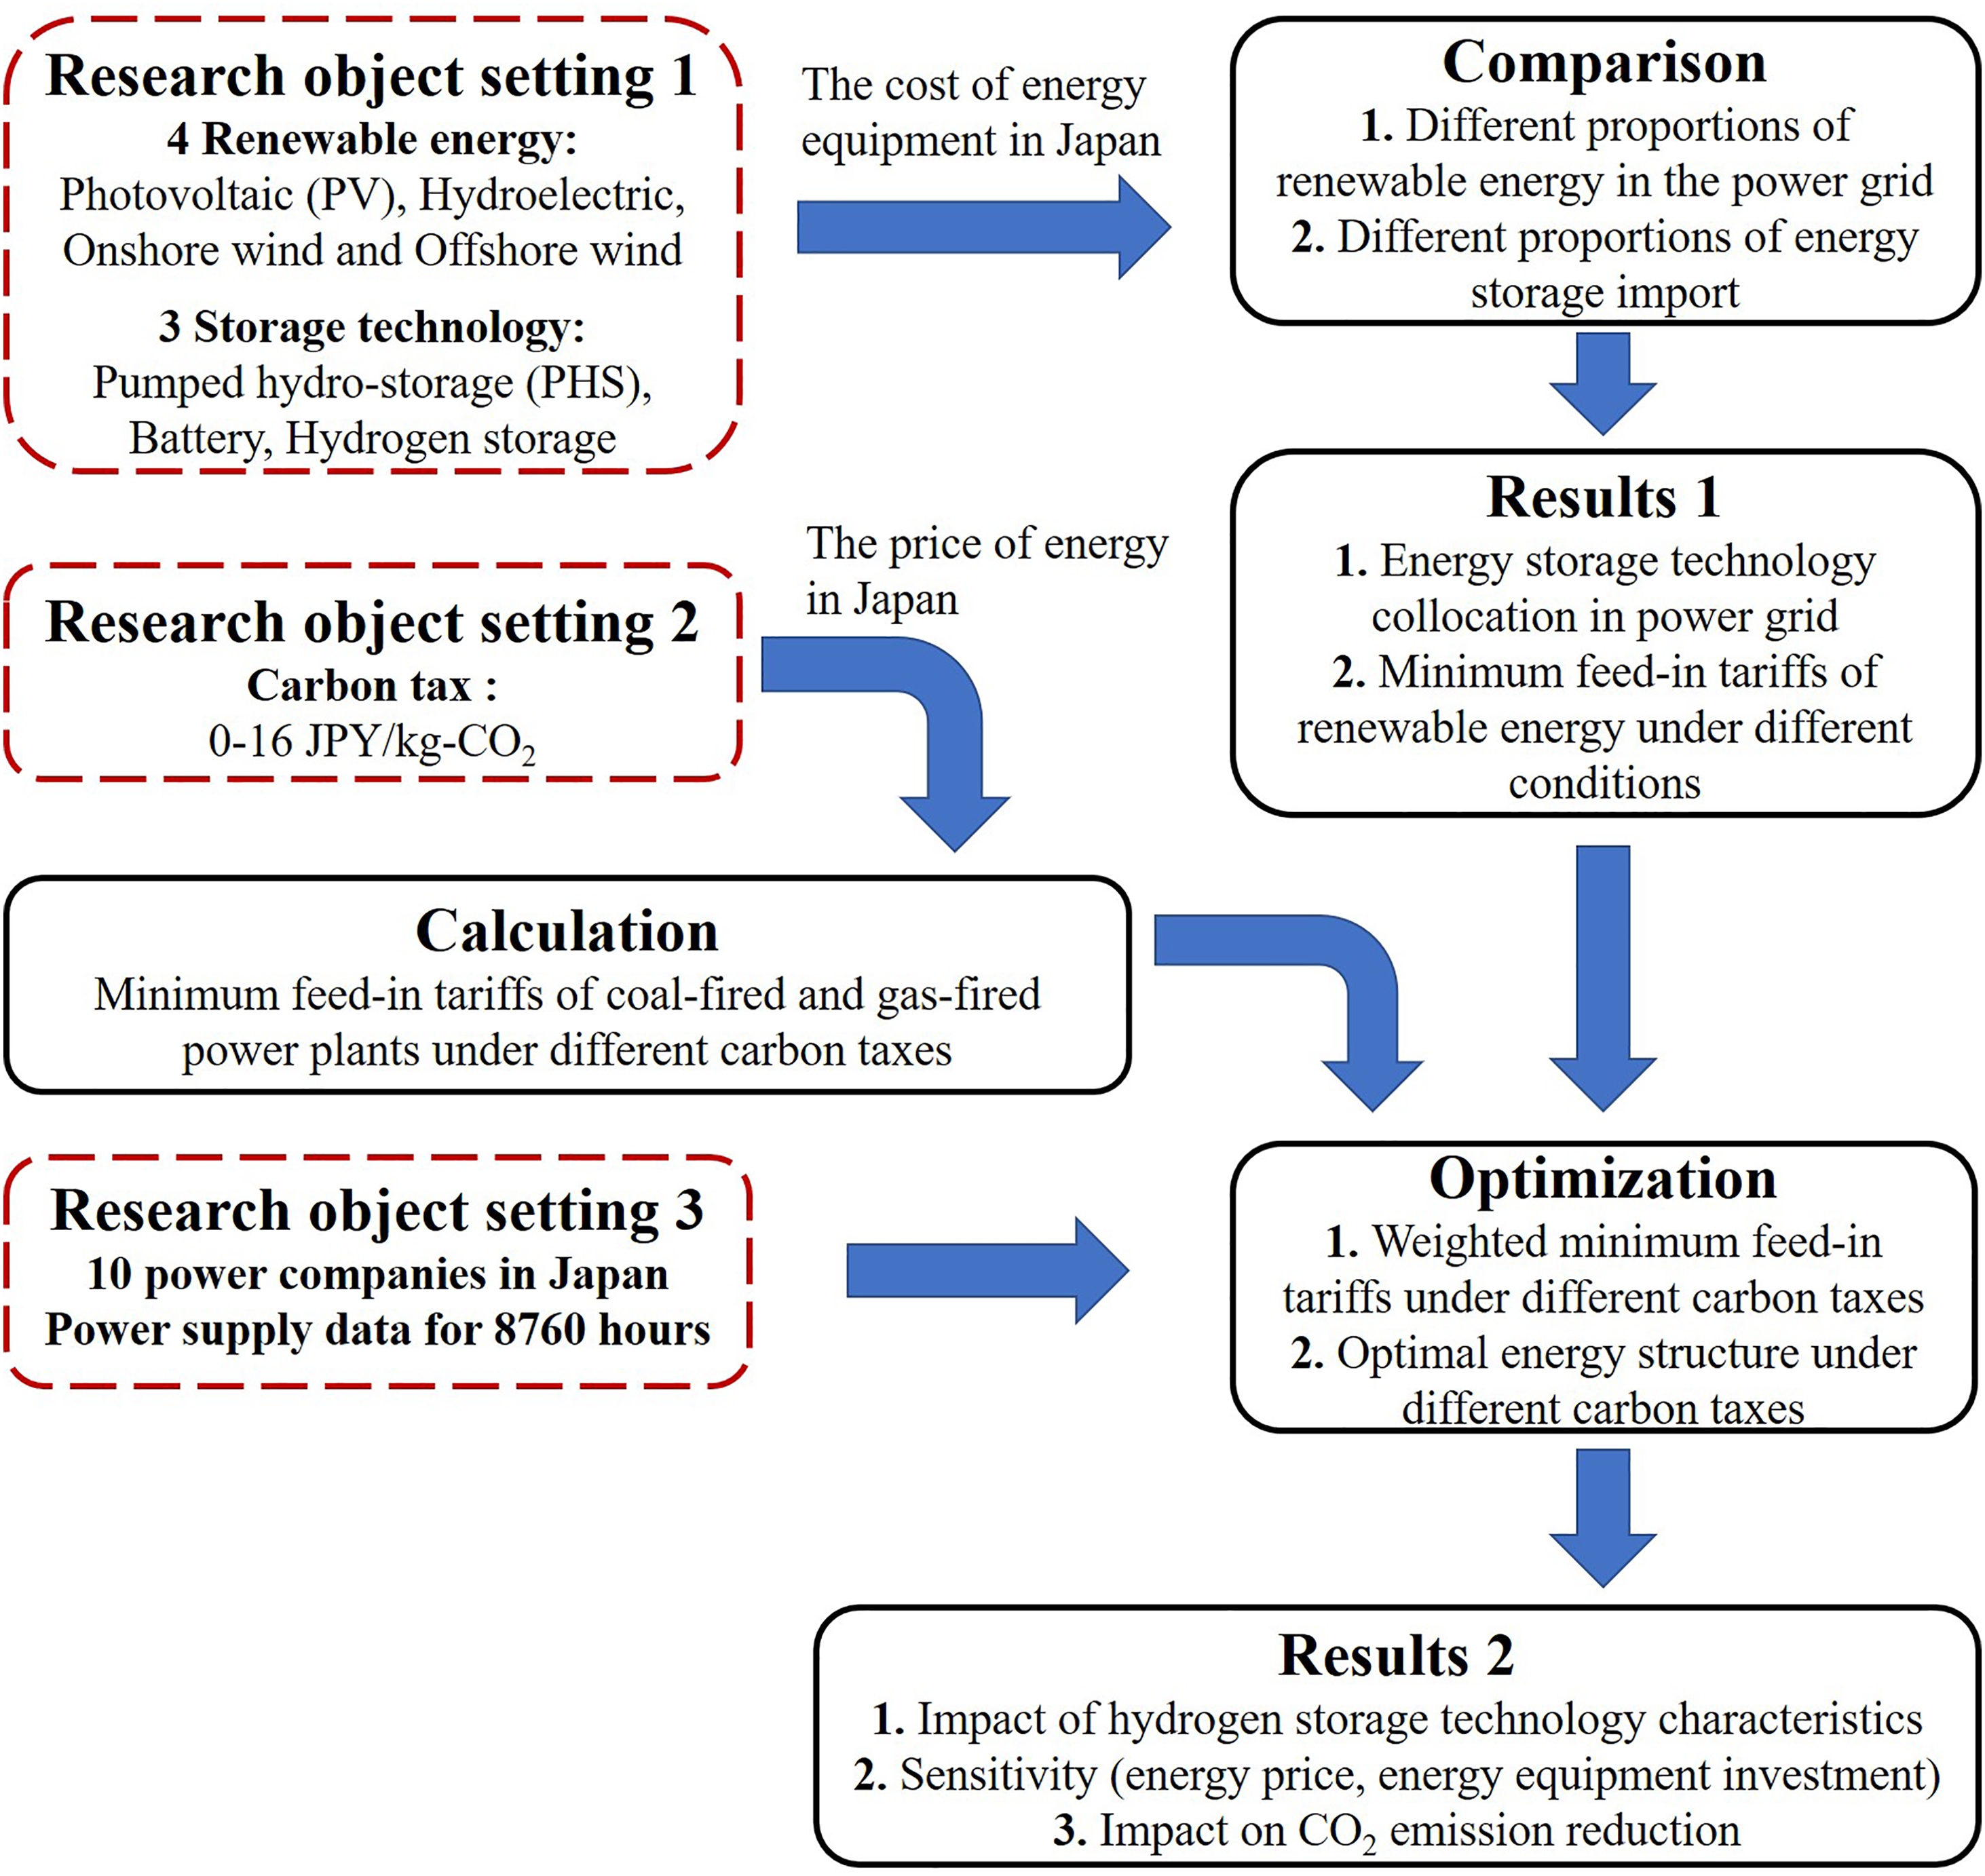
Research structure of the hydrogen energy potential analysis on the energy structure and carbon emissions.
Energy-storage ratio and minimum feed-in tariffs
The balance between supply and demand for a regional power grid system is given by (1):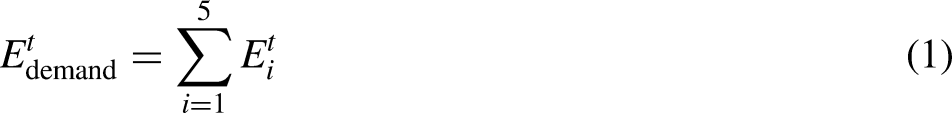
With the future increased demand for carbon emission reduction, the proportion of renewable energy will continue to increase. The new renewable-energy generation is given by (2):
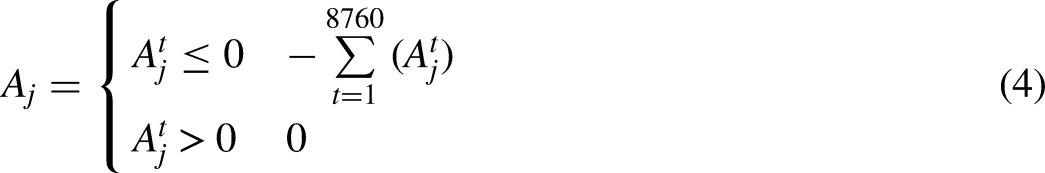
With the increased installed capacity of renewable energy, the utilization space of thermal power generation gradually compresses and eventually leads to the waste of excess power, as given by (3) and (4):
Storage of excess power is a common way to absorb renewable energy. The total investment of the system after the configuration of energy storage is given by (5):
The investment recovery balance of the entire system is given by (6):
With an increase in the proportion of different renewable energies, different energy-storage capacities are required. The objective of this optimization is to determine the required energy-storage capacity and minimum feed-in price for every fixed proportion of renewable energy, as given by (7):
Formula (8) provides the limiting condition. Because of the poor regulation of nuclear and renewable energy, the newly added renewable-energy power generation cannot exceed the scope of thermal power generation: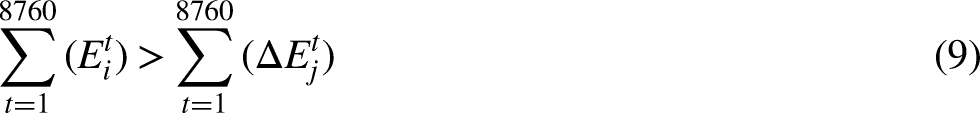
Optimization of the regional energy structure
According to the optimization results of the renewable energy and energy-storage configuration, combined with the adaptability of energy-storage technology, the supporting energy-storage mode of renewable energy in large areas can be obtained. Then, through the limitation of a carbon tax, the economy of thermal power generation and renewable power is compared. This work optimizes the regional energy structure by taking the lowest weighted feed-in tariffs as the goal.
Through the weight distribution, the thermal power plant has various levels of output reduction, primarily due to changes in policies and fossil-fuel prices and the aging and elimination of power plants. By the optimization logic in Figure 2, the power demand gap caused by the reduced output of thermal power plants is determined by the lowest feed-in tariffs of renewable energy. If the lowest feed-in price of renewable energy is lower than the feed-in price of thermal power generation, the weight quota is assigned to the corresponding renewable energy. In this process, it is also necessary to consider the excessive residual power brought by the increase of renewable energy. The use of energy-storage technology can absorb the remaining electricity, but it also needs to consider the limitations of energy-storage technology and investment recovery. Otherwise, thermal power generation will likely continue to be used. With the continuous redistribution of the weight, the increase in the proportion of renewable energy leads to increased demand for energy-storage technology and a continuous increase in the lowest feed-in price. The optimal energy structure can be determined when various factors change, such as the carbon tax, weight, fossil fuel, and equipment price.
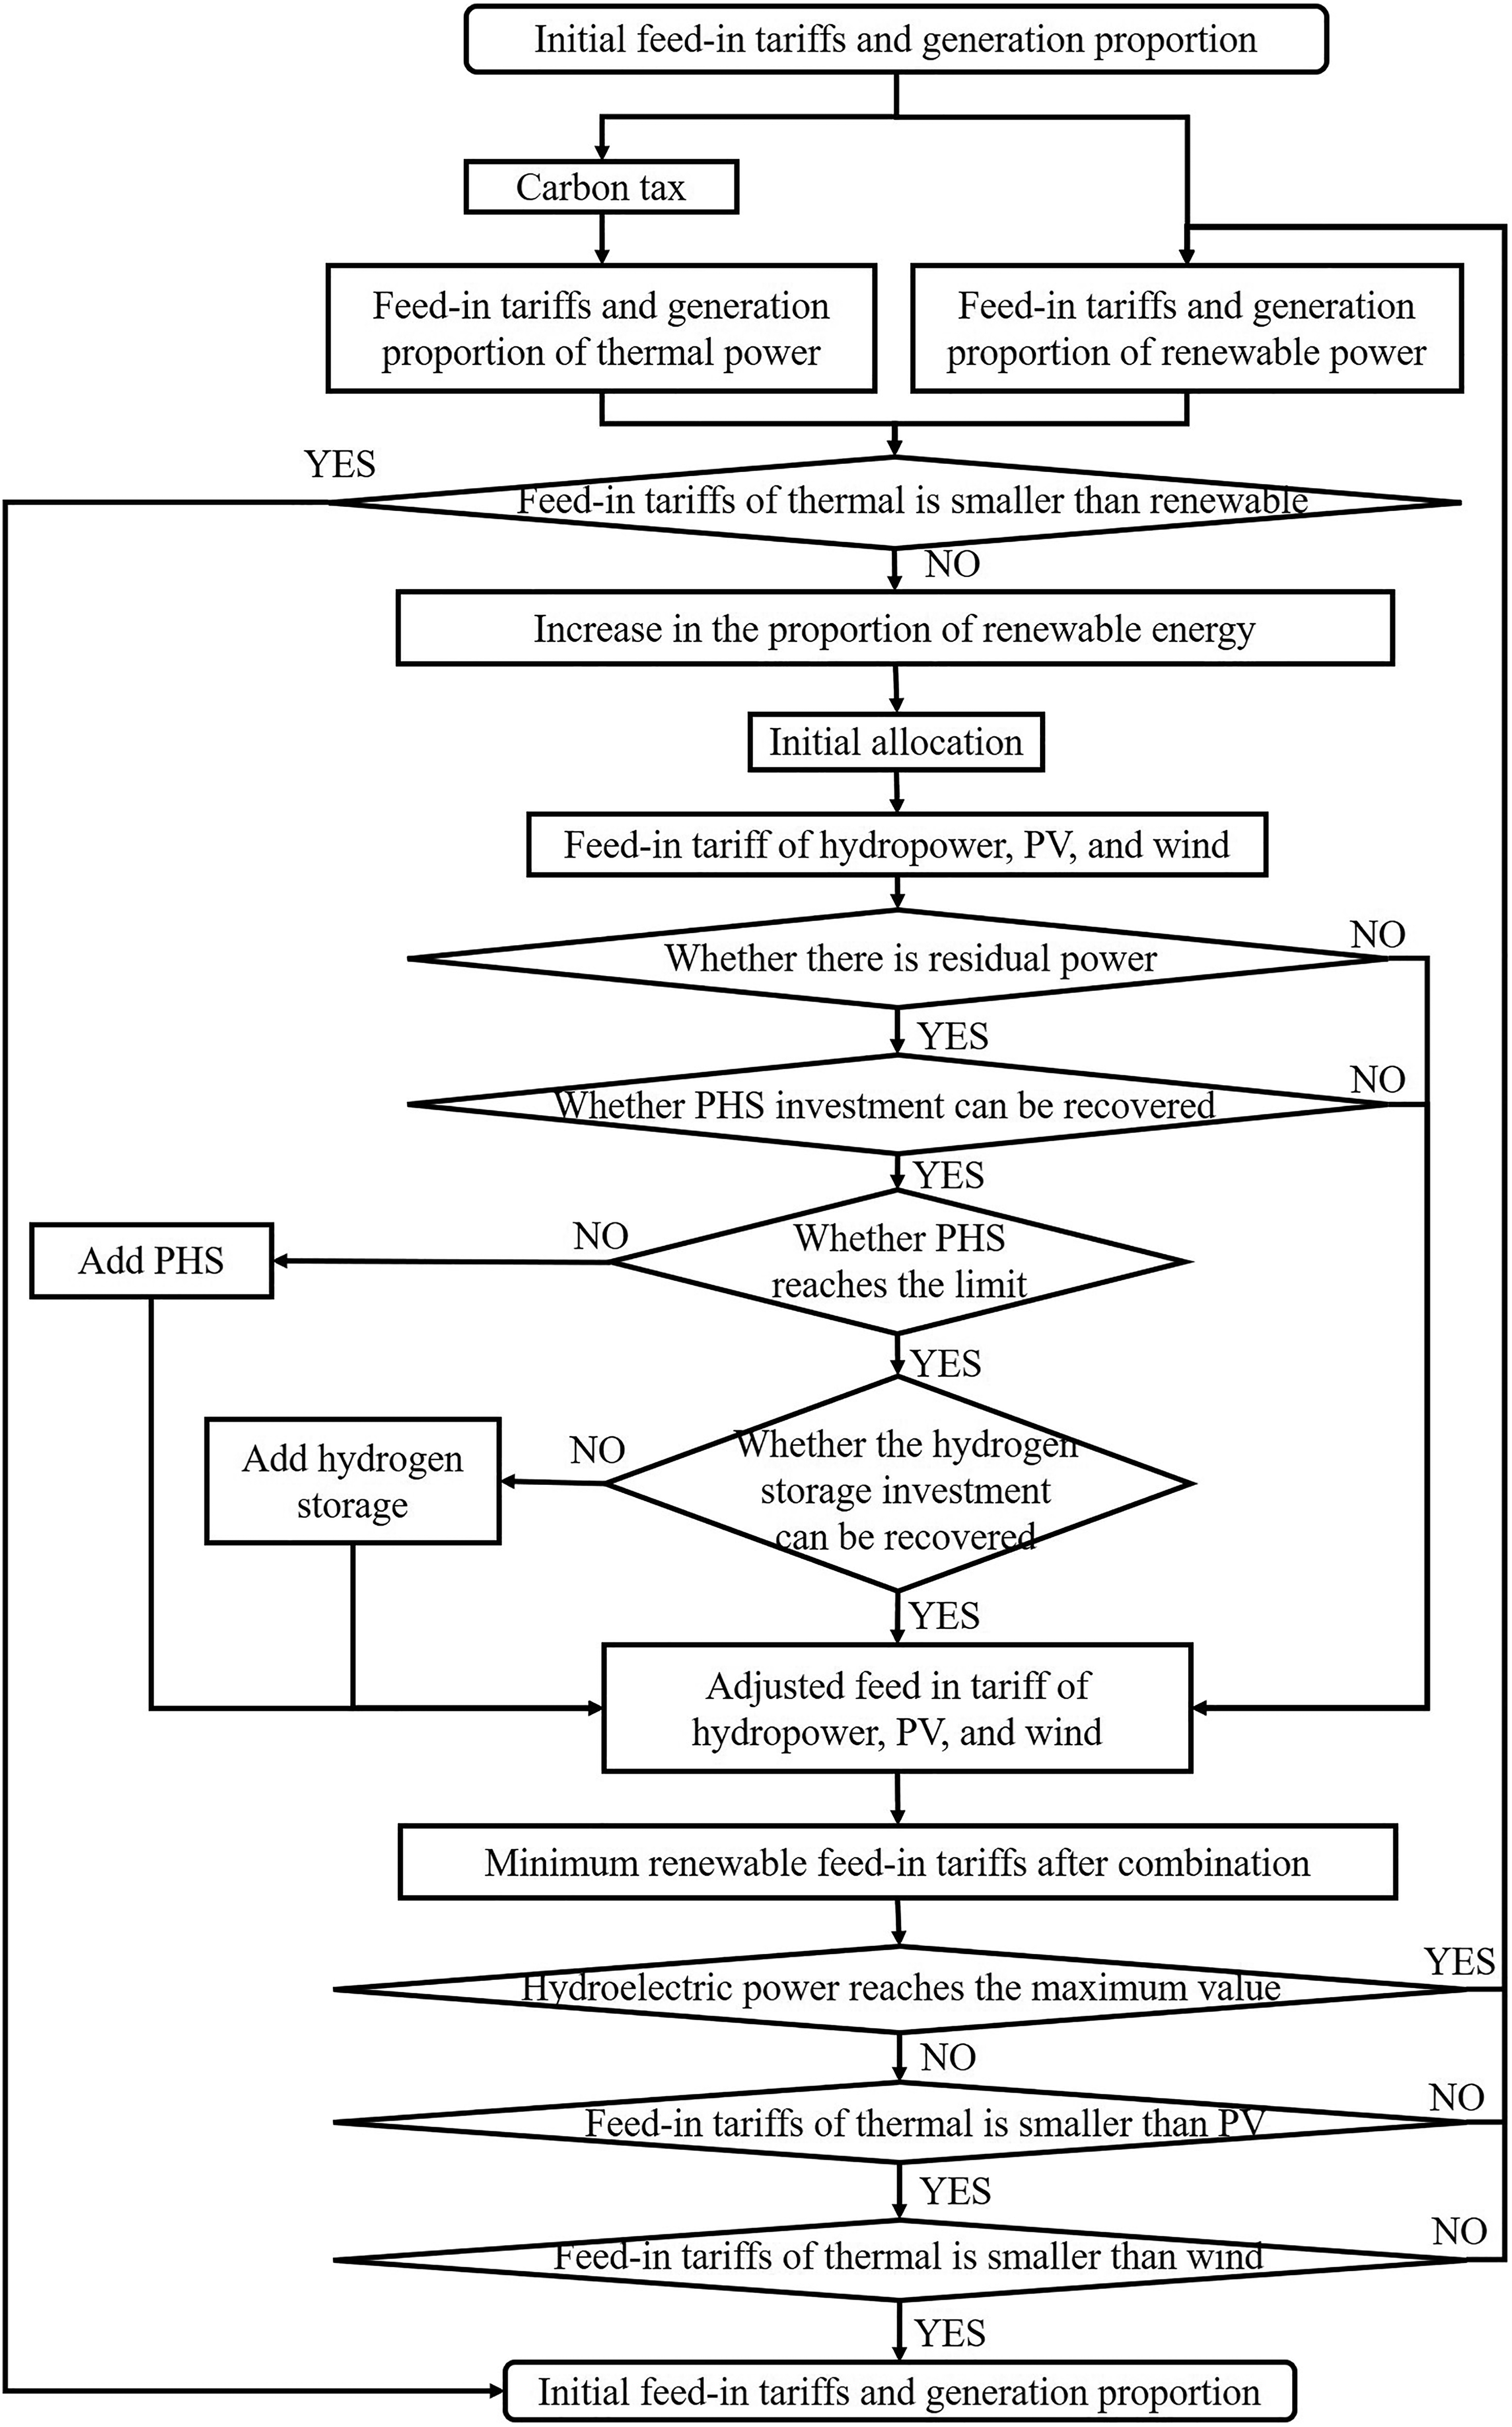
Logic diagram of energy structure optimization.
Basic research
This section is the basis of the whole study. The minimum feed-in tariffs of renewable energy under different conditions and thermal power with different carbon taxes was analyzed. The results of this section provide a basis for the following weighted minimum feed-in tariffs optimization. At the same time, the variation range of benchmark feed-in price of various energy types was provided, which was applied in sensitivity analysis.
Comparison of hydrogen storage and conventional energy-storage technology
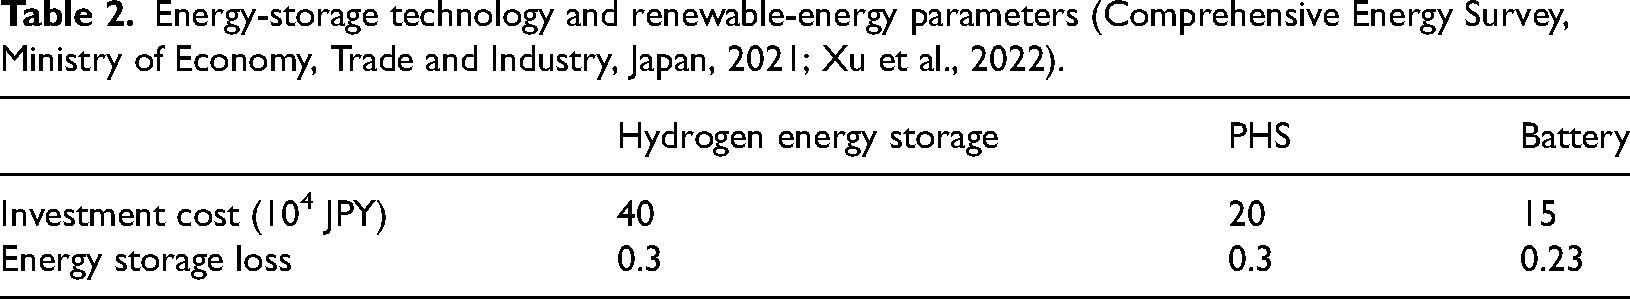
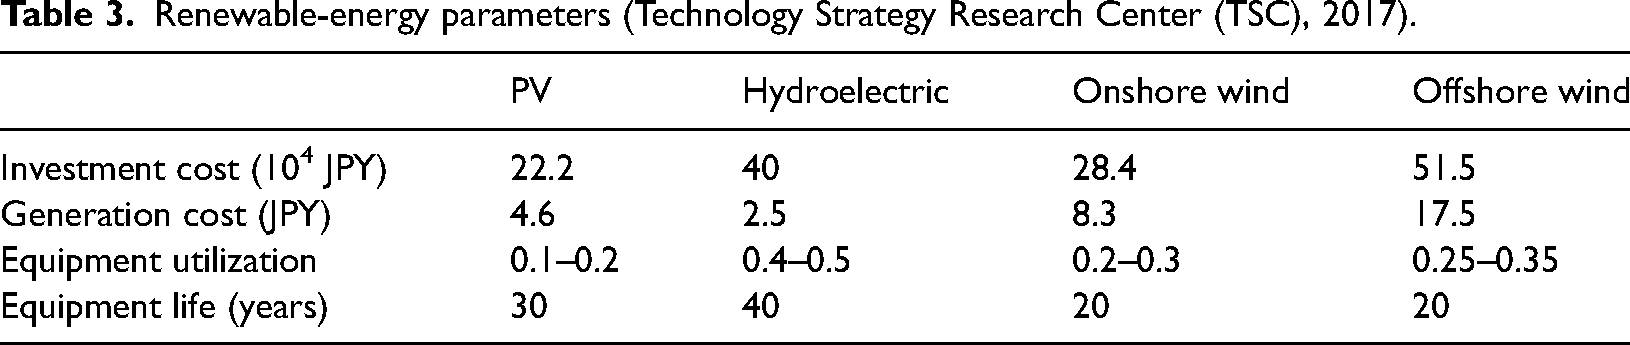
Concerning hydrogen production from renewable energy, the energy-storage technology and location are compared in terms of money for the hydrogen, PHS, and battery. The basic parameters of the energy location for storing technology and renewable energy are provided in Tables 2 and 3.
Energy-storage technology and renewable-energy parameters (Comprehensive Energy Survey, Ministry of Economy, Trade and Industry, Japan, 2021; Xu et al., 2022).
Renewable-energy parameters (Technology Strategy Research Center (TSC), 2017).
Whenever the output of renewable energy exceeds the demand, resulting in excess power, the system charges the energy-storage device and stores this excess power. This excess power is used when renewable-energy output cannot meet the demand. Figure 3 illustrates the minimum feed-in tax on goods of three types of energy-storage technologies after they are used in the example of an added amount of various renewable energies. The minimum feed-in price is formed as the feed-in price that can make the cumulative income of the entire life cycle of the power generation system and the energy-storage system reach the dynamic investment cost.
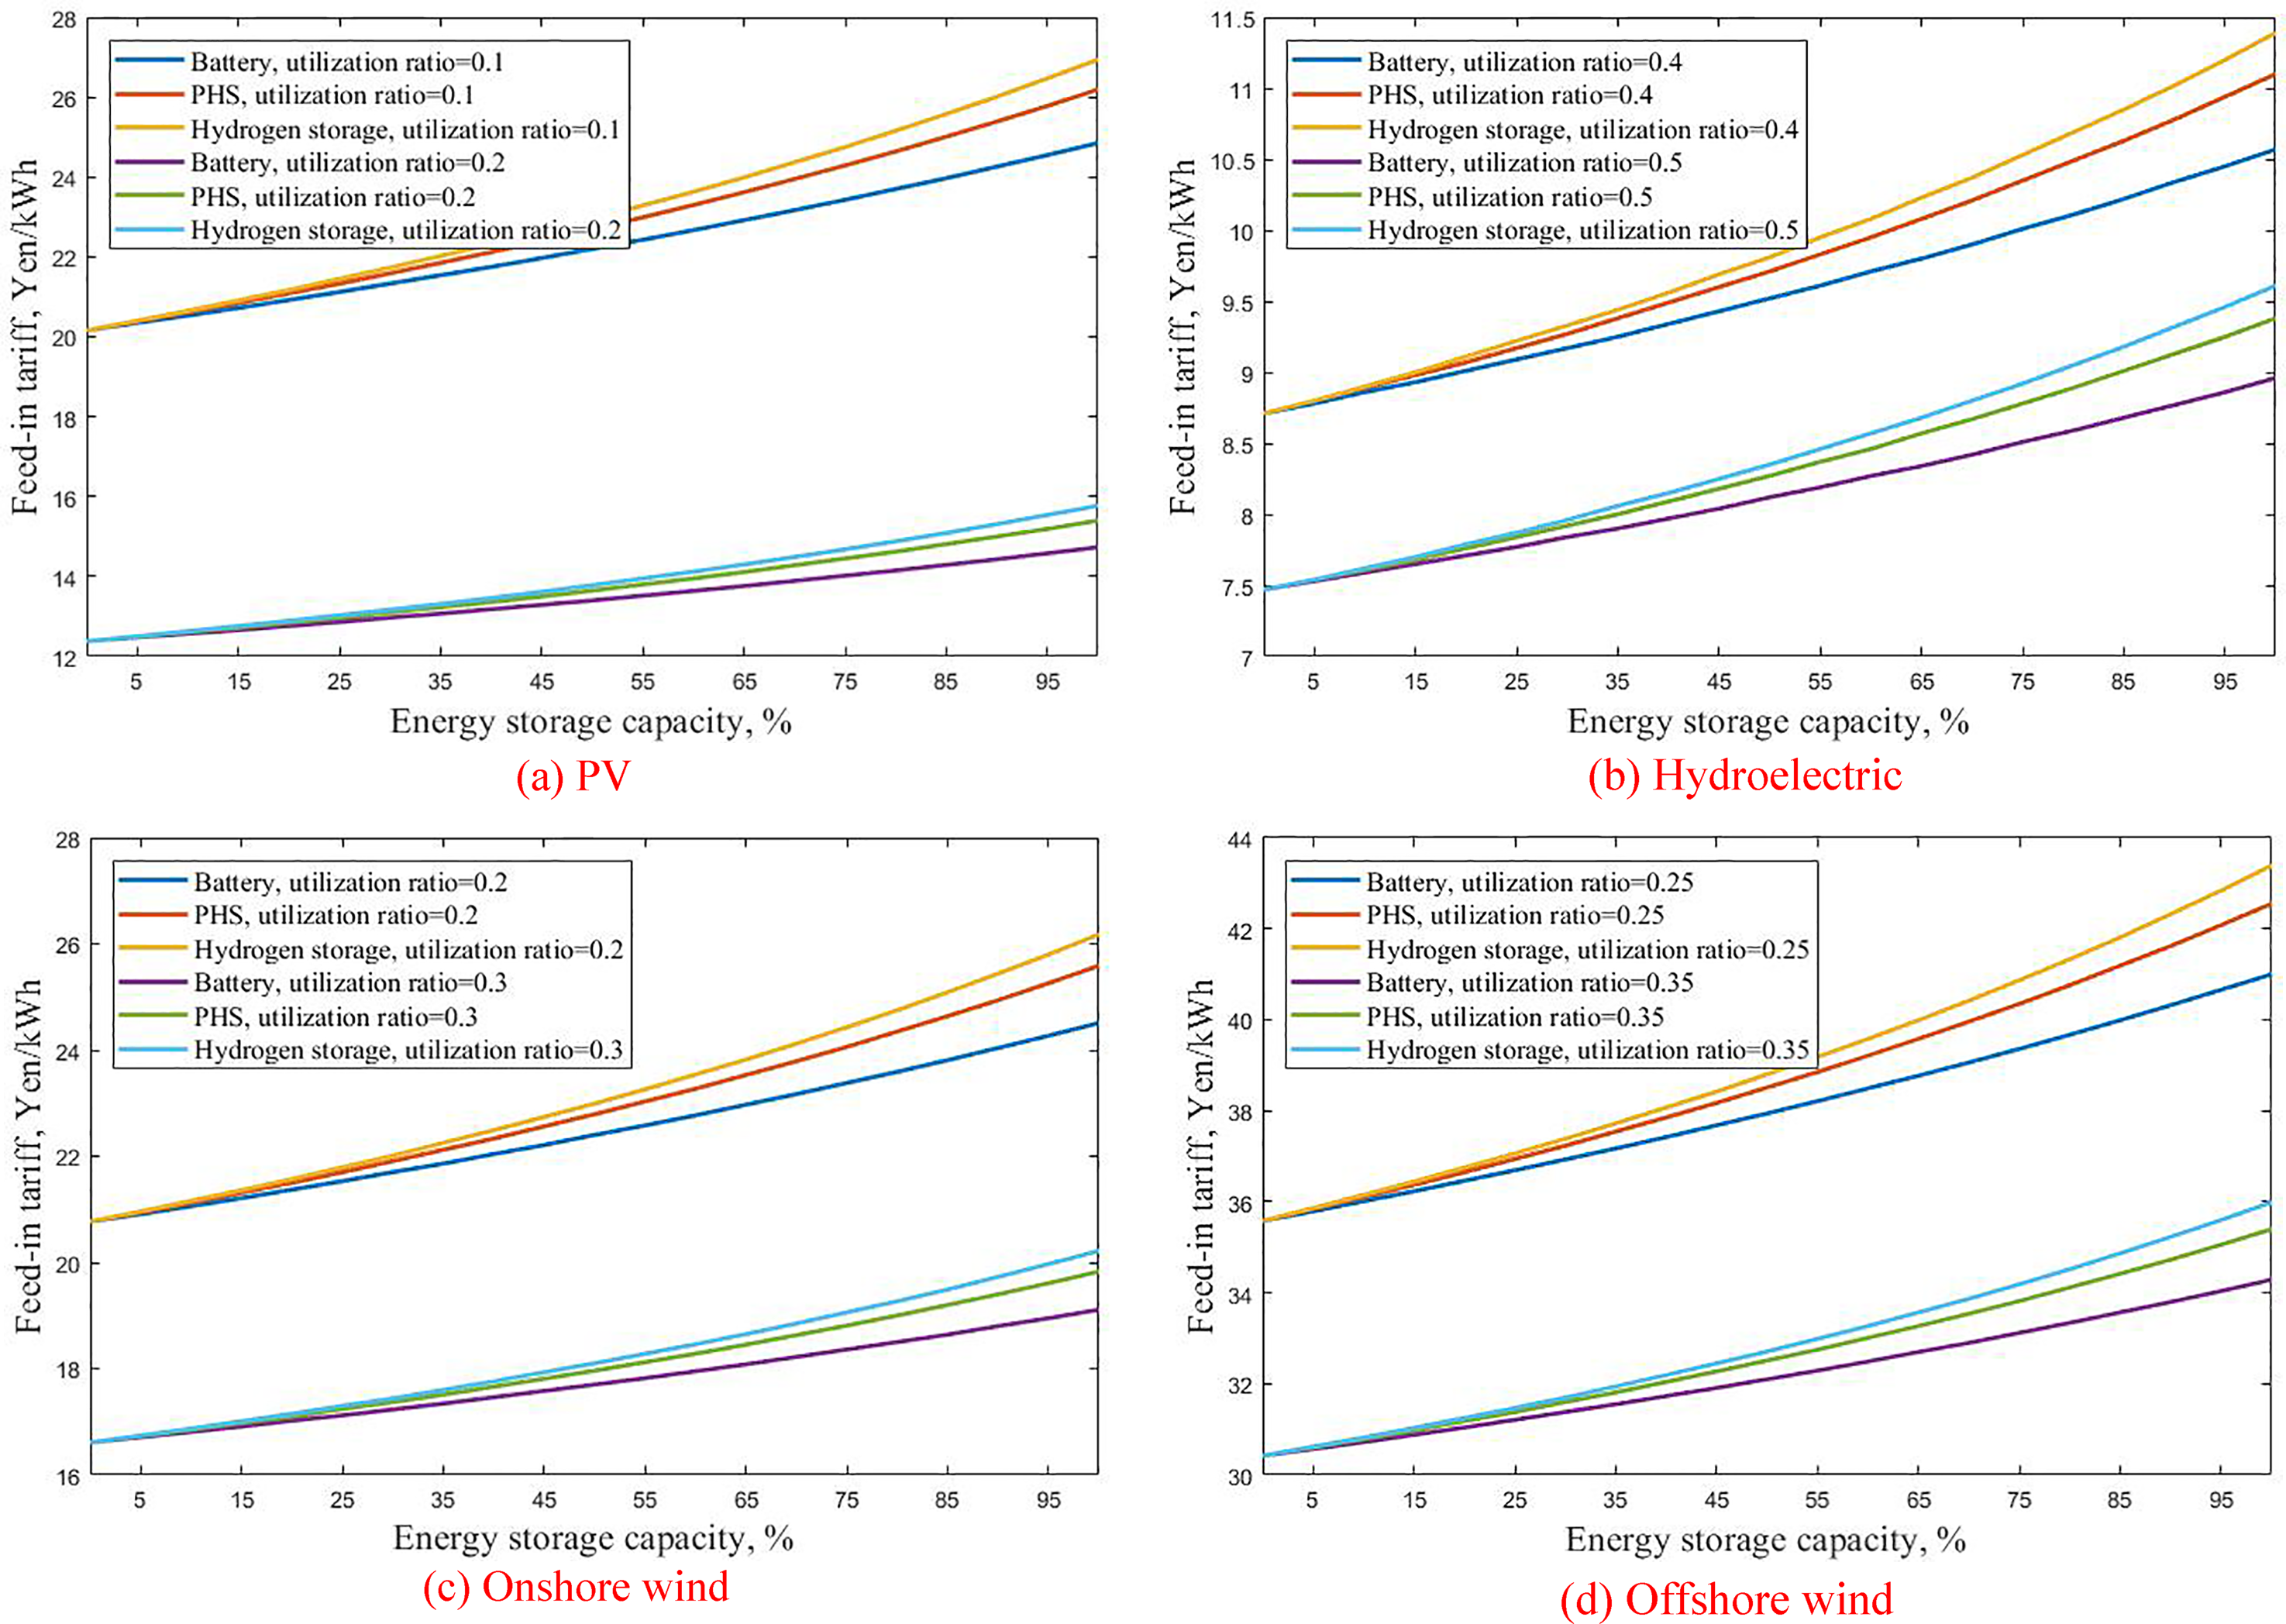
Minimum feed-in price with (a) PV, (b) hydroelectric, (c) onshore wind, and (d) offshore wind generation.
The results in Figure 3 illustrate that the economic benefits of the four renewable-energy sources are hydropower generation > onshore wind power/PV > offshore wind power. Among them, PV and onshore wind power may be affected by the effective equipment utilization rate, and there may be different orders of effectiveness. The order of the three energy-storage technologies is PHS > battery > hydrogen. However, Japan's large-scale reservoir resources have been exhausted, and only small and medium-sized reservoirs can be used for the continued development of PHS. Due to the early development of hydropower generation, this is the general situation for most countries with relatively mature power systems. The current battery technology is insufficient to support such a large-scale practical application. Therefore, although hydrogen energy is the least economical, it is still the second choice after PHS in large-scale power systems.
Economic benefit analysis of coal- and gas-fired power stations
General situation (no carbon tax)
Japan's thermal power generation is primarily through coal- and gas-fired stations. According to the survey of the Ministry of Environment and Resources of Japan, the main parameters of the two types of thermal power plants are listed in Table 4.
Investment, operation, and maintenance costs of coal- and gas-fired power plants (Natural Energy Institute, Japan, 2019).
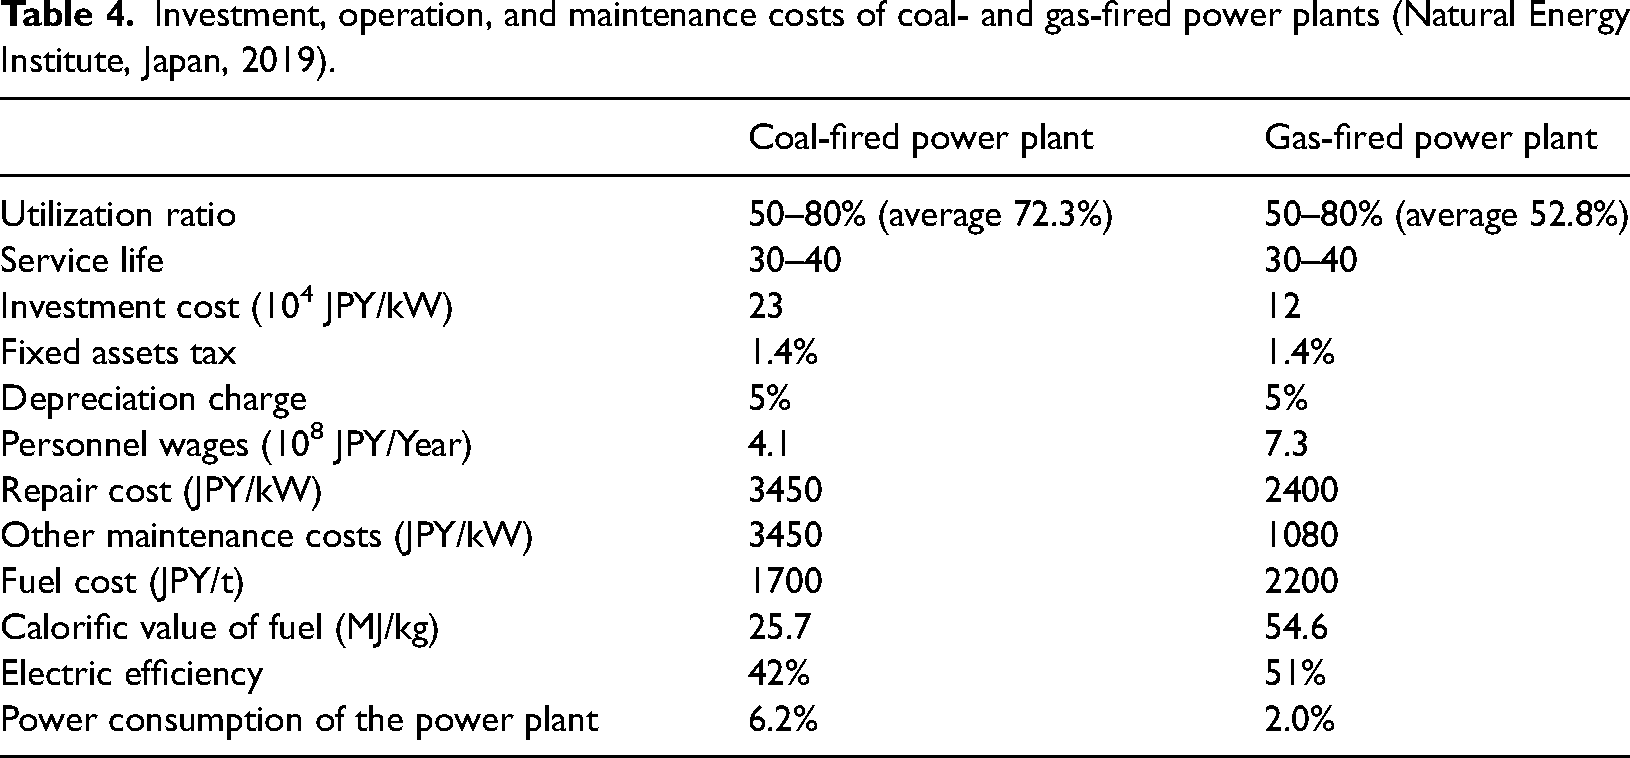
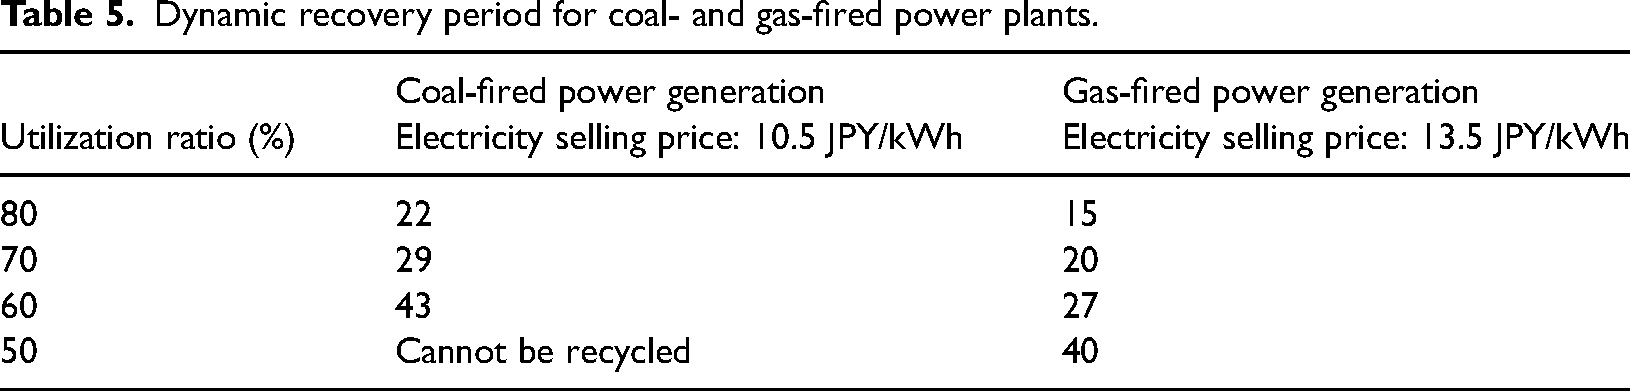
Table 5 presents the results of the dynamic recovery years obtained according to the calculation parameters in Table 4. As indicated in Table 4, the average coal and gas utilization rate is about 70% and 50%, respectively. Therefore, the respective electricity prices of 10.5 and 13.5 JPY/kWh are the lowest feed-in tariffs to ensure that coal- and gas-fired power plants can be recovered within the service life of 40 years under the average utilization rate. Although the minimum feed-in price of coal-fired power plants is lower, once the requirements for effective utilization cannot be met, the economic benefits of coal-fired power plants decline more perceptibly.
Results of with carbon tax
Dynamic recovery period for coal- and gas-fired power plants.
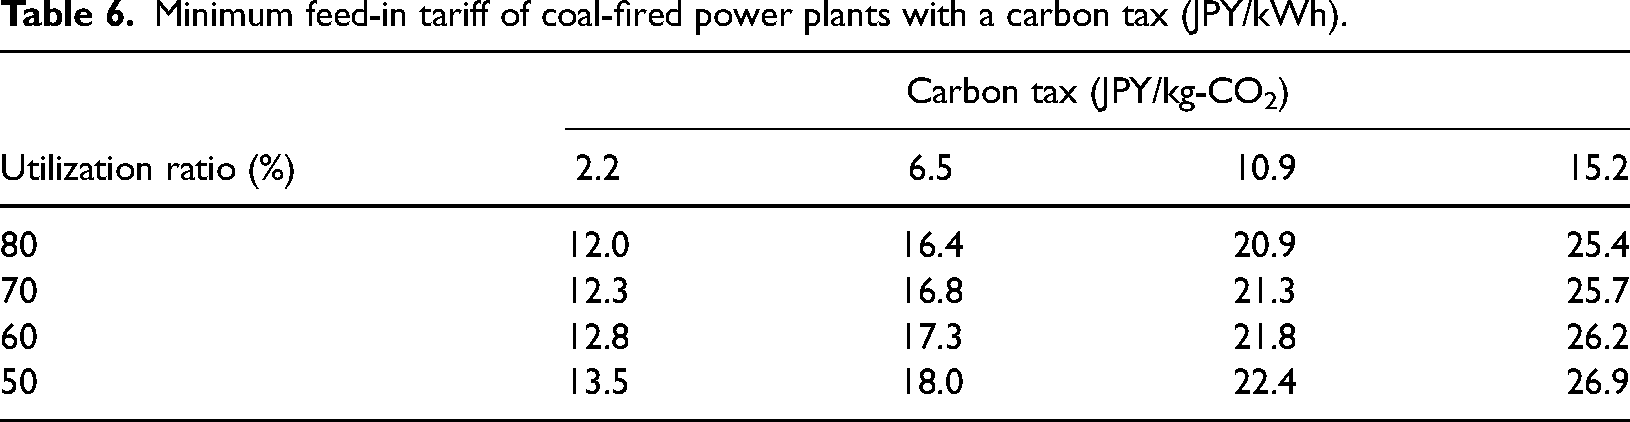
The imposition of a carbon tax leads to an increased minimum feed-in tariffs for thermal power plants. Tables 6 and 7 present the calculation results of the minimum feed-in price under different carbon taxes. Among them, 2.2 JPY/kg-CO2 is from the carbon tax demonstration project in Japan, which is the current situation. The other three carbon tax data are forecasts of carbon tax growth in the next two decades (Qian et al., 2020). The average carbon tax level of countries worldwide is about 2 to 6 JPY/kg-CO2, and the highest level in Sweden reaches 18 JPY/kg-CO2. Therefore, the carbon tax forecast data are within a reasonable range and can be realized in the future.
Minimum feed-in tariff of coal-fired power plants with a carbon tax (JPY/kWh).
Minimum feed-in tariff of gas-fired power plants with a carbon tax (JPY/kWh).

There is a price gap of approximately 3 JPY between coal- and gas-fired power plants, which increases with an increased carbon tax. In addition, with the low carbon emission of gases, the use rate has a low effect on the benefits of gas-fired power plants.
Figure 4 depicts the change in the minimum feed-in price of coal- and gas-fired power plants at the average utilization rate. The calculation results in Figure 4 are also referred to for the subsequent comparison of the minimum feed-in price.
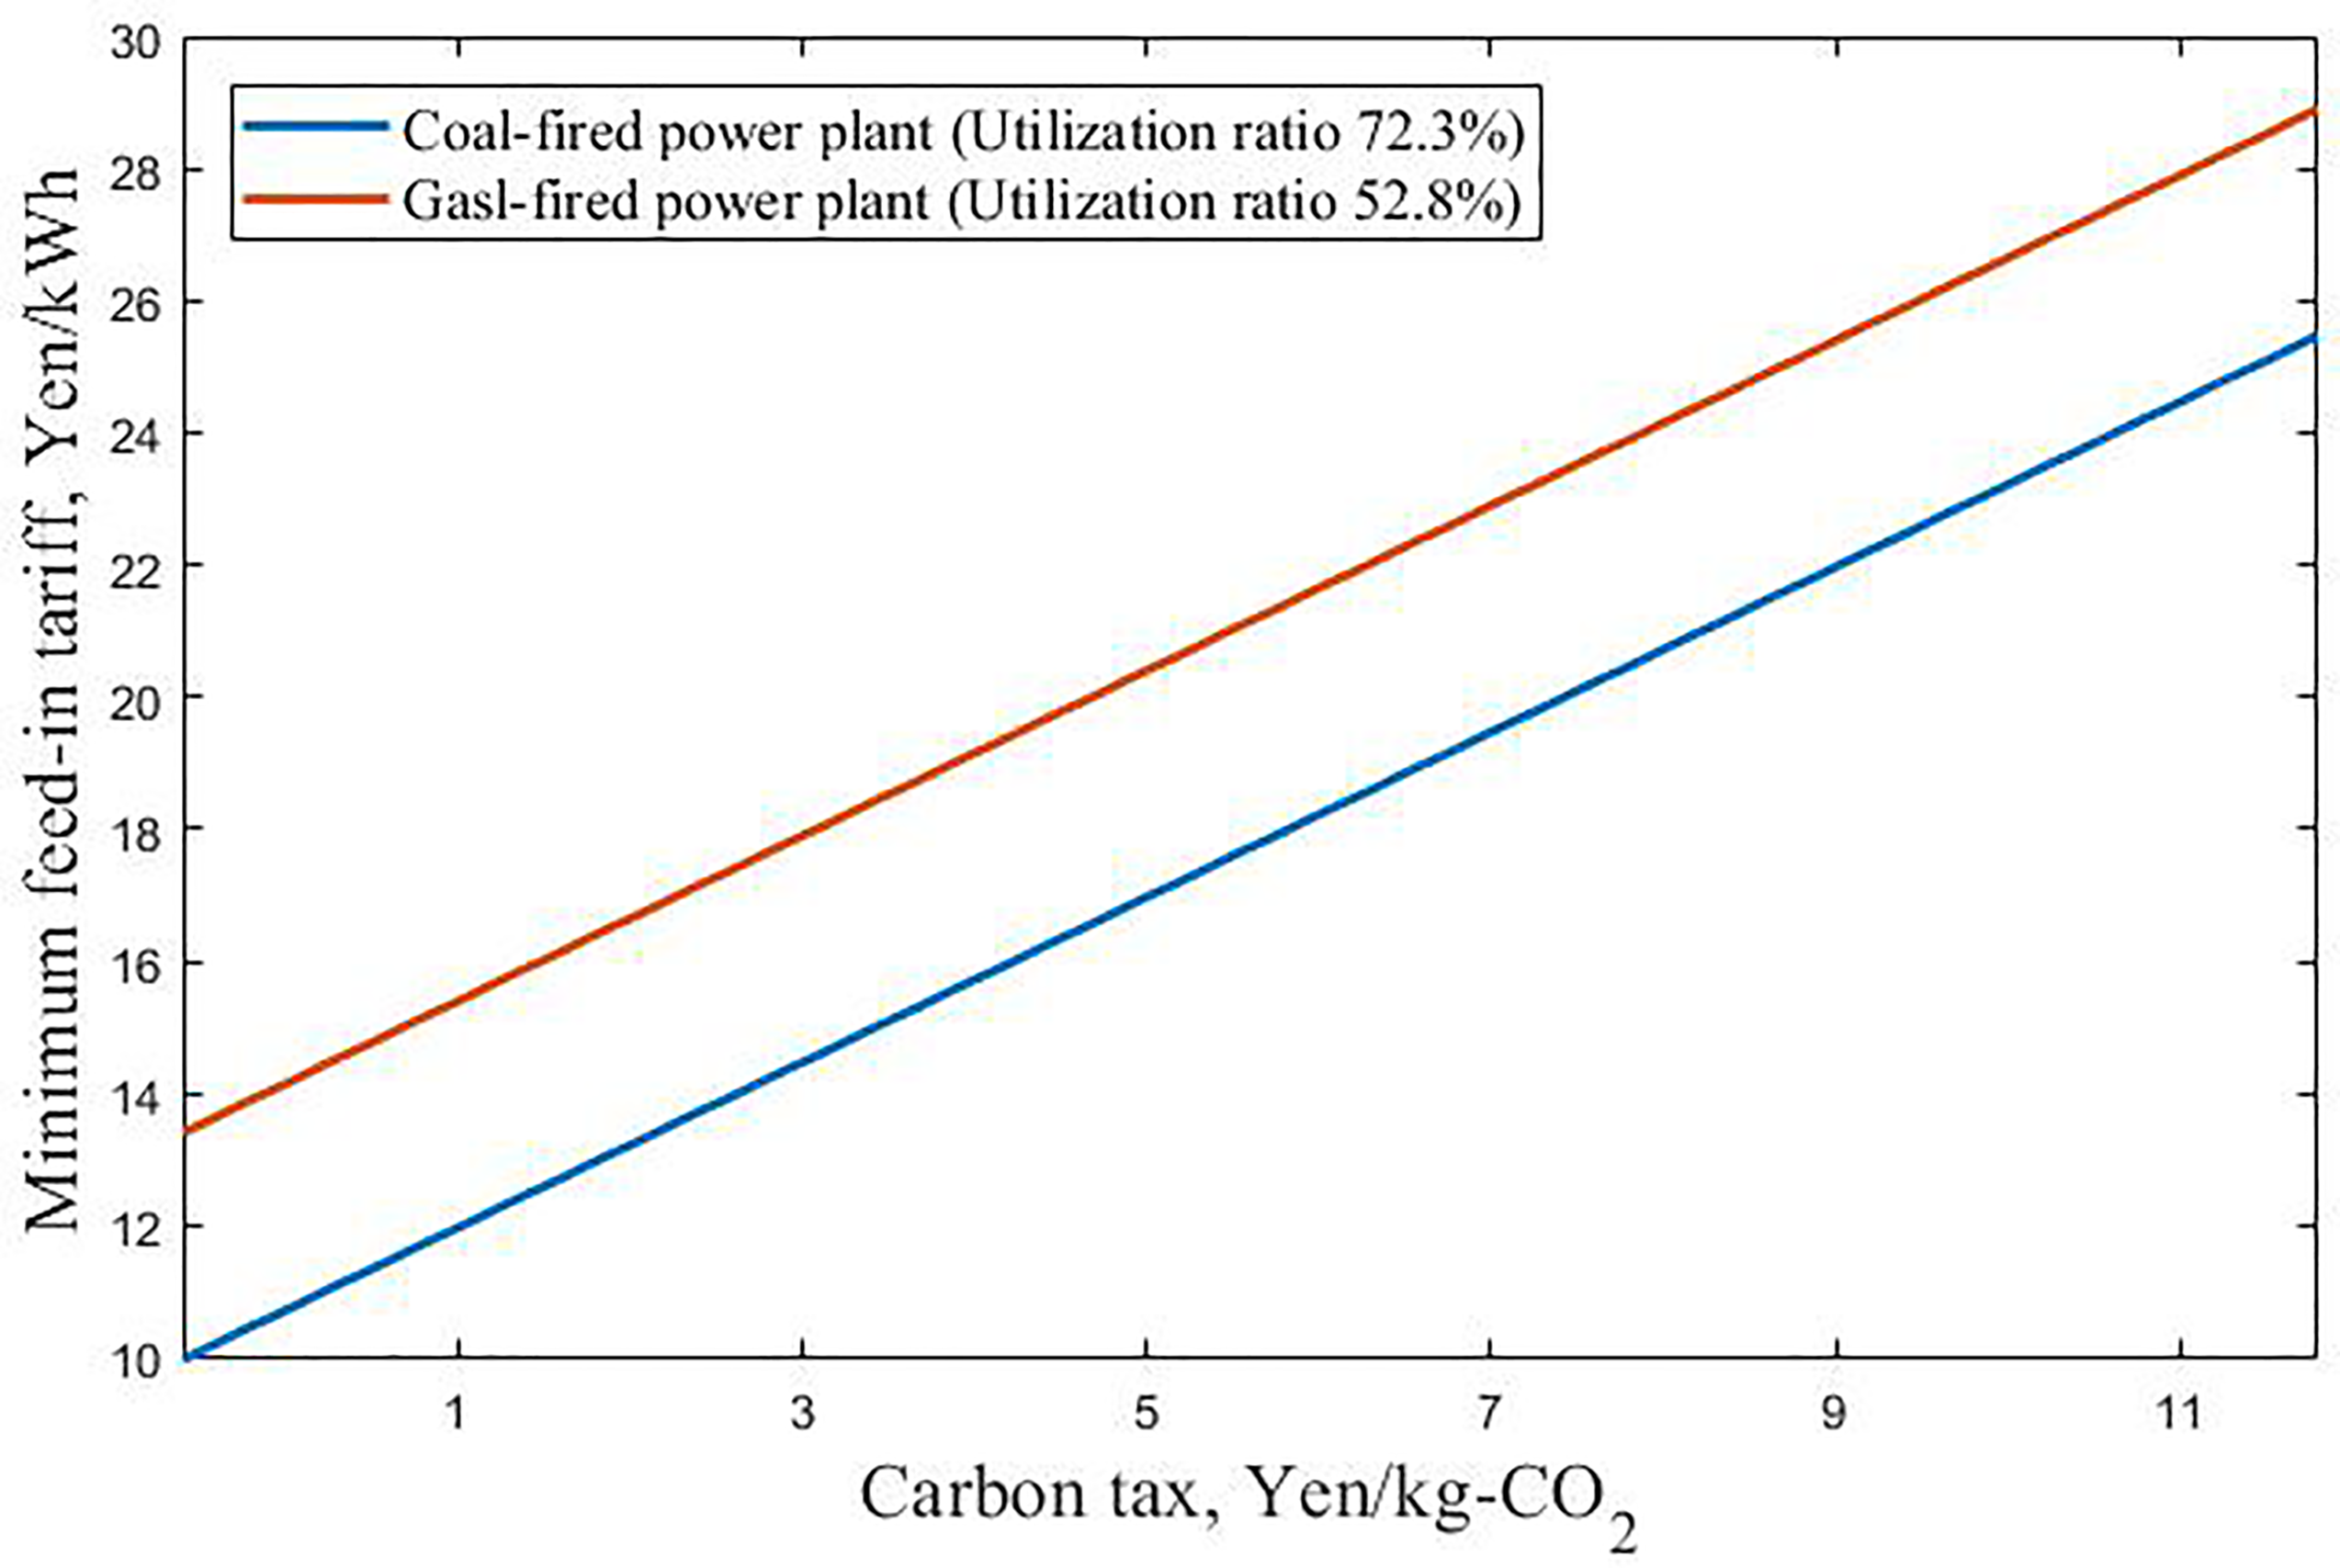
Minimum feed-in tariff under different carbon taxes in coal- and gas-fired power plants.
Optimization of the energy structure for feed-in tariffs
Optimization of the energy structure
In this study, Japan's top 10 power companies, covering more than 90% of Japan's total power supply, were selected as the research objects (Figure 5). As the remaining power demand not included in the study is mostly self-built power plants and distributed renewable energy, the influence on the power grid is small. Therefore, this study is expected to reflect the change in energy structure in Japan. According to the operation data from April 2019 to March 2020, the power supply of the top 10 power companies is calculated in Table 8.
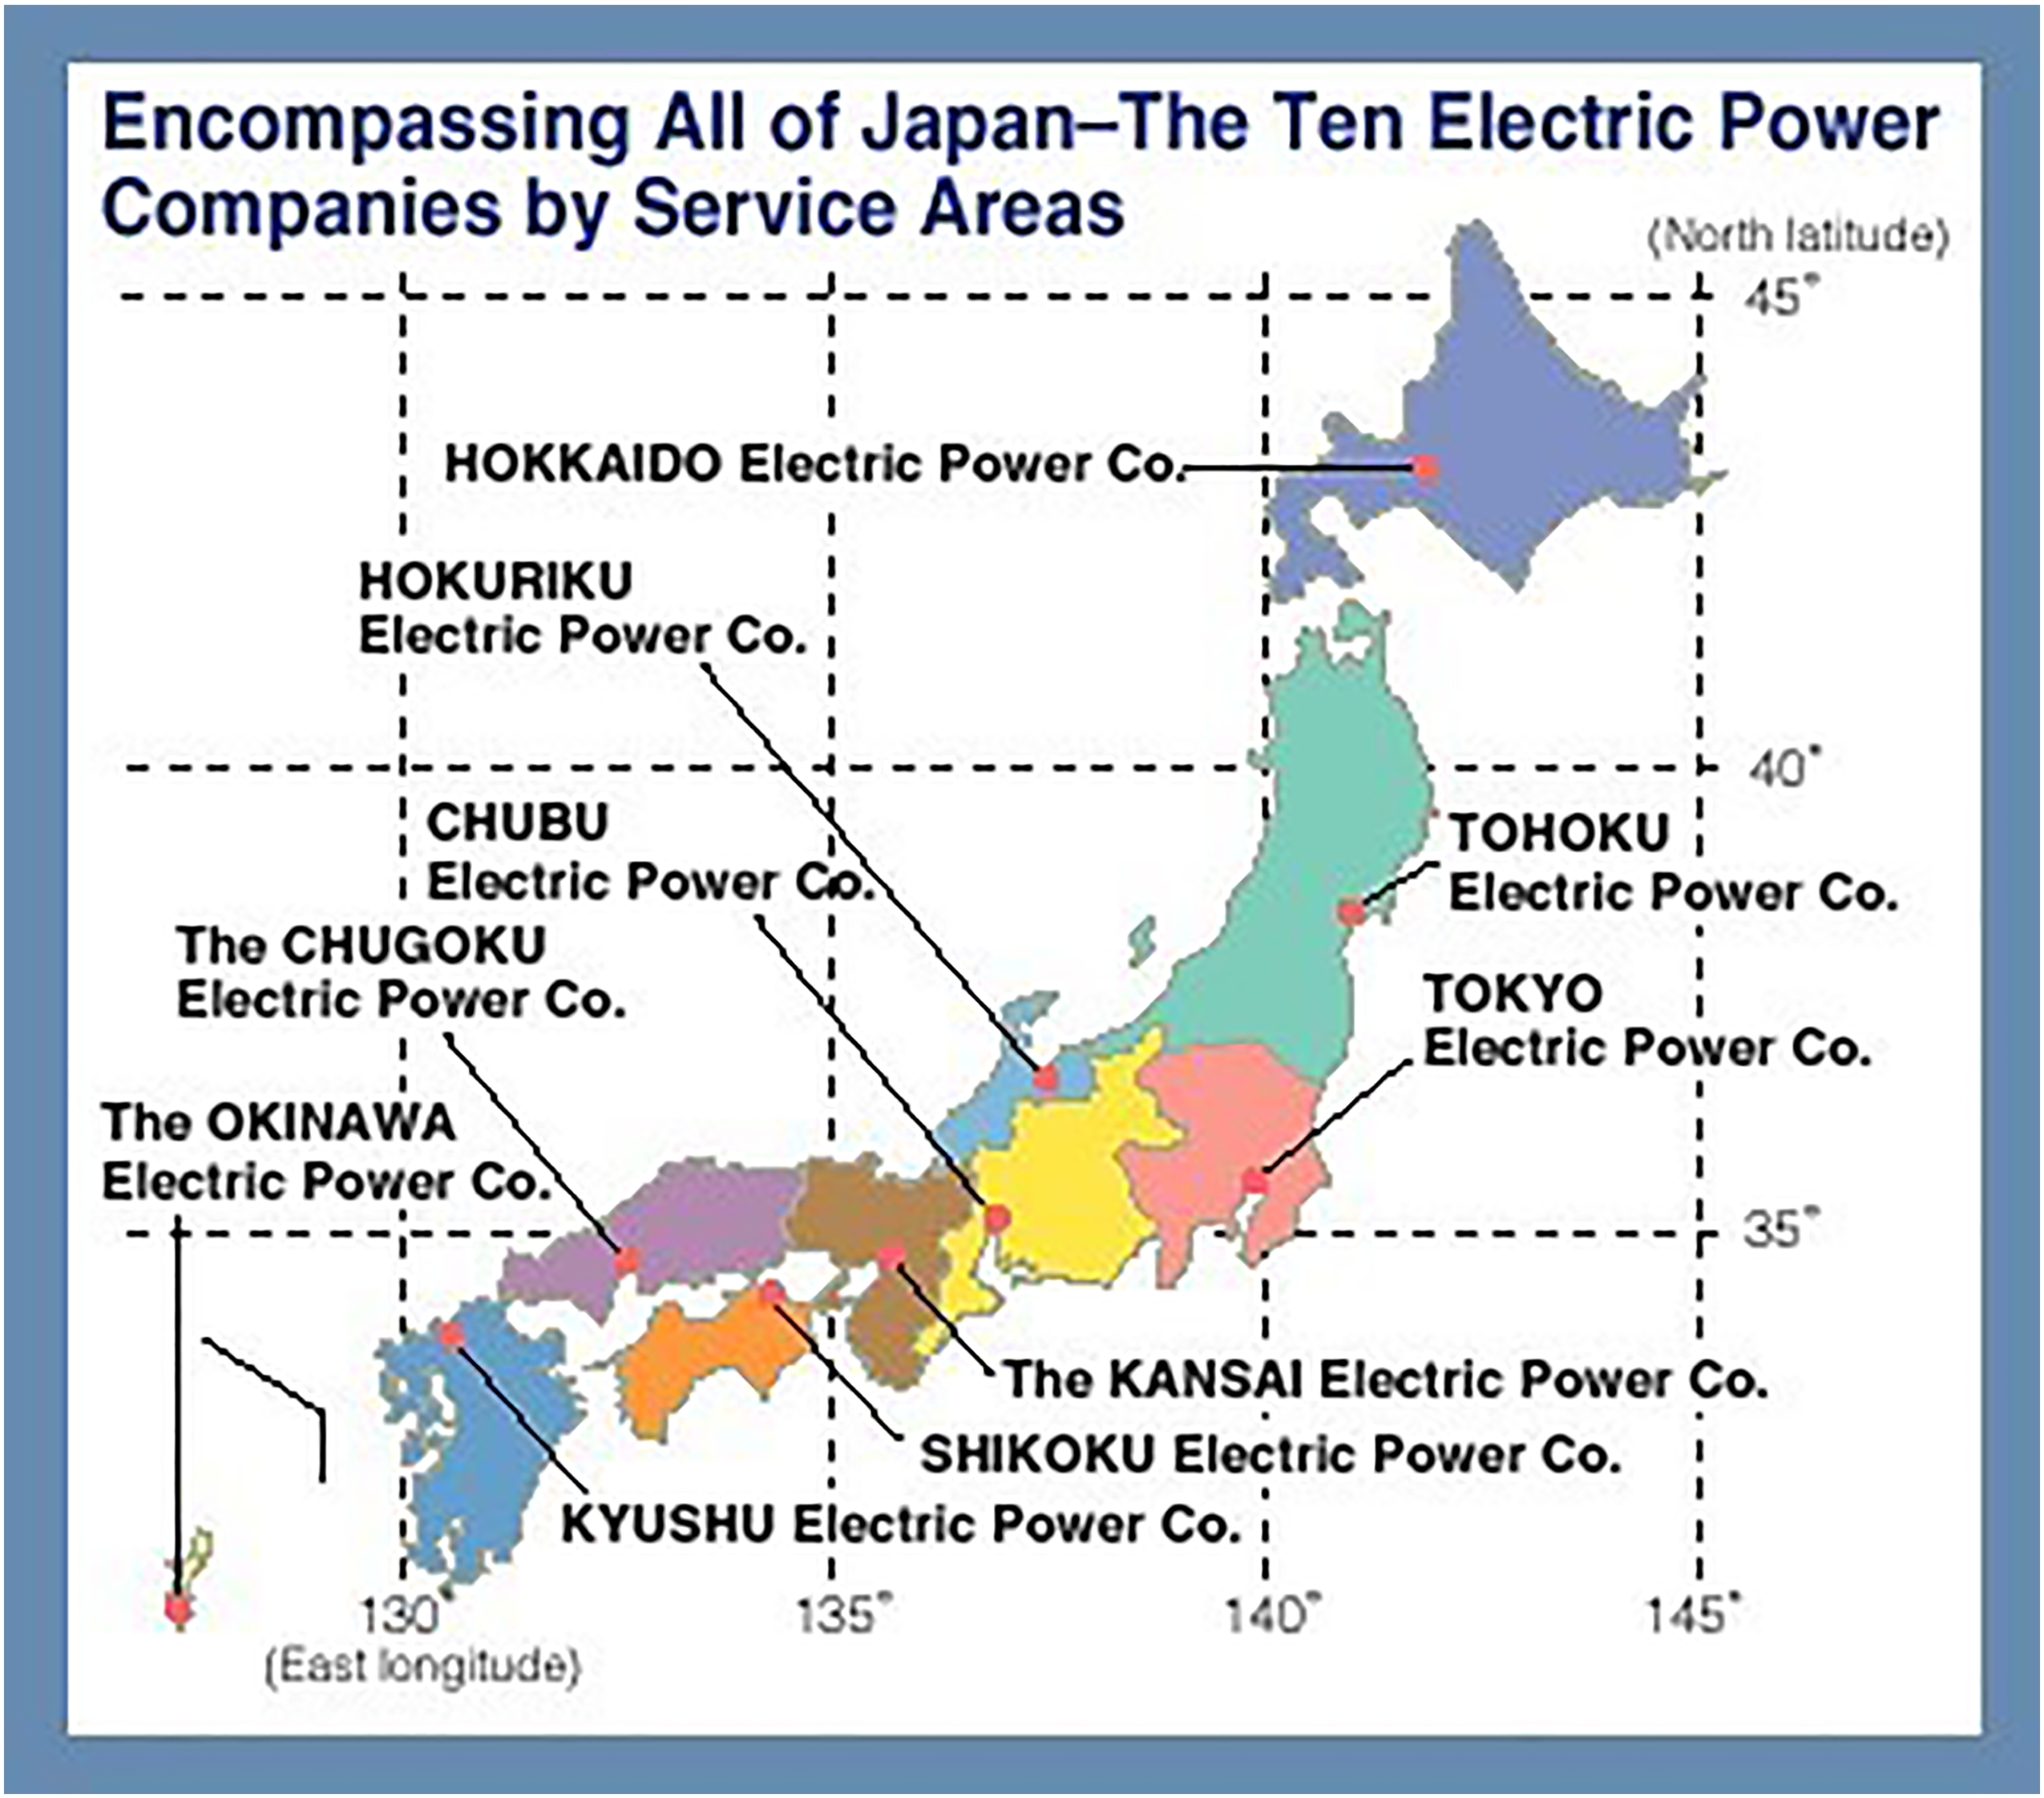
Schematic diagram of Japan's top 10 power companies.
Primary energy structure of the top 10 power companies (April 2019 to March 2020).
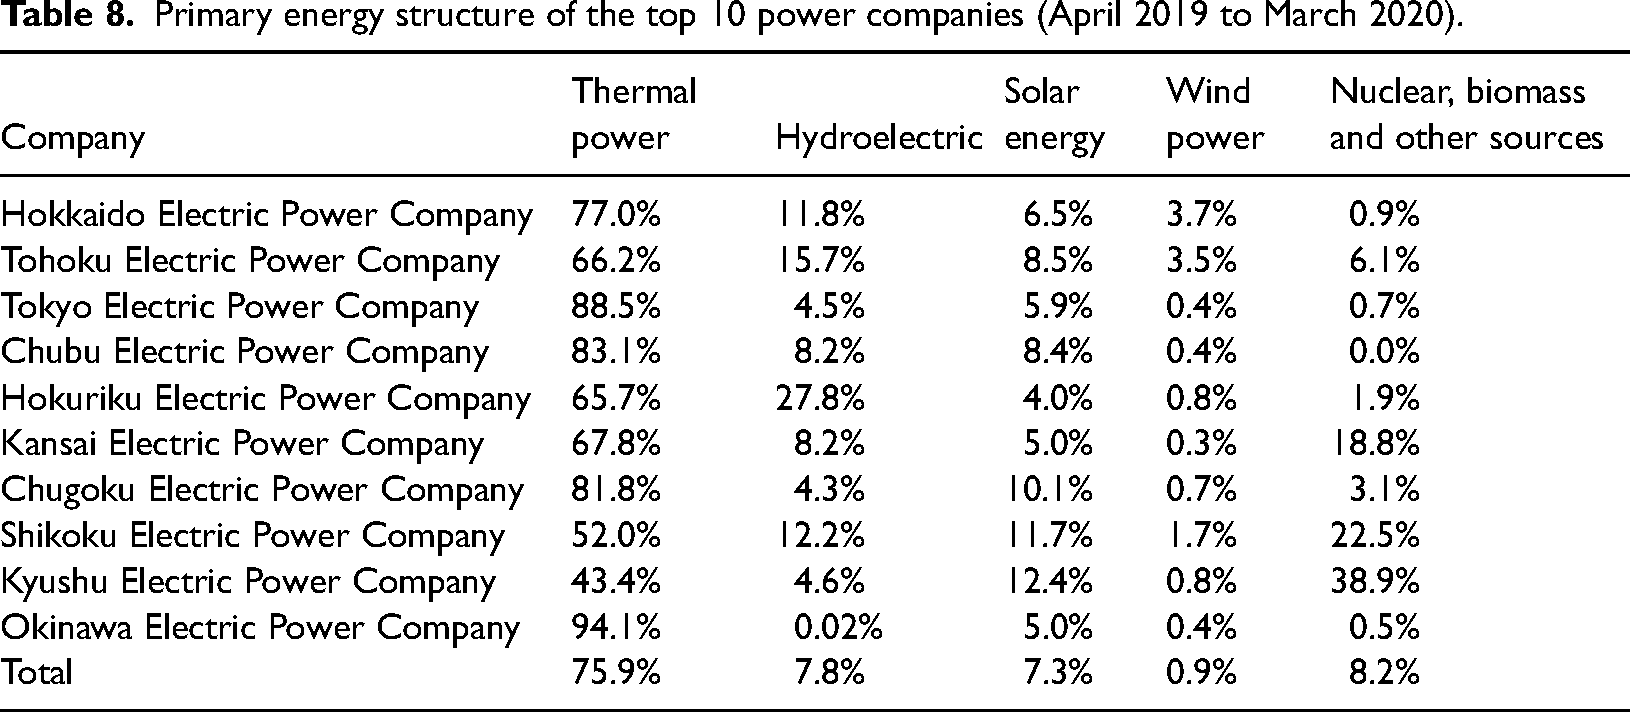
The proportion of oil-fired power plants in thermal power plants is relatively small at only 2%. Therefore, according to the statistics of installed capacity of coal- and gas-fired power plants by the top 10 power companies and the average equipment utilization rate in Table 4, the current minimum feed-in tariffs of thermal power generation is 12.3 JPY/kWh, which is consistent with the statistics on the average power generation cost of thermal power plants from the Ministry of Environment and Resources in Japan. The optimal energy structure after the introduction of a carbon tax was calculated. The following assumptions were made for the optimization process in this study:
Figure 3 reveals the economic ranking of various renewable energy and energy-storage technologies. During the energy structure optimization, the equipment cost and performance parameters in Tables 2 and 3 were used. However, due to the limitation of the actual environment, the maximum proportions of hydropower were set to 0.3. When the power generation capacity for hydropower reaches this ratio, even if the economy for hydropower is still the best, other forms of energy are used. The PHS is limited by the environment. When the stored power reaches the capacity limit, it must release the power completely before it can be stored again. Combined with the actual operation of PHS in the top 10 power companies, this charging and discharging process is set to be completed in one day. Hydrogen energy can be stored for a long time, so there is no such limitation. Among the nuclear energy, biomass energy, and other types in Table 8, except nuclear energy, the remaining types of power generation account for a small proportion. This study assesses these power generation forms with a small proportion. This study considers that nuclear energy can be used as a basic power facility to maintain the stability of the power grid. Therefore, when the price is dominant, all thermal power generation can be replaced by renewable energy. According to the survey, large-scale thermal power plants in Japan were built earlier, and most have reached or nearly reached the design life (Xu et al., 2022). Although affected by the international situation and fluctuation of fossil-fuel energy prices, Japan may continue to rely on fossil energy. However, replacing renewable energy is an inevitable trend. The current technology of 100% natural gas blended with hydrogen has also been successfully applied, which can directly replace the fuel for gas-fired power plants with hydrogen through a certain transformation. Therefore, there is no case in which the newly built thermal power plant is replaced in the calculation process, resulting in a waste of investment. The hydrogen energy generated by renewable power can also be fully consumed by mixing hydrogen and burning it without needing to build new hydrogen power generation facilities.
Results, analysis, and discussion
Based on the above description of the current situation and forecast of a carbon tax in Japan and worldwide, the change range of the carbon tax was set to 0 to 16 JPY/kg-CO2. Combined with the maximum proportion of hydropower generation and various price and performance parameters replaced above, the weighted minimum feed-in price in Figure 6 is obtained. Figure 7 presents the proportion of change in thermal power plants in optimizing the weighted minimum feed-in price. When the carbon tax exceeds 8 JPY/kg-CO2, the thermal power generation of most power companies no longer has a price advantage, and the proportion rapidly drops to 0%. This carbon tax price is slightly higher than the current global average level, but it is still within the achievable range.
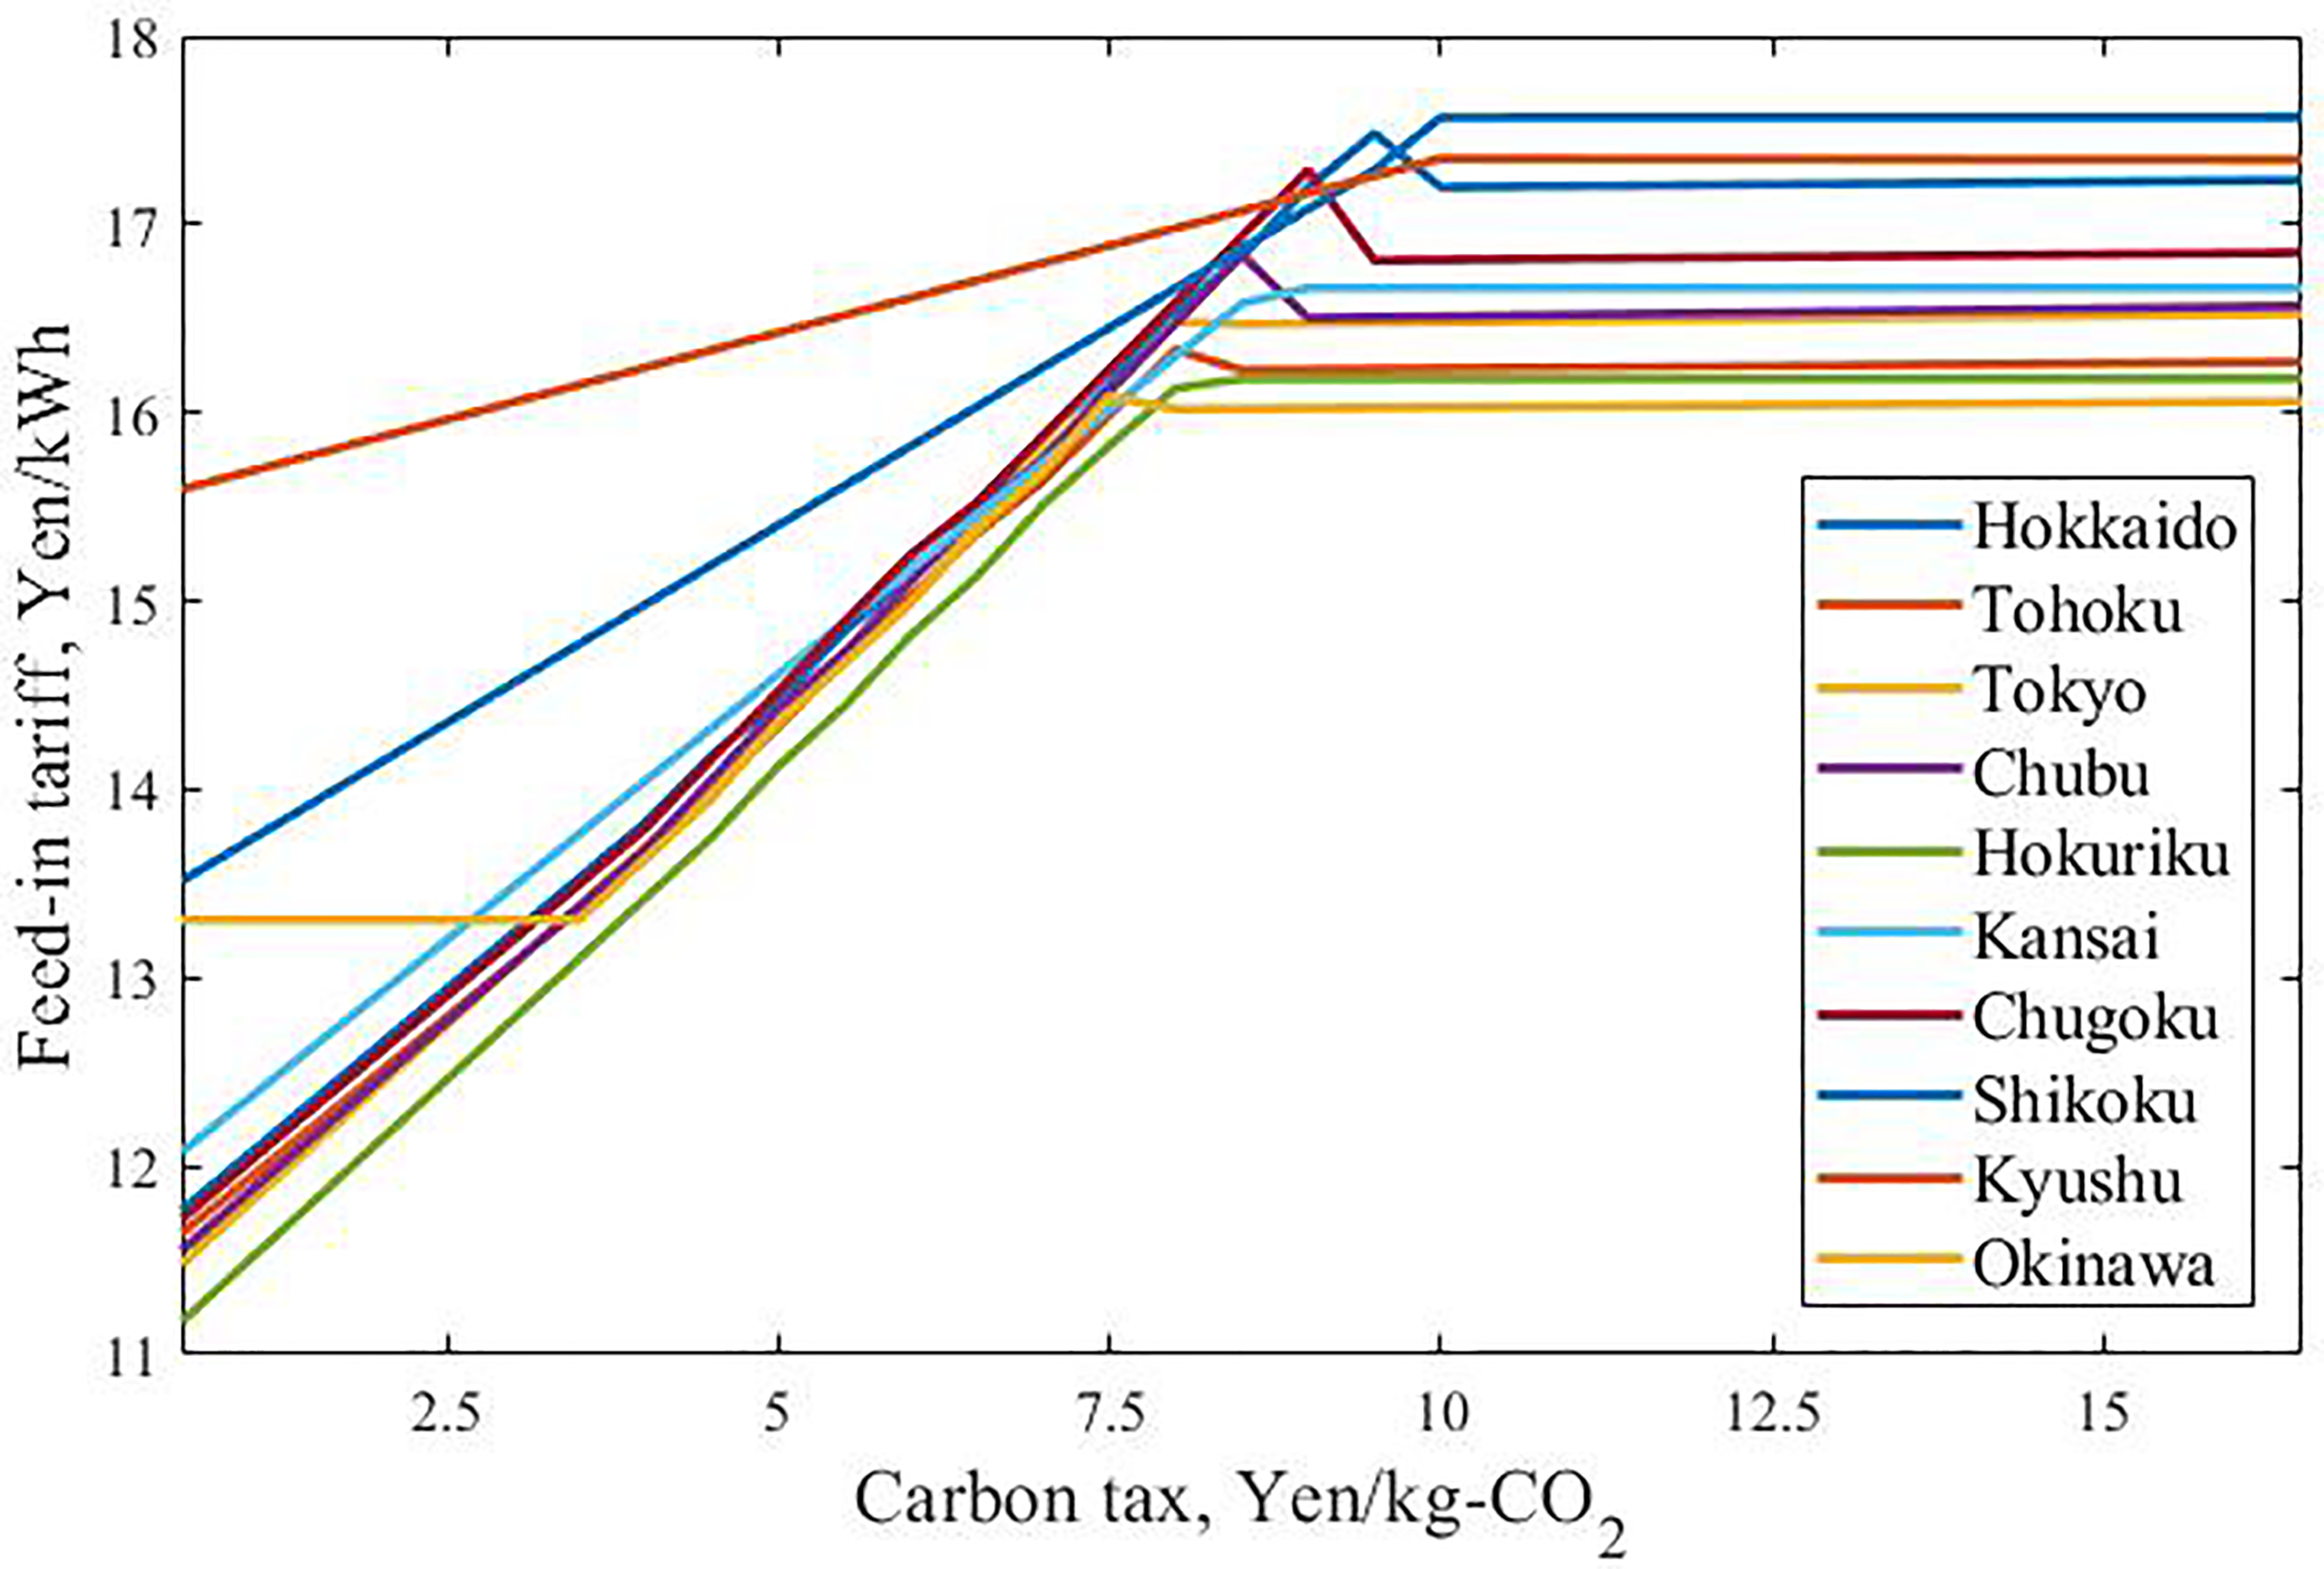
Relationship between the weighted minimum feed-in price and carbon tax.
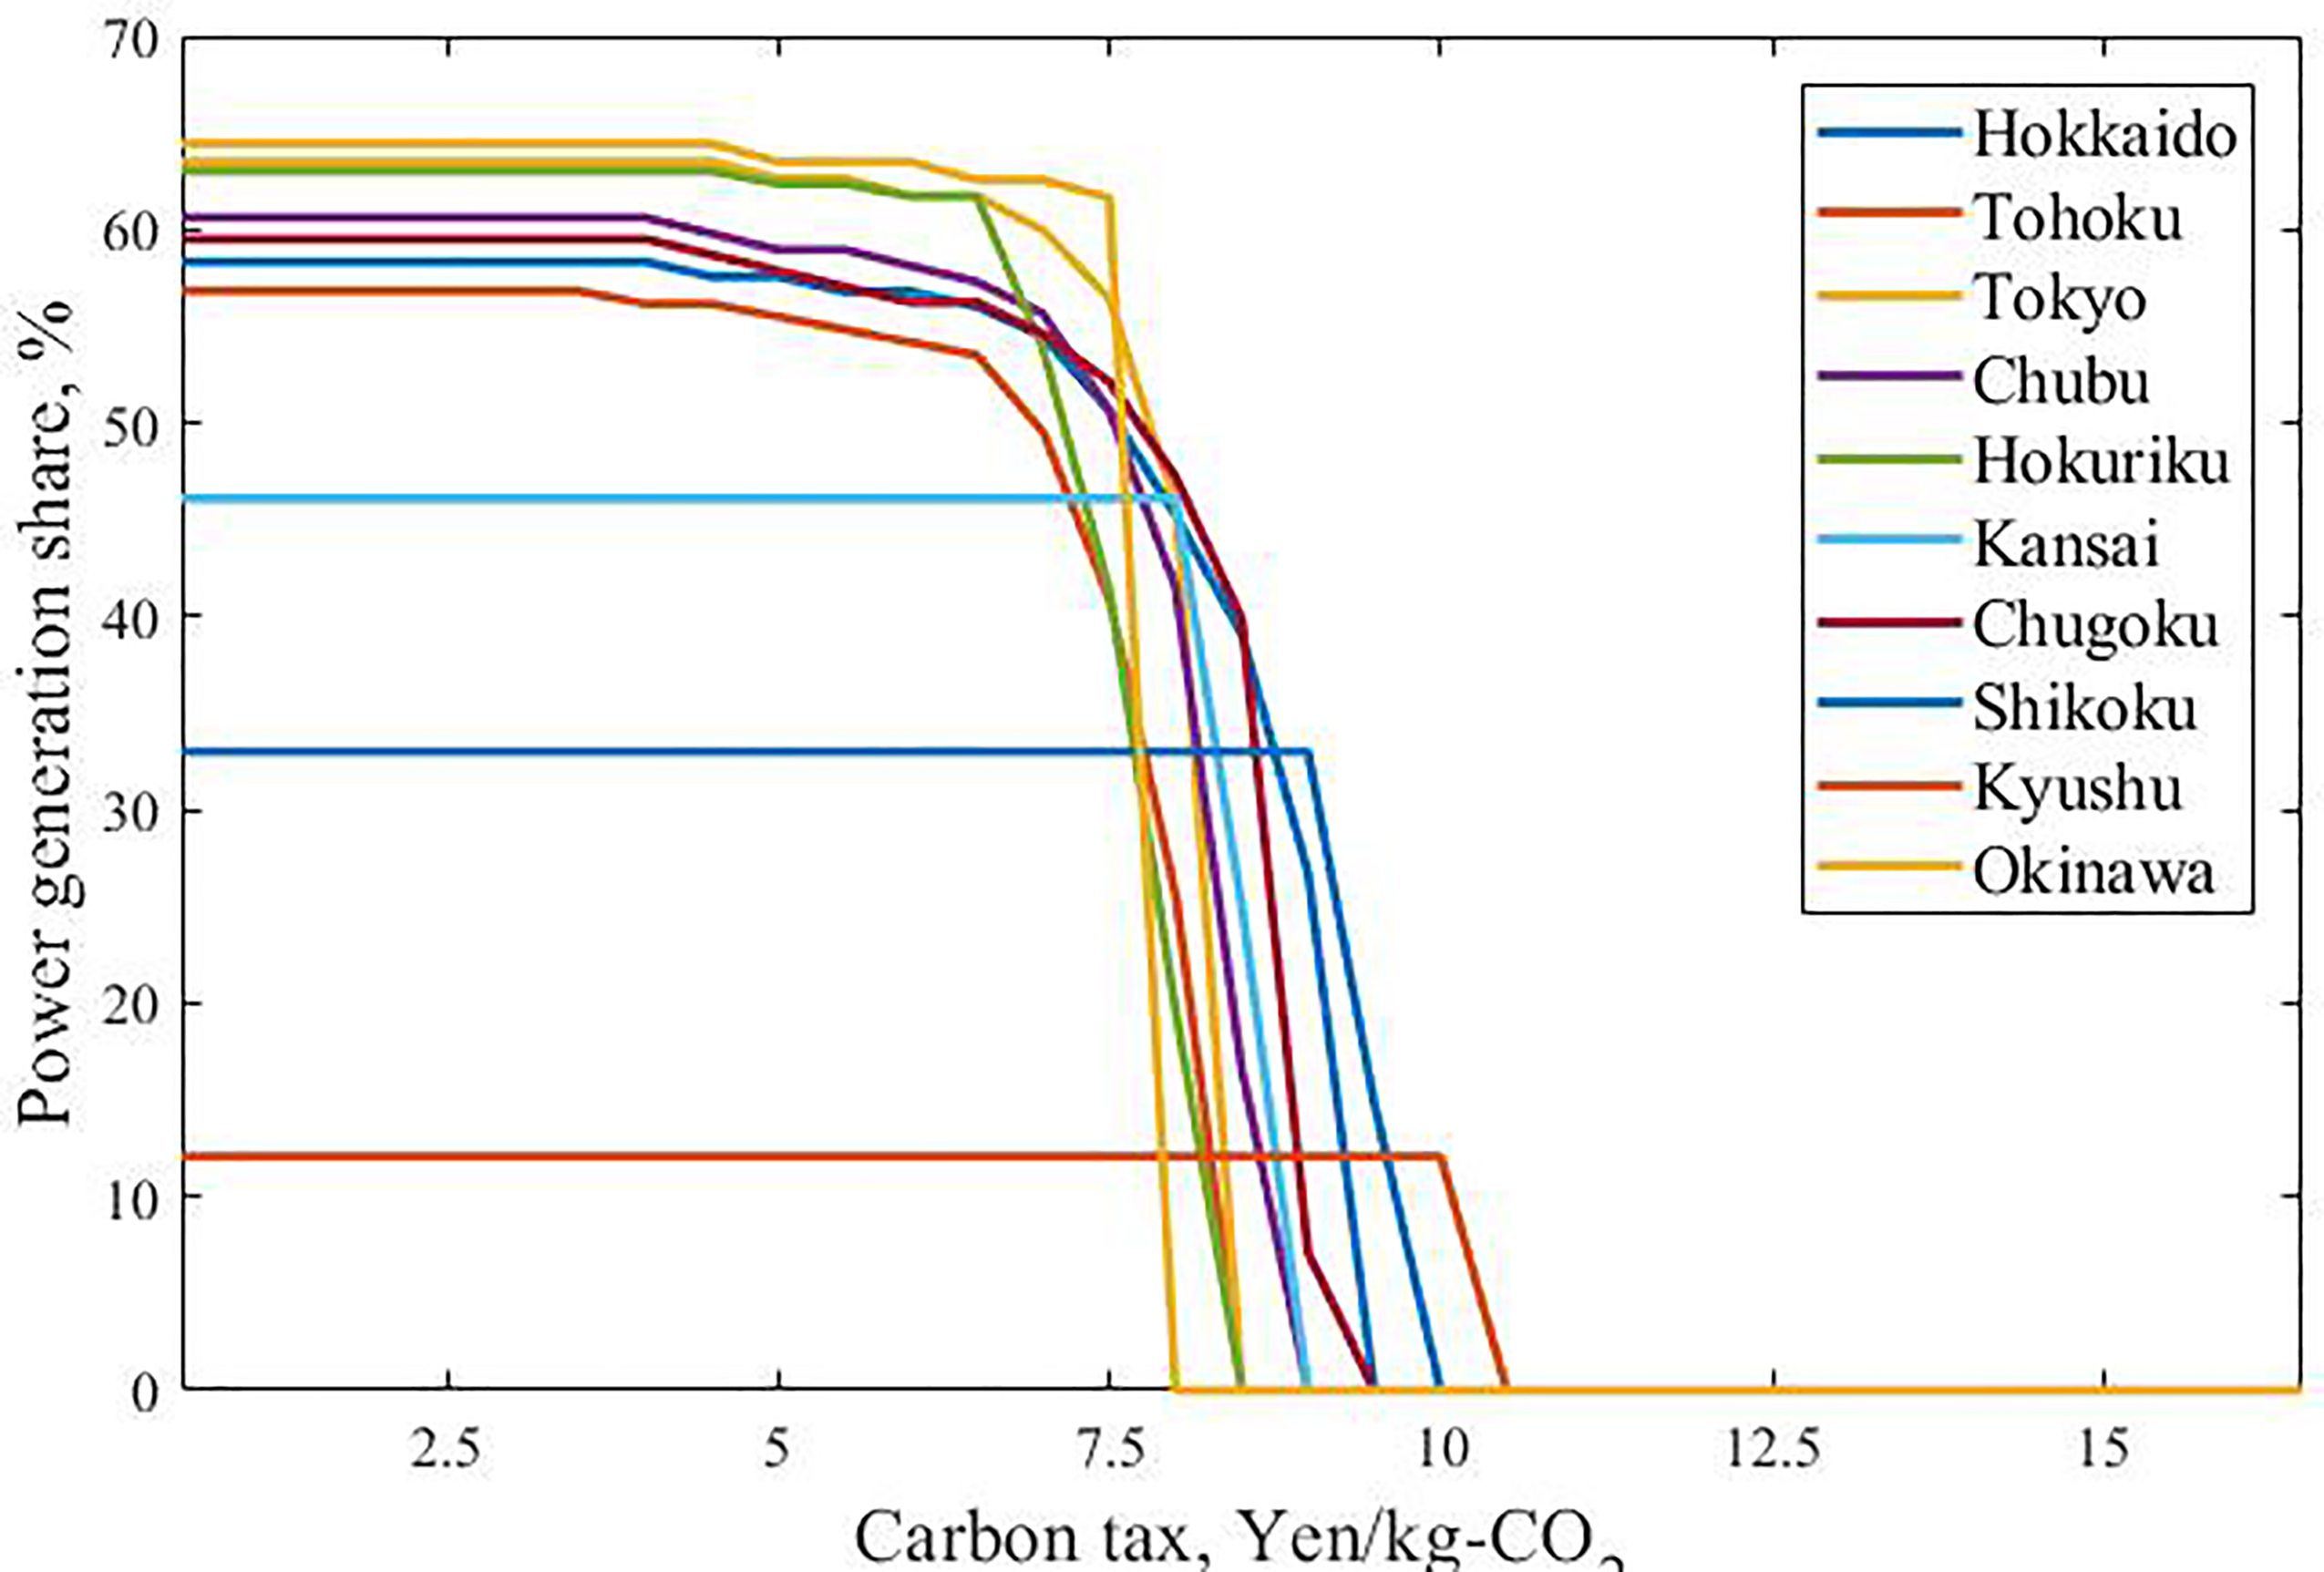
Change diagram of the proportion of change in thermal power plants.
The results in Figures 6 and 7 demonstrate that the change in the carbon tax leads to the gradual replacement of thermal power generation with renewable energy. In this process, hydrogen energy only exhibits long-term storage characteristics as a supplement to PHS. To explain the characteristics of the long-distance transmission of hydrogen energy, with the storage of hydrogen energy, the surplus renewable power of the top 10 power companies can be used interactively. The results are presented in Figure 8. When the renewable power of the top 10 power companies can be complemented by hydrogen storage technology, the proportion of thermal power plants declines earlier. The carbon tax price of 6 JPY/kg-CO2 is consistent with the current global level, indicating that even if the carbon tax price remains unchanged, hydrogen storage technology can accelerate the replacement process of fossil fuels.
Changes in the proportion of thermal power plants with long-distance renewable power storage by hydrogen.
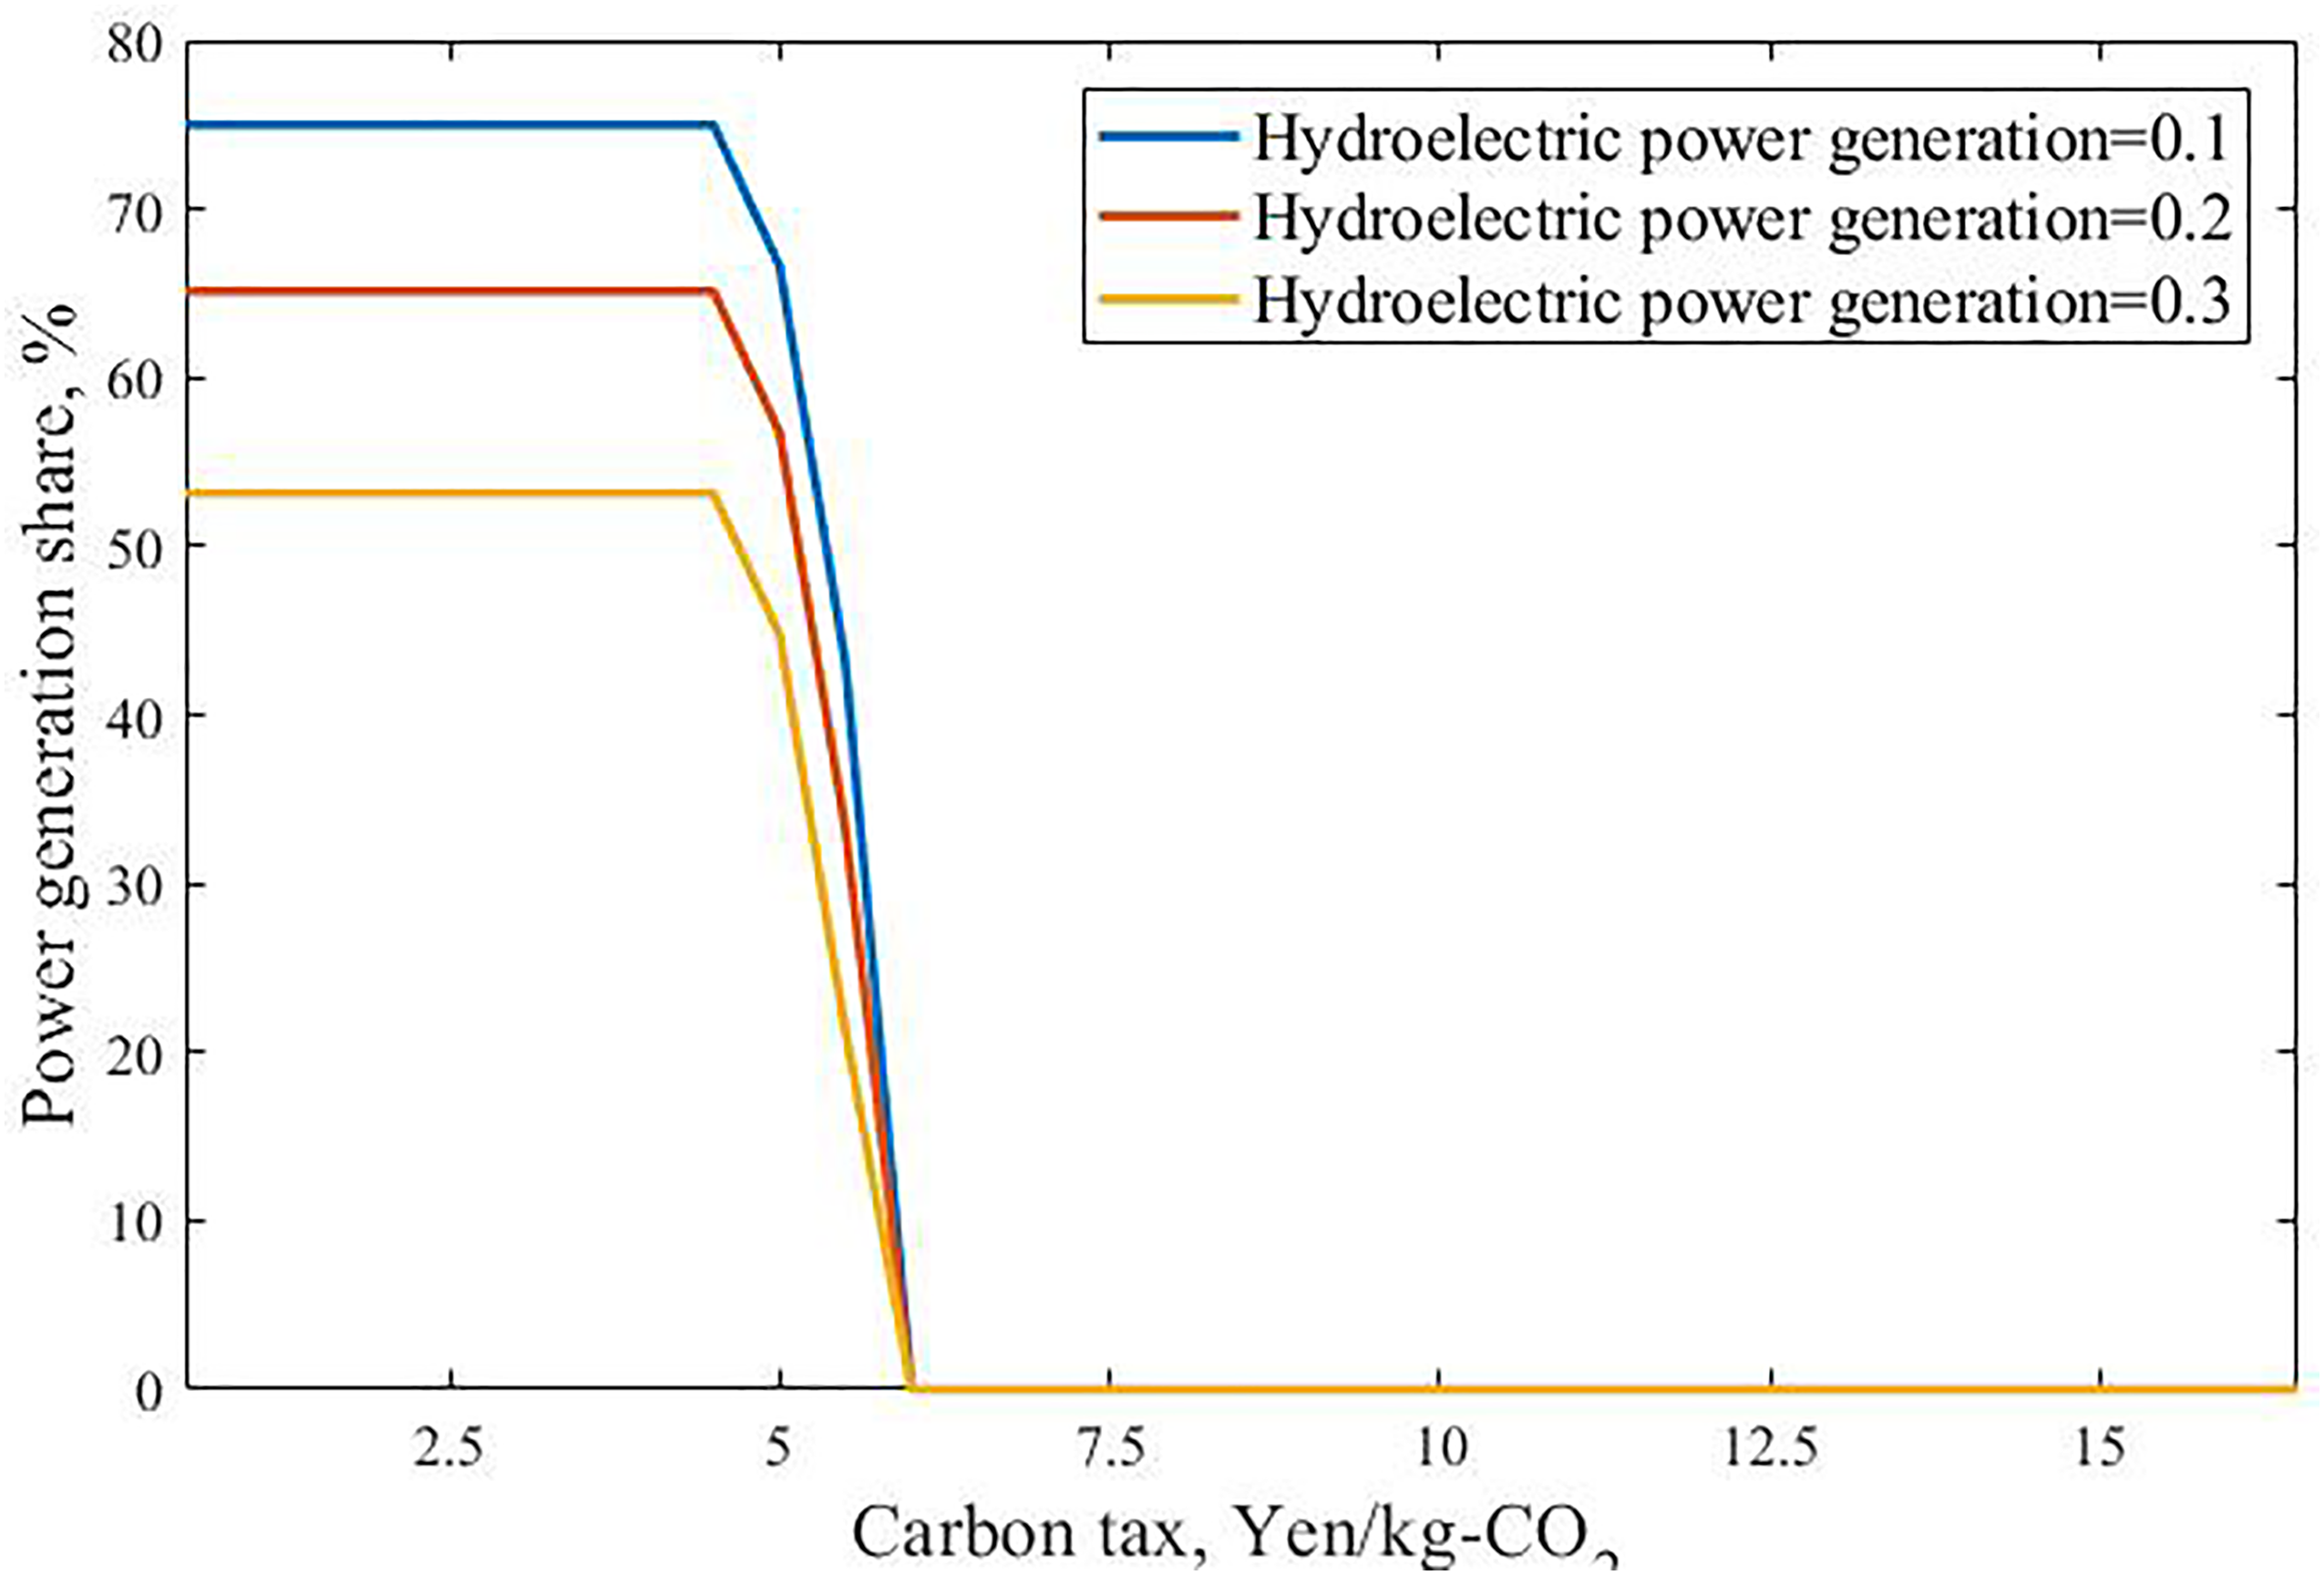
Figure 9 depicts the lowest feed-in tariffs when different energy-storage technologies are introduced to further explain the role of hydrogen storage technology. The effect of PHS on accelerating the replacement of fossil-fuel energy is not obvious, whereas hydrogen storage technology has an obvious effect.
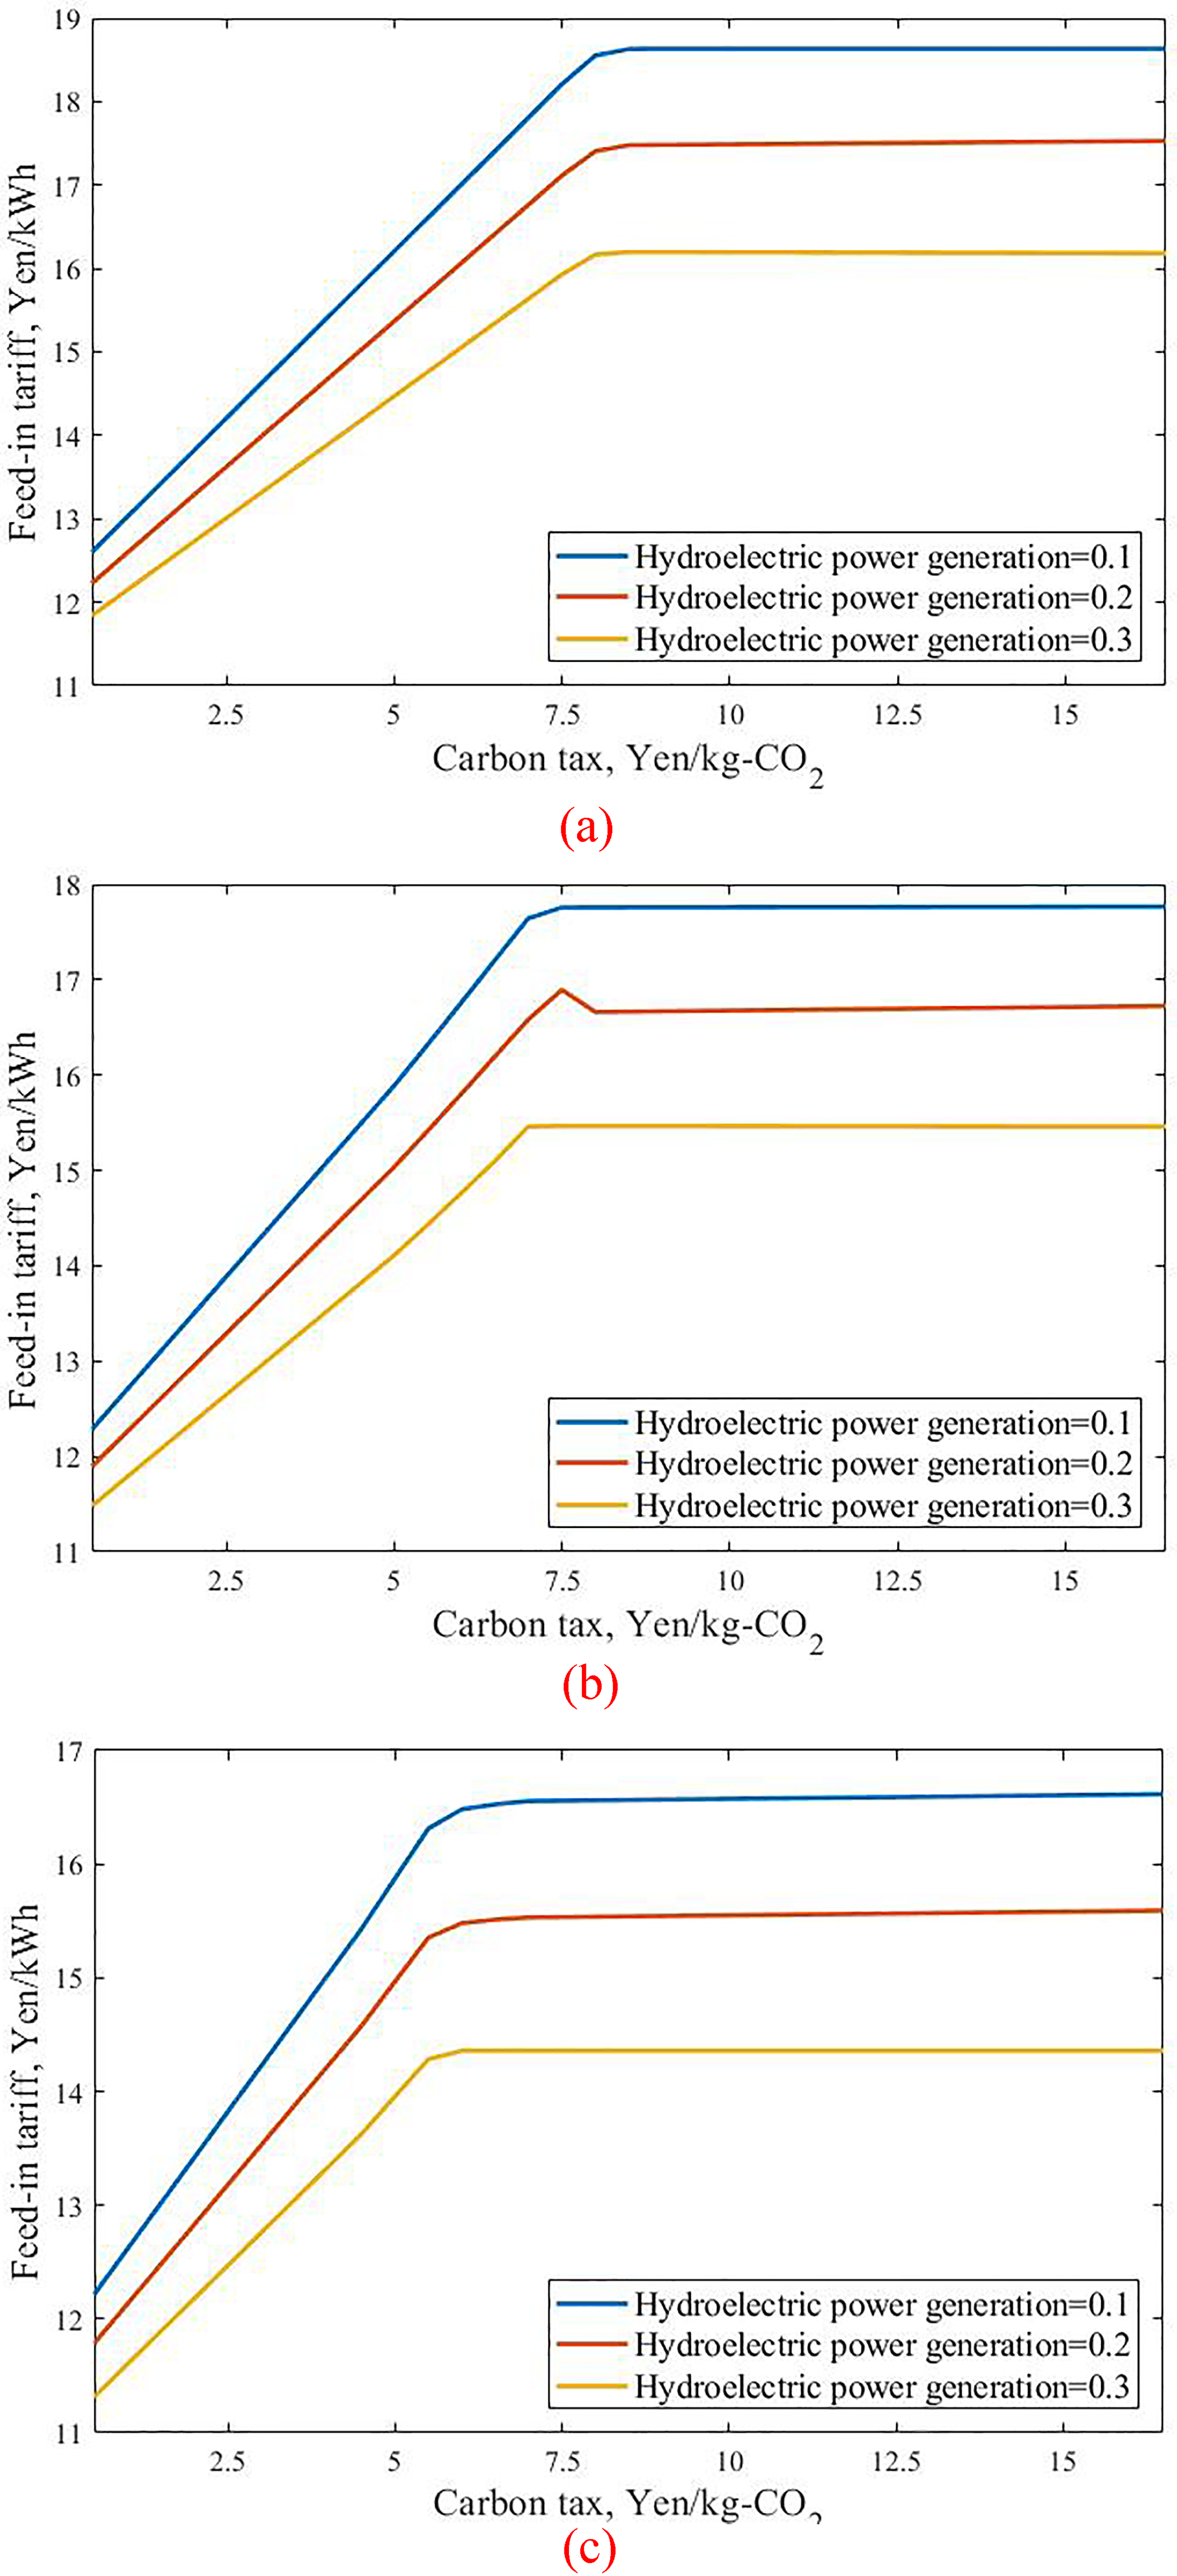
Effect comparison of pumped hydro-storage and hydrogen storage technology. (a) Without storage. (b) Only PHS. (c) With PHS and hydrogen storage.
Sensitivity analysis and discussion of the promotion of hydrogen energy
Sensitivity analysis of energy price and equipment investment
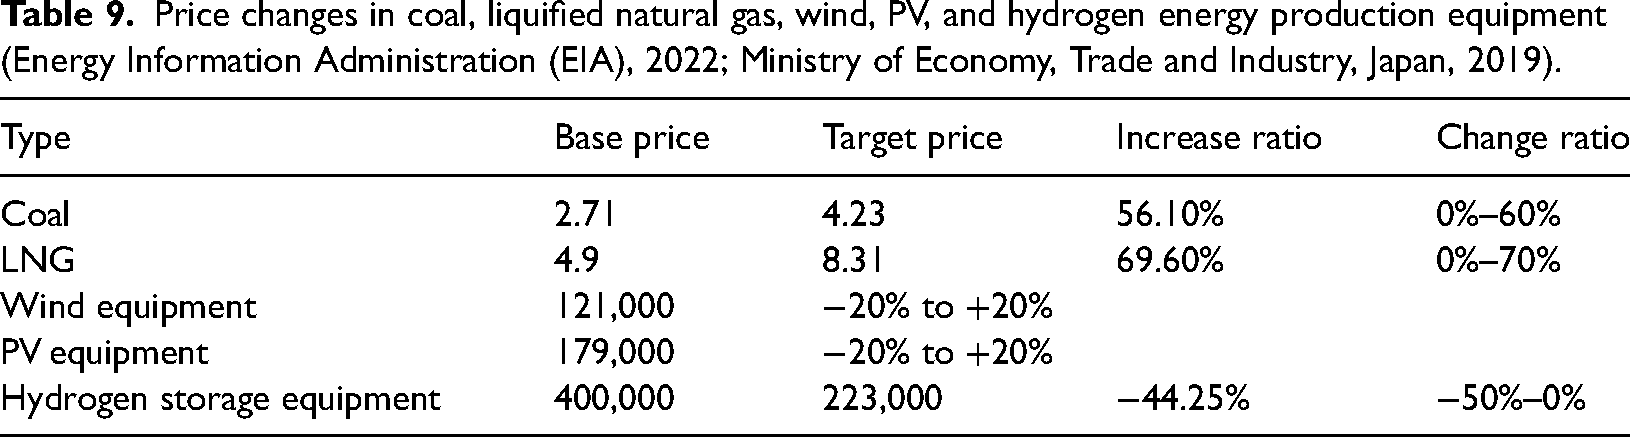
The price of global fossil-fuel energy has been exhibiting an upward trend. According to the forecast of the Energy Information Administration (EIA), coal and liquified natural gas (LNG) prices will rise by 60% and 70%, respectively. According to the route plan of the Japanese government for the development of hydrogen energy, the cost of hydrogen storage equipment will be greatly reduced. Therefore, this part of the study conducts a sensitivity analysis of the main factors affecting the research results. The fluctuation range of parameters is presented in Table 9.
Price changes in coal, liquified natural gas, wind, PV, and hydrogen energy production equipment (Energy Information Administration (EIA), 2022; Ministry of Economy, Trade and Industry, Japan, 2019).
Figures 10 and 11 show comparison of economic sensitivity between coal and LNG. Among them, the maximum and minimum PV feed-in tariffs in Figures 10(b) and 11(b) refer to the changes in PV feed-in tariffs due to the participation of energy-storage investment under different proportions of PV in Figure 3(a). As shown in Figure 10(b), the fluctuation of the minimum feed-in tariffs of thermal power generation caused by the change of coal price is not obvious, which is consistent with the change of the weighted minimum feed-in tariffs in Figure 10(a).
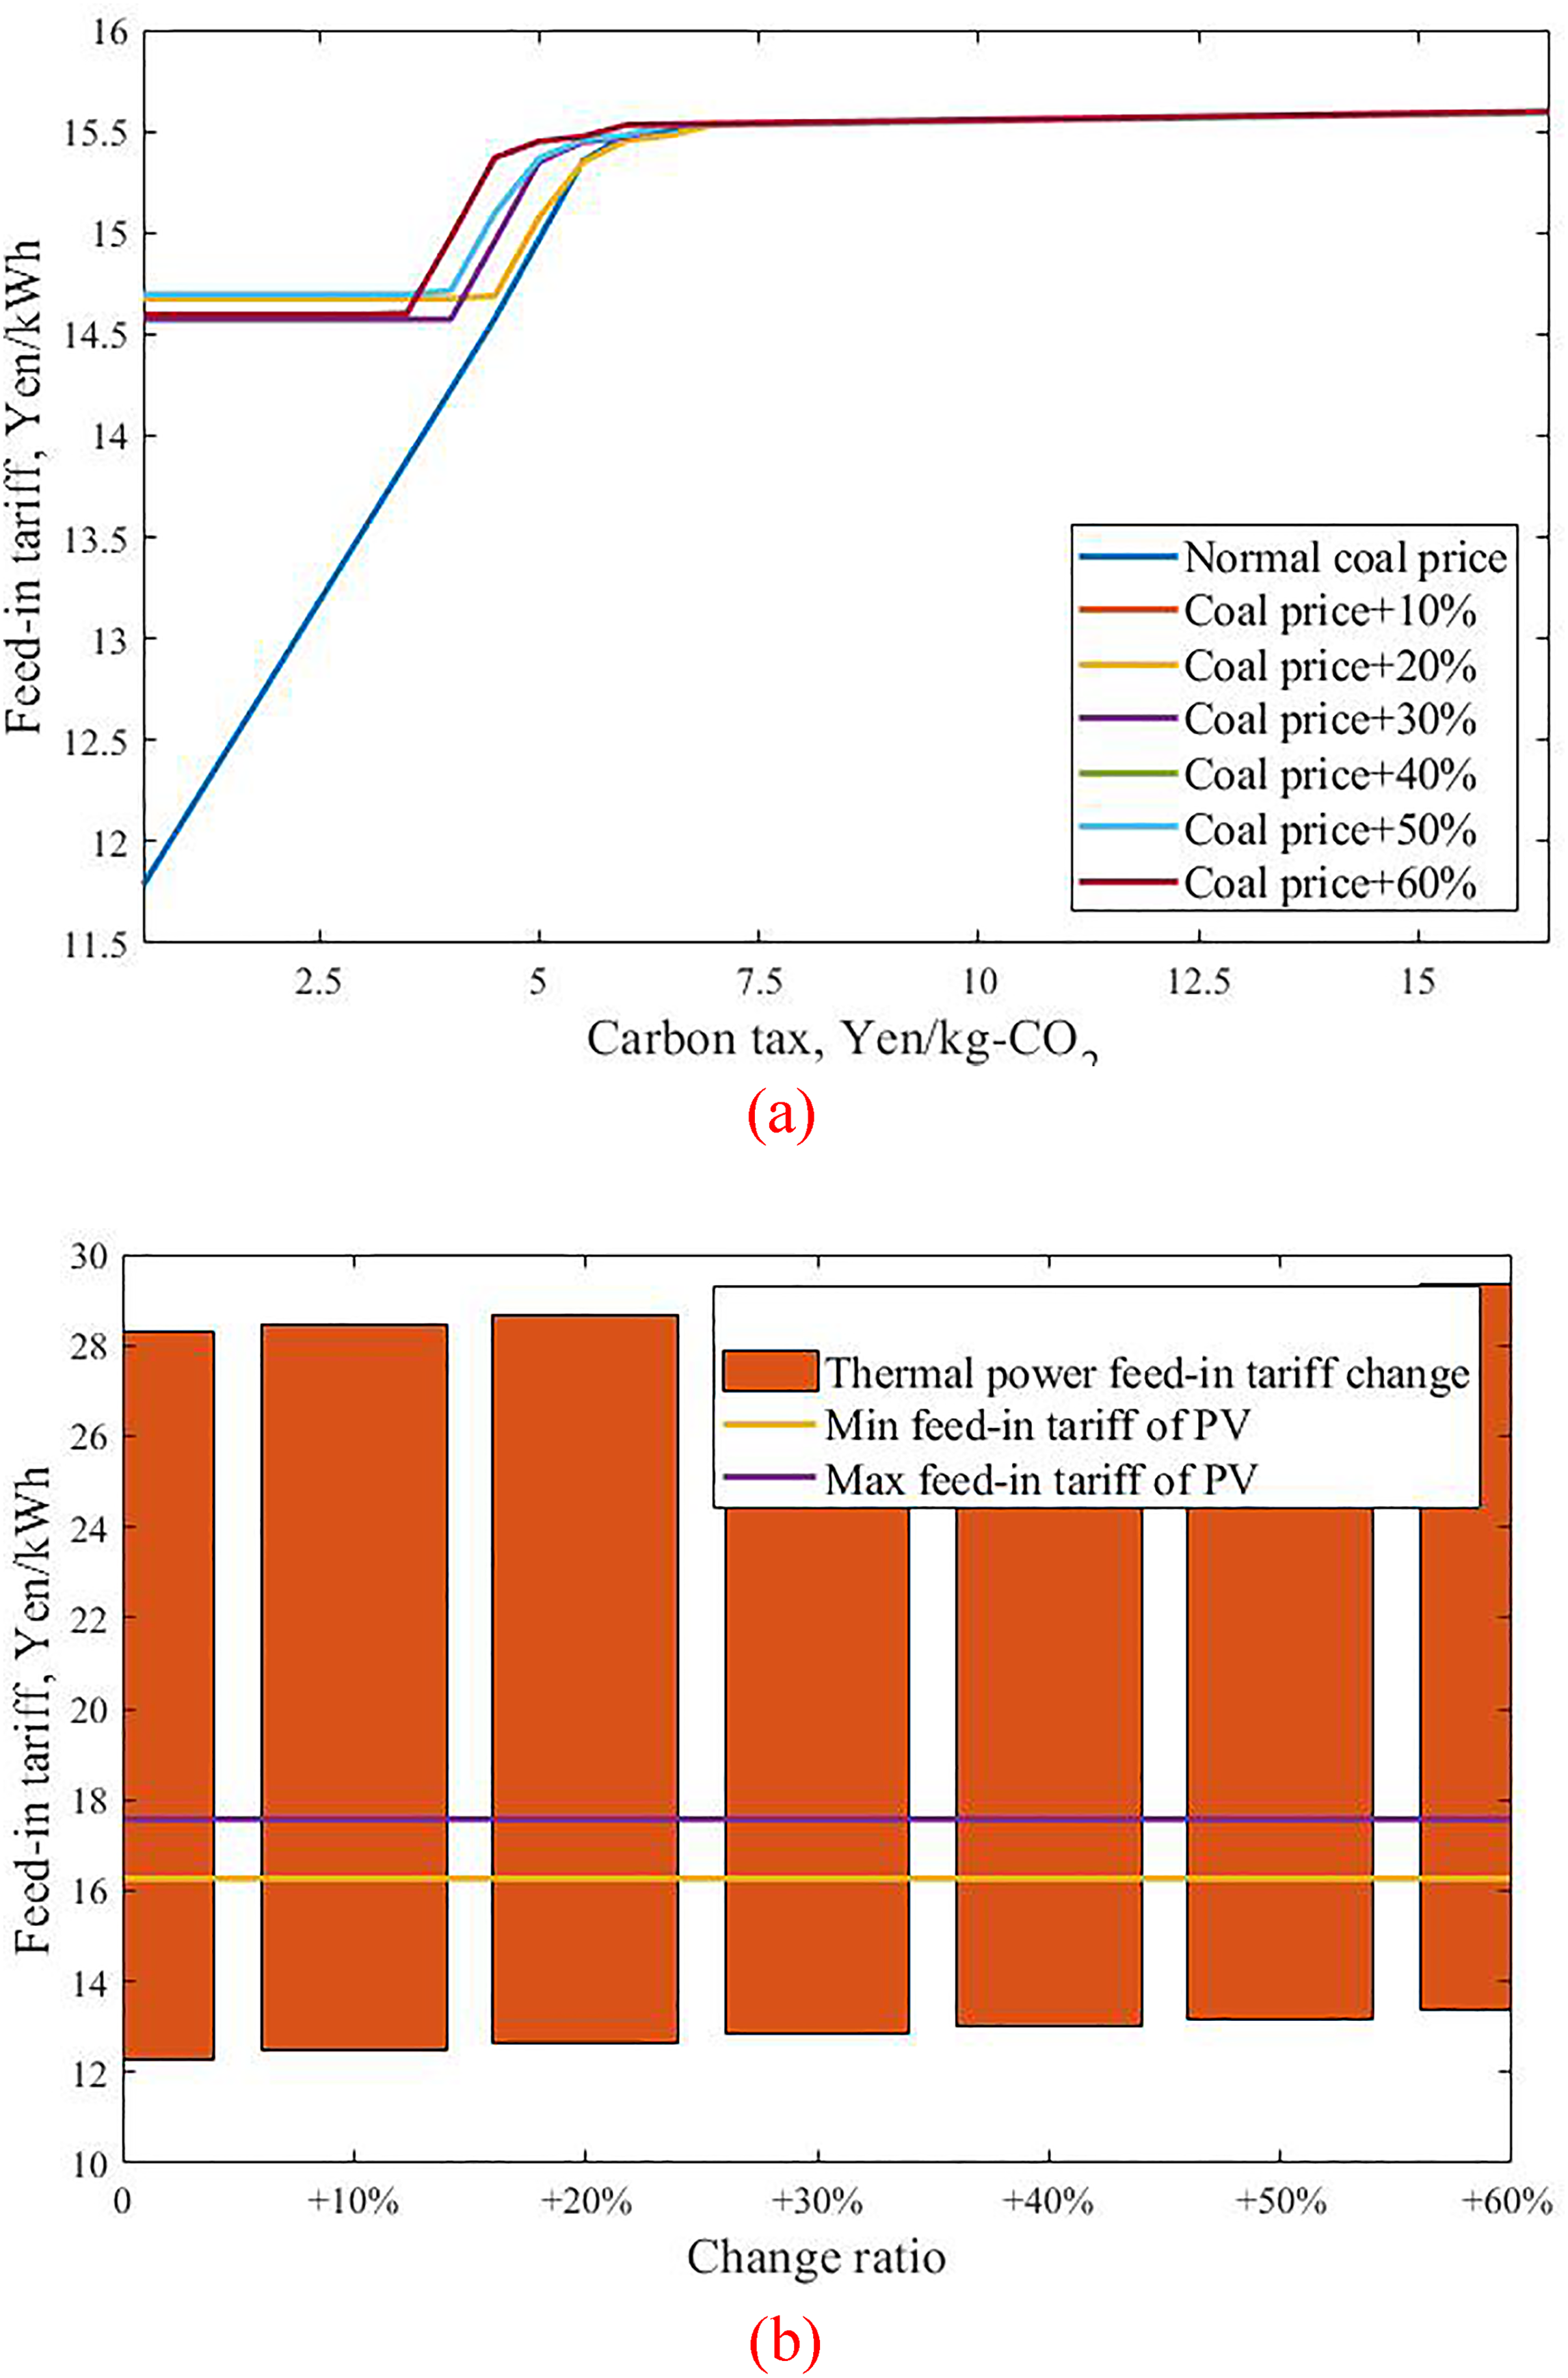
Sensitivity analysis results of coal price. (a) Lowest weighted feed-in tariff under different carbon taxes. (b) Comparison of feed-in tariff of PV and thermal power.
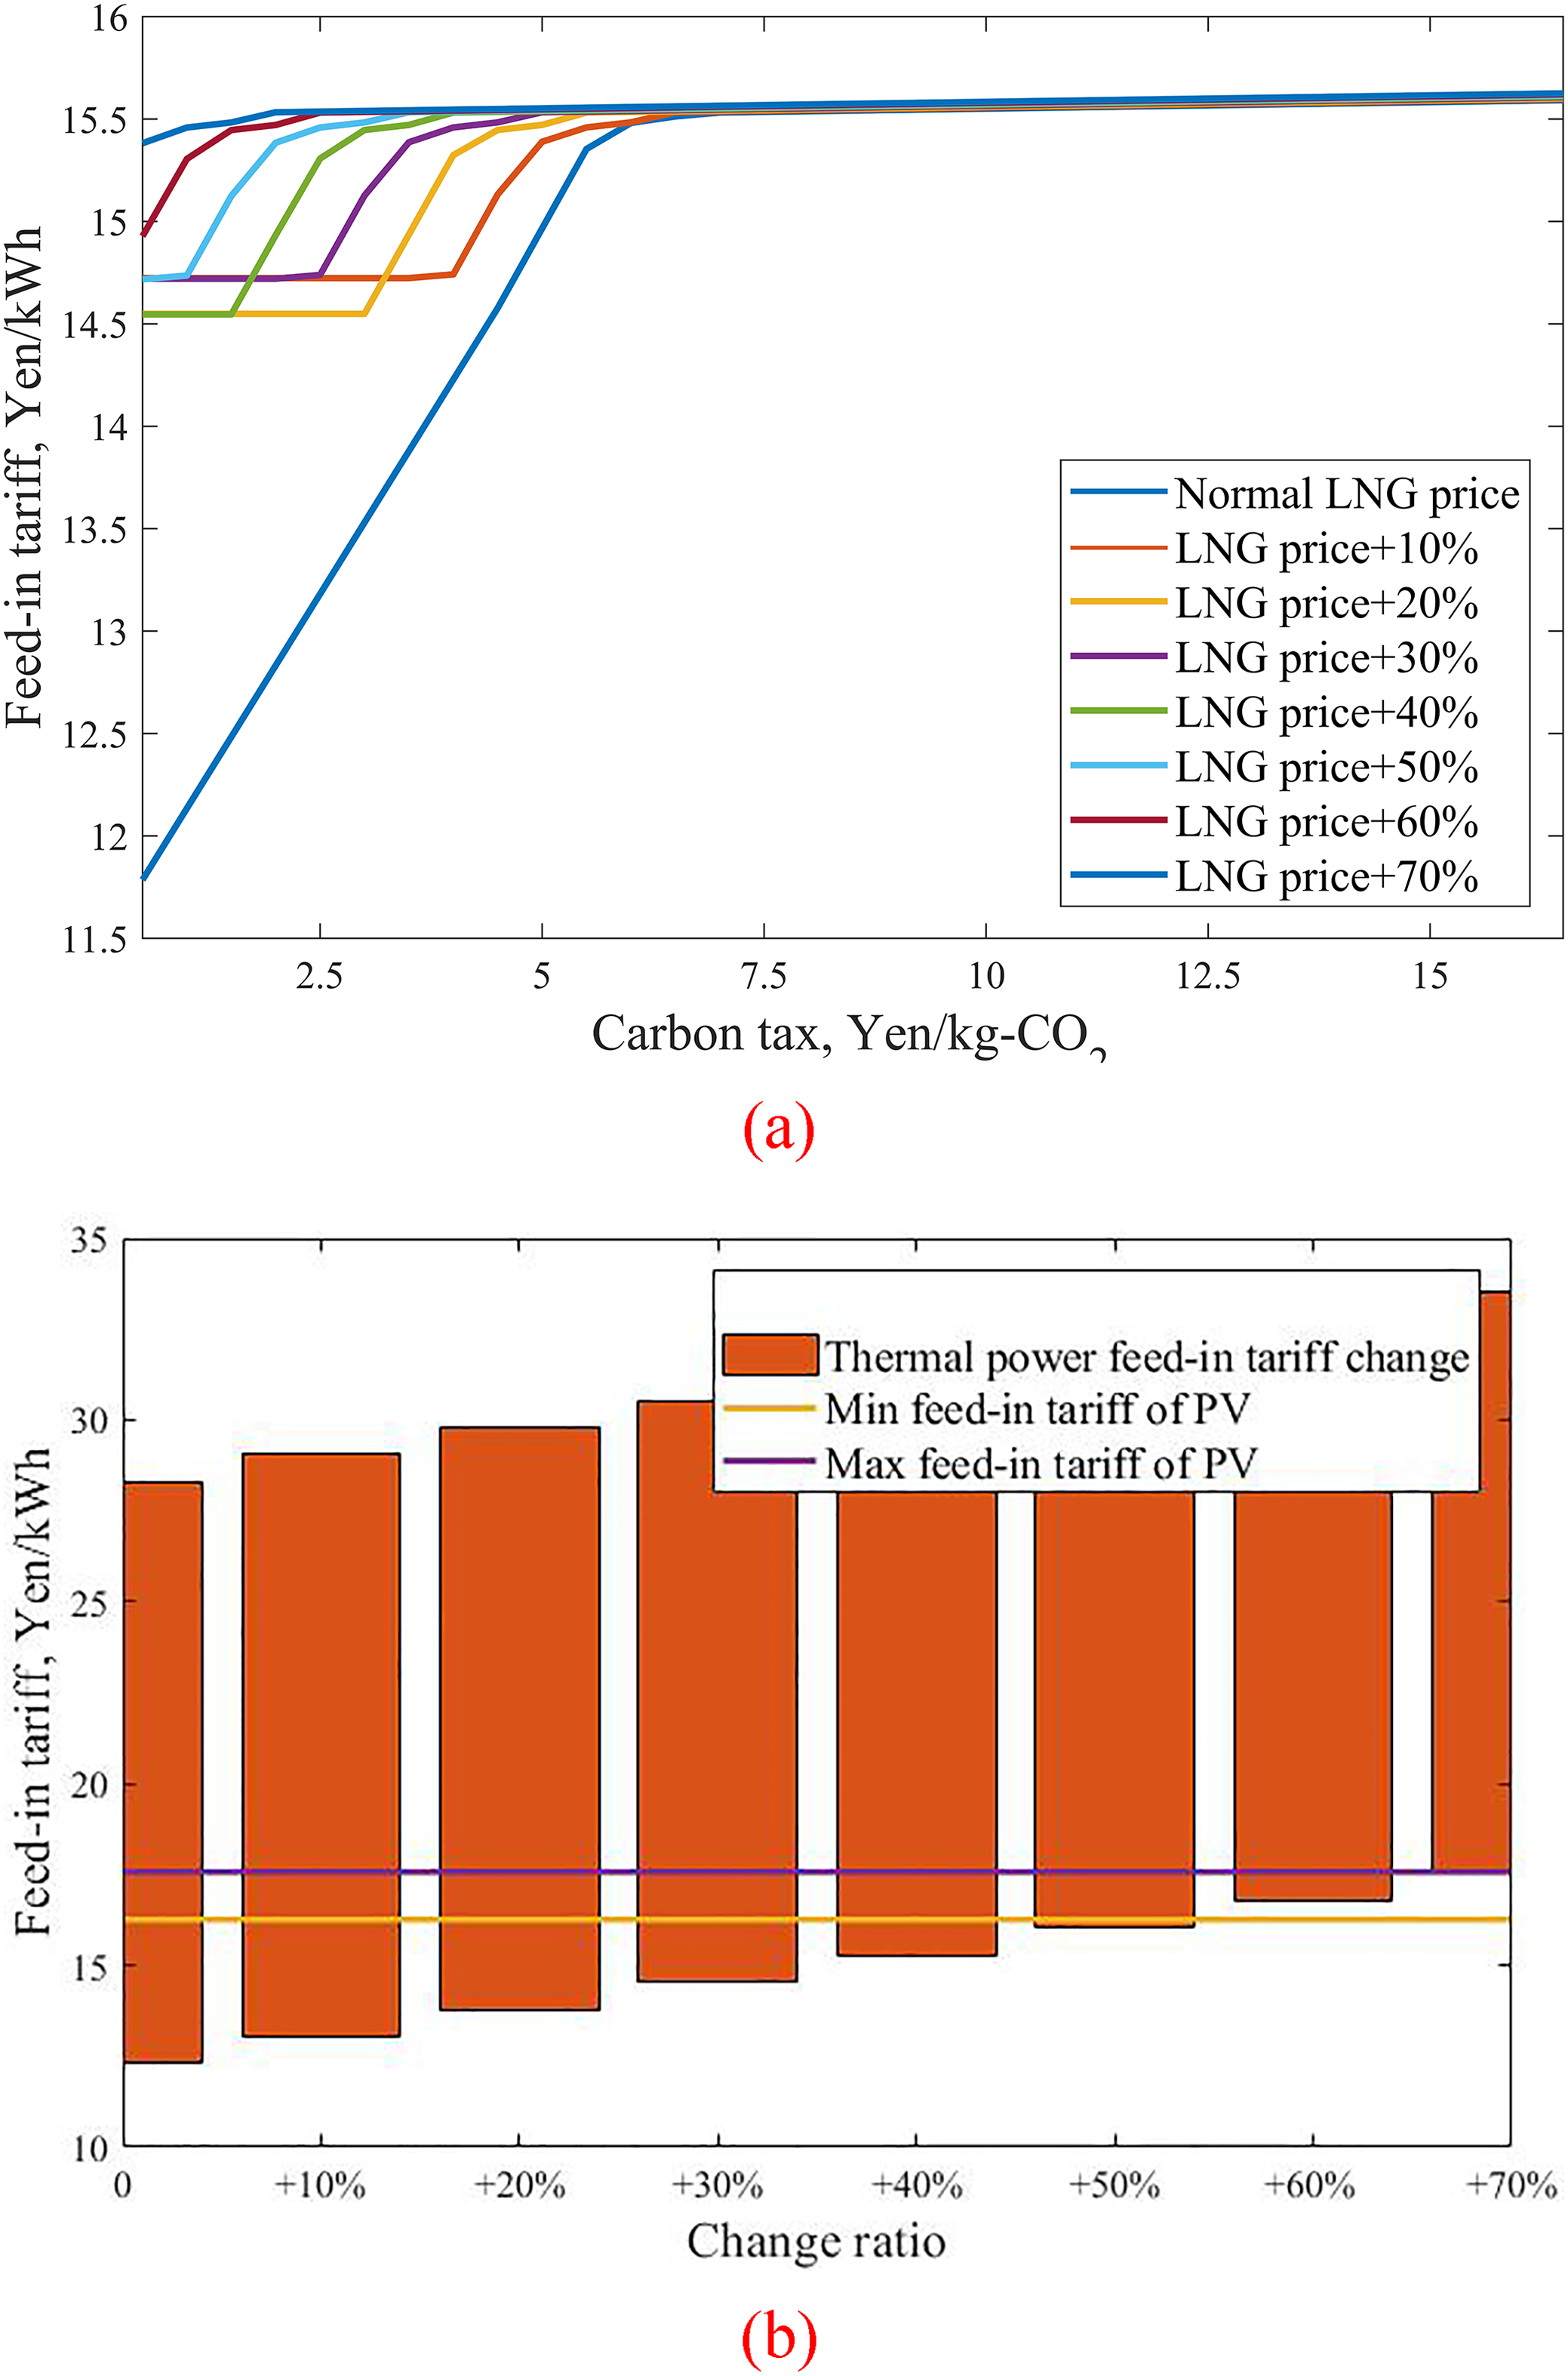
Sensitivity analysis results of LNG price. (a) Lowest weighted feed-in tariff under different carbon taxes. (b) Comparison of feed-in tariff of PV and thermal power.
Compared with coal, LNG price change has a greater impact on the weighted minimum feed-in tariffs. Especially when the LNG price increases by 70%, it can be seen from Figure 11(b) that the feed-in tariffs of thermal power generation at this time has completely exceeded the fluctuation range of the feed-in tariffs of PV. At this time, thermal power generation has completely lost its price advantage. Even with few carbon tax restrictions, thermal power generation will be replaced by renewable power.
Figure 12 and Figure 13 show the comparison of economic sensitivity between PV and wind power generation. Among them, Figures 12(b) and 13 (b) compare the minimum and maximum feed-in tariffs of PV, wind power and thermal power respectively. The data sources of the lowest and highest feed-in tariffs are Figures 3 and 4, respectively. In terms of the sensitivity of PV investment, the change of PV investment has a significant impact on the weighted minimum feed-in tariffs. When the PV investment rises by more than 10% and 20%, the variation range of its feed-in tariffs will exceed that of wind power generation, resulting in a decrease in the contribution of PV to the weighted minimum feed-in tariffs. The replacement of renewable energy for thermal power generation will be dominated by wind power generation. The result of this situation in Figure 12(b) is that the weighted minimum feed-in tariffs curve with PV investment increasing by 10% and 20% is very close.
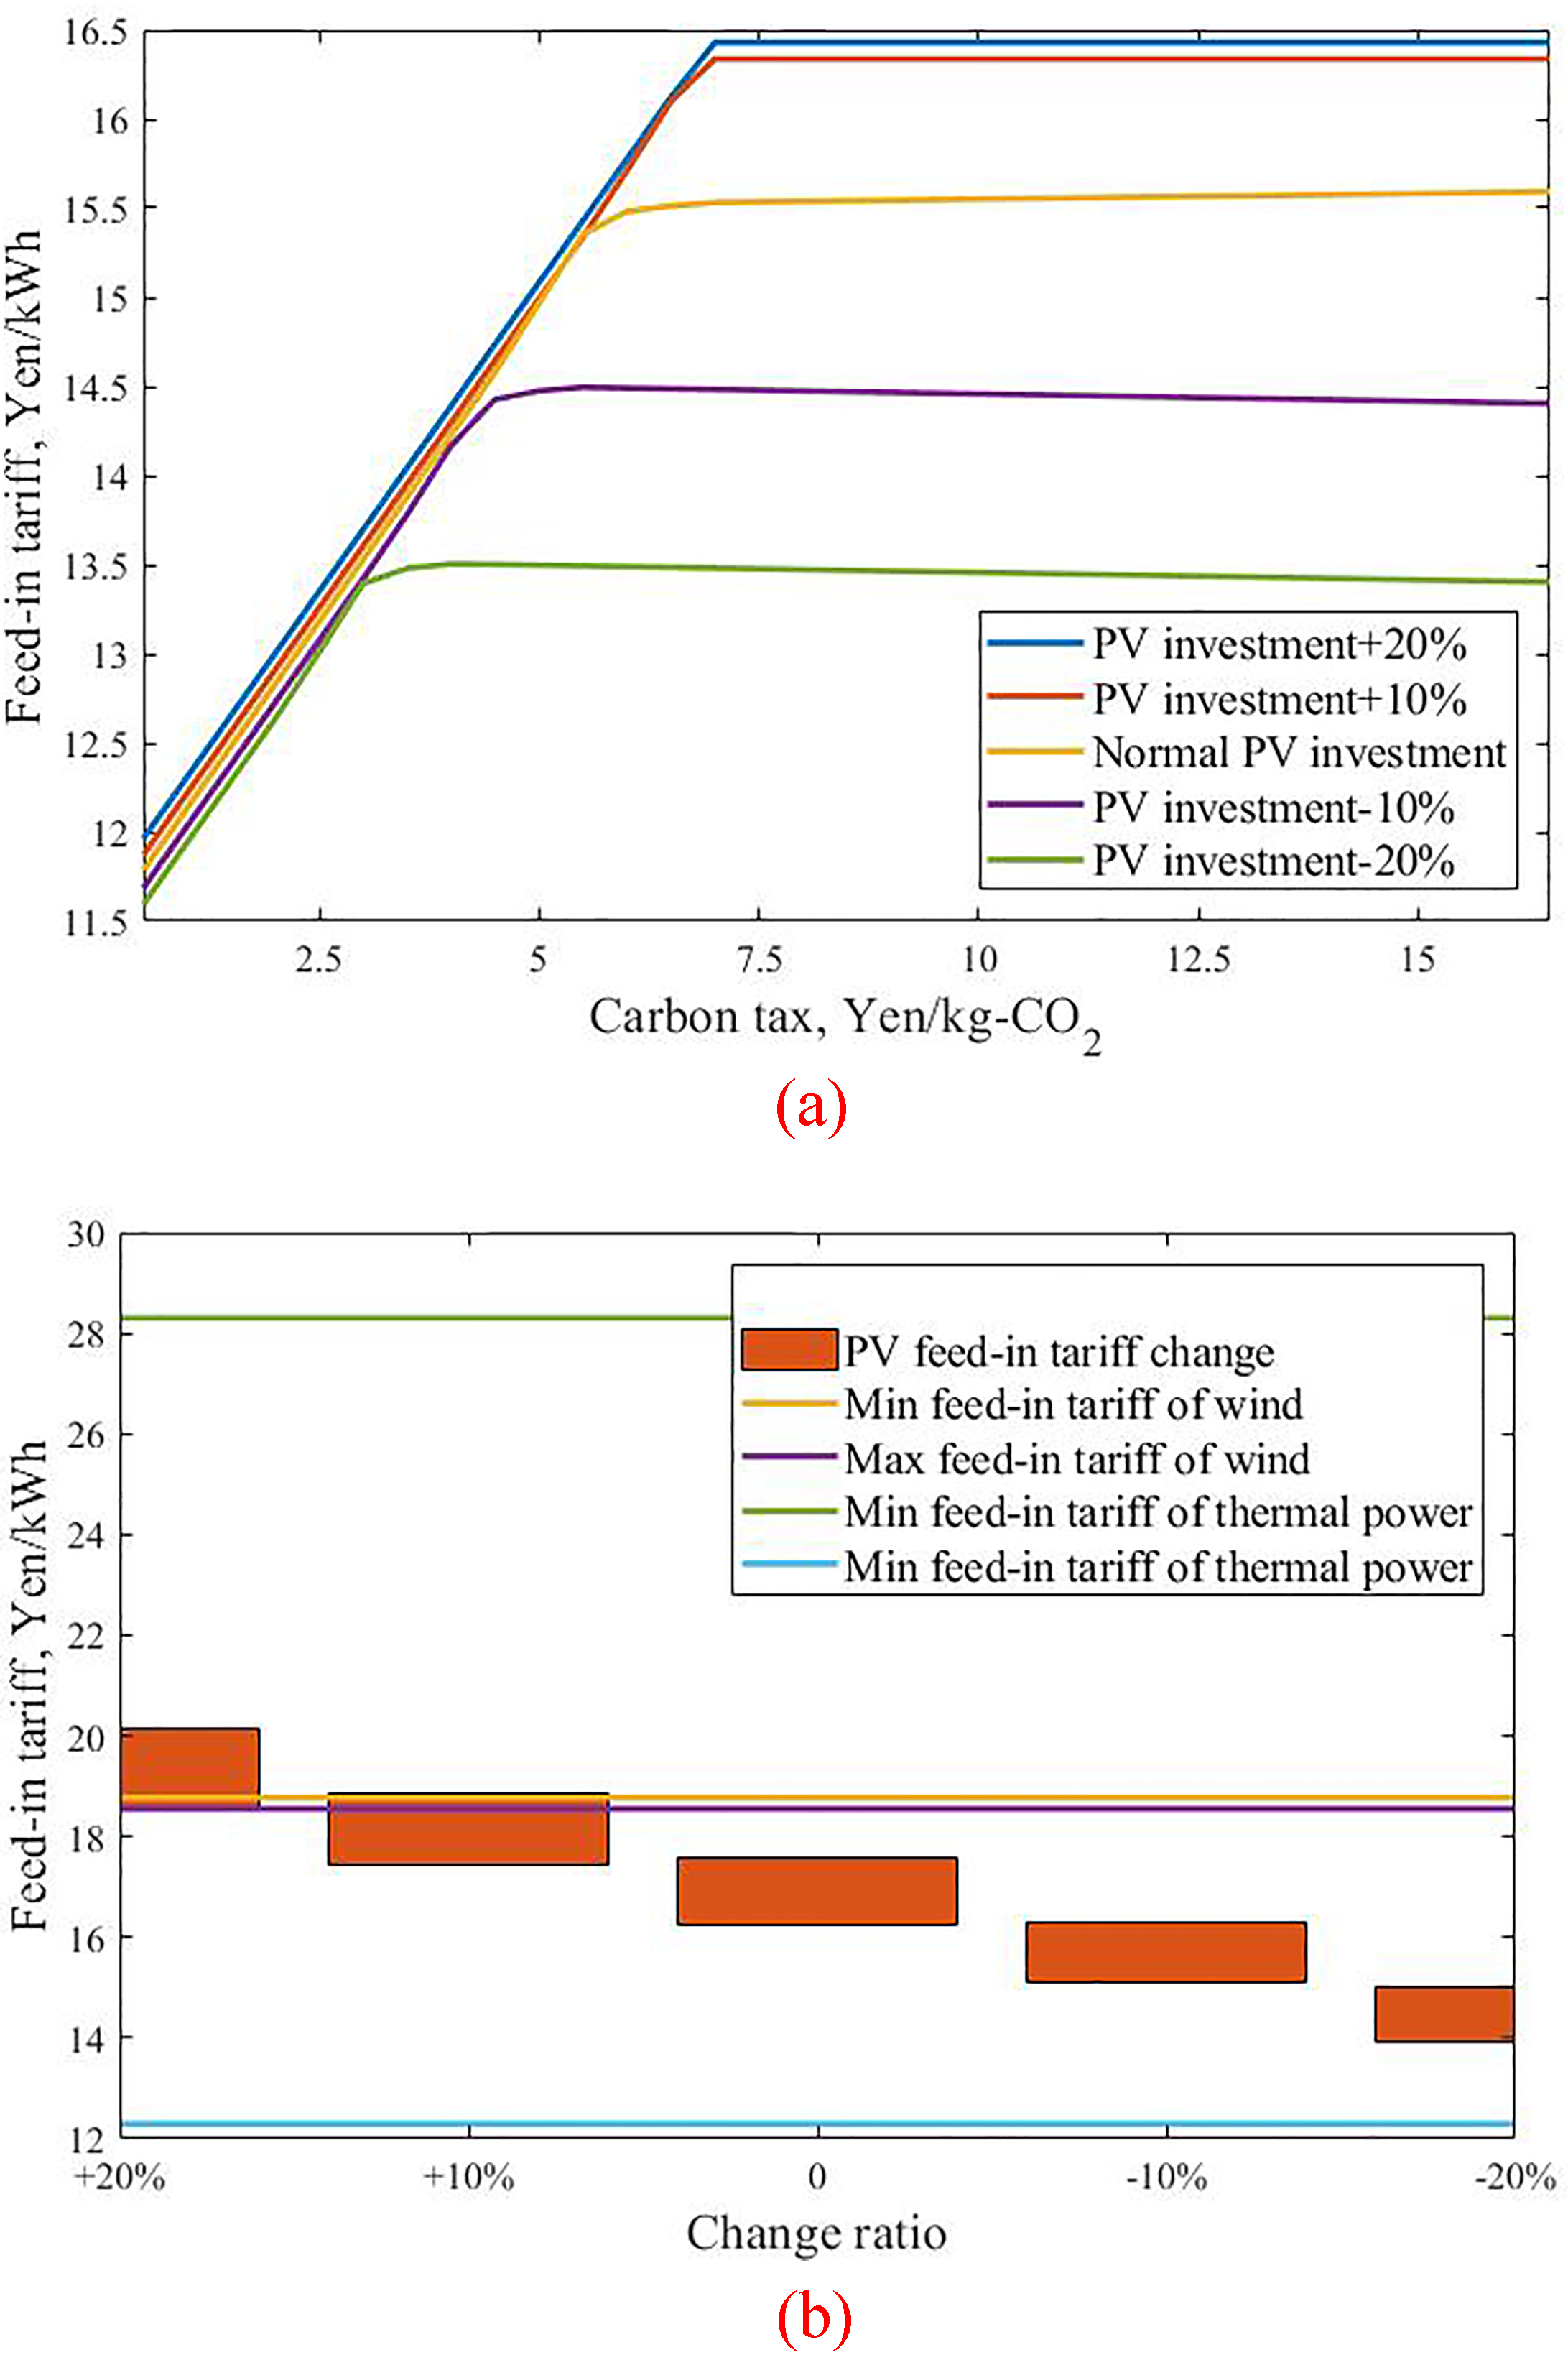
Sensitivity analysis results of PV investment. (a) Lowest weighted feed-in tariff under different carbon taxes. (b) Comparison of feed-in tariff of wind power and PV.
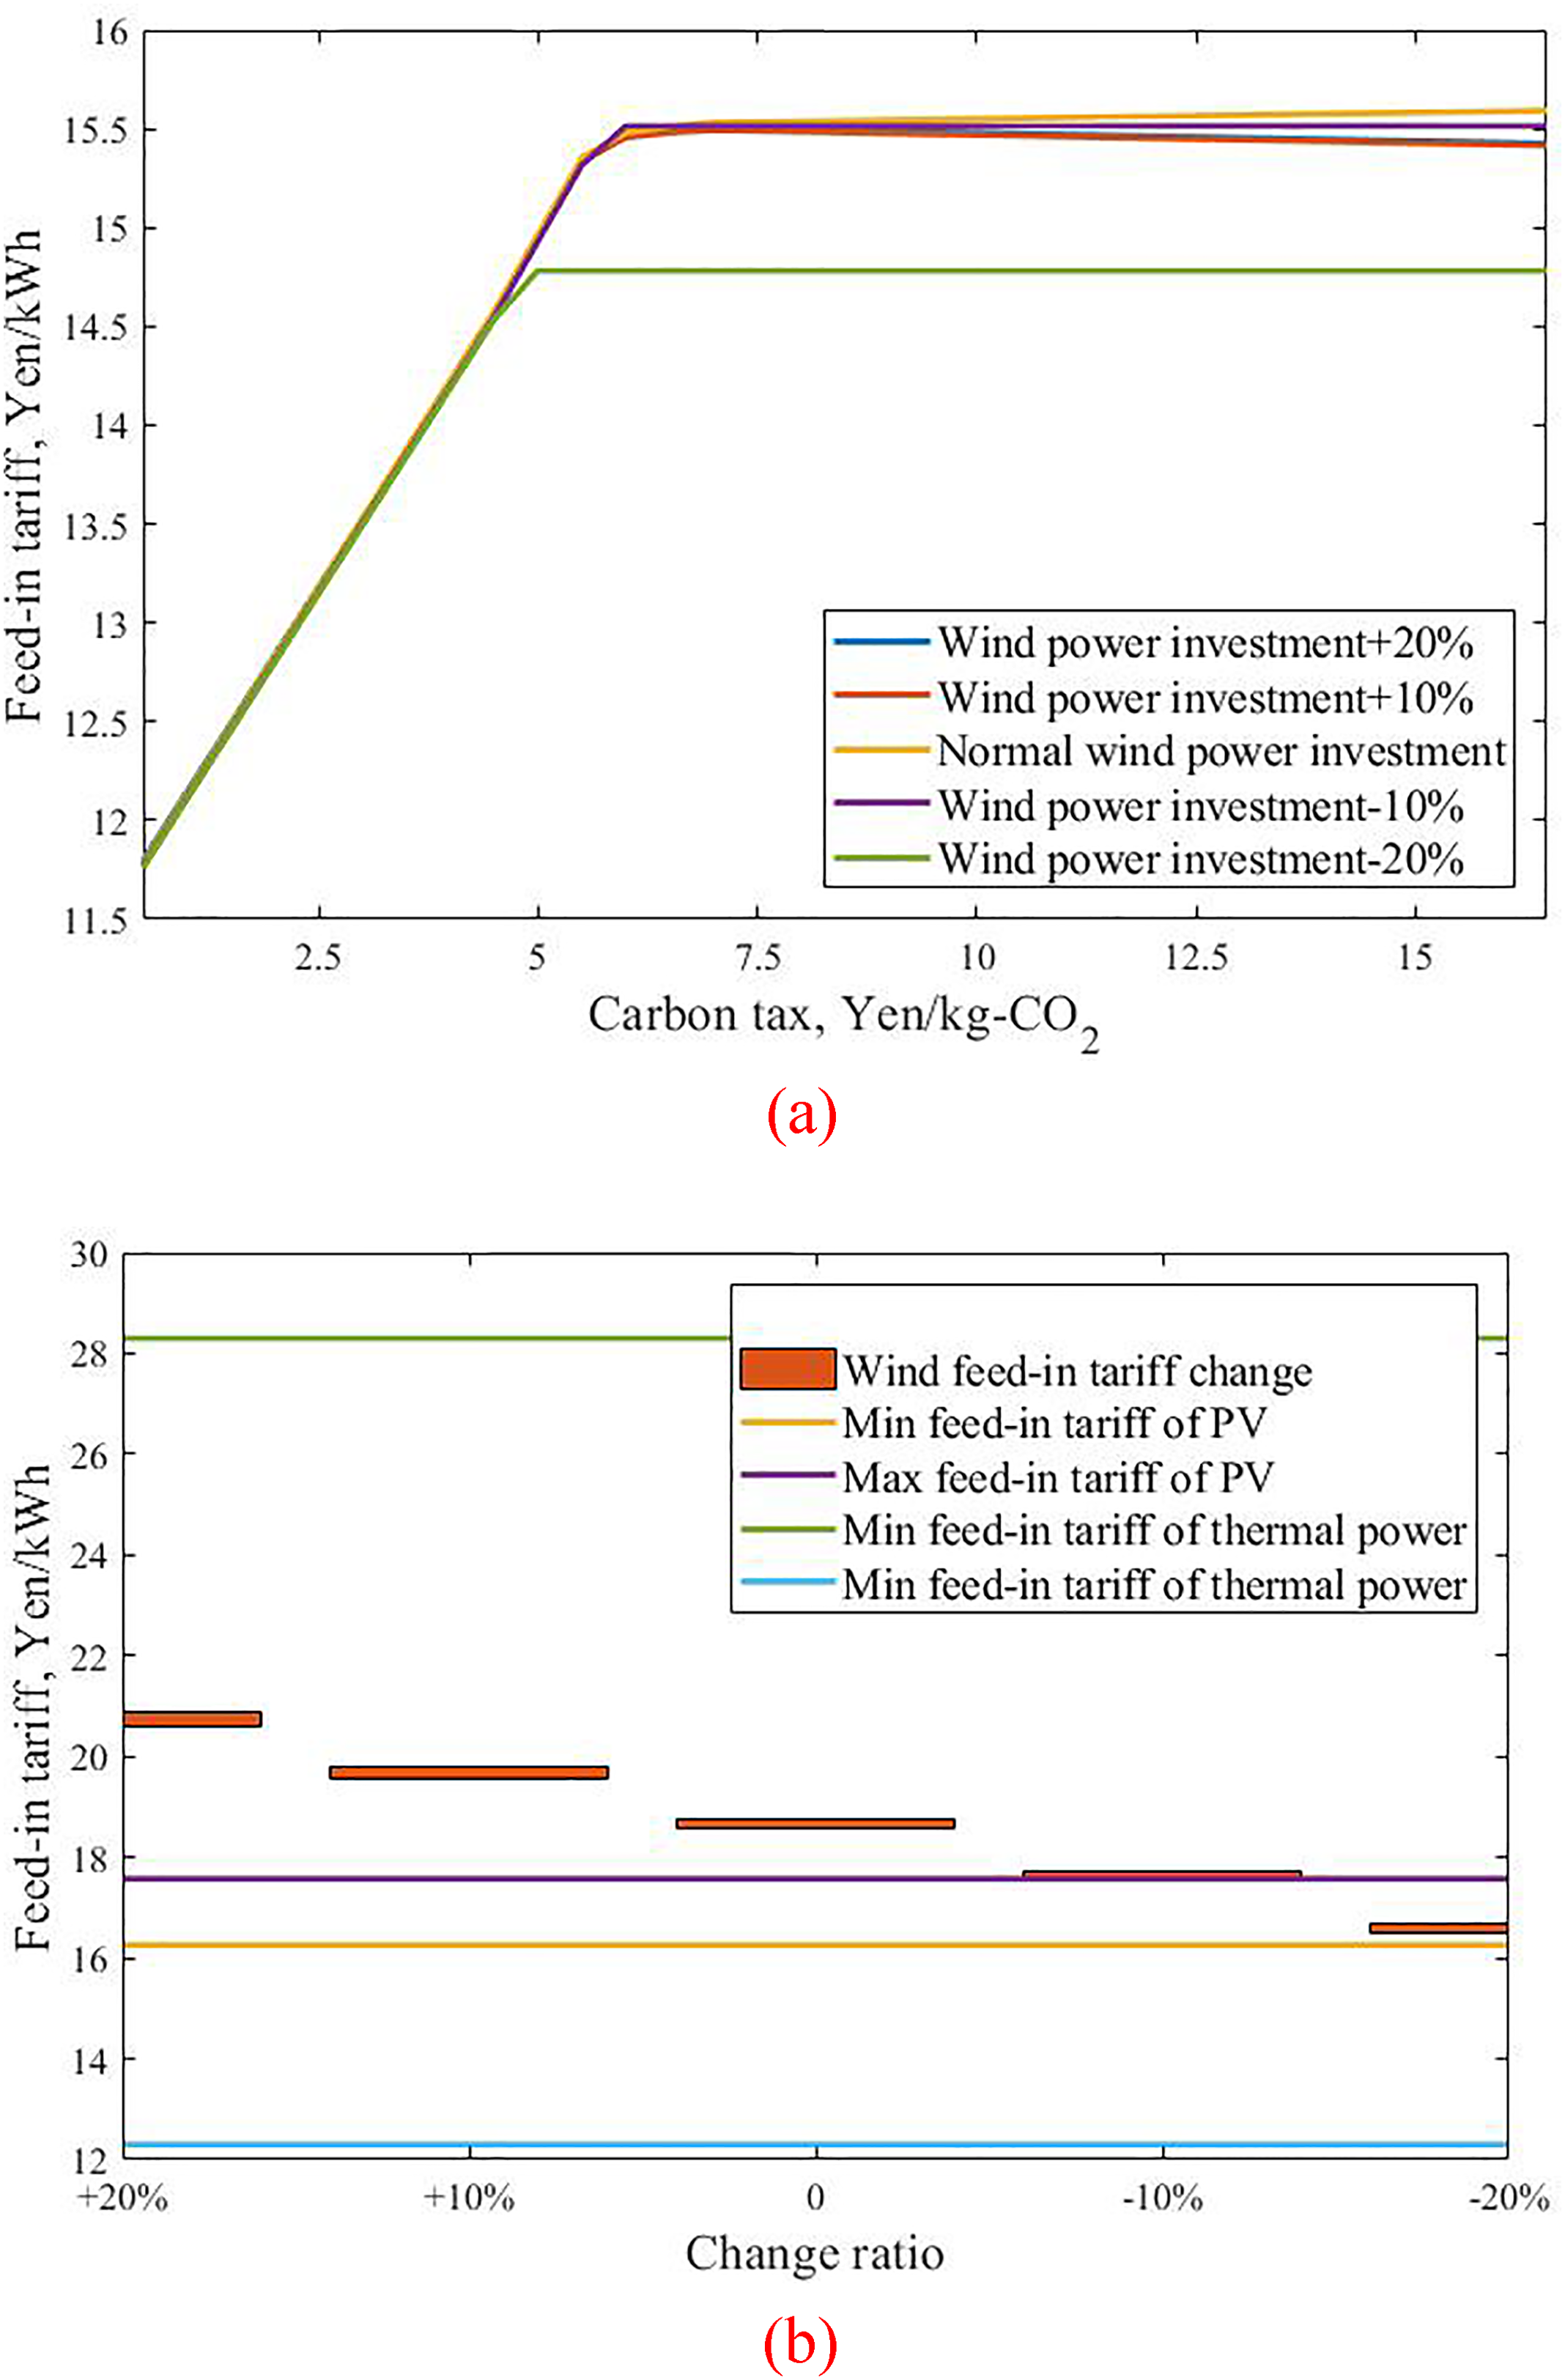
Sensitivity analysis results of wind power investment. (a) Lowest weighted feed-in tariff under different carbon taxes. (b) Comparison of feed-in tariff of PV and wind power.
In terms of the sensitivity of wind power investment, it can be seen from Figure 13(b) that only when the equipment investment is reduced by 20%, compared with PV, can wind power generate economic advantages. As reflected in Figure 13(a), there is no obvious gap between the +20% and −10% change curve of wind power investment. In these cases, the replacement of renewable energy for thermal power generation will be dominated by PV generation.
Figure 14 shows the investment sensitivity analysis of hydrogen storage equipment investment changes. As hydrogen storage equipment has an impact on both PV and wind power generation, Figure 14(b) analyzes the changes feed-in tariffs of PV, wind power and thermal power generation. Compared with PV, the cost reduction of hydrogen storage equipment investment has a more significant impact on wind power generation. Initially, the cost of hydrogen storage equipment decreases, producing positive benefits. However, the continued cost reduction does not introduce more changes mainly because, compared with the equipment cost, the long-term and long-distance storage characteristics of hydrogen storage technology have more obvious effects. This conclusion is also mutually verified with the description in the previous literature review (Tschiggerl et al., 2018).
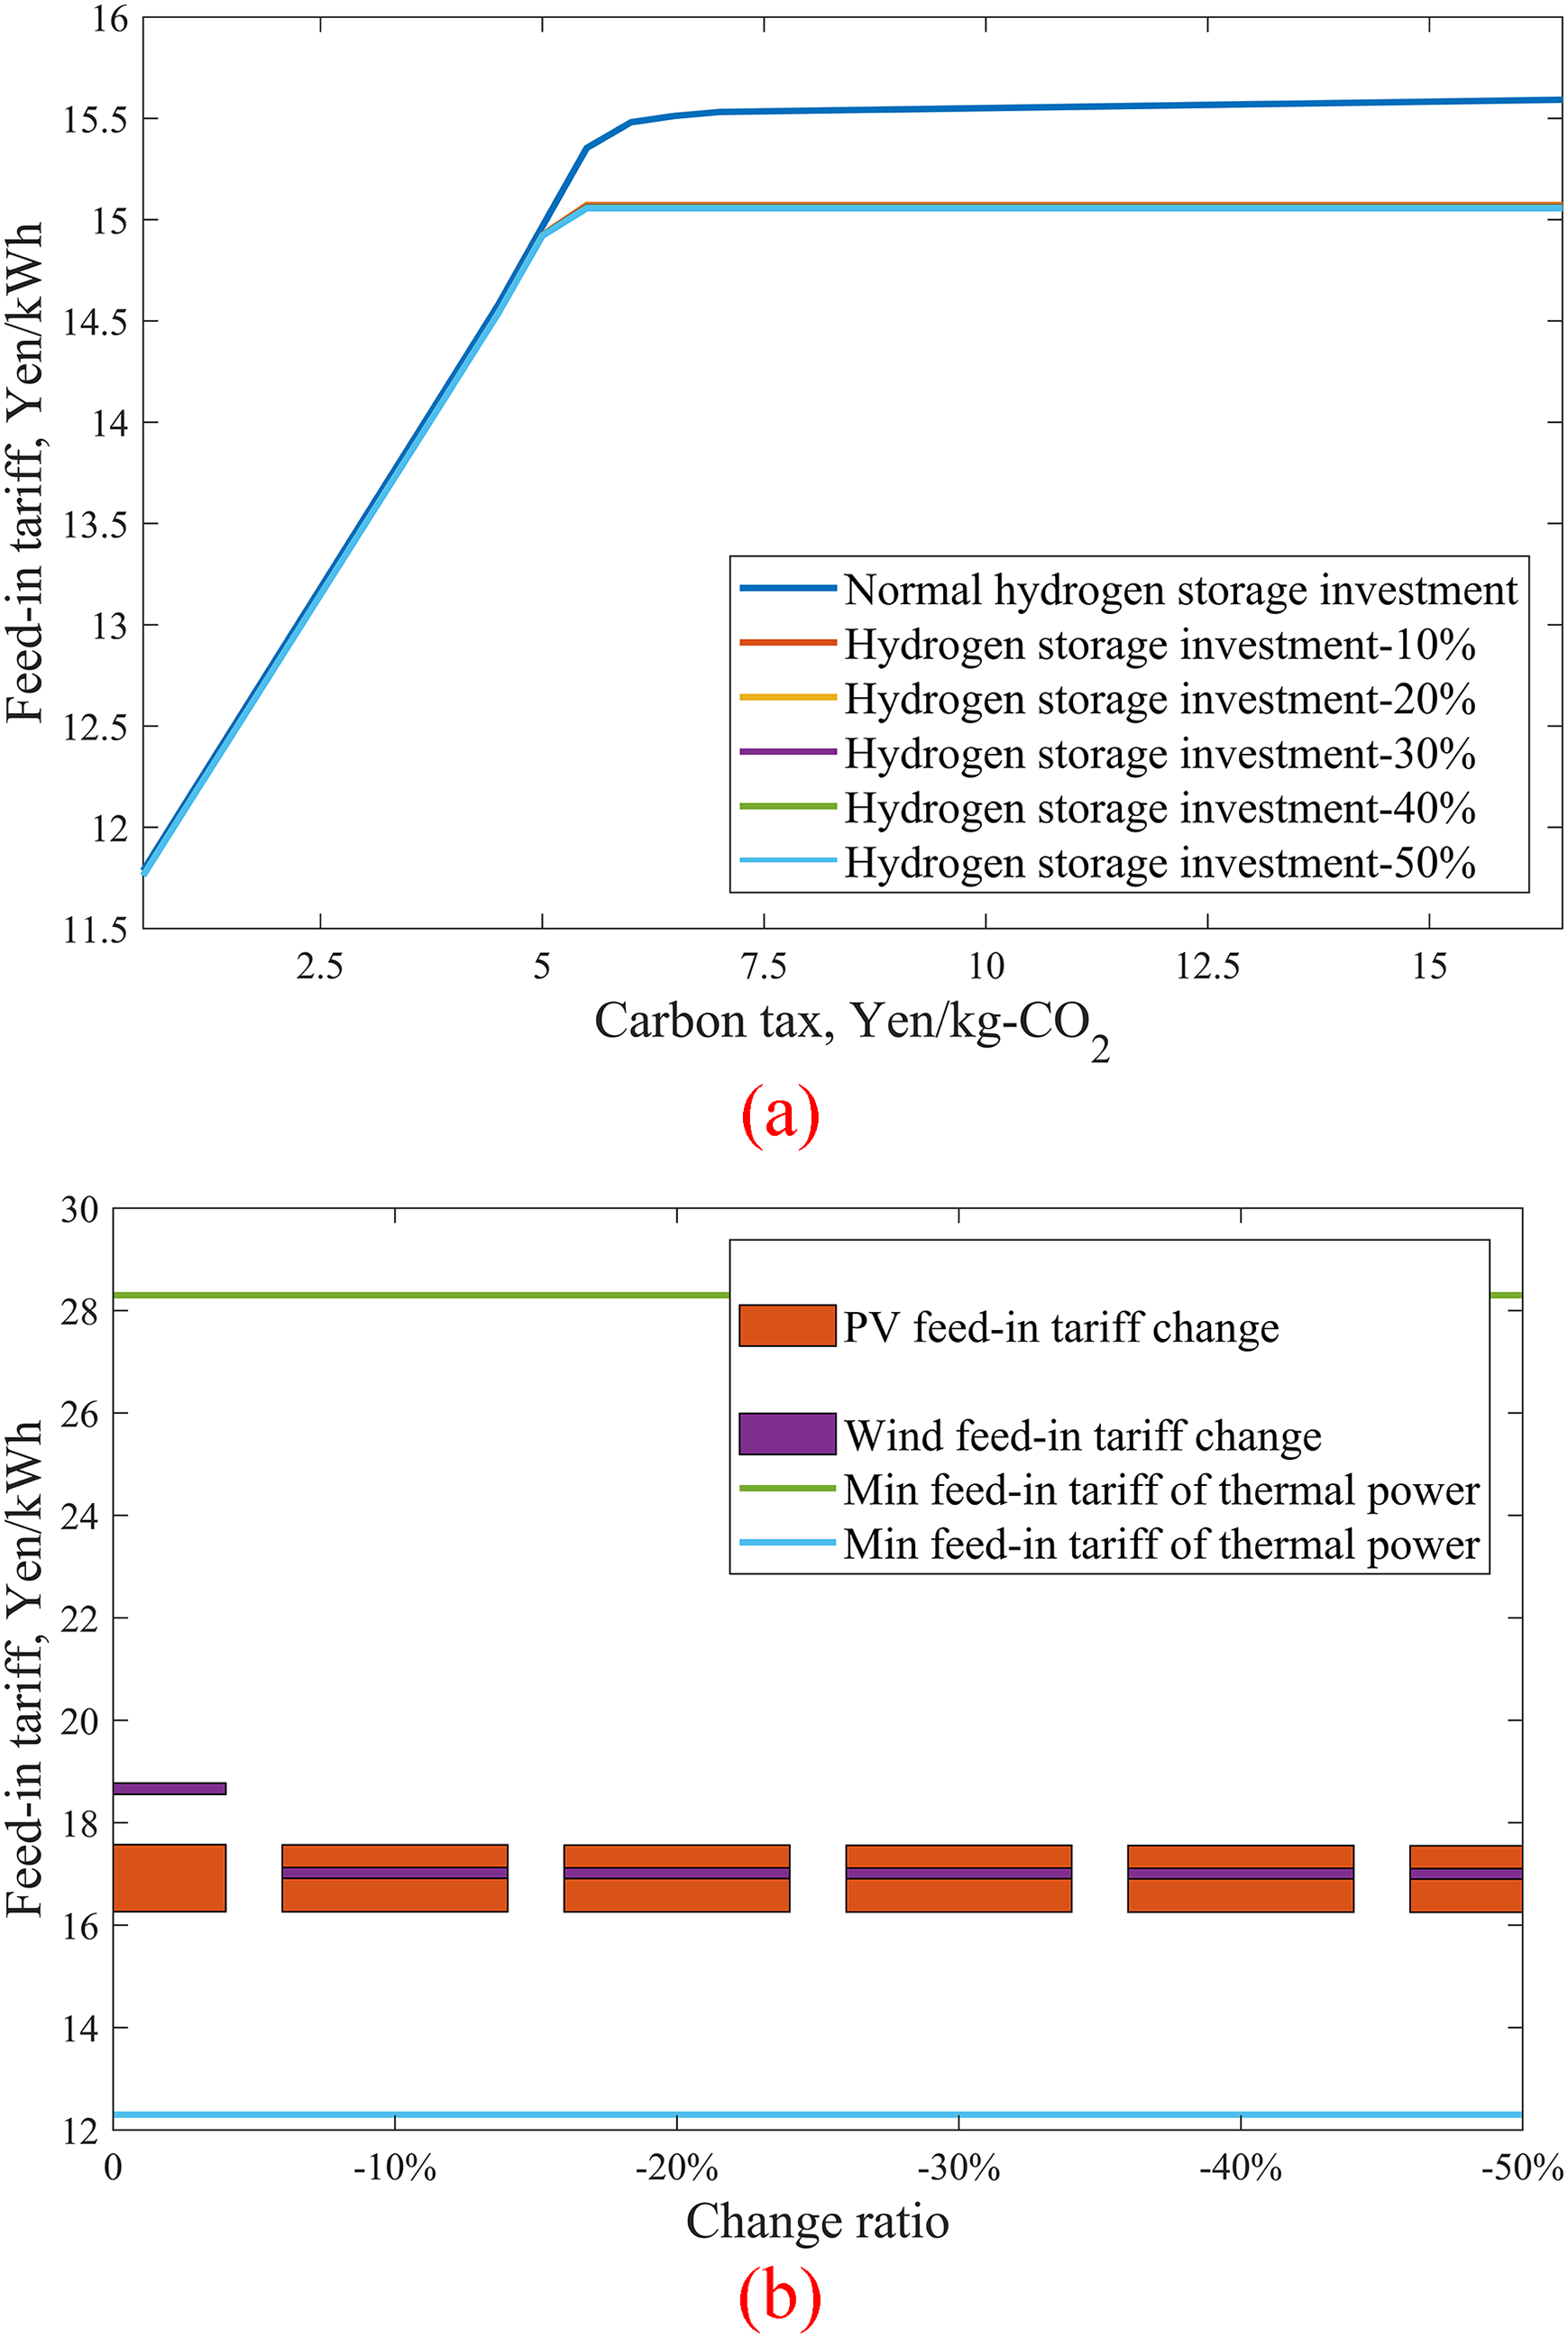
Sensitivity analysis results of hydrogen storage investment. (a) Lowest weighted feed-in tariff under different carbon taxes. (b) Comparison of feed-in tariff of PV and wind power.
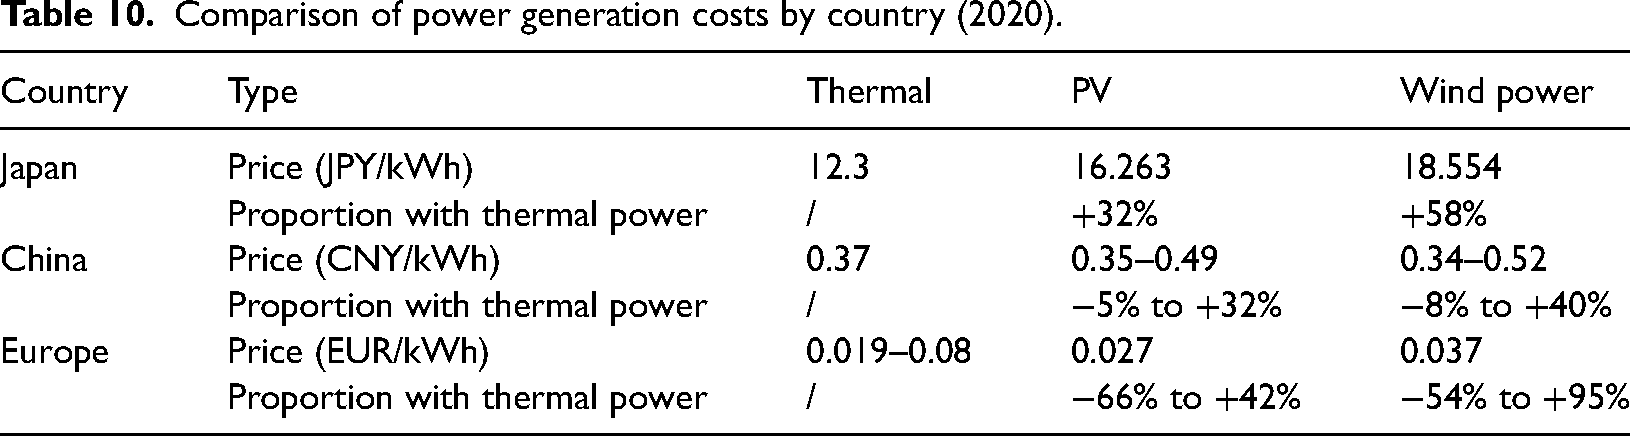
From the perspective of adaptability, there are differences in energy prices and equipment investment costs in different countries. Especially for PV and wind power generation in renewable energy, due to different resource conditions in different regions, the minimum feed-in tariffs of PV and wind power generation are also obviously different. In combination with the statistical data of government departments in various countries, Table 10 shows the comparison of the cost of thermal power, PV and wind power in Japan, China and Europe. Taking China as an example, due to different solar and wind energy resources in different regions, China has divided the minimum feed-in tariffs in different regions. From the perspective of the proportion gap with thermal power generation, the situation of some regions with poor solar energy resources in China is similar to that of Japan. Carbon tax and hydrogen storage technology will obviously help in large-scale promotion of renewable power in such regions. In some regions with good resource conditions, the minimum feed-in tariffs of PV and wind power generation is lower than that of thermal power generation. In such regions, renewable power will develop at a high speed in the initial promotion. However, combined with the analysis results in Figure 3, after the increase of renewable energy penetration rate, a large amount of additional investment in energy-storage facilities is required to absorb excess power. At this time, carbon tax and hydrogen storage technology can still have a positive effect.
Comparison of power generation costs by country (2020).
The price of fossil-fuel energy is affected by various factors and has experienced many sharp rises and falls in the past decade. This volatility has also led to a gradual increase in the world's attention to renewable energy, hydrogen energy, and carbon taxes. From the comparison of the overall sensitivity results, the changes in energy prices and equipment costs are all in the direction of a higher proportion of renewable energy. Therefore, in the next 20 years, even if the government does not set a high carbon tax for various reasons to limit carbon emissions, with the cost reduction from developing renewable energy and hydrogen energy technology, it is possible to realize the complete replacement of thermal power generation by relying on the existing carbon tax level.
Effect on the energy structure and carbon emission
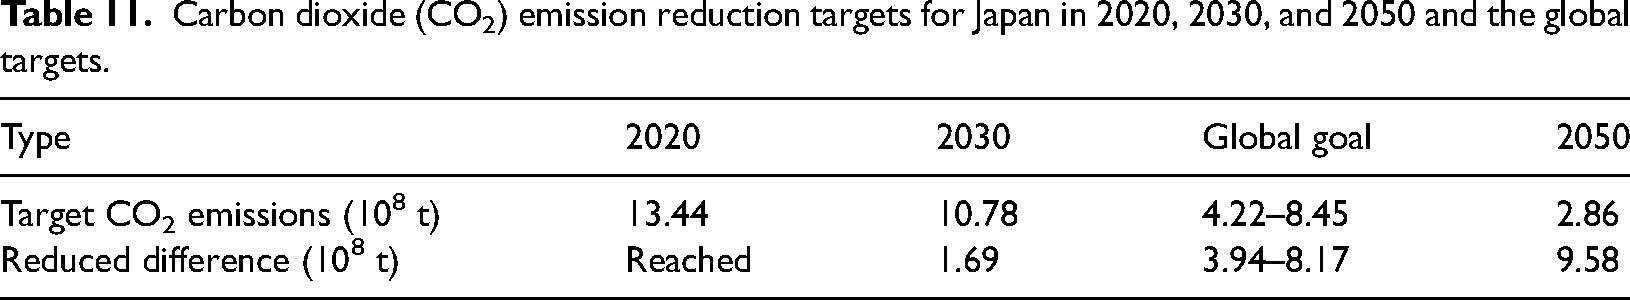
The results in Figures 15 and 16 are obtained by combining the statistical data published by the Japanese government to deeply analyze the effects on Japan's primary energy structure and overall carbon emissions. Table 11 compares the CO2 emission reduction targets for Japan and the world. Finally, in the primary energy structure, the proportion of renewable energy will reach 60%, and the CO2 reduction will exceed the target of 2030 and reach 45% of the target of 2050. In this process, the main force of emission reduction is renewable power. However, hydrogen storage technology and carbon tax can help renewable power generate economic advantages and achieve emission reduction effects earlier. This study only examines hydrogen storage technology and carbon taxes from the energy supply side. The promotion of hydrogen energy and carbon taxes can also be conducted on the demand side. Therefore, it is expected that the effects achieved by these two technologies would be more obvious.
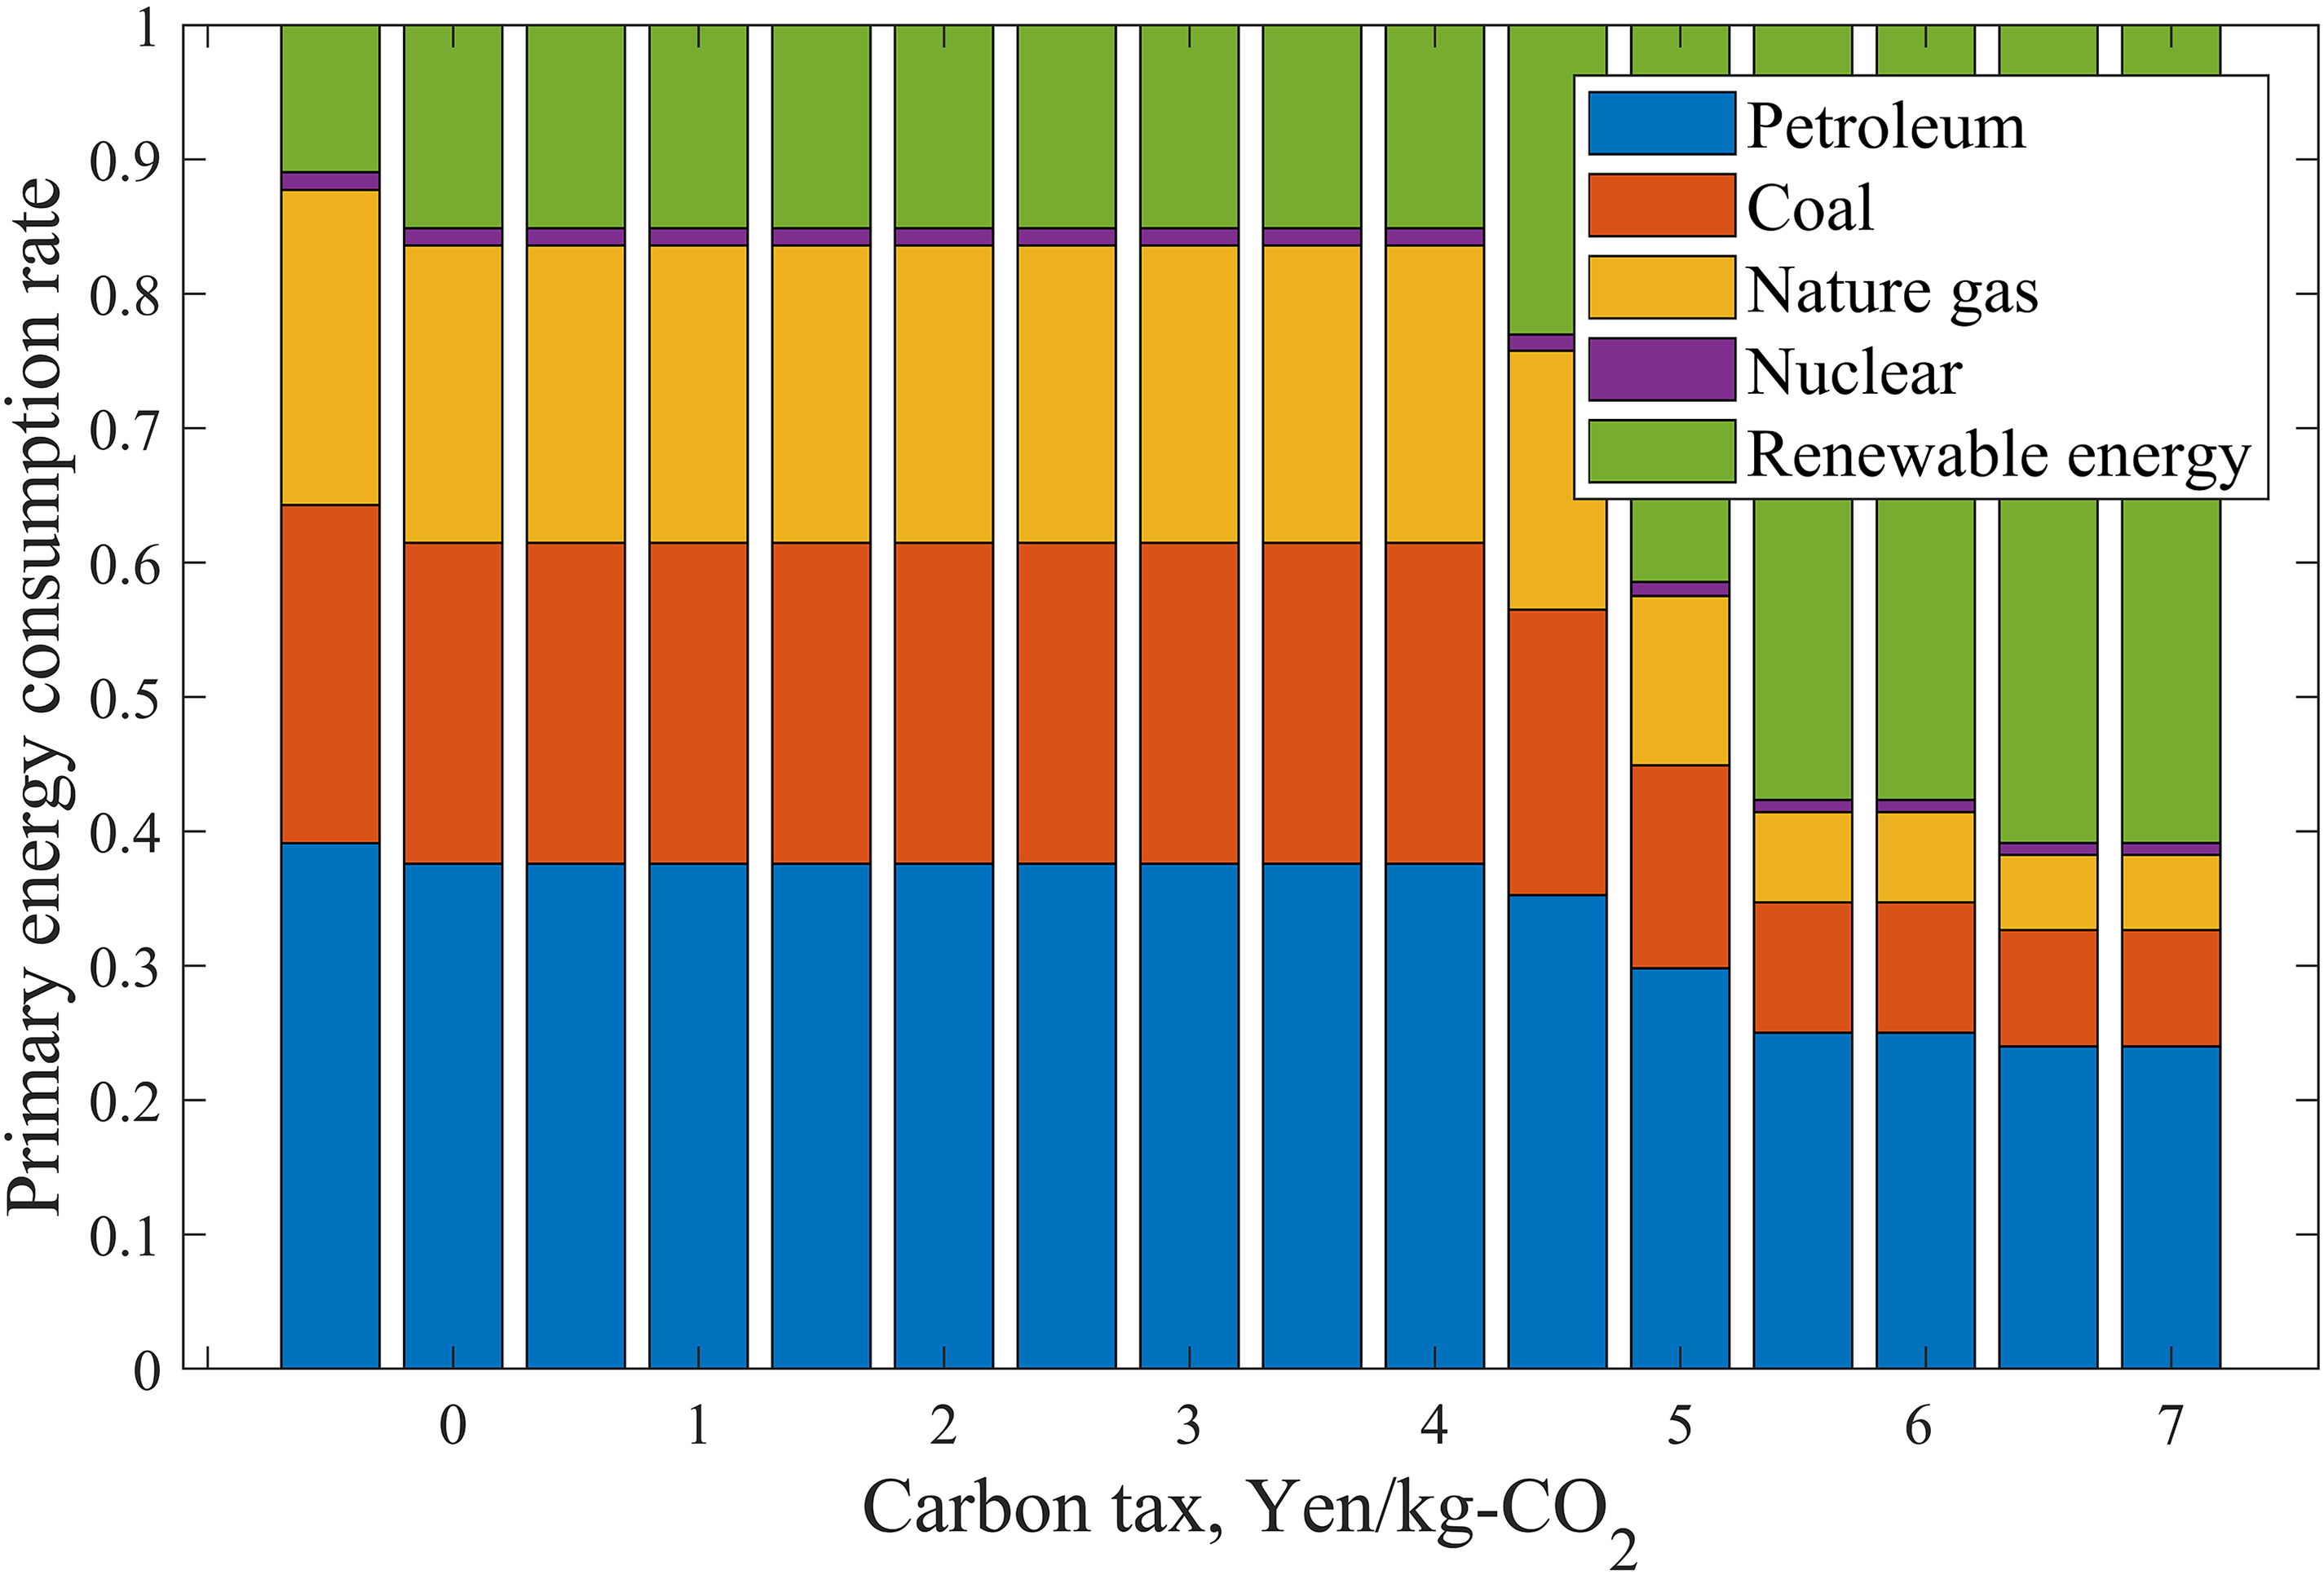
Influence of the research results on the primary energy structure.
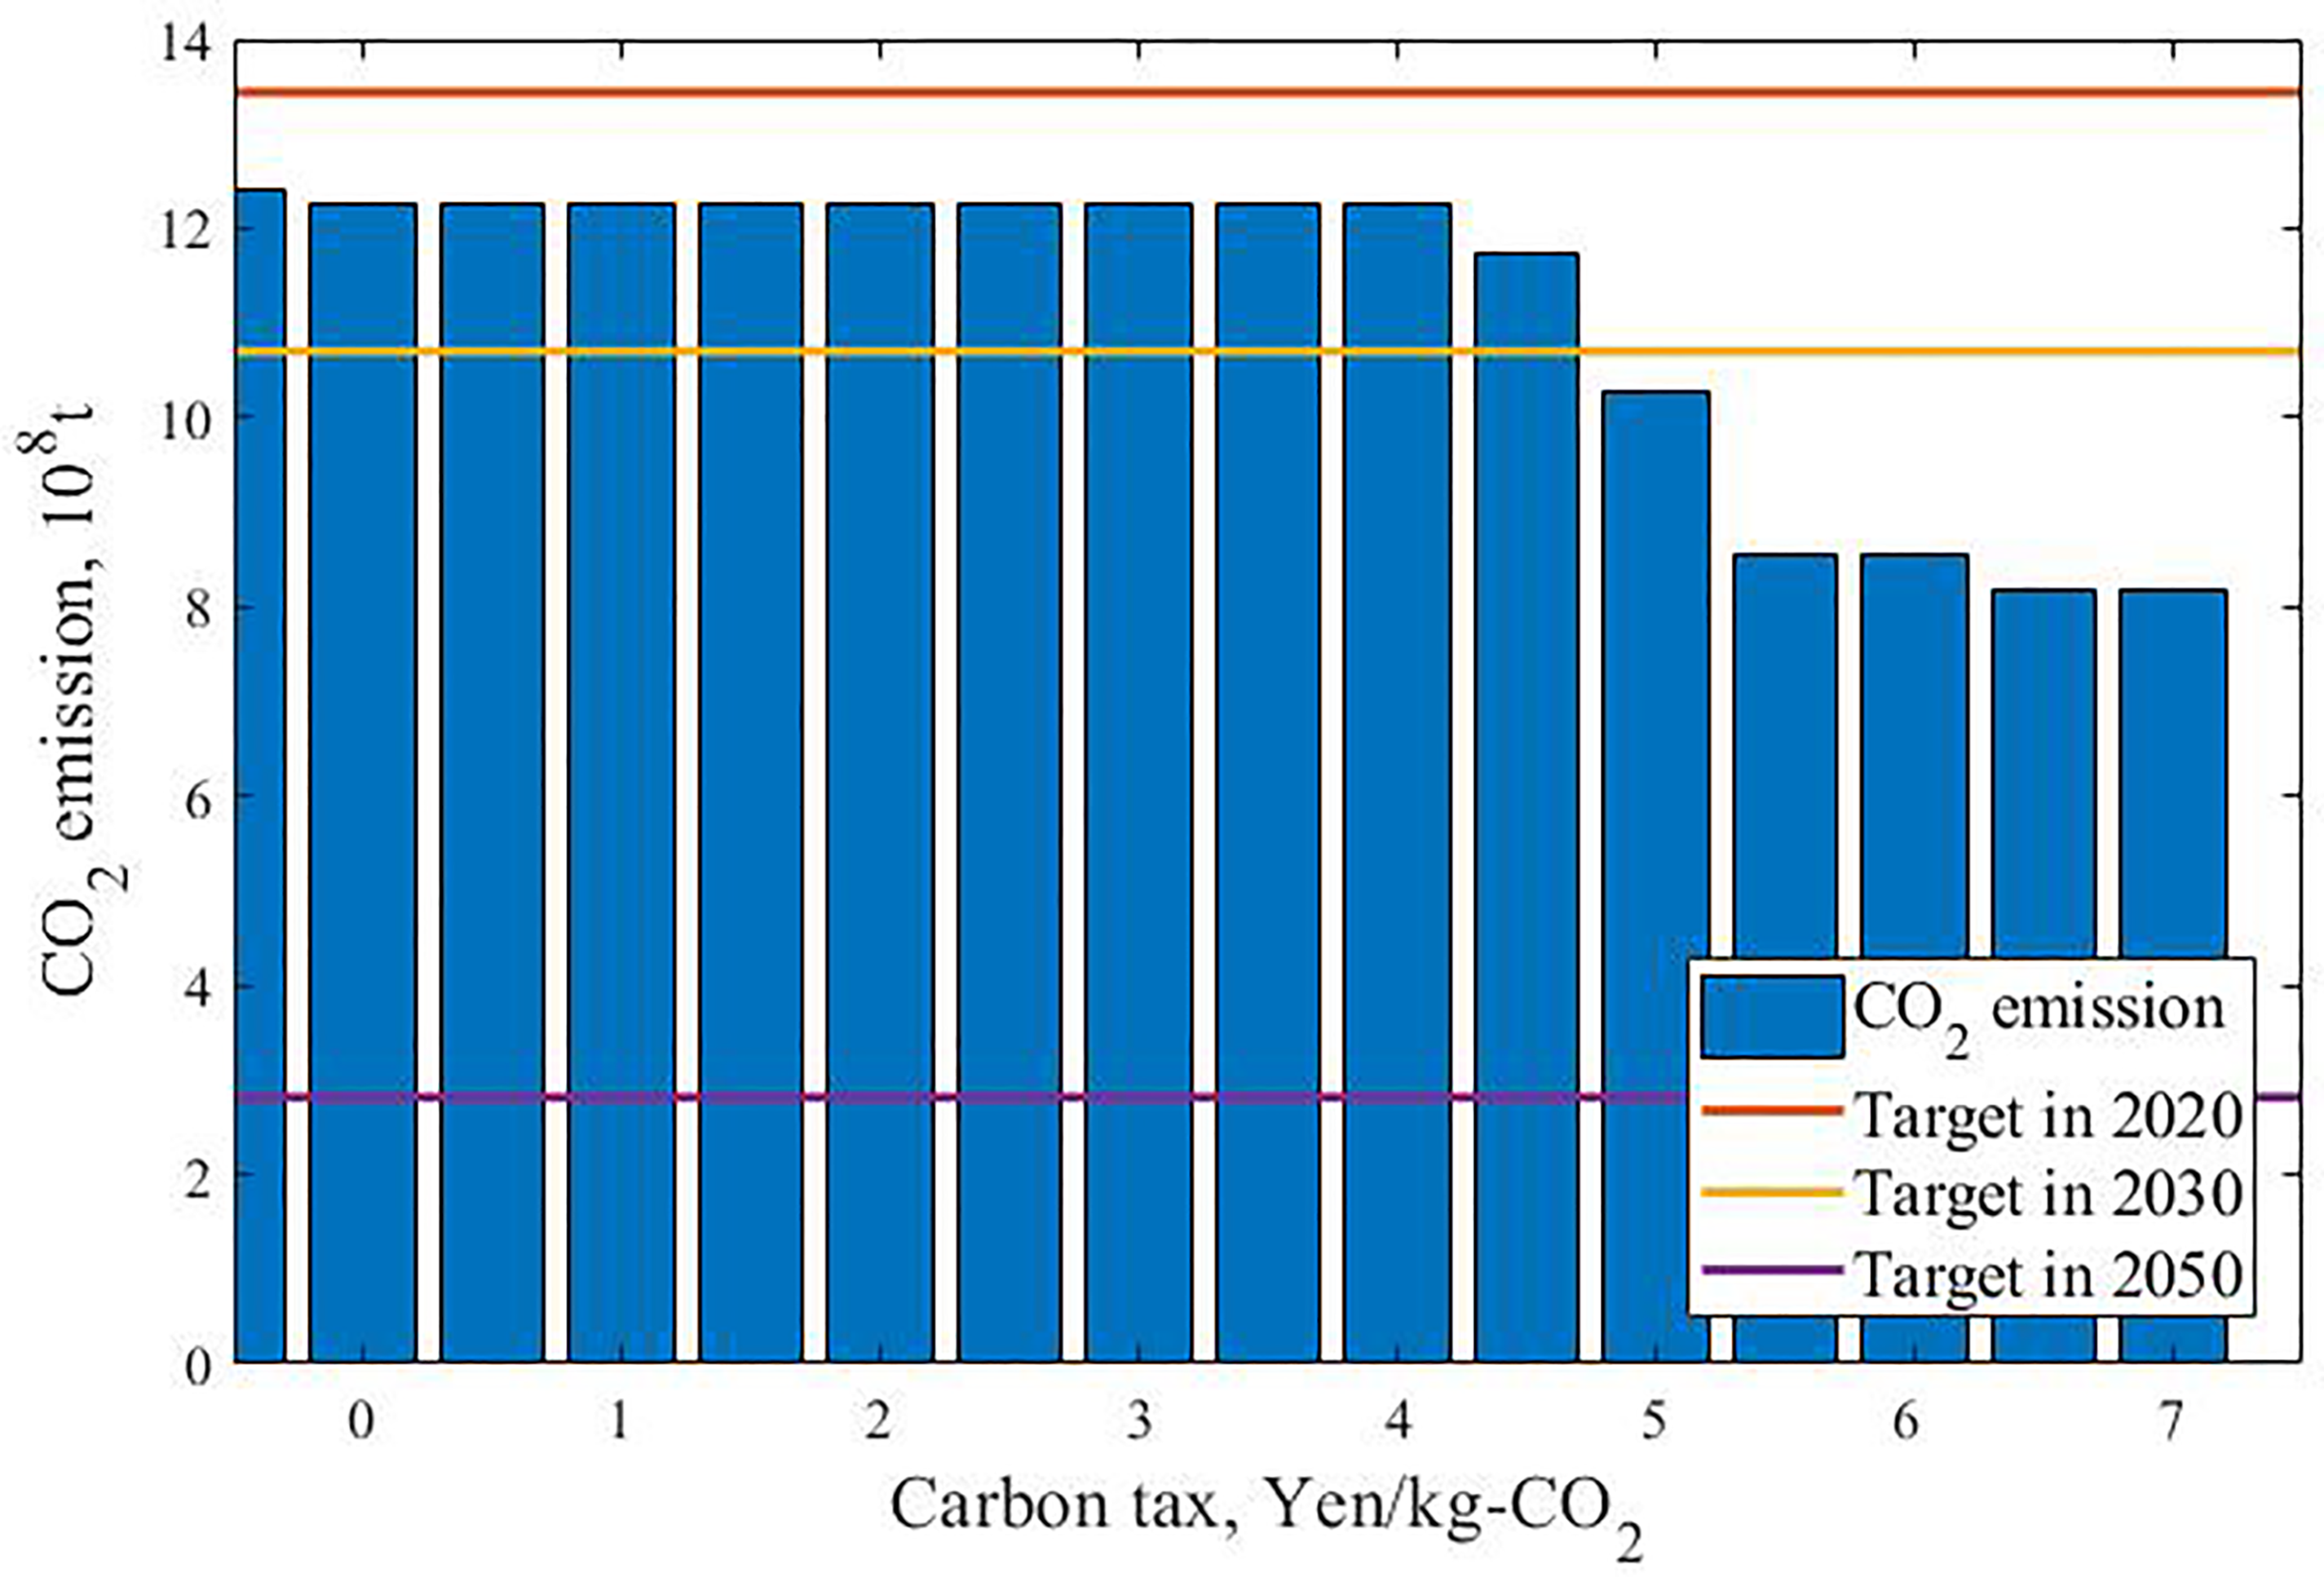
Comparison of the emission reduction effects of the research results and Japan's planned targets.
Carbon dioxide (CO2) emission reduction targets for Japan in 2020, 2030, and 2050 and the global targets.
Conclusion
Hydrogen storage technology can effectively realize the long-term storage and long-distance transmission of renewable power and a high proportion of renewable power in the power grid. However, the high equipment cost hinders the development of this technology. This study proposed highlighting the environmental advantages of renewable power through a carbon tax to allow space for the large-scale application of hydrogen storage technology. This study analyzed the economic effects of different renewable energy and energy-storage technologies. Combined with the operational data from Japan's top 10 power companies, the influence of a carbon tax on the power structure was analyzed, and the application effects of hydrogen storage technology in this process were studied. The main conclusions of this study are as follows:
A carbon tax of more than 8 JPY/kg-CO2 can provide clear price advantages for renewable power and promote the complete replacement of coal- and gas-fired power plants. When the characteristics of long-distance transportation of hydrogen energy are fully applied, this carbon tax price demand is reduced to 5 to 6 JPY/kg-CO2, close to the current average carbon tax level. The economic benefit of hydrogen storage technology is lower than that of PHS. However, compared with PHS, the application of hydrogen storage technology can make renewable power generate price advantages earlier. From the perspective of CO2 emission reduction, hydrogen storage technology is most worthy of promotion. The price of LNG and cost of PV equipment significantly influence the research results. When the price of LNG increases by 60% or the cost of PV equipment decreases by 20%, renewable power and hydrogen storage technology would be well promoted even if they do not rely on a carbon tax. The price advantage of renewable power will help renewable energy break through the limit of 15% and eventually reach 60%, achieving 45% of Japan's 2050 emission reduction target. The carbon tax limit of 6 JPY/kg-CO2 obtained at this time is the economic quantification of the environmental advantages of renewable energy and can be used as a quantitative reference for financial support policies for other renewable energy and hydrogen storage technologies.
This study analyzed the influence of hydrogen storage technology and a carbon tax on the power structure based on data from Japanese power companies. The conclusions have a high reference value for countries and regions with a similar power structure. Especially for regions where solar and wind energy resources are not excellent but where large-scale development of renewable power is planned. However, in some regions with good solar and wind energy resources, the cost of renewable electricity is lower than that of thermal power generation. The results of this study can only be used as a theoretical support for these regions after introducing a high proportion of renewable energy. At the same time, the battery is not suitable for large-scale power storage; thus, the application effect of this technology is not considered in the comparative analysis of the power structure. Moreover, there is no specific comparative analysis of other mechanical and chemical energy-storage technologies, leaving room for further improvement.
Footnotes
Acknowledgements
This paper is supported by Shanghai Science and Technology Development Foundation, NO. 21DZ1208803.
Declaration of conflicting interests
The author(s) declared no potential conflicts of interest with respect to the research, authorship, and/or publication of this article.
Funding
The author(s) disclosed receipt of the following financial support for the research, authorship, and/or publication of this article: This work was supported by the Shanghai Science and Technology Development Foundation, (grant number NO. 21DZ1208803).