
Abstract
Accurate prediction of spatial distribution of petroleum resources is important for petroleum exploration. Mahalanobis distance is a popular and effective method to predict the spatial distribution of oil and gas. However, this method has equal weights for each variable, exaggerates secondary variables, and is prone to misjudge when the distance is close or equal, which impairs the accuracy of classification. To solve these problems, this paper proposes a novel Mahalanobis distance method based on genetic algorithm (GA-MD) to optimize attribute weights. The Sangonghe Formation in the hinterland of the Junggar Basin was used as an example, the validity of GA-MD was evaluated in the exploratory well data set. Compared with the current mainstream methods, the results show that the accuracy of GA-MD method is the highest, and the accuracy is improved by 2–6.2%. The application effect of the proposed method is verified by the prediction result of oil and gas probability map, the GA-MD method not only shows higher oil and gas bearing probability in the reserve areas but also has better trend extrapolation ability compared with other methods. Based on the GA-MD results, the favorable zones with remaining petroleum resources in the Sangonghe Formation in the hinterland of the Junggar Basin were visualized. Three types of favorable oil and gas distribution areas are selected. The favorable areas provide a basis for quantitative decision-making for the optimization of the next drilling strategy and determination of oil and gas exploration deployment direction in the study area.
Keywords
Introduction
Petroleum exploration is mainly conducted to find economically recoverable reserves, but it is a high-risk high-cost investment activity with many complexities and uncertainties (Hamzeh and Karimipour, 2020b). From 1980 to 2016, China National Petroleum Corporation(CNPC) drilled 40730 exploratory wells in prospective areas, among which there were only 17371 wells with economic oil and gas flow, accounting for 42.6% (Guo et al., 2019). This indicates that the drilling success rate can be further improved. Predicting the spatial distribution of petroleum resources can visualize exploration risks, thereby facilitating decision making for a series of exploration activities, such as target ranking, drilling planning, and resources management, and benefits exploration and development. Thus, an effective prediction algorithm is crucial for petroleum exploration.
There has been great interest in the prediction of spatial oil and gas distribution in the past decades. This has been realized using three primary methods types: knowledge-driven, data-driven, and hybrid methods. The knowledge-driven method is based on the knowledge and experience of an expert, and the main geological elements required for oil and gas accumulation in the region are comprehensively studied. The relative importance of input data sets and model parameters are evaluated by the expert, and the oil and gas bearing property of the study area are evaluated through calculation. For example: overlay method (White, 1988, 1993; Otis and Schneidermann, 1997; Guo et al., 2022a), fuzzy integration method (Chen et al., 2002), grey relational analysis method (Sheng et al., 2020). This type of method is suitable for areas in early and medium stages of exploration and with relatively simple geologic structures, and are usually affected by artificial factors, thus being subjective. The data-driven method mainly uses data mining and artificial intelligence and other methods, according to the exploration wells and geological data in the research area where oil and gas have been found. The relationship between oil and gas potential and geological factors are analyzed, then the extracted relationship is used to estimate the model parameters, the input data set is integrated into the model and the spatial changes of oil and gas distribution are quantitatively calculated, to establish the exploration risk. For example: mahalanobis distance(MD) method (Hu et al., 2007, 2009; Xie et al., 2011), support vector machine method (Chen et al., 2012), evidential belief functions model (Amiri et al., 2015a, 2015b), logistic regression method (Zhu et al., 2018), Bayesian network method (Ren et al., 2020; Guo et al., 2022b). The data-driven method may yield relatively objective results and have been widely used in the areas at medium stage of exploration, but they require a lot of data. The hybrid method combines the merits of the knowledge- and data-driven methods to predict the spatial oil and gas distribution in the target reservoirs. For example: optimized fuzzy ELECTRE method (Hamzeh and Karimipour, 2020a), optimized fuzzy preference ranking organization method (Hamzeh and Karimipour, 2020a).
MD has been widely applied in the prediction of spatial oil and gas distribution, but it places equal weights to variables, exaggerates the effects of secondary variables, and misjudges in the context of close or equal distances. Therefore, the objective of this paper is to propose an efficient algorithm for the above MD problems, and to predict the spatial distribution of oil and gas resources, so as to provide decision-making basis for oil and gas exploration. The main innovations of this paper are: (1) The Mahalanobis distance method based on genetic algorithm is proposed for the first time. (2) The effectiveness and superiority of this method are illustrated by an application example. (3) The application of this method to the spatial distribution of oil and gas in Sangonghe Formation points out the direction for future oil and gas exploration.
This paper presents the methodology and workflow of the MD method in section 2, a case study involving geological setting, key parameters, experimental design and results, and predicted prospects with promising resources in section 3, and conclusions in section 4.
Methodology descriptions
Approach
Drilling and seismic data provide the primary information for venture exploration and prospect prediction. Completed exploratory wells can be used as a set, and the wells are classified into two categories; wells with economic oil and gas flow (productive wells) and wells without economic oil and gas flow (non-productive wells). The subset consisting of productive wells is titled the population of productive wells, denoted as
Workflow of MD
The MD method has been widely used in petroleum exploration, especially in identifying oil and gas wells, predicting the spatial distribution of petroleum resources, and drilling site optimization. The workflow of MD integration of geological variables combined with the Bayesian statistical method for oil and gas prediction is shown in Figure 1. The major steps are as follows.
Data collection Collect all available exploratory well and geoscience data in the study area and classify exploratory wells into two categories; productive and non-productive wells, denoted as Discriminant parameter determination Establish geologic factors which dominate hydrocarbon accumulation in the study area based on drilling, seismic, and basin modeling data combined with expert knowledge, and establish the system of discriminant parameters. Data preprocessing Data preprocessing focuses on checking parameter effectiveness and establishing data sets. Plotting of MD-based petroleum probability chart
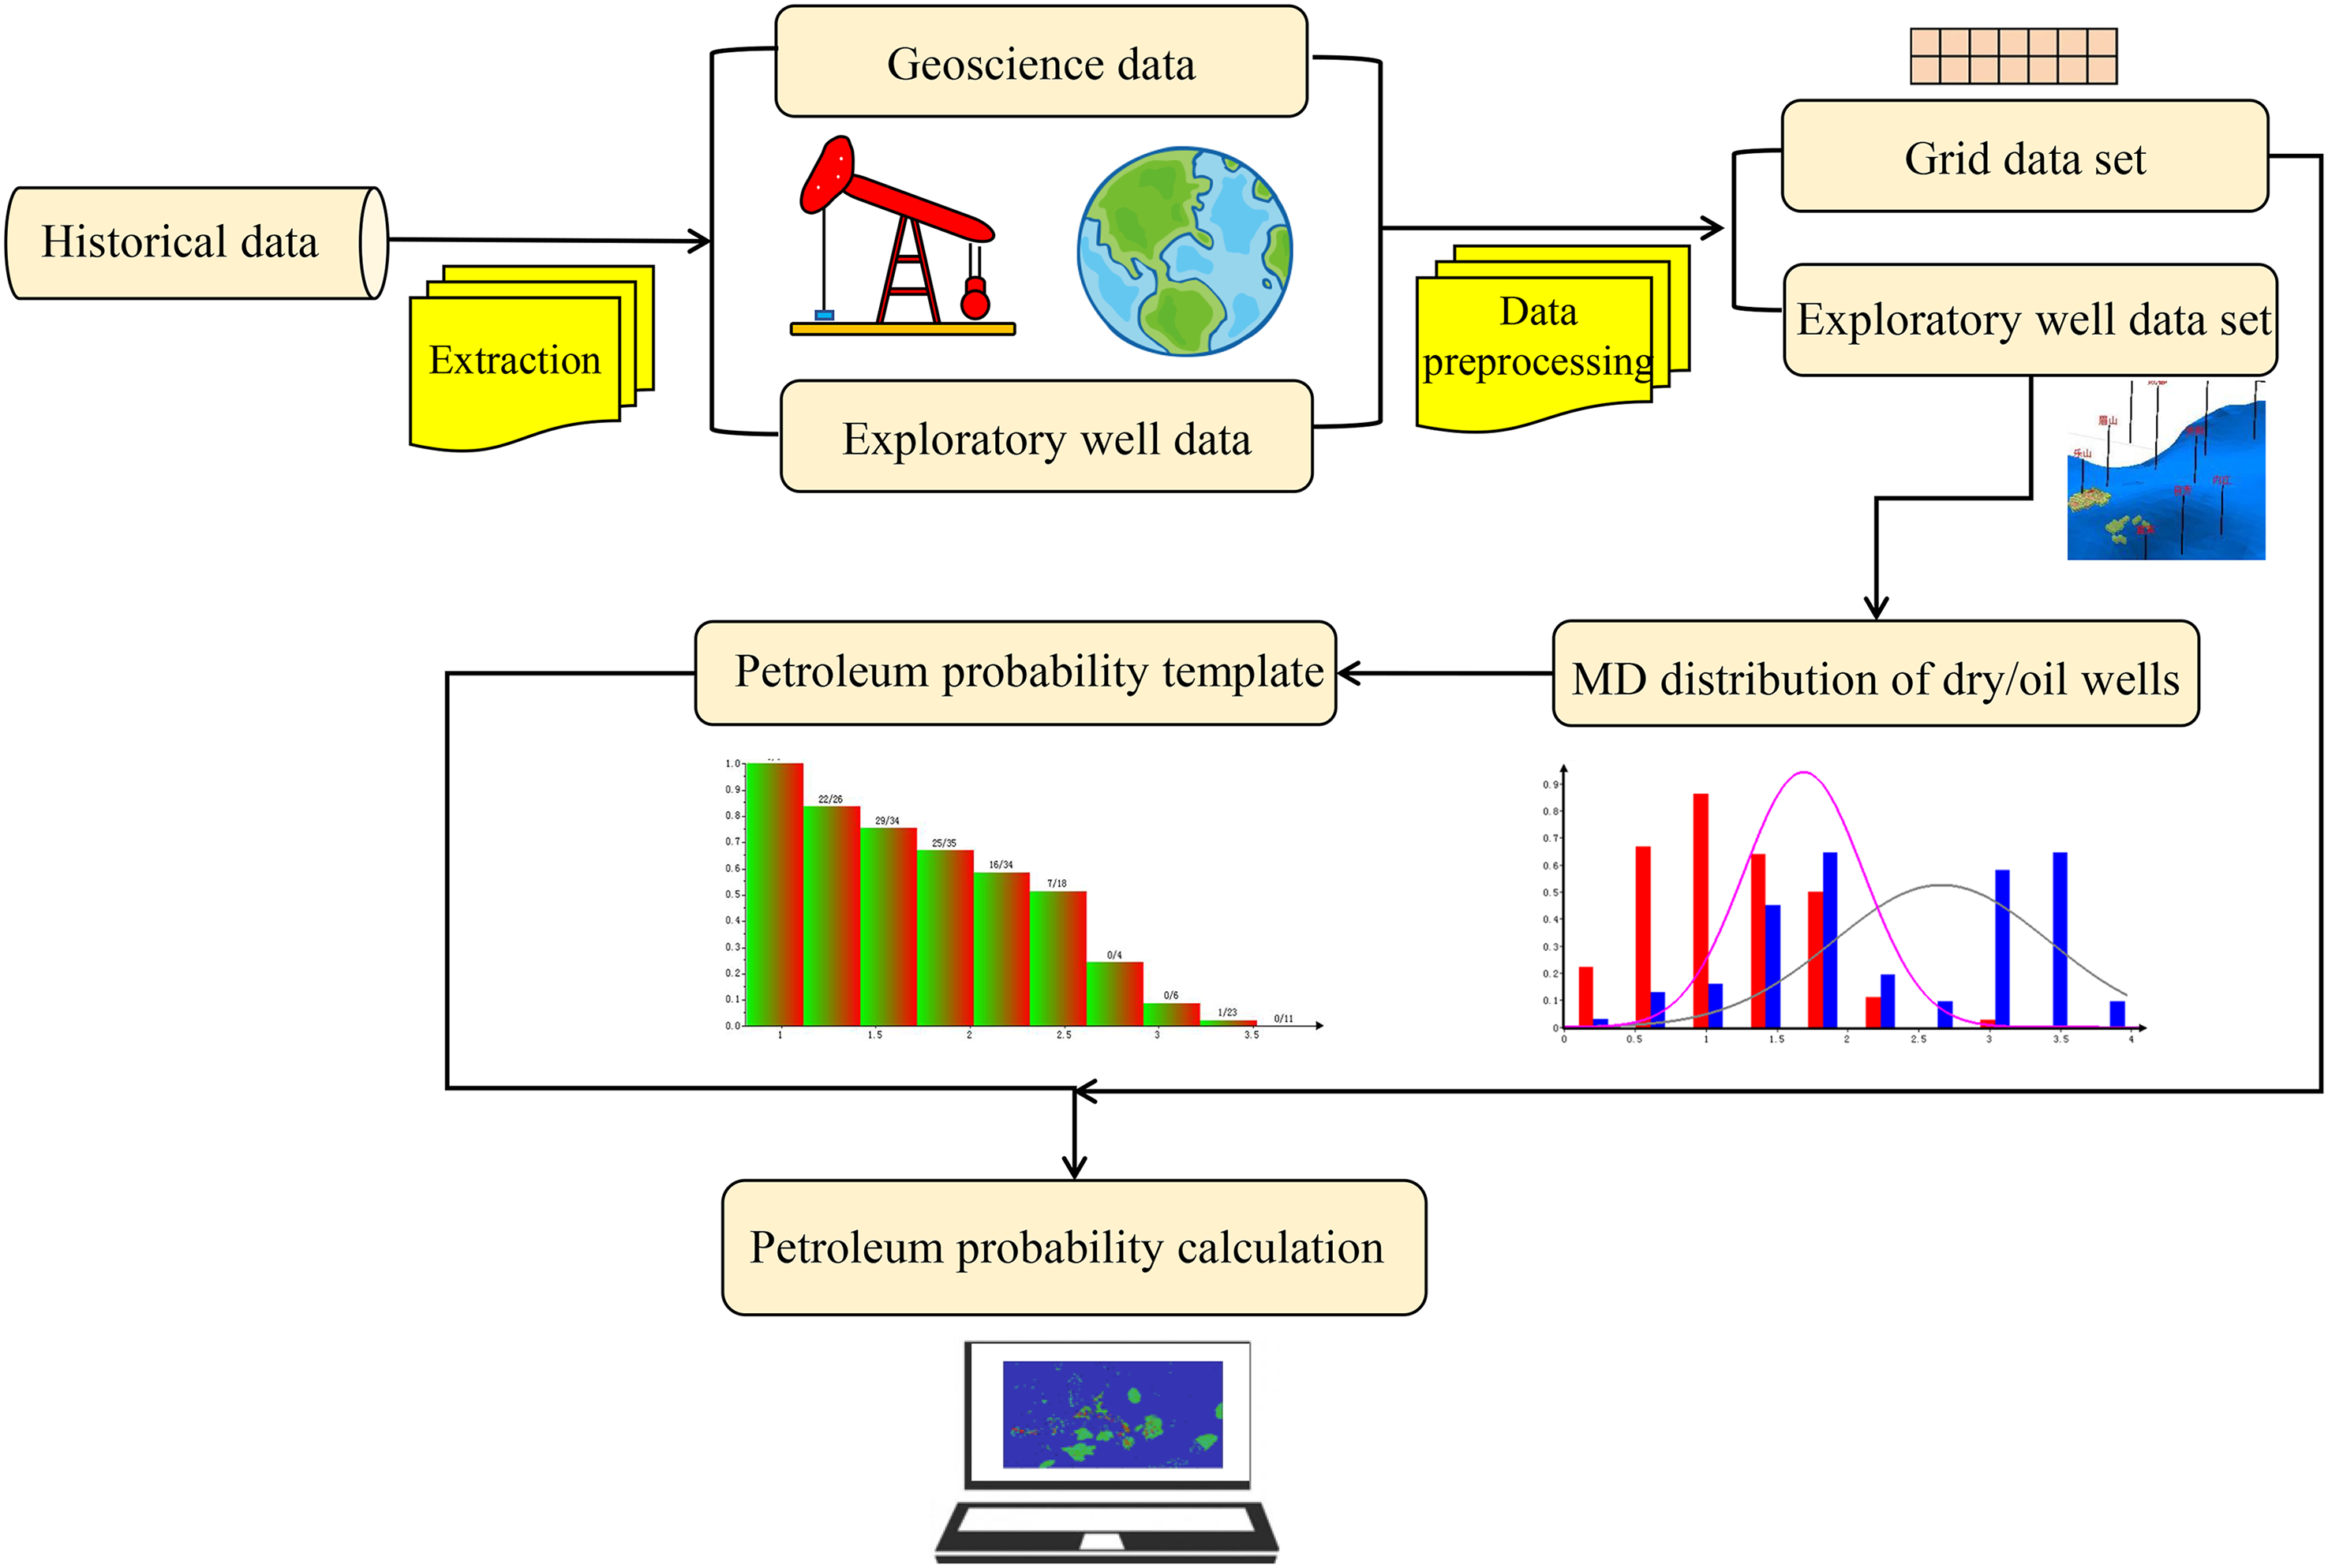
Workflow of spatial oil and gas distribution prediction by the MD method.
The MD method calculates the distance between the observation

According to the Bayes formula, the conditional probability of the sample 5. Petroleum probability calculation and risk visualization

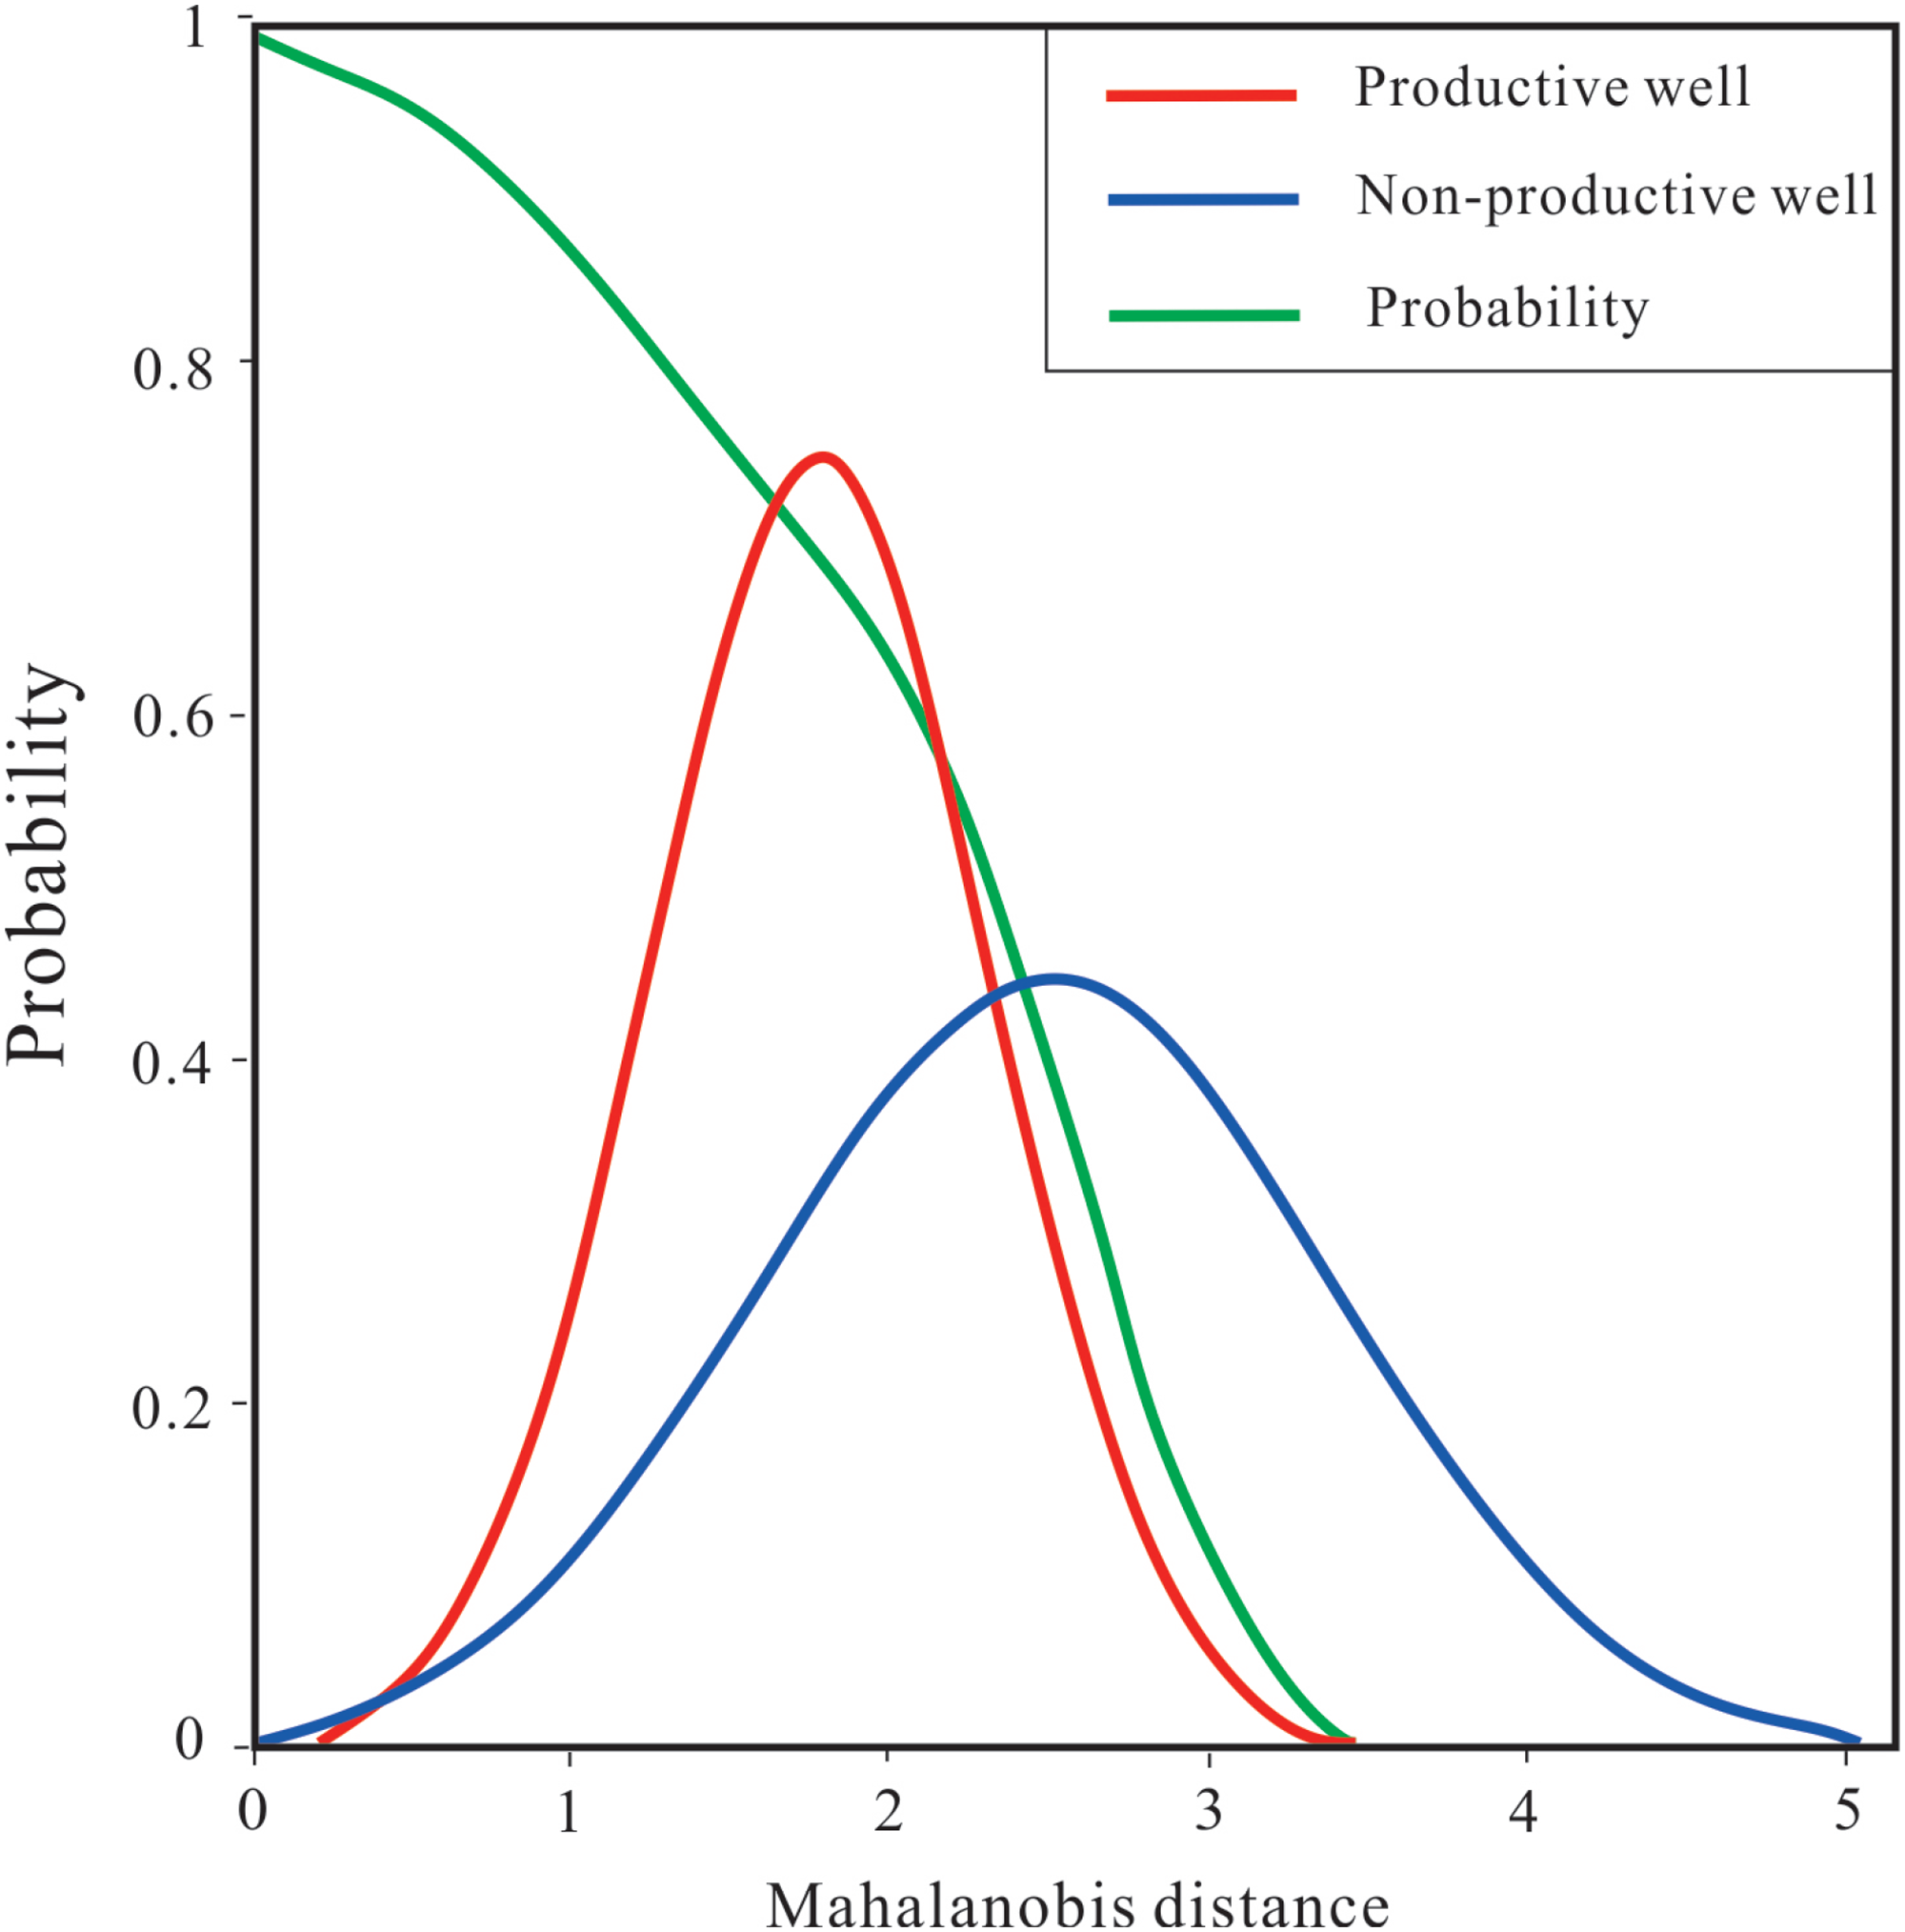
MD risk probability template.
Based on the template in Figure 2, the MDs at the sites to be predicted in the grid data set are converted into the petroleum probability using the interpolation method. The spatial distribution is generated using the Kriging interpolation and then visualized to delineate the spatial distribution of petroleum resources (risks).
GA-MD
As a key feature of MD, an inverse matrix of the covariance matrix is introduced into the equation of distance calculation, to yield dimensionless variables and alleviate the influence of correlation between variables based on distance. However, the MD method is defective since it exaggerates the variables with small changes and may misjudge in the context of close or equal distance. We developed a novel MD method based on genetic algorithm for variable weight optimization to effectively improve the accuracy of the algorithm. Eq. (1) is converted into the following equation by adding the weights:

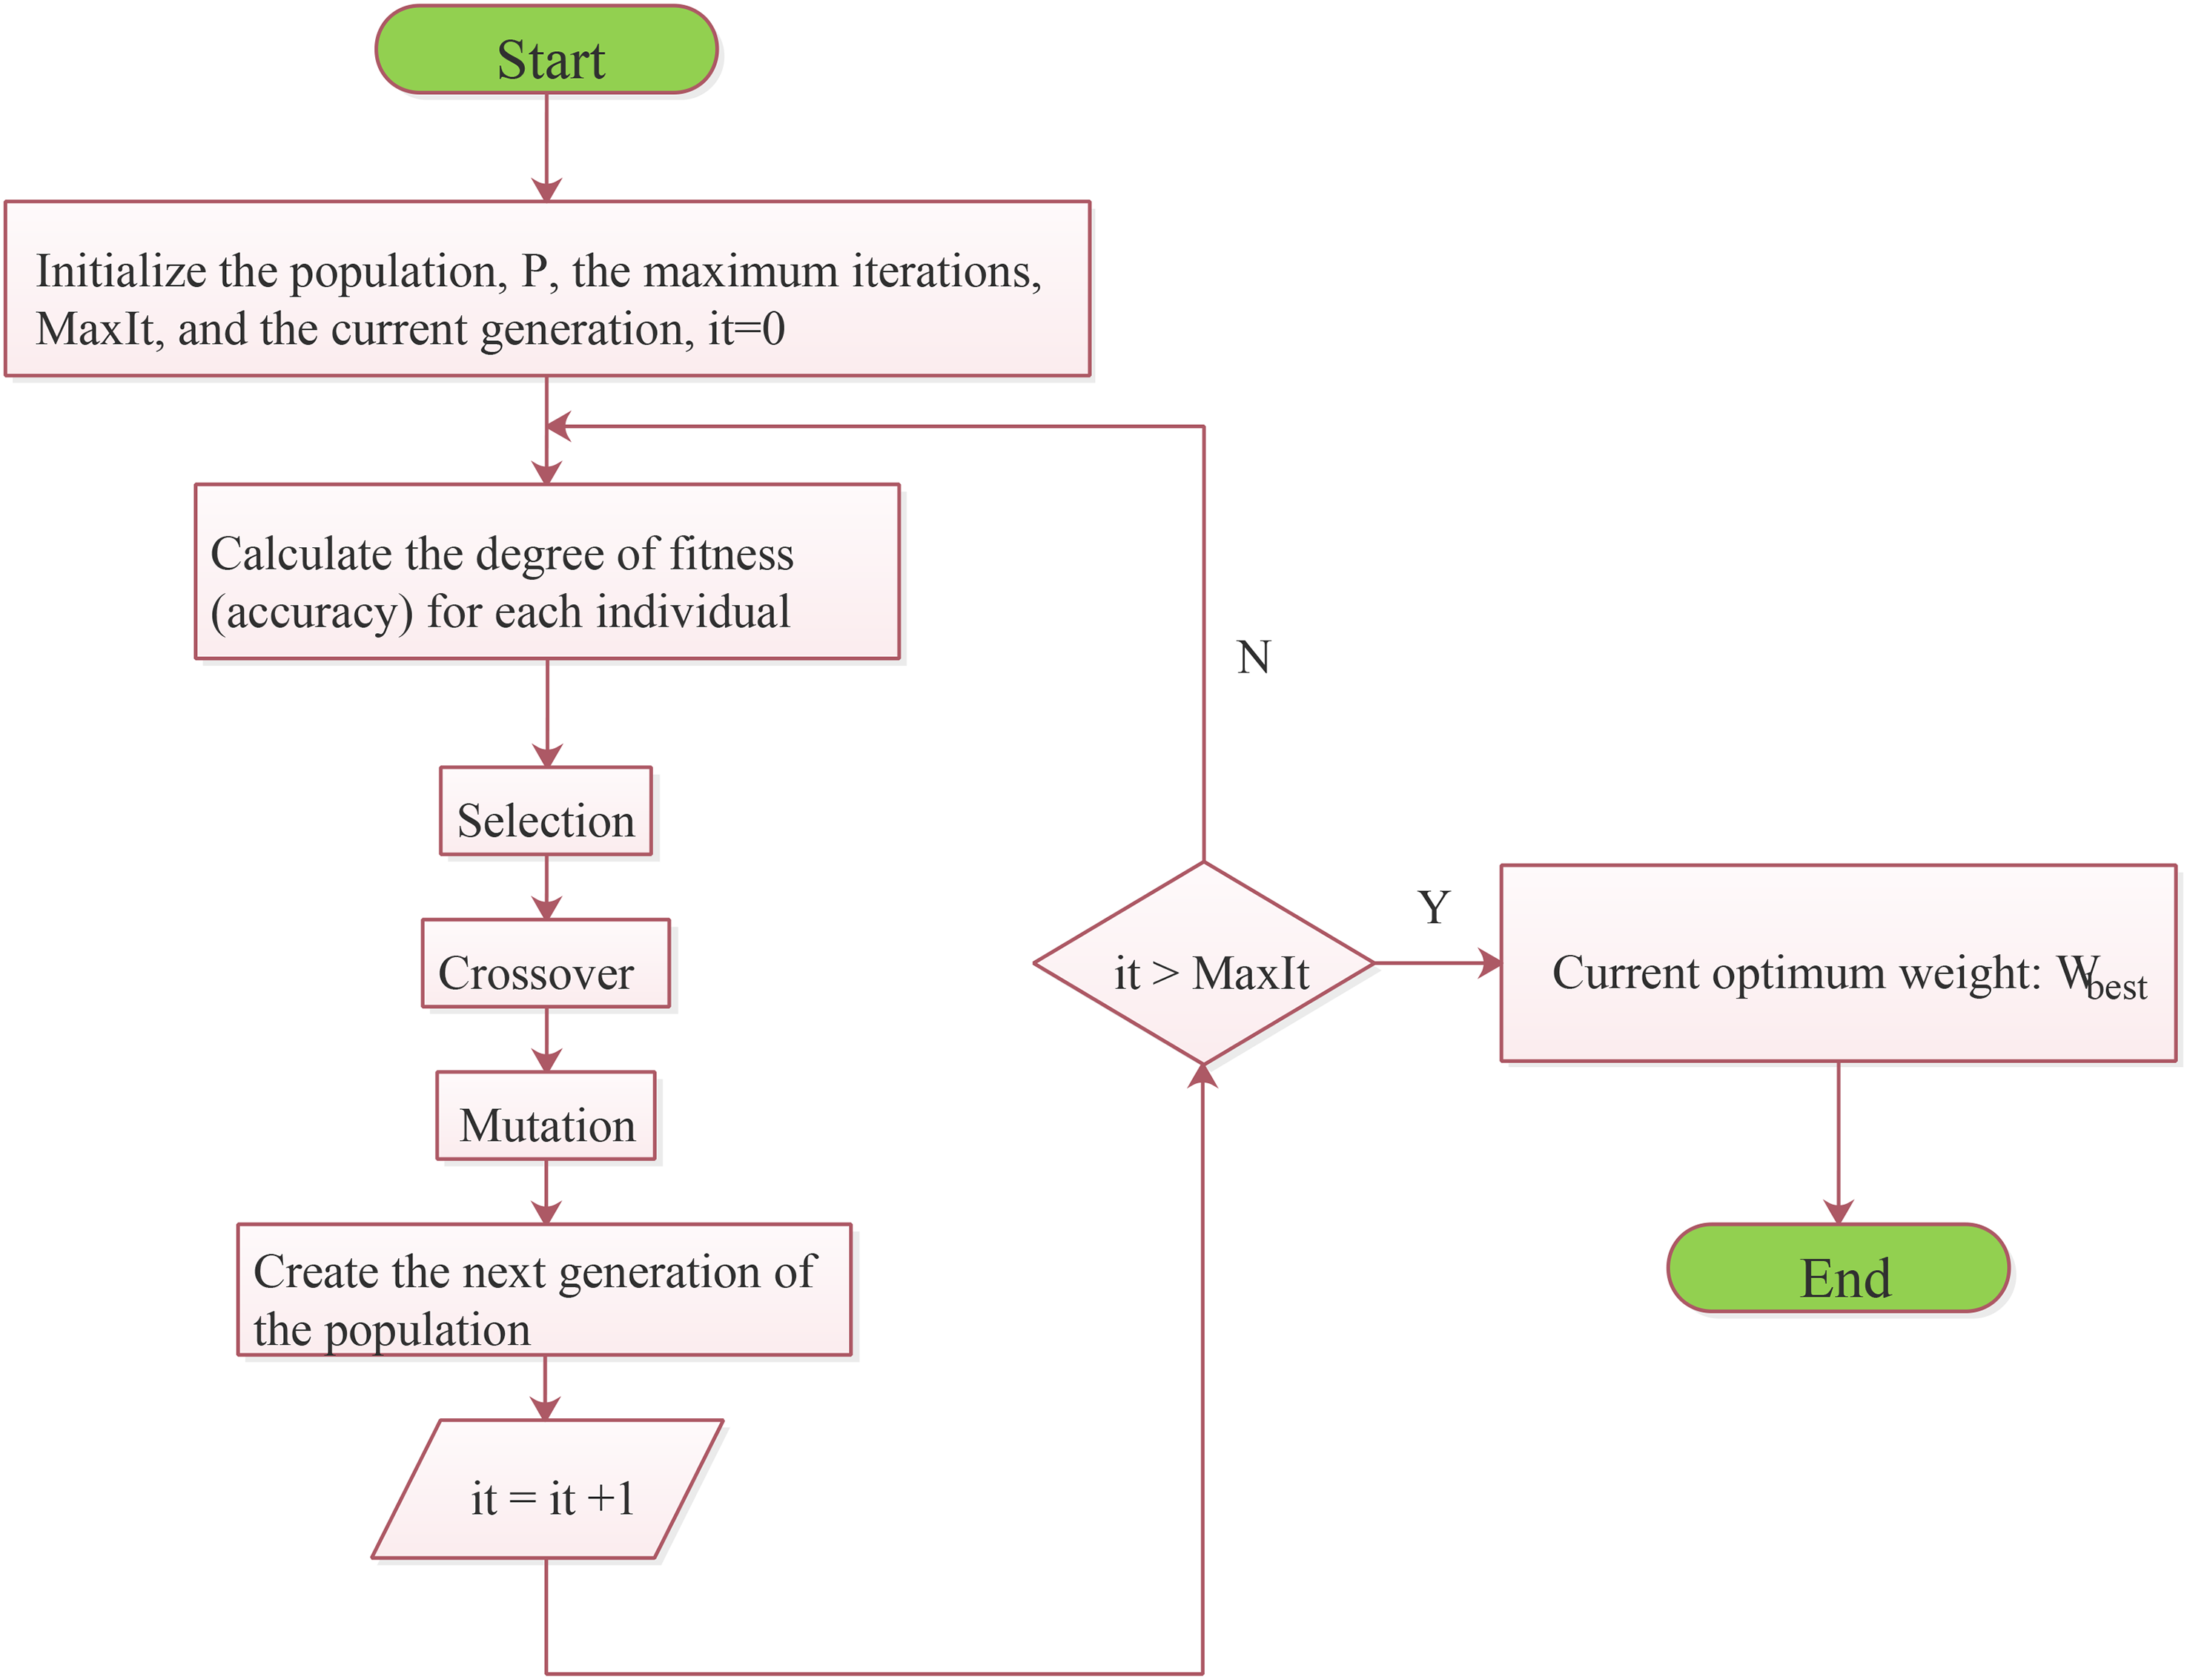
The flow chart of optimizing the weight of MD method based on GA.
Application example
Geological setting of the study area
The case study dealt with the Junggar Basin, which is a large petroliferous basin of
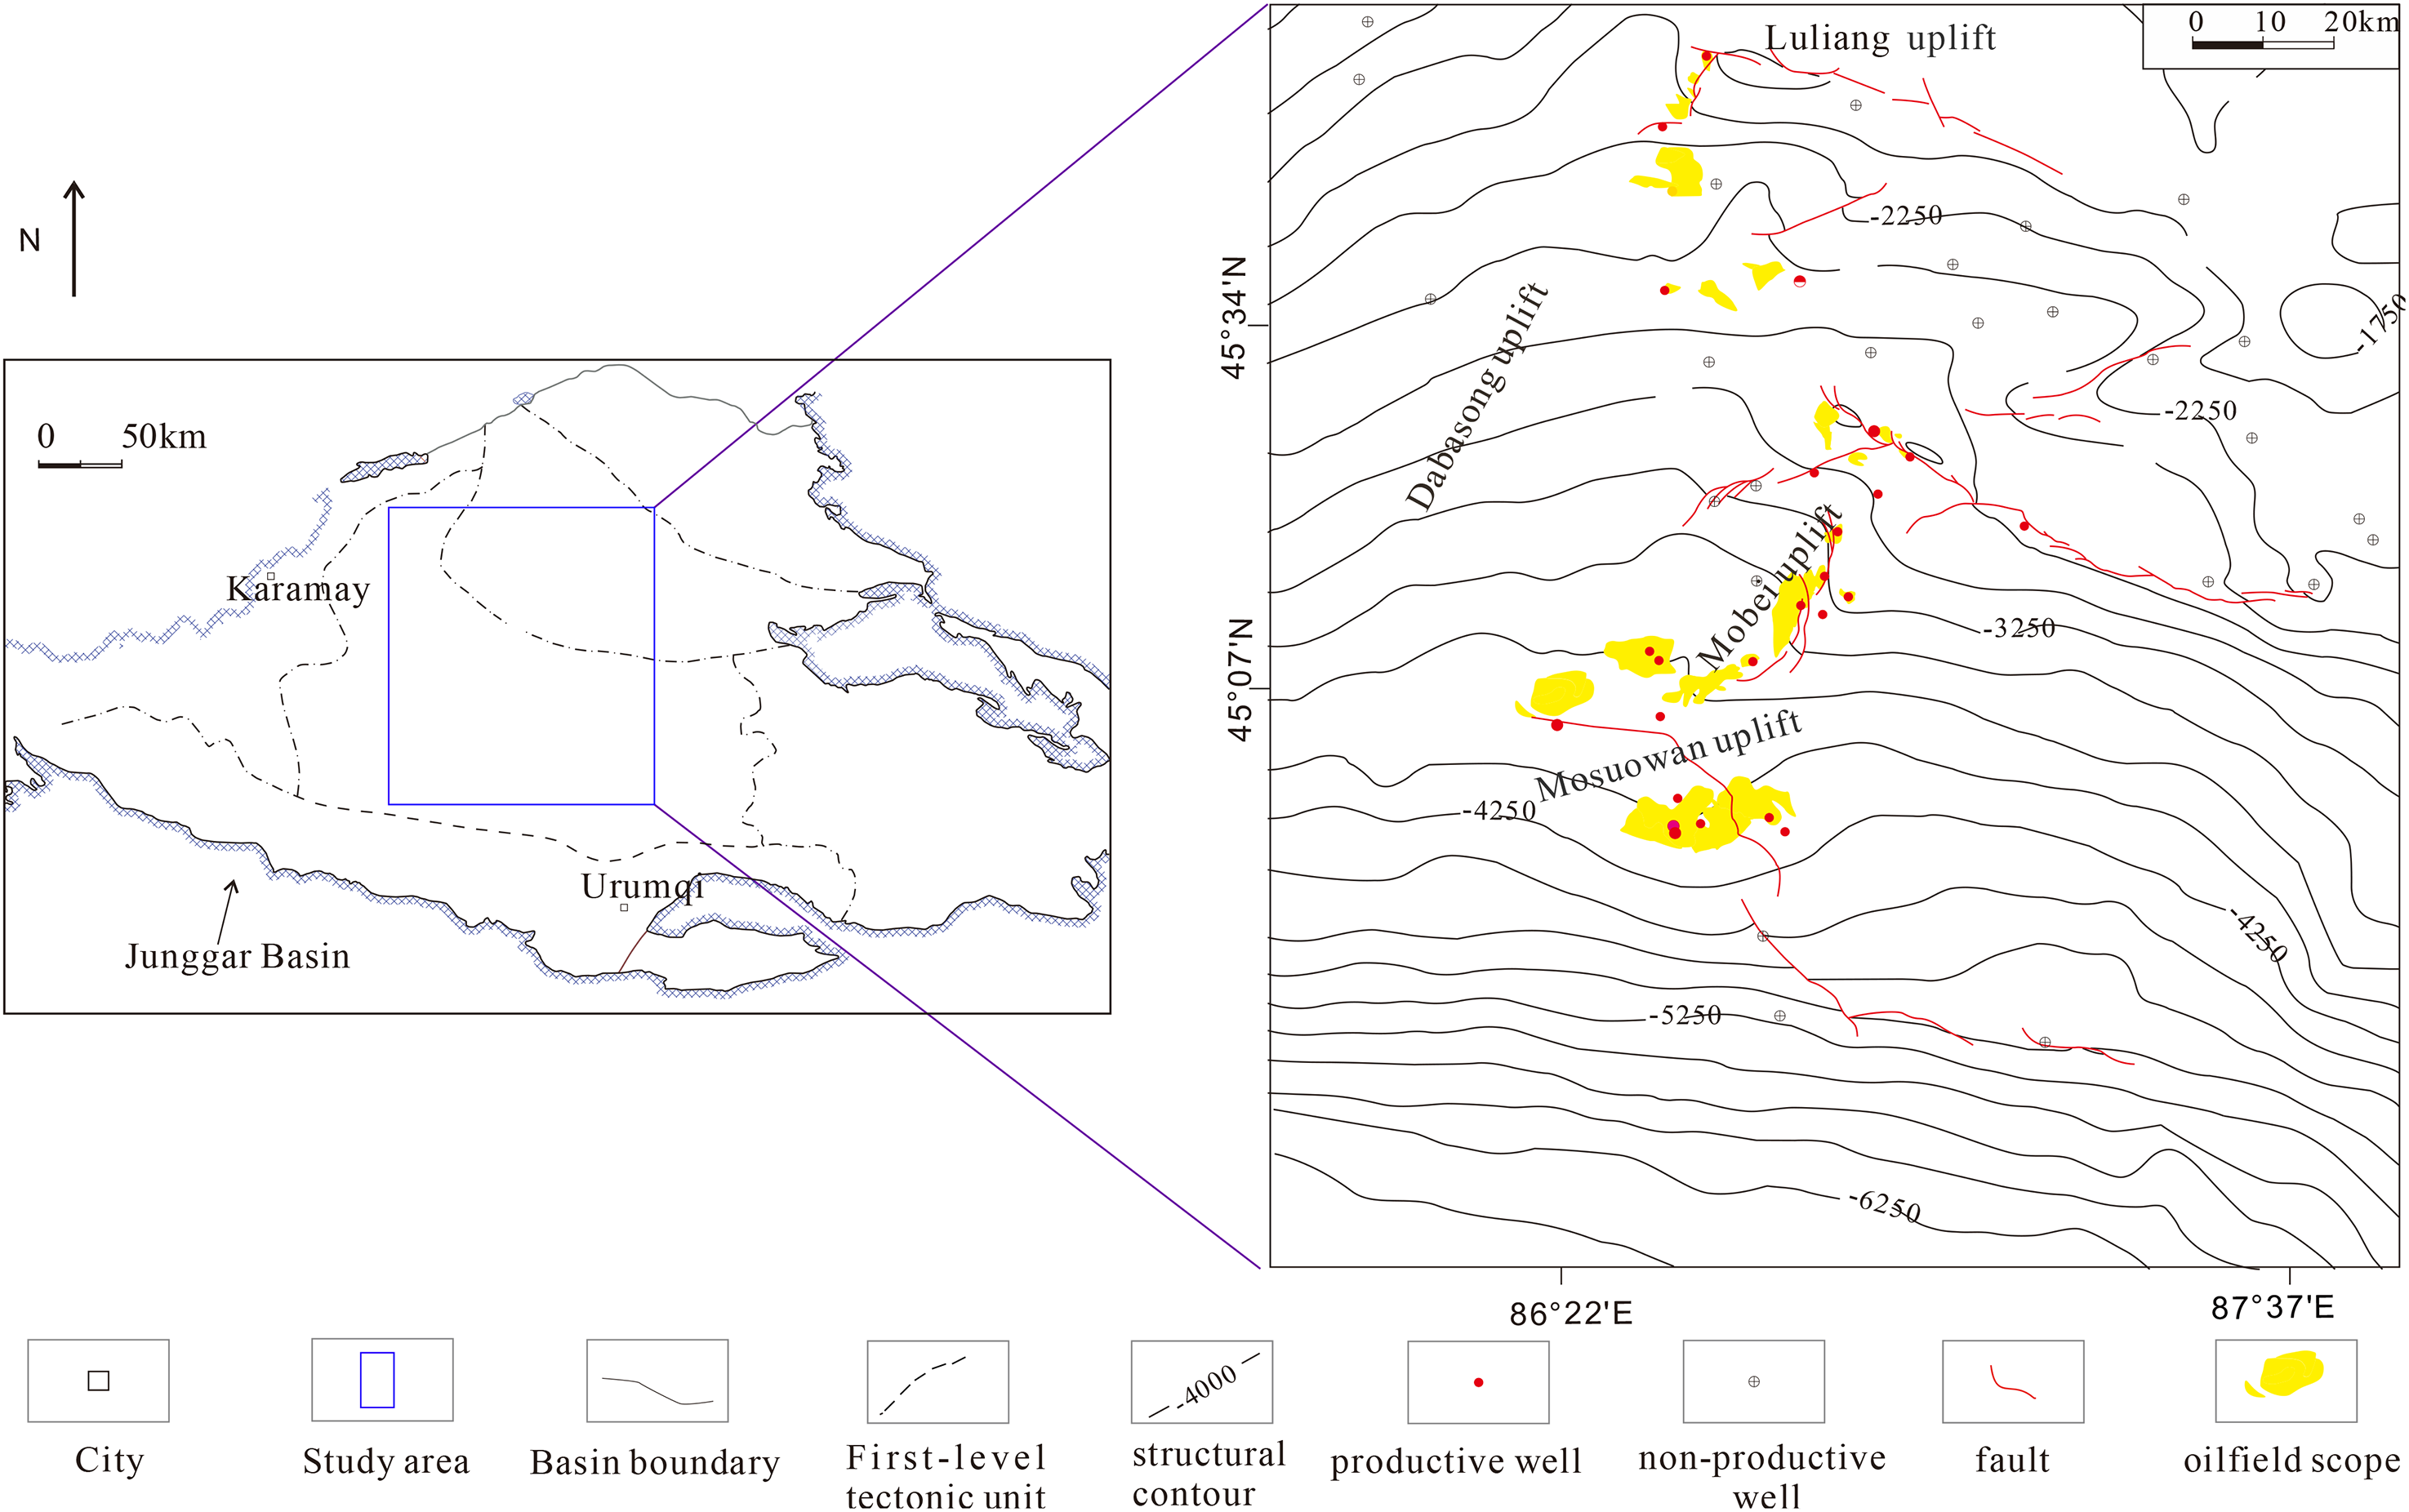
Location of study area and distribution of oil and gas reservoirs.
Key parameters and validity check
Based on the data of the 203 exploratory wells penetrating the Sangonghe Formation, and the petrophysical data, reserves, sedimentary facies maps, seismic structure maps, fault maps, trap maps, and basin modeling results of 54 reservoirs, four geologic factors were extracted to predict the spatial oil and gas distribution in the study area.
(a) Source rock (or hydrocarbon supply) conditions
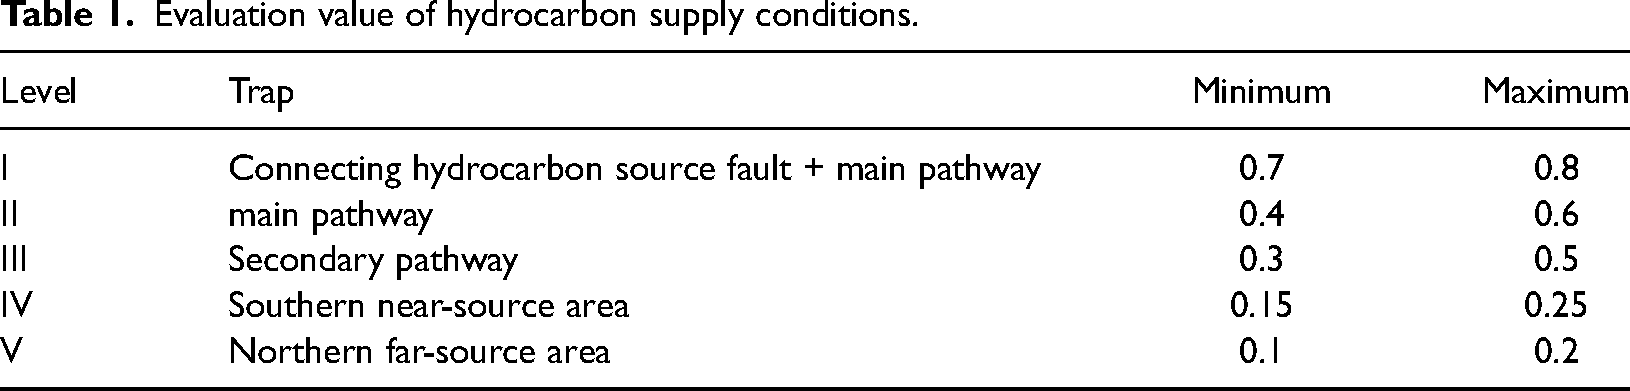
These conditions indicate the probability of hydrocarbon supply, which is defined to be from 0 (probability of 0) to 1 (probability of 100%). Probability distribution is determined in terms of hydrocarbon-generating intensity map, the map of faults connecting the underlying source rocks, and modeled oil and gas migration pathways(Guo et al., 2018). Table 1 is the evaluation of the interval value of hydrocarbon supply conditions.
Evaluation value of hydrocarbon supply conditions.
(b) Reservoir rock conditions
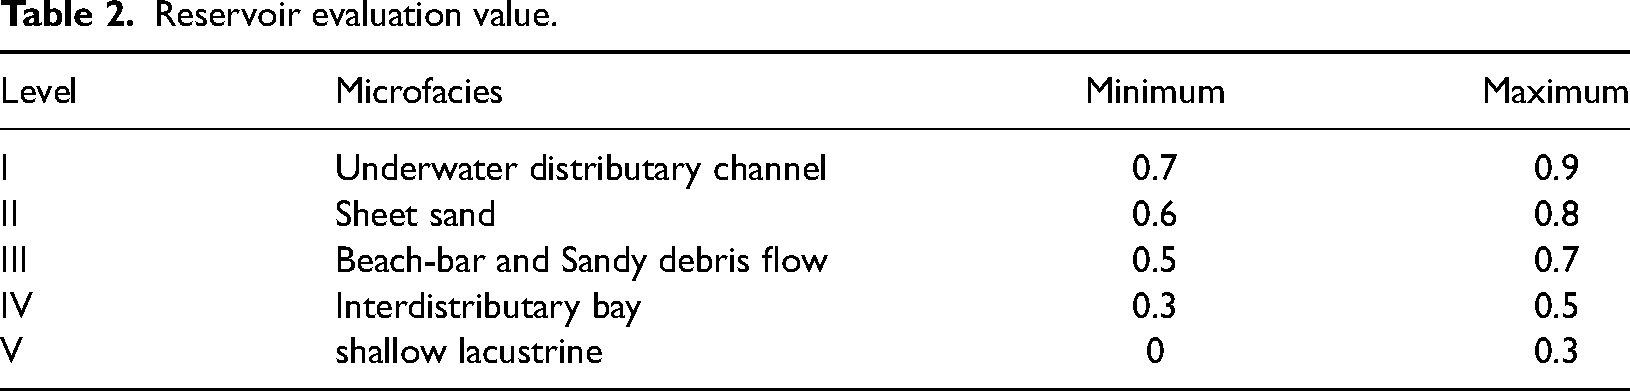
These conditions indicate the probability of reservoir rock occurrence, which is established based on Sangonghe sedimentary facies (fluvial-delta facies) and petrophysical data of oil and gas reservoirs. Table 2 is the evaluation of the interval value of reservoir rock conditions.
Reservoir evaluation value.
(c) Trap conditions
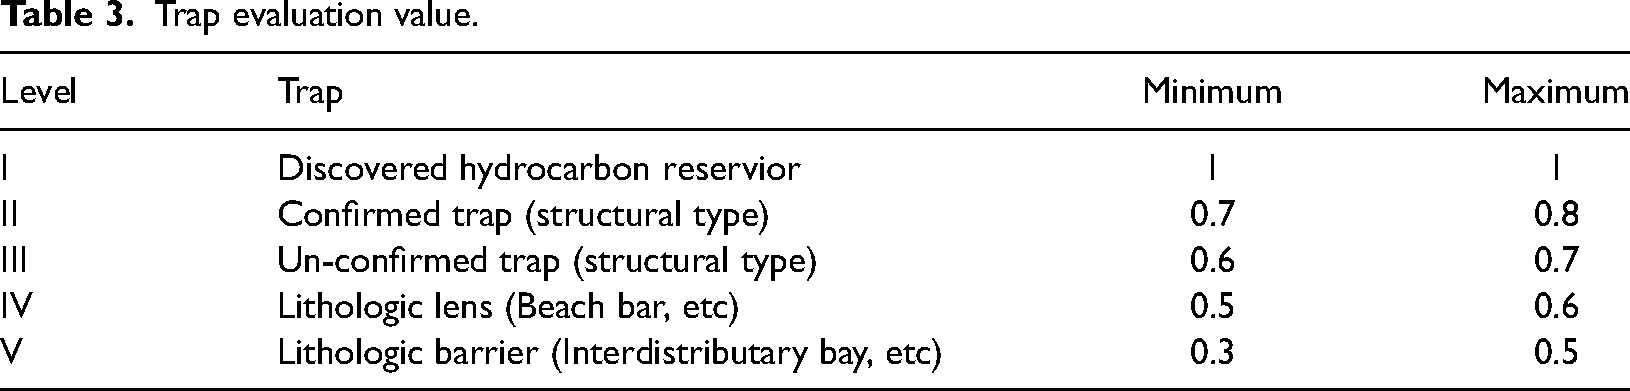
These conditions indicate the probability of trap occurrence, which is set to be 100% for the area with discovered oil and gas reservoirs, 70–80% for confirmed traps, 60–70% for the traps to be confirmed, 30–60% for prognostic lithologic traps, and < 30% for additional areas. Table 3 is the evaluation of the interval value of trap conditions.
Trap evaluation value.
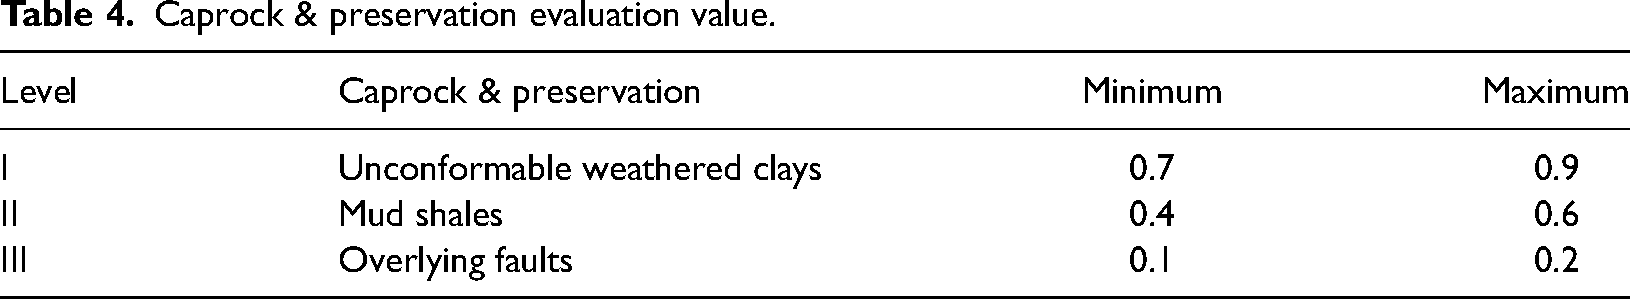
(d) Caprock & preservation conditions
These conditions indicate the probability of hydrocarbon sealing and preservation, which is determined depending on overlying faults and unconformable weathered zones. The probability is set to be 10–20% in the area where overlying faults are unfavorable for hydrocarbon preservation, 70–90% in the area where unconformable weathered clays function as good seals for hydrocarbons, and 40–60% in the area where mud shales serve as local seals. Table 4 is the evaluation of the interval value of caprock & preservation conditions.
Caprock & preservation evaluation value.
The target interval is the Sangonghe Formation. We used the data of the 203 exploratory wells penetrating the Sangonghe Formation, including 109 productive and 94 non-productive wells (Figure 4). A labelled exploratory well dataset with 203 samples was established based on the quantitative assessment of hydrocarbon supply, reservoir conditions, trap conditions, and caprock & preservation conditions at each well site (Table 5).
Data set of 203 exploratory wells.
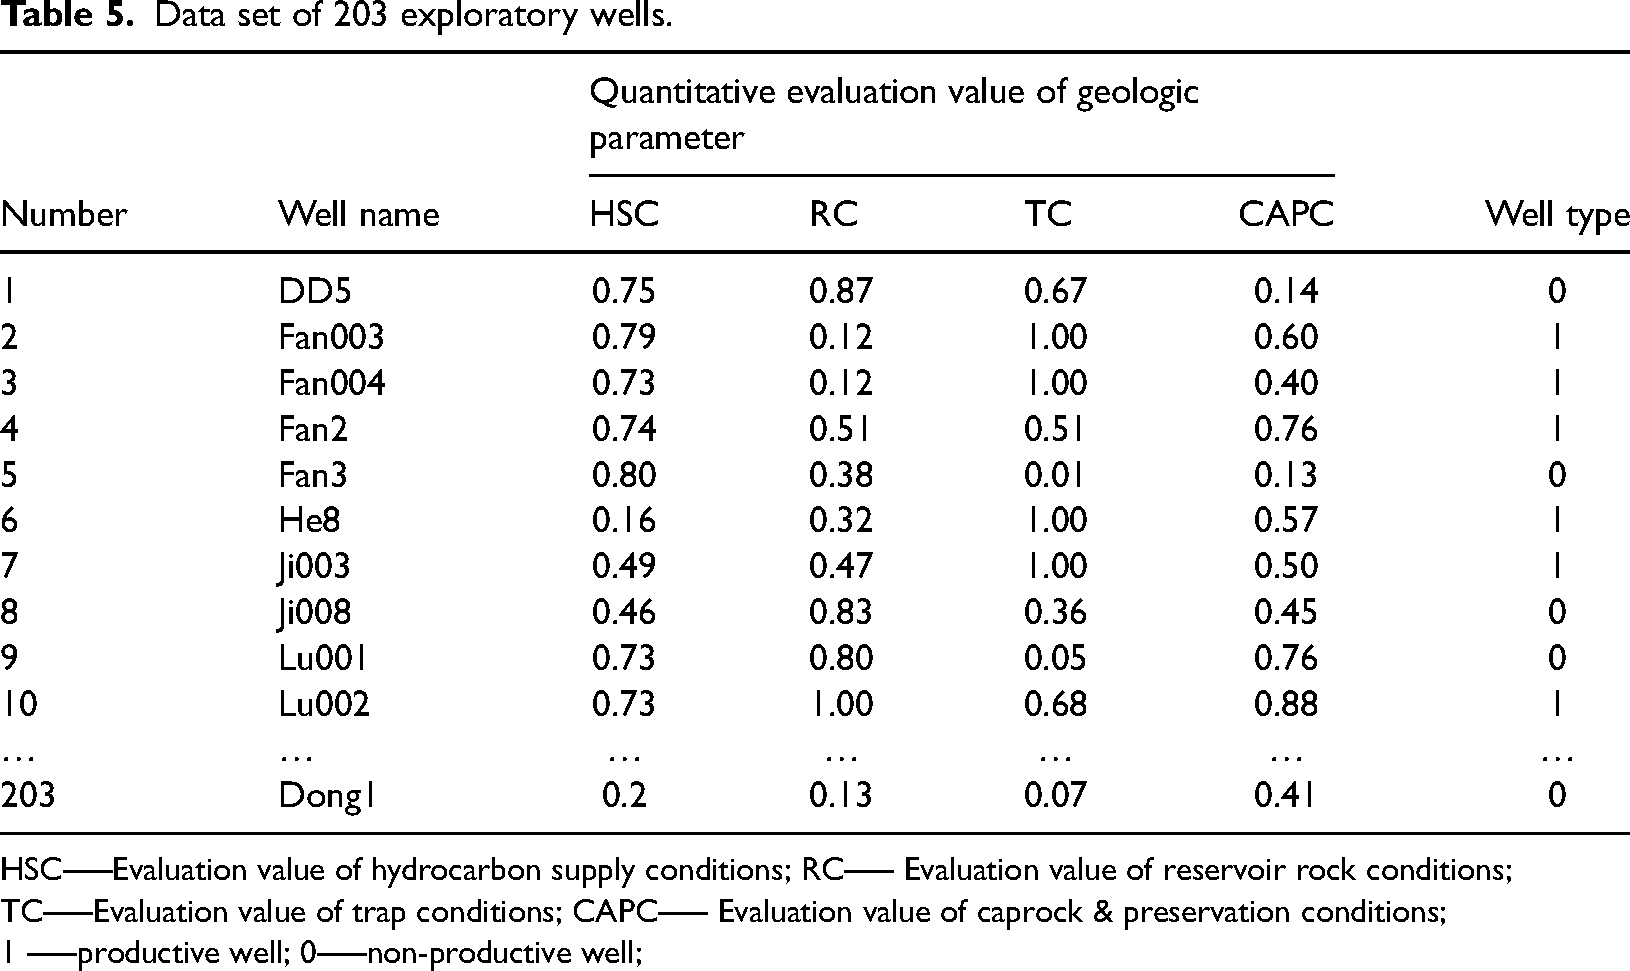
HSC—–Evaluation value of hydrocarbon supply conditions; RC—– Evaluation value of reservoir rock conditions; TC—–Evaluation value of trap conditions; CAPC—– Evaluation value of caprock & preservation conditions; 1 —–productive well; 0—–non-productive well;
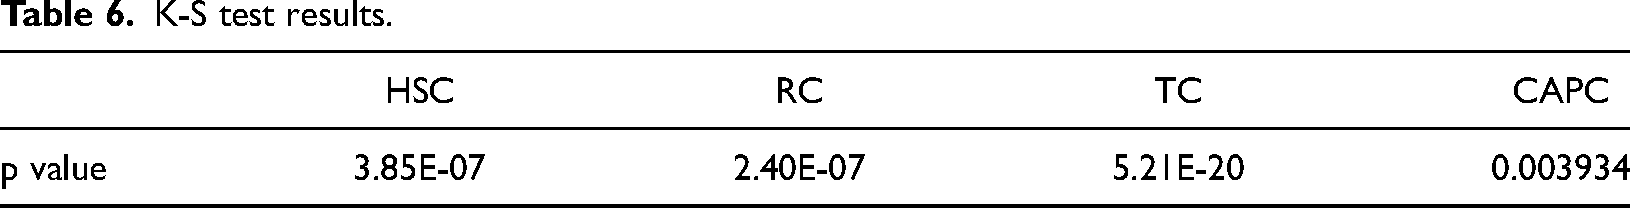
Exploratory well types can be discriminated using valid parameters. Figure 5 shows the variations of four key geologic factors of well types. Non-productive and productive wells show different patterns of the probability distribution of each factor. To quantitatively demonstrate the validity of key factors, we used the Kolmogorov-Smirnov (K-S) test to validate the correlation between the four geological variables (source rock conditions, reservoir rock conditions, trap conditions, and caprock & preservation conditions) and class variables (exploratory well type). According to the null hypothesis of the K-S test, two groups of samples of an attribute have equal distribution at the given class variable conditions, i.e.,
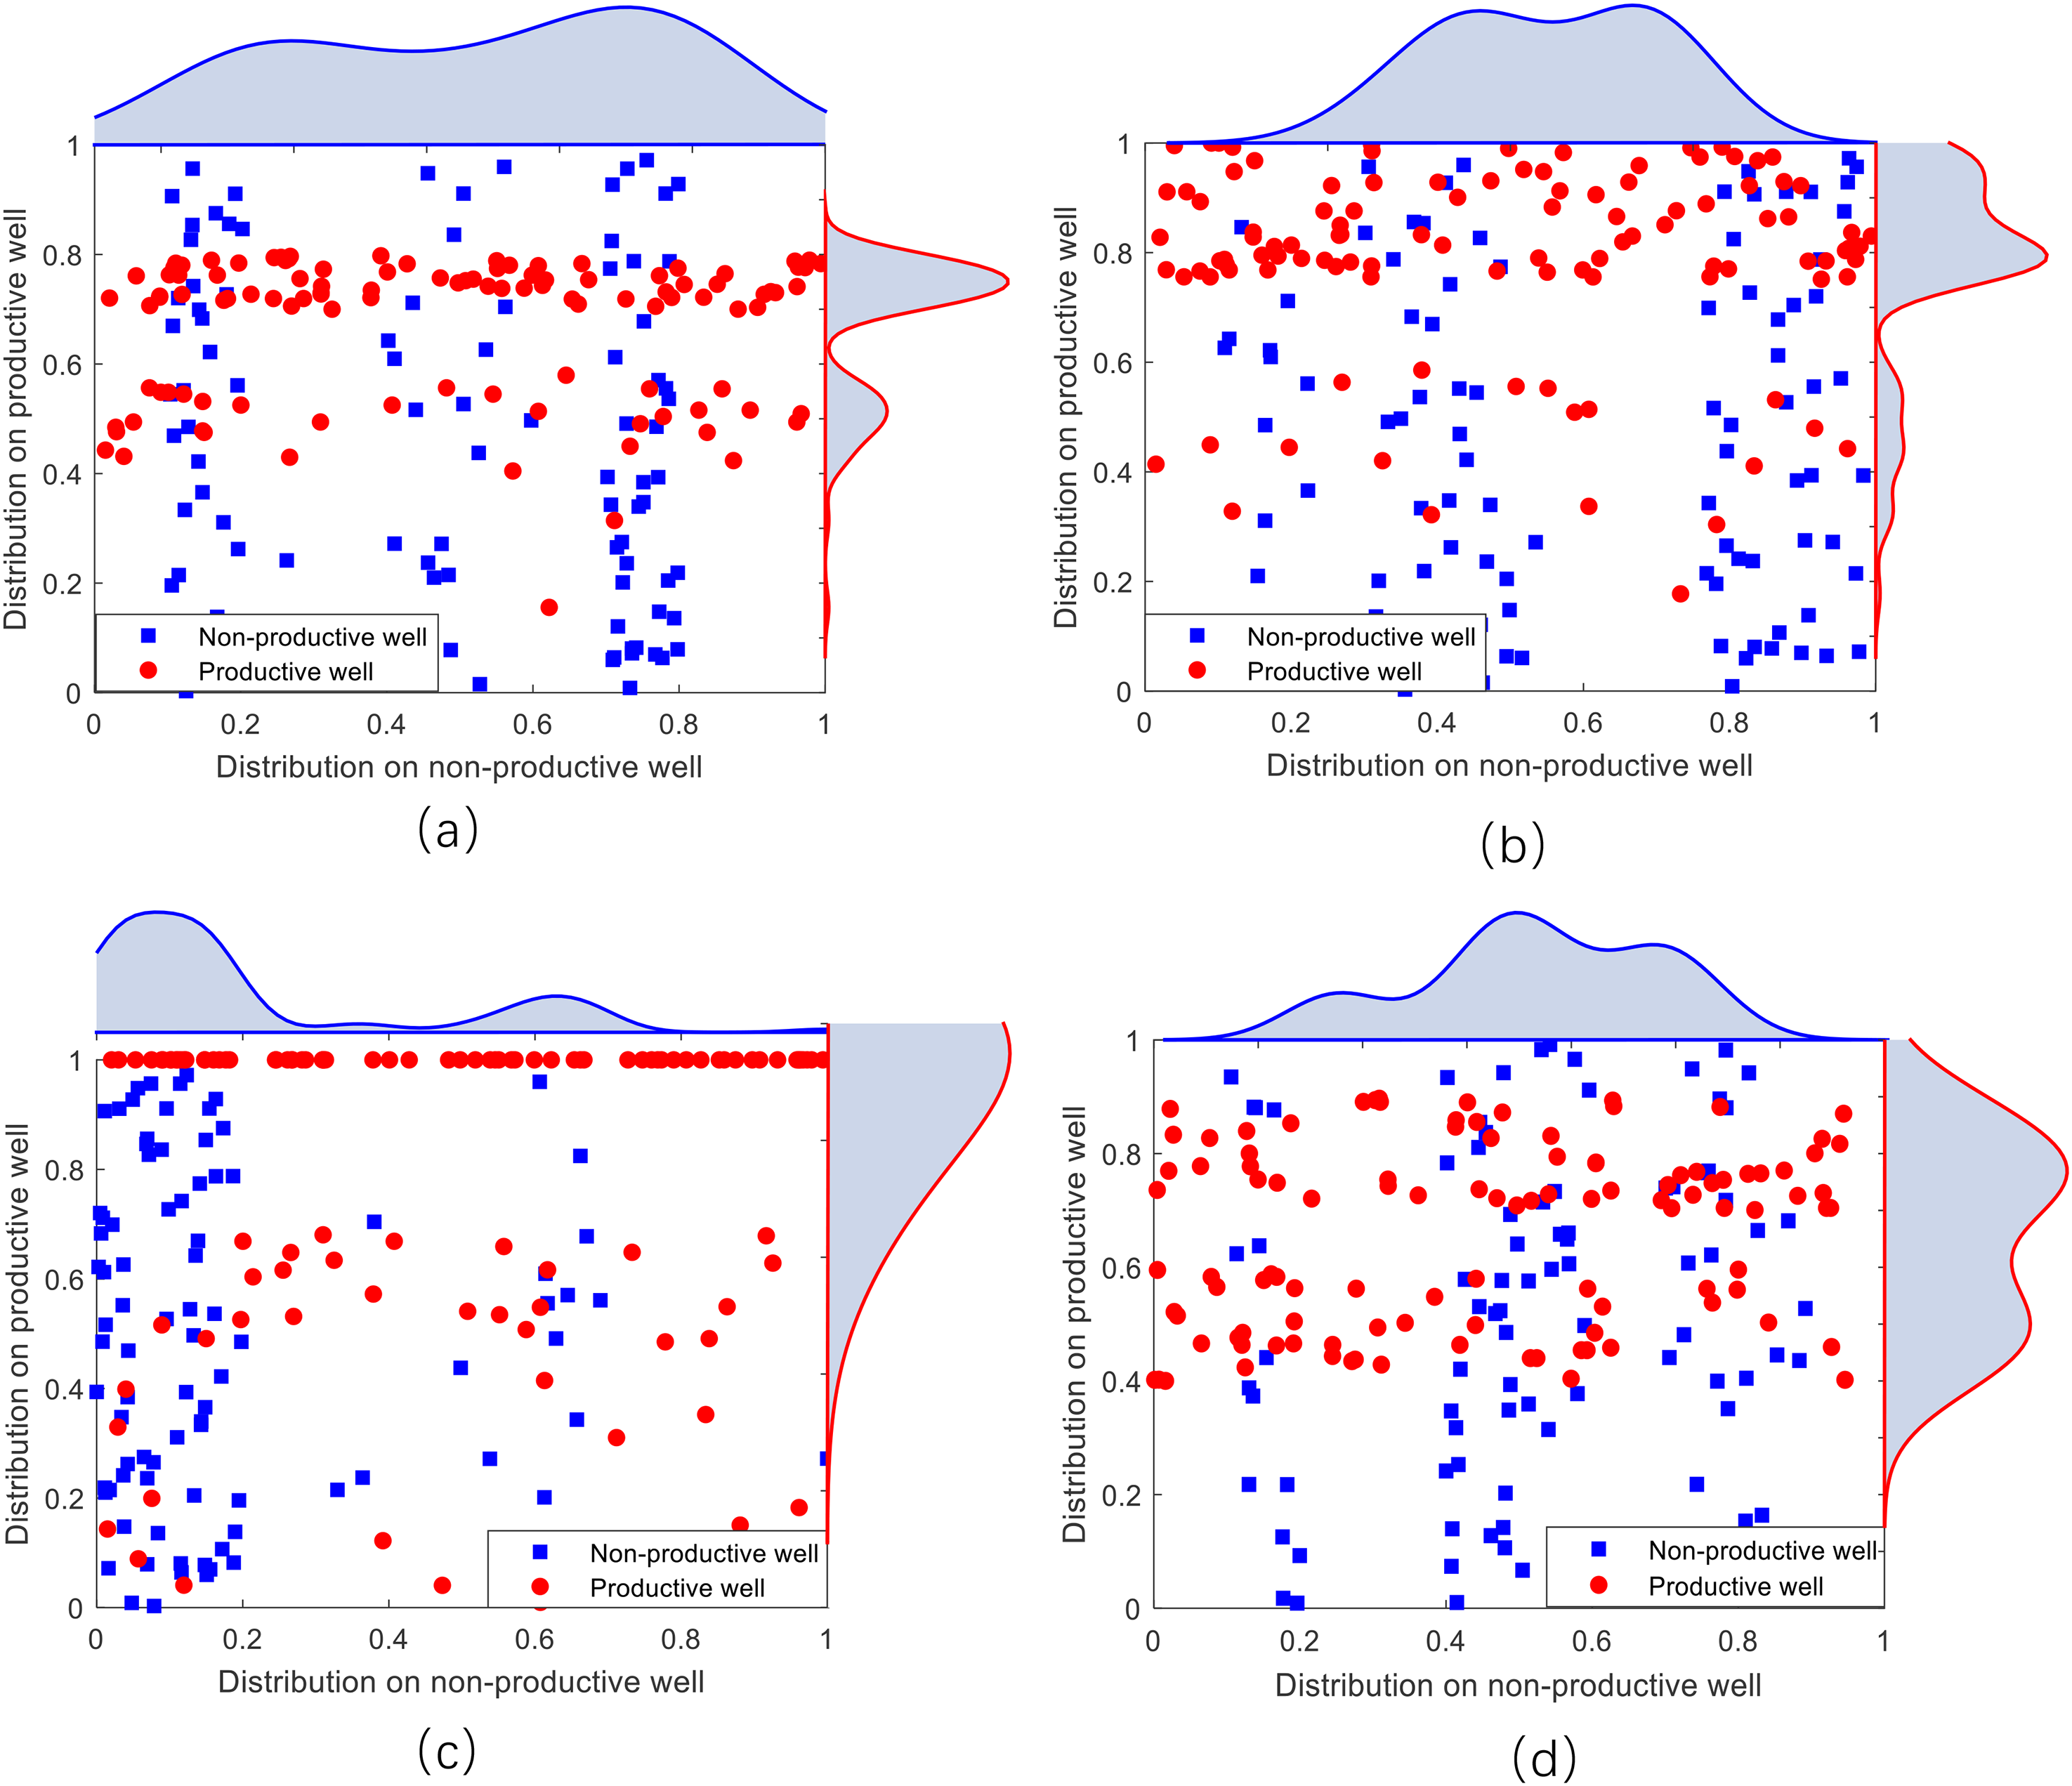
Distribution of the key parameters ((a) Evaluation value of hydrocarbon supply conditions; (b) Evaluation value of reservoir rock conditions;(c) Evaluation value of trap conditions;(d) Evaluation value of caprock & preservation conditions.)
K-S test results.
In addition to the exploratory well data set, we used the two-dimensional Perpendicular Bisection grid technique to establish 15951 evaluation units in the study area. Each unit was acquired with four accumulation factors to form the grid data set, which was mainly applied to the prediction of spatial oil and gas distribution.
Experimental design and result analysis
Comparison method
To demonstrate the validity, GA-MD was compared with five popular methods for the prediction of spatial oil and gas distribution.
MD: Original Mahalanobis distance method (Xie et al., 2011). TAN: Tree-augmented naive Bayes is a Bayesian network classifier(BNC) method, which establishes the maximum weighted spanning tree between geological attributes to characterize the relationship between the different attributes (Ren et al., 2020). AODE: Average one-dependence estimator is an integration method that improves the accuracy of AODE by integrating multiple BNC models (Guo et al., 2022b). LR: Logistic regression method is a generalized linear regression analysis model that establishes the discriminant relationship between geological attribute variables and class variables (Zhu et al., 2018). SVM: Support vector machine method is a generalized linear classifier for binary classification of data, and its decision boundary is a maximum-margin hyperplane that solves for the learning samples (Chen et al., 2012).
Data sets and evaluation criterion
Data sets used are shown in Table 5. Accuracy is a common criterion to evaluate the classification performance and is defined as the ratio of the number of correctly classified samples to the number of all samples. Generally, the higher the accuracy, the better the classifier (evaluation method). The accuracy of a known evaluation method 
Results and discussion
(I) Validation of the proposed method
We compared GA-MD with MD, TAN, AODE, LR, and SVM. For GA-MD, the parameters were set to be the population P=20 and the maximum iterations MaxIt=5. The parameters of other algorithms were set in accordance with the corresponding references. In each test, 90% of samples were randomly extracted as the training set from the data set with 203 exploratory wells, and 10% of samples were used as the test set. Each algorithm was run 10 times independently, and the average of 10 results was taken as the accuracy of the corresponding method.
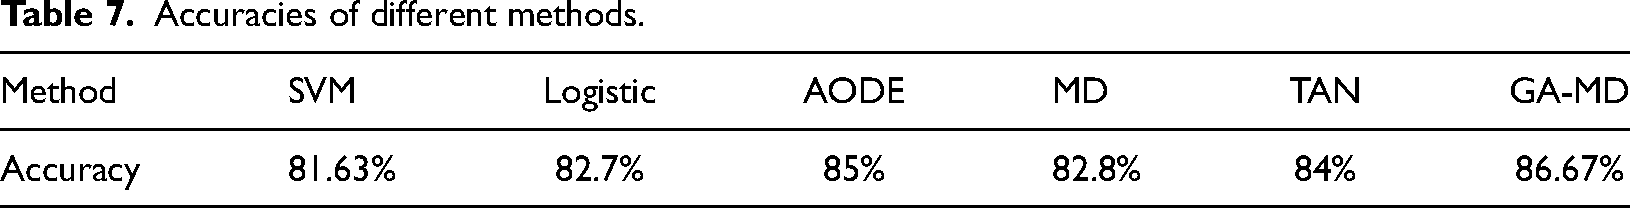
Table 7 lists the accuracy of the GA-MD method and five comparison methods using the test set. As shown in Table 7, the accuracy of GA-MD was the highest, reaching 86.67%, and the accuracy of AODE, TAN, MD, SVM, and LR were 85%, 84%, 82.8%, 82.7% and 81.63%, respectively. The analysis shows that the six methods are roughly divided into three categories: (1) MD, SVM and LR methods, with accuracy of 82.8%, 82.7% and 81.63% respectively, the accuracy is not low, but is relatively lower when compared with the other methods. The main reason is that these methods belong to conventional statistical models. When there is a large amount of data to be analyzed, they have shortcomings when compared with the intelligent statistical AODE and TAN methods based on big data research. (2) The accuracy of AODE and TAN methods is 85% and 84% respectively, which is relatively high. This is because the data set has a large and balanced sample size. If the data size is small, the prediction result is not necessarily better than the MD, SVM and LR methods. (3) GA-MD method, which is based on MD but is further optimized, has the advantages of high accuracy. High accuracy can be achieved without pursuing operational efficiency. The above analysis not only shows that the GA-MD method can solve the oil and gas distribution prediction problem, but also has improved accuracy compared to the current popular methods.
Accuracies of different methods.
(II) Validation of the probability map of oil and gas spatial distribution
The GA-MD model was trained using the training set with 203 exploratory wells and then applied to the calculation of the posterior petroleum probability for the samples in the grid data set. The contour map of hydrocarbon probability was made through interpolation, in which the units with the probability above 50% may have hydrocarbon accumulations. At the same time, we also used MD, TAN and AODE methods to predict the hydrocarbon spatial distribution.
Figure 6(a) and (d) show the oil and gas probability results predicted by MD, TAN, AODE and GA-MD, respectively. The map uses different colors to characterize the level of possibility of oil and gas in any site in the whole region. It can be found from the Figure 6 that the probability of hydrocarbon occurrence predicted by the four methods is the highest in the discovered reserves area (the blue curve), indicating that the predicted results of the four methods are highly consistent with the actual exploration results. A good model not only has a good prediction effect in the known reserves area, but also has a certain trend extrapolation ability, that is, the ability to predict the undiscovered oil and gas areas. It can be seen from Figure 6 that although the four methods have better prediction results in the discovered oilfields, the four methods have different distribution patterns outside the reserves. The analysis shows that the oil and gas probability distribution patterns in Figure 6(a) and (b) and (d) are obviously different. Figure. 6(a) and (b) shows more large areas with high probability of hydrocarbon distribution. The existence of these high probability areas does not conform to the laws of geology in terms of distribution form, and obviously exceeds the existing geological knowledge in the scope of distribution area. The distribution patterns of hydrocarbons in Figure. 6(c) and (d) are similar, and the prediction results are better, but there are still some differences. The distribution of hydrocarbon in the study area is controlled by many different factors. It can be seen from Table 6 that trap conditions are the most important, followed by reservoir and hydrocarbon supply conditions, and finally cap rock conditions. Through comprehensive analysis of the factors that control the distribution of hydrocarbon and the prediction results, we find that the areas with high hydrocarbon occurrence probability in Figure 6(d) are basically located in areas with higher hydrocarbon supply evaluation values and cap evaluation values, while some areas with high hydrocarbon occurrence probability in Figure 6(c) are located in the areas with lower hydrocarbon supply evaluation value and cap evaluation value, which indicates that GA-MD is more sensitive to hydrocarbon supply information and cap information than AODE. Based on the above analysis, it is considered that the prediction results of Figure 6(d) are relatively objective, and the probability map shape is more in line with the current exploration knowledge and geological laws.
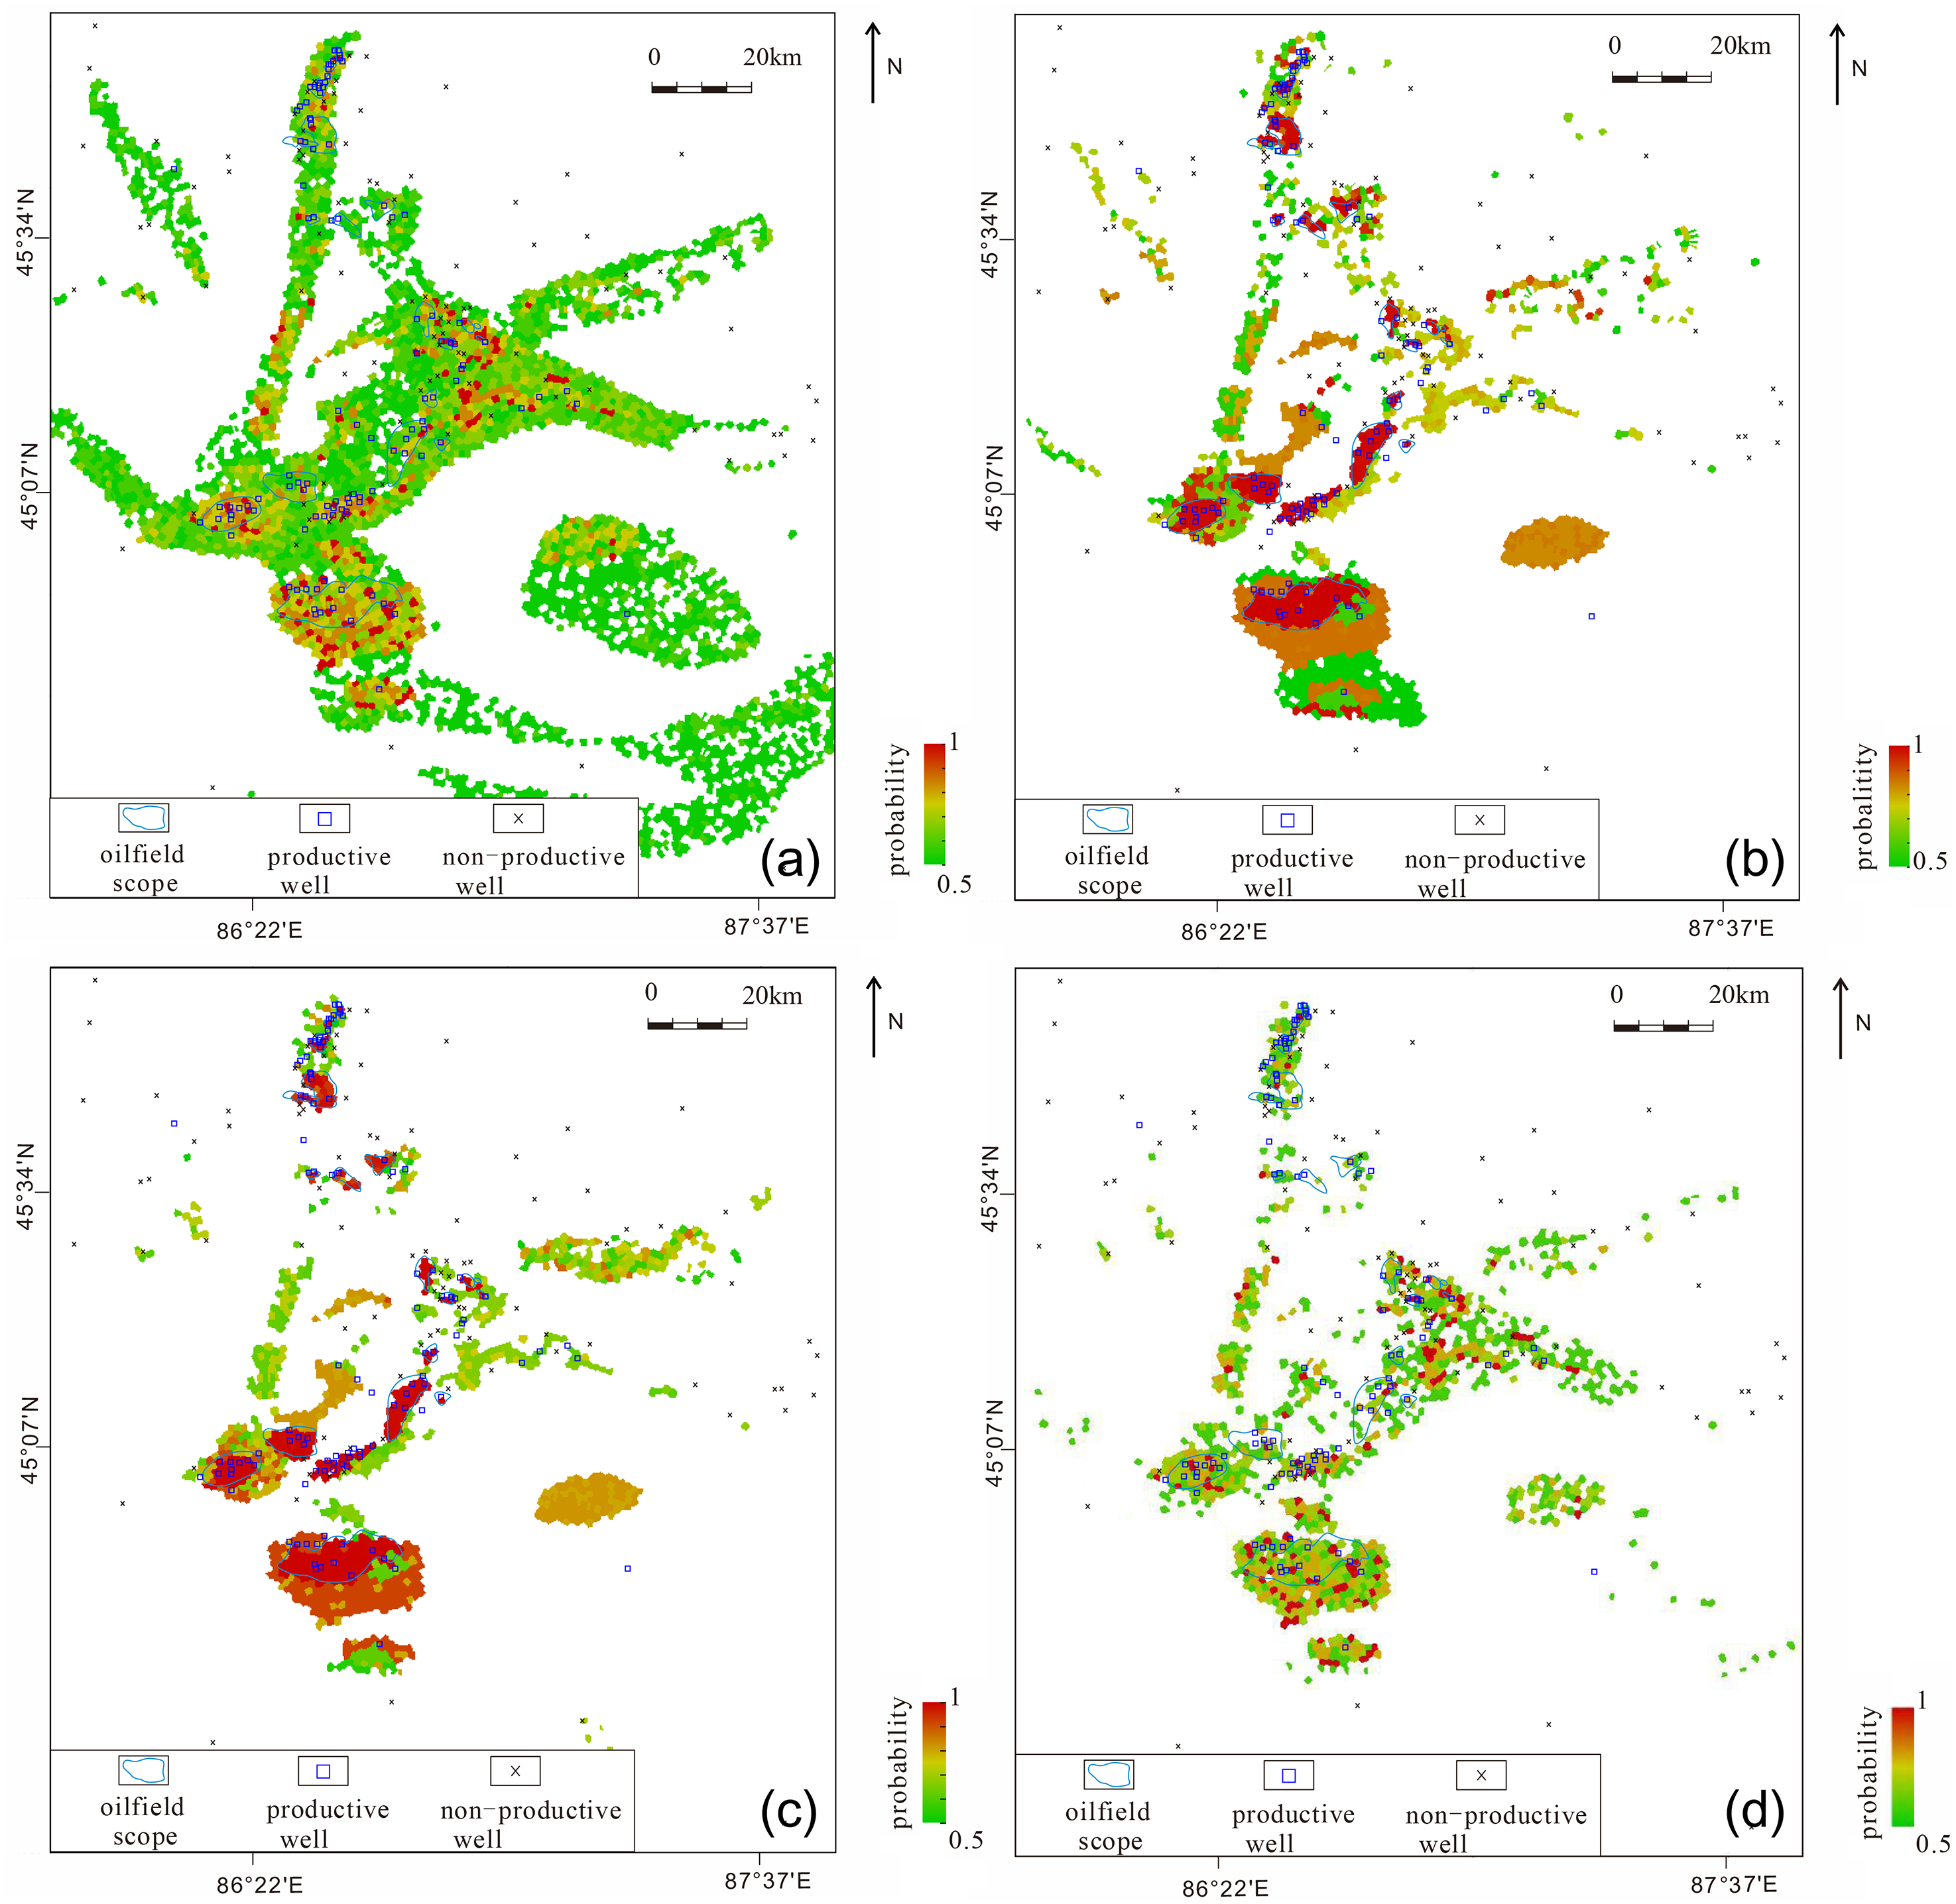
Prediction results of oil and gas spatial distribution in the Sangonghe Formation in the hinterland of the Junggar Basin(a: MD; b: TAN; c: AODE; d: GA-MD).
(III) Prediction of favorable areas for spatial distribution of oil and gas
Figure 6(d) shows that inside the areas with booked reserves, drilled productive wells occur in and close to the red zones with high hydrocarbon probability, and drilled non-productive wells occur in the zones (white color) with low oil probability. This means that the prediction agrees with drilling results. There are some prospects with the probability above 50% outside the areas with booked reserves, which could be classified into three types (Figure 7).
Type-I prospects extend in the perimeter of the areas with booked reserves, as plotted in Figure 7 by red solid lines in the mid-south and central parts. Type-II prospects are undrilled new areas, as plotted in Figure 7 by red dash-dot lines in the southeast and northwest. Type-III prospects are the areas with geologic complexities, where there were some hydrocarbon discoveries but no booked reserves, as plotted in Figure 7 by red dotted lines in the middle and northeast.
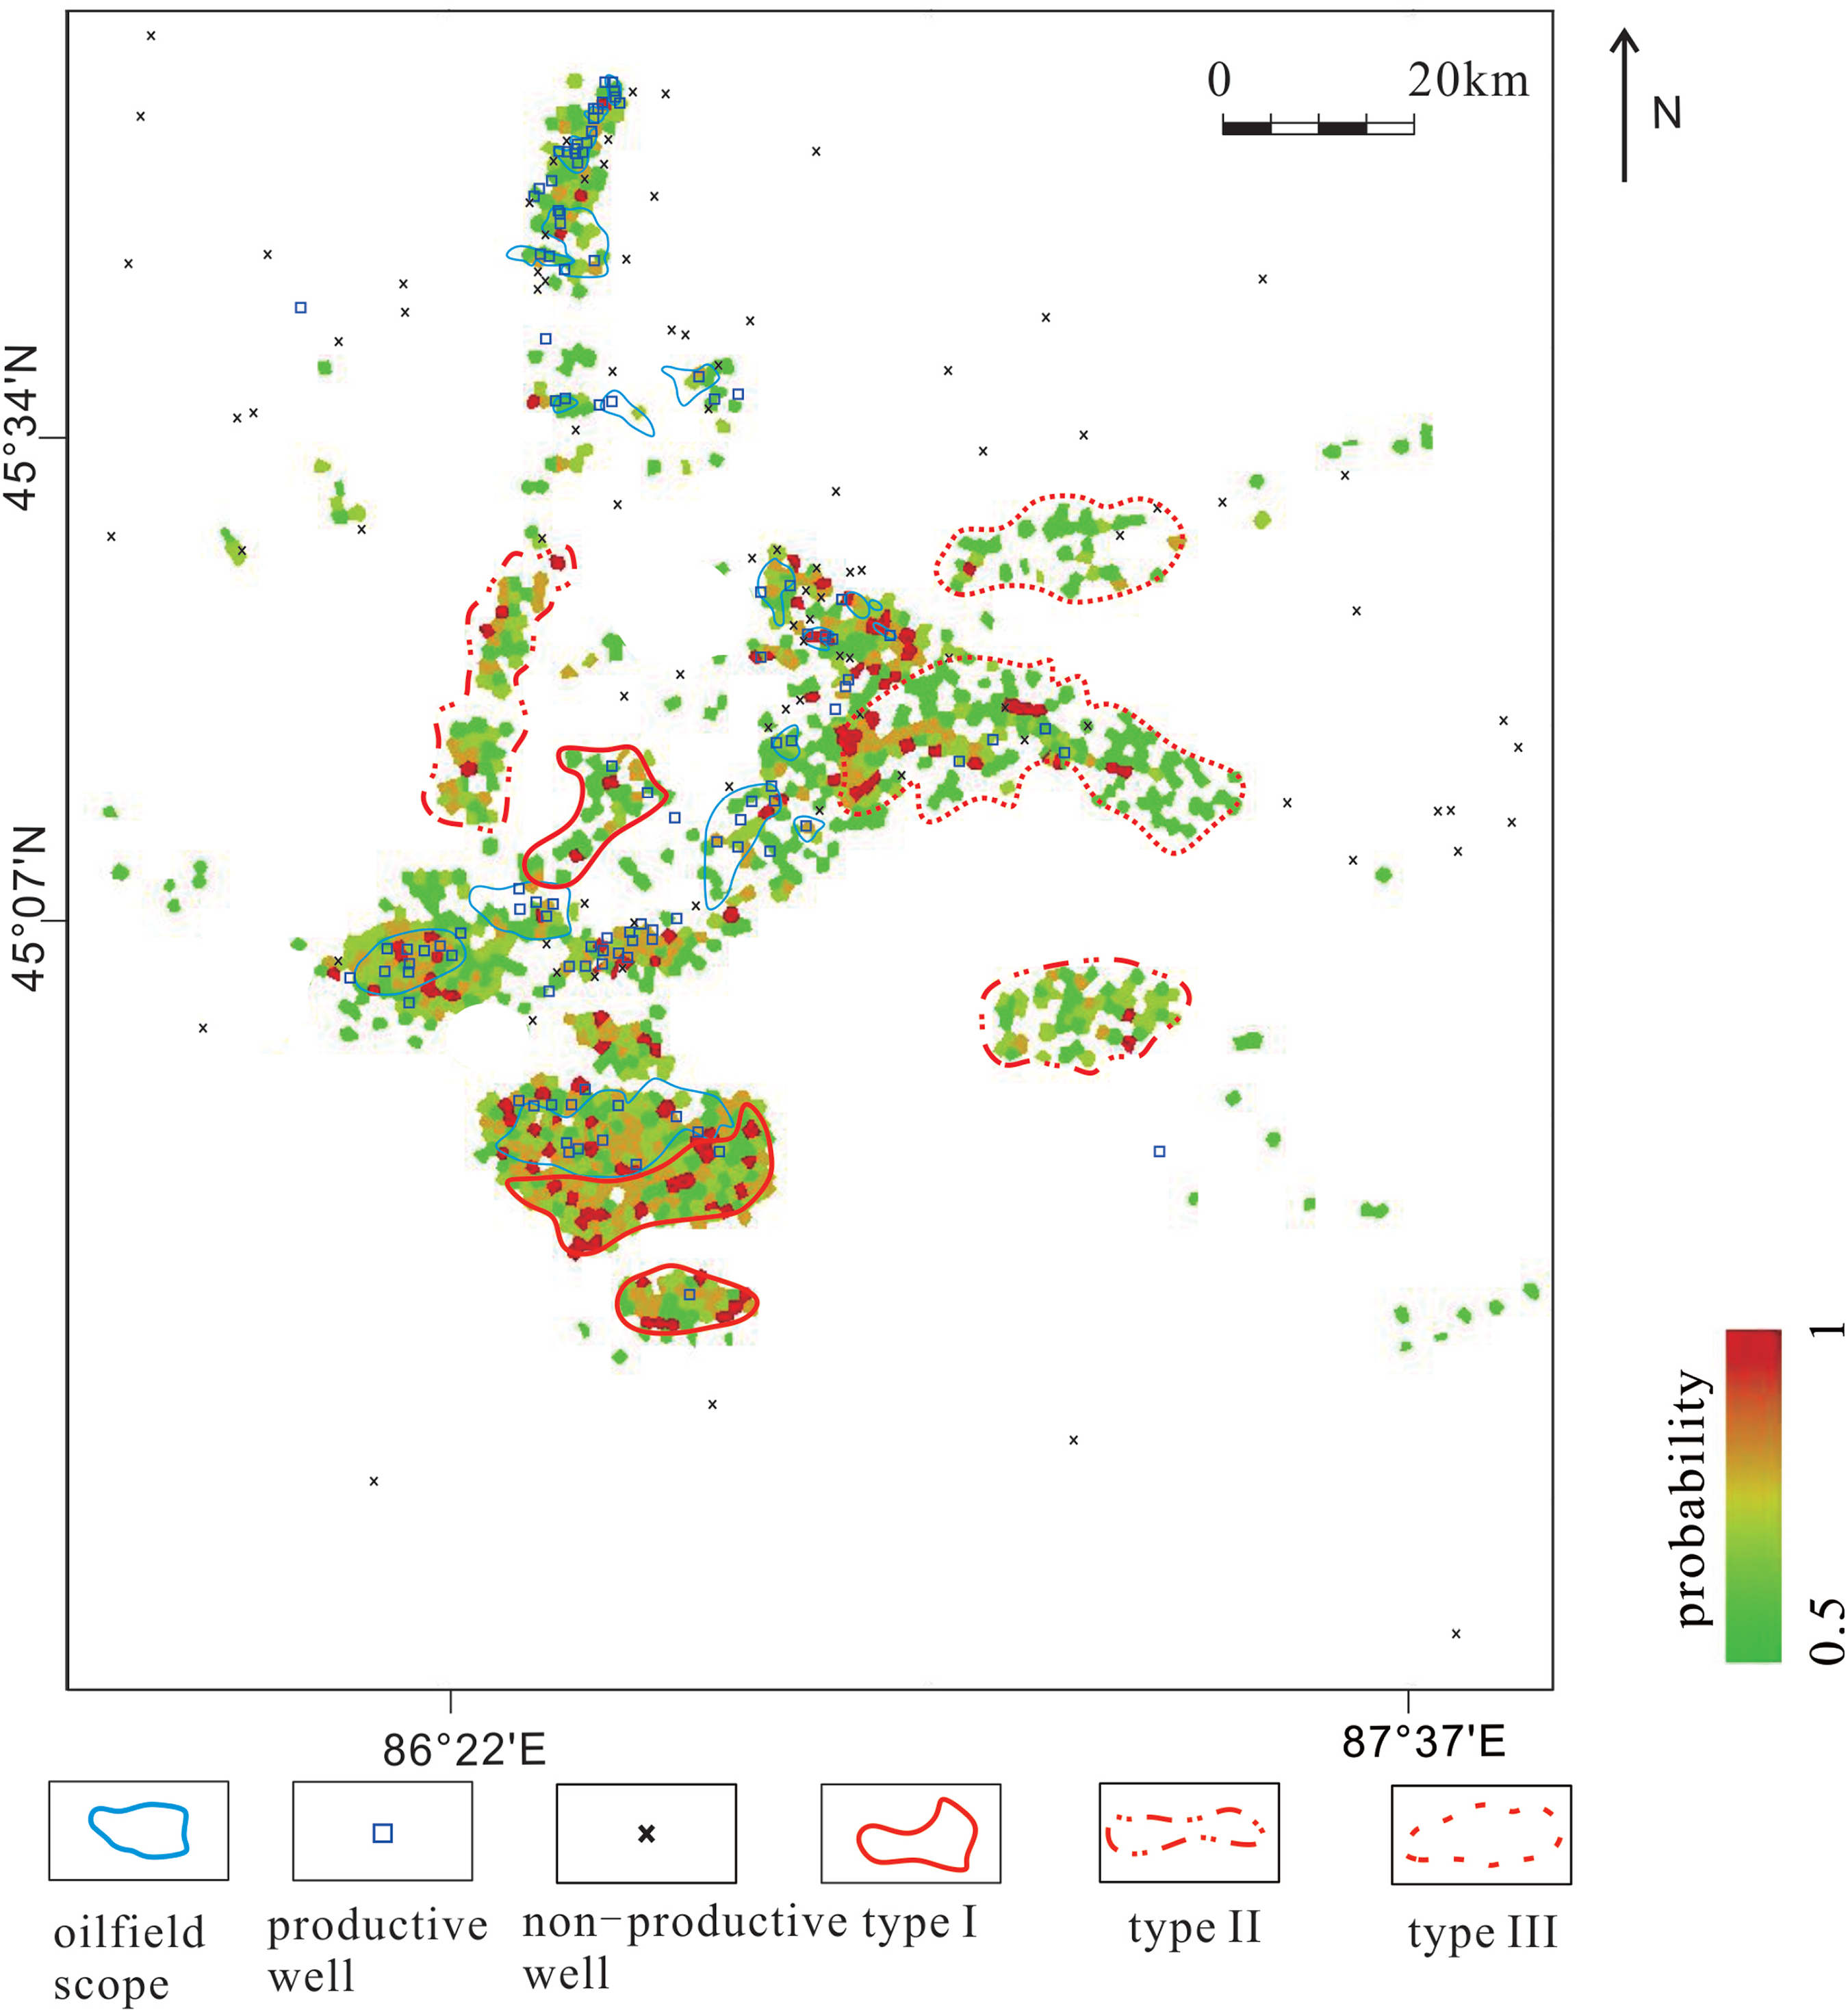
Sangonghe hydrocarbon probability map derived from GA-MD.
Type-I prospects predicted with high confidence are the focus of extension and rolling exploration. Type-II prospects predicted with high uncertainties are the focus of venture exploration activities. Type-III prospects with geological complexities require further investigation before progressing with drilling deployment and booking reserves.
Conclusions
This paper presents a novel MD method based on genetic algorithm for variable weight optimization and was applied to the prediction of spatial oil and gas distribution. The conclusions are as follows:
A case study of the Sangonghe Formation in the Junggar Basin shows the accuracy of GA-MD was 86.67%, which was higher than other five popular methods (MD, TAN, AODE, LR, and SVM). This demonstrates the validity and advantages of GA-MD. Compared with other methods, GA-MD method also shows its superiority and accuracy in probability map prediction. The accuracy of GA-MD is higher than that of MD in theory and practical application, which plays an important role in improving economic benefits of oil and gas exploration and production with huge investment. Through geological analysis and K-S verification of the training set, it is found that the traps in the study area play an important role, and it is suggested to give priority to finding traps in the next exploration. According to the prediction results of GA-MD for oil and gas accumulation in Sangonghe reservoir, three types of prospects were predicted outside the areas with booked reserves. Type-I prospects predicted with high confidence are the focus of extension and rolling exploration. Type-II prospects predicted with high uncertainty are the focus of venture exploration activities. Type-III prospects with geological complexities that require further investigation before progressing with drilling deployment and booking reserves. GA-MD prediction will facilitate exploration risk reduction in the study area and improved decision making for drilling optimization.
Although the GA-MD method proposed in this paper is superior to the MD method, it still has the following limitations: (1) There are many parameters that are not easy to determine; (2) In finite steps, the genetic algorithm may not be able to establish the global optimal solution; (3) The time complexity is high. Therefore, our future work will focus on the above limitations to optimize the GA-MD method and improve its performance. In addition, the application effect of GA-MD in the research area in this paper is better, but the application effect in other research fields needs further research.
Footnotes
Acknowledgments
We thank the editors and anonymous reviewers for their valuable comments on this paper.
Declaration of conflicting interests
The authors declared no potential conflicts of interest with respect to the research, authorship, and/or publication of this article.
Funding
The author(s) disclosed receipt of the following financial support for the research, authorship, and/or publication of this article: Funds for this paper come from China National Petroleum Corporation in major S&T projects, including Research on Key Technologies of Fine Exploration in Mature Exploration Areas (No. 2021DJ07), Evaluation Methods/Parameters and Potential of Shale Oil Resources (2019E-2601), and Shale Oil Exploration and Development Technologies (No. 2021DJ18).