
Abstract
Energy sharing within building complexes depends greatly on the complex load adaptability and policy support. However, most building complex microgrid research concentrates on configuration and operation optimization, rather than energy contributions from different users. The objective of this study is to analyze energy sharing ability and load adaptability for a building complex comprising multiple building types, under transaction liberalization restrictions in different energy markets. The specific research for this study is a smart community in Kitakyushu, Japan, with 49 buildings of different types. The complex's microgrid system in this study comprises photovoltaic, battery, and vehicle to grid services. We obtained six representative typical clusters by reducing the 49 buildings’ dimensionality using principal components and clustering, then Monte Carlo simulation to predict permissible discharge capacities for vehicle to grid (V2G) services. We propose three demand-side liberalization scenarios: self-use, photovoltaic feed-in tariffs (FITs), and free trade; optimizing system configuration under different scenarios using a genetic algorithm. Results confirm that shopping malls achieve best economic benefits with self-use scenario; whereas office building adaptability is more significant for the other scenarios. These results will contribute to user selection and system design for building complex microgrid systems.
Introduction
Global economic development and urbanization have increased fossil energy consumption and accelerated environmental degradation (Onifade, 2022; Savaş et al., 2022). All countries, worldwide, are transforming their energy systems to achieve carbon reduction goals (Castillo-Calzadilla et al., 2022), with many countries imposing considerable restrictions on fossil energy use (Alola et al., 2022). Introducing high proportions of renewable energy and electrification of fossil energy are currently the most recognized transformation pathways (Isik et al., 2021; Luderer et al., 2022).
Previous studies have shown that developing environmental related technologies can effectively reduce carbon dioxide emissions (Bekun et al., 2021; Onifade et al., 2022). However, introducing excessive renewable energy can impact current power grid stability (Kebede et al., 2022), and electrification will also lead to a significantly increased power demand, which will aggravate supply pressure for power grids (Ma et al., 2022). Demand-side energy conservation and efficient management (Pascual et al., 2021; Yu et al., 2020) can effectively reduce power grid burdens and contribute to their safe and reliable development (Saffari et al., 2018; Wang et al., 2021). Careful energy system construction and management on the demand side can also help shorten supply distances, reduce transmission losses (Kuiken et al., 2019), and effectively integrate users and microgrids (Li et al., 2018).
Research review of microgrid optimization
Optimization research for demand side microgrid systems can be divided into configuration and operation optimization (Ding et al., 2020; Ebrahimi, 2020). Microgrid components primarily include renewable energy, energy storage, gas-fired cogeneration (Cui et al., 2020), etc., and most previous studies have focused on these component's characteristics and mutual scheduling coordination (Arnaudo et al., 2019; Scheller et al., 2020).
The research objectives for this study include user impacts on Microgrids (Wang et al., 2019) and microgrid impacts on urban power grids (Zhang et al., 2021). In particular, we studied energy sharing to help analyze user impacts on the microgrid. Previous studies mainly focused on energy sharing between photovoltaic (PV), battery, and PV-battery hybrid systems (Jun et al., 2022; Li et al., 2022) proposed a sharing model for renewable energy in regional microgrids from game theory, and increased economic benefits for buyers and sellers by more than 40%. (Özge et al., 2022) proposed a PV-wind battery-EV hybrid system, and verified effects to improve both buyer and seller economic benefits through simulation. However, they did not consider EV reverse discharge to the building, nor change building types.
Research review of energy demand side market management
User energy consumption habits on the demand side can be conditioned to some certain extent by regulating electricity prices (Christensen et al., 2019; Zhao et al., 2020) and introducing reward and penalty systems for energy use (Alasseri et al., 2020; Zhu et al., 2020). However, most previous studies have focused on electricity prices, rewards, penalty strategies (Tang et al., 2019), and responses for the demand side (Antonopoulos et al., 2020), among others. Extensive studies have developed vehicle to grid (V2G) technology for electric vehicles (EVs) (Qian et al., 2020; Sovacool et al., 2020), where the EVs function as distributed energy storage units, assisting power grid regulation by charging and discharging as required (Mozafar et al., 2018). Charging and discharging connected EVs can help realize peak shaving and valley filling, power-frequency regulation, renewable energy power stabilization, and reactive power support for the power grid (Sadati et al., 2018). V2G technology can also assist with peak shifting charging or discharging to help mitigate introducing too much renewable energy on the demand side, by coordinating and cooperating with user power consumption behaviors, absorbing more renewable energy power.
Demand-side scenarios and current power-market liberalization policies suggest that power consumption will shift from planned-economy to manage-and-dispatch modes, which are dominated by the market and entirely partaken by consumers. Manage-and-dispatch modes can effectively reduce power demand during peak times (Lampropoulos et al., 2018) and realize balanced and optimal microgrid and main power grid configurations (Kiptoo et al., 2020). Feed-in electricity tariffs can effectively help to achieve environmental goals and offer incentive measures against carbon emissions from the construction sector (Wen et al., 2021). However, demand side market management studies rarely consider microgrid and building type adaptability, with similarly sparse research on V2G system impacts under different trading liberalization scenarios.
Content and contribution
Current microgrid optimization and demand side market management have several deficiencies.
Energy sharing research has mostly focused on PV and battery systems, with less emphasis on V2G or combining the three approaches. Few studies have considered different building types and degree of liberalization for market transactions. We obtain system configurations and output rules for PV-battery-V2G systems under three market modes: spontaneous self-use, PV feed-in tariffs (FITs), and electricity free trade based on actual object and price systems in Japan; We obtain PV-battery-V2G and energy sharing adaptability for six representative buildings types.
Therefore, the present study considered energy sharing ability and adaptability for PV-battery-V2G microgrid systems under different transaction policy restrictions and user types. Novelty and main contributions from this study can be summarized as follows.
This paper is structured as follows. Section ‘Introduction’ introduces microgrid, energy sharing, and energy market transaction backgrounds and research status. Section ‘Methodology’ provides the mathematical model for the equipment and the relevant research structures. Section ‘Case study’ applies the structure to a specific case study, reducing research object dimensionality using principal component and cluster analyses to obtains EV visit states through Monte Carlo simulation. Section ‘Result analysis’ presents the results and subsequent analyses for PV-battery-V2G microgrids under three market models and six building types. Section ‘Discussion and policy suggestions’ discusses these outcomes, presents subsequent policy suggestions, compares research conclusions, and suggests future guidelines for Microgrid and energy sharing for Japan and similar countries and regions. Finally, Section ‘Conclusion and prospect’ summarizes and concludes the paper, and discussing some possible future research avenues.
Methodology
Figure 1 shows this study's research method and experimental procedures. Dimensionality for 49 building load types are reduced by factor and cluster analysis, obtaining six representative building load groups. Then visit time and remaining EV power are obtained using a Monte Carlo approach, to provide the allowable discharge to participate in V2G services. A mathematical model for microgrid systems based on PV, battery, and V2G is then established, and the configuration optimized using the genetic algorithm. Three demand-side liberalization scenarios are considered.
Spontaneous self-use; Photovoltaic feed-in tariffs; Electricity free trade.
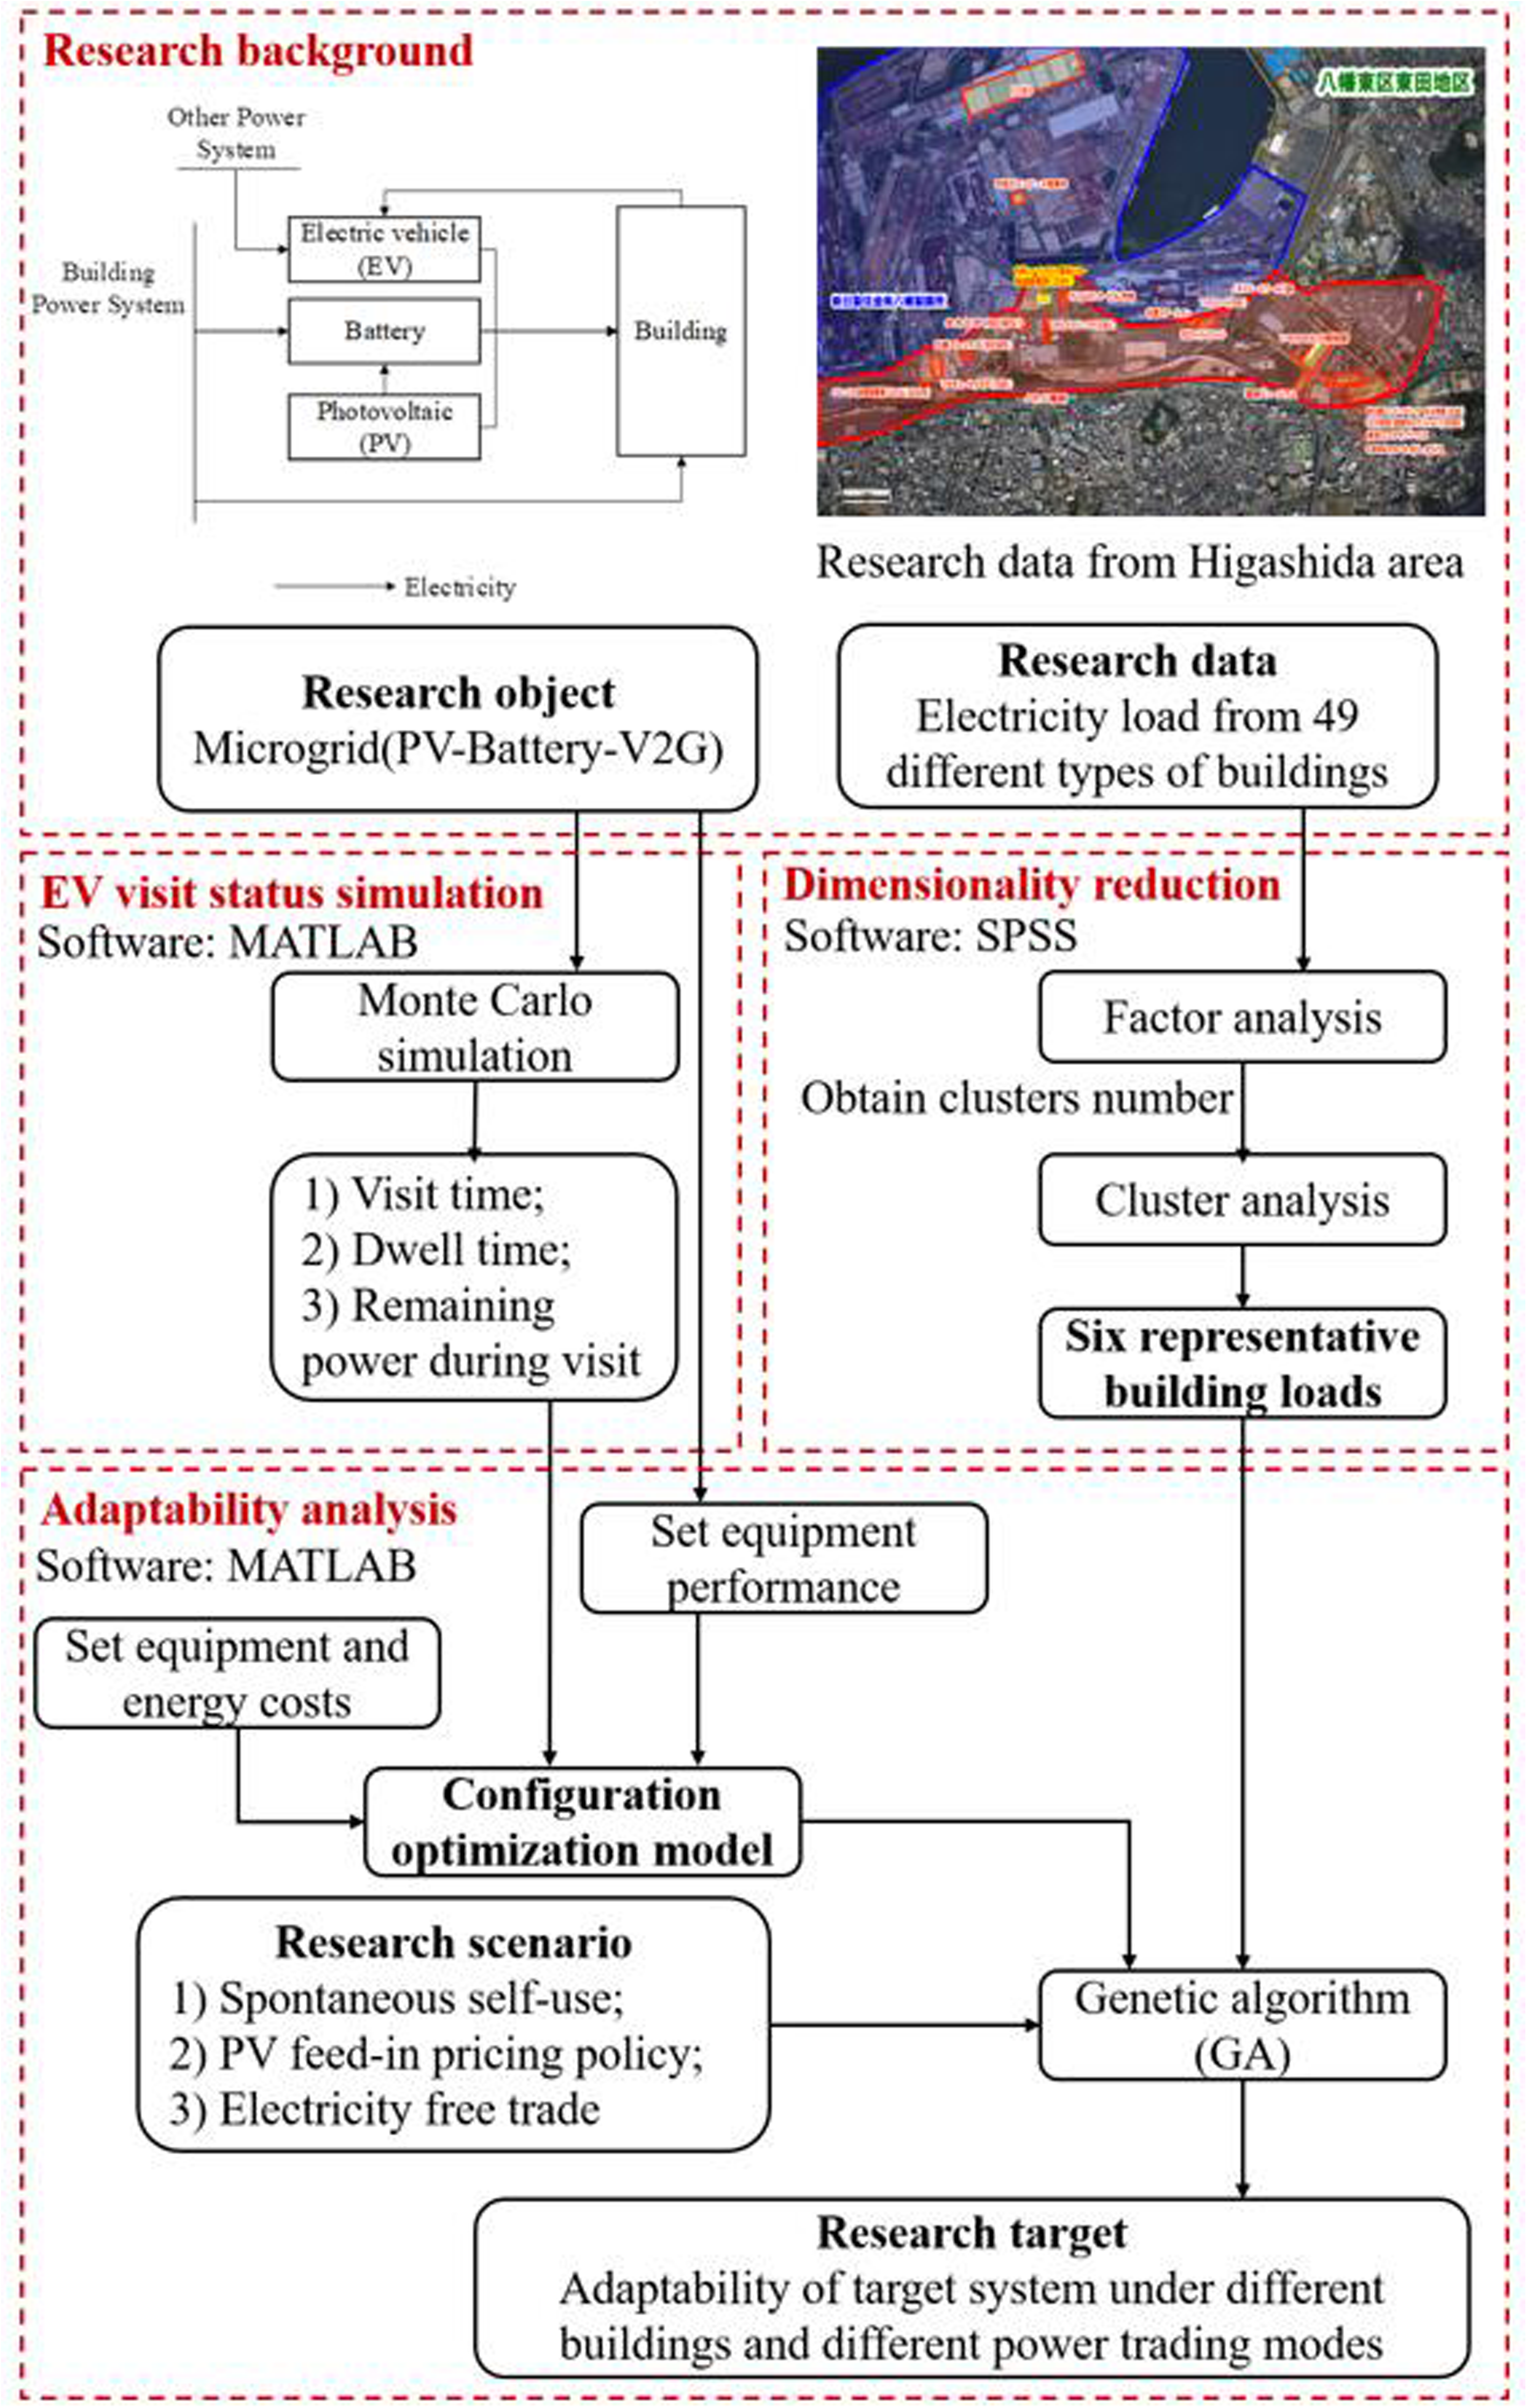
Research method and process (picture source: Toyozo, 2015).
Finally, we compare optimization results for the adaptability of microgrid under the three transaction modes, and the matching degree of microgrid under different building types.
Microgrid electricity balance
This study focuses on optimizing demand-side microgrid systems. Conventional microgrid system is a hybrid of renewable energy, gas-fired generation, and battery., where gas-fired generation is mostly used in cogeneration systems due to high natural gas pricing in Japan. Therefore, this study only considered PV and battery combinations, with V2G systems to form novel microgrids.
Photovoltaic systems store surplus electrical energy in batteries while generating electricity. Furthermore, the battery in the building electricity system stores electrical energy at low costs and distributes electricity at high prices. EV remaining power is uncertain when they reach the target building parking. Hence the EV requires charging when remaining power is low, and can be discharged when residual power is high and the building has high power demand, as most advantageous given time differences between peak and valley electricity prices. Thus, discharging EVs at sufficient scale can effectively reduce building load demands. The balance between electrical supply and demand for the system can be expressed as

Monte Carlo simulation and visiting vehicle model
Monte Carlo simulation is a statistical method to consider probability events as simulation objects. The method is suitable to simulation random events with certain regularity, and is typically used to verify energy equipment and system reliability, and V2G systems. The current study used Monte Carlo simulation to simulate maximum permissible discharge capacity for EVs participating in the V2G system that visited the buildings (Qian et al., 2020).
Visit status
EVs were considered completely charged when they leave their residence each day. Logarithmic variation of EV daily mileage variation is normally distributed and can be expressed as (National Household Travel Survey (NHTS), U.S. Department of Transportation; Li et al., 2012)

An EV can participate in V2G services for reverse discharge if its residual electricity exceeds 50%. Residual electricity for a visiting EV with unknown mileage can be estimated as

Charge–discharge model
The charge–discharge model for EVs can be expressed as the state model of their battery,

Economic model
V2G system discharge loss and elastic coefficient
Discharging an EV incurs battery losses that should be considered as discharge cost,

We introduce an elastic coefficient based on user behavior to reflect that not all EV users with more than 50% residual capacity may be willing to participate in V2G systems, and the proportion willing to discharge is related to discharge cost (Tong, 2017),

Energy cost model
Energy cost for the demand-side microgrid system can be expressed as


Objective function and boundary conditions
One objective for this study was to minimize total energy cost, i.e.,


Case study
Case introduction
We selected the Higashida area (Toyozo, 2015) in Kitakushu, Japan as the target for this study. Higashida is a core of an environment-friendly city, and has been working toward developing a smart community since its establishment. Thus, several green energy and smart energy demonstration projects have been developed in the area, such as distributed roof PV, hydrogen energy, and energy-saving housing. Electricity load data collected for this study represent different building type situations, hence they reflect high practical applicability.
Figure 2 shows 49 buildings in the Higashida area were selected, with yearly (8760 h) electricity loads sorted in descending order. We adopted 0–1 normalization to facilitate comparison.
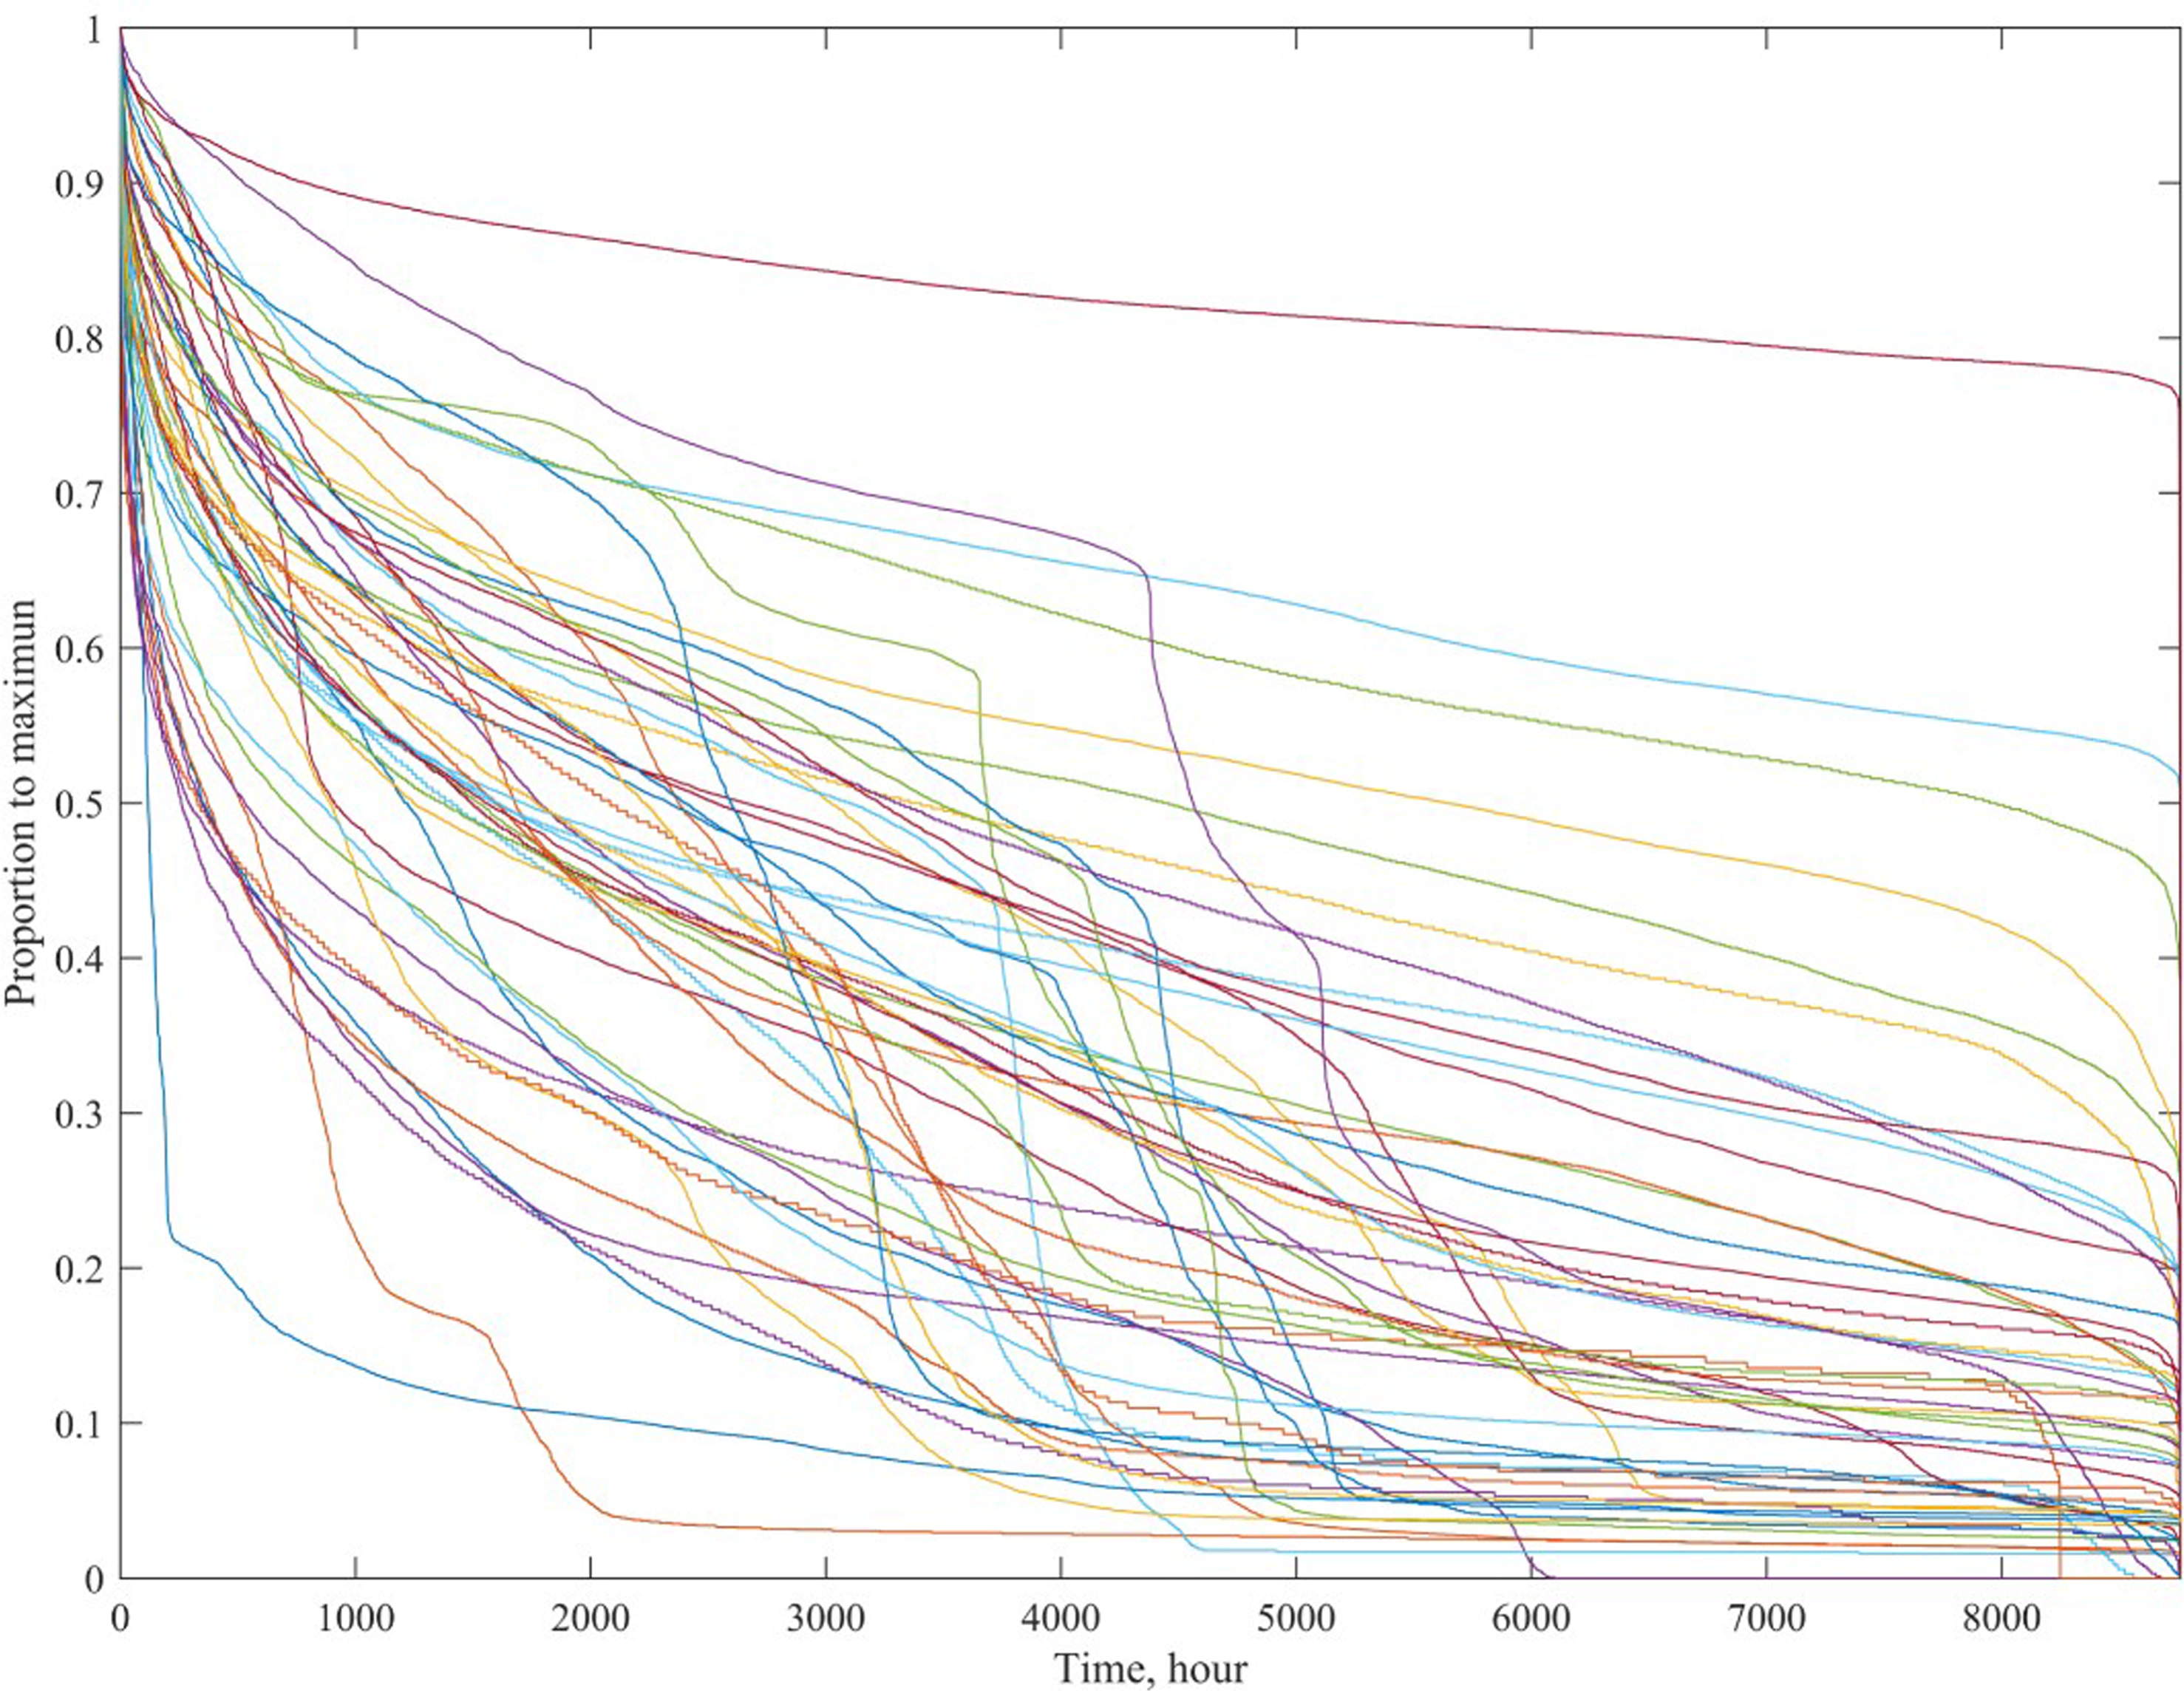
Normalized hourly electricity load ranking for the selected 49 buildings in Higashida (data source: actual measurement).
There are significant differences between building load variations, but with overall similar trends. For example, the top red shows the annual minimum load for that building was maintained at greater than 75% of the maximum load, and annual load change was relatively gentle. Several buildings exhibit significant steps around 4000 h, confirming these buildings had relatively regular load cycles, such as typical office and commercial buildings with low loads at night and high loads during the day. Since the load is sorted in descending order, higher loads appear at the front and low loads (e.g. nighttime) at the back, forming a step shape.
Table A1 (Appendix) shows building types and detailed load characteristics for the selected buildings, including total electricity load (TEL), average load (AL), load standard deviation (LSD), and coefficient of variation (CV). TEL and AL represent electricity demand volume, and LSD and CV represent load fluctuations. Commercial and office buildings account for the largest proportion of the selected buildings, but the various buildings exhibit quite different load characteristics even within the same type. Therefore, we reduced power usage dimensionality using factor and cluster analyses to identify the most suitable representative for the typical load as the target for optimization.
Load analysis and dimension reduction
Factor analysis
Building loads were normalized onto [0100] to better indicate load characteristic impacts, and characteristic values for the different building loads were calculated using SPSS. Factor analysis eigenvalue contributions reduced from 25 (initial) to 1.33 for the 6th building in a group, with subsequent building contributions < 1. Therefore, loads for the 49 buildings can be characterized using loads from 6 buildings, i.e., optimal number of clusters = 6.
Cluster analysis
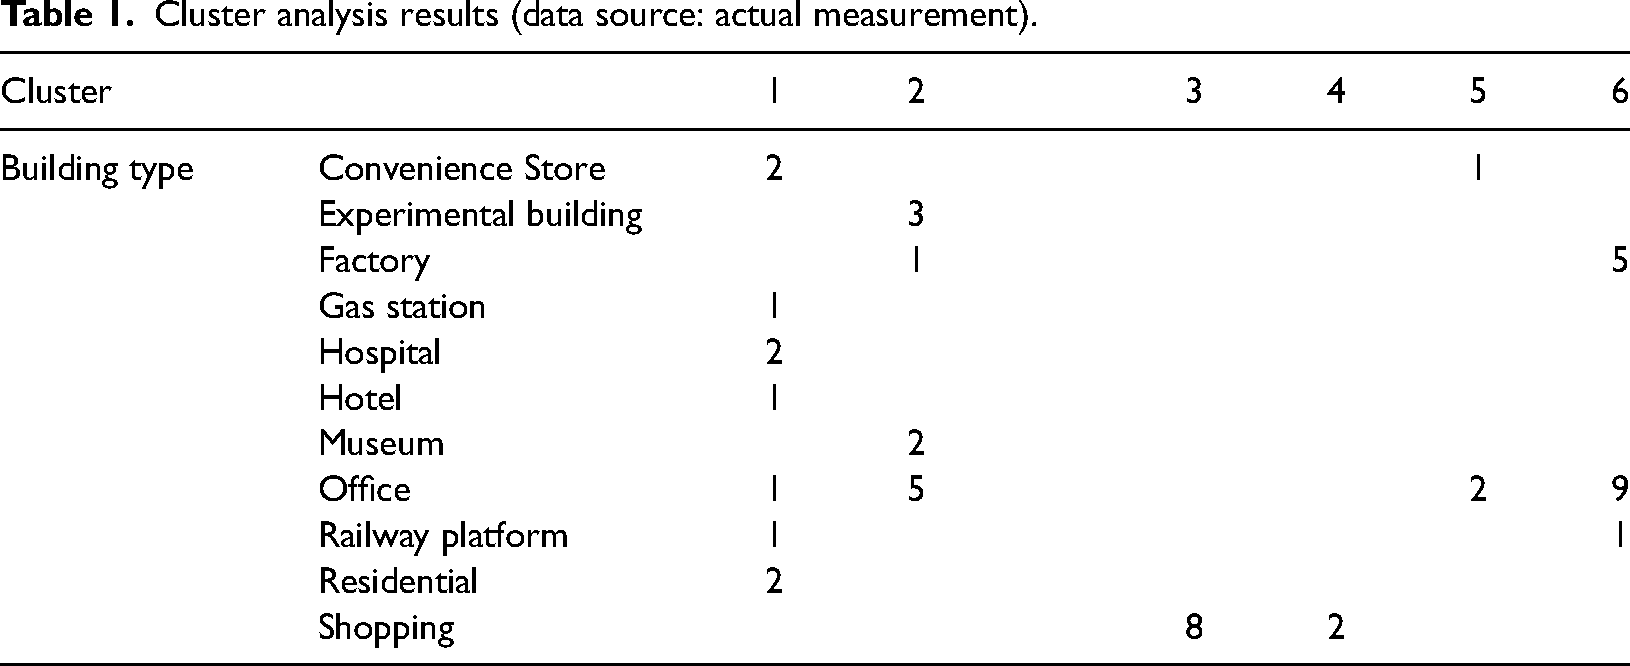
Table 1 shows k-means cluster analysis on six clusters, using load volatility data from Table A1. Cluster 1 primarily represents residential buildings, hotels, hotels, and other buildings with low load volatility and electricity demand during both day and night. Clusters 2, 5, and 6 primarily represent office and factory buildings, with load fluctuations least significant for cluster 5, cluster 2 includes buildings with fewer working hours than those in the other clusters, and longer working times for buildings in cluster 6. Clusters 3 and 4 represent commercial buildings, with cluster 3 primarily including shopping malls with relatively less significant load changes during business hours, whereas cluster 4 buildings have relatively high load demand during the morning.
Cluster analysis results (data source: actual measurement).
Monte Carlo simulation for EV discharge capacity
Electric vehicle visiting state and residence time in the different buildings comprising the clusters were estimated by Monte Carlo simulation as follows.
Business hours for the target building were set, where parking lots were closed outside business hours, i.e., no visiting EVs. Building electricity load demands during business hours were due to commonly used equipment and personnel densities. Therefore, a positive correlation was assumed between electricity load and number of visiting EVs. The total number of EVs visiting each target building was assumed to reach its maximum each month, and the time when EVs did not visit was calculated according to the ratio of hourly to monthly maximum electricity load. Visiting EV per hour was calculated from expected and standard deviation for vehicle mileage during the different time periods. We set expected EV dwell time = 1.5 h with standard deviation = 1 h derived from visiting EV statistics for each target building from Google Maps. Unit hourly discharge capacity for an EV was assumed to be the same as charging rate (6 kW). Figure 3 shows hourly EV discharge capacities for each V2G charging and discharging unit for different periods, calculated by superimposing all building values over the time periods and divided by the number of charging piles (fixed at 100 per building). Although EV visiting time and electricity load are correlated, maximum discharge capacity appears one hour prior to business timings due to different EV stay times. Although this is inconsistent with the load demand, it more accurately reflects the true situation.
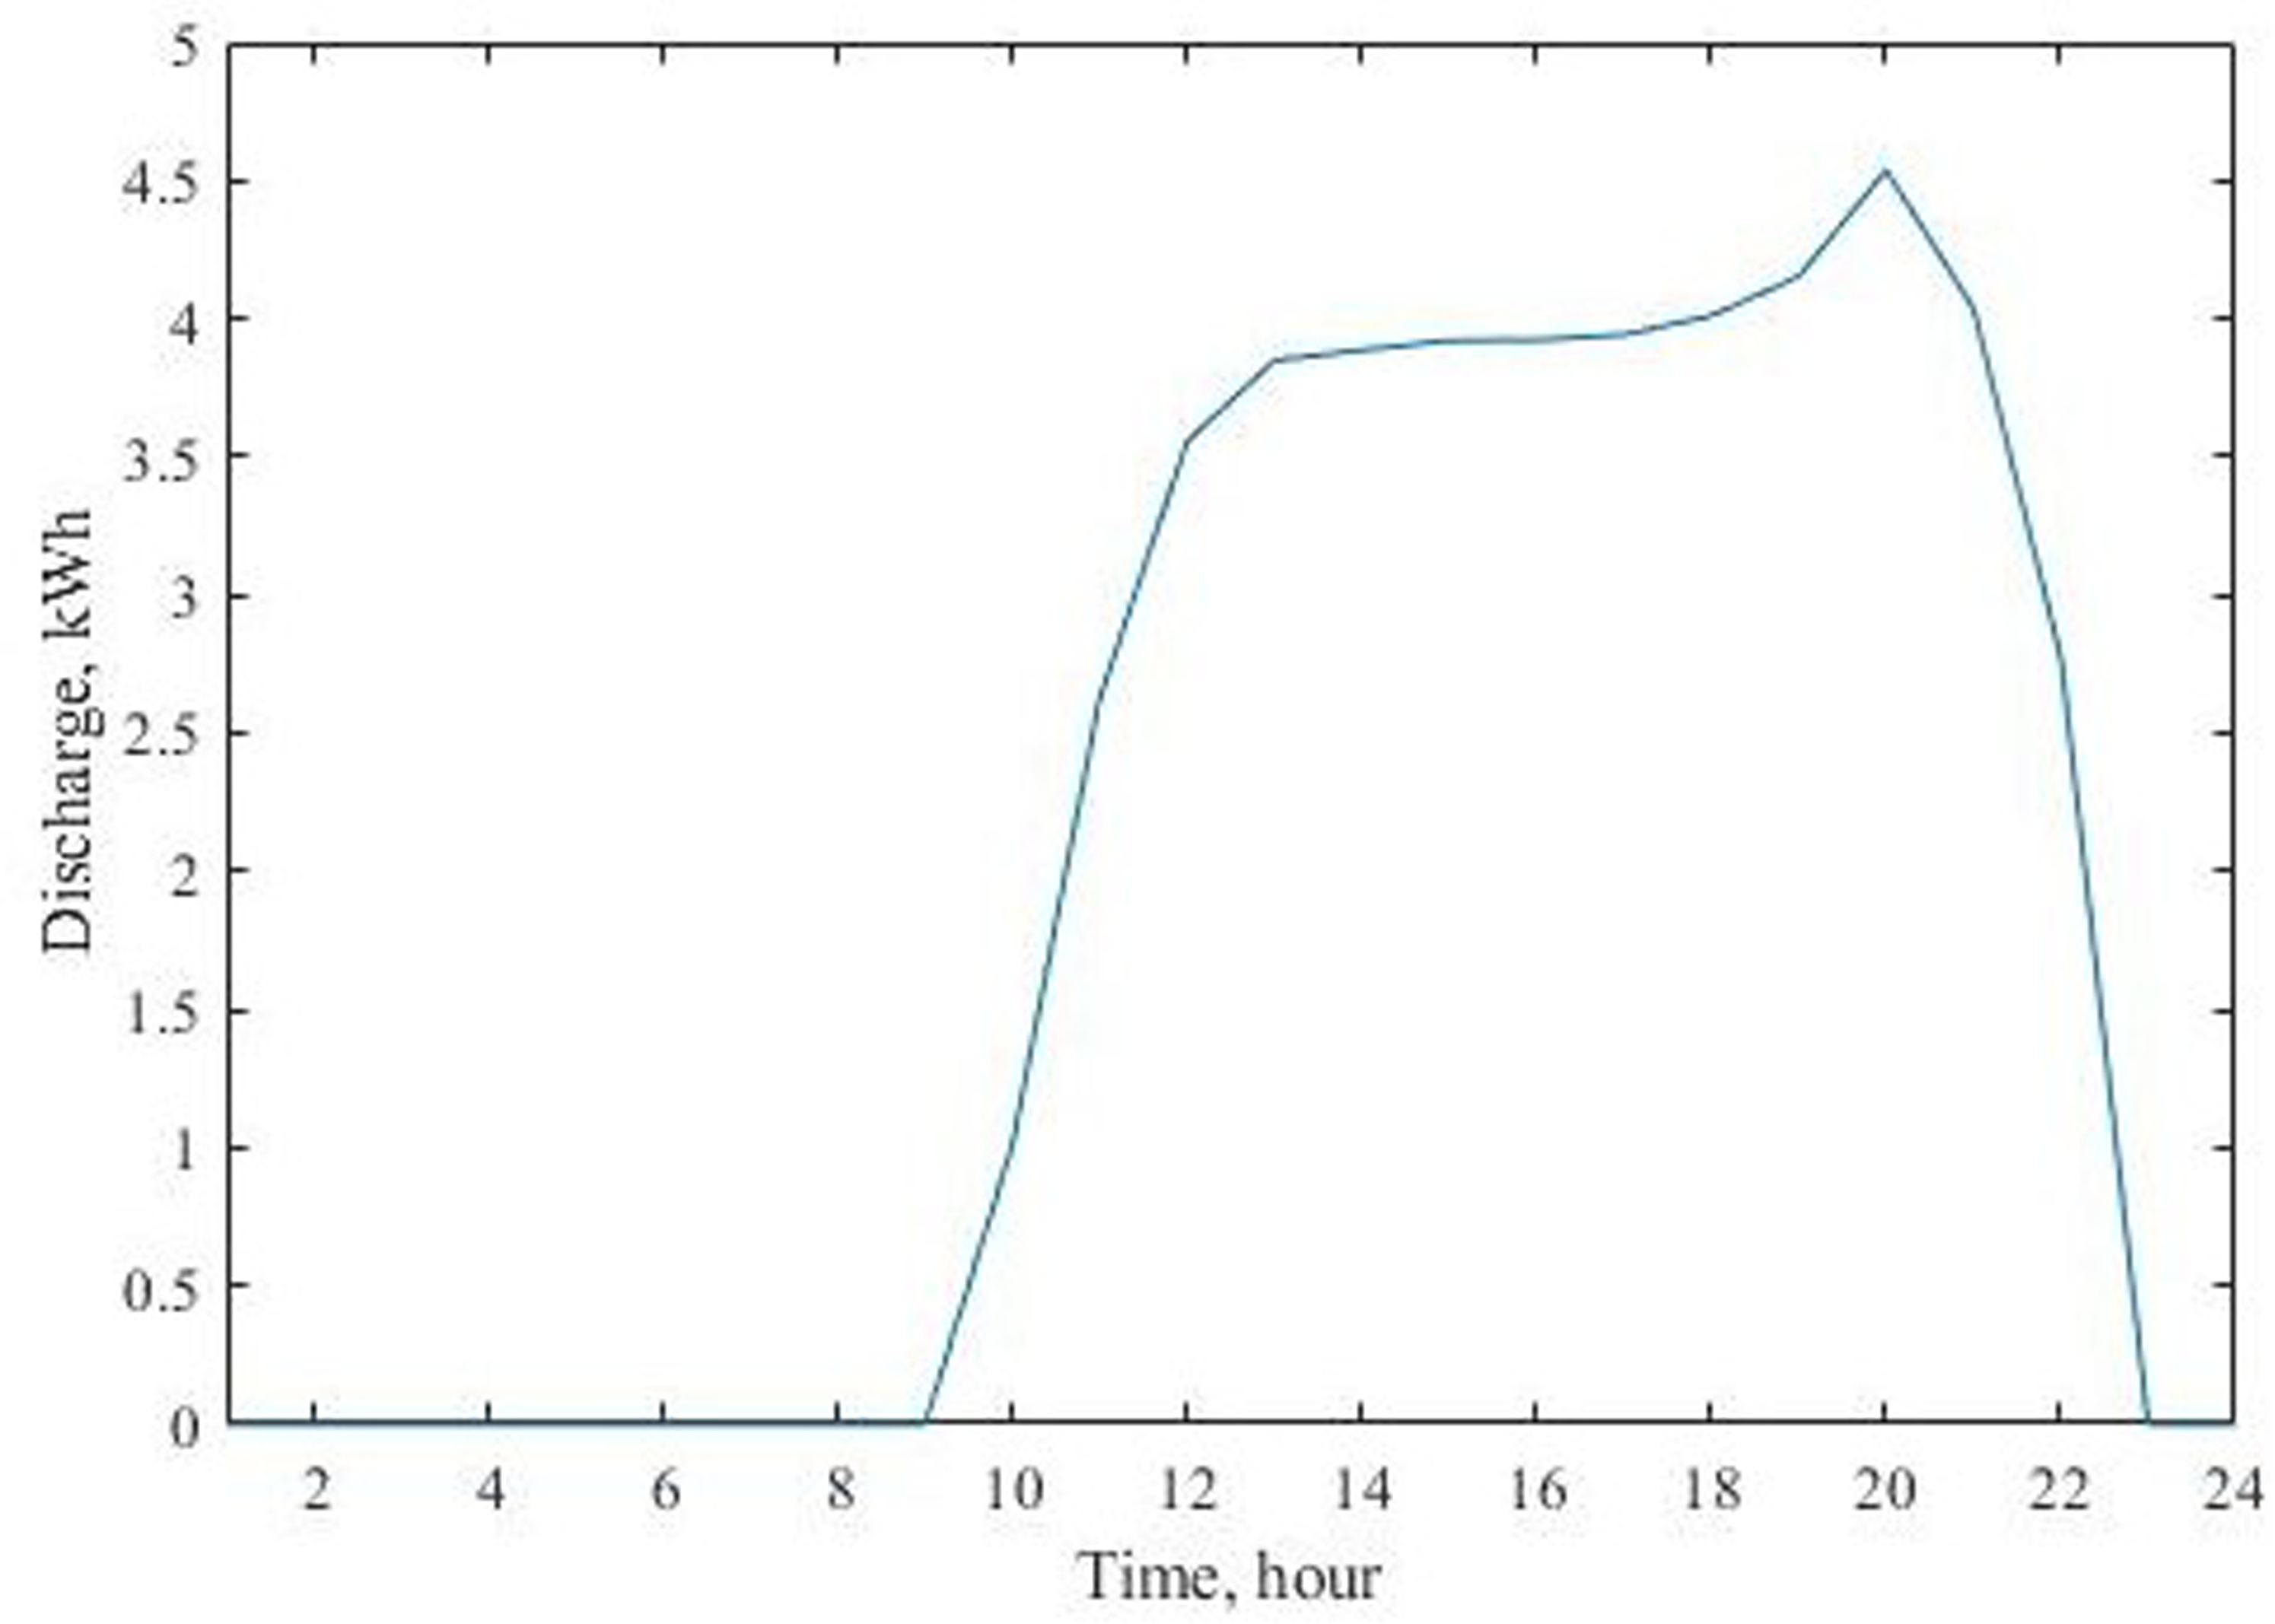
Typical daily discharge capacity for each V2G service unit in cluster 3 (data source: google maps).
Assumptions and basic parameters
The EV simulations implied the system may be limited by objective conditions and that actual operation was somewhat more complex. Therefore, the following assumptions were applied.
Maximum instantaneous reverse discharge load to the target building from a participating EV does not exceed the electricity load demand for the target building and surplus discharge is not stored in the microgrid energy storage battery. Excess PV generated power that cannot be consumed in time can be stored or the load demand changed. V2G technology can use PV power generation and load forecasting to perform collective discharge in advance after obtaining information of possible light abandonment. Then collective EV charging can be undertaken when light abandonment occurs, absorbing the waste light through load flexible scheduling while keeping constant overall power demand. Therefore, we assumed the proposed battery and V2G operational strategy was supported by sufficiently accurate load forecasting. Energy storage batteries can only be charged and discharged once a day. PV is somewhat restricted due to limited roof area. Therefore, we assumed maximum PV penetration = 20%, and optimal energy storage and V2G configurations were calculated with different PV penetration = 0–20% at 2% intervals. A distributed roof PV system operated near the study area, with annual effective utilization time = 940 h. Therefore, this study used this nearby system as a reference to calculate annual PV 8760 h power generation.
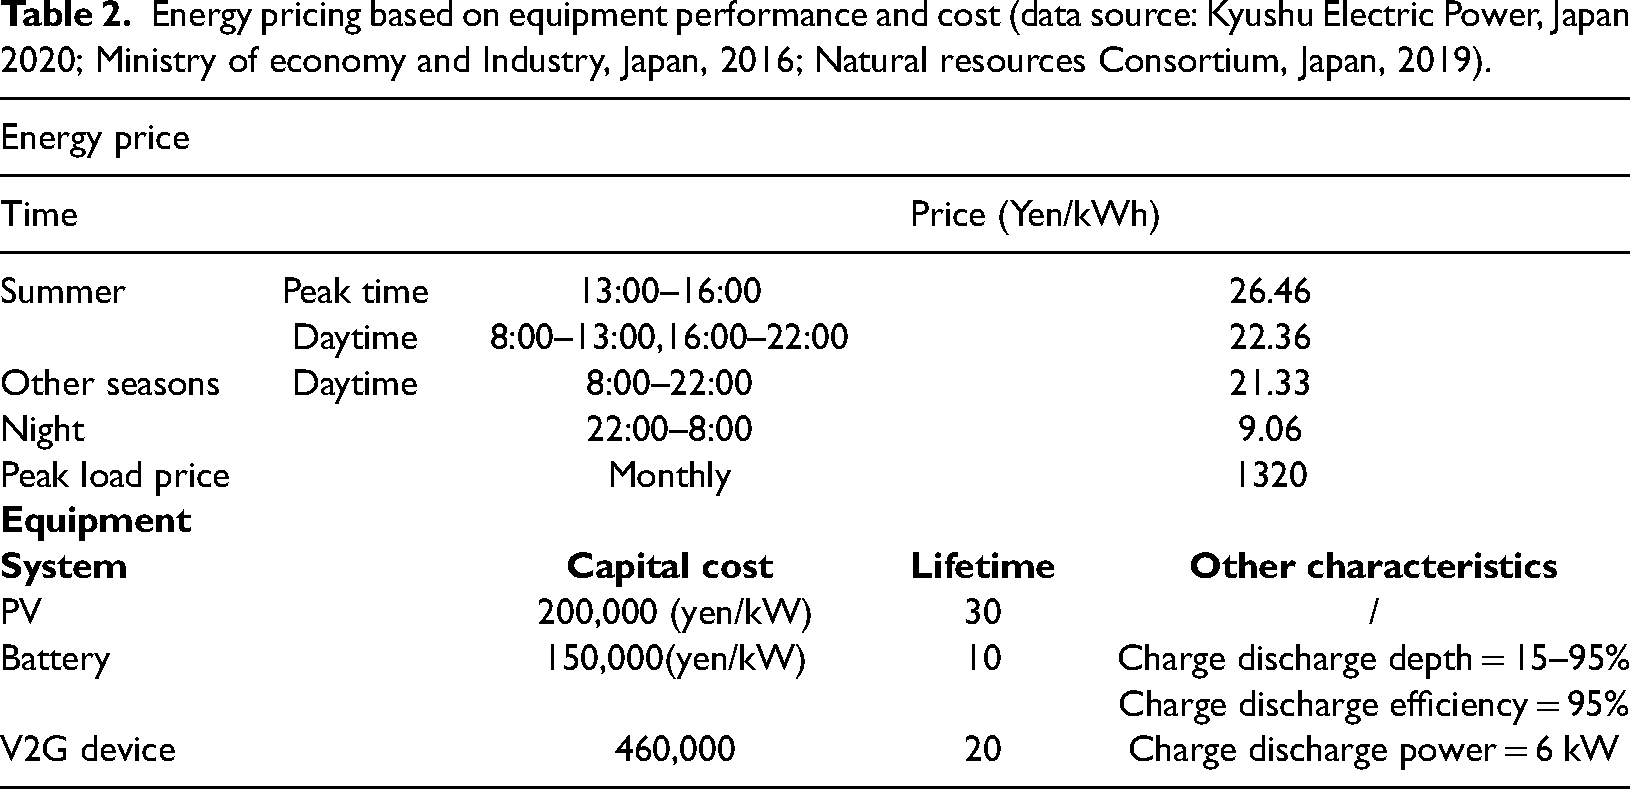
Table 2 shows equipment performance and cost parameters employed for optimization.
Energy pricing based on equipment performance and cost (data source: Kyushu Electric Power, Japan 2020; Ministry of economy and Industry, Japan, 2016; Natural resources Consortium, Japan, 2019).
Result analysis
The demand-side microgrid system was modeled and optimized by combining PV, battery, and V2G services; and the system was optimized for three cases based on the degree of liberalization on the demand side:
Case 1. Spontaneous self-use: All electricity generated by users was consumed by themselves. Case 2. PV feed-in tariffs (FITs): Users were allowed to use or sell generated PV power to the grid. Case 3. Electricity free trade: Users in one or more buildings with high adaptability microgrid systems were responsible for constructing the microgrid and controlling surplus electricity trading with users in other buildings.
Spontaneous self-use
Users cannot sell surplus electricity to the electricity grid for Case 1. Therefore, surplus PV energy storage must be prioritized, and PV energy that cannot be stored is treated as light abandonment. Figure 4 shows reduced energy cost for the six clusters for each 2% PV penetration increase at different rates. Basic energy cost reduction = 1–1.5%, with largest reduction for the six clusters = 13–14% when PV penetration = 20%.
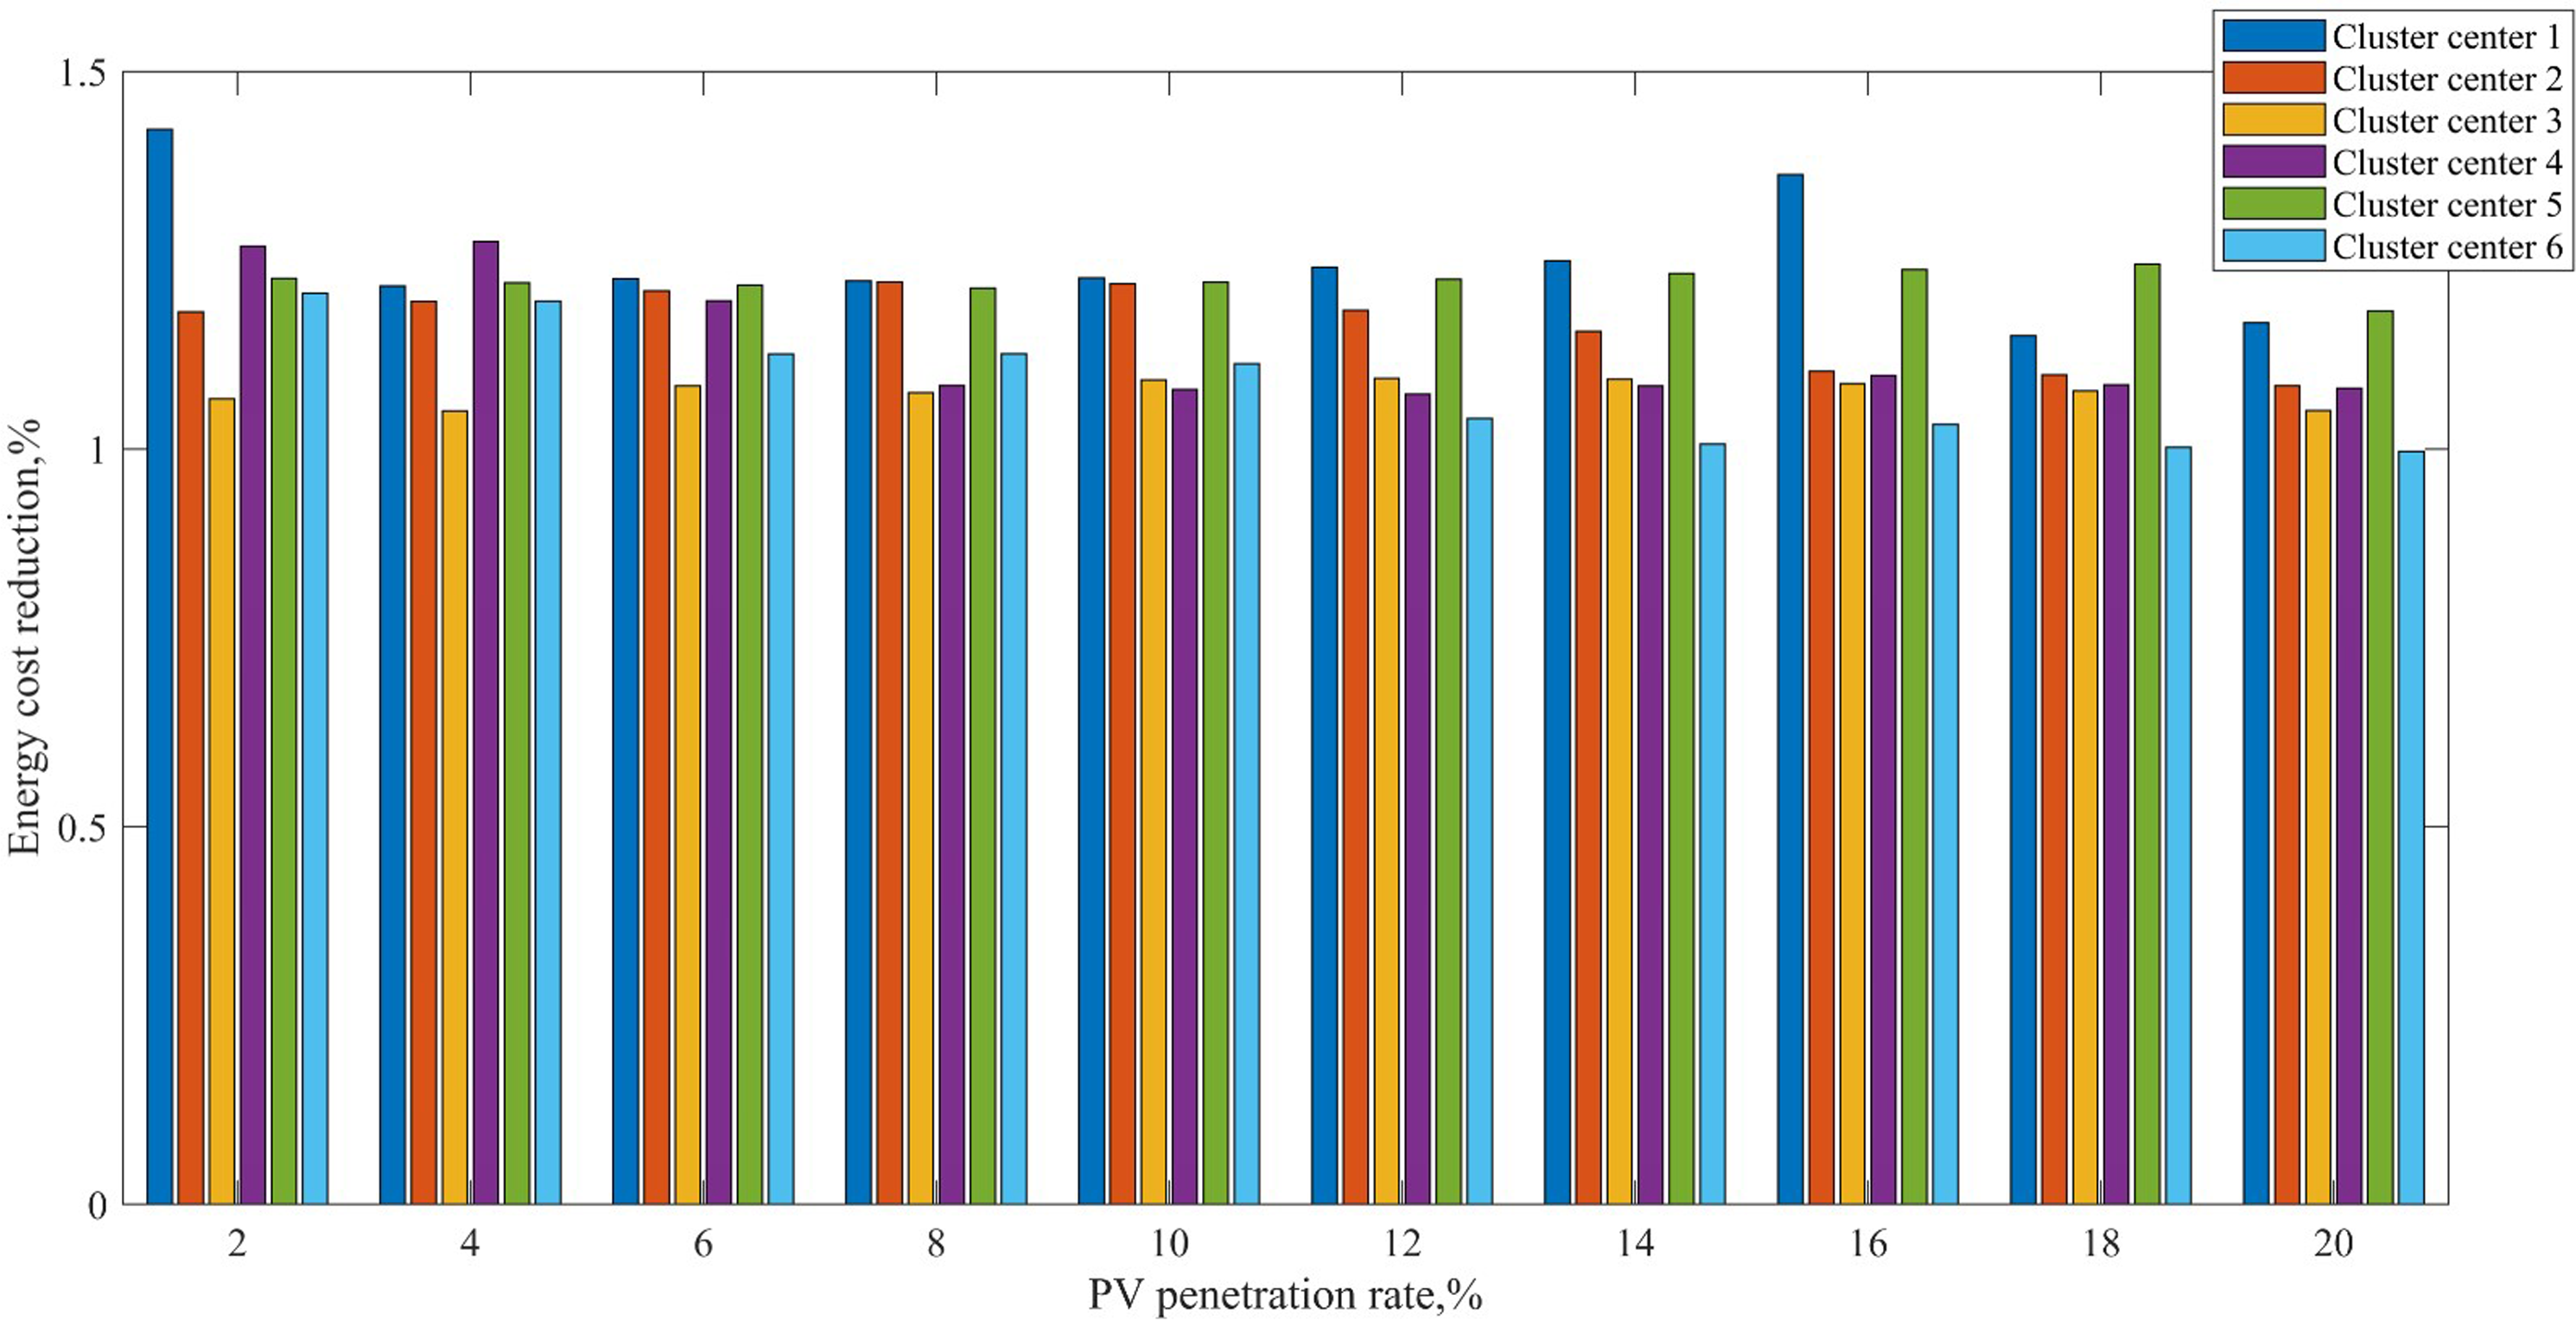
Energy cost reduction for different PV penetration (data source: actual measurement and Table 2).
Construction demand-side microgrid systems in the six clusters has high economic benefits, but optimal equipment configuration differs considerably for each cluster. Figure 5 shows optimal V2G devices for different PV penetration rates. PV has great impact on economic benefits from V2G equipment since PV power sale revenues increase with PV increasing PV penetration. Unit revenue for V2G services reduces with increasing demand, reducing V2G equipment cost However, energy cost reductions fluctuate within a fixed range, implying that clusters 1, 3, and 5 have several V2G devices initially, but the requirement reduces (quickly for cluster 5 and more slowly for cluster 3) with increasing PV penetration. V2G services in clusters 2, 4, and 6 do not generate sufficient economic benefits initially, and hence equipment costs in those clusters are maintained within a low range.
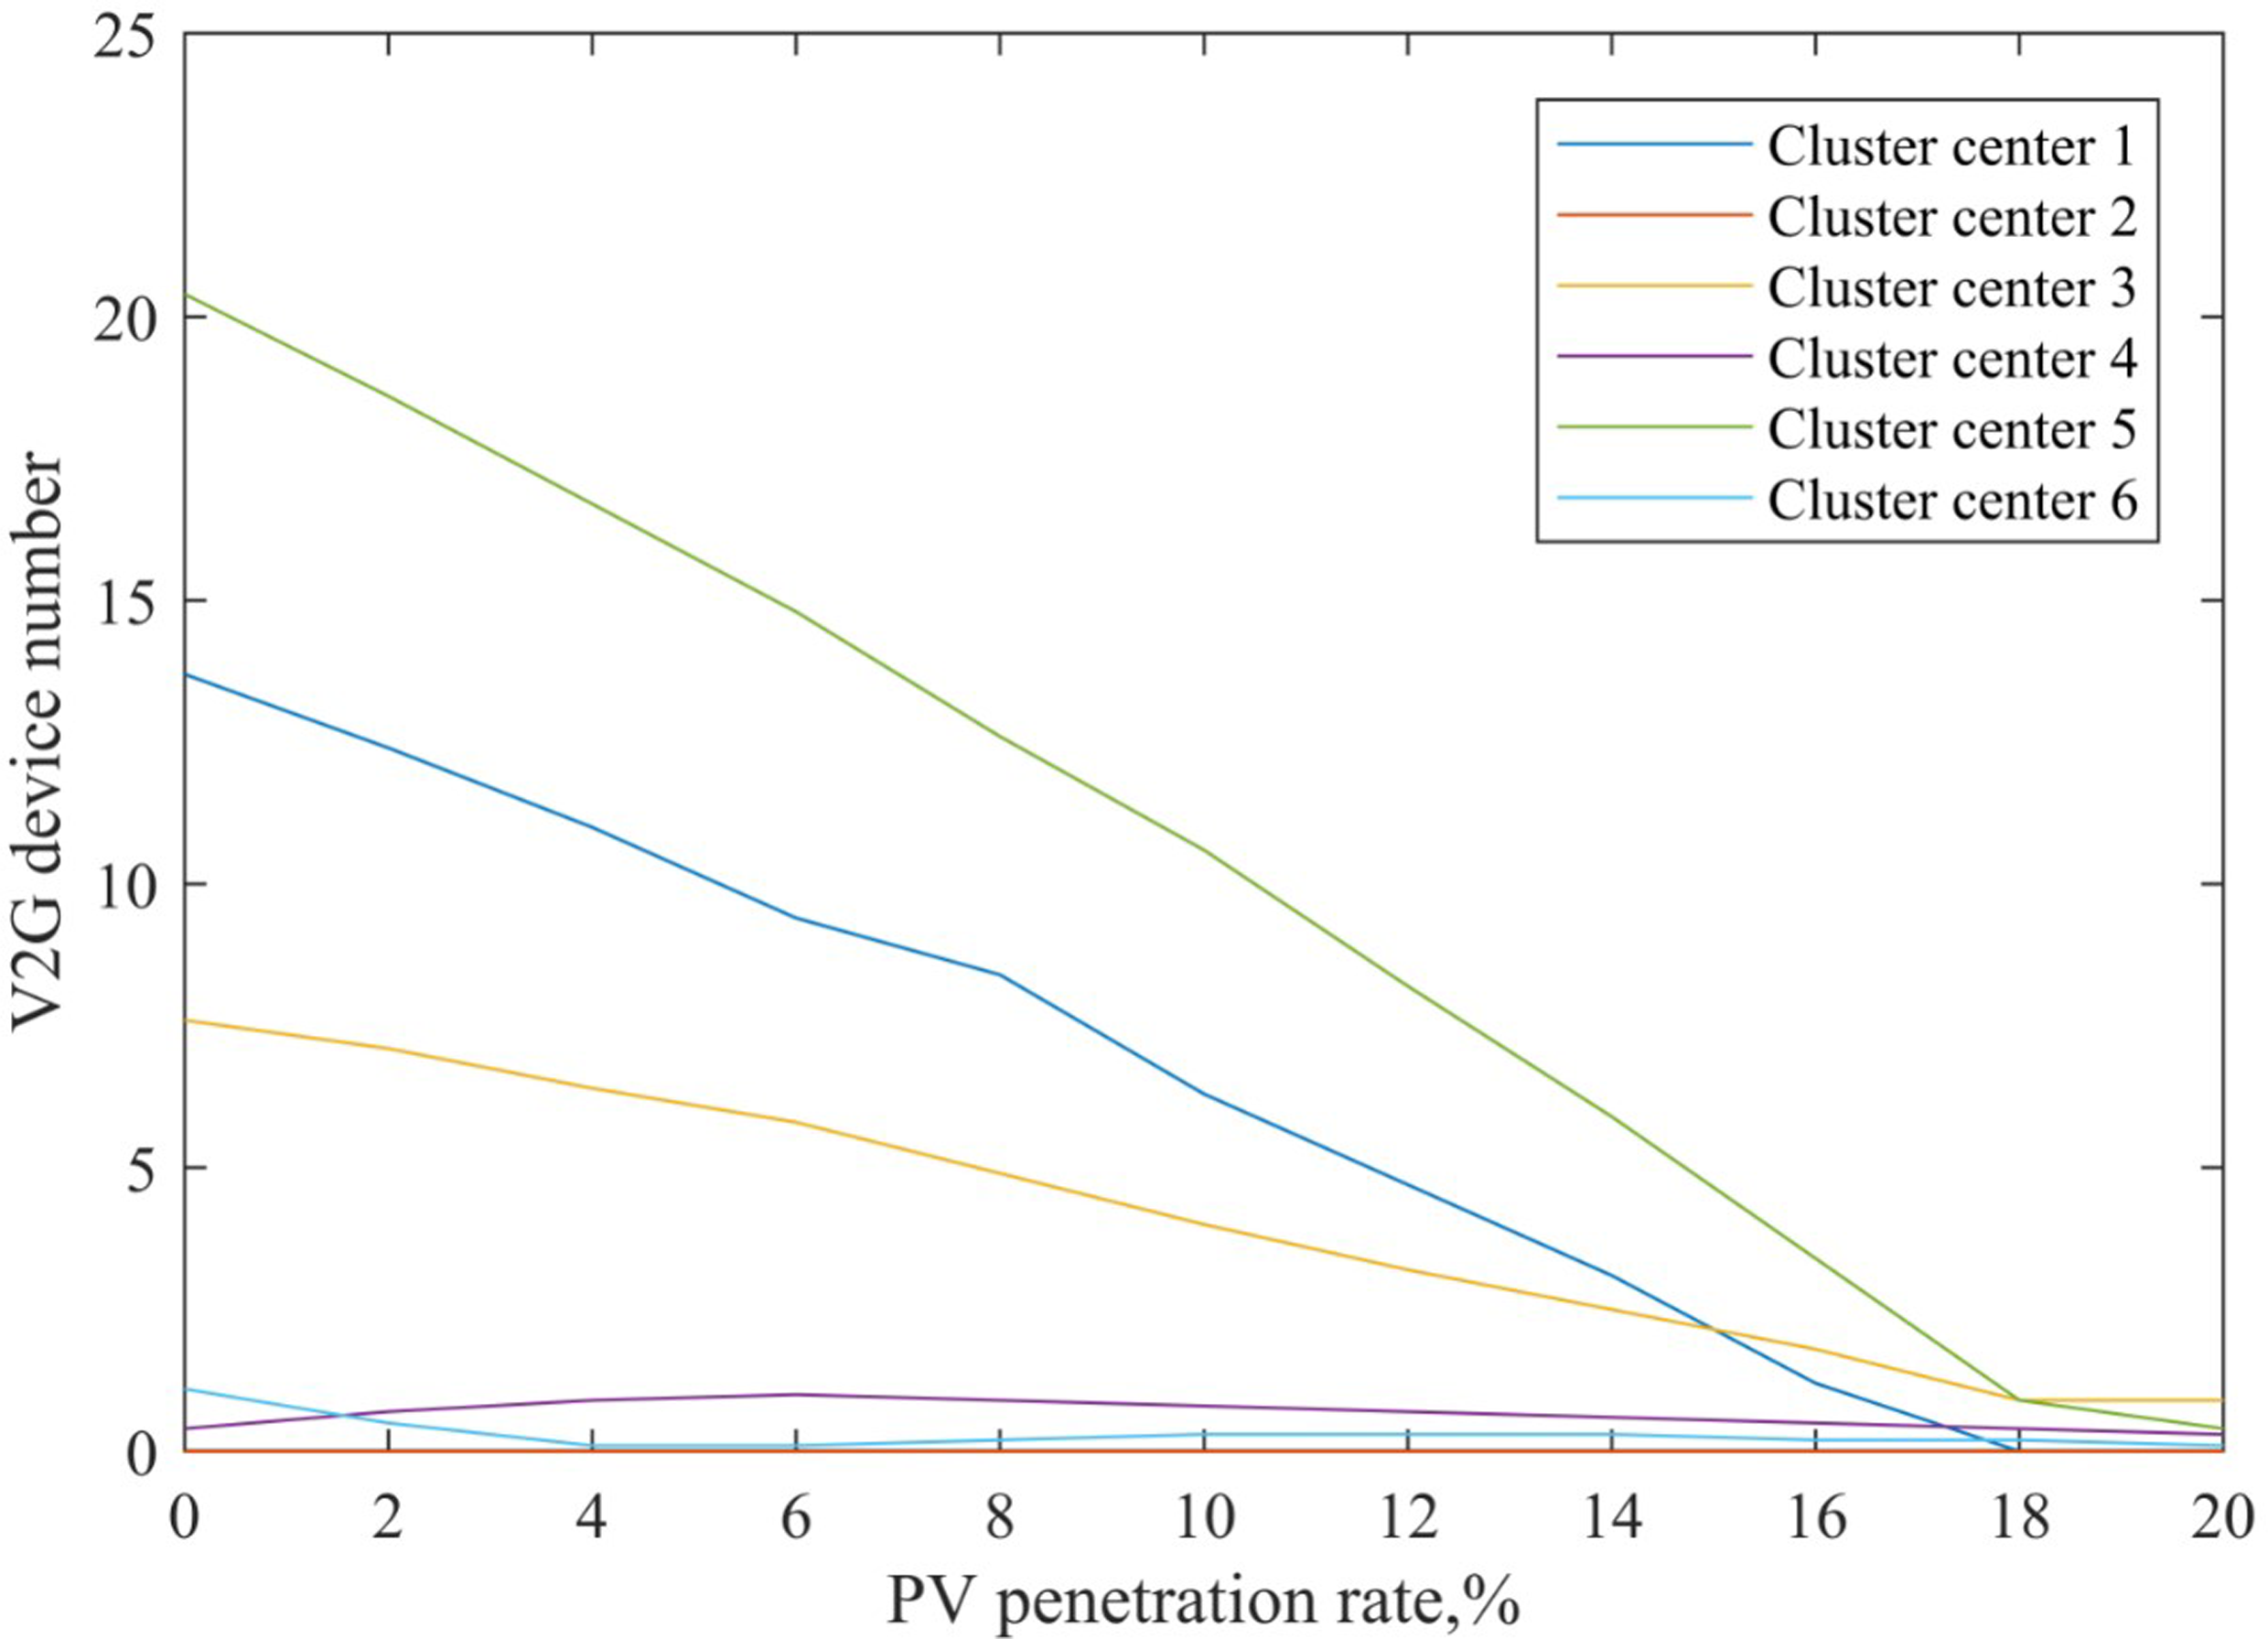
V2g device variation with PV permeability (data source: actual measurement and Table 2).
All 6 clusters achieved surplus PV power generation, accounting for 2–3% total PV power generation. Figure 6 shows that clusters 1 and 5 cannot store this surplus PV power, resulting in light abandonment.
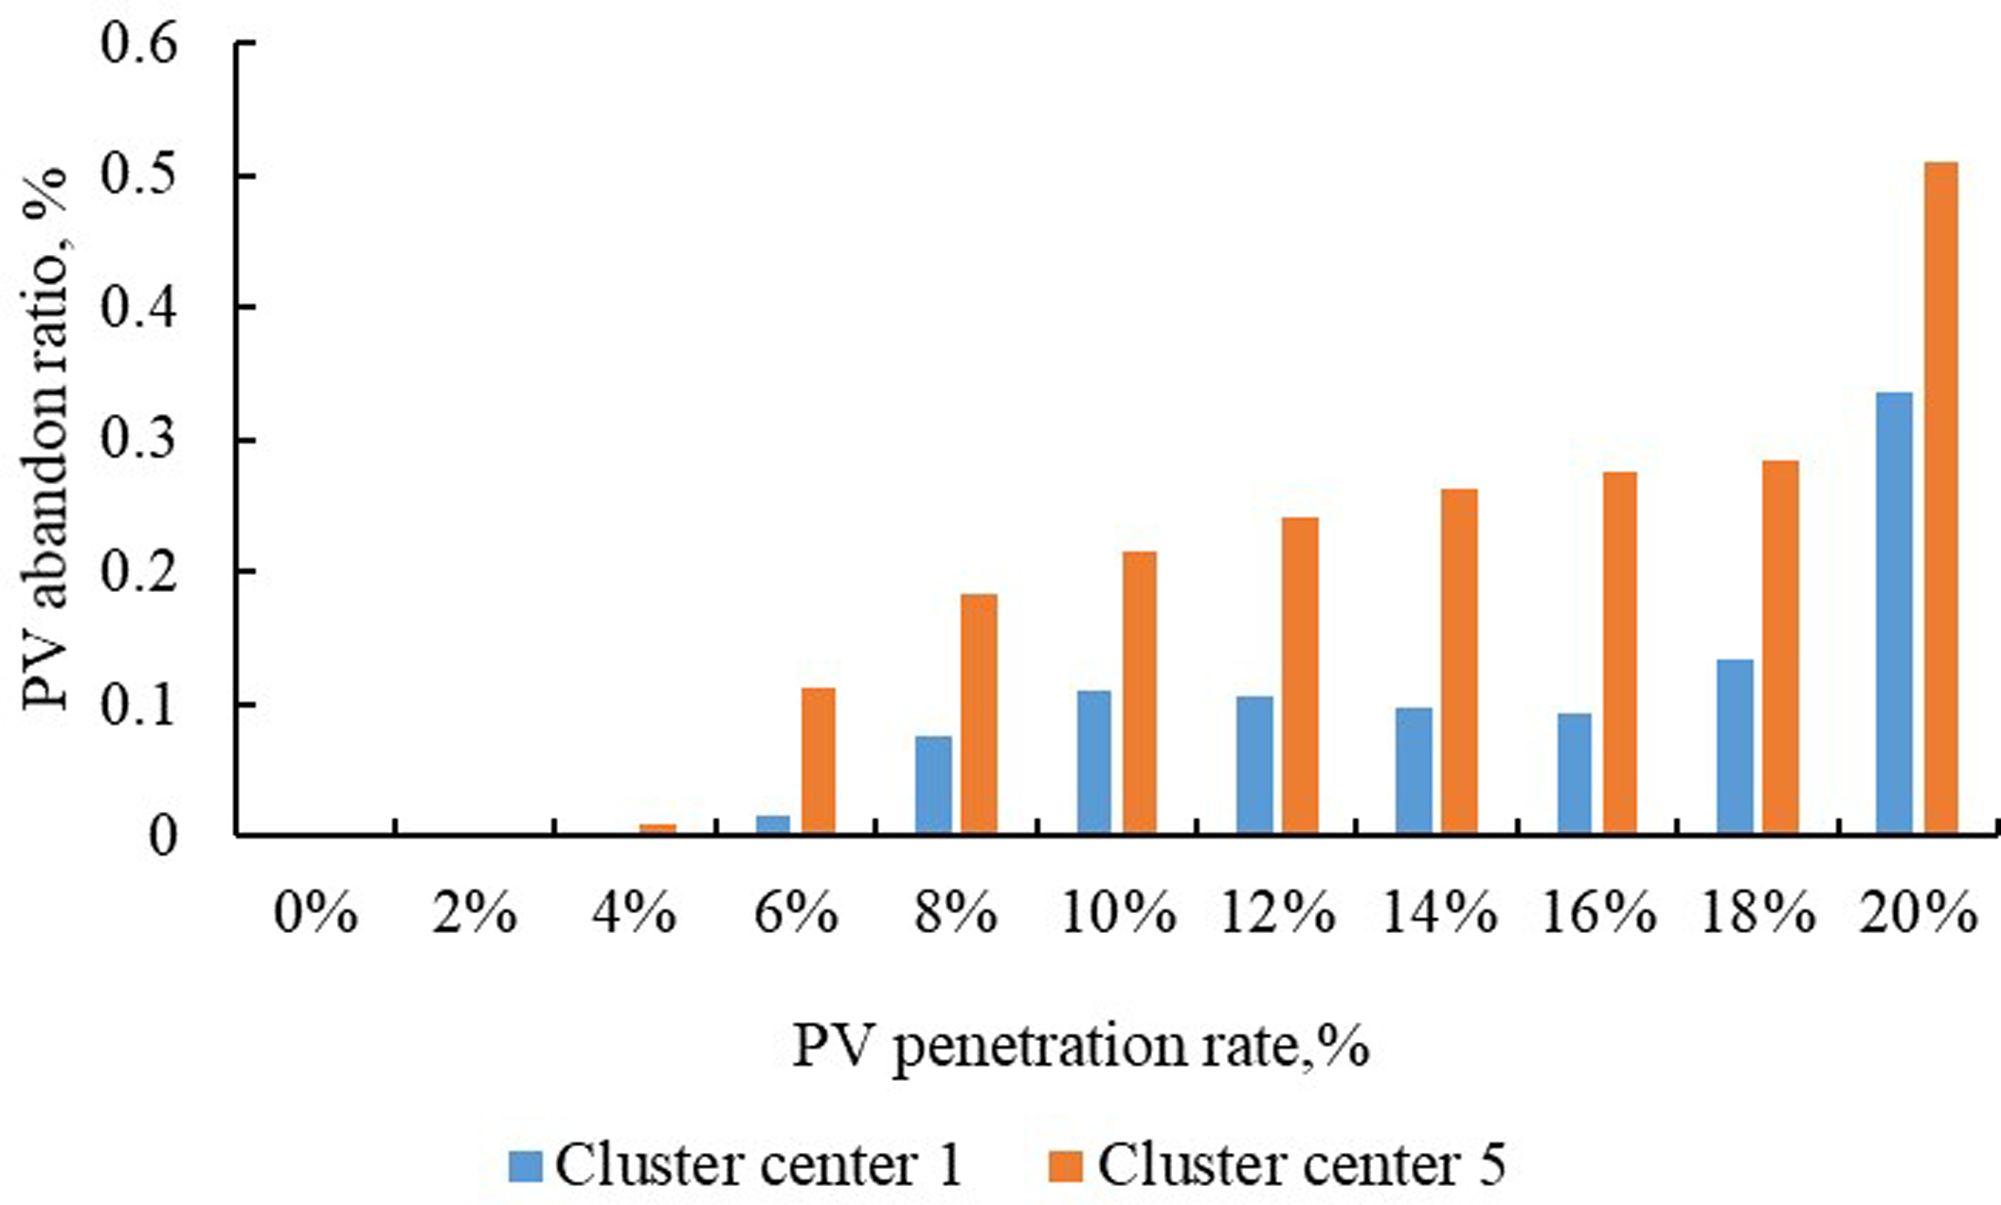
Relationship between the amount of PV light abandoned and the PV light abandoned that cannot be stored by energy storage (data source: actual measurement and Table 2).
Figure 7 shows the various cluster V2G energy supply structures with respect to PV permeability. Similar to Figure 4, V2G system electricity supply reduces with increasing PV penetration. However, cluster 1 V2G supply ratio without PV reaches ≈ 37% (Figure 7(a)). Hence clusters 1 and 5 (residential, hospital, and office) are more suitable to include V2G components and batteries from demand-side self-sufficiency and light-rejection perspectives; whereas clusters 2, 4, and 6 (office, commercial, and factory) are more suitable for battery and PV systems. Cluster 3 (commercial) can maintain self-sufficiency within 23–24%, which is suitable for energy systems comprising V2G equipment, batteries, and PV devices.
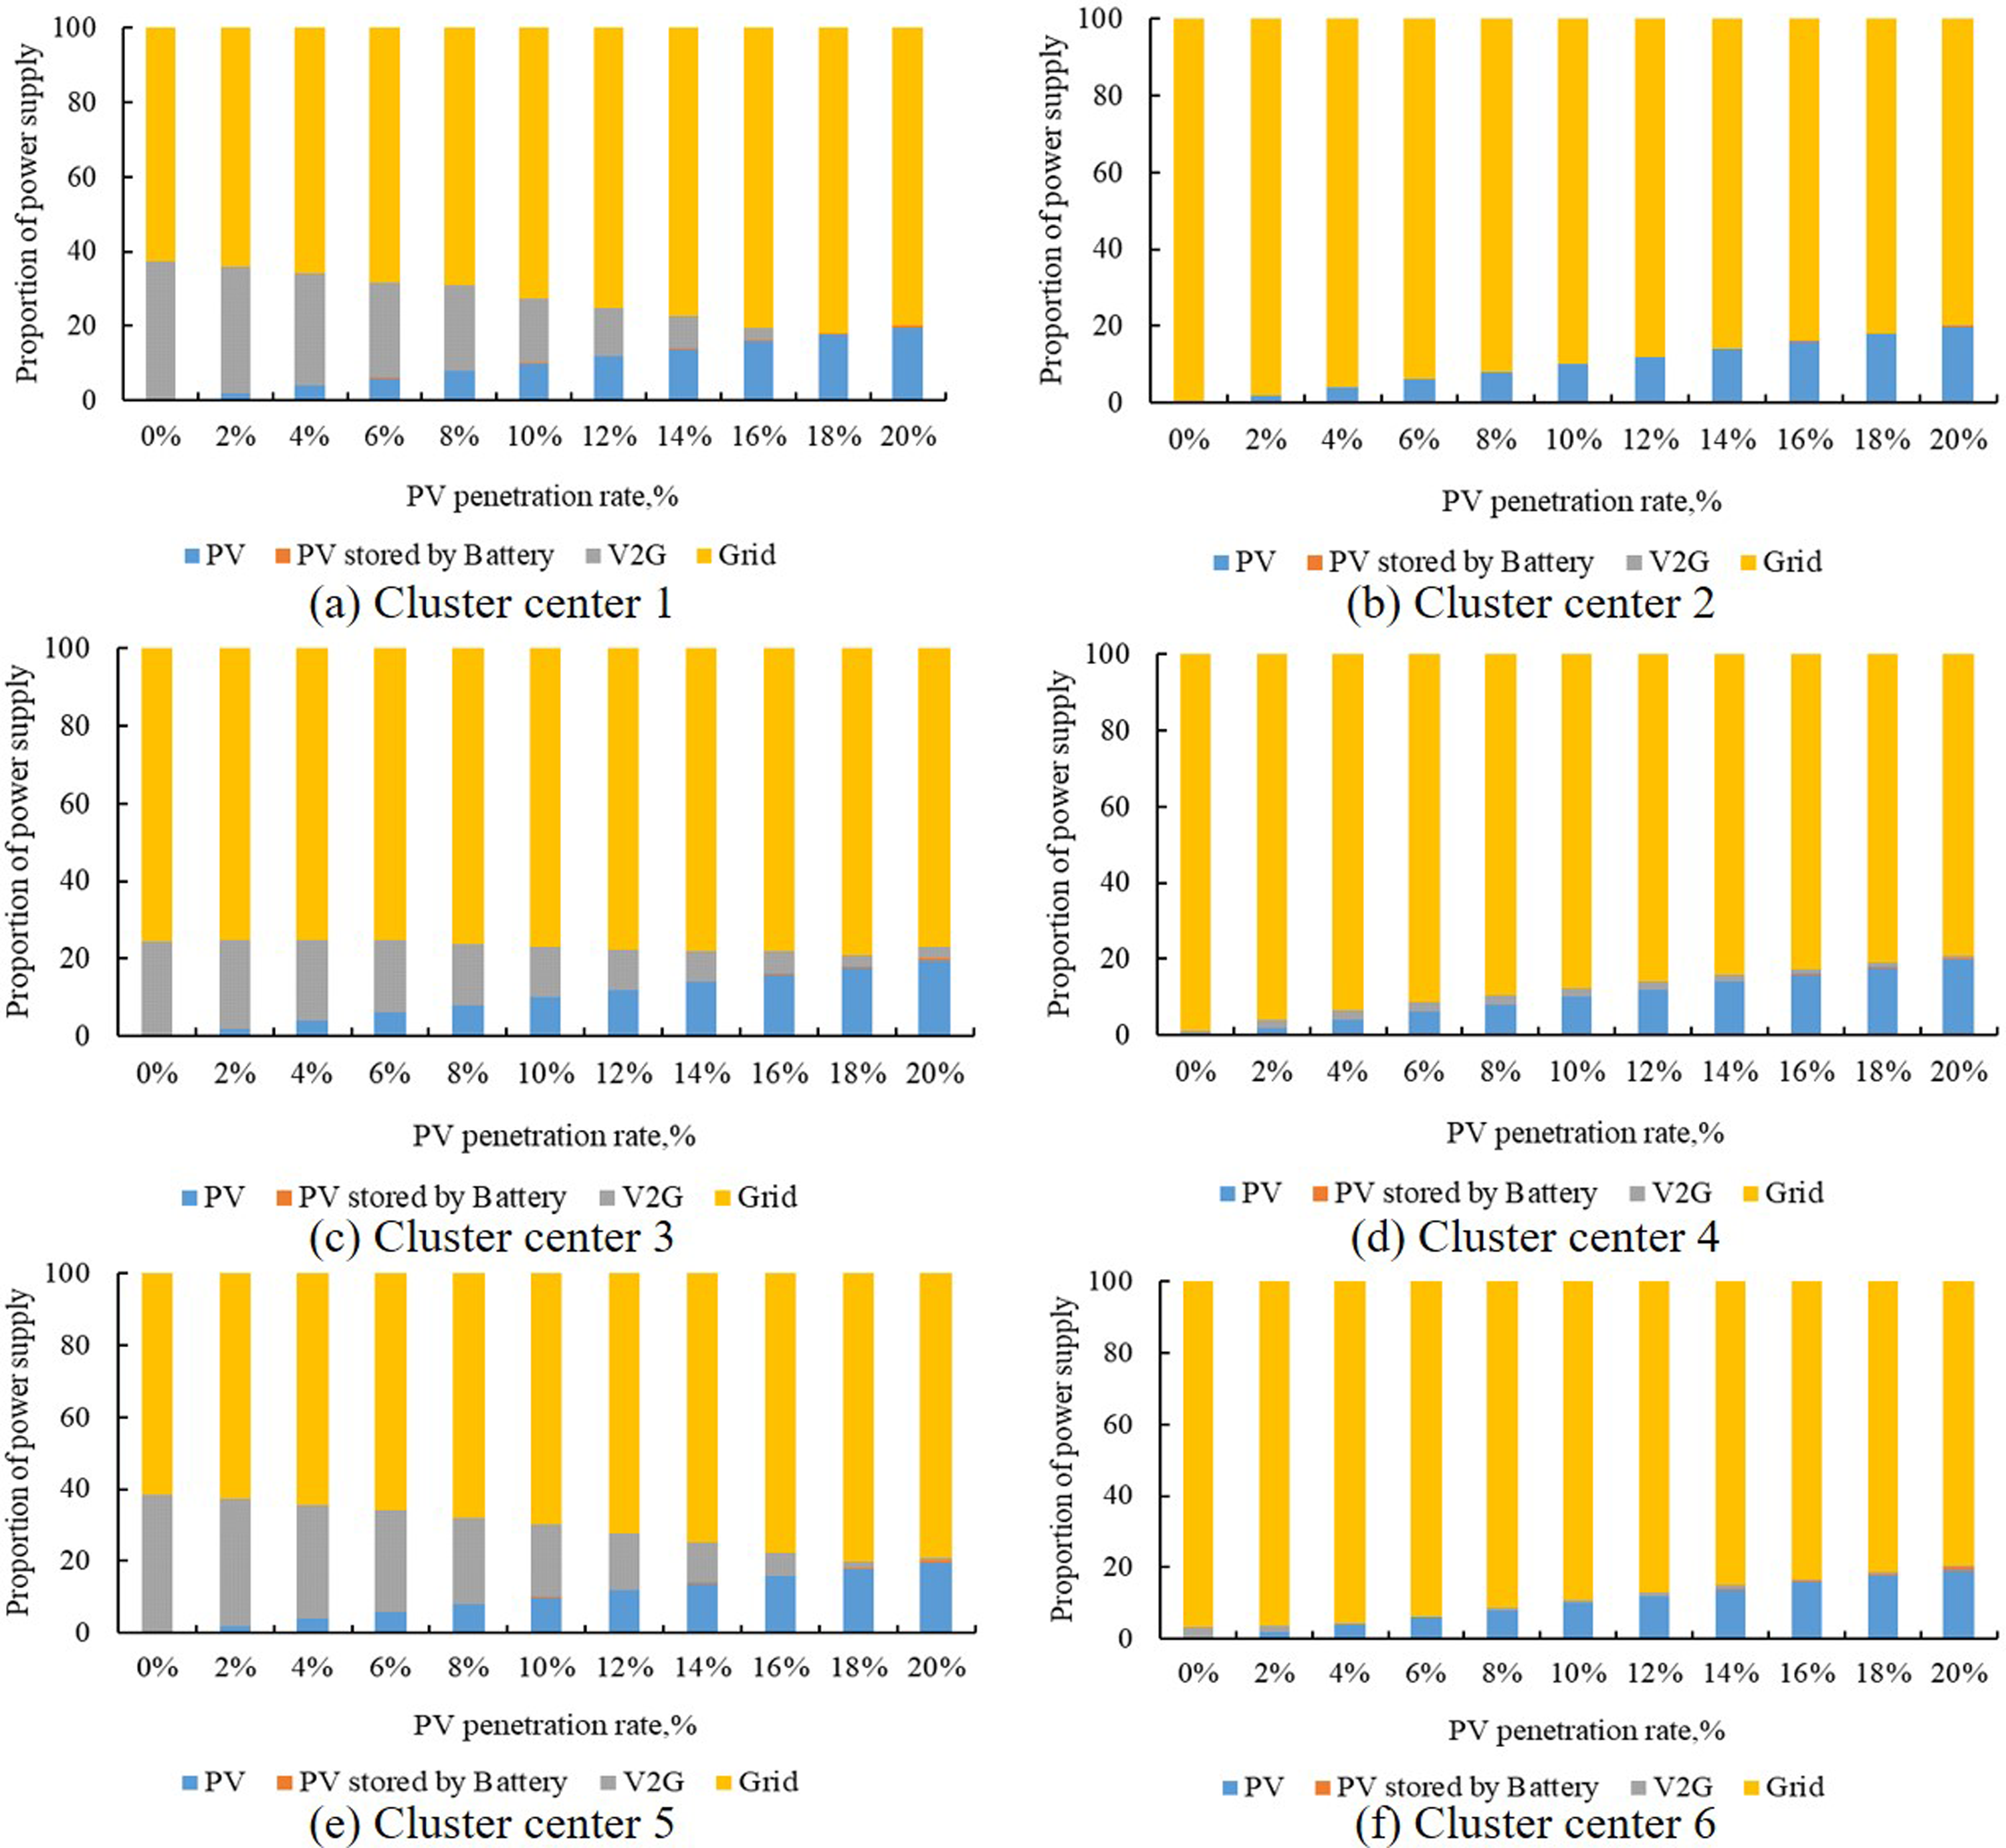
Cluster energy supply structures with respect to PV penetration: (a) cluster 1 (residential, hotel, and hospital); (b) cluster 2 (museum, experimental, and office buildings); (c) cluster 3 (commercial); (d) cluster 4 (commercial); (e) cluster 5 (office); and (f) cluster 6 (office and factory) (data source: actual measurement and Table 2).
Feed-in tariffs (FITs)
Microgrid economic benefits are limited since demand side surplus electricity cannot be used. Therefore, increasing demand side liberalization can permit surplus electricity sale to the main grid. Current Japanese policies consider only PV and wind power generation, hence the current study only considered microgrid PV generation, conforming to Japan's feed in tariffs (FITs) policy.
Users obtain the most economic PV power generation by optimizing their own electricity and grid prices. Japan FITs can be up to 31 Yen/kWh initially for a distributed PV system, and reduce with time. Figure 8 shows energy cost reduction with respect to PV FITs 31–10 Yen/kWh. For example, cluster 1 exhibits reducing microgrid revenue with reducing FITs.
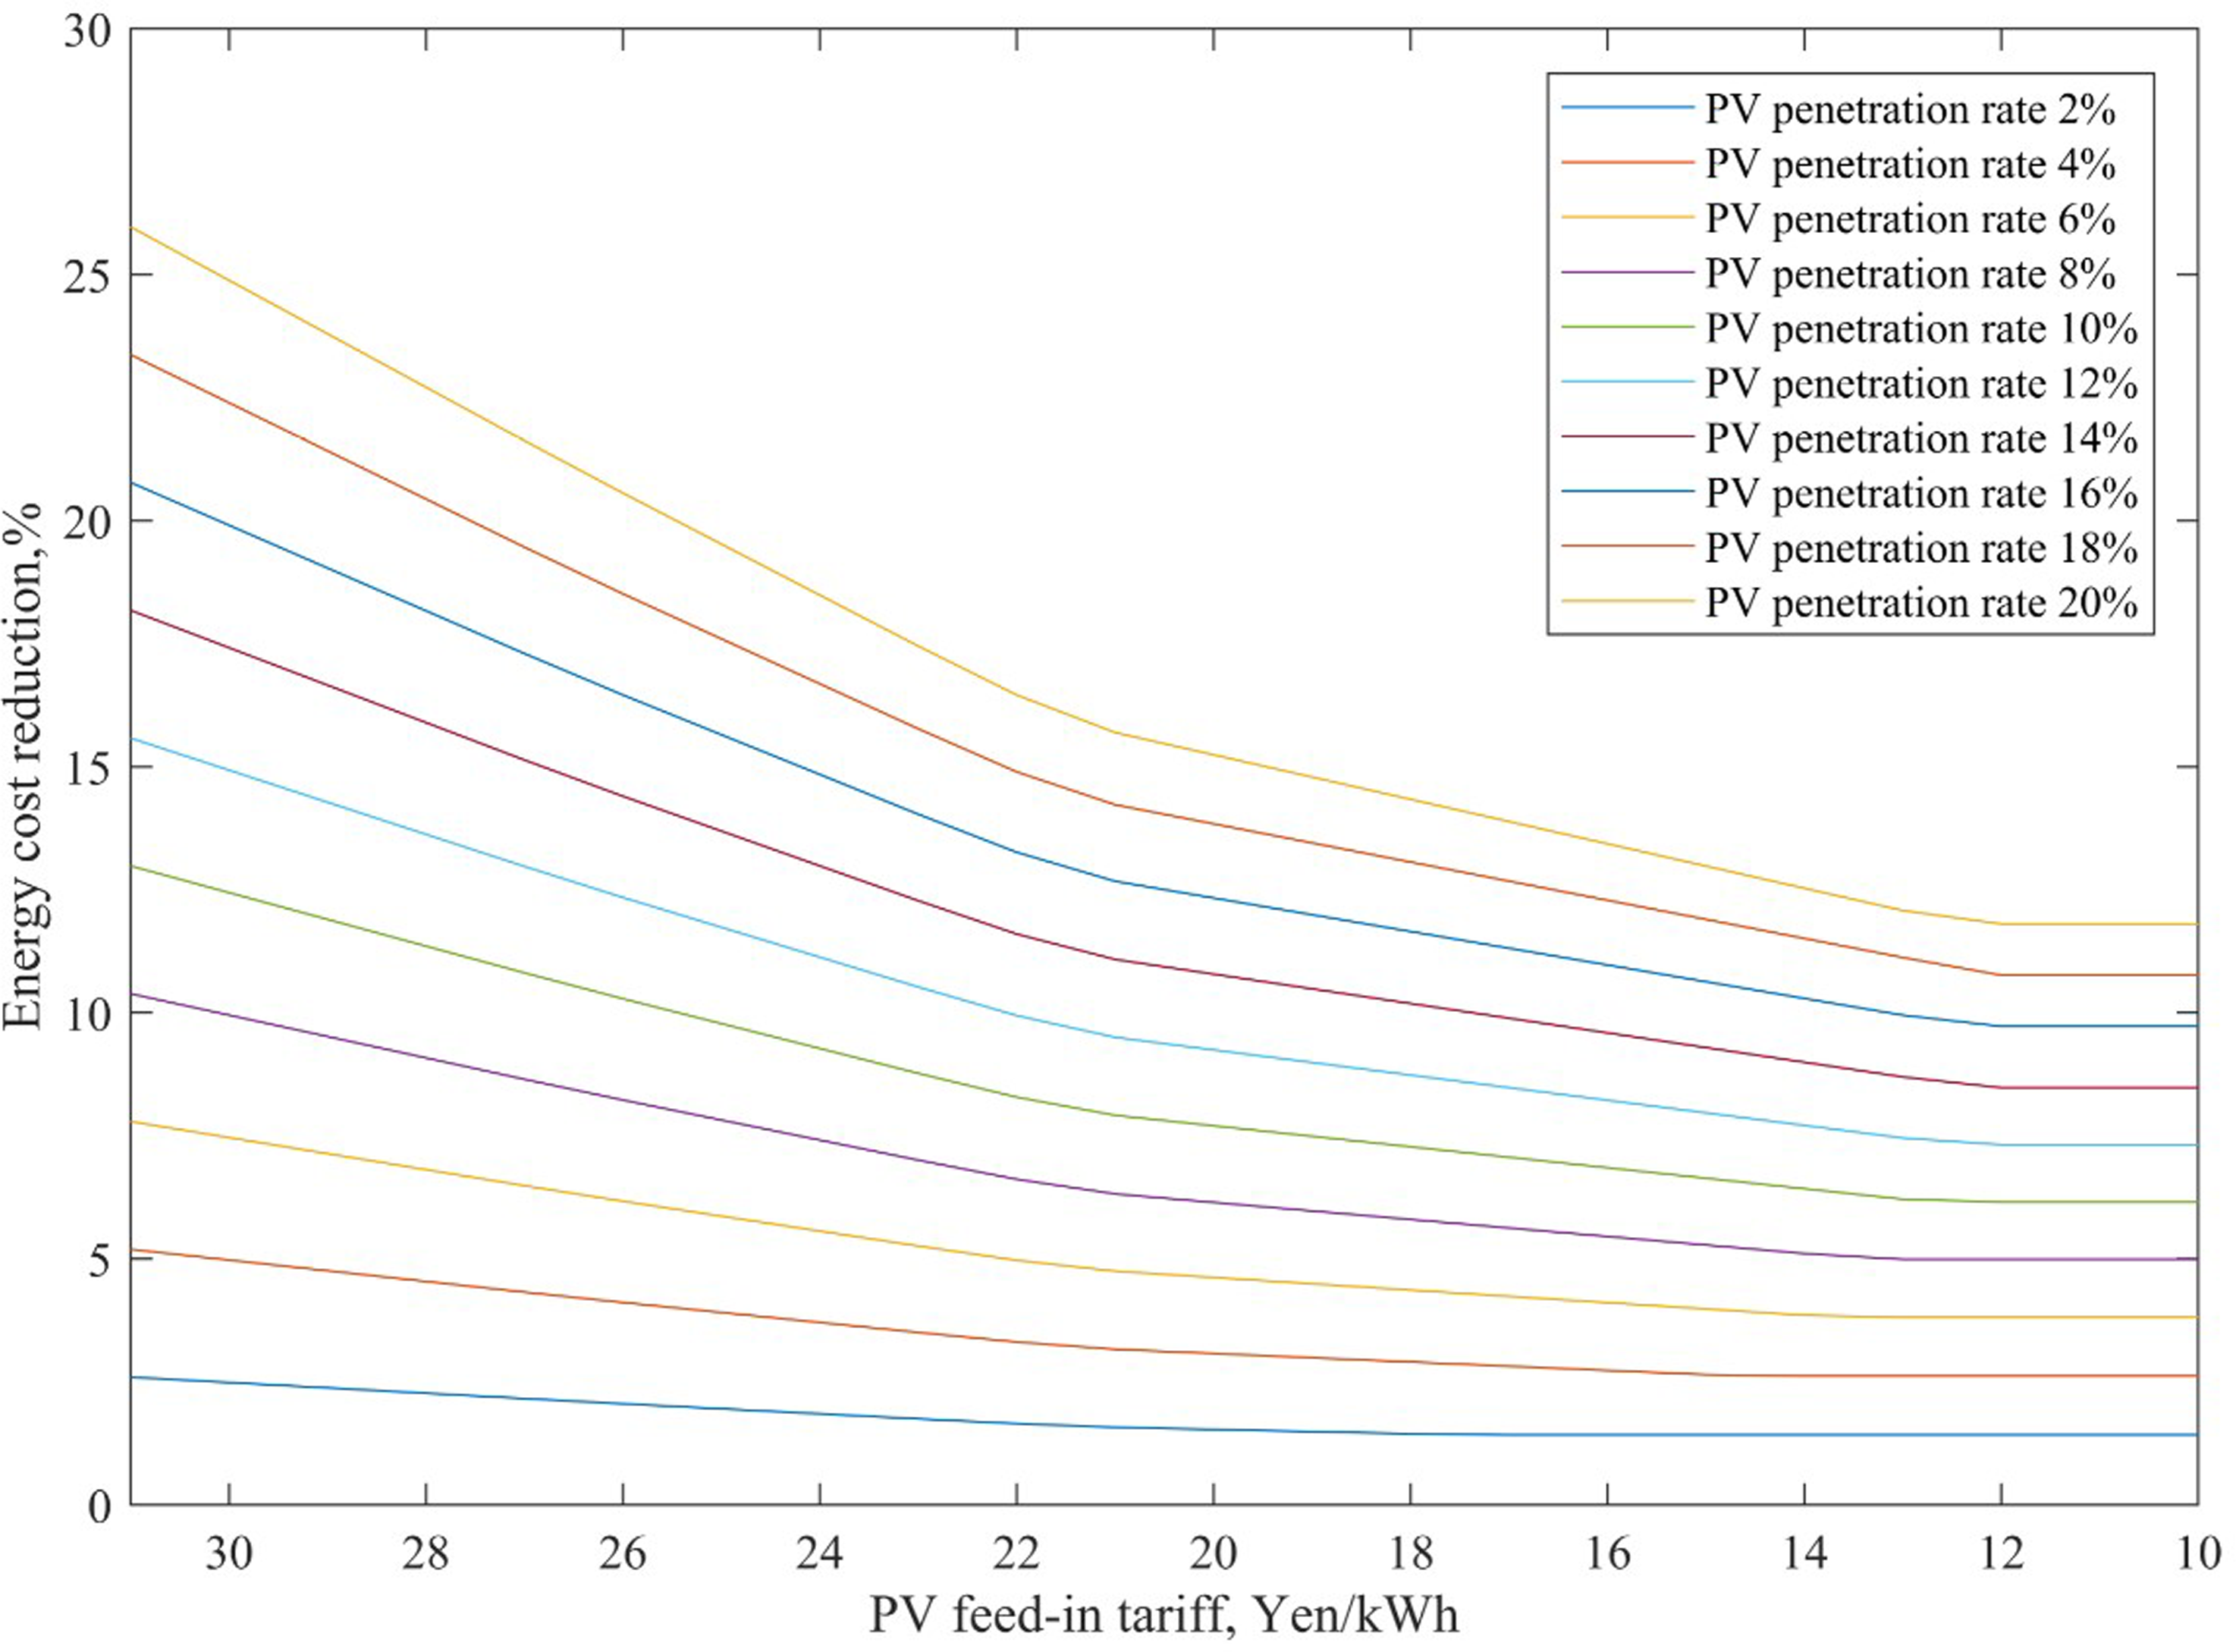
Energy cost reduction with respect to PV feed-in tariff price for cluster 1 (data source: actual measurement and Table 2).
Figure 9 shows that microgrid revenue is equivalent for FITs ≤ 12 Yen/kWh and spontaneous self-use cases with PV penetration = 20%. Thus, the current FITs policy for PV power will eventually lead to zero revenue.
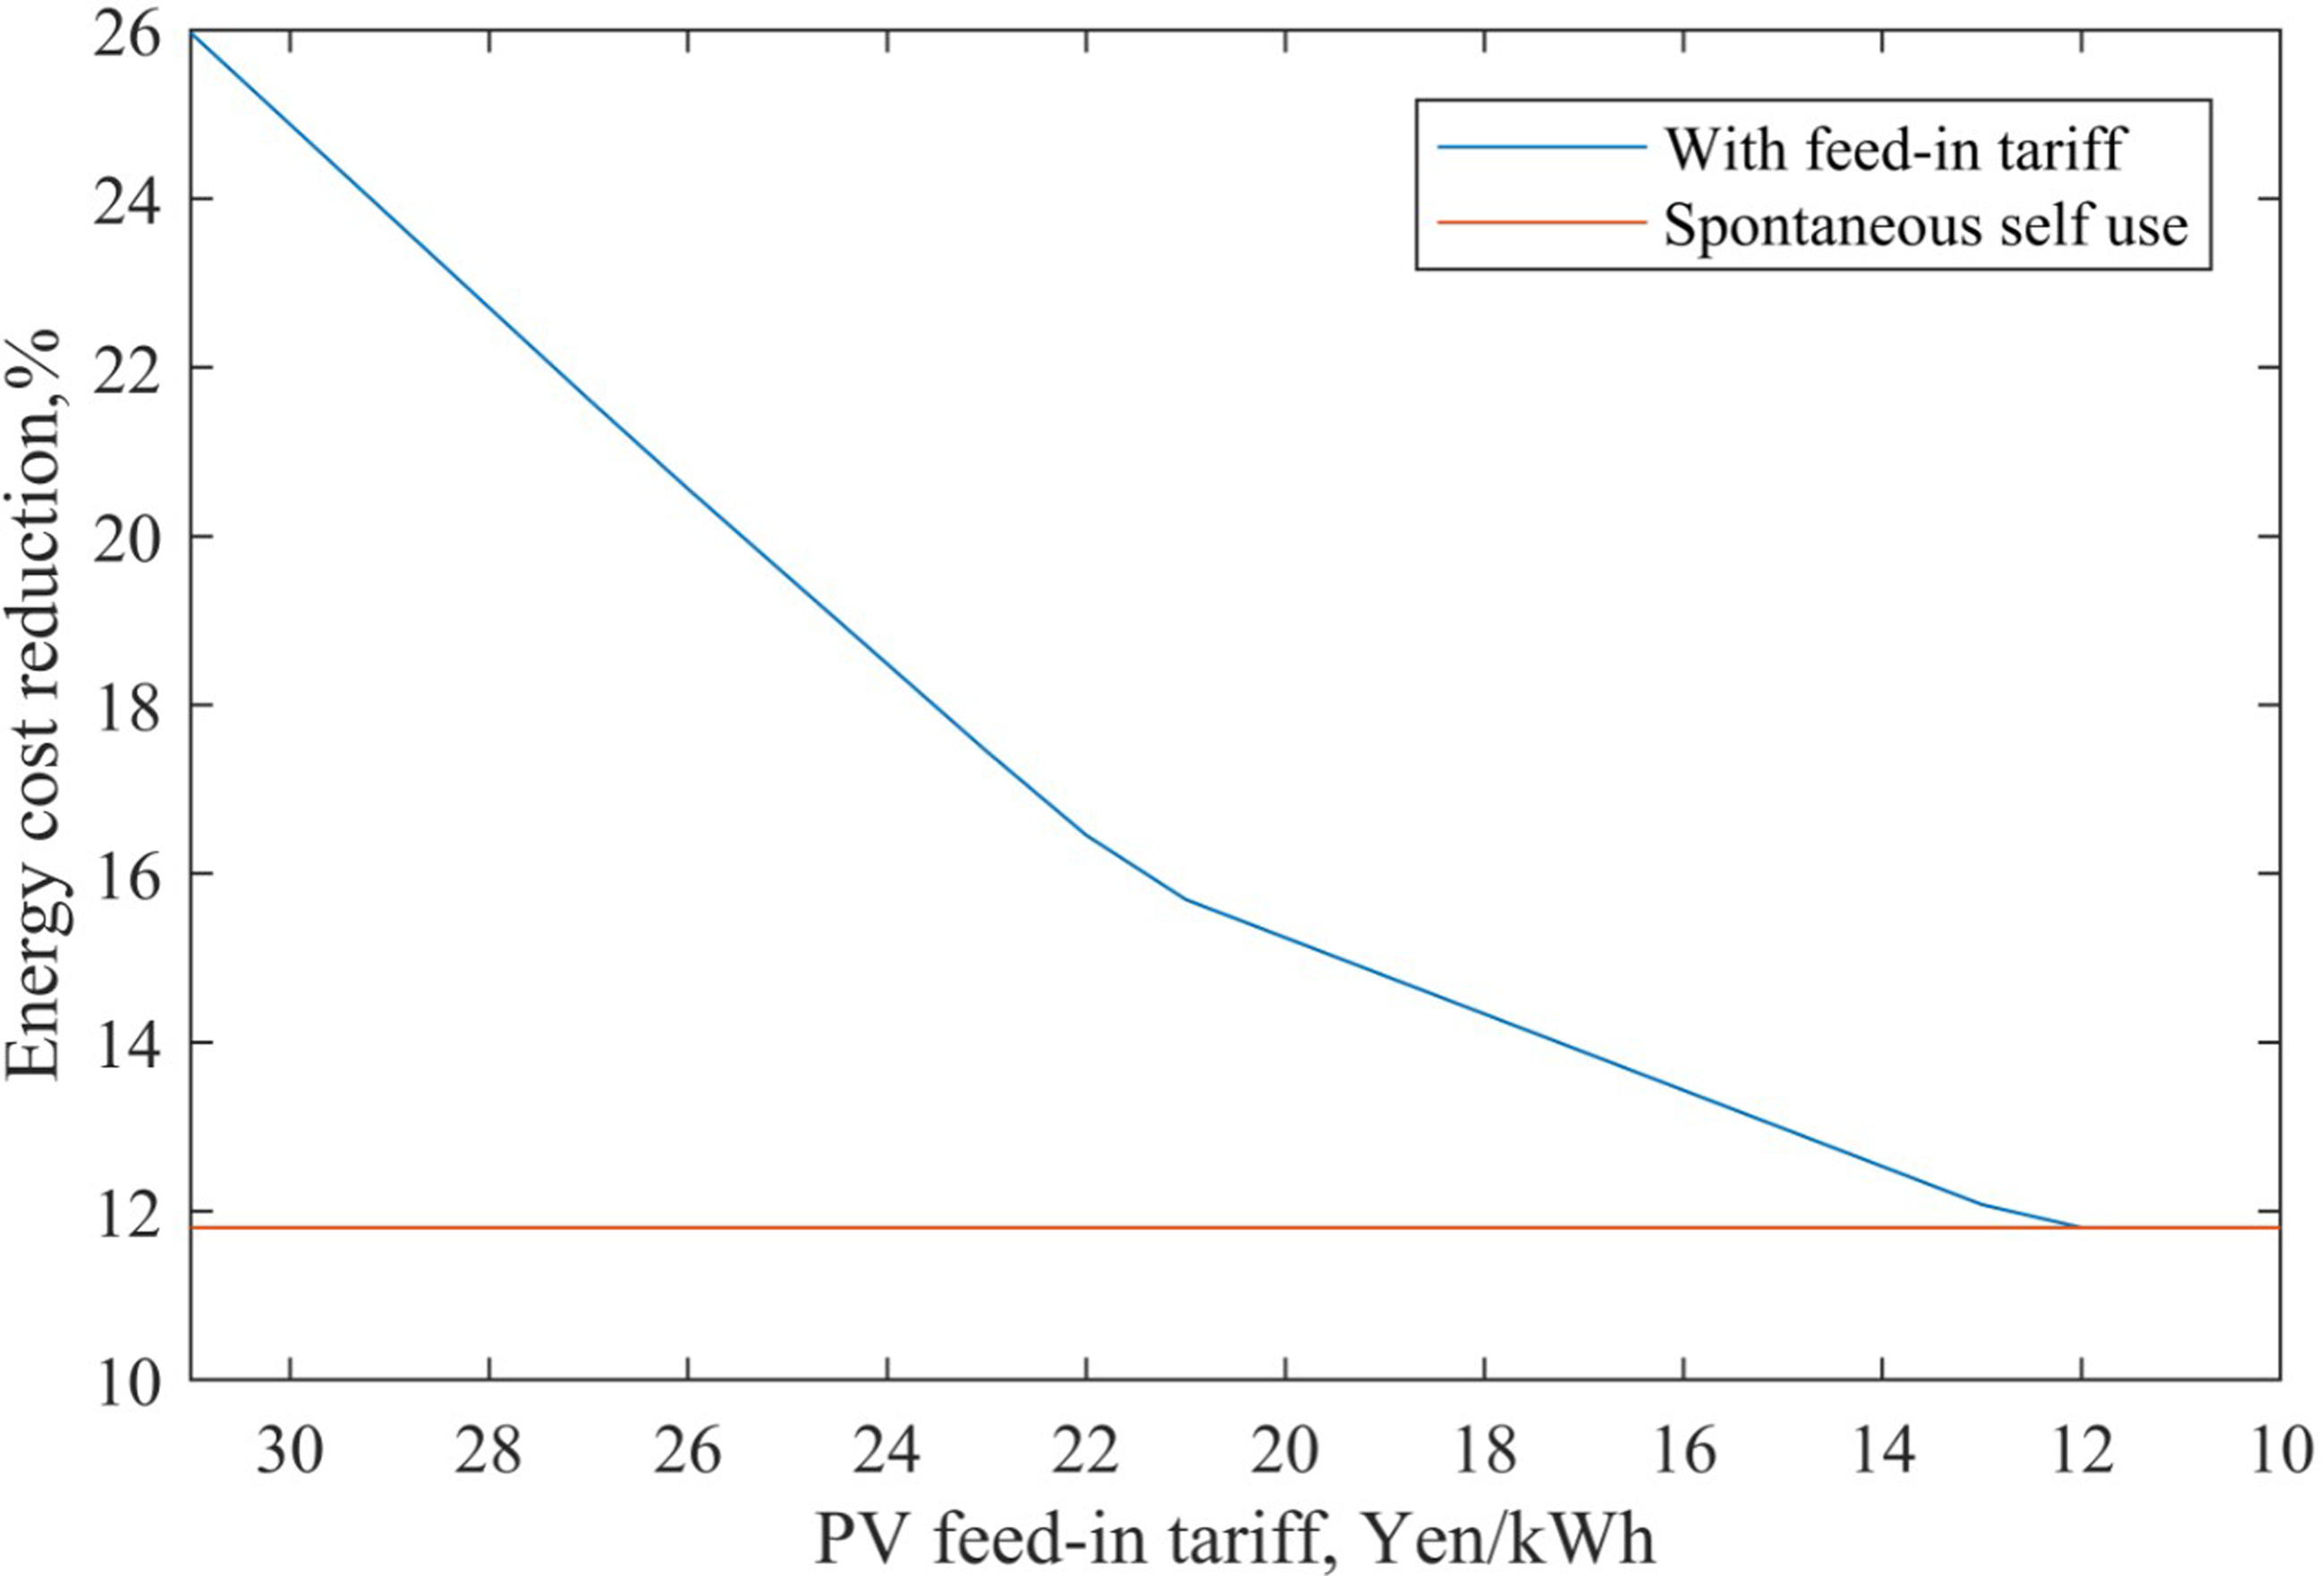
Energy cost reductions with respect to feed-in tariff for and spontaneous self-use for cluster 1, PV penetration = 20% (data source: actual measurement and Table 2).
Daily electricity pricing = 9.06 Yen/kWh during weekends and holidays (Table 2). Hence average PV electricity yield is low for case 1 (self-use). However, revenue generated during weekends and holidays reduces significantly when PV is sold to the grid. Therefore, cluster adaptability to the demand-side microgrid system must be reconsidered.
Figure 10 shows minimum PV FITs (21–16 Yen/kWh) that can generate additional revenue reduces significantly with increasing PV penetration (2–20%). Cluster 4 exhibits lowest tolerance against grid price; whereas cluster 5 exhibits highest tolerance against FITs, requires only 12 Yen/kWh minimum FITs at initiation and only 11 Yen/kWh when PV > 8%. This is consistent with light-rejection results in Figure 5. Therefore, microgrid adaptability to PV, battery, and V2G systems are contrary to self–use when considering PV power pricing. Thus, clusters 1, 3 and 5 are selected for PV-battery-V2G system.
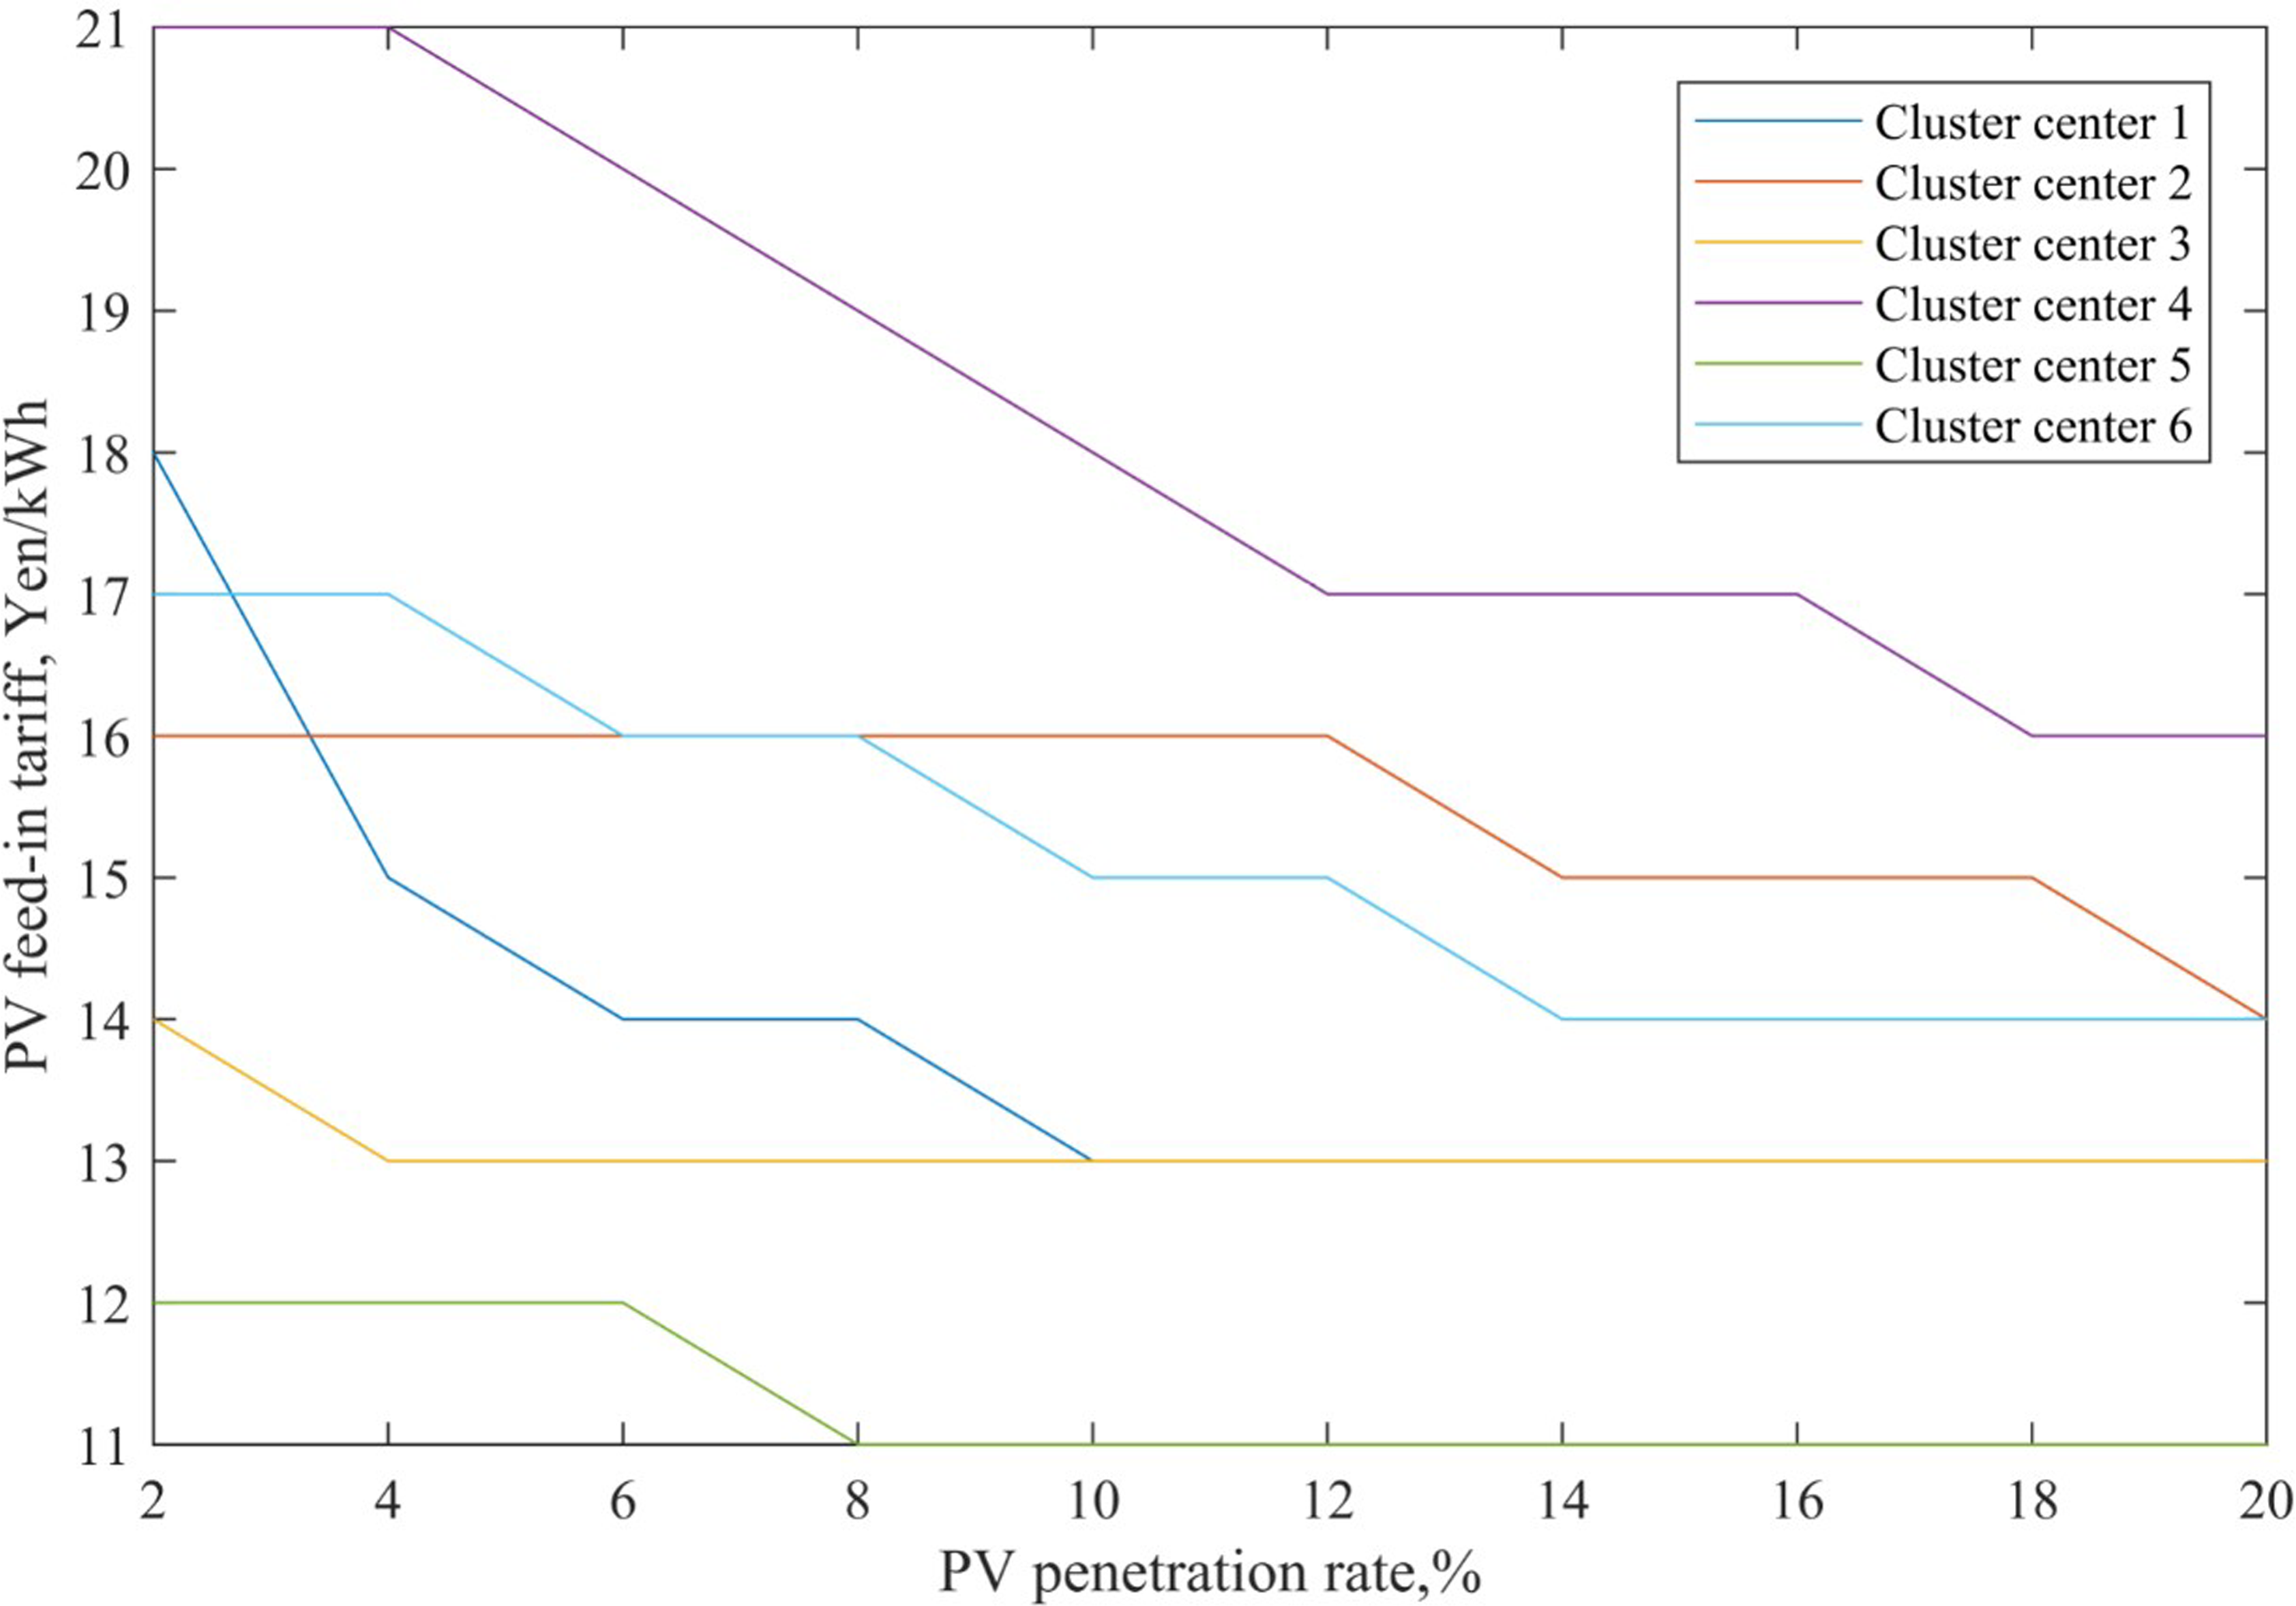
Minimum FITs to generate additional revenue with respect to PV penetration (data source: actual measurement and Table 2).
Electricity free trade
Photovoltaic generated electricity cost = 7.1 Yen/kWh (Table 2), which is lower than minimum FITs (Figure 9); hence the FITs policy would be deficit expenditure. Furthermore, FITs will be reduced to < 7.1 Yen/kWh once the distributed microgrid system is completely developed and promoted, i.e., close to the lowest cost for large-scale PV stations. Eventually, demand side liberalization must be increased once the demand side can no longer generate additional revenue by selling surplus PV to the grid, allowing surplus electricity to be traded among users.
Batteries can store surplus PV energy and help handling peak and valley demands, but they cannot improve regional self-sufficiency. Furthermore, low battery electricity prices, for overall benefit of all buildings, will lead to lost economic benefits for the microgrid system. Therefore, excess battery electricity need not be sold to other buildings to optimize each building's economics. PV generation can fulfil its own demand if residual electricity prices are not higher than regular electricity prices. Therefore, the main participants in residual electricity transactions are surplus PV electricity and aggregated V2g electricity. But V2G services are not available on weekends and holidays due to low pricing. (Table 3)
Conversion ratios of different clusters (data source: actual measurement and Table 2).
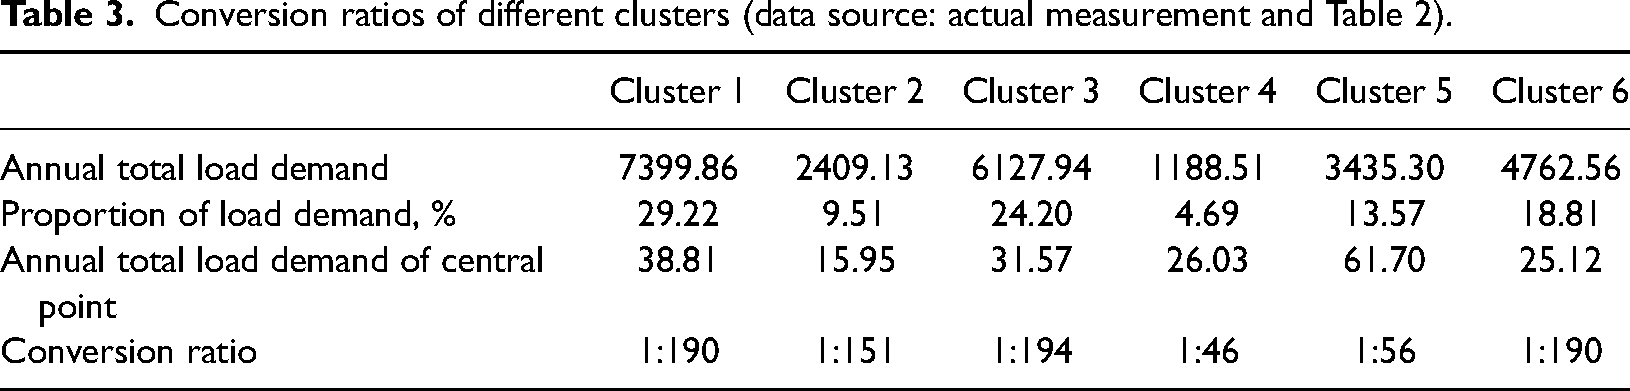
Photovoltaic system performance after load conversion is limited by roof area, hence we assumed PV penetration = 10%. Figure 7 confirms that clusters 1, 3, and 5 are more suitable for electricity trading as V2G service aggregators, and hence were selected as the main sales bodies for V2G services with the other buildings participating in mutual transactions of surplus PV power. Three free electricity trade modes were assumed: mode 1 (cluster 1 as core), mode 2 (cluster 3 as core), and mode 3 (cluster 5 as core). Figure 11 shows overall local energy cost reduction and power supply structure changes with respect to self-use for grid price = 20 Yen/kWh.
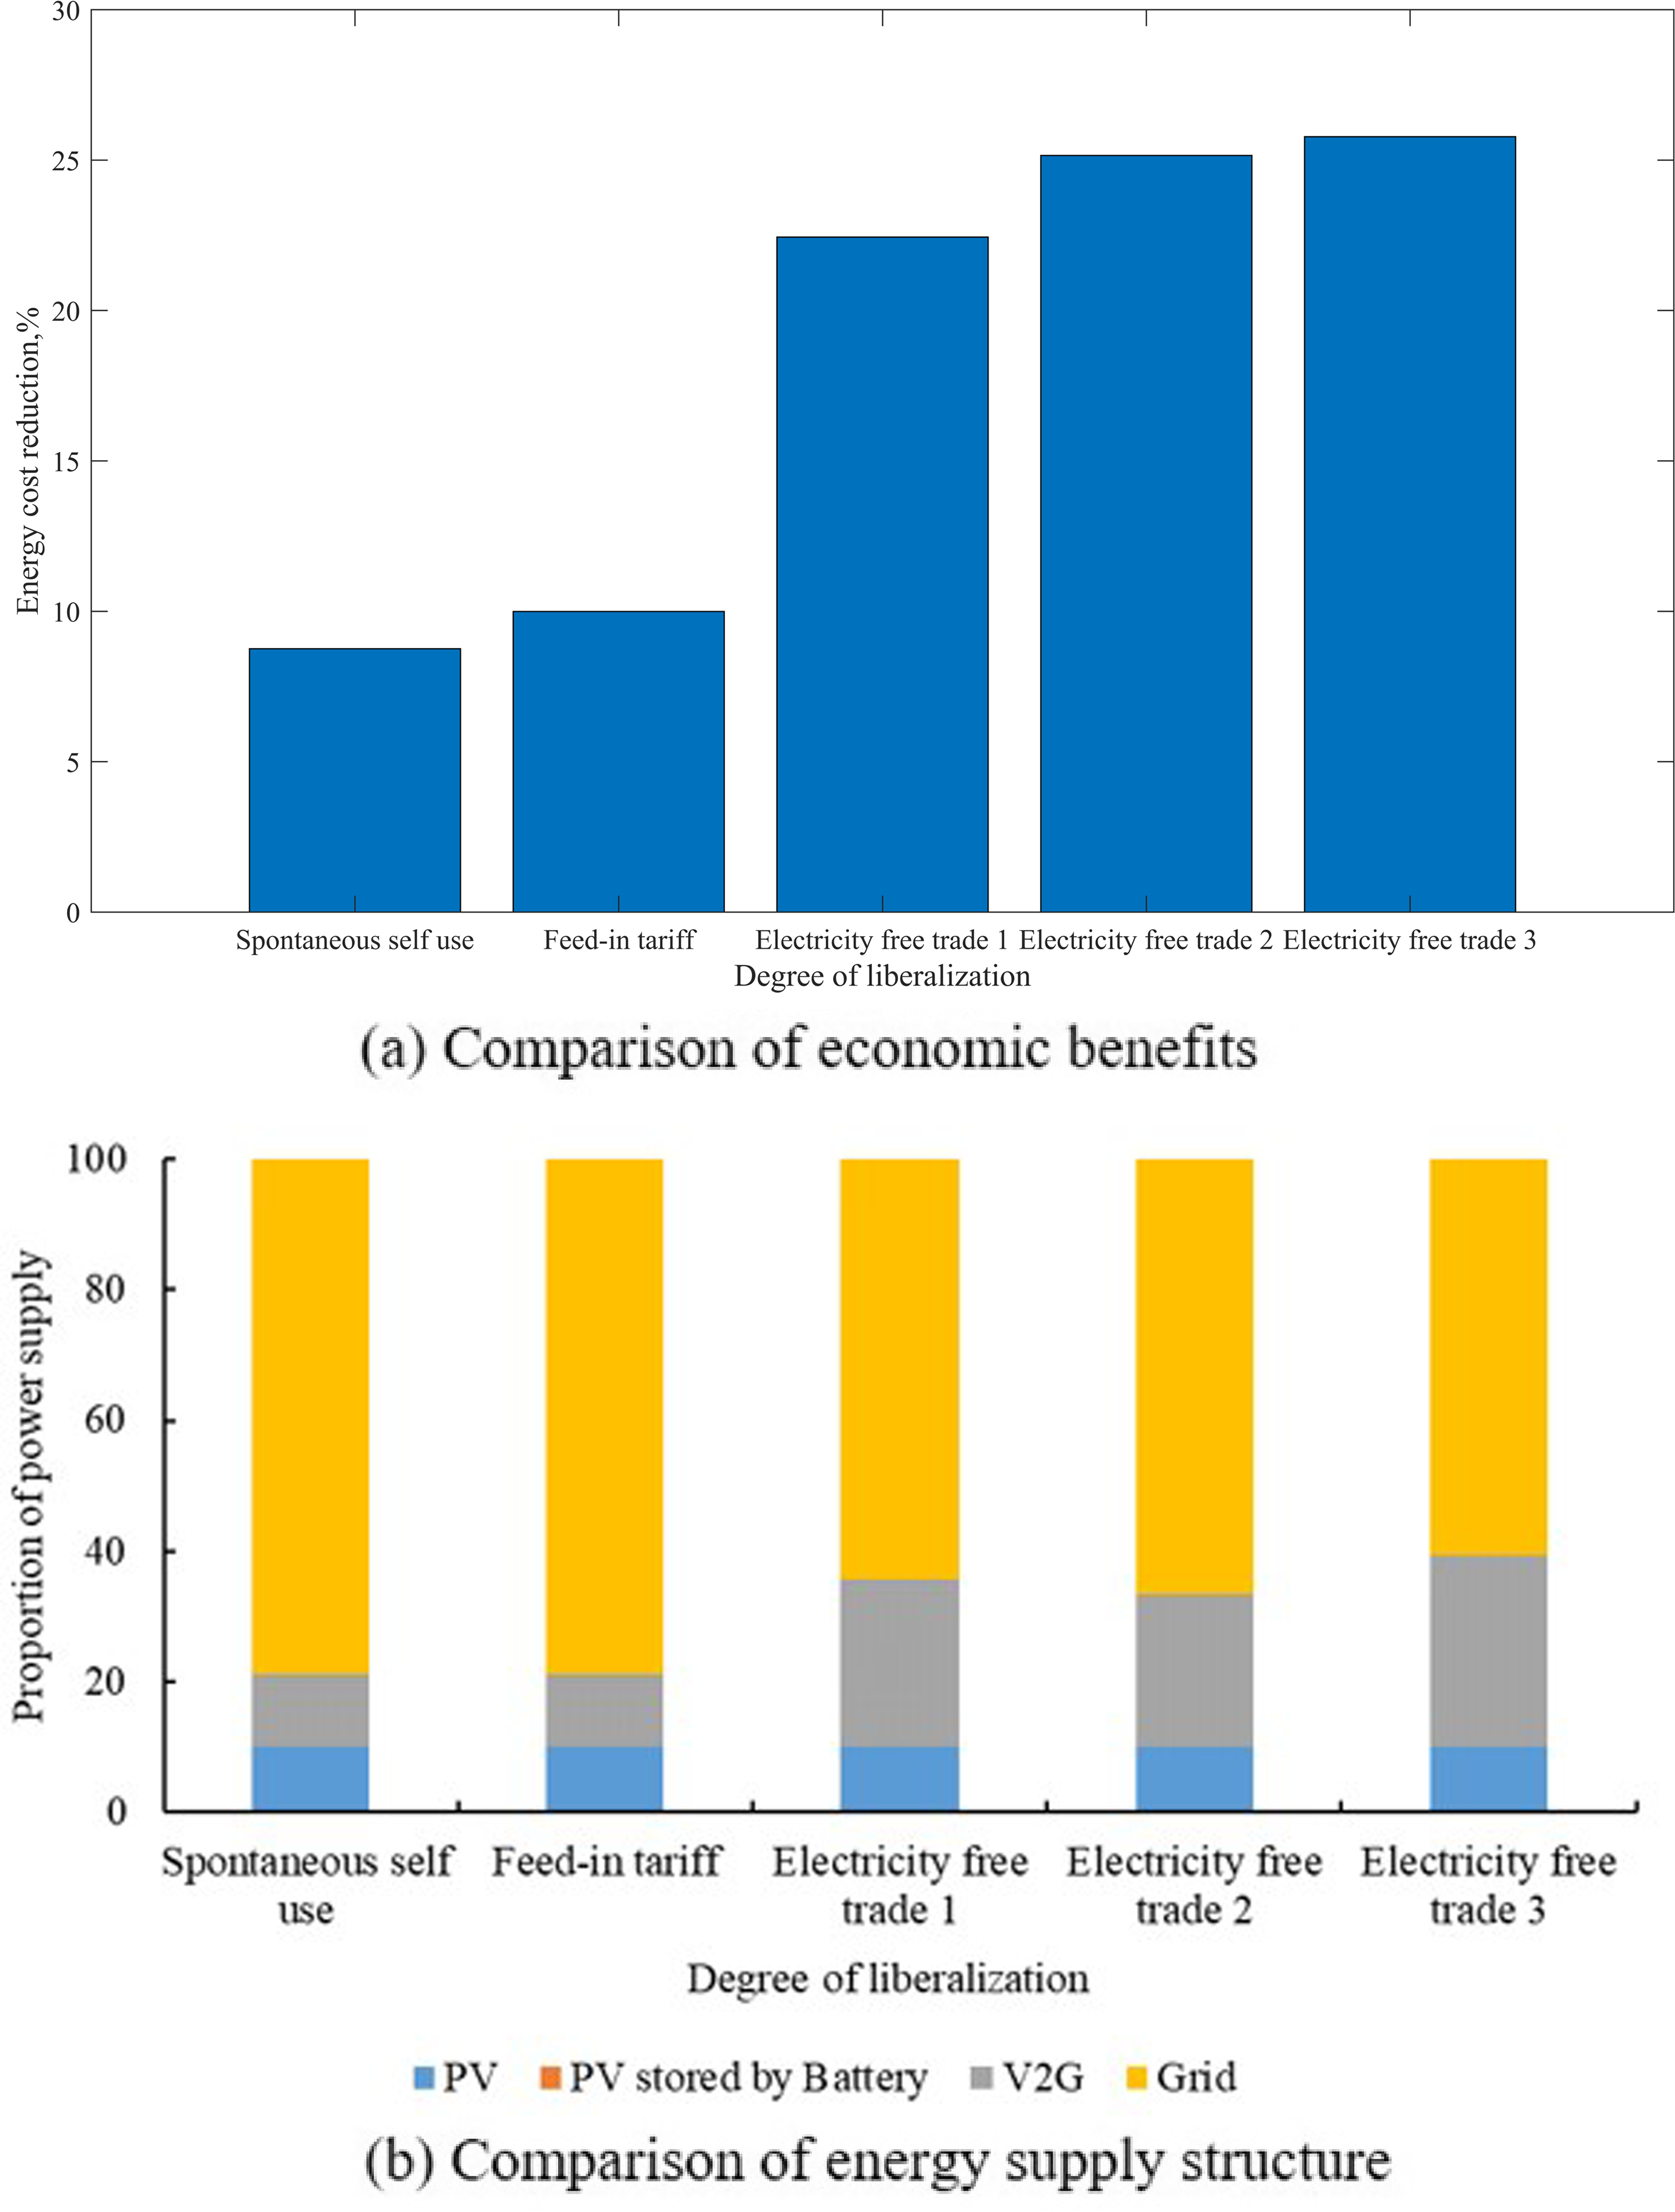
Microgrid (a) economic benefits and (b) energy supply structure for different liberalization levels on the demand side (data source: actual measurement and Table 2).
Figure 11(a) shows that revenue from electricity free trade is significant, and mode 3 achieves optimal benefit. Figure 11(b) shows that the FITs policy can help increase economic benefits on the demand side, but surplus PV power generation has negligible impact on the electricity supply structure due to the small amount of abandoned light, hence the transaction does not improve the supply rate. Electricity free trade mode effectively improves V2G implementation and increases self-sufficiency for the whole region from 22–40%, which has significant impact. Increased V2G electricity supply also improves overall economic benefits by 22–25%.
Electricity free trade mode 1 achieves high self-sufficiency, but relatively low economic benefits; whereas mode 3 achieves highest self-sufficiency and economic benefits. Therefore, office buildings (cluster 5) are the most suitable aggregators for V2G services in the electricity free trade mode.
Sensitivity analysis
We selected EV charge and discharge power, V2G device cost, battery cost, and electricity price are selected for sensitivity analyses to investigate key parameter changes influence on the results. As discussed above, cluster 5 was the most sensible objective and we set PV penetration = 10%. Fluctuation range for the four parameters 20% to +20%. Table 4 shows significant outcomes changes with the parameter changes.
Impact analysis after key parameters change (data source: actual measurement and Table 2).
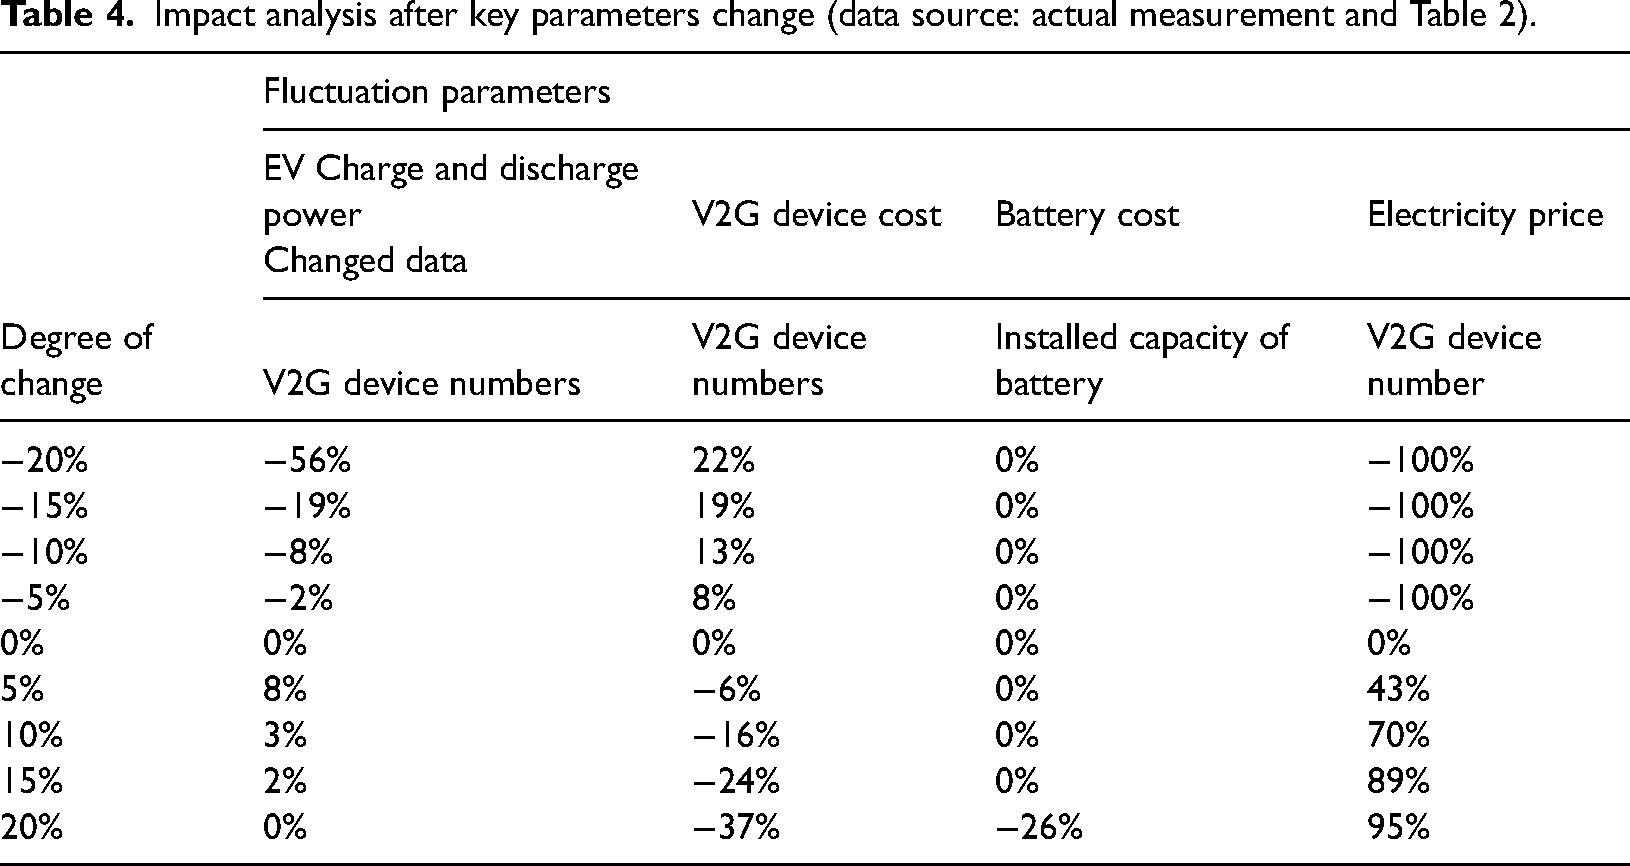
Reducing EV charging and discharging power reduces V2G benefit, thus reducing the number of V2G devices. However, revenue for a single V2G device increases once EV charging and discharging power increases above a threshold, but the total number of configurations reduces since building adjustable load and photovoltaic light rejection have not changed.
Different V2G device costs have significant impact on the number of devices. In contrast, battery operation income does not change since photovoltaic and building loads remain constant. Therefore, changing battery cost has little impact on battery capacity configuration within 20 to +15%. However, battery operation income can no longer meet the original capacity configuration once battery costs increase by 20%, resulting in reduced capacity.
Fluctuations in the electricity price difference between peak and valley are not significant since electricity price fluctuation was set as the overall change. Hence, there is no significant battery capacity configuration changes. However, power price fluctuations cause significant impact on V2G. V2G equipment will not be configured if power price drops by 5%, because it cannot generate revenue. Correspondingly, the number of V2G devices nearly doubles when power price increases by 20%.
Charging and discharging power from EVs varies among different vehicle brands and models, but the overall trend is towards higher power, i.e., faster charging and discharging. V2G equipment and battery costs will gradually reduce with large-scale production, and electricity prices will continue to increase in the near future since international benchmark prices for fossil energy continues to rise. Therefore, the sensitivity analysis confirms that V2G benefits will continue to increase, and demand for more V2G devices will also increase.
Discussion and policy suggestions
Demand-side energy system sharing ability and adaptability under different loads and liberalization levels are practically significant. This paper established the following policy recommendations for Japan and similar countries.
Photovoltaic devices are the leading equipment option when transaction liberalization levels are low, and increasing PV penetration will inhibit V2G. Cluster 3 (shopping center) exhibited weakest inhibition effect of PV on V2G, and changing self-sufficiency was most stable (23–24%), which is most suitable for PV-battery-V2G system applications. This is consistent with previous studies that only considered PVs and batteries (Li et al., 2018). Combinations are best due to great impacts on PV economic benefits and strong coupling with commercial building load curves. Therefore, commercial buildings are the most suitable construction objects for microgrids for countries and regions that do not allow direct energy transactions between buildings. Cluster 5 (office building) generate benefits through power sales even when PV FITs reduced to 11–12 Yen / kWh, which FITs will occur soon in Japan. Although power generation and grid connection have some economic benefits due to PV equipment cost reduction, matching battery and V2G technologies are advised during construction when FITs electricity price ≤ 7 Yen/kWh (targeted for 2030). V2G comes to the fore when transaction liberalization is high. Cluster 5 (office building) as V2G aggregator in the electricity free trade scenario can increase self-sufficiency > 40% for the whole region. Thus, introducing V2G can improve building energy self-sufficiency. This is consistent with previous studies (Sovacool et al., 2020), but those researches could not identify building type(s) most suitable for V2G microgrid. Therefore, it is essential to ensure that at least some EV charging piles can be bi-directional (charge and discharge) during office buildings construction in countries and regions that allow transactions between buildings.
Conclusion and prospect
This study divided 49 different buildings into 6 clusters using factor and cluster analyses. Optimal PV-battery-V2G microgrid configurations and adaptabilities were analyzed under spontaneous self-use, photovoltaic FITs, and electricity free trade modes. Commercial buildings were the most suitable construction goals under spontaneous self-use, and office buildings were the most suitable construction target under the PV FITs and electricity free trade scenarios.
Data for this study were collected on site, covered all common building types. Equipment selection and energy policy for the considered microgrid in this study correspond with current common equipment types and policy standards in Japan. The results have strong adaptability in Japan and similar countries and regions. Hence this paper has high universality and practical reference value.
However, this study only considered sensitivity analysis for equipment cost and power price, and did not study other performance parameters of the equipment. We also did not discuss impacts on other support or subsidy policies aside from the FITs policy. This study was limited to local pricing, etc. Energy price systems differ considerably between countries and regions. Hence future study should consider the impacts from different pricing models.
We used Monte Carlo methods to simulate visiting vehicles states, and actual statistical data may differ significantly. Future studies should consider how to ensure the simulations more strongly match actual measures.
Footnotes
Declaration of conflicting interests
The author(s) declared no potential conflicts of interest with respect to the research, authorship, and/or publication of this article.
Funding
This research has been supported by the scientific research fund of Shanda University (No. 2022BSZX02)
Appendix
See Table A1.