
Abstract
This work's focus is determining how the improvements in wind power technology alter current onshore wind power potential and exploitable electrical energy in Turkey. Then, consequent environmental and economic benefits through substitution of imported hard coal, natural gas and local lignite resources in the Turkish electricity mix have been analyzed. Lack of potential, environmental and economic data kept offshore wind calculations out of the scope of this work. Increasing hub height and power coefficient due to better blade designs of wind turbines can increase 114 thousand MW of onshore wind power potential at 50 m up to 418 thousand MW at 300 m. Consequent wind electricity generation can change in the range of 2.3 × 10⁵–1.95 × 10⁶ GWh. Acknowledging several different conditions operating wind turbines can be subject to and that the whole capacity may not be used, mean value of 1.09 × 10⁶ GWh wind electricity generation is assessed as the limit providable to the Turkish electricity grid. Installable wind power capacity (IWPC) and electricity generation potential (EGP) are both most sensitive to the changes in spacing followed by CP and aging. The level of sensitivity increases at higher hub heights for both IWPC and EGP. Environmentally, substitution of lignite and after 2040 hard coal and lignite by wind power is the most feasible option in improving environmental performance of Turkish electricity mix compared to sole substitution of hard coal, natural gas or lignite. In 2040, wind can replace all lignite hence in the years following 2040, wind can substitute lignite and a second fossil resource. Economically, hard coal and natural gas substitution result in 10.85 billion $ and 7.93 billion $ gain from 2021to 2050. Local job creation and carbon tax mechanisms to be employed in favor of wind power can create additional economic and social benefits for the country.
Introduction
As a developing economy and having an increasing population, Turkey has the highest electricity utilization rate increase among all OECD (Organization for Economic Co-operation and Development) countries (RTINDC, 2018). In 2020, 57.7% of electricity in Turkey was generated from fossil resources; mostly from imported hard coal and natural gas that constitute 75% of the fossil resources utilized in electricity generation (TEIAS, 2020). Although hydropower is currently the dominant renewable electricity generation technique, the potential of other renewable energy sources in Turkey are underutilized (TEIAS, 2020; Barıs and Kucukali, 2012). Around 33.0% of all greenhouse gas (GHG) emissions originated from electricity generation for the year 2018 and the total GHG emissions of the country continue to rise (OECD, 2018). Electricity generation related environmental problems such as air pollution, global warming and volatility in fossil fuel prices necessitate generation of power via alternative environmentally benign technologies (Owusu and Asumadu-Sarkodie, 2016). Turkey has 21.0% GHG reduction commitment by 2030 corresponding to 246 million tons of CO2 under United Nations Framework on Climate Change (UNFCC). Wind power can be a promising resource contributing to this goal. Additionally, meeting electricity needs with wind power, a local renewable resource can be a significant cure in the context of energy security for the country (RTINDC, 2018).
Literature review
Existing literature regarding wind energy in Turkey has a diverse scope. Kaplan studied the legislations related to wind energy and incentives needed for promotion and wider adoption concluding that wind power potential is underutilized in Turkey due to lack of necessary policies (Kaplan, 2015). Regional studies for onshore wind power potential (Arslan et al., 2020; Akın and Kara, 2017), offshore wind power potential estimate for Black Sea Region and Turkey's all coastal regions are performed. All of the offshore wind power estimate studies referred for Turkey have quite different ranges for the offshore wind potential of the country. They calculate offshore wind potential from 1629 MW to 9021 MW at 150 m height in coastal regions of Turkey (Argın et al., 2019; Emeksiz and Demirci, 2019; Argın and Yerci, 2017). Studies of joint hydropower and wind electricity potential (Donmez et al., 2017), wind energy capital investment (Tagliapietra et al., 2019), green hydrogen production by utilization of wind power (Karayel et al.; 2022) are also available.
Environmental impacts and comparison of wind power with other energy technologies are also widely studied (Siddiqui and Dincer, 2017; Xua et al., 2018; Huang et al., 2017; Martineza et al., 2018; Abbasi et al., 2014; Dai et al., 2015). Studies concentrating on environmental impacts of wind power employ life cycle assessment (LCA) methodology in general. Siddiqui and Dincer (2017) compare electricity generation by wind turbines with hydro and nuclear electricity. According to their findings, wind power has higher impacts in eutrophication, acidification and photochemical ozone creation potential categories than other alternatives. These impacts are mainly attributed to construction phase of the wind turbines. Global warming potential (GWP) wise, wind power is found to be quite advantageous (12 g CO2 eq./kWh) (Siddiqui and Dincer, 2017). When life cycle impacts of onshore and offshore wind power are compared, higher environmental impacts of offshore wind turbines are mainly due to the higher quantity of foundation materials required in the installation phase (Xua et al., 2018; Huang et al., 2017). Additionally, end of life processes and recycling of wind turbines at the end of their lifespan are important in terms of their life cycle impacts (Siddiqui and Dincer, 2017; Martineza et al., 2018). Based on this fact, Mertineza et al. studied environmental performances of “dismantling or repowering” of a wind farm reaching its end of life via LCA. While repowering has considerably better environmental performance than dismantling, renewal of electrical parts constitutes the main impacting parameter of repowering (Martineza et al., 2018). Environmental issues with wide adoption of wind power and precautions that can mitigate these impacts are also investigated. Careful planning and location selection with respect to human settlements and bird migration routes are some of these important precautions that can be taken (Abbasi et al., 2014; Dai et al., 2015). Furthermore, studies on the technological development trends in wind power and future directions focus on development of wind turbines with higher hub height and larger blade area (Watson et al., 2019; Gkantou et al., 2020; Kumar et al., 2016).
Literature review reveals that wind power potential rise due to technological advancement in wind power technology, changes that can occur in Turkish electricity environmental impacts and consequential economic aspects have not been studied. The
In the rest of this article, background information on wind power potential in Turkey and technology related considerations of the work are presented in Background section. Following section includes analysis methods and the related assumptions utilized. Results and discussion reveal the study findings followed by the main conclusions.
Background
Wind power in Turkey
Turkey has 114000 MW total on-shore installable wind power potential (WPP) at 50 m height according to data provided by General Directorate of Energy Affairs (GDEA, 2020). These are submitted as raw data in a separate file and can be referred. By December 2020, Turkey has 8830 MW installed wind power capacity that only corresponds to 7.75% of the total potential [GDEA, 2020 and TWEA, 2020). Wind is the renewable energy source with the highest installed capacity increase (TWEA, 2020), and meets 8.10% of electricity consumption in 2020 (TEIAS, 2020). Currently, there is no offshore wind turbine operating in Turkey and offshore WPP data for the whole country are not available. Furthermore, studies estimating offshore WPP for Turkey calculate hugely different values in the range of 1629 MW and 9021 MW at 150 m height in coastal regions (Argın et al., 2019; Emeksiz and Demirci, 2019; Argın and Yerci, 2017). Although considering these values;
Technology specifics and considerations in the study
Wind turbines convert kinetic energy that a wind flow has into mechanical energy first and then to electrical energy. Mathematically, electrical power that a wind turbine can generate is proportional to the third power of the wind speed at the hub height of the turbine. Wind speed being the dominant factor increasing power harnessed by wind turbines followed by turbine blade area, trends in improvement of wind power technology focus on development of wind turbines with higher hub height and larger blade area (Watson et al., 2019; Gkantou et al., 2020; Kumar et al., 2016).
Today wind turbine hub heights are around 100 m with 2 to 3 MW capacity on average (Radmanathan et al., 2019; Wiser and Bollinger, 2019). Future projections foresee turbines up to 250−300 m hub height. Ramanathan et al. present projections of wind turbines with 250 m hub height and 20 MW capacity in an attempt of discussing improvements in wind energy conversion systems to increase exploitable wind electricity potential (Radmanathan et al., 2019). A survey discussing the decreases in wind electricity costs indicates expected hub height rises as one of the main reasons (Wiser et al., 2021). S&P Global report wind turbine size of 16 MW for 2024 and onwards with hub heights over 200 m referring to major sector actors of Vestas and Mingyang Smart Energy (S&P Global, 2022). Watson et al. states wind resources between 100 and 1000 m should be assessed in detail for possible gains (Watson et al., 2019). Considering that our work covers a time horizon of 2020−2050 in its evaluations and mentioned tendencies of the wind power sector,
Three parameters are accounted for that affect WPP and EGP calculations. Of those, positioning of wind turbines is an important parameter for optimum wind electricity generation. 6–10 rotor diameter (D) distance spacing is generally applied for horizontal axis wind turbine farms. Hence, 6D to10 spacing is applied in calculations to explore sensitivity of WPP and EGP to spacing (Son et al., 2014; Meyers, 2011).
Secondly, the proportion of power a wind turbine can convert into electricity to what is originally available in the wind flow is significant and known as the power coefficient (CP). Thermodynamic limit for this value is called Betz's limit and determined to be 0.59 (Manwell et al., 2010; Burton et al., 2011). Currently, for a good performing turbine CP is around
Lastly, efficiency loss due to turbine aging should be analyzed. A diverse review of multiple wind farms determined an 1.6% efficiency decline in power output per year (Staffel and Green, 2014). 20 years being the common lifetime for a wind turbine, 10 years is the time for replacement and maintenance of electrical and certain turbine parts (Wang et al., 2020). Hence, yearly efficiency loss up to
All in all, our work also examines the sensitivity of WPP and EGP to spacing, CP and aging at different hub heights.
Environmental and economic aspects
With its standardized framework, life cycle assessment (LCA) is an environmental performance evaluation technique that is extensively used to assess environmental impacts of energy technologies. The phases of LCA framework are goal and scope definition, inventory analysis, impact assessment and interpretation (Gunee et al., 2011; ISO, 2006). For conciseness, LCA methodology and environmental impact categories are explained in detail in the supplementary material (SM) and can be referred. Atilgan and Azagapic (2016) evaluated the environmental impacts of multiple energy resources in the context of Turkey on kWh electricity basis from LCA perspective except for solar power. Filing this gap, Kursun (2022) calculated environmental impacts of solar power per kWh for Turkey. Based on these studies, substitution of imported hard coal, natural gas and local lignite by wind power is studied due to their high environmental impacts and changes in electricity mix impacts are assessed.
Turkey is dependent on imported resources in energy sector and imports 74% of these resources to meet her primary energy demand (MFA, 2020). For electricity generation, 57.7% of utilized energy resources were fossil fuels in 2020 and 75.0% of these were imported hard coal and natural gas (TEIAS, 2020). Furthermore, Turkey pays substantial amount of foreign currency for energy resource imports. Hence, economic benefits that can be acquired due to substitution of imported energy resources (hard coal and natural gas) have been assessed on the basis of the currency gain in 2020-dollar value. Lastly, it is important to note that both environmental and economic assessments are realized from 2020 to 2050.
Methodology
This section explains analysis methods and assumptions utilized in this work. Furthermore, a comprehensive supporting material (SM) containing sample calculations, methodological details and data tables related to each subsection of the Methodology is prepared and presented with the article. In each subsection here, where the related calculation details and data in the SM can be found is also mentioned.
Change of Turkish population and electricity demand
Turkey has a population of around 83.9 million in 2020. Data provided by Turkish Statistical Institute (TUIK) estimate a decelerating increase in Turkish population and reach it to around 105 million in 2050 (TUIK, 2022a). Detailed population data can be found in Supplemental Table S1 of the SM.
To calculate annual electricity demand increase, data presented in Supplemental Table S2 of the SM from 1971 to 2020 are processed. An average of 7.72% annual electricity utilization increase is determined during these 49 years. When last 10 years from 2011 to 2020 are considered, annual average increase is 4.83% (TUIK, 2022b). For electricity demand projections, 1% below (3.83%) and 1% above (5.83%) of annual increase range is used in calculations to capture recent trends.
Wind power density, wind power potential and electricity generation
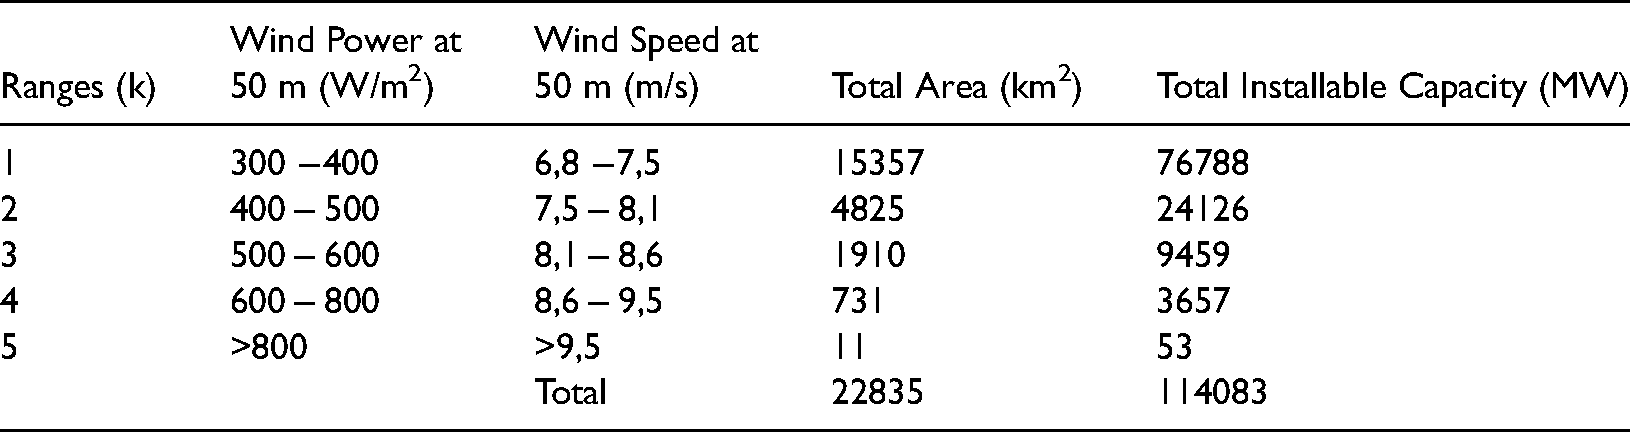
Table 1 presents wind power density distribution (W/m2), wind speed (m/s) and total installable wind power capacity (MW) for Turkey at 50 m height (raw data is submitted with the article). City by city data generated by General Directorate of Energy Affairs (GDEA) of Turkey have been added to calculate total quantities of area and installable power capacity for Turkey. Suitable areas for wind power installation are determined according to certain criteria. These are wind speed distribution, closeness to substations, electricity transmission lines, residential areas etc. (GDEA, 2020). Hence, wind power increase due to technological development in these areas are calculated following the steps below.
Wind power density distribution, wind speed and total installable wind power capacity for Turkey at 50 m height (GDEA, 2020).
Installable wind power capacity in a region corresponds to the rated power of the wind turbines that can be constructed in that area. This capacity changes up to the wind speed at the considered hub height, power coefficient (CP) of the turbine and local geographical characteristics which are reflected in wind shear exponent α.
Wind shear coefficient,
Electrical energy that can be generated by a wind turbine generally does not match with its rated power due to the intermittent nature of wind. That means wind does not have the optimum wind speed to make the turbine generate its maximum power 100% of the time. There comes the concept of capacity factor (CF).
Wind power density
To determine wind power density (W/m2) at different heights, first step needed is to calculate the wind speeds at corresponding altitudes (100, 150, 200, 250, 300 m). Due to the increase in wind turbine hub heights, these calculations are made to explore the change in wind power potential range at higher altitudes for Turkey.
To extrapolate wind speed at higher altitudes, three methods are proposed. The most widely adopted Monin-Obukhow method provides a robust basis for extrapolation of wind speed because of including several site-specific parameters. However, the method can evaluate short term data meaningfully and could not be utilized in extrapolation of our annual average wind speed data. Other method that can be utilized in wind speed extrapolation is Logarithmic Wind Profile law. This method provides reliable outcomes given that site specific data z0 can be found or calculated (Bañuelos-Ruedas etal., 2011). For instance, site specific studies as in Demir and Taskın (2013), Logarithmic Wind Profile law is utilized in wind speed extrapolation. However, obtaining this parameter for all sites is not possible for a country wide study like we conduct. Z0 value data for all sites or regions are not available for Turkey. Hence, Hellman exponential law also called as power law is utilized in wind speed extrapolations in this work. To accommodate shortcomings of the method, not single but 0.10–0.25 range of shear exponent values corresponding to different settings are applied in calculations. 0.10–0.25 range is adopted since small towns and cities are not considered as suitable areas for high-capacity wind turbine installations. This approach enables calculation of possible wind speed ranges under changing conditions at considered higher altitudes consequently changing wind power and electricity generation potential. Power law is even utilized in regional studies by considering different shear exponent values as in Bidaoui et al. (2019).
Equation (1) facilitates application of power law to our study. In this equation, Z0 and Zi represent 50 m and extrapolated altitudes where i takes 100,150,200,250 and 300m values. V50k represents the wind speed at 50 m for corresponding range that is denoted by k taking values from 1 to 5. Vik stands for wind speed in m/s at higher altitudes Zi and subscripts i and k take values as explained. Lastly, α is the wind shear exponent taking the values of 0.10, 0.14, 0.20 and 0.25.


Installable wind power capacity
In calculation of new total installable wind power capacities (IWPC) in MW, effects of spacing, power coefficient (CP) and aging are considered. For optimum wind power generation. 6–10 rotor diameter (D) distance spacing is generally applied for horizontal axis wind turbine farms spacing (Son et al., 2014; Meyers, 2011). A mean value of 8D is used for calculation. To calculate 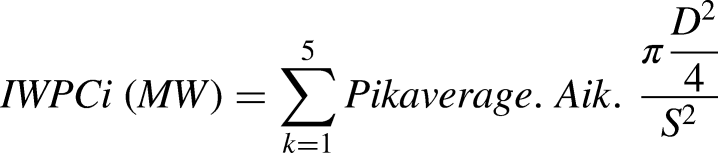
Capacity factor and wind electricity generation
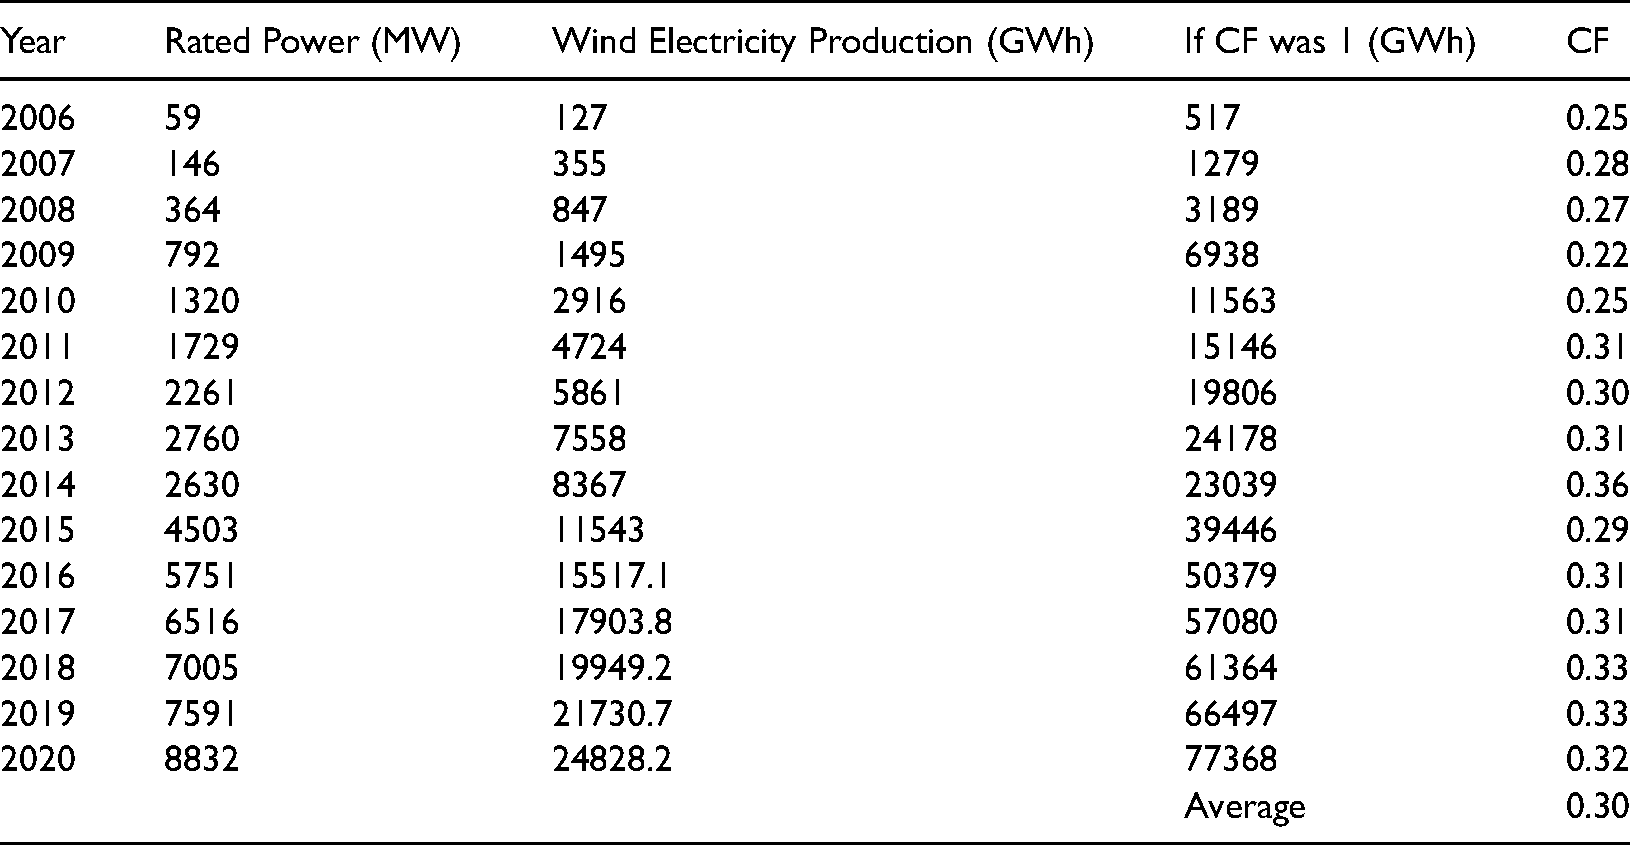
In calculation of CF for Turkey, wind power installed capacity that is the rated power of installed onshore wind turbines and generated wind electricity data from 2006 to 2020 are assessed and results are presented in Table 2 (GDEA, 2021; TEIAS,2020). A backwards approach is adopted here. Maximum possible electricity generation if capacity factor was 1 for the whole country is calculated, then the ratio of real electricity generation to maximum possible electricity generation is computed corresponding to CF. Averaging CF values found for each year, 0.30 value is determined and adopted as the country average CF value in further calculations (GDEA, 2021; TEIAS, 2020). Since our work is not a regional but a country wide study, this approach is followed.
Installed wind power capacity and wind electricity generation in Turkey from 2006 to 2020 (GDEA, 2021; TEIAS, 2020).
Determination of CF enables EGP calculations. To calculate 
In assessing wind electricity generation outcomes, it is important to acknowledge that all the turbines operating will not have the same hub height, age, CP values and will not be subject to the same local conditions (α). Additionally, all of the available capacity may not be utilized. Hence, mean of the computed wind electricity potential range will be accepted as the limit that wind power can provide in this work.
Sample calculations for wind power density, IWPC, EGP and related tables can be found in
Fossil resource substitution and electricity mix environmental impacts
Figure 1 presents the composition of Turkish electricity mix in 2020 having 8.10% wind power share (TEIAS, 2020).
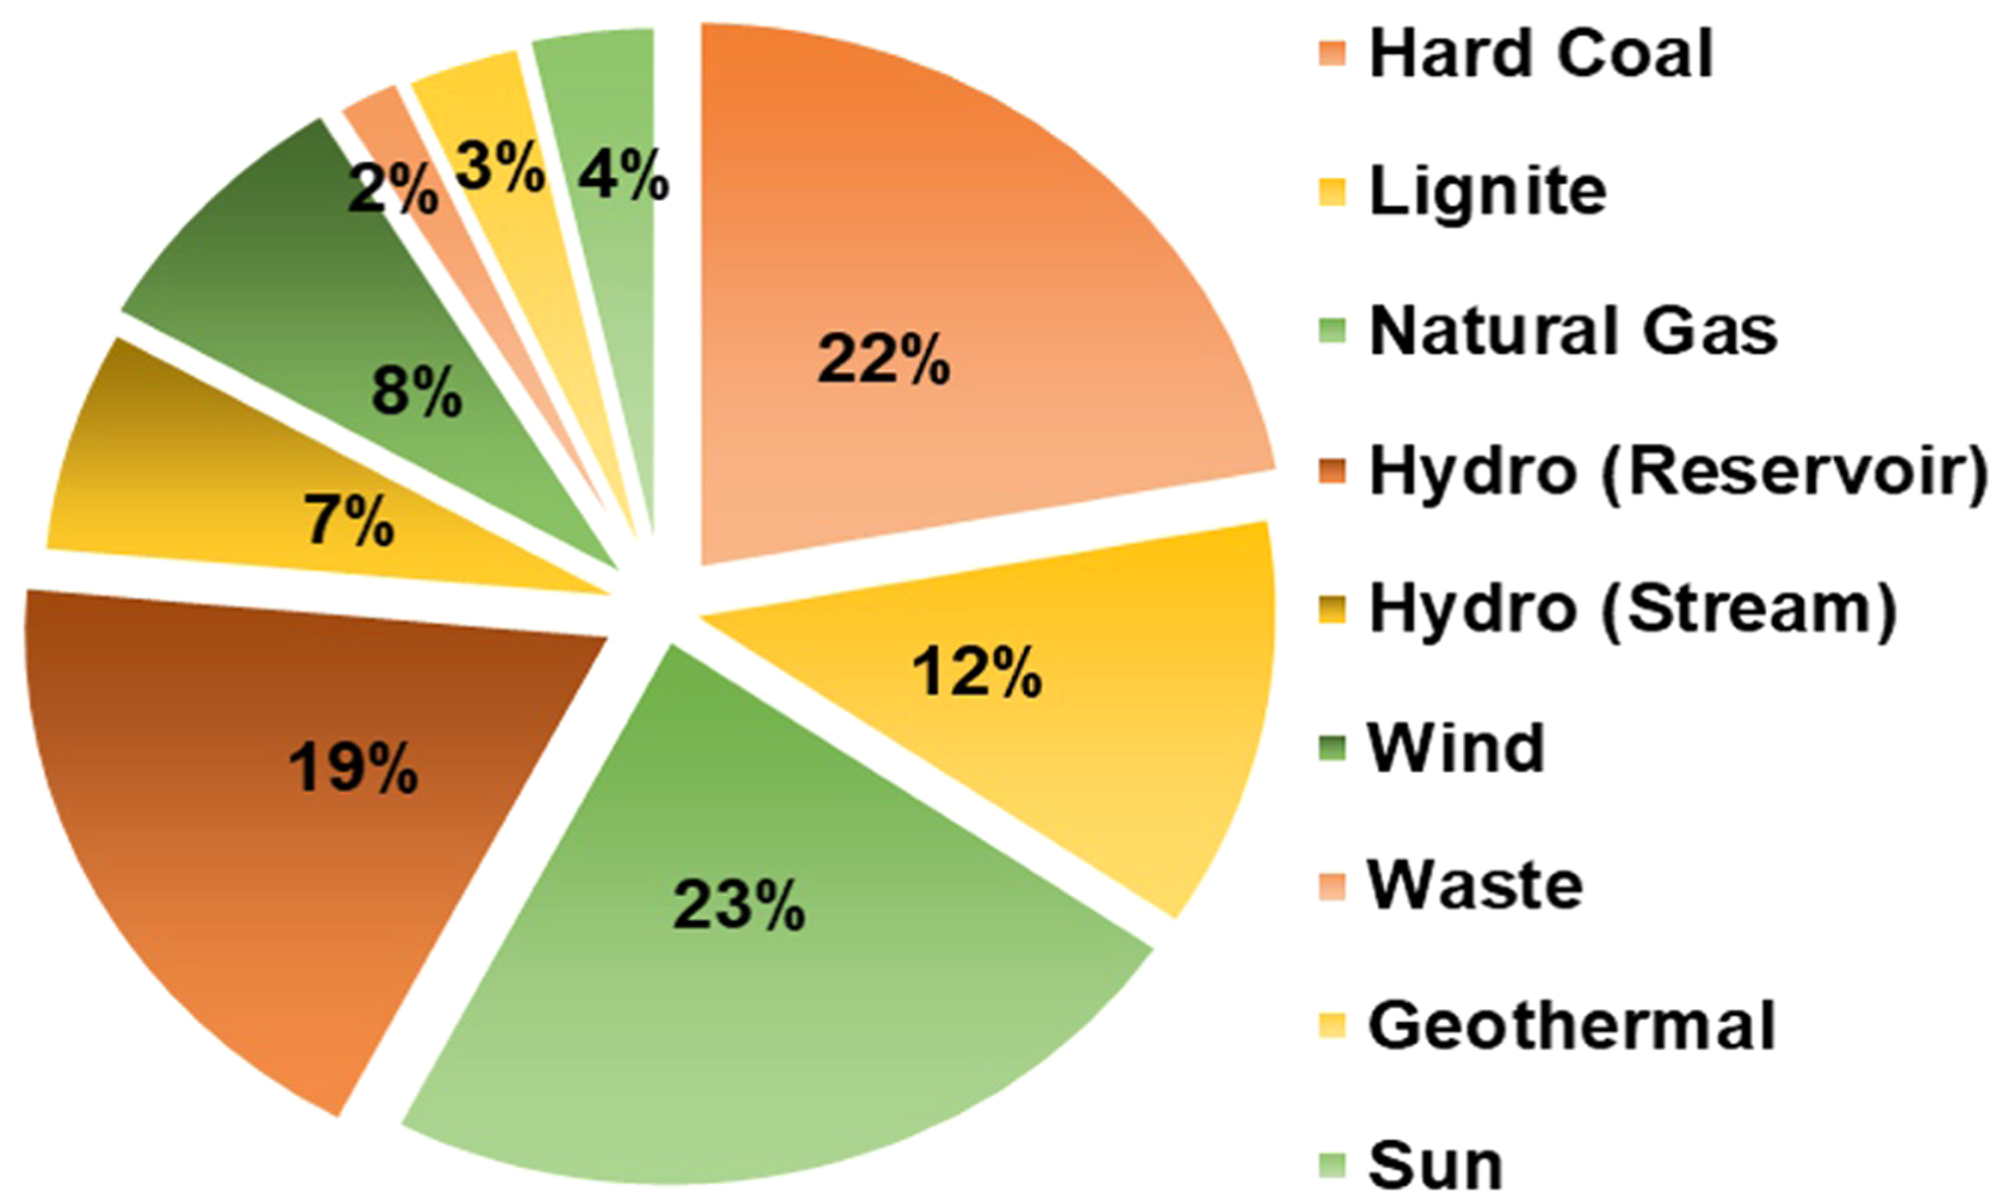
2020 Turkish electricity mix composition by different resources (TEIAS, 2020).
Table 3 presents the coefficients per kWh electricity for the life cycle impacts evaluated in our work (Atılgan and Azapagic, 2016; Kursun, 2022). Here, emission levels per kWh electricity generation from each of the considered energy resources are given. For instance, 1 kWh electricity generation by utilization of hard coal emits 1060 g of CO2 equivalent GHG and 2.31 g of PO43− equivalent of eutrophication causing emissions. Having emission levels for the energy sources in Turkish electricity mix enables calculation of environmental impacts related to electricity generation in Turkey. Multiplication of the coefficients in Table 3 by the corresponding percentage of each resource in 2020 electricity mix and summing them, total life cycle impact per kWh of electricity is calculated for all of the 8 impacts individually by utilization of equation (7). In equation (7), i represents different energy resources in the electricity mix.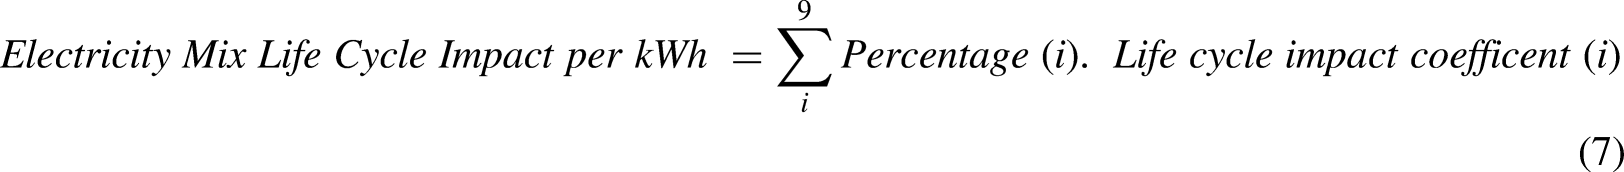
Life cycle impacts of different energy resources per kwh electricity generation in Turkish electricity mix.
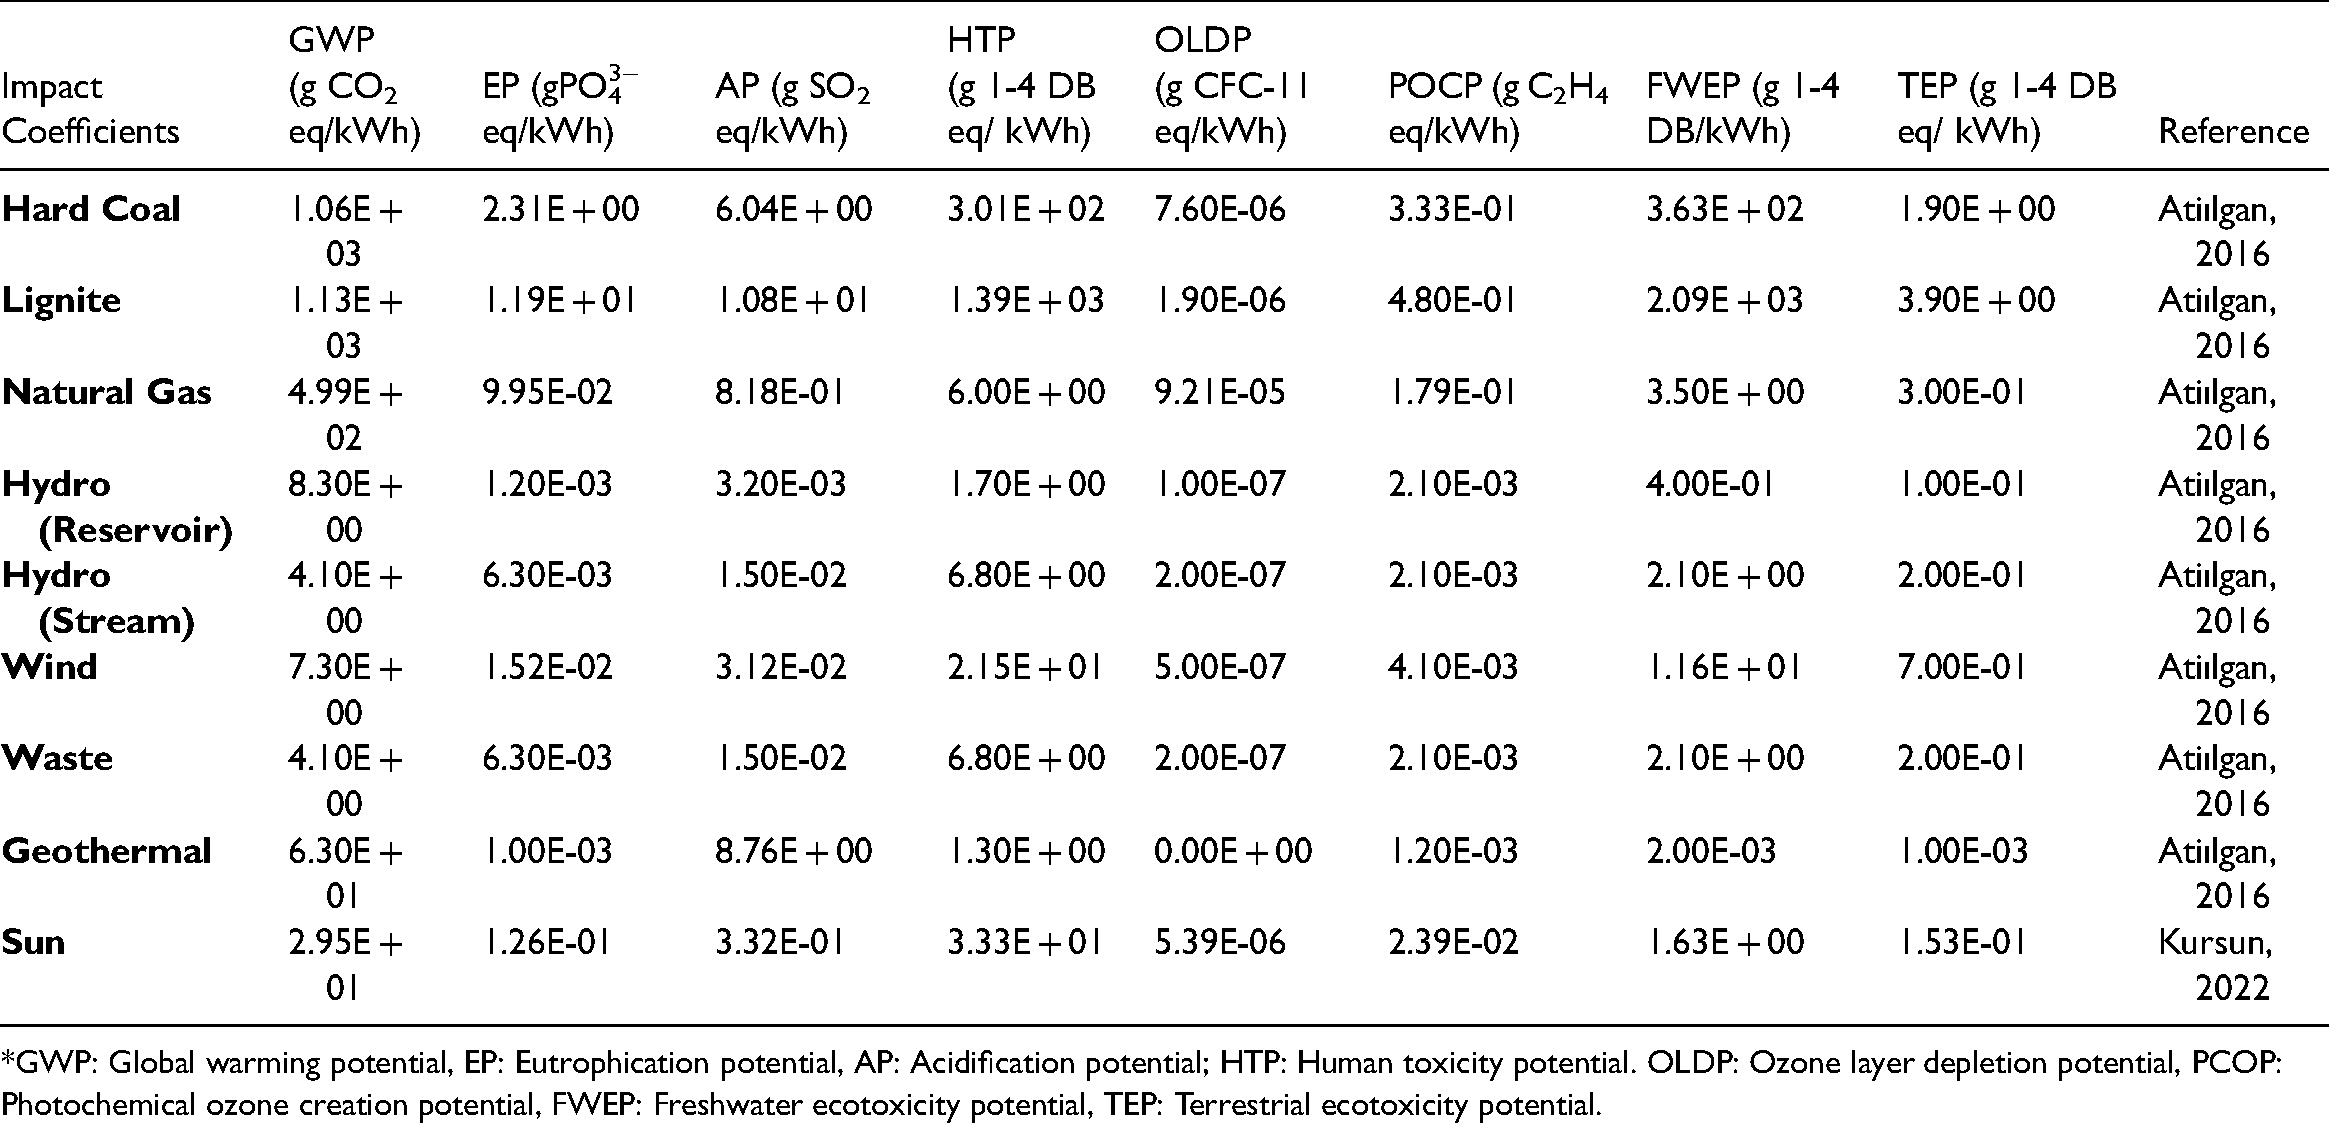
*GWP: Global warming potential, EP: Eutrophication potential, AP: Acidification potential; HTP: Human toxicity potential. OLDP: Ozone layer depletion potential, PCOP: Photochemical ozone creation potential, FWEP: Freshwater ecotoxicity potential, TEP: Terrestrial ecotoxicity potential.
To determine Turkish electricity mix environmental impacts in the years of 2025, 2030, 2035, 2040, 2045 and 2050, calculation of the average wind power share increase in the electricity mix and its percentage in considered years are necessary. Based on change of wind power in Turkish electricity mix from 2010 to 2020 (GDEA, 2021), 0.672% annual increase rate for wind is calculated (in Supplemental Table S15 of SM). Hence, 8.10% wind power percentage in the 2020 electricity mix rises to 11.46%, 14.82%, 18.18%, 21.54%, 24.90% and 28.26% in the years 2025, 2030, 2035, 2040, 2045 and 2050, respectively. As can be seen in Supplemental Table S16 of SM, maximum wind electricity required to realize these substitutions is 4.23 × 10⁵ GWh.
Substitution of hard coal by wind
In analyzing the effect of substitution of hard coal-based electricity by wind power on electricity mix environmental impacts, new electricity mix compositions are constituted for considered years. The percent increase in wind power corresponds to the percent reduction in hard coal percentage in the mix. Supplemental Table S19 in the SM includes the new compositions of Turkish electricity mix due to hard coal substitution. Environmental impacts as a result of electricity composition change are also calculated for each term by modification of equation (7). The absolute values of environmental impacts for each term due to hard coal substitution can be found in Supplemental Table S20 of the SM.
Substitution of natural gas by wind
As in hard coal, new electricity mix compositions are also constituted for the substitution of natural gas-based electricity by wind power. These compositions can be found in Supplemental Table S21 of the SM. Here, projected wind power percentages for 2025, 2030, 2035, 2040, 2045 and 2050 are utilized with corresponding reductions in natural gas percentage in the mix. By applying equation (7) for these compositions, change in electricity mix impacts are determined. Calculated environmental impact values for each term due to natural gas substitution can be found in Supplemental Table S22 of the SM.
Substitution of lignite and hard coal by wind
Lastly, substitution of lignite first due to its high environmental impacts and then imported hard coal by wind power is explored. Composition of electricity mix change can be found in Supplemental Table S23 of the SM. Here, projected wind power percentage for 2025, 2030, 2035, 2040, 2045 and 2050 are utilized with corresponding reductions in lignite first and then in hard coal percentage. Environmental impacts as a result of electricity composition change are calculated for each term by application of equation (7). New environmental impact values for each term due to lignite and hard coal substitution can be found in Supplemental Table S24 of the SM.
Economic aspects
Economic benefits that can be acquired due to substitution of imported energy resources hard coal and natural gas have been assessed based on the currency gain in 2020-dollar value. First step taken for this evaluation is to calculate the wind electricity generated from 2021 to 2050 in GWh for each year by also considering the increasing electricity demand. Then, quantities of electricity substituted due to rise in wind electricity and decline in hard coal and natural gas electricity are computed. Based on substituted electricity quantities, amounts of avoided usage of hard coal and natural gas are calculated. 339 tons of coal generates 1 GWh electricity under conditions of Turkey and the country imported hard coal at 80$/ton price in 2020 (THI, 2021). Similarly, 1 m3 natural gas generates 10.64 kWh electricity. Turkey imported natural gas at 0.21 $/m3in 2020 (EMRA, 2021).
Presentation of all the steps and results for economic assessment can be found in Supplemental Tables S25 and S26 of the SM in detail.
Results and discussion
Electricity demand projection
According to Turkish Statistical Institute (TUIK) data, Turkey's population is 83.9 million in 2020, this population is expected to reach to 104.8 million in 2050. 0.291 million GWh electricity demand in 2020 increases to the range of 1.48 and 1.52 million GWh in 2050 with the 3.83%−5.83% range of annual electricity demand increase as can be seen in Figure 2. In addition to increasing population, this tremendous increase of about 4 folds is attributed to the targeted industrial development by the government, expected wider use of electric cars and individual energy consumption increase due to improving life standards (such as use of several new personal electronics).
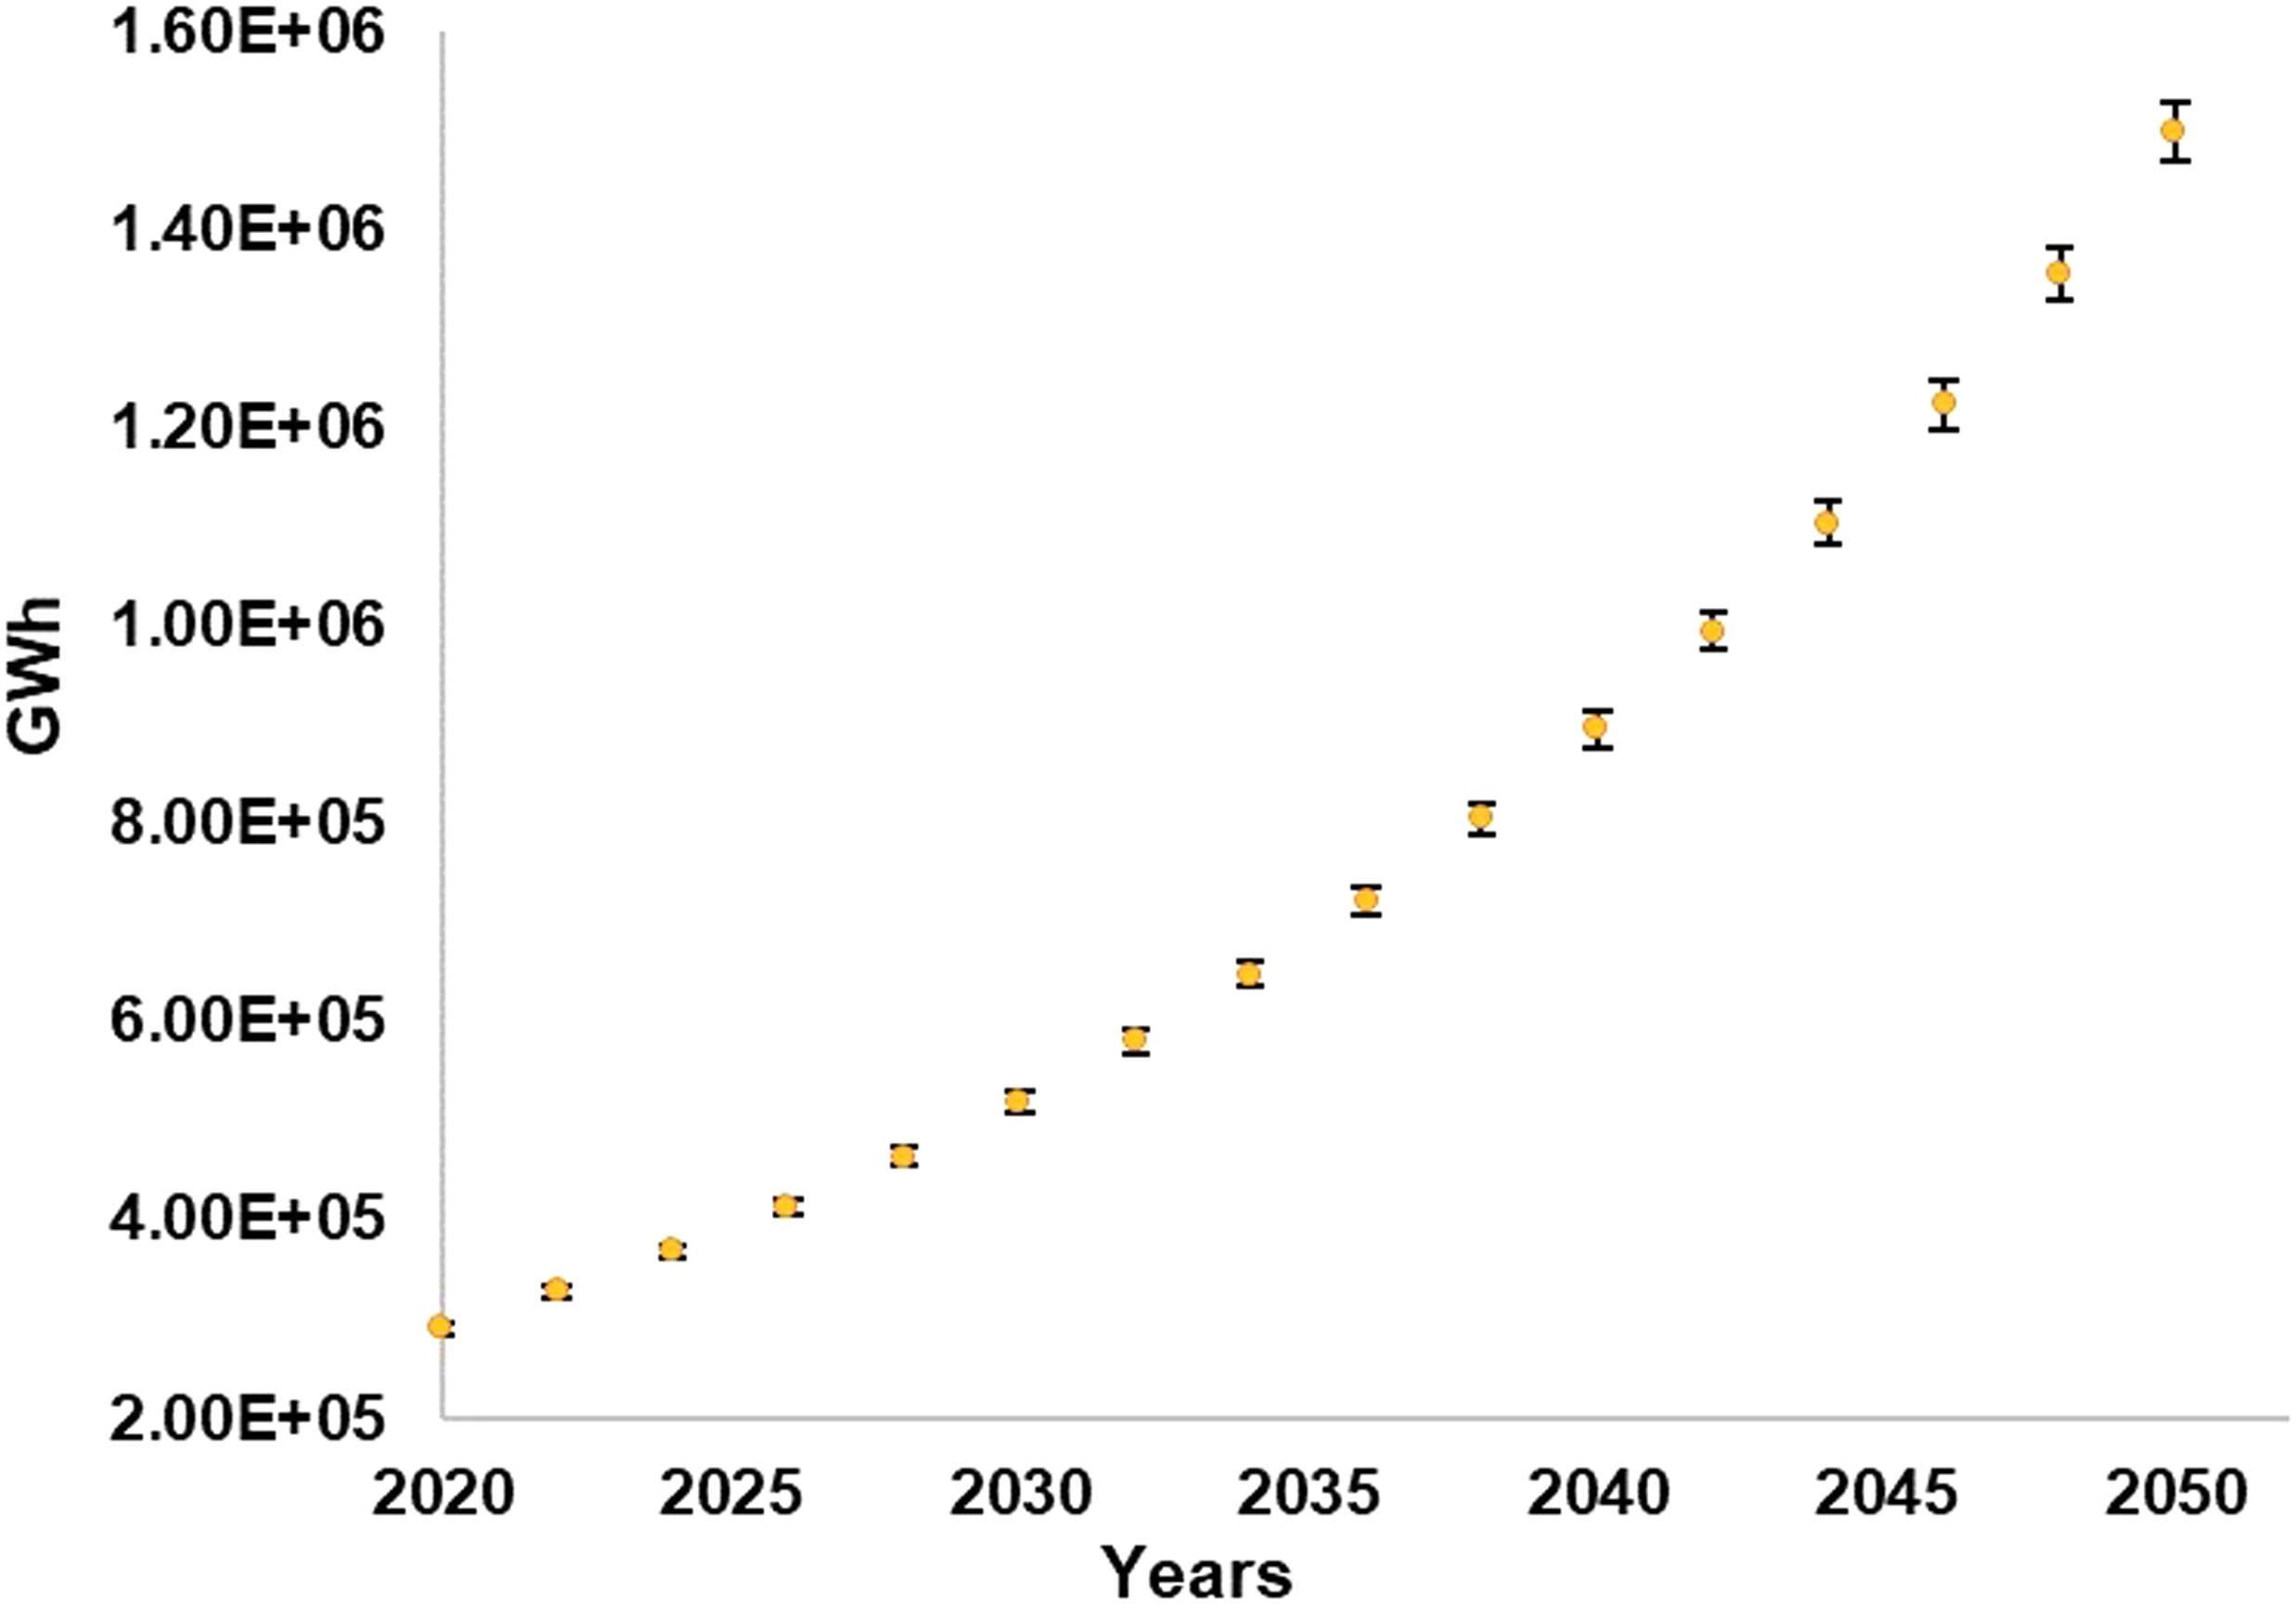
Electricity demand increase projection in Turkey from 2020 to 2050.
Installable wind power potential (IWPC)
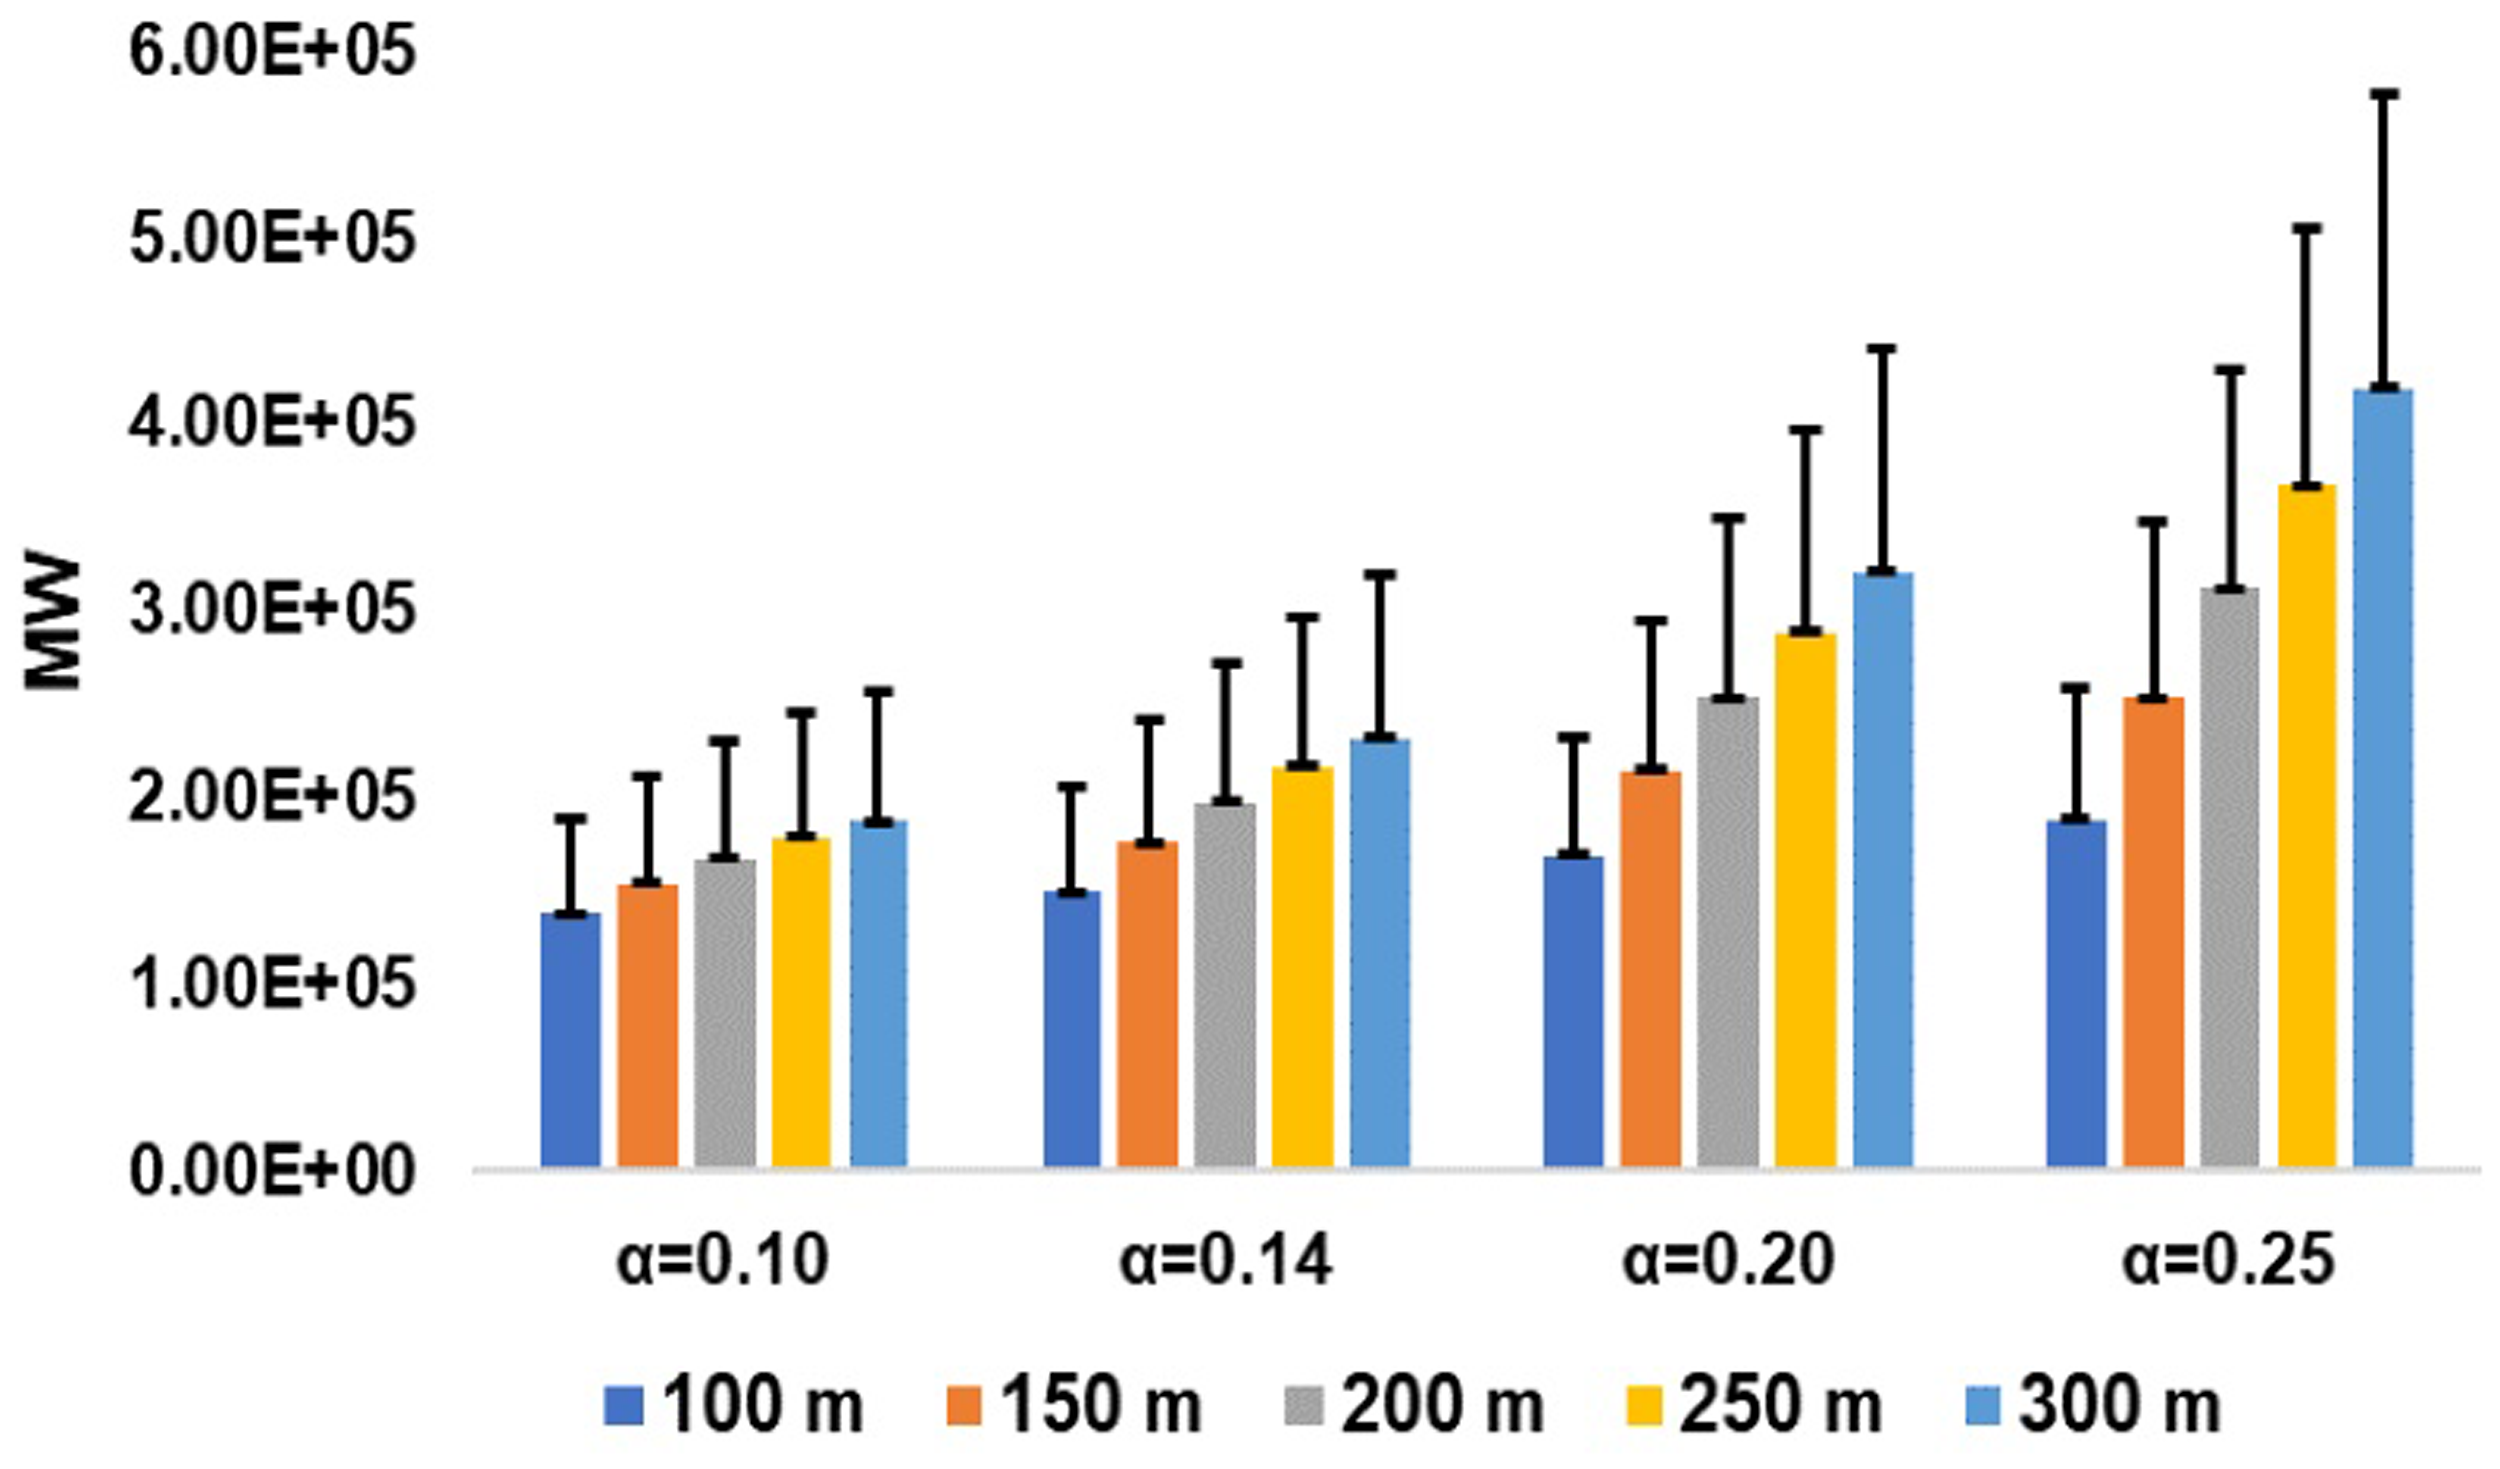
As discussed earlier 6–10 D spacing is applied in wind turbine farms for electricity generation with optimum efficiency. Change of mean IWPC values calculated for 8D spacing with rising hub height and shear exponent α is graphed and sensitivity results of mean IWPC to spacing, CP and aging are presented in Figures 3 to 5, respectively.
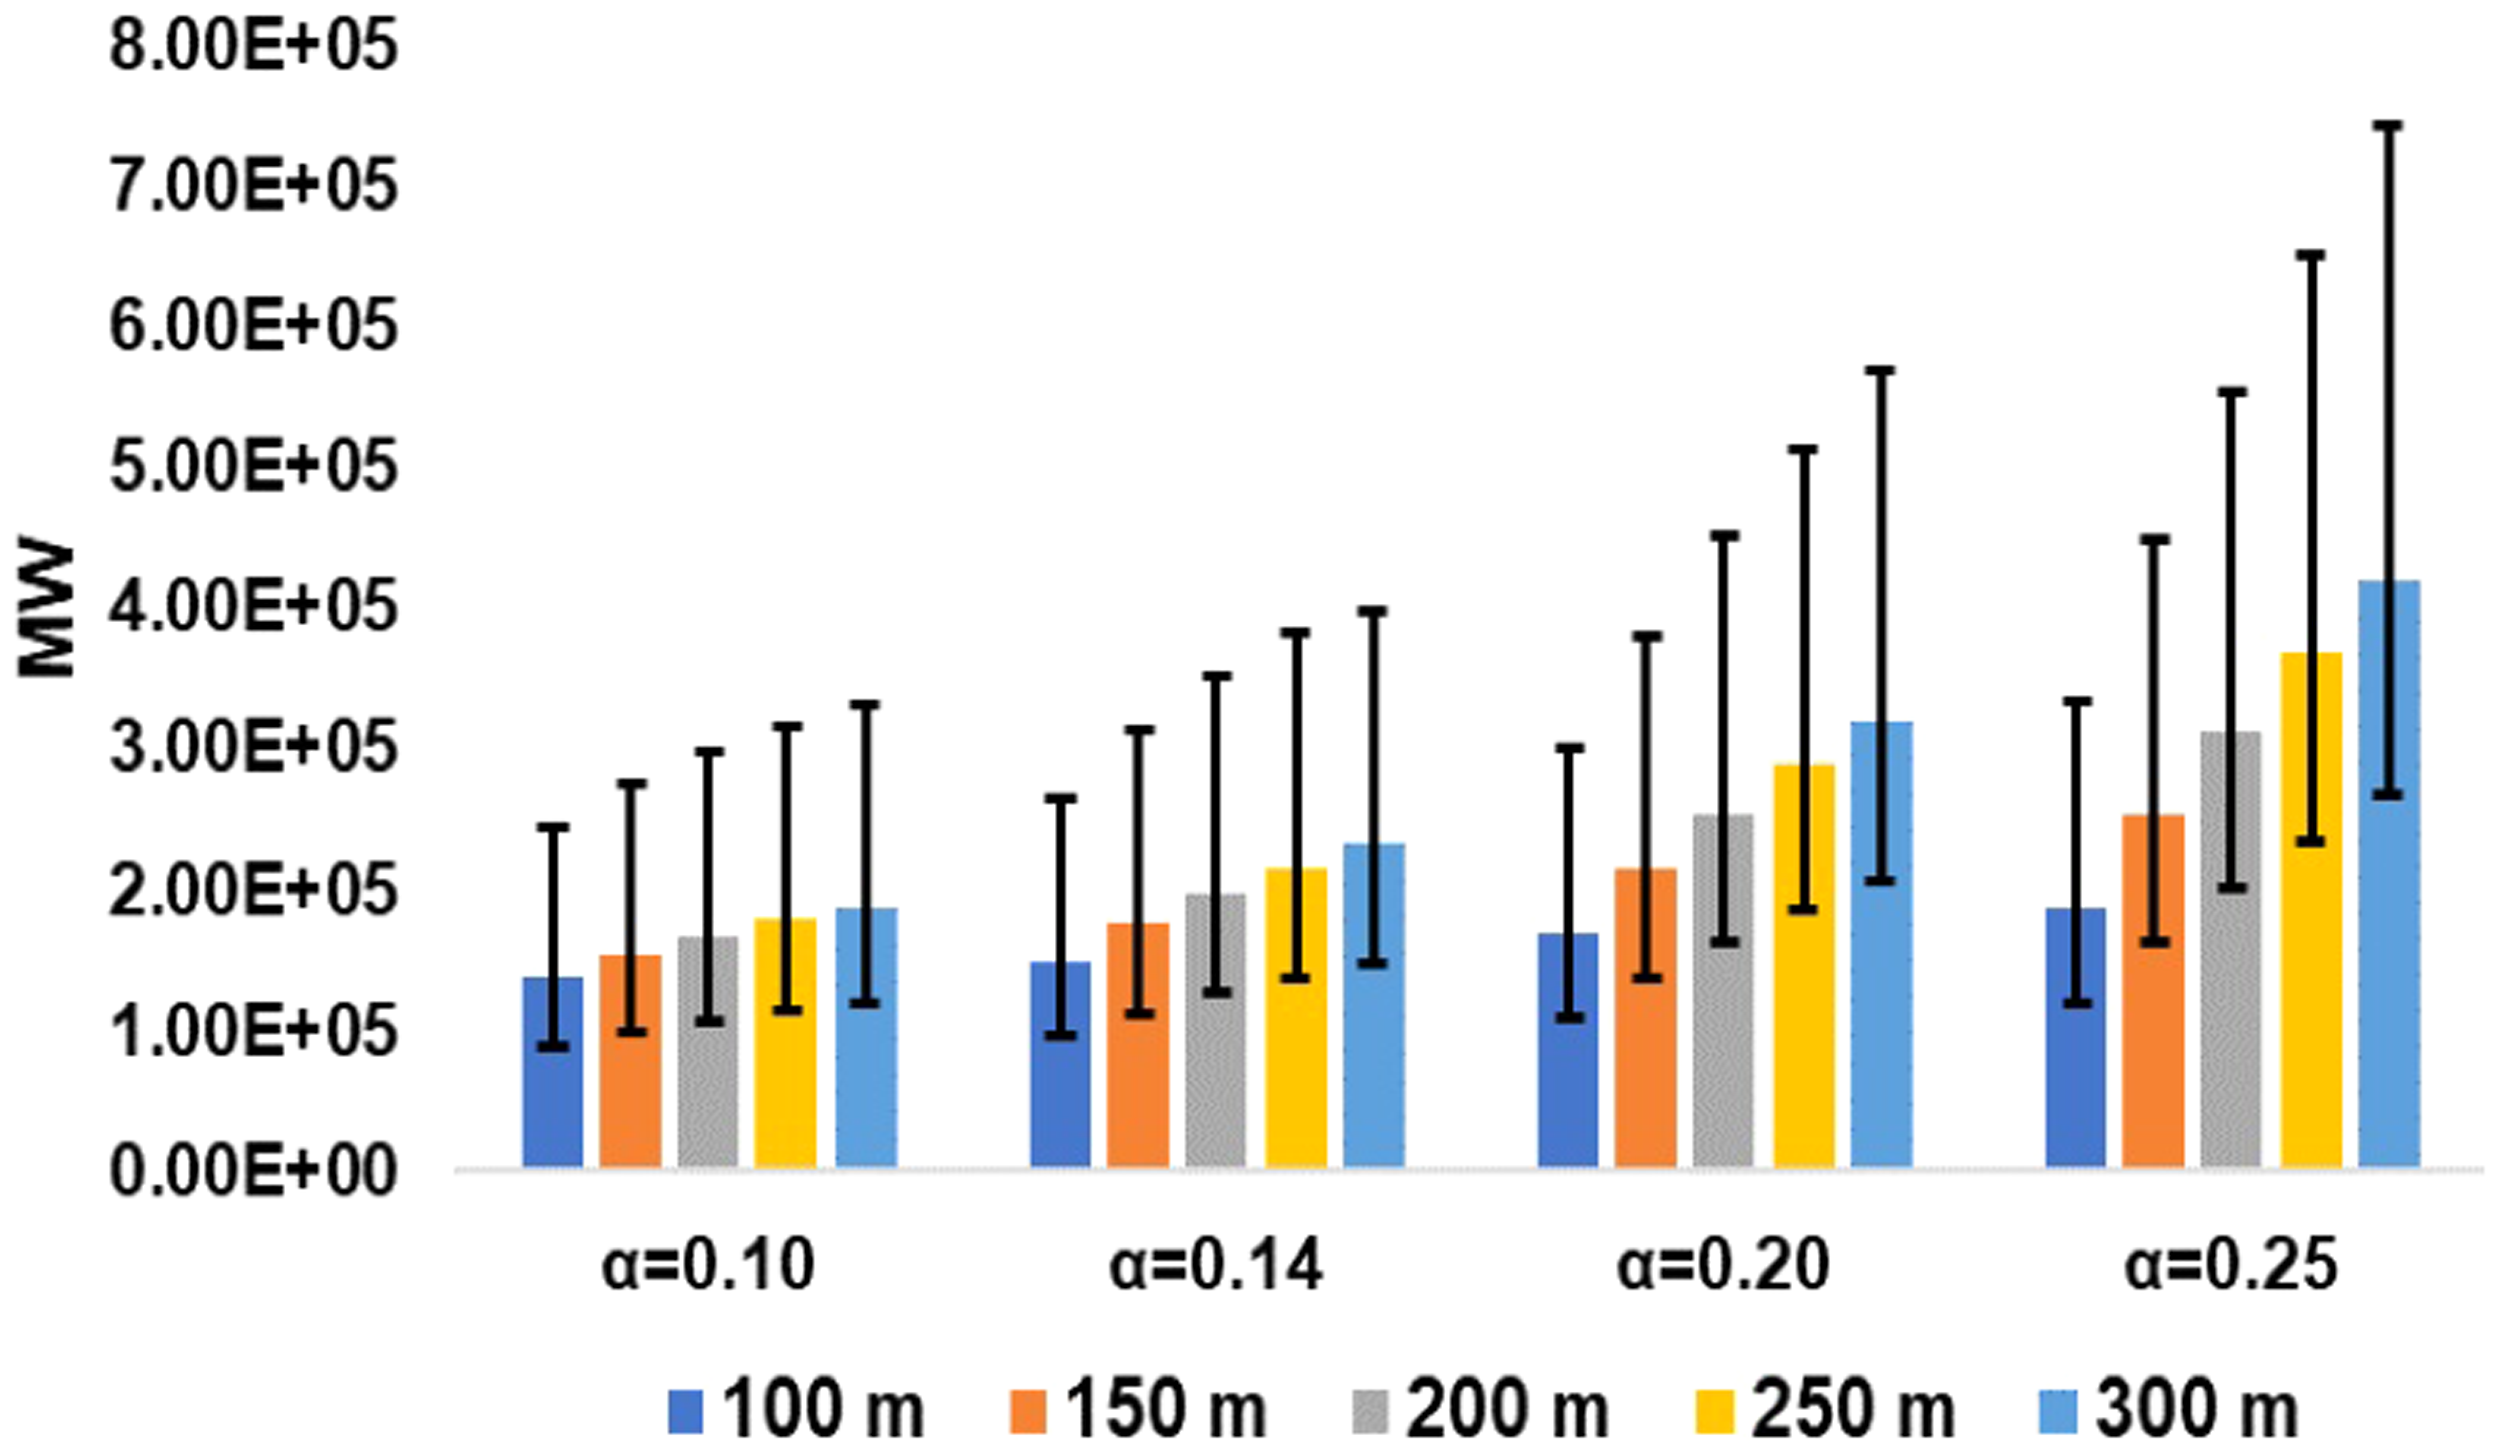
Sensitivity of mean IWPC at different hub height and α values to spacing.
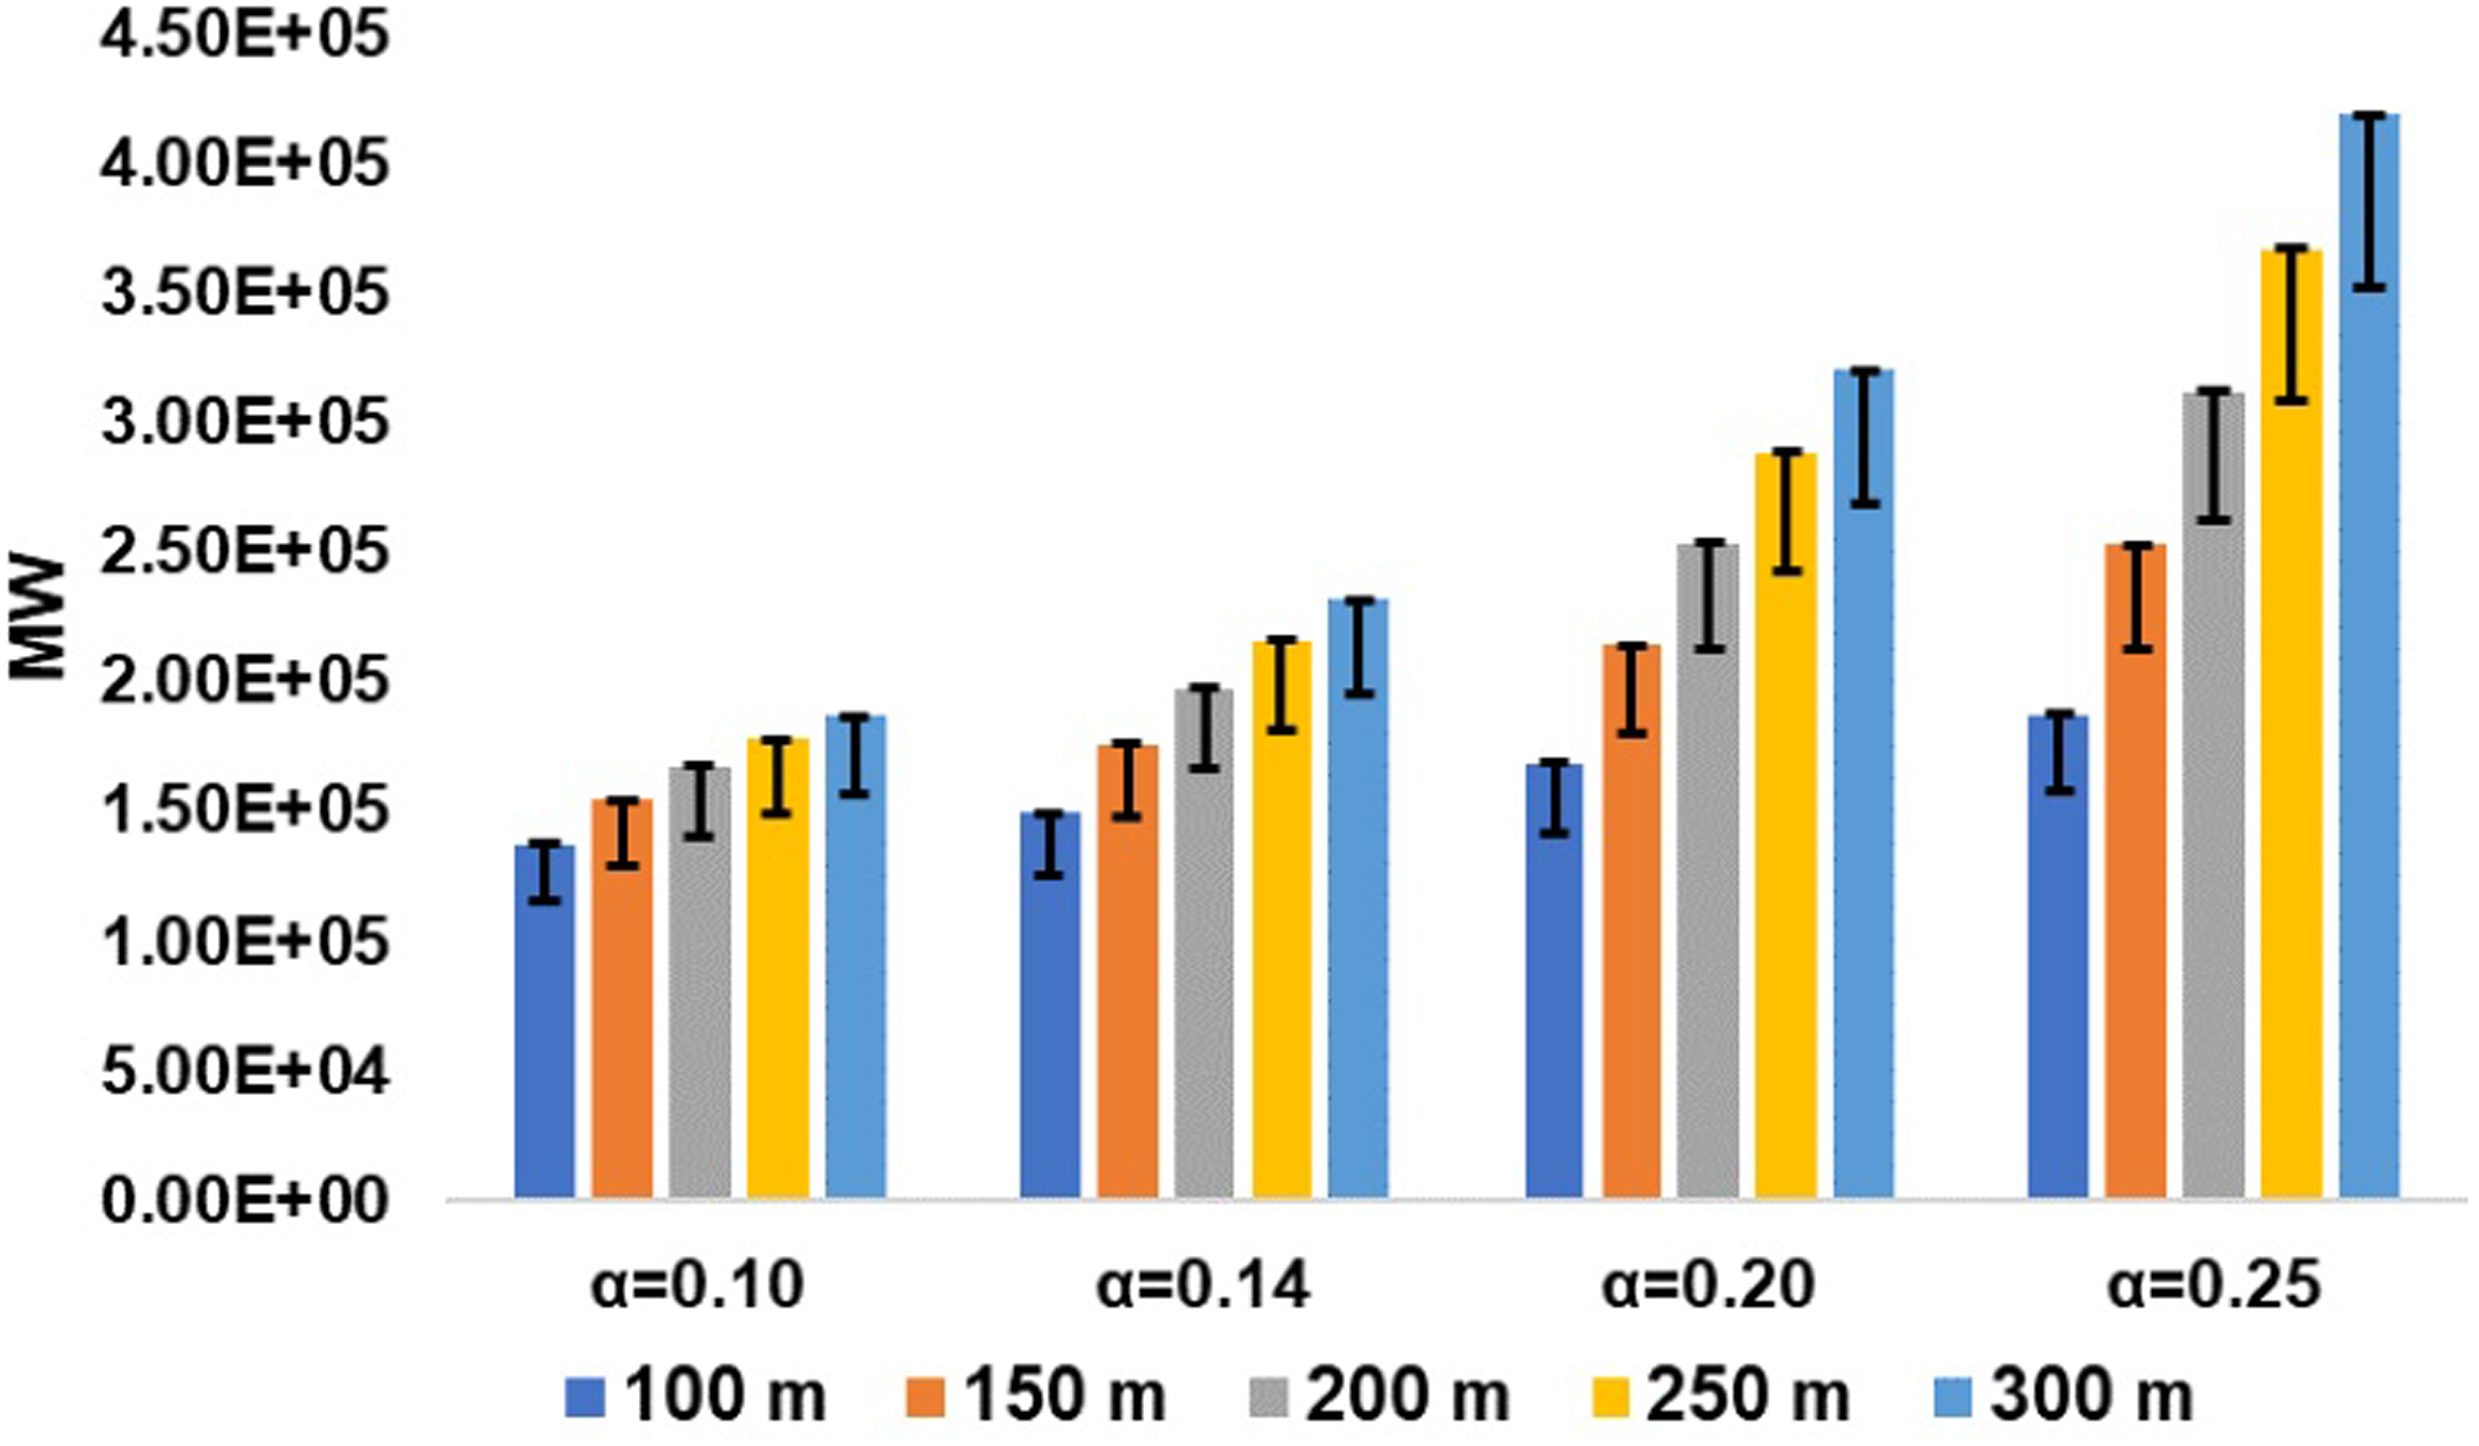
Sensitivity of mean IWPC at different hub height and α values to cp.
Sensitivity of mean IWPC at different hub height and α values to aging.
Mean IWPC rises increasingly at higher hub heights due to faster wind speeds at higher altitudes since IWPC is proportional to the third power of the wind speed. Furthermore, wind speed rise realizes at higher proportions (the power rule) with increasing shear exponent hence a sharper increase in IWPC is observed. Mean IWPC calculated for 8 D can take values from 1.37 × 10⁵ MW (at 100 m, α = 0.1) to 4.18 × 10⁵ MW (at 300 m, α = 0.25) with changing hub height and shear exponent values. These results reveal the increase that can be achieved in exploited wind power via higher hub height wind turbines and optimum site selection with higher α values.
IWPC is inversely proportional to the second power of rotor diameter D attributed to the D2 term in swept area calculation. Sensitivity analysis performed for 6D-10D range of spacing shows that IWPC is more sensitive to decreases in spacing. The magnitude of IWPC rise from mean IWPC value due to spacing decline is higher than the magnitude of IWPC decrease due to spacing rise as can be seen from the rise and decline range of error bars from 8D mean in Figure 3. This tendency reveals the necessity of possible minimum spacing selection for optimum wind electricity generation.
Sensitivity results of mean IWPC to increase of current CP value of around 0.40 to 0.55 with advancement in wind power technology in an approaching manner to Betz's limit of 0.59 is presented in Figure 4. Change of CP from 0.40 to 0.55 can increase IWPC up to 37.5% for all heights and shear exponent (α) values. However, if all else kept equal, contribution of CP rise at higher hub heights and α values to IWPC increase will also be higher in absolute terms. For instance, 1.37 × 10⁵ MW mean IWPC value at 100 m when α is 0.10 increases to 1.89 × 10⁵ MW while 4.18 × 10⁵ MW mean IWPC value at 300 m increases to 5.75 × 10⁵ MW when α is 0.25. Hence, three-fold difference in exploitable wind power and observed variability in IWPC even at the same hub height point to the crucialness of considering changes in shear exponent in wind power potential calculations.
Aging in wind turbines and parts causes efficiency decrease over time. 20 years being the common lifetime for a wind turbine, 10 years is the time for replacement and maintenance of these turbine parts. If all else kept equal, up to 16% efficiency decline can be observed for all heights and shear exponent (α) values over 10 years. However, contribution of aging to efficiency decline will be greater at higher hub heights and α values in absolute terms. This can be seen from the greater range that error bars occupy as hub height and α increases in Figure 5. 1.37 × 10⁵ MW mean IWPC value at 100 m when α is 0.10 reduces to 1.15 × 10⁵ MW while 4.18 × 10⁵ MW mean IWPC at 300 m decreases to 3.51 × 10⁵ MW when α is 0.25. The reductions in IWPC emphasizes that renewals and maintenance on wind turbines to secure optimum electricity generation should be performed not necessarily one in 10 years but at determined time intervals based on economical return and replacement cost calculations.
Overall, our results convey that IWPC is most sensitive to the changes in spacing followed by CP and then aging.
Electricity generation potential (EGP)
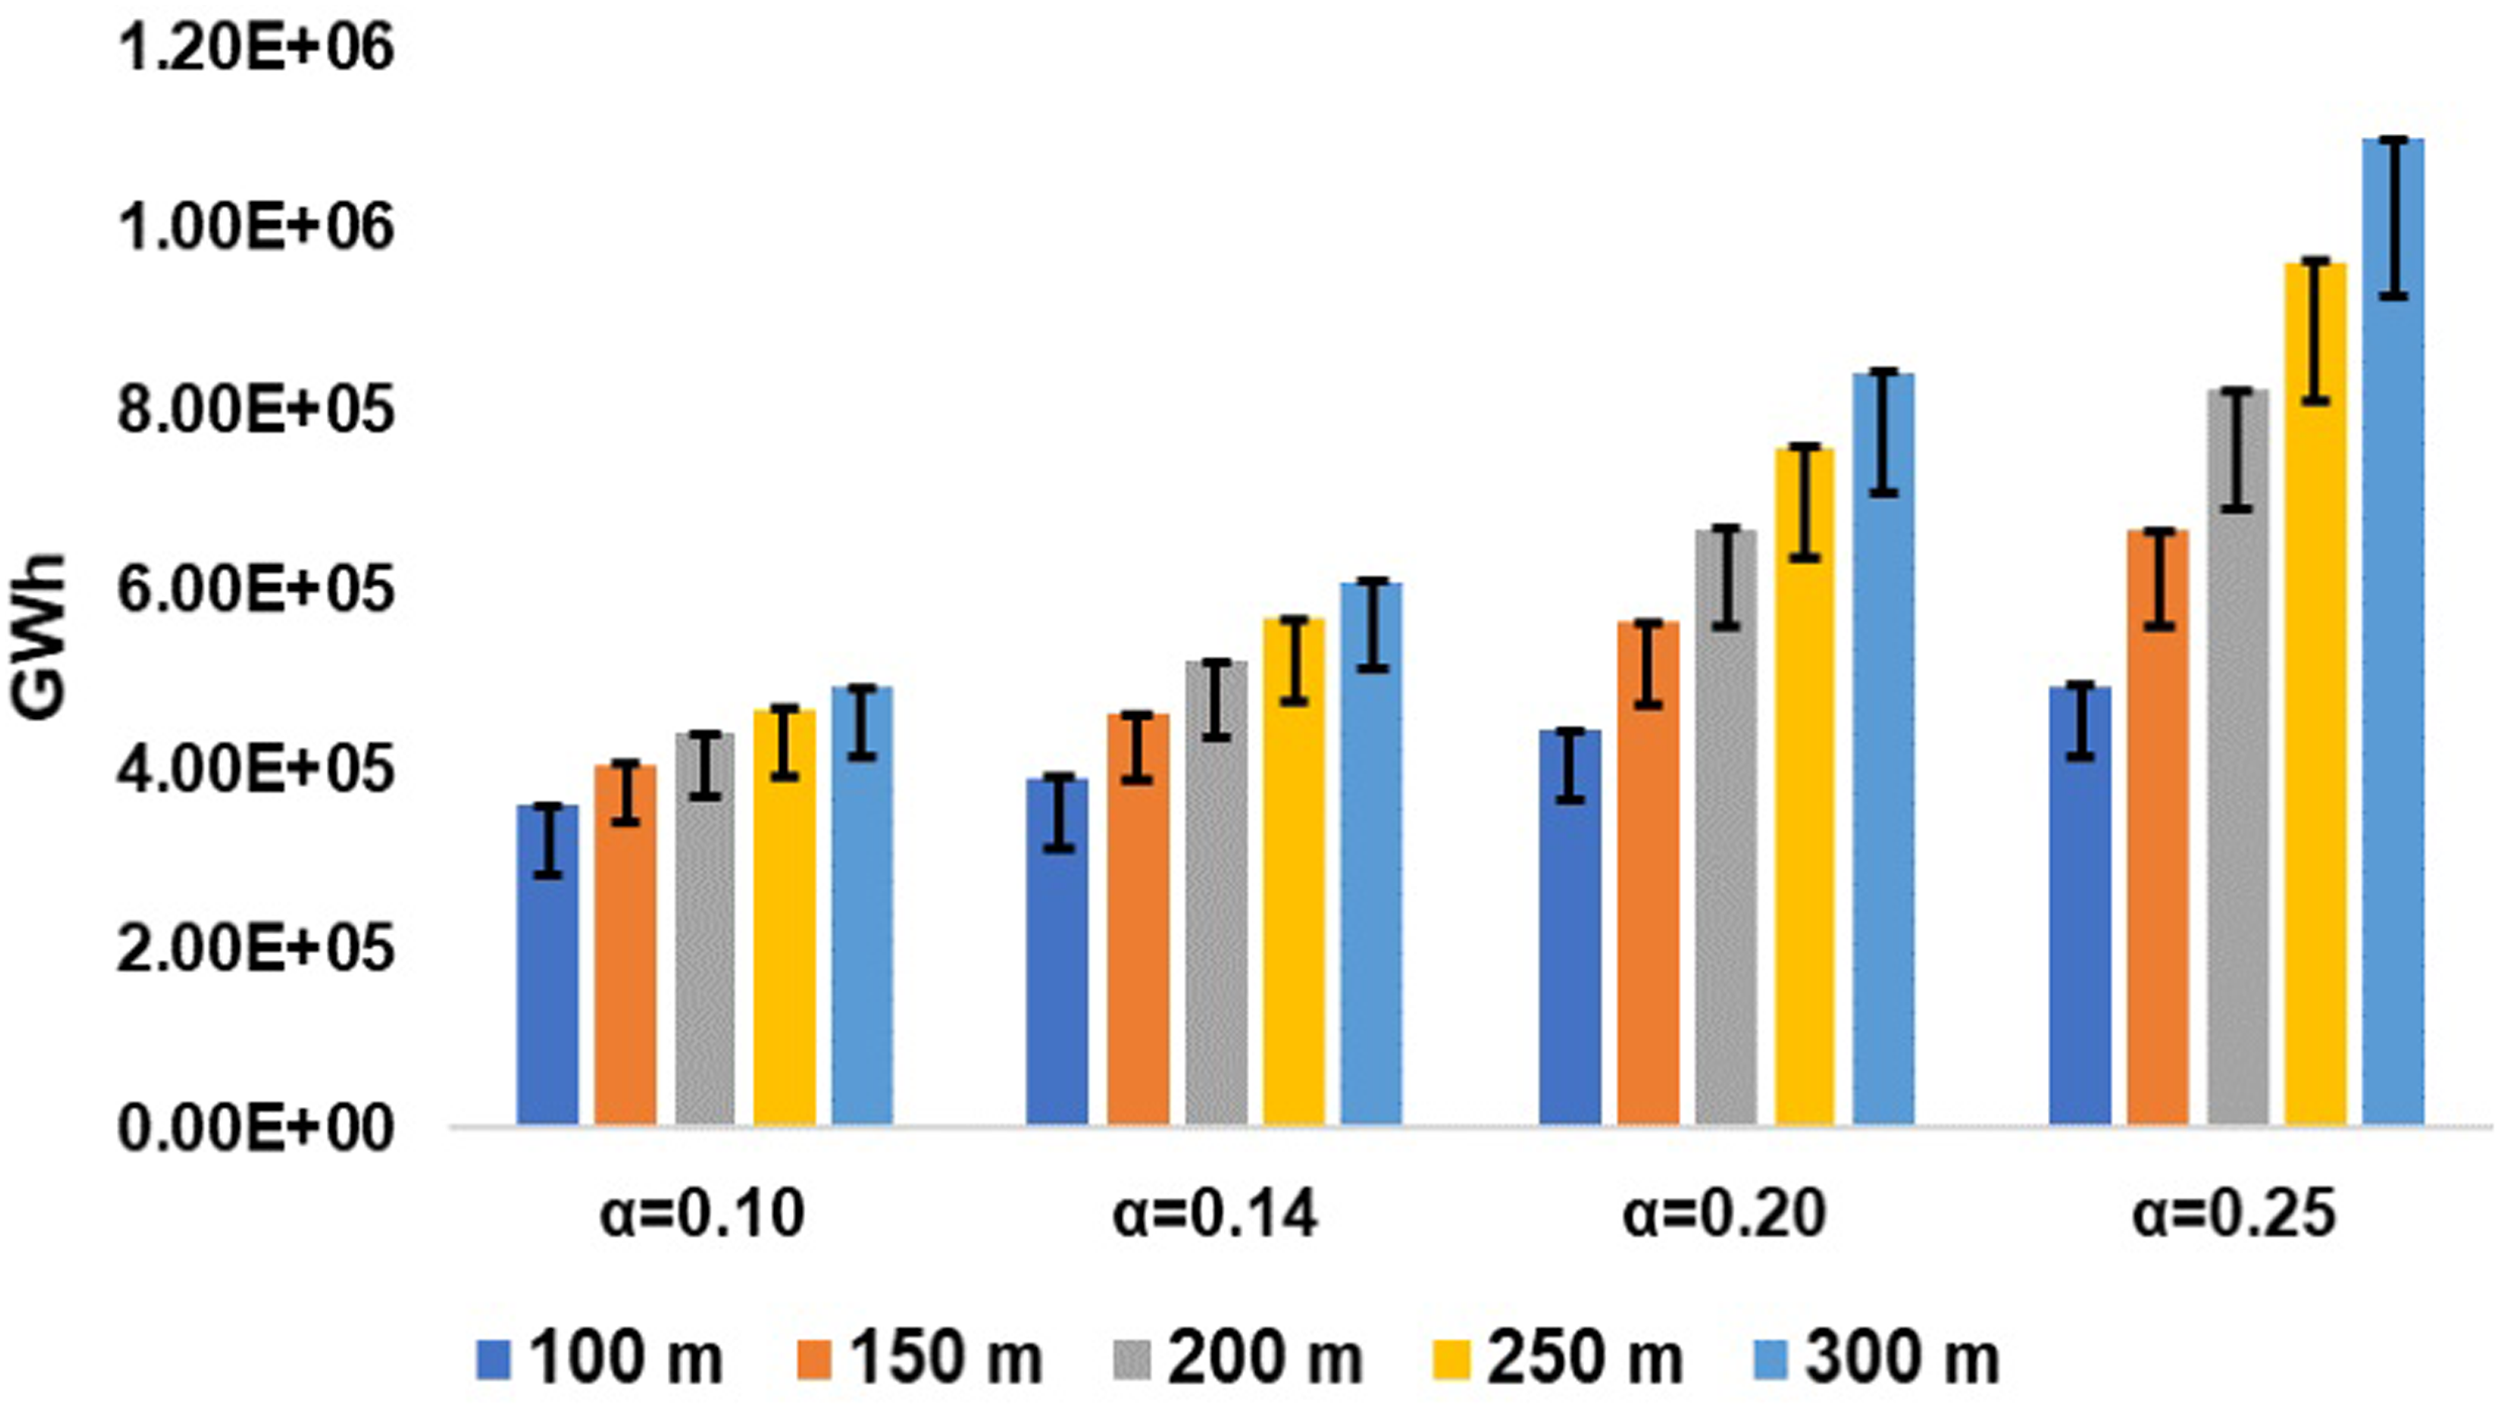
Sensitivity results of mean EGP to spacing, CP and aging are presented in Figures 6 to 8, respectively. Having similar trends with IWPC, mean EGP also shows a sharper increase with rising hub height and α values. 3.60 × 10⁵ GWh mean EGP value at 100 m when α is 0.10 increases to 1.95 × 10⁶ GWh at 300 m when α is 0.25 due to faster wind speeds at higher altitudes and larger α values.
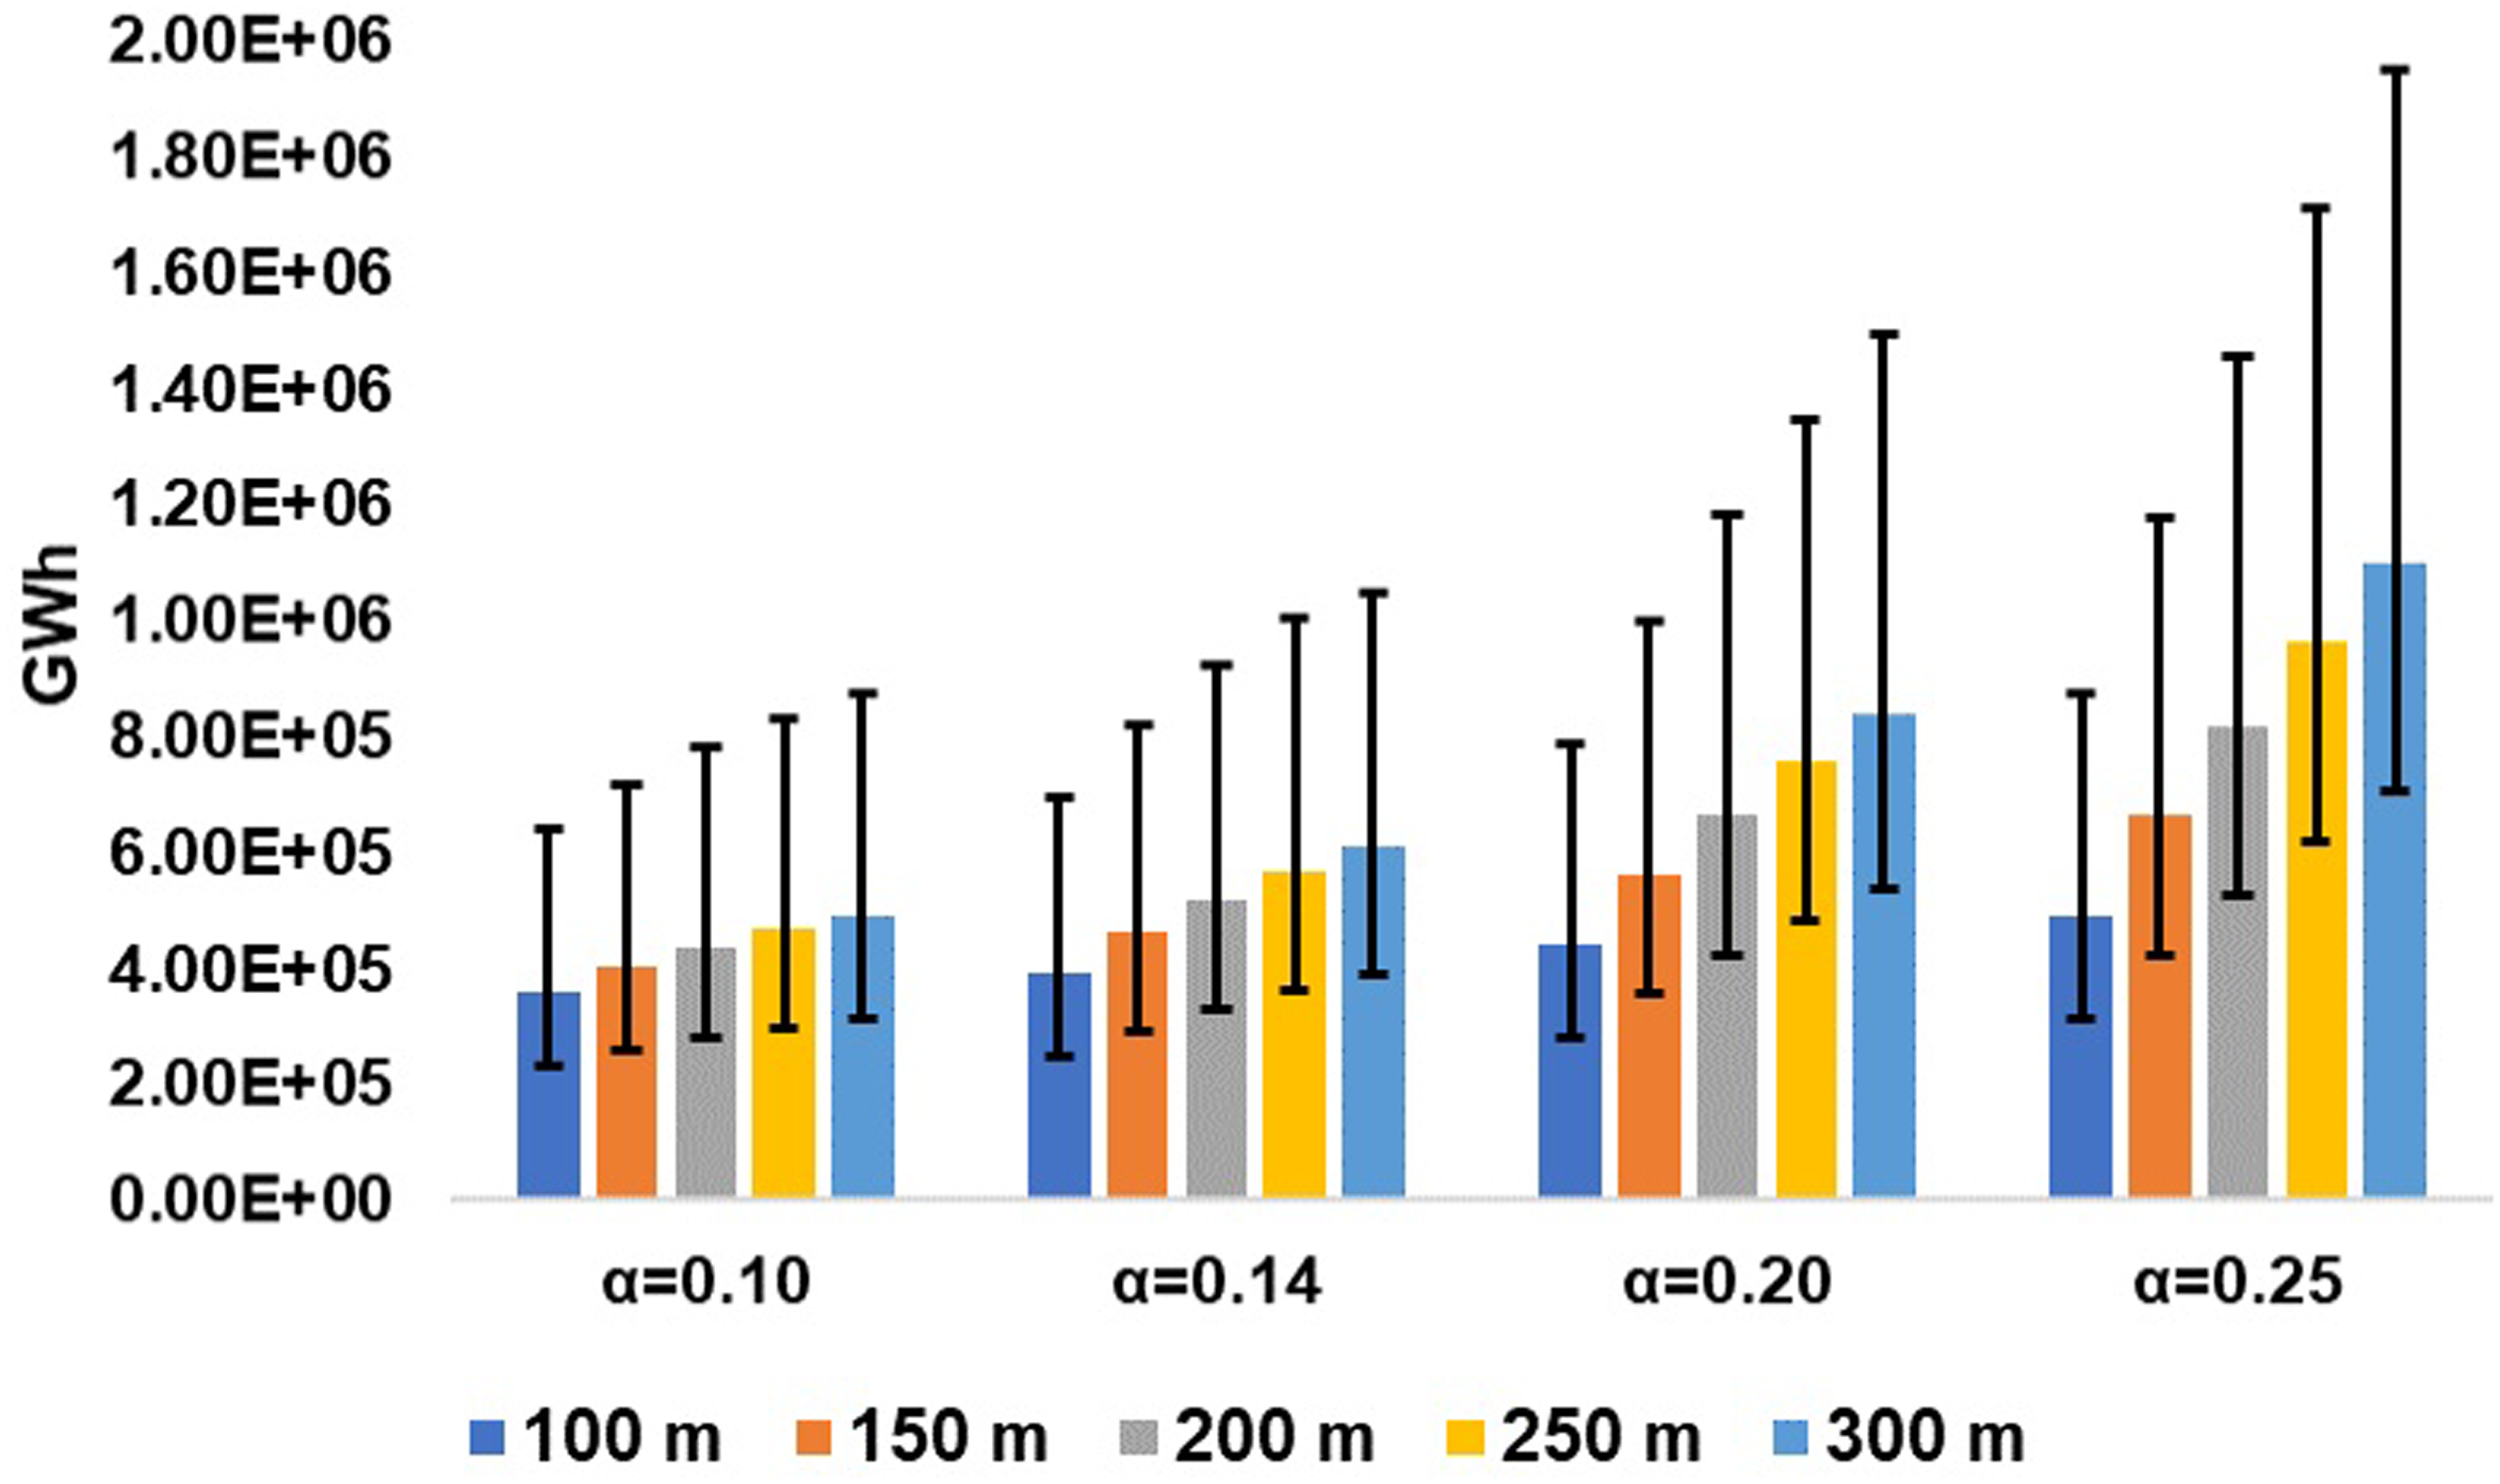
Sensitivity of mean EGP at different hub height and α values to spacing.
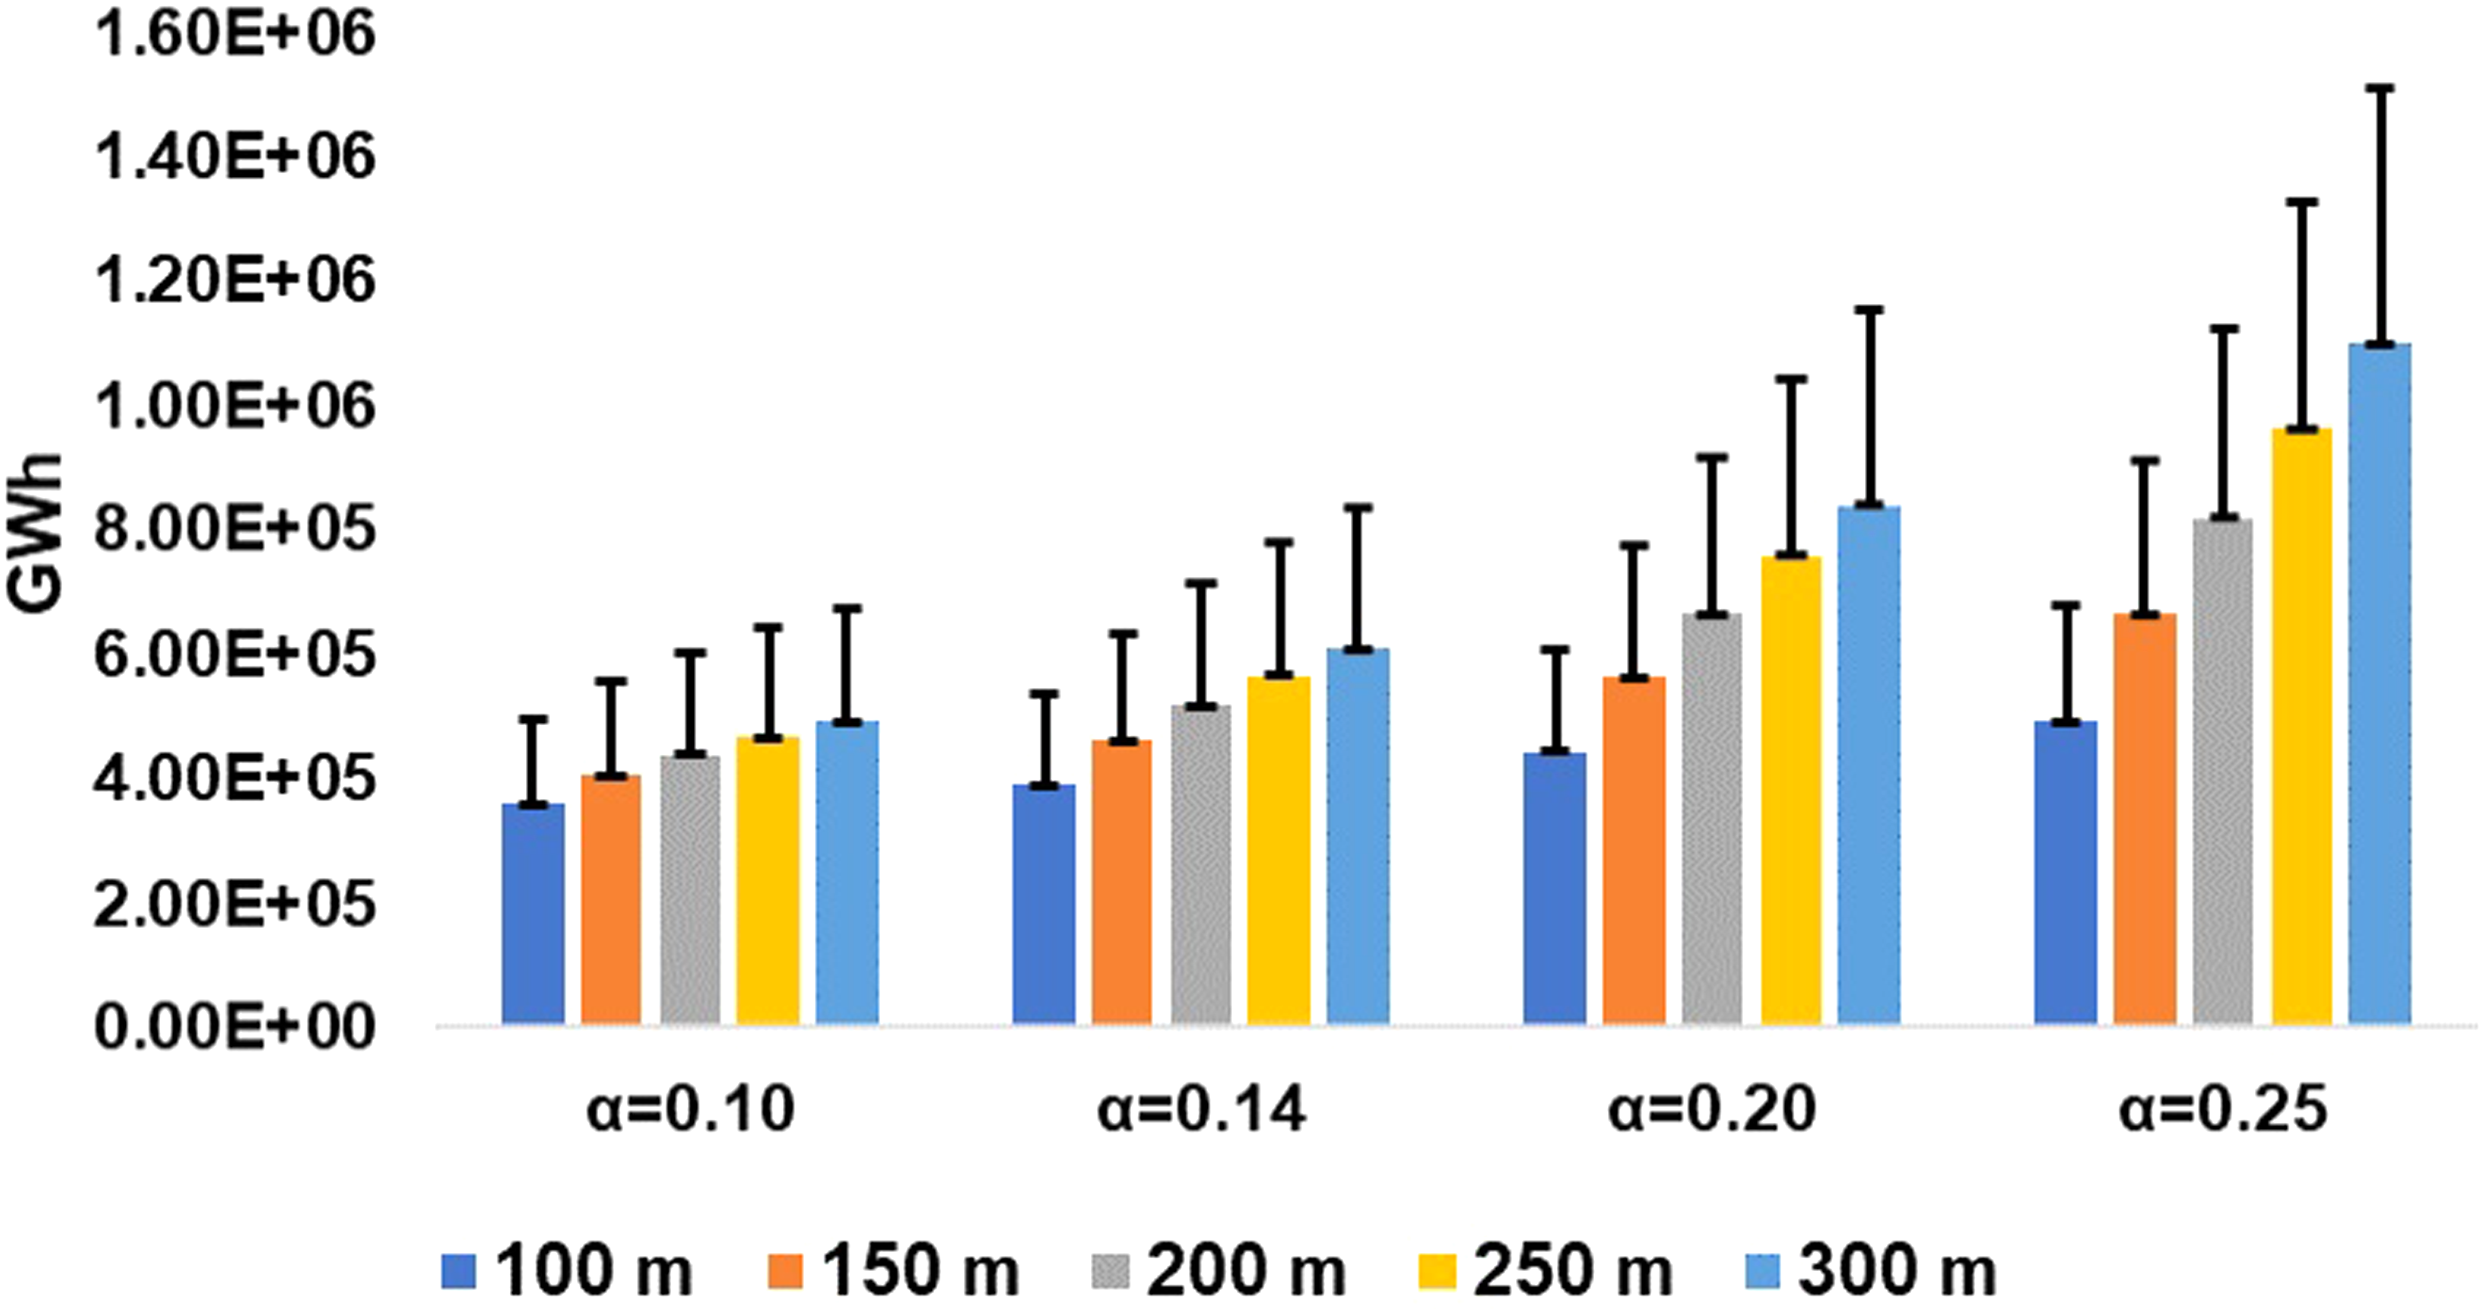
Sensitivity of mean EGP at different hub height and α values to CP.
Sensitivity of mean EGP at different hub height and α values to aging.
As a function of IWPC, EGP is also more sensitive to decreasing spacing among wind turbines as can be seen from the rise and decline range of error bars from 8D mean in Figure 6. For instance, 3.60 × 10⁵ GWh mean EGP value increases to 6.40 × 10⁵ GWh when spacing is 6D and reduces to 2.30 × 10⁵ GWh when spacing 10 D. Absolute values of rise and decline in EGP becomes larger at higher altitudes and α values due to sharper increase of wind speed. This is reflected in the broader range of error bars observed in mean EGP bars of higher hub heights and α values.
Change of CP from 0.40 to 0.55 can increase EGP up to 37.5% for all heights and shear exponent (α) values. However, if all else kept equal, contribution of CP rise at higher hub heights and α values to EGP increase will also be higher in absolute terms as can be seen in Figure 7. 3.60 × 10⁵ GWh mean EGP value increases to 4.95 × 10⁵GWh when α is 0.10 while 1.10 x10⁶ GWh mean EGP increases to 1.51 x10⁶GWh when α is 0.25. This observation emphasizes the importance of considering changes in shear exponent for accurate exploitable wind electricity generation calculations.
Figure 8 presents sensitivity of mean EGP to wind turbine aging at different hub heights and shear coefficient values. Up to 16% decline can be observed for all heights and α values over 10 years in mean EGP. However, contribution of aging to electricity generation decline will be greater at higher hub heights and α in terms of absolute values as can be seen in Figure 8. Mean EGP of 3.60 × 10⁵ GWh decreases to 3.03 × 10⁵ GWh when α is 0.10 while mean EGP of 1.10 x10⁶ GWh decreases to 9.26 x10⁵ GWh when α is 0.25. Hence, the reductions in EGP reveals the importance of appropriate timing for renewals and maintenance realized based on economical return of increased electricity generation and replacement cost
Analysis results show that EGP is most sensitive to the changes in spacing followed by CP and then aging as in IWPC. Being 2.30 x10⁵ GWh the lower and 1.95 × 10⁶ GWh the upper bound for EGP, this is determined as the exploitable onshore wind electricity potential range for Turkey. 1.09 × 10⁶ GWh is the mean of the computed range and accepted as the limit that wind power can provide to the Turkish electricity grid. And, considering that maximum level of wind electricity requirement projected for 2050 is 4.23 × 10⁵ GWh, the potential suffices the requirement.
Grid electricity environmental impacts
Table 4 presents lifecycle impacts calculated for 2020 electricity mix by multiplying impact coefficients of resources presented in Table 3 and their share in the 2020 mix, and summing them up. Of the resources contributing to 2020 electricity mix, hard coal and natural gas are imported fossil resources with high environmental impacts. Furthermore, local lignite has the highest environmental impact values except for OLDP. Hence, we analyze three situations; substitution of imported hard coal, substitution of imported natural gas and lastly substitution of local lignite till 2040 and after 2040 substitution of both lignite and some portion of hard coal by wind power. In 2040, wind power share in the electricity mix is projected to reach 21.54% that means wind can replace all lignite. With further increase in the years following 2040, wind can substitute lignite and a second fossil resource hence rest of wind capacity increase is dedicated to hard coal substitution.
Life cycle environmental impacts calculated for 2020 Turkish electricity mix.
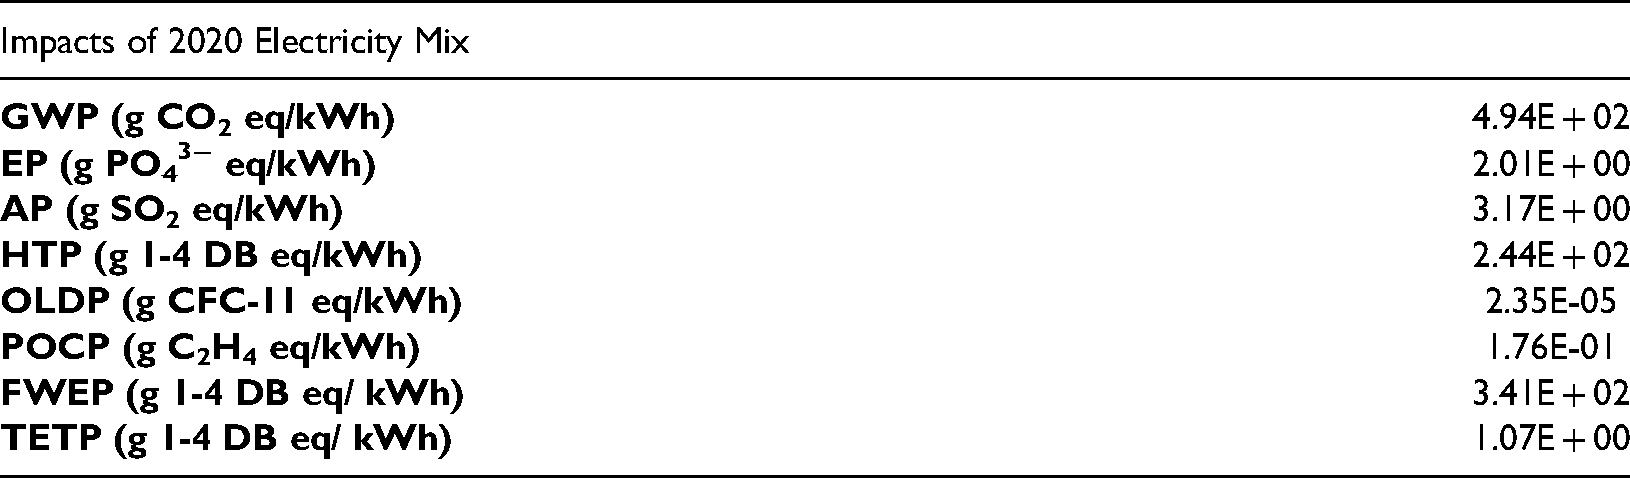
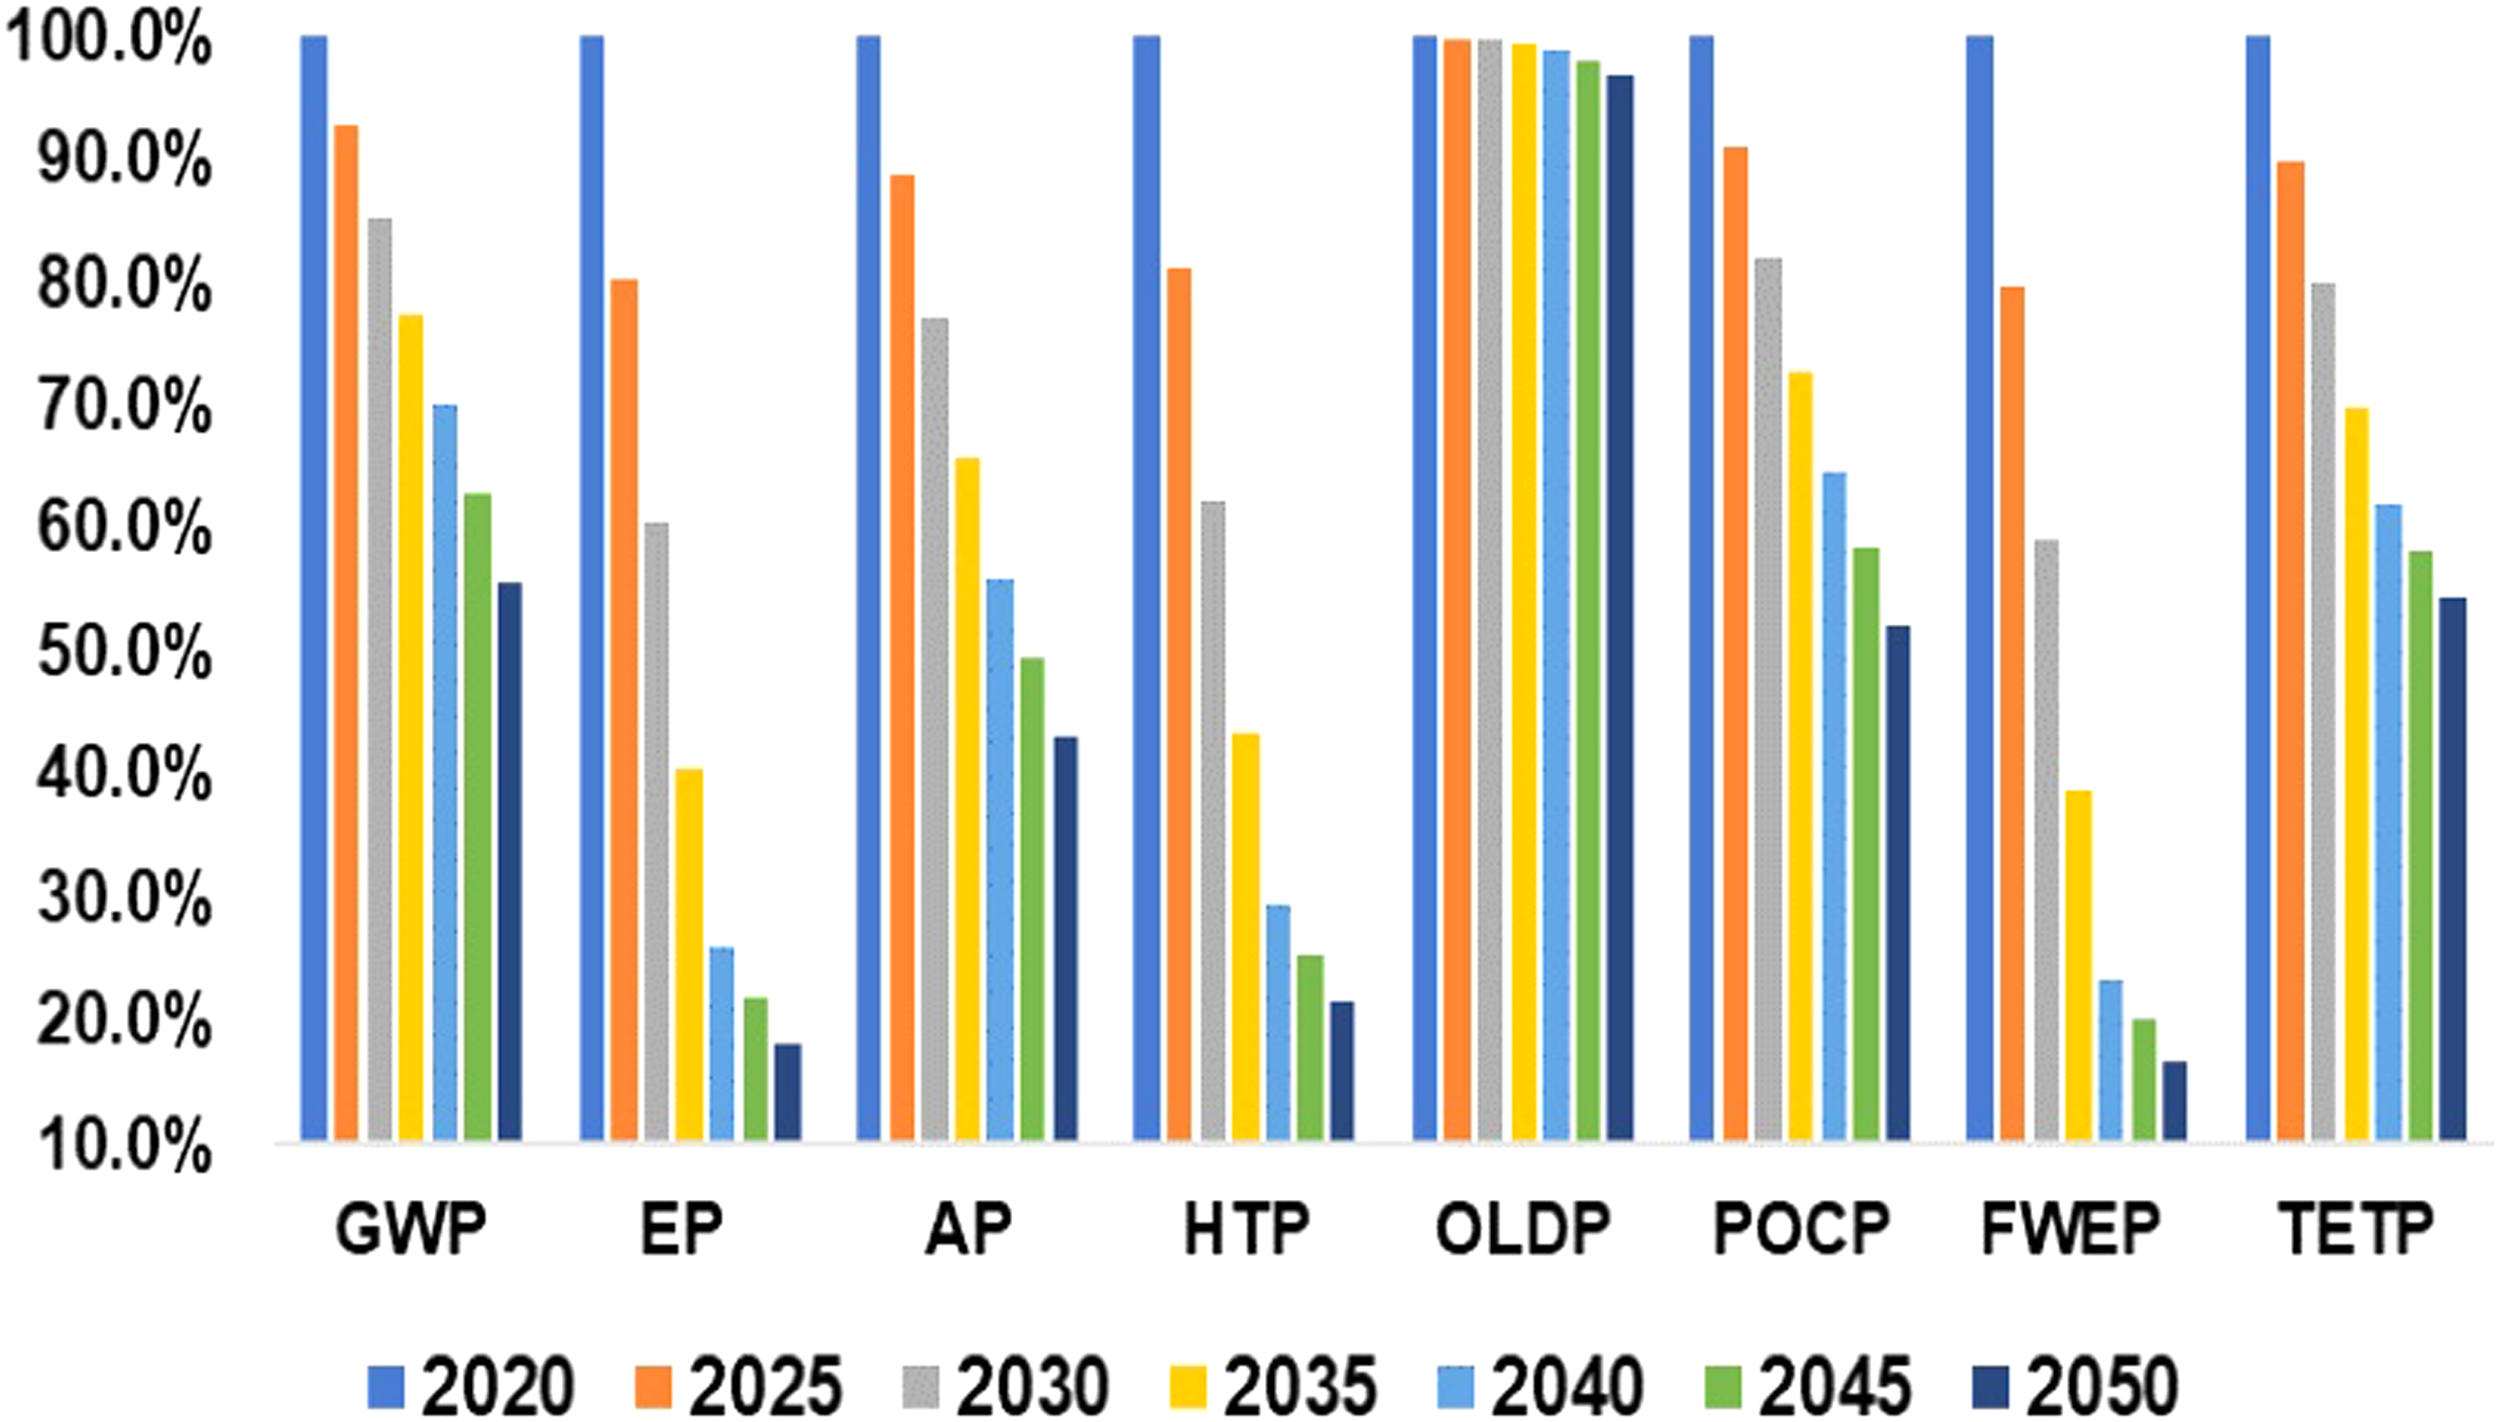
Taking 2020 mix impact levels as 100%, changes in environmental impacts resulting from substitution of hard coal are presented in Figure 9. The sole substitution of hard coal shows that a gradual reduction in all environmental impact categories is observed as wind power share increases from 8.10% in 2020 to 28.26% in 2050. While the highest percentage reduction occurs in GWP from 100% to 57.3%, the lowest percentage reduction occurs in OLDP due to close OLDP values of hard coal and wind per kWh of electricity generation. Turkey can avoid 56.3 tons of CO2 equivalent of GHG emissions by 2030 corresponding to 22.9% of the commitment she made under UNFCC through substitution of hard coal.
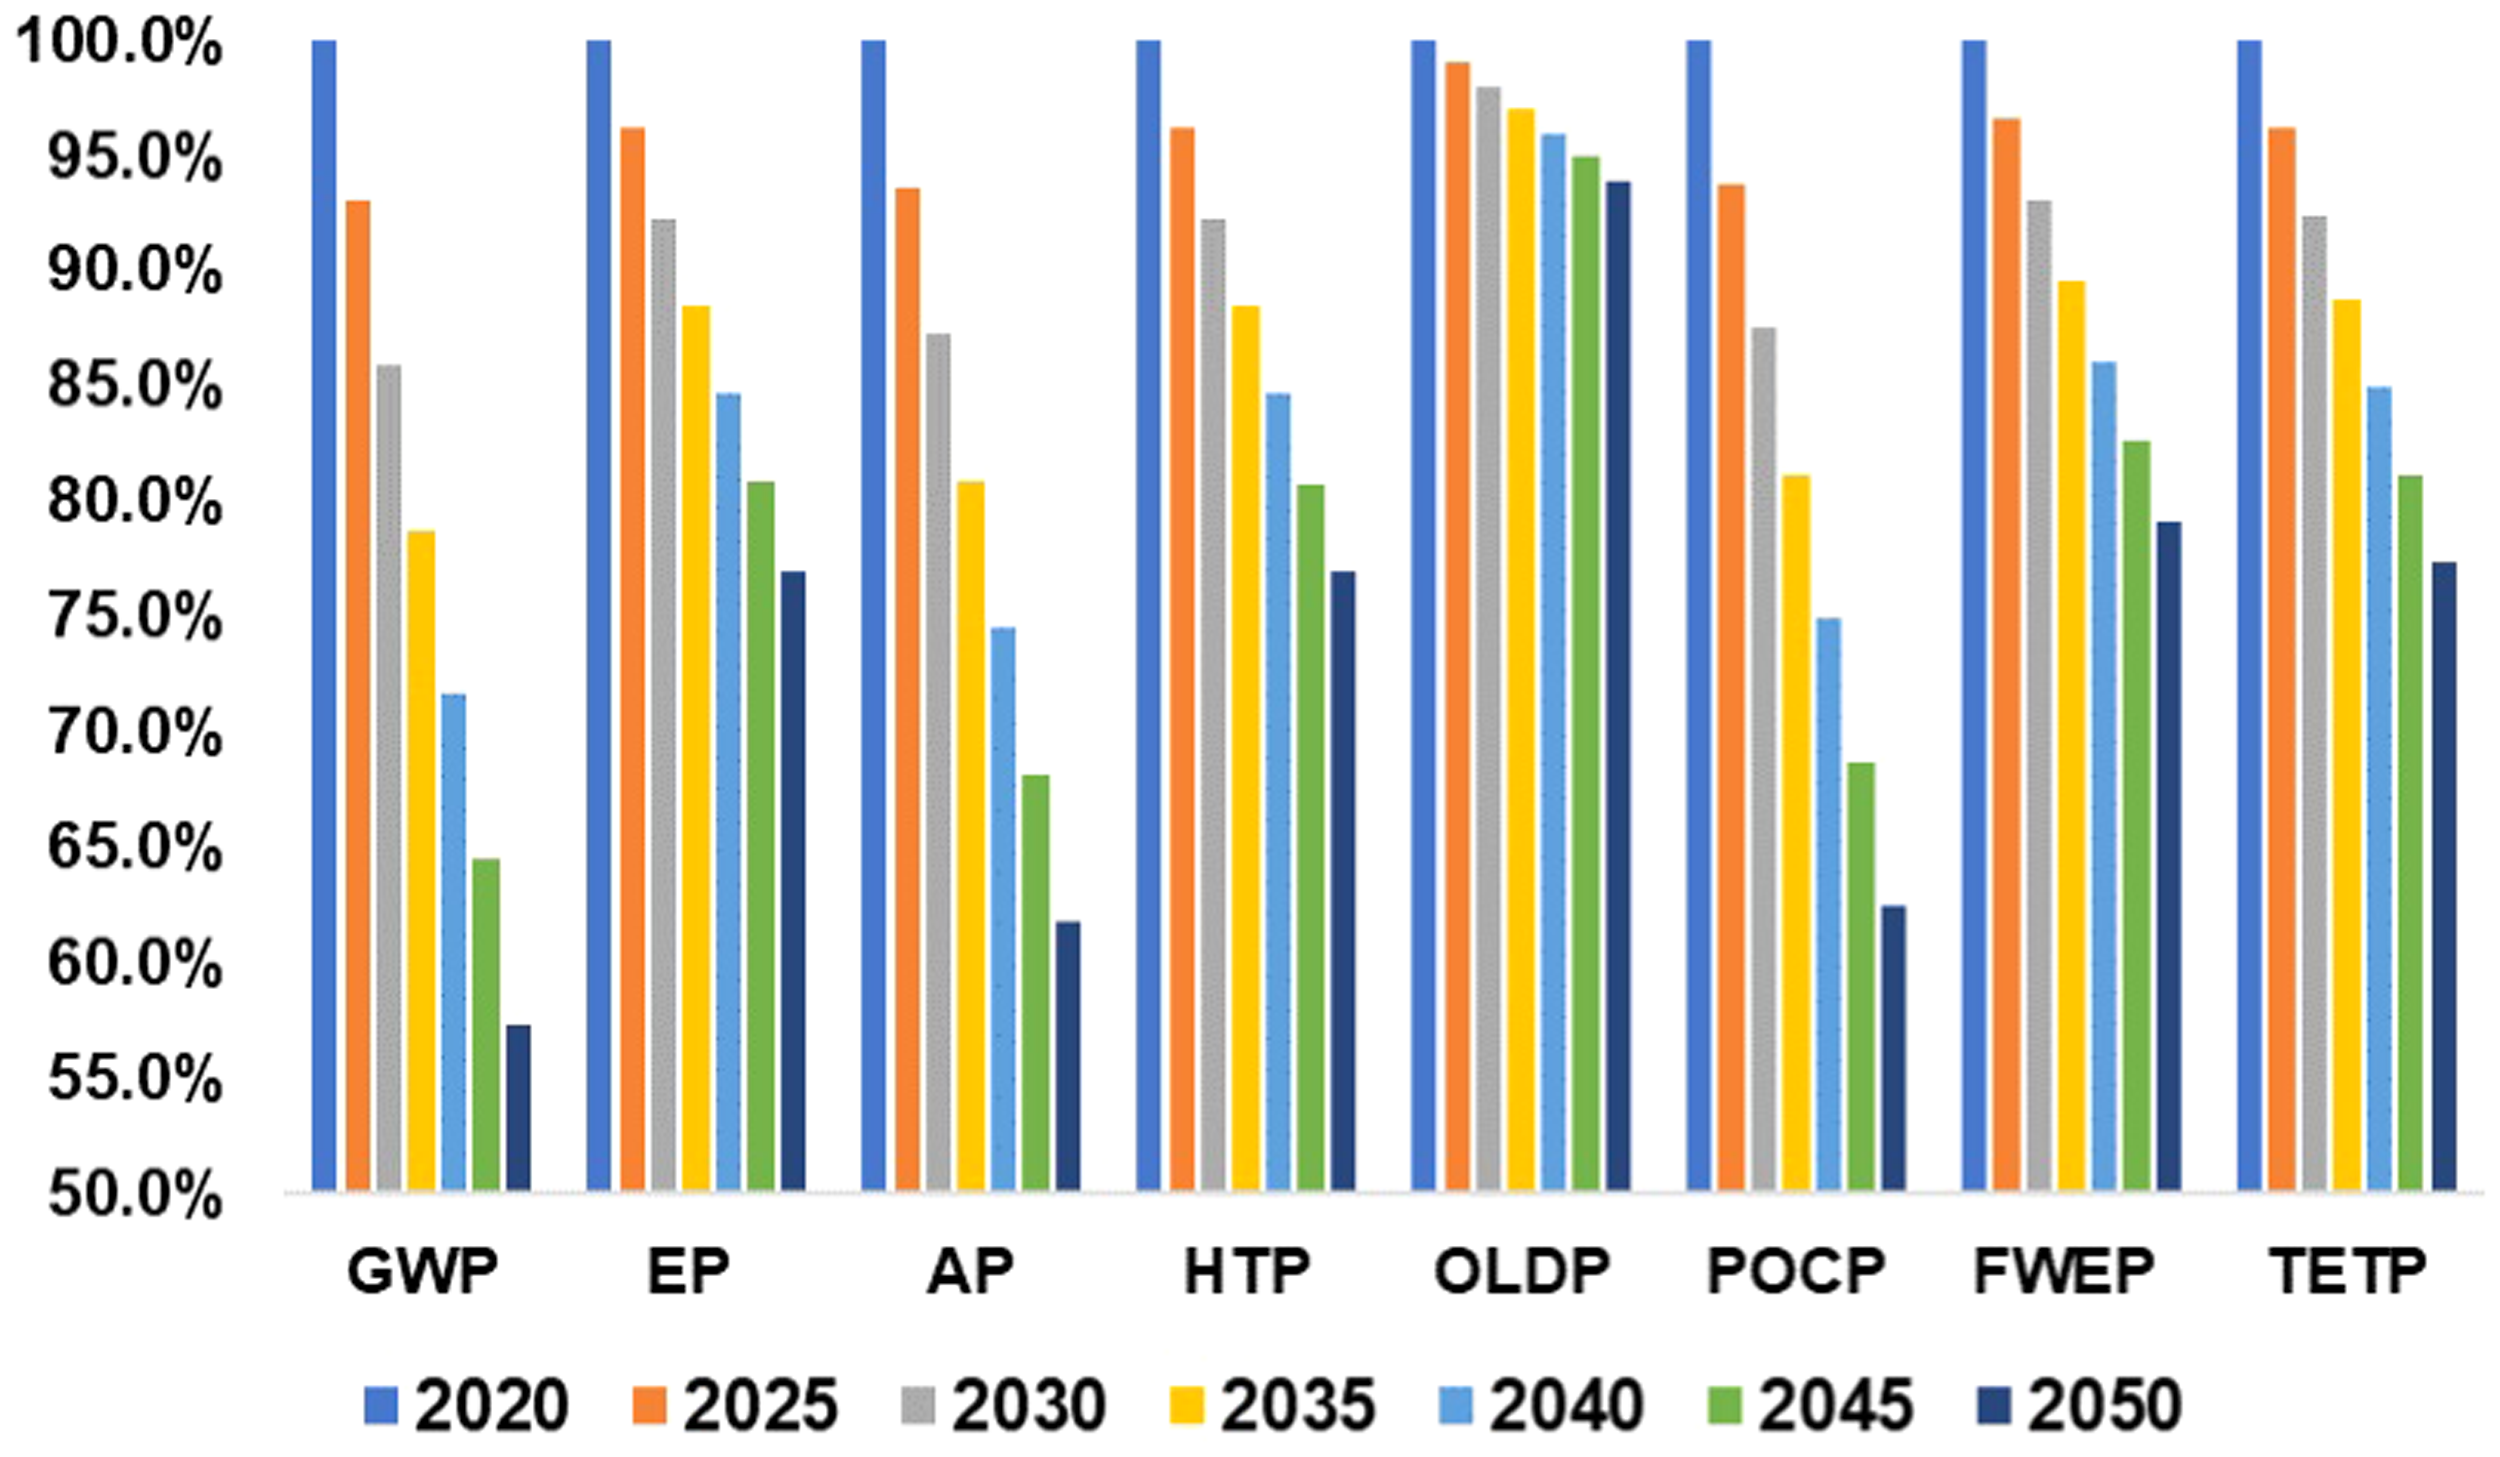
% change of Turkish electricity mix environmental impacts with substitution of had coal.
In substitution of natural gas by wind, lower reduction percentages are observed in GWP, EP, AP and POCP impacts than substitution of hard coal as can be seen in Figure 10. OLDP reduces from 100% in 2020 to 21.4% in 2050 since OLDP of natural gas per kWh electricity is 200 times higher than that of wind power creating this substantial reduction. While there is no significant change in FWEP, HTP and TETP impacts increase because of higher impact values of wind than natural gas. 26.2 tons of CO2 equivalent of GHG emission mitigation can be achieved through natural gas substitution by 2030 that forms 10.7% of the country's commitment.
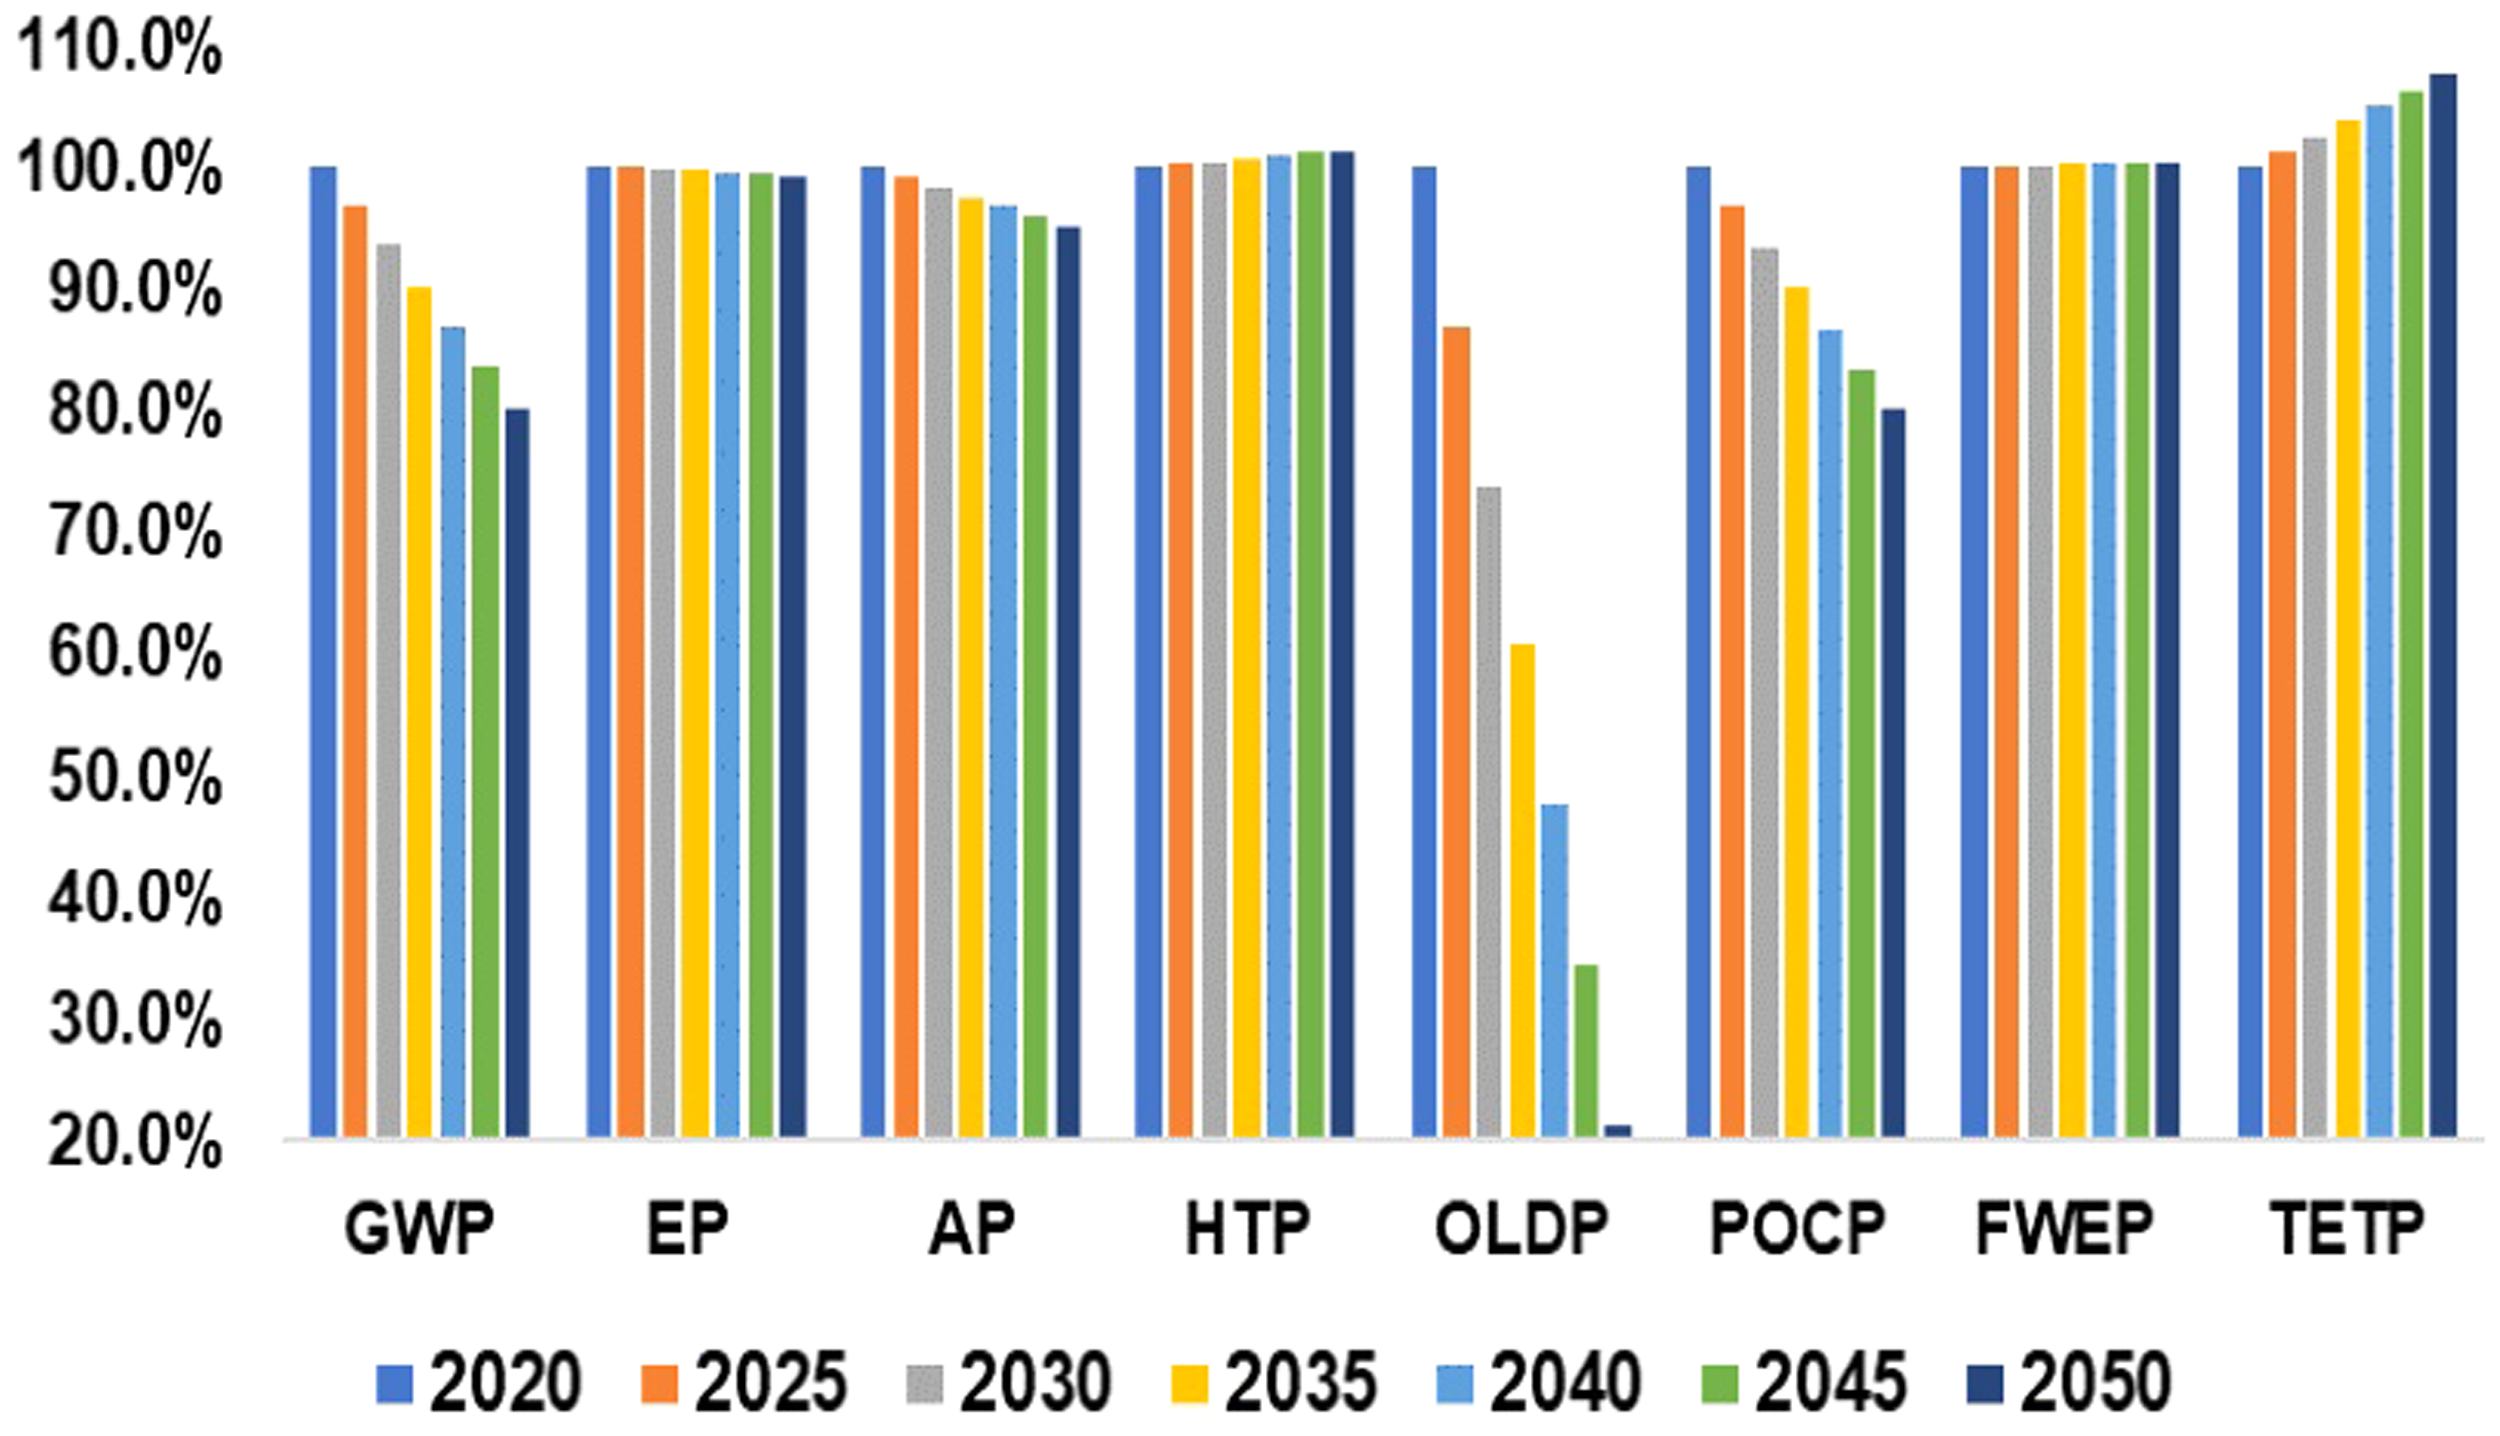
% change of Turkish electricity mix environmental impacts with substitution of natural gas.
Of the three situations analyzed, substitution of lignite first and then hard coal creates the highest percent reductions in all evaluated impact categories except for OLDP as can be seen in Figure 11. This is due to lignite being the most polluting energy resource in the electricity mix. Till 2030, only lignite substitution occurs and 59.7 tons of CO2 equivalent of GHG emissions can be avoided corresponding to 24.3% of 246 tons of CO2 mitigation commitment made by Turkey.
% change of Turkish electricity mix environmental impacts with substitution of lignite and hard coal.
All in all, our results suggest that substitution of lignite and hard coal by wind power would be the most feasible option in improving environmental performance of Turkish electricity mix. Additionally, wind power can be an important resource to meet Turkey's climate change targets.
Economic aspects
Economic benefits acquired via substitution of two imported energy resources have been analyzed and presented in Figure 12. The results reveal that economic benefit of hard coal substitution catches up with natural gas substitution as early as 2023 and surpasses thereafter. From 2021to 2050, hard coal substitution results in 10.85 billion $ currency gain whereas natural gas substitution provides 7.93 billion $ gain for the same term. Hence, hard coal substitution appears as a more advantageous option from economic point of view as in case of environmental impacts.
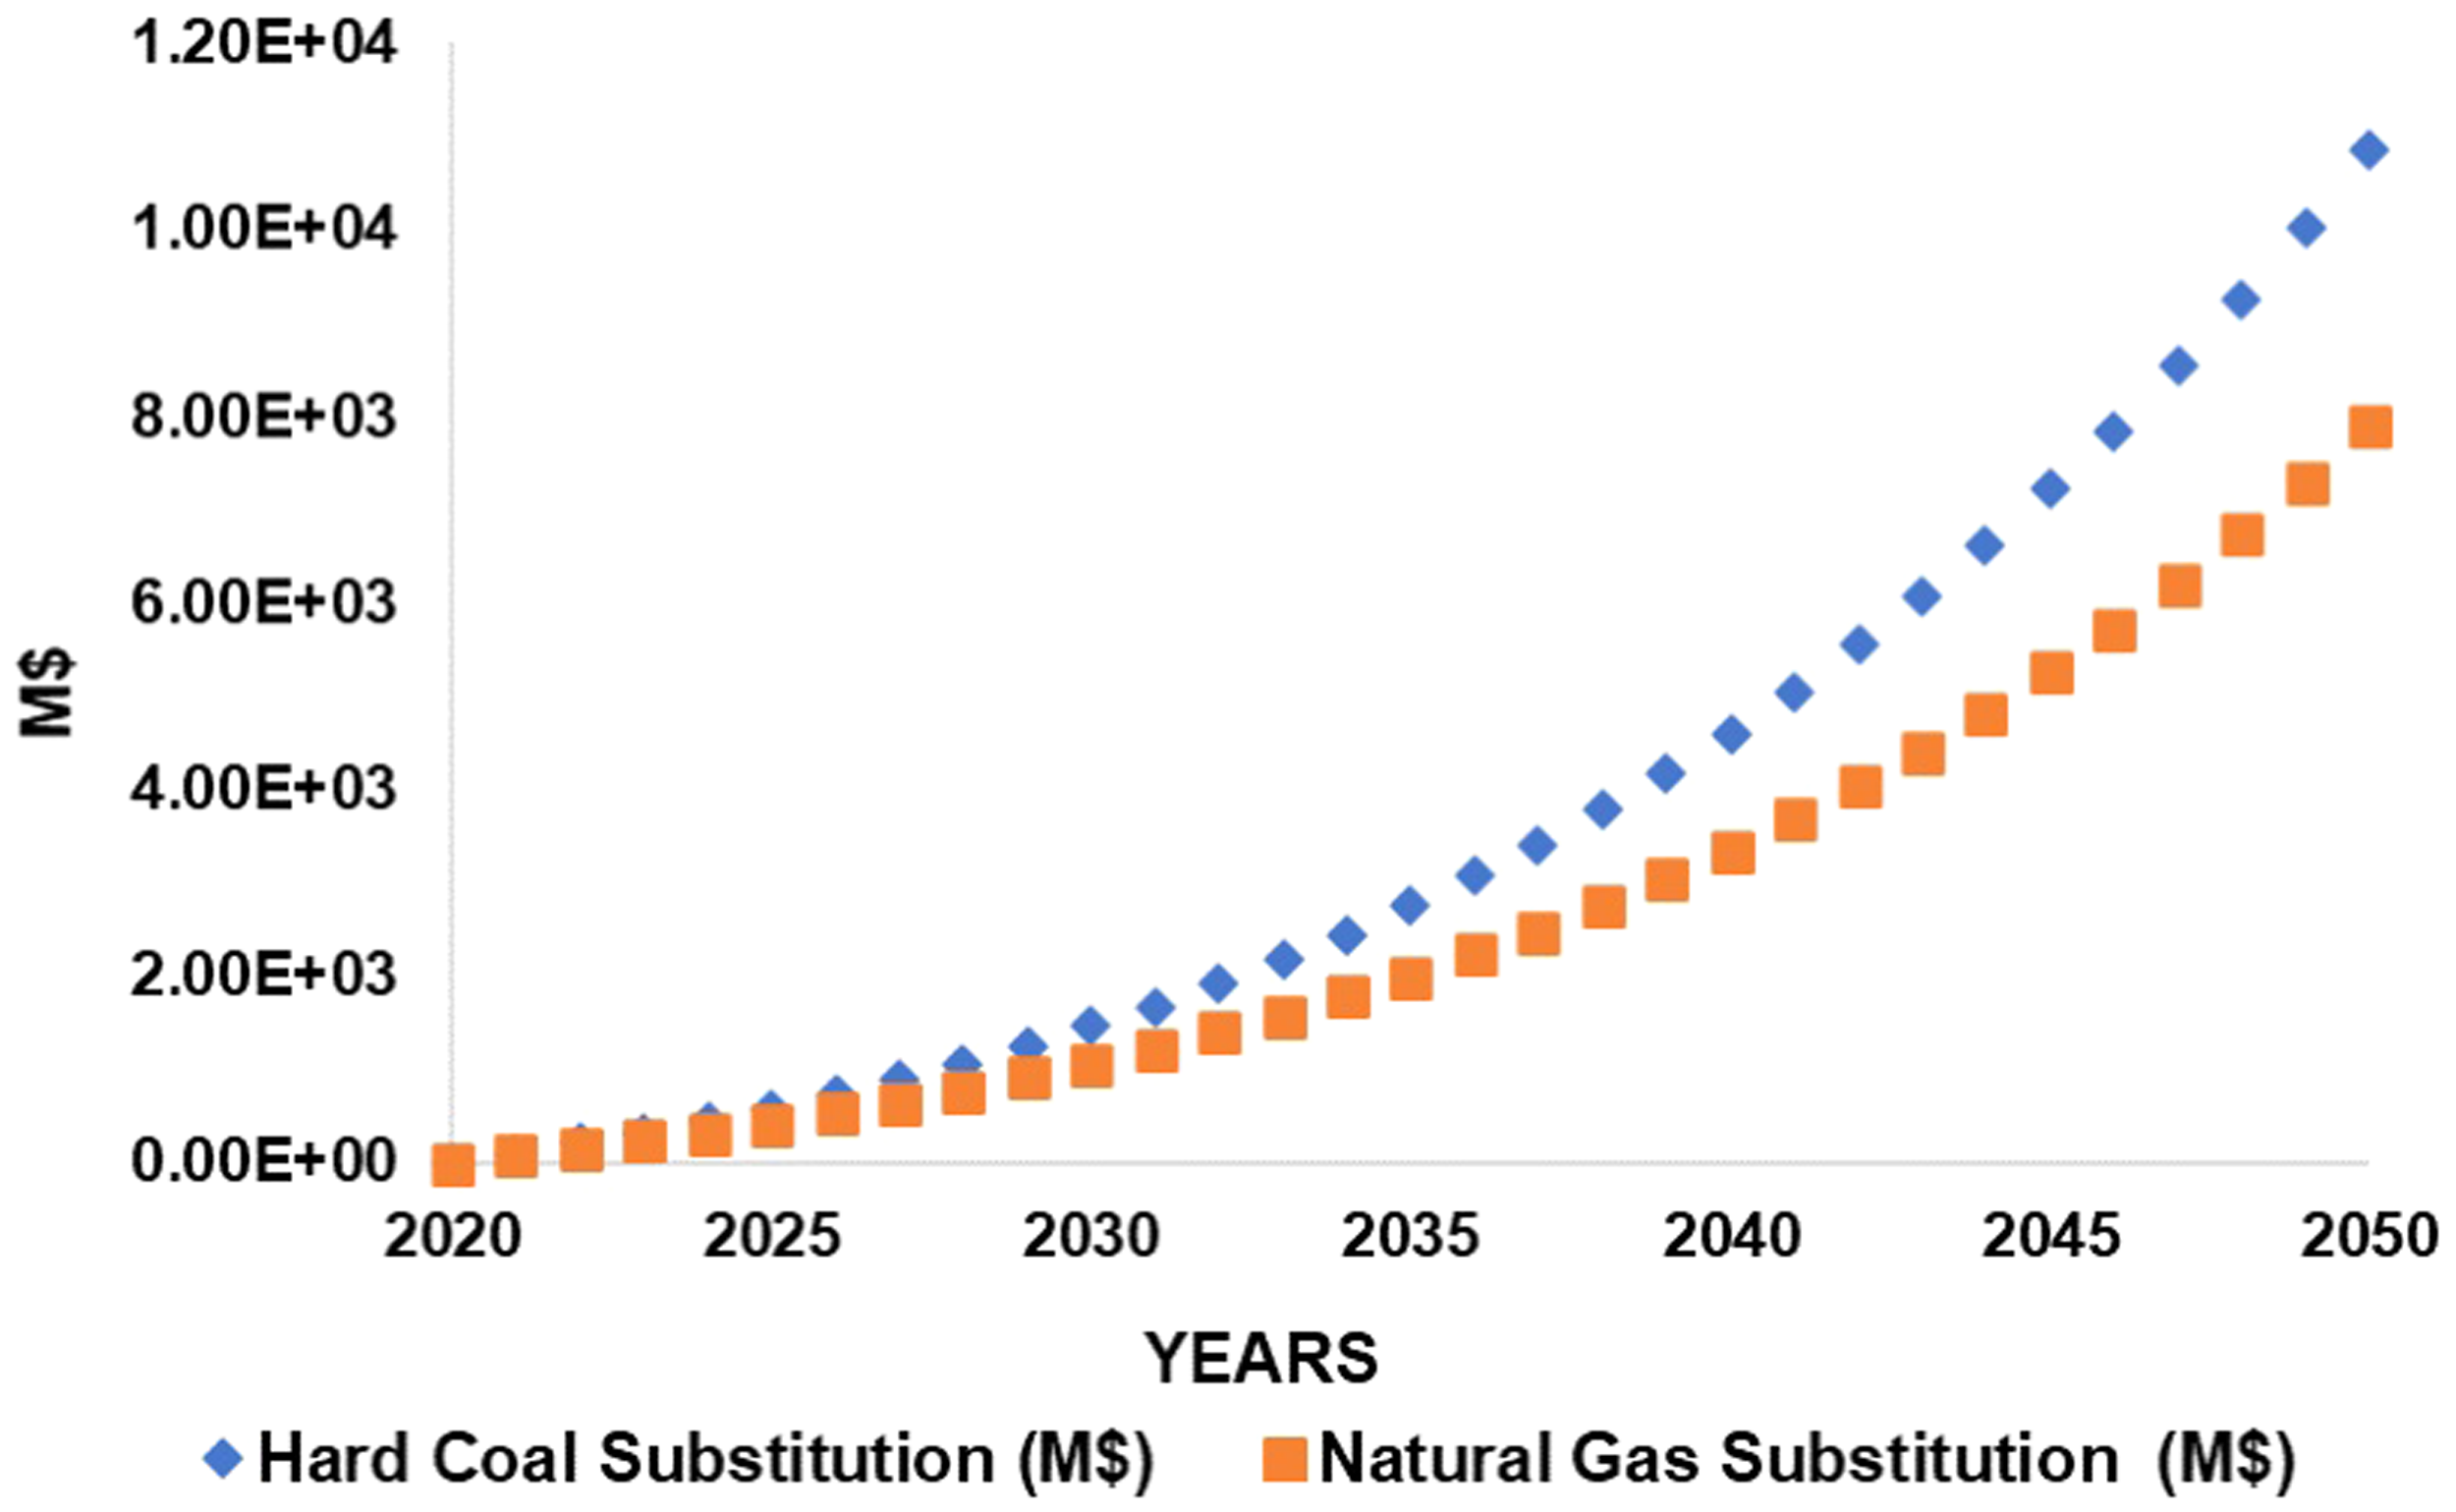
Economic analysis results of hard coal and natural gas substitution by wind energy.
Beyond the direct economic benefits due to avoided energy resource imports, local jobs that will be created in wind power sector (operation, construction, maintenance jobs and jobs that are related to recycling of wind turbine parts) can create additional economic and social benefits for the country. Additionally, carbon credit legislations to be put into practice can accelerate wider adoption of wind power and create further benefits for Turkey.
Conclusions
This work explores the rise in exploitable onshore wind power and electricity generation potentials in Turkey due to technological advancement considering sensitivity of the potentials to spacing, CF and turbine aging. Results show that 114 thousand MW wind power potential at 50 m can rise up to 418 thousand MW at 300 m. And, electricity generation can change in the range of 2.3 × 10⁵–1.95 × 10⁶ GWh. IWPC and EGP are both found to be most sensitive to the changes in spacing followed by CP and then aging. One major finding is that absolute values of changes in IWPC and EGP due to spacing, CP or aging have higher magnitudes (higher sensitivity) at higher hub heights. This is attributed to the higher wind speeds and corresponding rise in wind power potential at these elevations.
In assessing wind electricity generation outcomes, it is important to acknowledge that all the turbines operating will not have the same hub height, age, CP values and will not be subject to the same local conditions (α). Additionally, all of the available capacity may not be utilized. Hence,1.09 × 106 GWh wind electricity generation that is the mean of the computed wind electricity potential range is assessed as the limit that can be provided to the Turkish electricity grid. And, considering that maximum level of wind electricity requirement projected for 2050 is 4.23 × 10⁵ GWh, the potential suffices the requirement for substitution of fossil resources.
Of the three energy resource substitution cases, substitution of lignite and hard coal by wind power is determined to be the most feasible option in improving environmental performance of Turkish electricity mix. This phenomenon is due to lignite being the most polluting energy resource in the electricity mix. Also, this substitution provides the highest contribution to Turkey's climate change targets.
Economics wise, hard coal substitution results in 10.85 billion $ currency gain whereas natural gas substitution provides 7.93 billion $ gain from 2021to 2050. Hence, hard coal substitution appears as a more advantageous option from economic point of view. Additionally, local jobs created in wind power sector and carbon credit mechanisms to be employed can create additional economic and social benefits for the country.
Furthermore, our work can contribute the wind energy planning policies of Turkey and other countries with the multiparameter covering structure it has.
Supplemental Material
sj-docx-1-eea-10.1177_01445987221115814 - Supplemental material for Exploitable wind power potential in Turkey with technological advancement and resulting environmental-economic aspects
Supplemental material, sj-docx-1-eea-10.1177_01445987221115814 for Exploitable wind power potential in Turkey with technological advancement and resulting environmental-economic aspects by Berrin Kursun in Energy Exploration & Exploitation
Supplemental Material
sj-xlsx-2-eea-10.1177_01445987221115814 - Supplemental material for Exploitable wind power potential in Turkey with technological advancement and resulting environmental-economic aspects
Supplemental material, sj-xlsx-2-eea-10.1177_01445987221115814 for Exploitable wind power potential in Turkey with technological advancement and resulting environmental-economic aspects by Berrin Kursun in Energy Exploration & Exploitation
Footnotes
Acknowledgements
I would like to thank Prof Dr Gokcen Ciftcioglu from Marmara University for the guiding discussions on environmental impact calculations part of this study.
Declaration of conflicting interests
This research did not receive any specific grant from funding agencies in the public, commercial or not-for-profit sectors.
Funding
The author(s) received no financial support for the research, authorship, and/or publication of this article.
Supplemental material
Supplemental material for this article is available online.
References
Supplementary Material
Please find the following supplemental material available below.
For Open Access articles published under a Creative Commons License, all supplemental material carries the same license as the article it is associated with.
For non-Open Access articles published, all supplemental material carries a non-exclusive license, and permission requests for re-use of supplemental material or any part of supplemental material shall be sent directly to the copyright owner as specified in the copyright notice associated with the article.