
Abstract
This research targets to present a case study on the annual comparative assessment of photovoltaic thermal collectors (PV/T) by using water and Ag/water nanofluid for five different cities in Pakistan. The assessment is conducted at monthly, daily, and hourly resolutions. PV/T collector is imitated through a set of energy balance based physical models which are solved numerically for two working fluids (i.e. water and Ag/water nanofluid) in a yearly simulation format (with hourly, daily, and monthly predictions) for five major cities of Pakistan (Taxila, Peshawar, Multan, Lahore, and Karachi). Detailed comparative assessment is carried out based on the performance indicators such as electrical efficiency, thermal efficiency, heat gain, and net electricity power generation. In the results section, hourly, daily, and monthly patterns of performance indicators using water and Ag/water nanofluid are reported, followed by a comparative study between the different cities having different climatic conditions. The sensitivity of nanofluid's mass flow rate and its particle concentration on the performance indicators is also reported, and the analysis of the sensitivity of the nanofluid characteristics on the pumping and the net useful power is also presented. Assessment has indicated that the overall efficiency for Taxila, Peshawar, Multan, Lahore, and Karachi cities are similar and around 66% despite having different latitude and longitudinal locations. While using silver nanofluid as a working fluid, compared to the usage of pure water as a working fluid, overall lesser efficiency is seen at around 63.80%, for selected cities.
Introduction
The energy mix of Pakistan is heavily backed up by fossil fuels corresponding to a share of 63% and the renewable resourced solar energy has a penetration of less than 1% (Tahir and Asim, 2018). High life-cycle cost, low solar radiation to the electricity conversion efficiency which is normally between 20–25% (Fayaz et al., 2019), and high land-use-to-electricity generation ratio are unfavourable points for their mass installation in this region. Moreover, the climatic dependency of solar cells also portrays negativity because, for example, the solar cell efficiency decreases by 0.45% with a 1°C with the rise of solar cell temperature (Su et al., 2017b).
One option for its thermal management is the usage of a working fluid in the assembly of solar panels (Daniela-Abigail et al., 2021) which would yield multi-functionality of such a hybrid structure i.e., a combined solar panel and a solar thermal collector. (Kim et al., 2014) proposed a configuration by using air as a working fluid below the solar cells and reported that the thermal and electrical energy was increased by 22%, and 15%, respectively, and as a result of this cogeneration, the hot air was used for space heating or other applications as demonstrated by (Tariq et al., 2018).
A photovoltaic/thermal (PV/T) module was investigated with a honeycomb heat exchanger using air as working fluid, it was found that the system thermal efficiency increased to 87% with honeycomb and 27% without honeycomb at a mass flow rate of 0.11kg/s, the electrical efficiency of PV improved by 0.1% (Hussain et al., 2015).
Experimental studies were conducted to investigate a comparative performance of PV and PV/T collectors with the usage of different working fluids such as water, ethylene glycol (EG), and mixtures of water and EG with different ratios, the results have shown that the overall efficiency of a PV/T collector is higher than using EG which is about 25% (Joy et al., 2016) as compared to water as a base fluid.
The performance of a photovoltaic/thermal collector was studied on both experimental and numerical by using solar radiation intensity of 385 W/m2 and 820 W/m2 and at mass flow rates of 0.007kg/s and 0.07kg/s to discuss and investigate exergy (Fudholi et al., 2018).
Other thermal management options could be the usage of turbomachinery-free alternatives provided by the implementation of a phase-changing material (PCM) which was demonstrated in a theoretical study to improve the overall performance of a PV/T collector by investigating the PCMs layer thickness and its melting point. It was found that the highest overall efficiency of a PV/T collector was achieved at a 40°C melting point corresponding to a thickness of 3.4cm, and it was also found that electrical efficiency was increased by 13.6% at a PCM's fusion temperature of 30°C (Su et al., 2017b). The influence of the position of PCM on the photovoltaic thermal collector was also investigated in the literature and it was shown that the overall performance of a PV/T collector increased to 10.7% with upper position mode PCM as compared to a PV/T collector without phase change mode PCM. It noted that using upper phase change mode with a thickness of 3cm has high thermal and electrical performances (Su et al., 2017a) as compared to the other option. Using energy equations to enhance the performance of photovoltaic thermal collectors using water as base fluid, it was found that low inlet temperature of the water, high mass flow rate, and fewer series of PV modules can increase the electrical performance of the system (Shan et al., 2013).
Based on the numerical methods, a thermal model was constructed to investigate the thermal performance of the PV/T collector, in the setup, the absorber with the best quality of galvanized iron was used; it was found that the thermal efficiency of the PV/T collector was 54.51% using a water heat exchanger, 16.24% using an air heat exchanger and electrical efficiency was increased by 11.12% (Ben Youssef et al., 2018).
Similarly, a numerical study was carried out on PV and glazed PV/T collectors at a mass flow rate of 0.015kg/s for Ghardaia city, it was found that electrical efficiency was 7% and 6.25% for PV and glazed PV/T collector systems, respectively and it was also found that overall efficiency was 18.34% and 74.2%, respectively for PV and PV/T (Kazemian et al., 2018).
Focusing on regional studies, an experimental study was evaluated to investigate the effects of the base fluid and glass cover on the performance of PV/T collector for climate conditions in Iranian city of Mashhad, it was found that the system has high overall efficiency using water/EG (50%) mixture than pure EG, it was also found that electrical efficiency of unglazed cover is higher than glazed PV/T collector (Kazemian et al., 2018). For the enhancement of overall performance of PV/T collector numerical study was investigated using air as working fluid with
The researchers and scientists have investigated the effects of packing factor, solar radiation intensity, the diameter of the pipe, collector length, and Reynold number on the performance of the photovoltaic thermal system, it is found that energy efficiency is higher using glazed cover than the unglazed system, the exergy efficiency depend upon packing factor, Reynold number and collector length and it was also found that overall energy performance is higher in turbulent flow but overall exergy performance is higher in the laminar flow (Yazdanifard et al., 2016).
For the climate condition of Turkey, the photovoltaic thermal collector was constructed to evaluate the effects of MWCNT (multi-wall carbon nanotube). Nano platelets-water and distilled water on the performance of photovoltaic thermal collector, it was found that the overall energy performance of PV 53.4%, 57.4%, and 63.1% for distilled water, MWCNT-water, and graphene-water, the exergy efficiency for PV/T collector 11.2%, 12.1%, and 20.6% respectively (Alous et al., 2019). The mathematical model was constructed for a U type evacuated tube PV/T system using different working fluids such as air, water, lithium chloride solution, and other parameters of PV/T collector, it was found that collector length, working fluid flow rate and solar radiation intensity have a high impact on PV/T collector but inlet temperature has no significant impact on PV/T collector (Naik et al., 2016).
Another numerical and experimental study was conducted using metal-oxides/water to investigate the performance of the PV/T system, metal-oxides/water nanofluids have been used such as
Five different cooling methods and PV/TEM (thermoelectric system) were used to investigate the performance of the system, the result of this experimental study shows that using
A numerical study was conducted using pure water and
Similarly, another experimental study was conducted by using nano-ferrofluid as base fluid, it was found that using distilled water and
According to the literature review presented above, it is noted that different working fluids have been used for the enhancement of photovoltaic thermal collector modules such as air, water, engine oil, and nanofluids subjected to different climatic zones around the world. The regional variations, in different zones, significantly impact the performance of the working fluids and PV panels. The localization of the problem, especially the feasibility of PV/TEM and working fluid selection, requires a more extensive approach with reliable thermos-physical modelling in order to have a robust evaluation framework.
This work is specially dedicated to the development of a case study, as a deterministic model, on the thermal and energetic benefits of the usage of photovoltaic thermal collectors in Pakistan. This enables an extensive model validation that can be used for temporal as well as life-cycle-based assessment for such systems. Moreover, this validated model can be extended to other similar regions with enhanced learning/adaptive techniques in order to become a complete digital twin (Tariq et al., 2022a; Tariq et al., 2022b).
For this purpose, actual climatic data of five different Pakistani cities including Taxila, Peshawar, Multan, Lahore, and Karachi are used to run the assessment in monthly, daily, and hourly resolutions. The selection of various cities/locations provides a differential comparison to draw a broader conclusion with respect to localization and generality. The results of the case study are also compared with the same thermal machine with the usage of a nanofluid for enhanced performance.
The general objective is to provide the energetic benefits of this renewable energy-driven thermal machine for these big cities of Pakistan. The mass implementation of this device can bring huge benefits to the under-developed electricity system of Pakistan and thus, the case study of some of the biggest cities in this region can demonstrate the benefits. Karachi has an estimated population of 16.459 million and combined, these five cities have around 33.981 million inhabitants. Thus, the macro projection (Tariq et al., 2021b) of this case study can bring useful energy benefits, and consequently, it would participate in the social welfare of these inhabitants.
For this purpose, the photovoltaic thermal collector proposed by (Shan et al., 2013) is simulated, real climate data of these five cities are used, and an extensive comparison is described between the benefits of using the water or nanofluid as a working fluid. The usage of nanofluid eventually brings its own physical characteristics such as the influence of the particle volume fraction and its flow rate, thus, these findings are also analysed in this article.
Eventually, the addition of the nano-sized particles also alters the density and viscosity of the hybrid fluid, thus, it would also eventually change the pumping characteristics of the PV/T assembly. This additional pumping work is eventually a parasitic load on the total electricity generation by the solar panel, thus, this analysis is also conducted for the said regions.
In summary, the work is an extensive case study of the different aspects for the consideration purposes in the usage of nanofluids in PV/T assembly subjected to five different Pakistani cities.
Methodology of research
In this section, details related to the system description, physical model along with its assumptions, performance indicators, simulation procedure, and validation study are reported. Figure 1(b) details the overall flow of various sections of the article which involves the description of the literature gap, validation procedures, weather data collection, findings, and conclusions. The system description is reported in section 2.1. The physical model, nanofluid characteristics, performance indicators, and numerical setup are reported in sections 2.2, 2.3, 2.4, and 2.5, respectively. The validation of the mathematical model is placed in Appendix A.
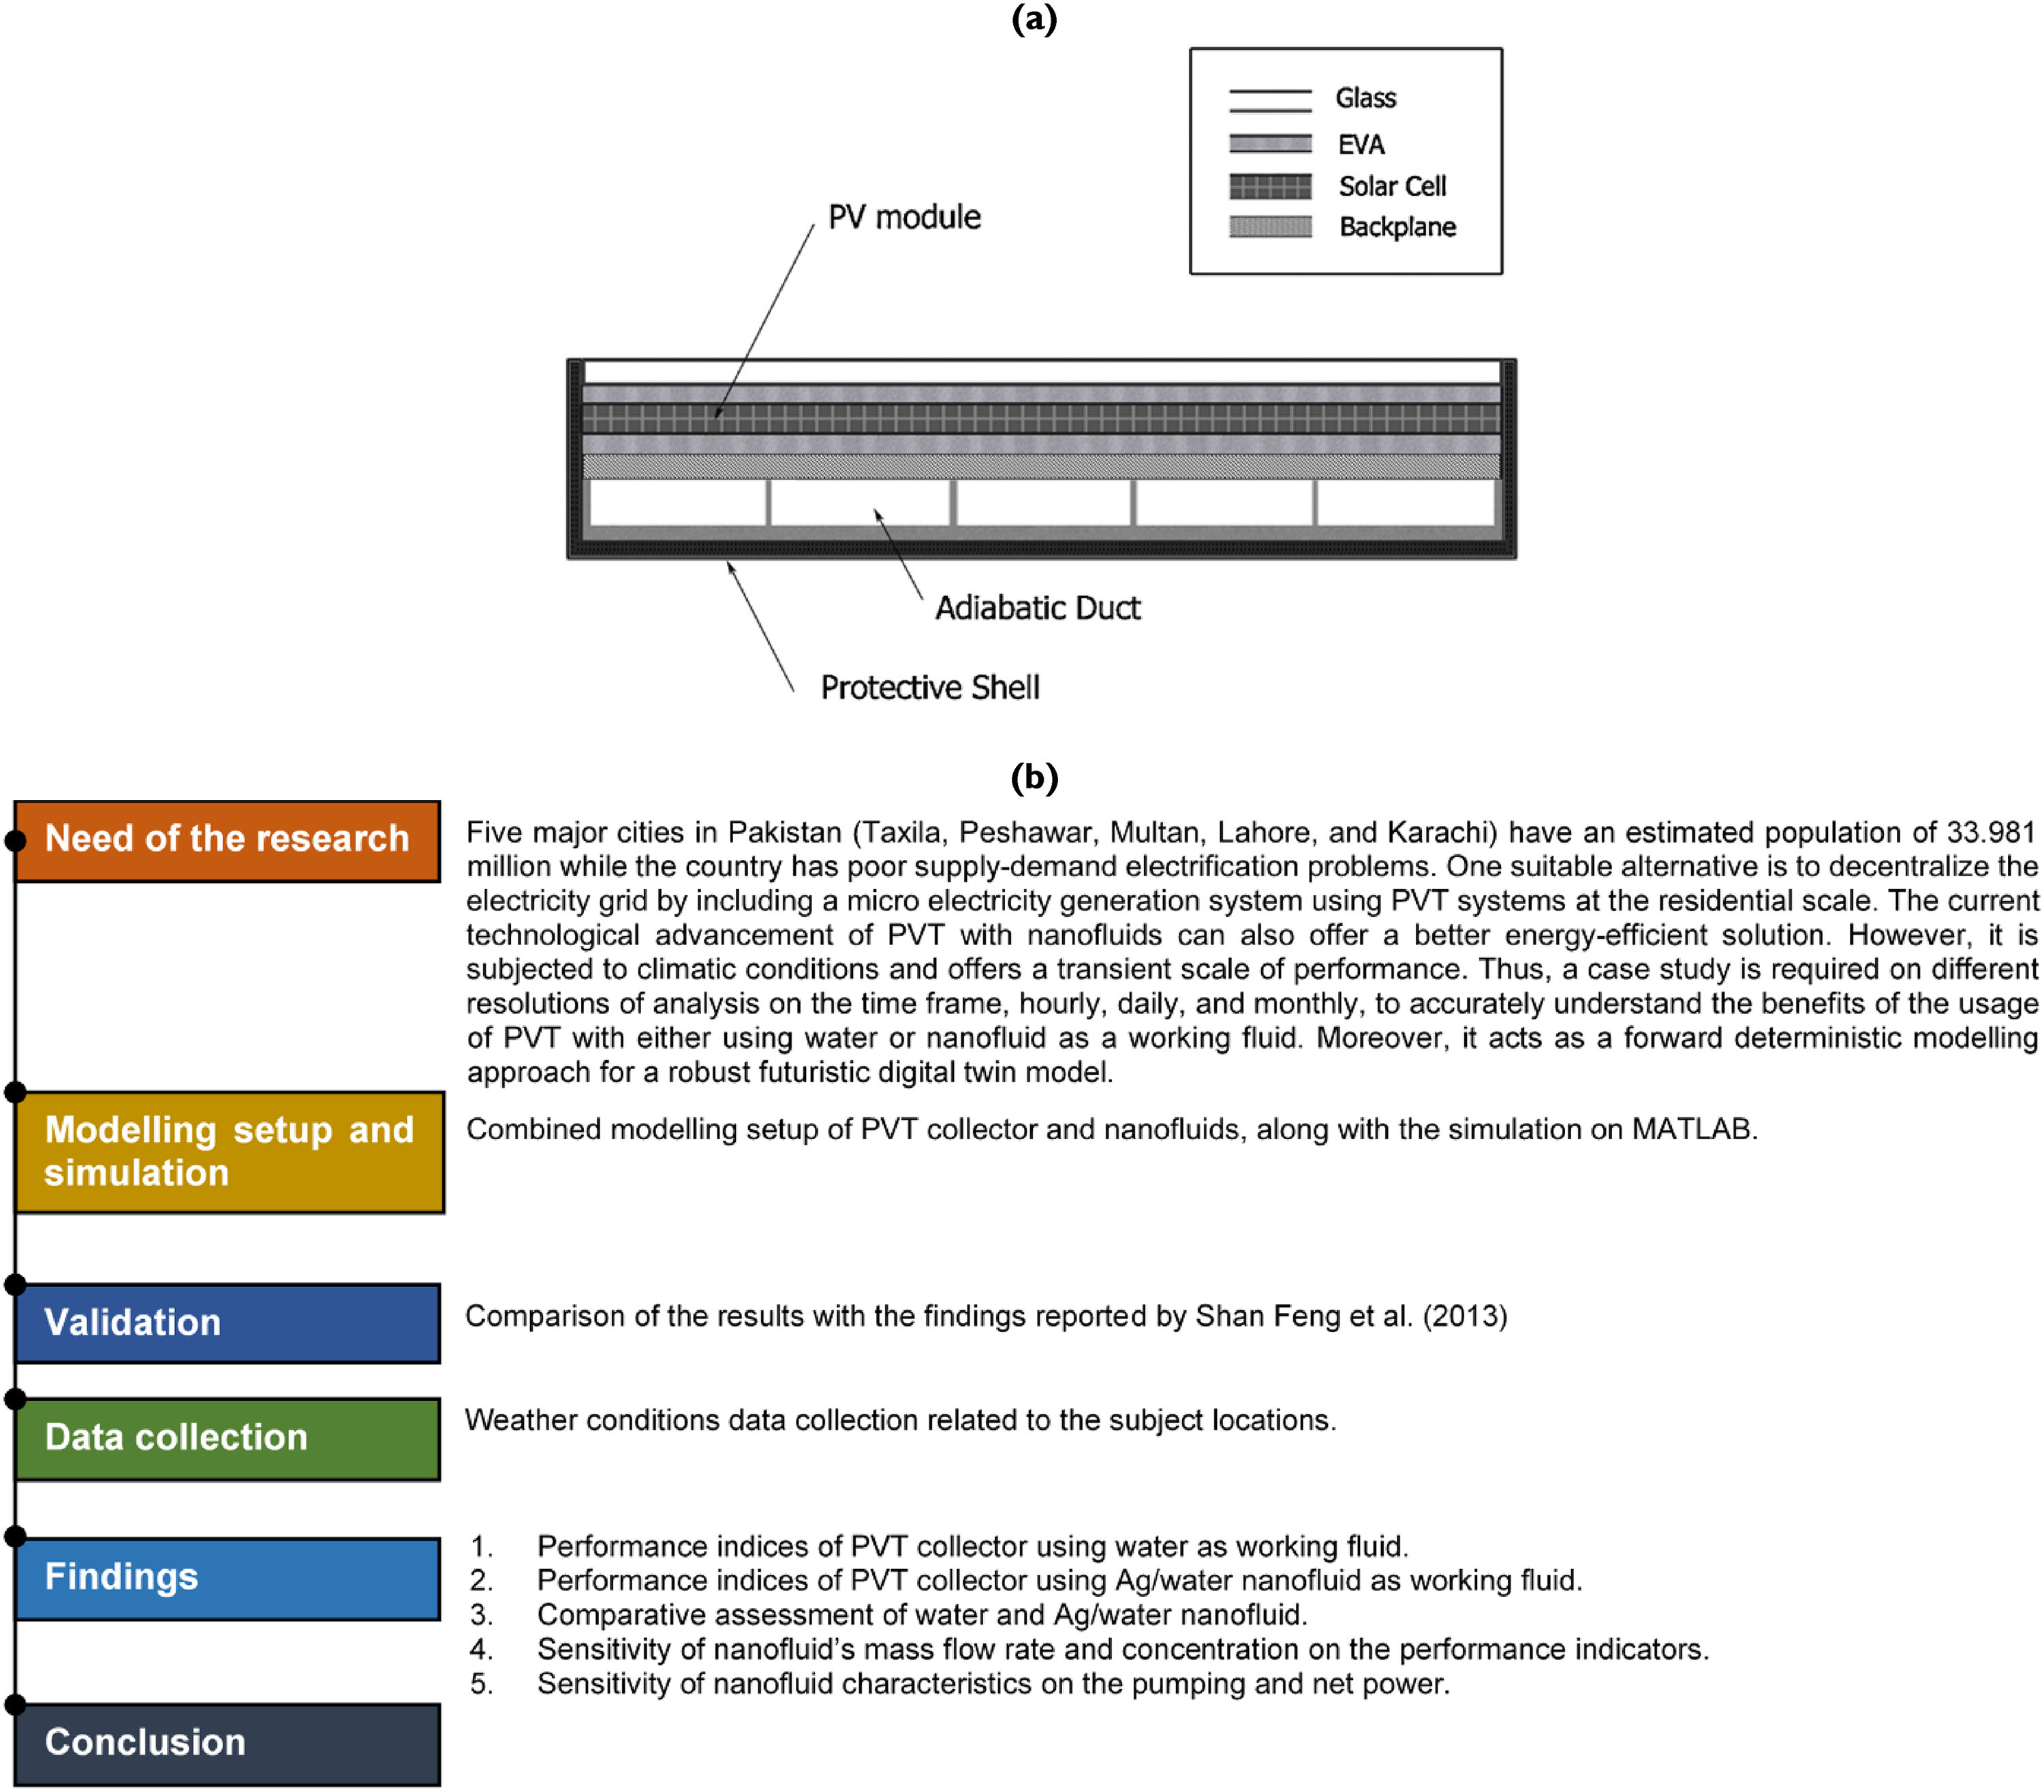
(a) Schematic of a photovoltaic-thermal collector of (Shan et al., 2013) (reused with Elsevier permission under license number 5245920382760). (b) Overall schematic diagram highlighting various stages of this research. Note: The reference cited in this figure is (Shan et al., 2013).
System description
Photovoltaic/thermal collector module (see Figure 1(a)) consists of the glass cover, first and second EVA, solar cell, backplane material and a duct with rectangular cross-sectional (attached below the solar cell), three sides of a physical module are adiabatic but one side next to the back surface of solar cell has a good thermal conductivity which is attached to the solar cell. EVA stands for ethylene-vinyl acetate, a thermoplastic polymer having high radiation transmission and low sunshine degradability. It's employed as an encapsulating agent in solar panels because it produces a sealing and insulating coating around the solar cells when heated. The duct consists of several narrow channels in the flow direction to keep a uniform flow pattern. The glass and backplane material are glued by ethylene-vinyl acetate to the solar cell. The entire assembly is placed in a protective shell.
Physical model of photovoltaic thermal collector
The physical model is solved in steady-state conditions in which the thermal inertial effects are ignored. The process of heat transfer from solar irradiance is rather quasi-steady in nature as the temporal fluctuations are mostly relatively smooth and gradual, in general. Moreover, the heat transfer fluid is continually circulated thereby the impact of thermal mass is not dominant in the process. The gradient of the temperature rise is also not steep. The gradual rise of temperature is much closer to the quasi-steady approach used here. This not only reduces the computational time, moreover, but the end result also matches well the previous data/published data (see Appendix A).
The following assumptions are considered before the development of the physical model:
The internal longitudinal temperature distribution of each component layer is neglected due to its small thickness. The heat capacity of the PV module is less than the heat capacity of water and it is neglected. The heat flux received by the backplane is equally distributed. The influence of temperature on the physical characteristics of each component layer is neglected.
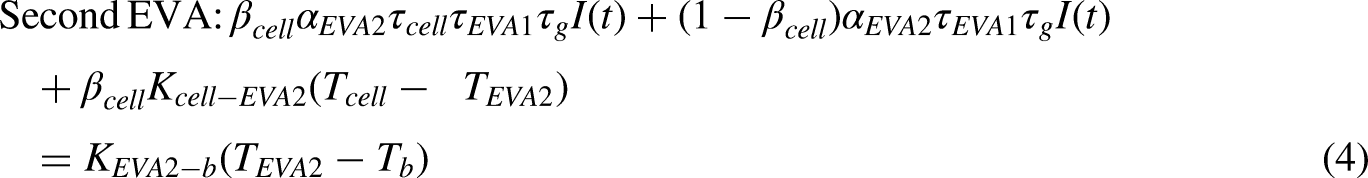
For the construction of energy balance equations of each component of the photovoltaic thermal collector, the law of conservation of energy is applied which is given as follows [10].


The model for the thermophysical properties of a photovoltaic thermal collector using nanofluid


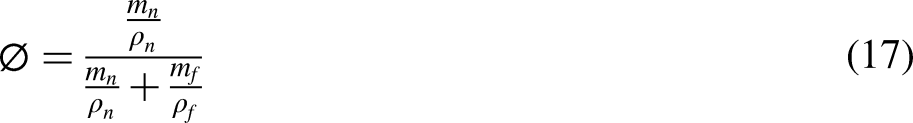
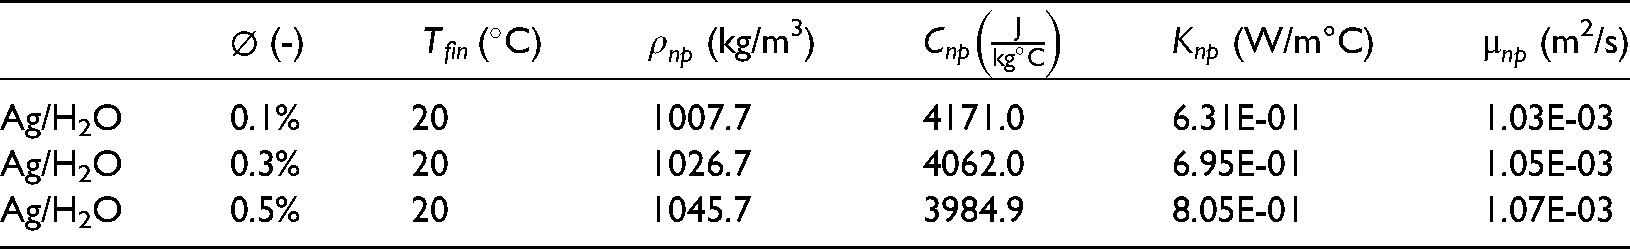
Eqs. (14), (15), (16), and (17) are used for the density of nanofluid, specific capacity of nanofluid, thermal conductivity, and volumetric concentration of nanofluid (Li et al., 2019), respectively.
Model for the performance of photovoltaic thermal collector using water and nanofluids


Eqs. (18), (19), (20), (21), (22), and (23) show thermal energy efficiency, electrical efficiency, total energy efficiency, pumping power, pressure head loss, and the net power of the system (Radwan et al., 2016), respectively.
Numerical setup
Numerical simulation was performed on MATLAB software by using energy balance equations in order to estimate both electrical and thermal performances of the solar thermal collector for each hour of each solar day throughout the whole year using working fluids like water and water/silver nanofluid.
Results and discussions
The results and discussion section contains five subsections. In the first section, simulations with hourly, daily, and monthly time frame are conducted using water as a working fluid for different regions. In the second section, the same simulations are carried out using nanofluid as a working fluid. In the next section, a comparative assessment is presented of the usage of different working fluids. It is followed by a sensitivity analysis of the nanofluid's mass flow rate and volume fraction on the performance indicators. This section is completed by reporting the influence of nanofluid characteristics on the pumping and electrical parameters.
Analysis of the performance of Pv/T collector using water as a working fluid
Hourly simulation results (water as a working fluid)
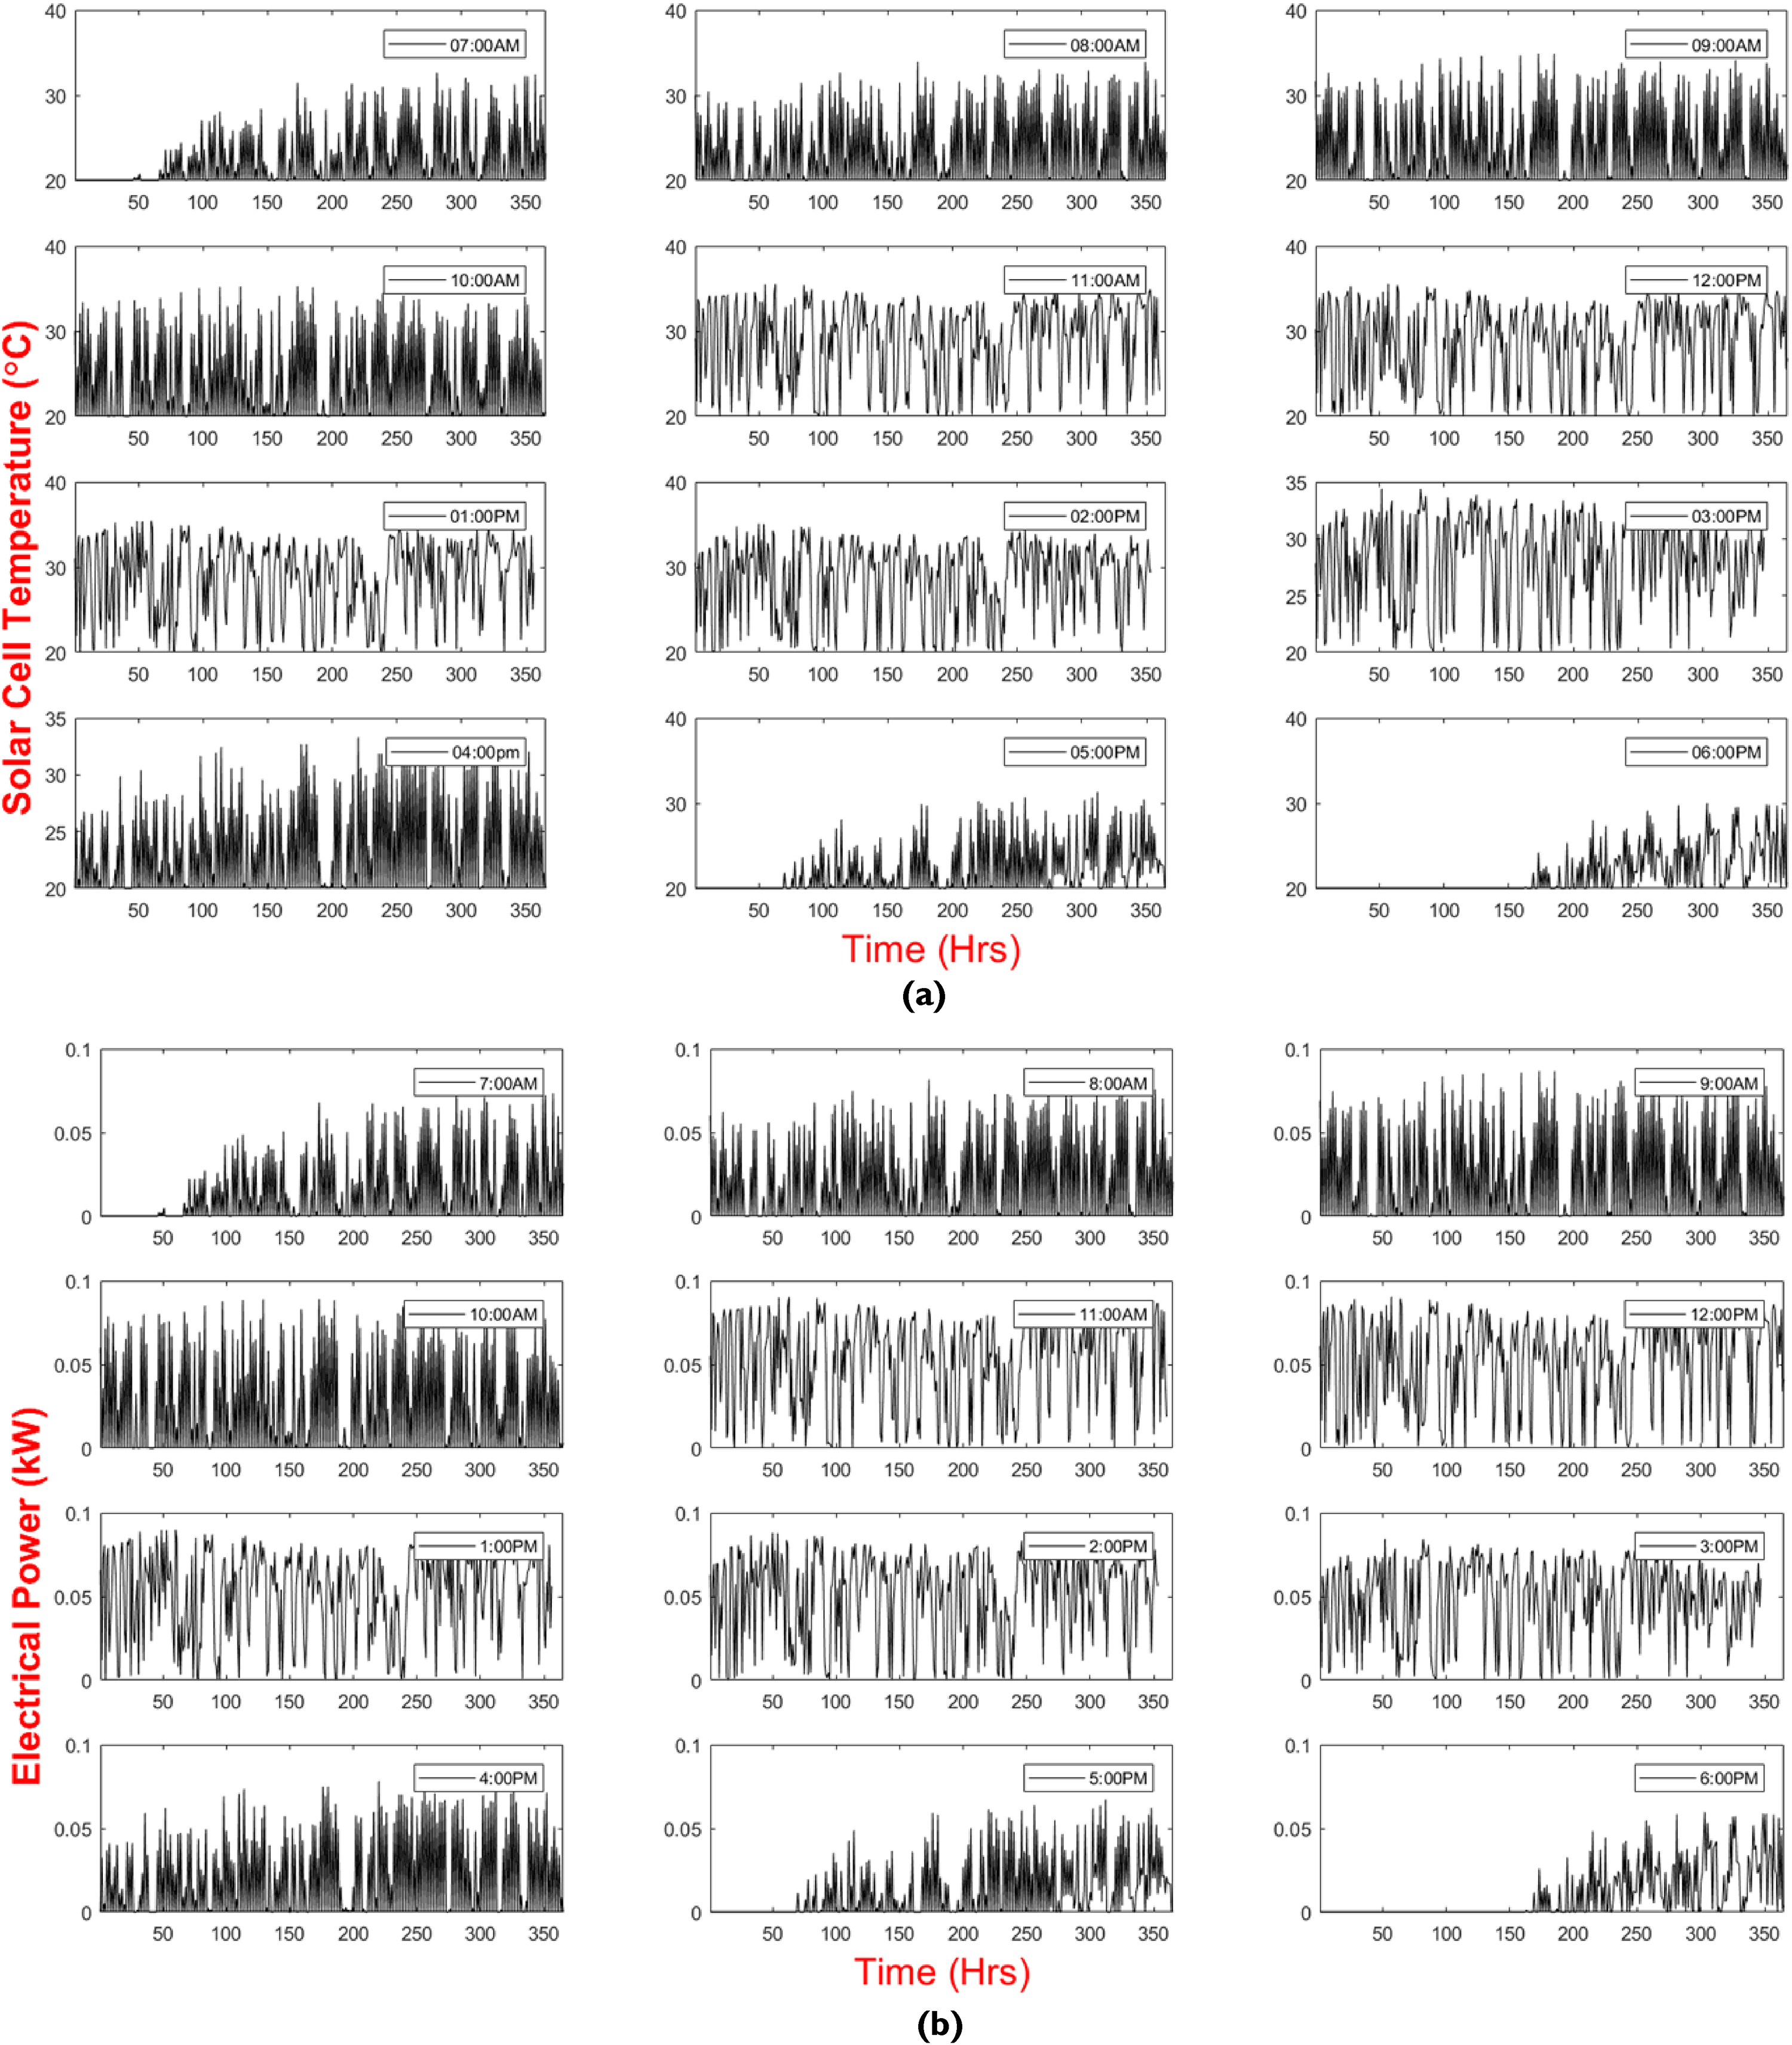
Numerical simulation was done for each hour of the whole year at a constant mass flow rate and inlet temperature of water (20°C). The behaviour of solar cell temperature, electrical power, and heat gain are shown in Figure 2 and Figure 3, respectively. Whereas, Table 1 summarizes the yearly simulation results using water as a working fluid in the PV/T collector.
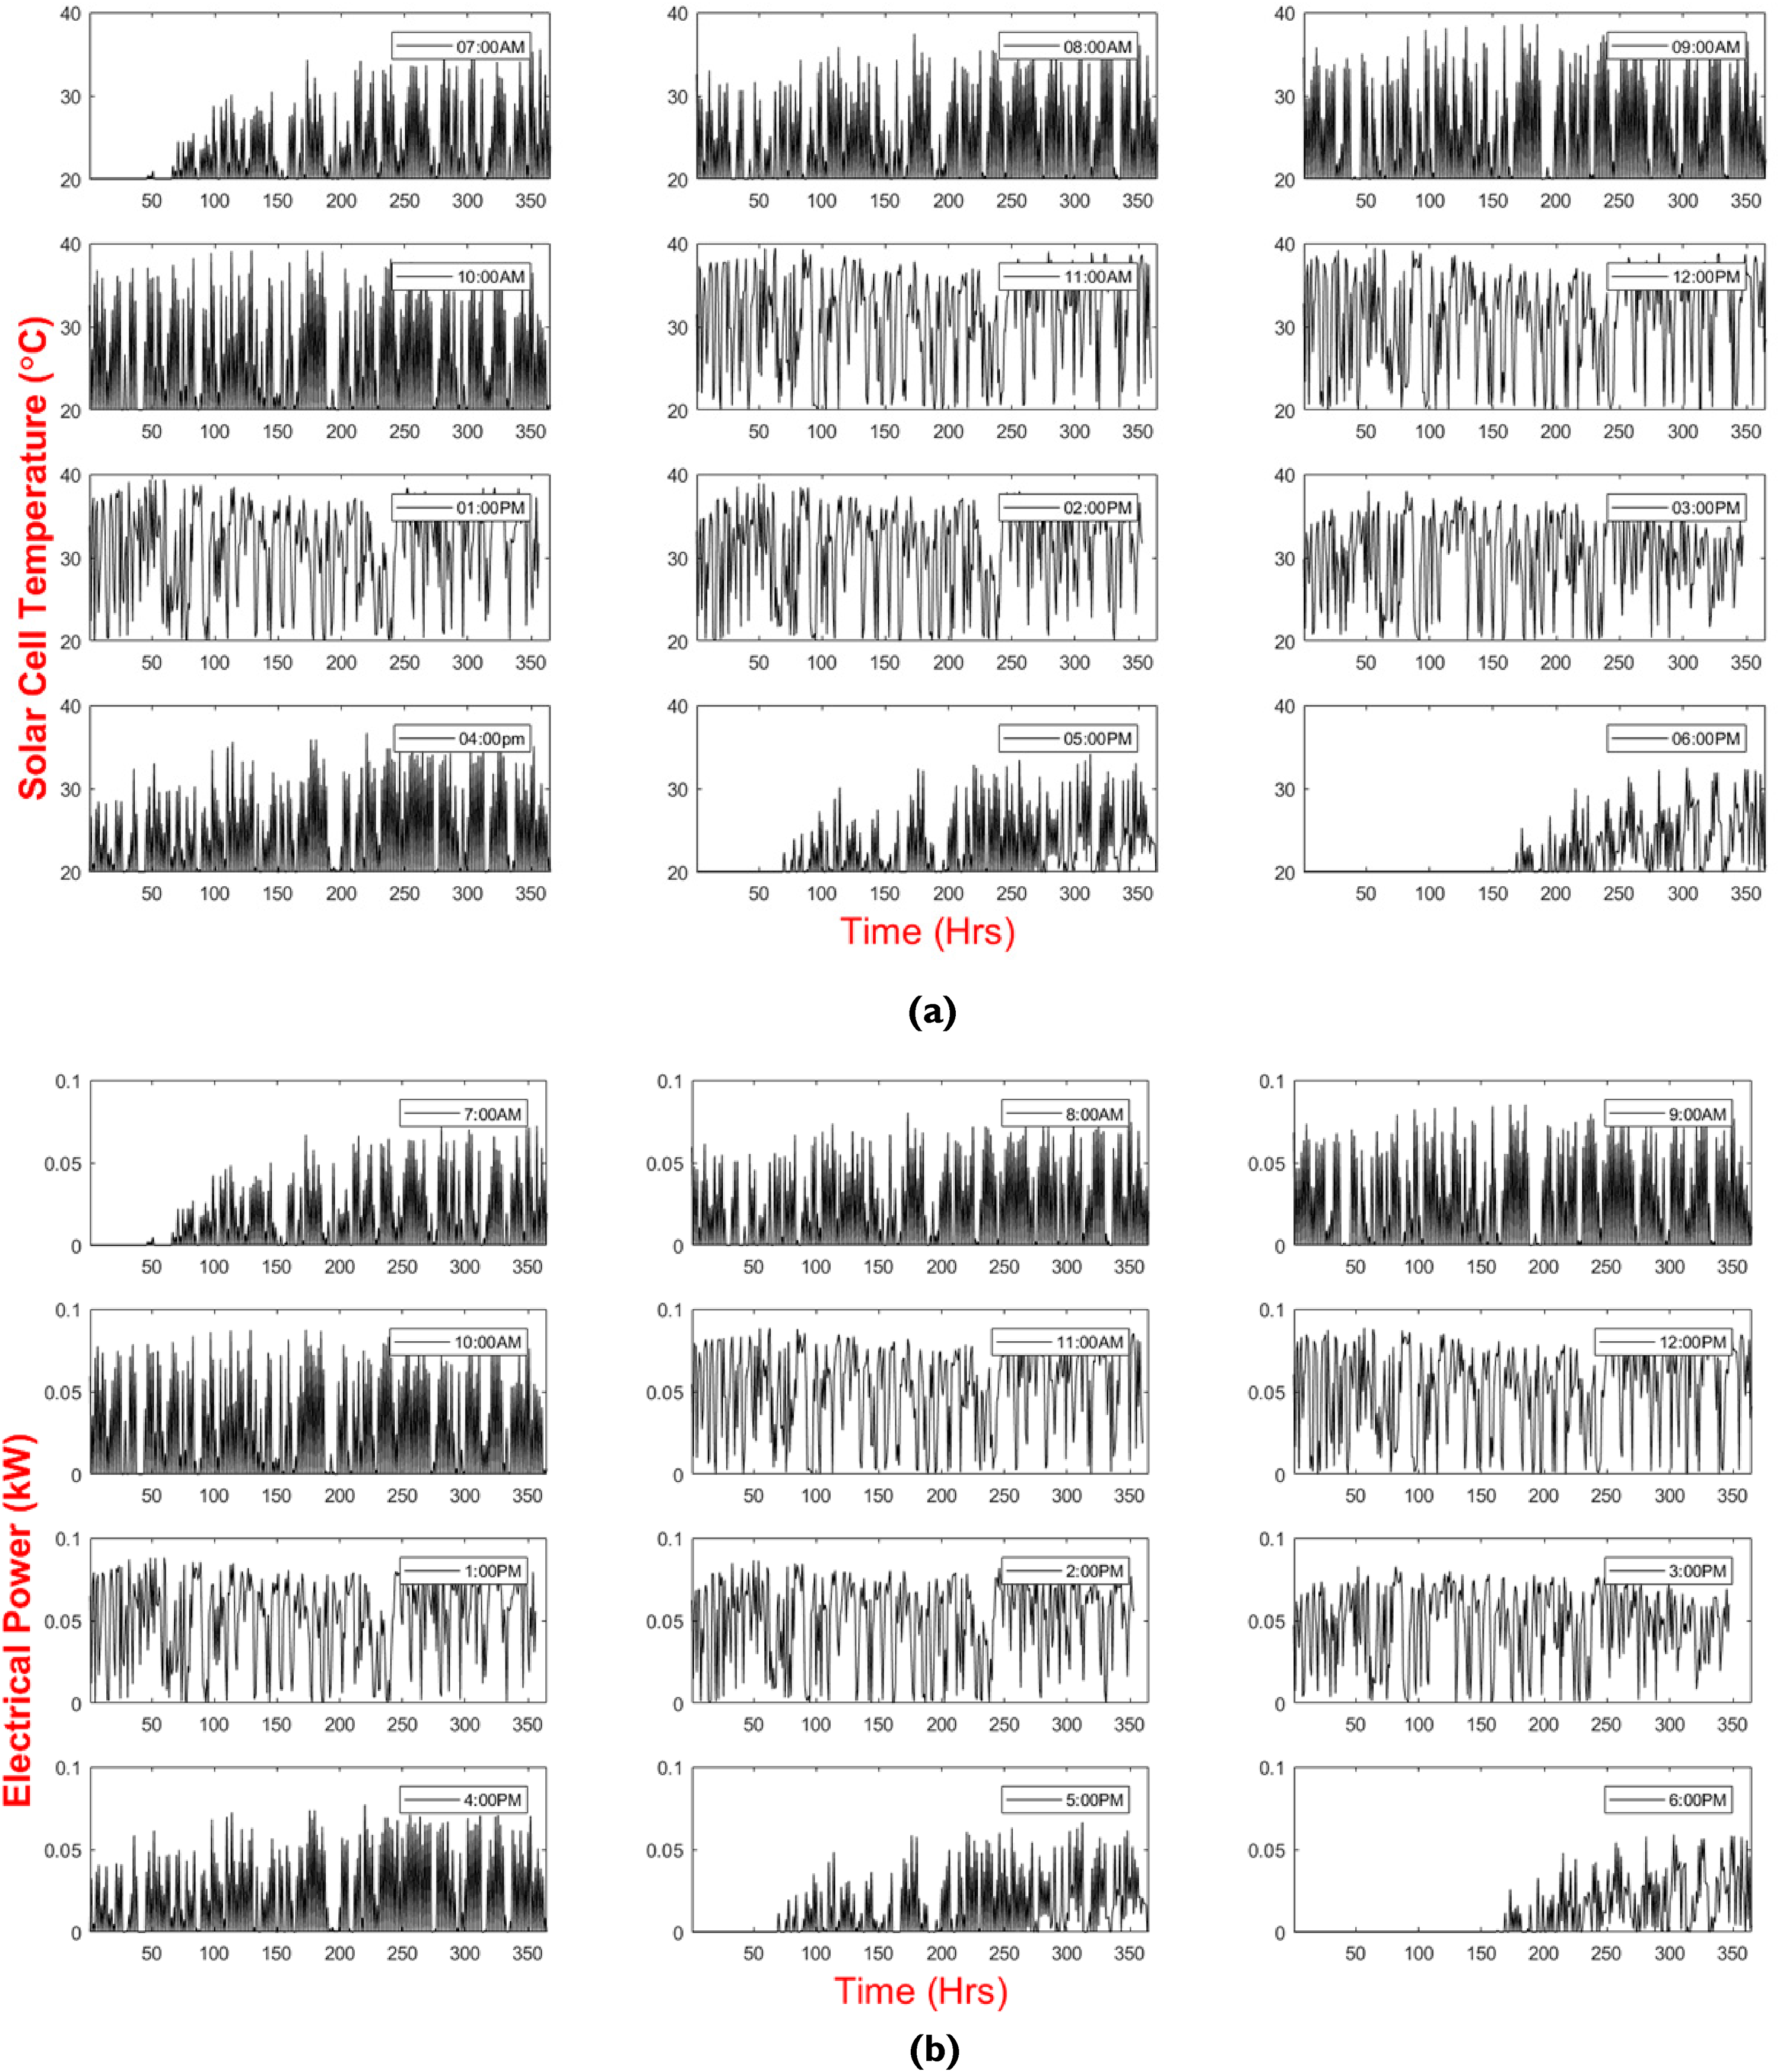
(a) Variation of solar cell temperature from the hours 07:00 AM to 06:00 PM for the whole year. (b) Variation of electrical power from the hours 07:00 AM to 06:00 PM for the whole year.
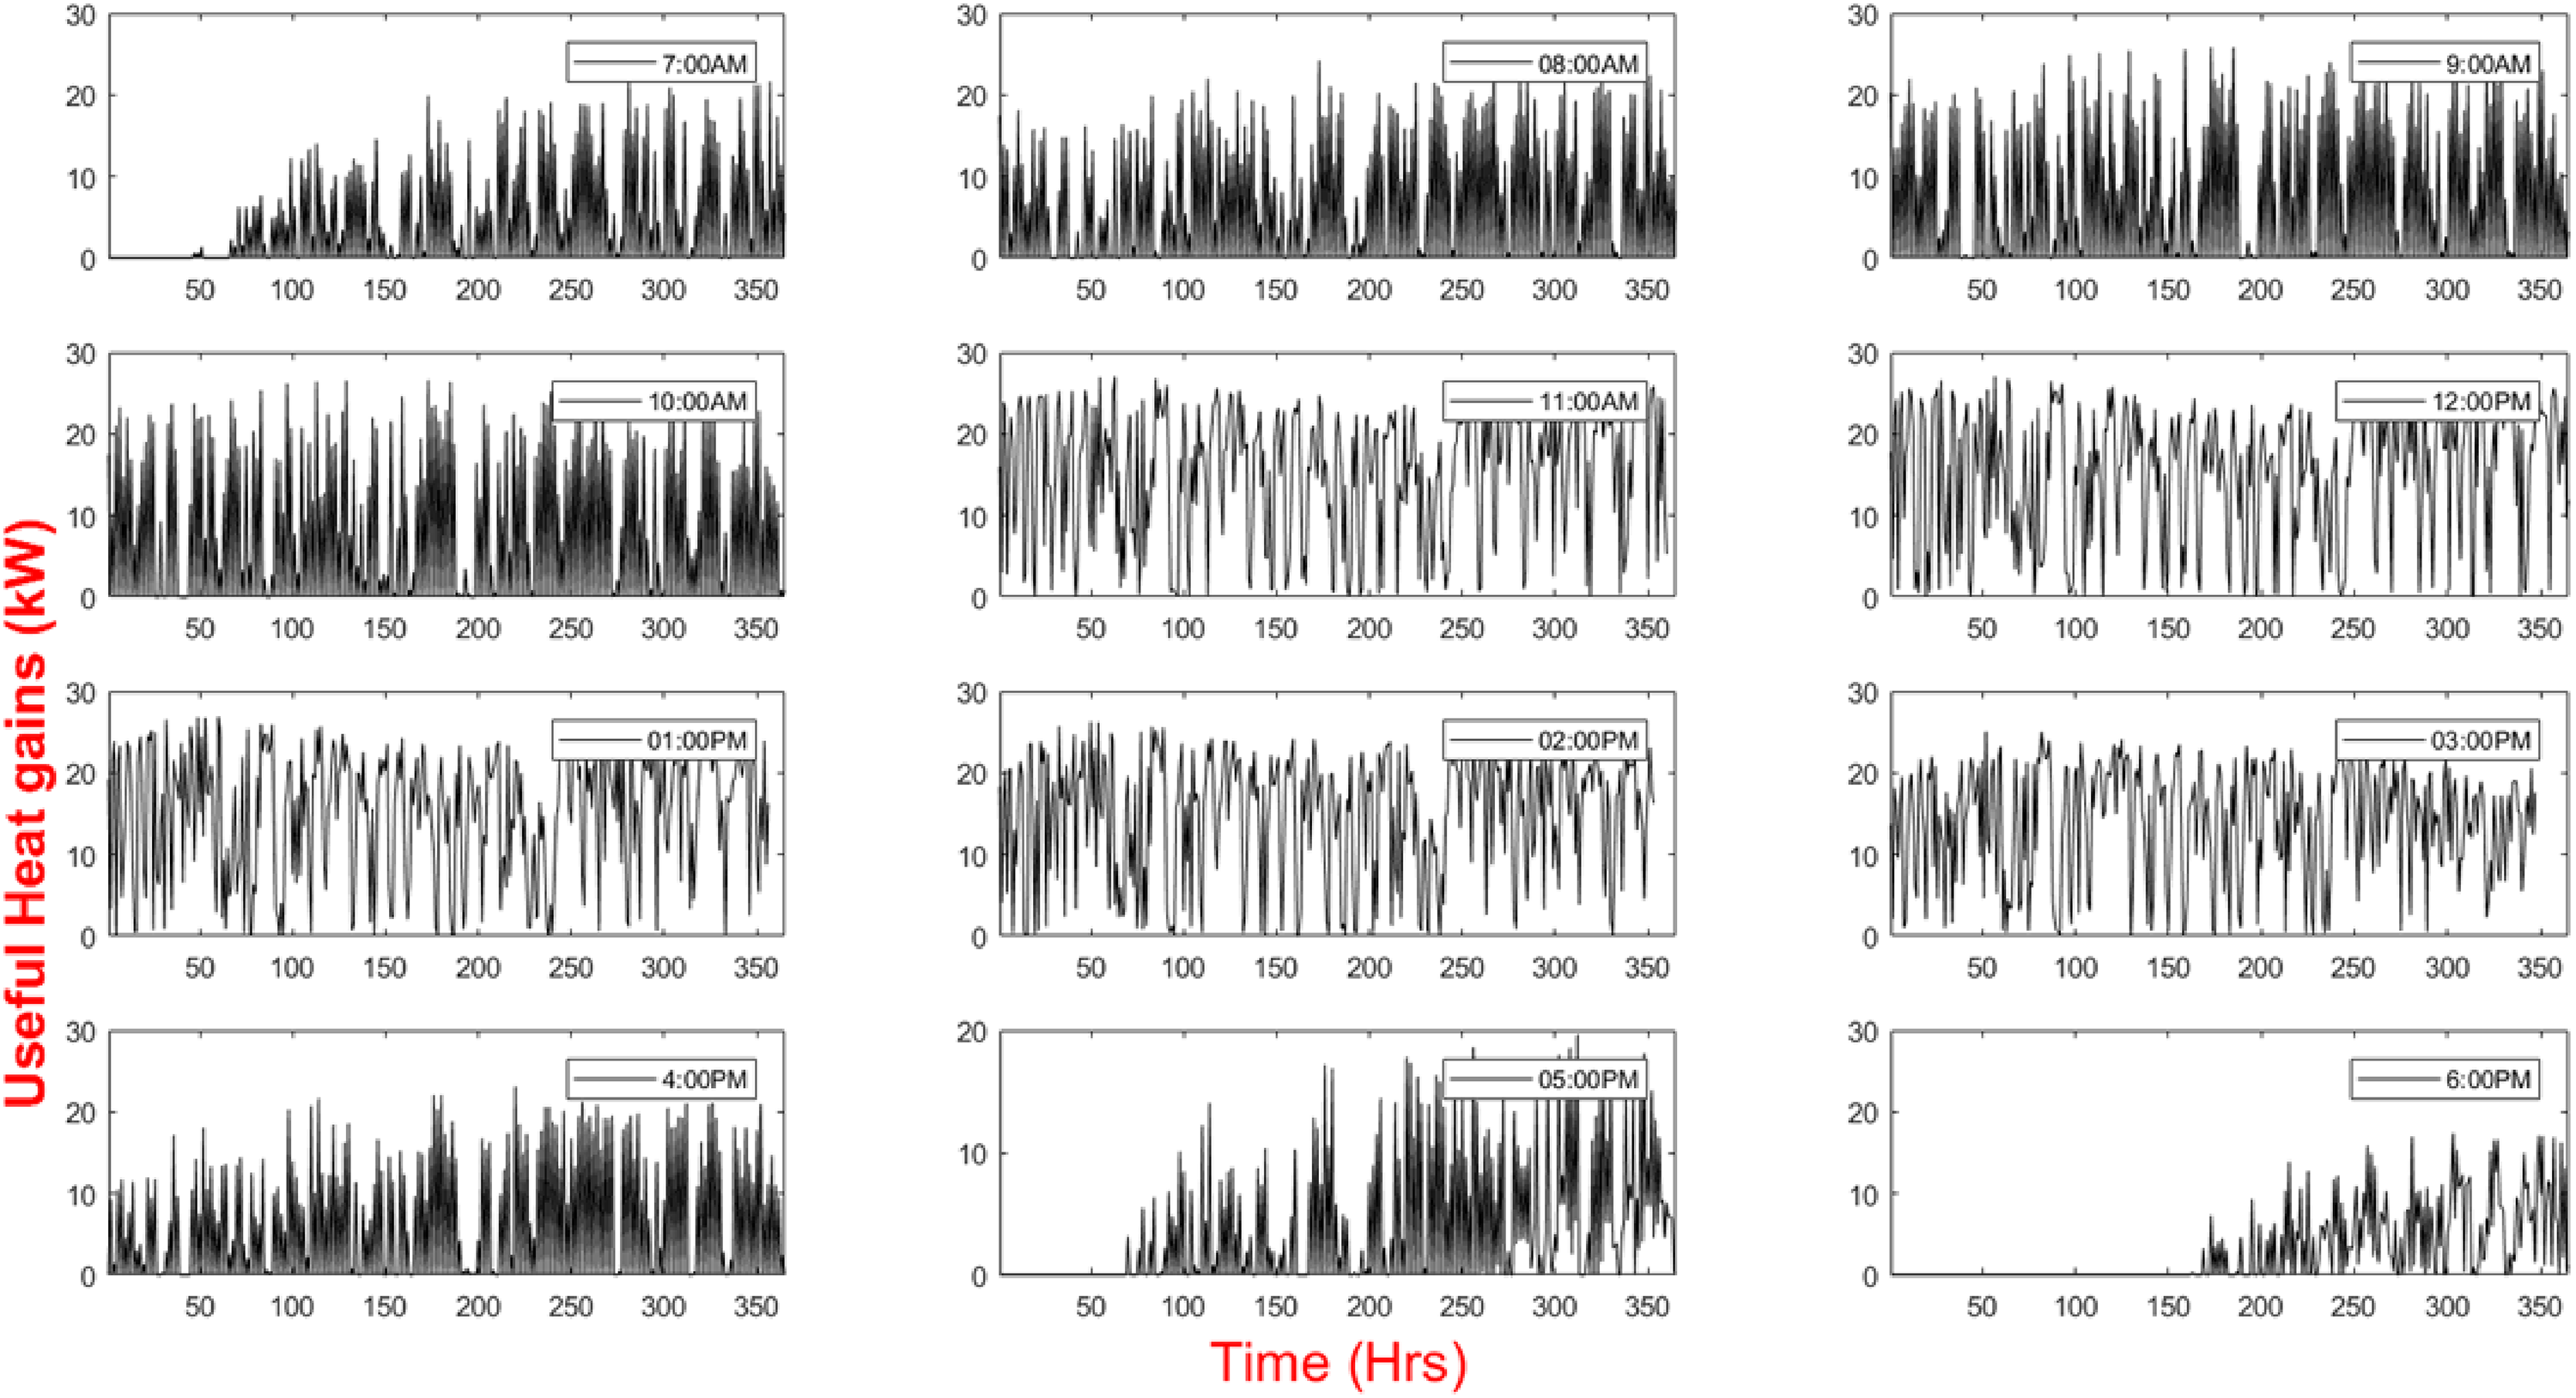
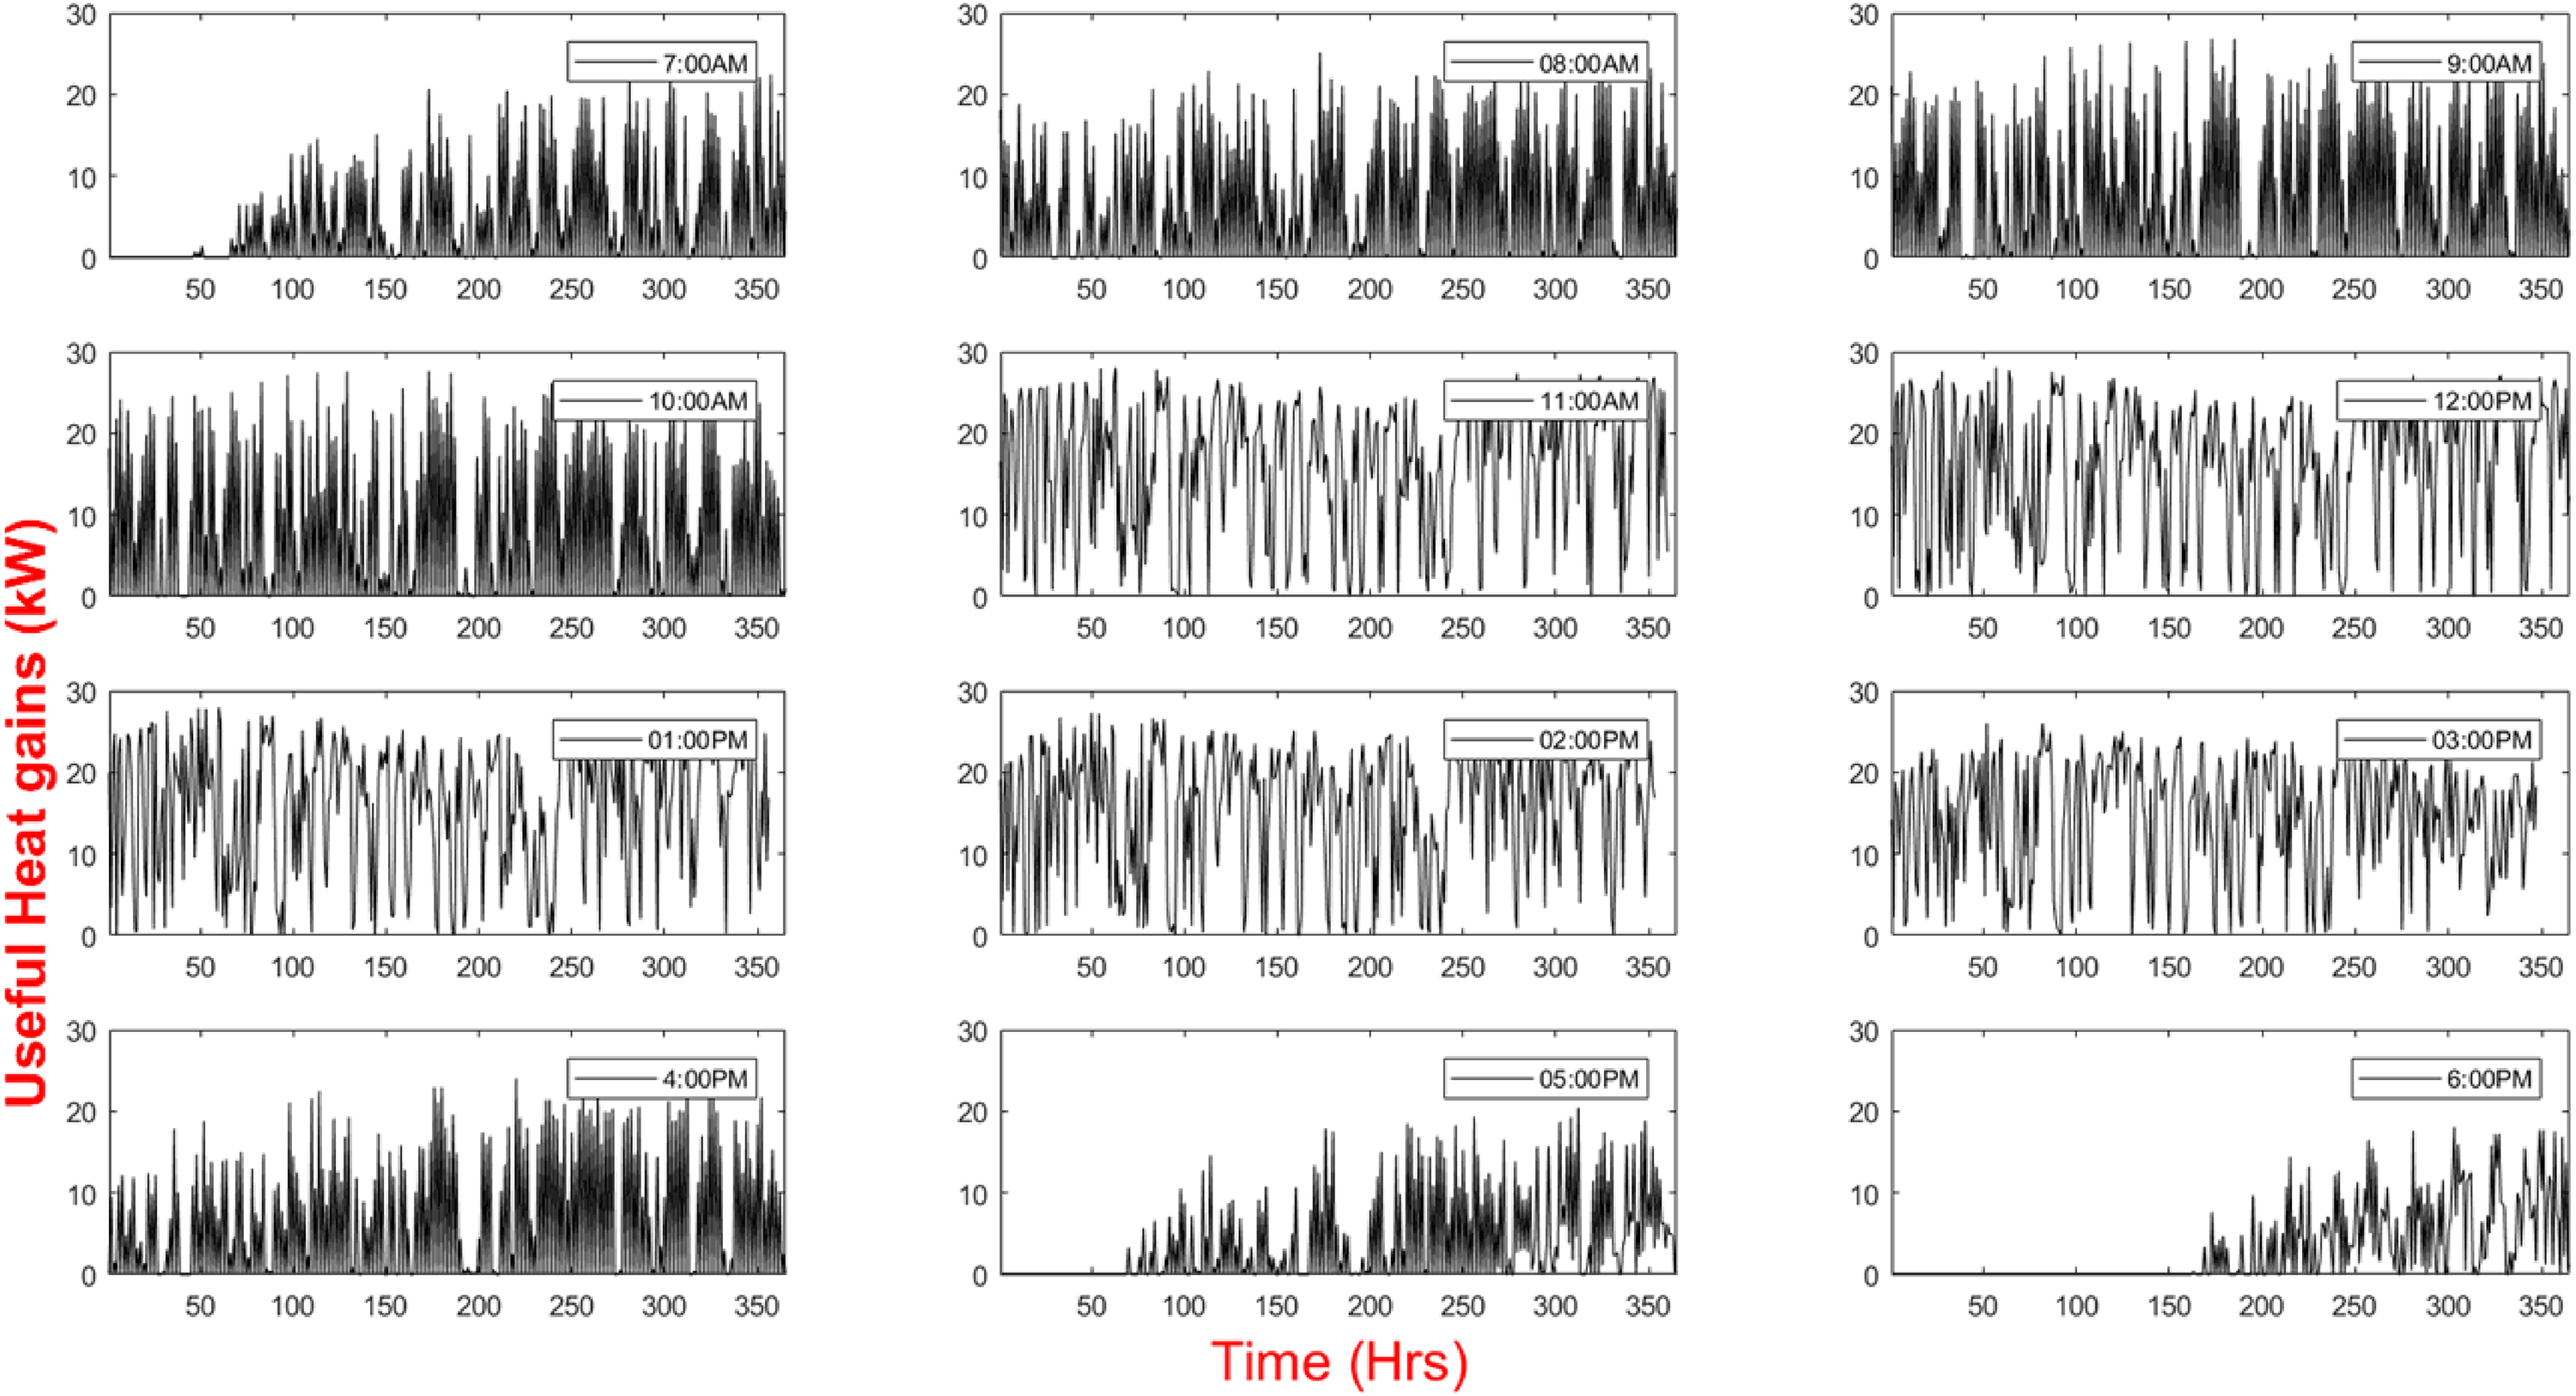
Variation of heat gain of working fluid from the hours 07:00 AM to 06:00 PM for the whole year.
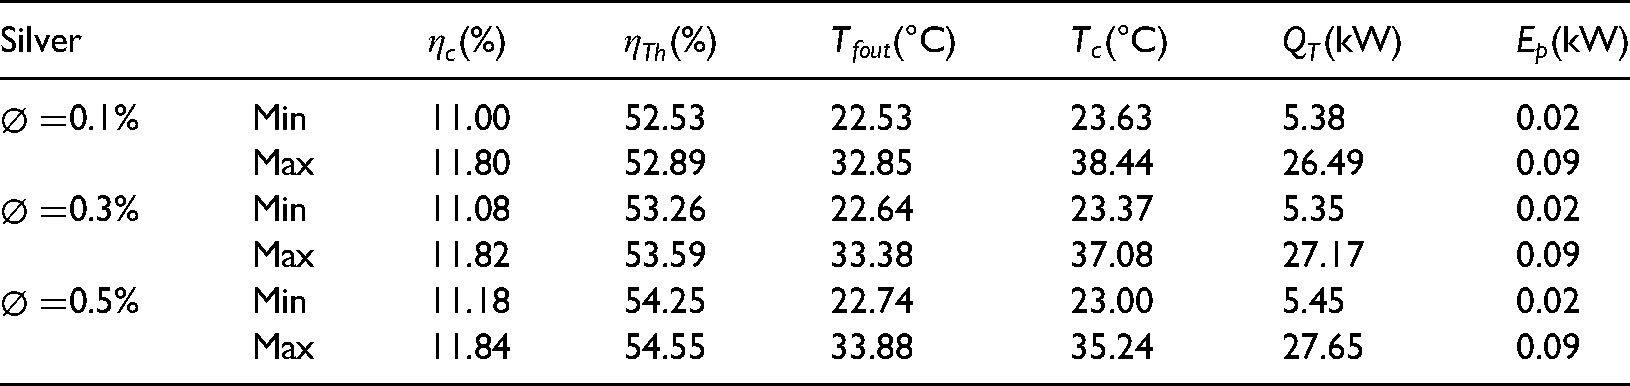
Hourly variation of photovoltaic thermal collector parameters using water as a base fluid for the city of karachi.
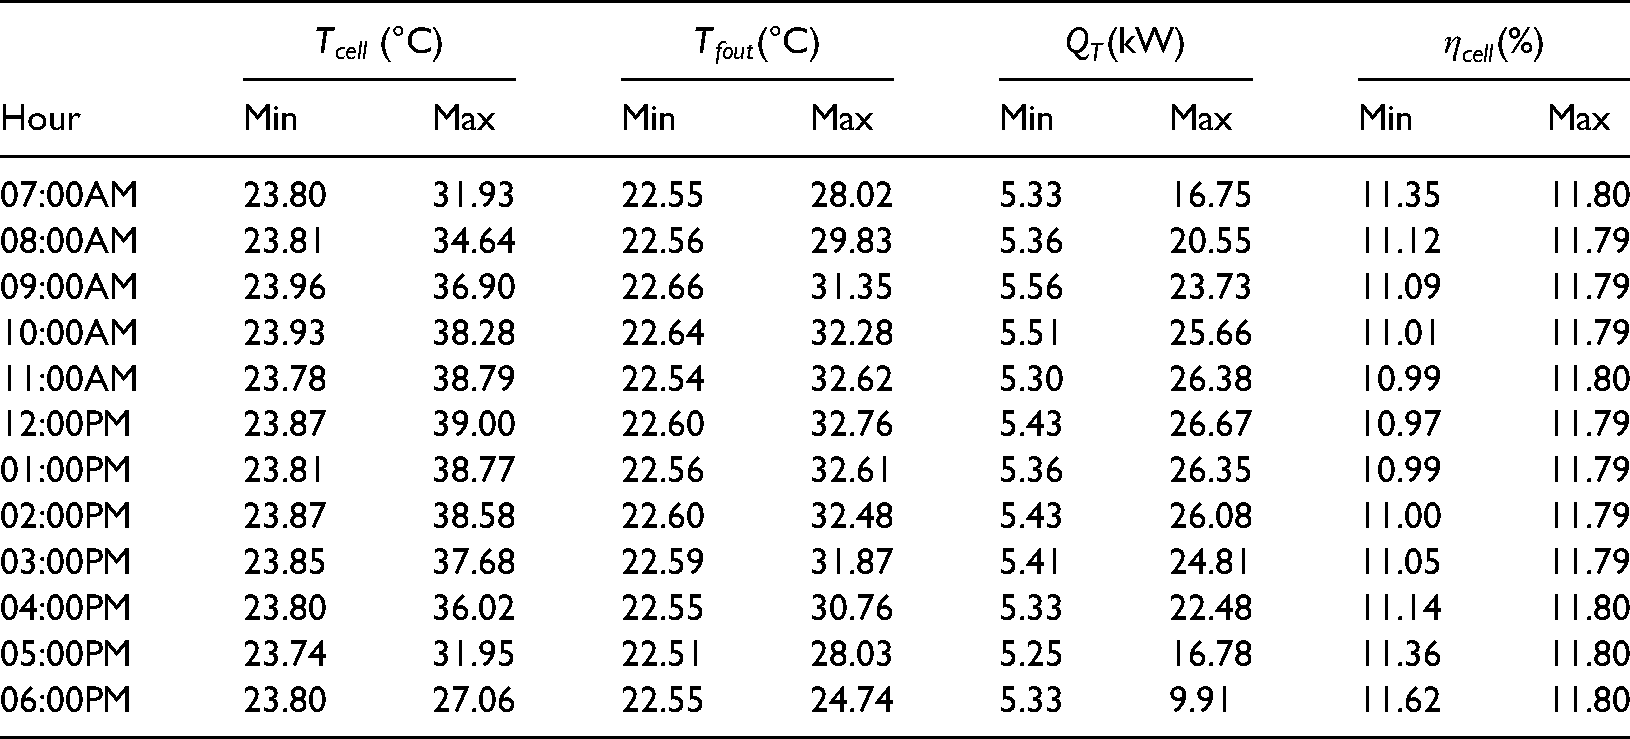
It is noted that the highest peaks in the solar cell temperature are attained between 12:00 PM to 02:00 PM, and the lower peaks are noted at 07:00 AM, 05:00 PM, and 06:00 PM. It makes sense because the solar cell temperature is correlated with the solar radiation which is maximum at 12:00 PM. The behaviour of solar cell efficiency is quite oppositive and the lowest solar cell efficiency is observed from 11:00 AM to 12:00 PM when the operating temperature of the solar cell is maximum. Similarly, the highest values of solar cell efficiency are noted at the beginning and at the end of the day when the operating temperature of the solar panel is the lowest The electrical power and the useful heat gain exhibit the same pattern as the solar cell temperature.
The results have suggested that the maximum solar efficiency of the photovoltaic thermal collector on a sunny solar day is achieved at 12:00 PM which is decreased from 11.79% to 10.97%. The lowest temperature of solar cells is 23.73°C at 07:00 AM and the maximum solar cell temperature is 38.99°C at 12:00 PM which decreases from 12:00 PM to 06:00 PM. Useful heat gains at the given condition are 5.24 kW at 07:00 AM and the maximum useful heat gain is at 12:00 PM which is 26.66 kW. Photovoltaic power at 07:00 AM is 0.01kW and maximum power at 0.08kW.
The outlet temperature of water increased from 07:00 AM to 12:00 PM which is about 20°C to 32.95°C and decreased from 12:00 PM to 06:00 PM. The maximum temperature at 06:00 PM is 28.32°C and the minimum temperature is 20°C. Solar cell efficiency decreased from 12% to 11.15% at 07:00 AM but it decreased from 12% to 10.95% at 12:00 PM. The solar cell temperature increased from 20°C to 39.26°C at 12:00 PM but it decreased from 12:00 PM to 06:00 PM to 32.51°C. The electrical power increased from 07:00 AM to 12:00 PM to 0.08kW at 12:00 PM and it decreased to 0.05kW at 06:00 PM. The results show that useful heat gain increased from 07:00 AM to 12:00 PM on sunny solar days which increased from 21.97kW to 27.07kW respectively, it decreased from 12:00 PM to 06:00 PM 17.38kW respectively.
The other parameters of a PV/T collector for each hour of the sunny solar day (07:00 AM to 06:0PM) using water as base fluid are given in Table 1.
Daily simulation results (water as a working fluid)
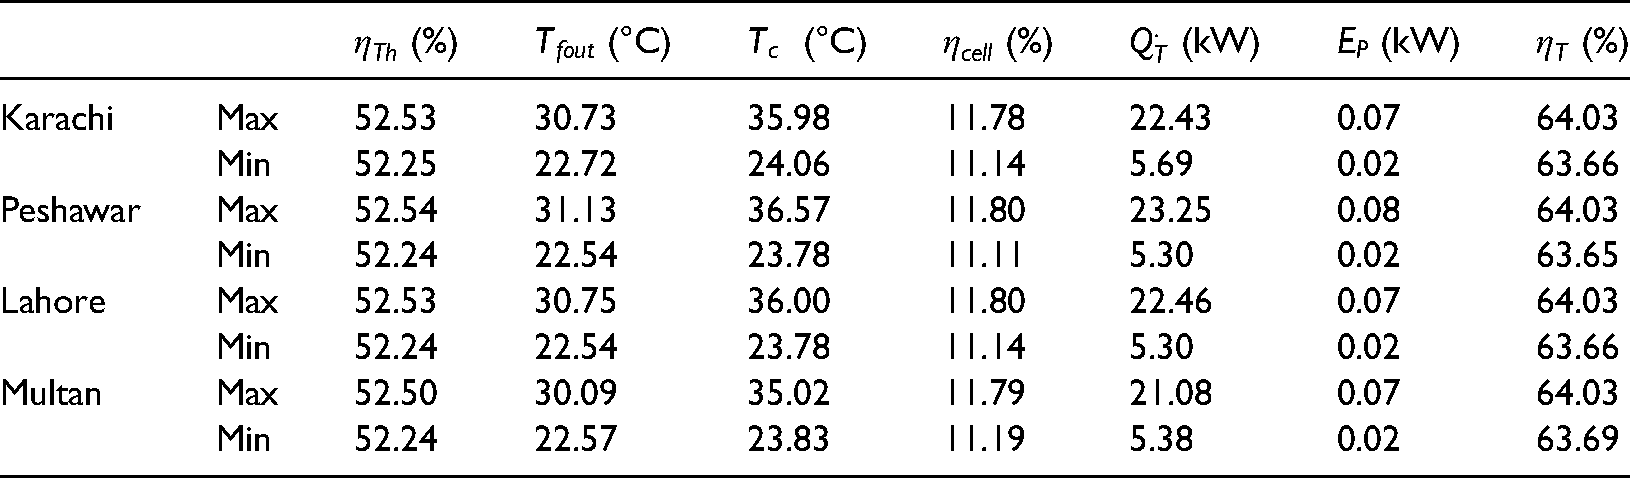
The performance of the PV/T collector was investigated by using daily average transient solar radiation while considering the inlet temperature of water to be constant (20°C). The result shows that for Taxila city, the outlet temperature of the water is increased from 22.57°C to 30.64°C (see Figure 4(a)). The solar cell temperature increased from 23.82°C to 35.84°C (see Figure 4(b)). Useful heat gains for photovoltaic thermal collectors increased from 5.37 kW to 22.23 kW (see Figure 4(c)). Solar cell efficiency increased from 11.14% to 11.80% (see Figure 4(d)) using water as working fluid for flat plate solar collectors for Taxila city for each sunny solar day. Thermal energy efficiency increased from 52.24 to 52.55% for Taxila city (see Figure 4(e)). The total efficiency of the PV/T collector increased from 63.67 to 64% (see Figure 4(f)). A similar daily analysis is conducted for other cities and thermal performance indicators are reported in Table 2. The highest water temperature, heat gain, and power output are noted for Peshawar city owing to its favourable weather conditions.
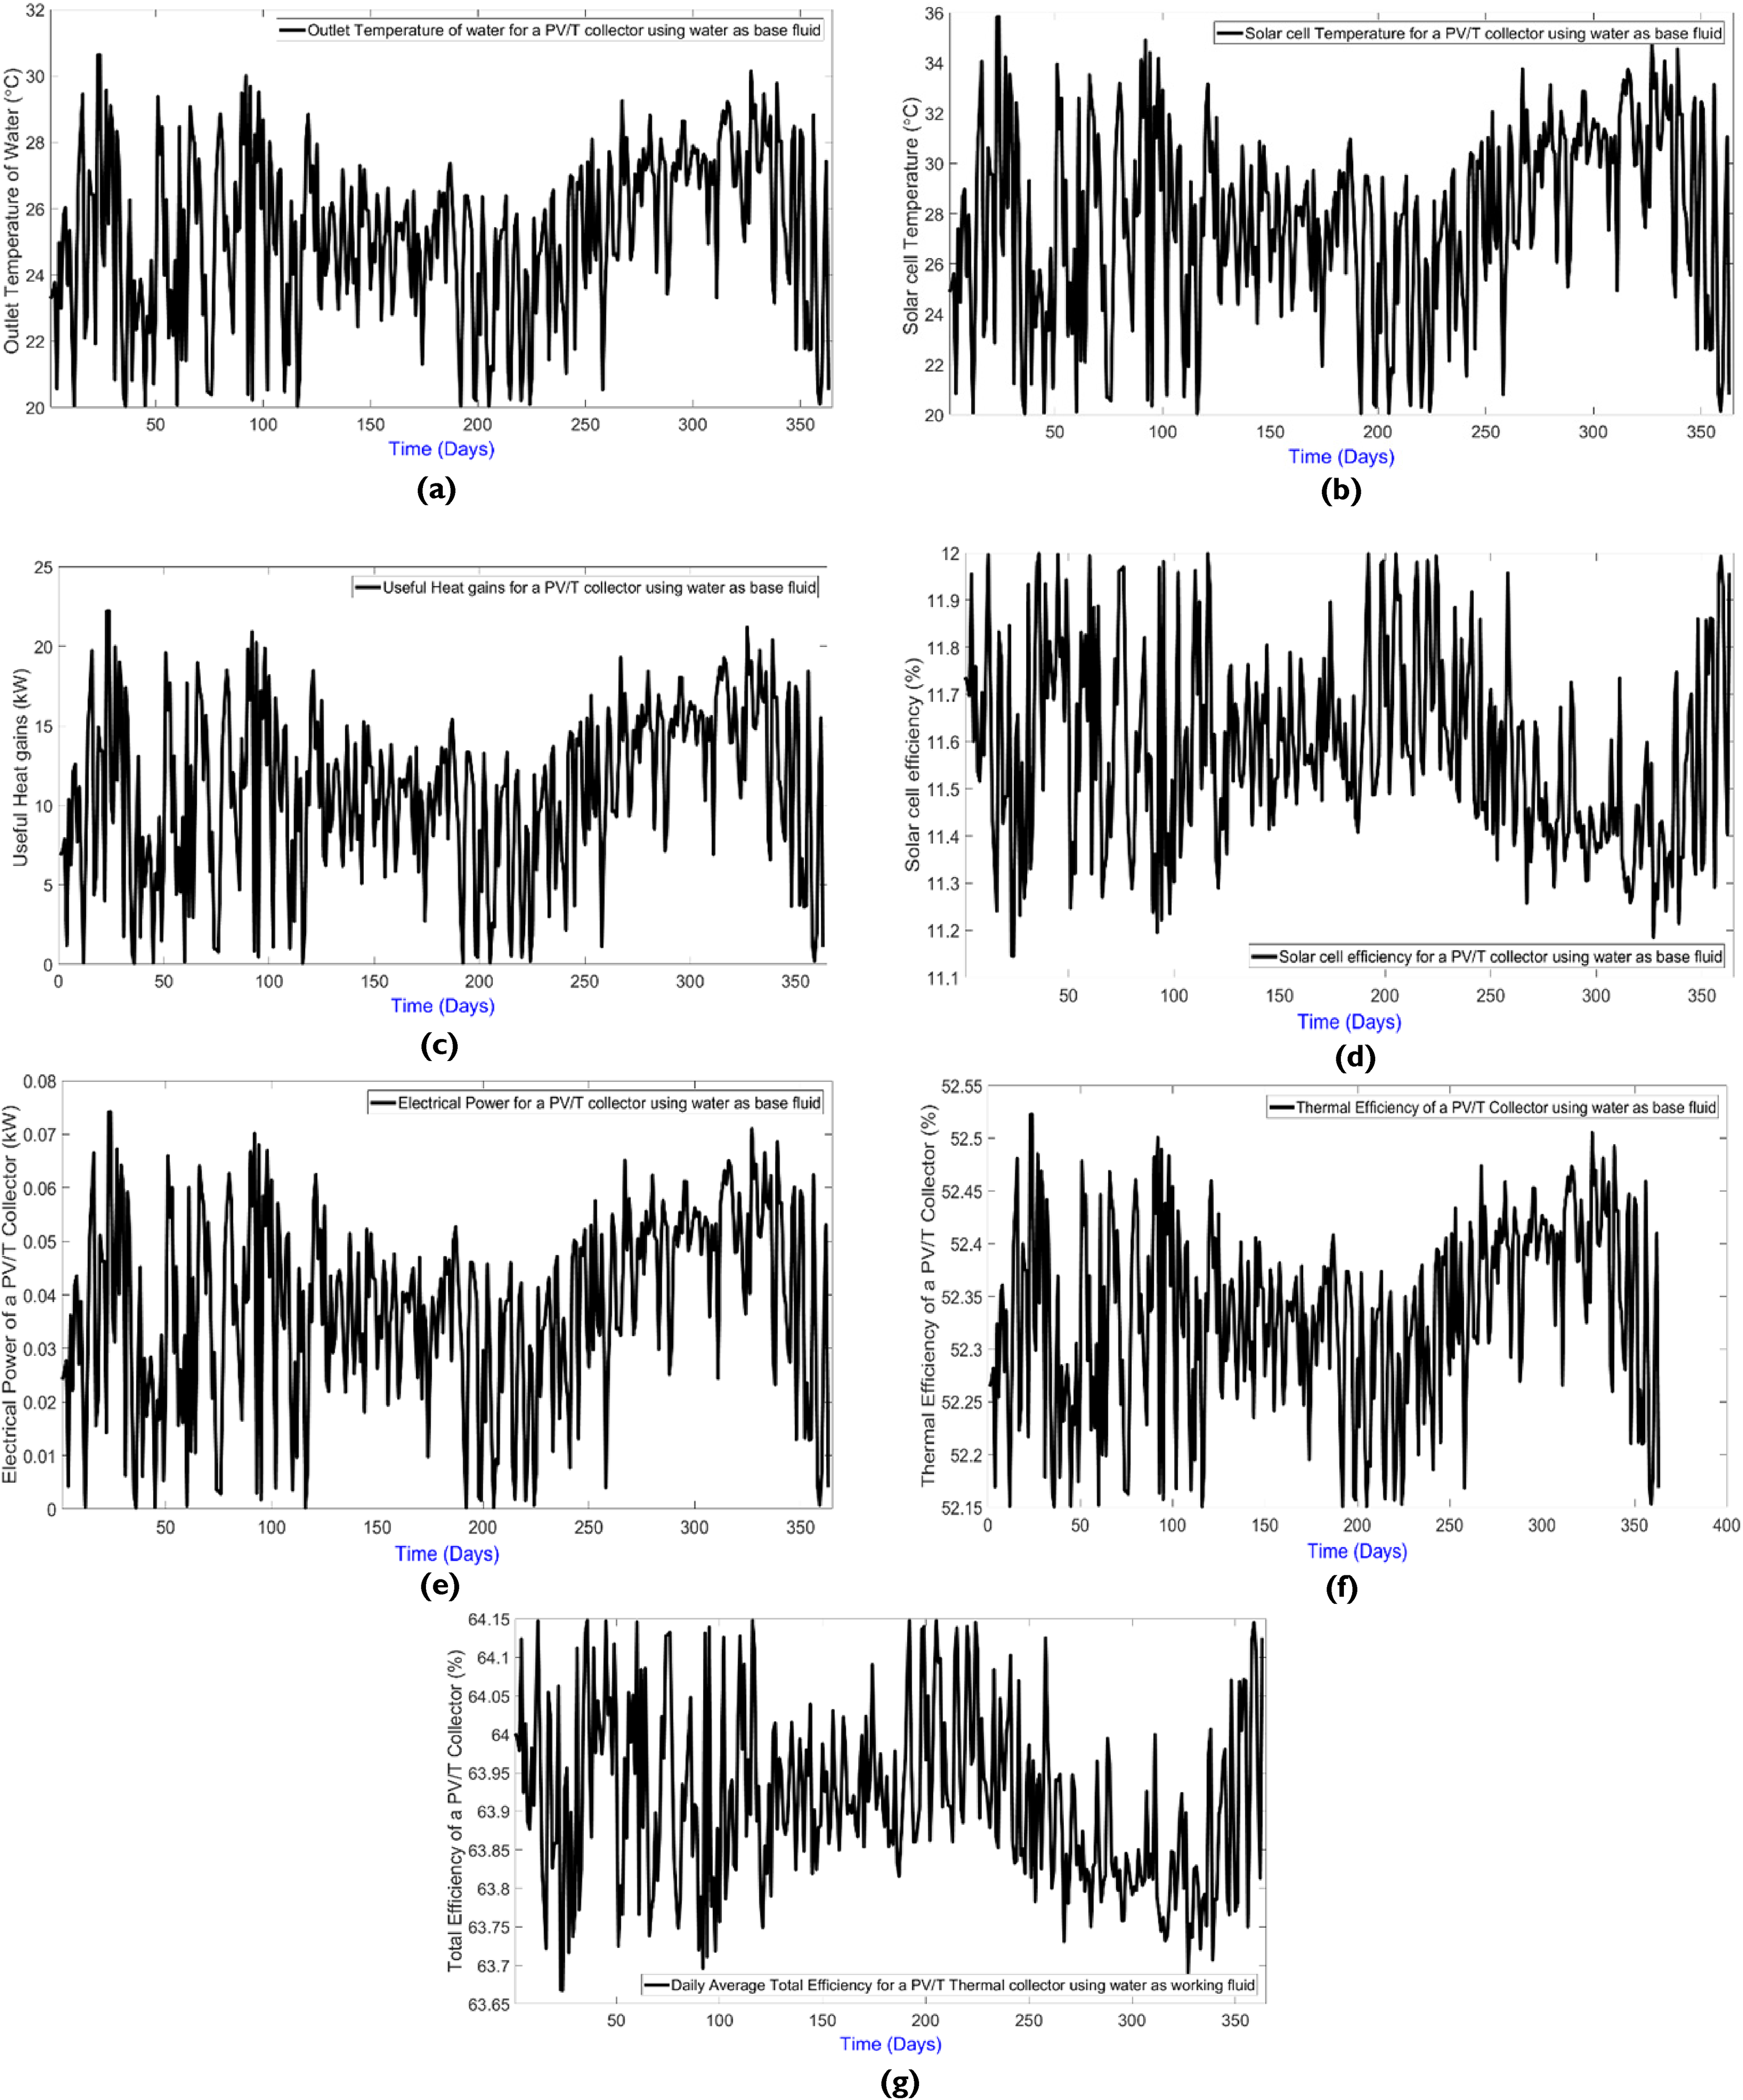
Results of a PV/T thermal collector parameters using daily average solar radiation intensity and water as base fluids on (a) outlet temperature of water (b) solar cell Temperature (c)useful heat gains (d) solar cell efficiency (e) electrical power (f) thermal efficiency (g) total efficiency.
Photovoltaic thermal collector parameters for other five cities using water as base fluid.
Monthly simulation results (water as a working fluid)
The findings of this section are reported in Figure 5. Karachi city has the lowest outlet temperature of the water which is 25.66 °C, and Peshawar city has the highest outlet temperature which is 28.05 °C. Peshawar city has the lowest total efficiency, which is 63.68%. Taxila city has the highest total efficiency which is 63.80%. Peshawar city has the lowest solar cell efficiency which is 11.34%, and Taxila city has the highest solar cell efficiency which is 11.55%. The results show that Taxila city has the lowest thermal efficiency city which is 52.25%. Peshawar city has the highest thermal efficiency city which is 52.34%. It is also found that Taxila city has the lowest electrical power which is 0.03kW. Peshawar city has the highest electrical power which is 0.05 kW. According to a numerical study, it is found that the lowest useful heat gain city is Taxila city which is 11.38 kW. Peshawar city has the highest useful heat gain which is 16.83 kW. It can also be noted that Taxila city has the lowest solar cell temperature which is 28.20°C, and Peshawar city has the highest solar cell temperature which is 32.11 °C.
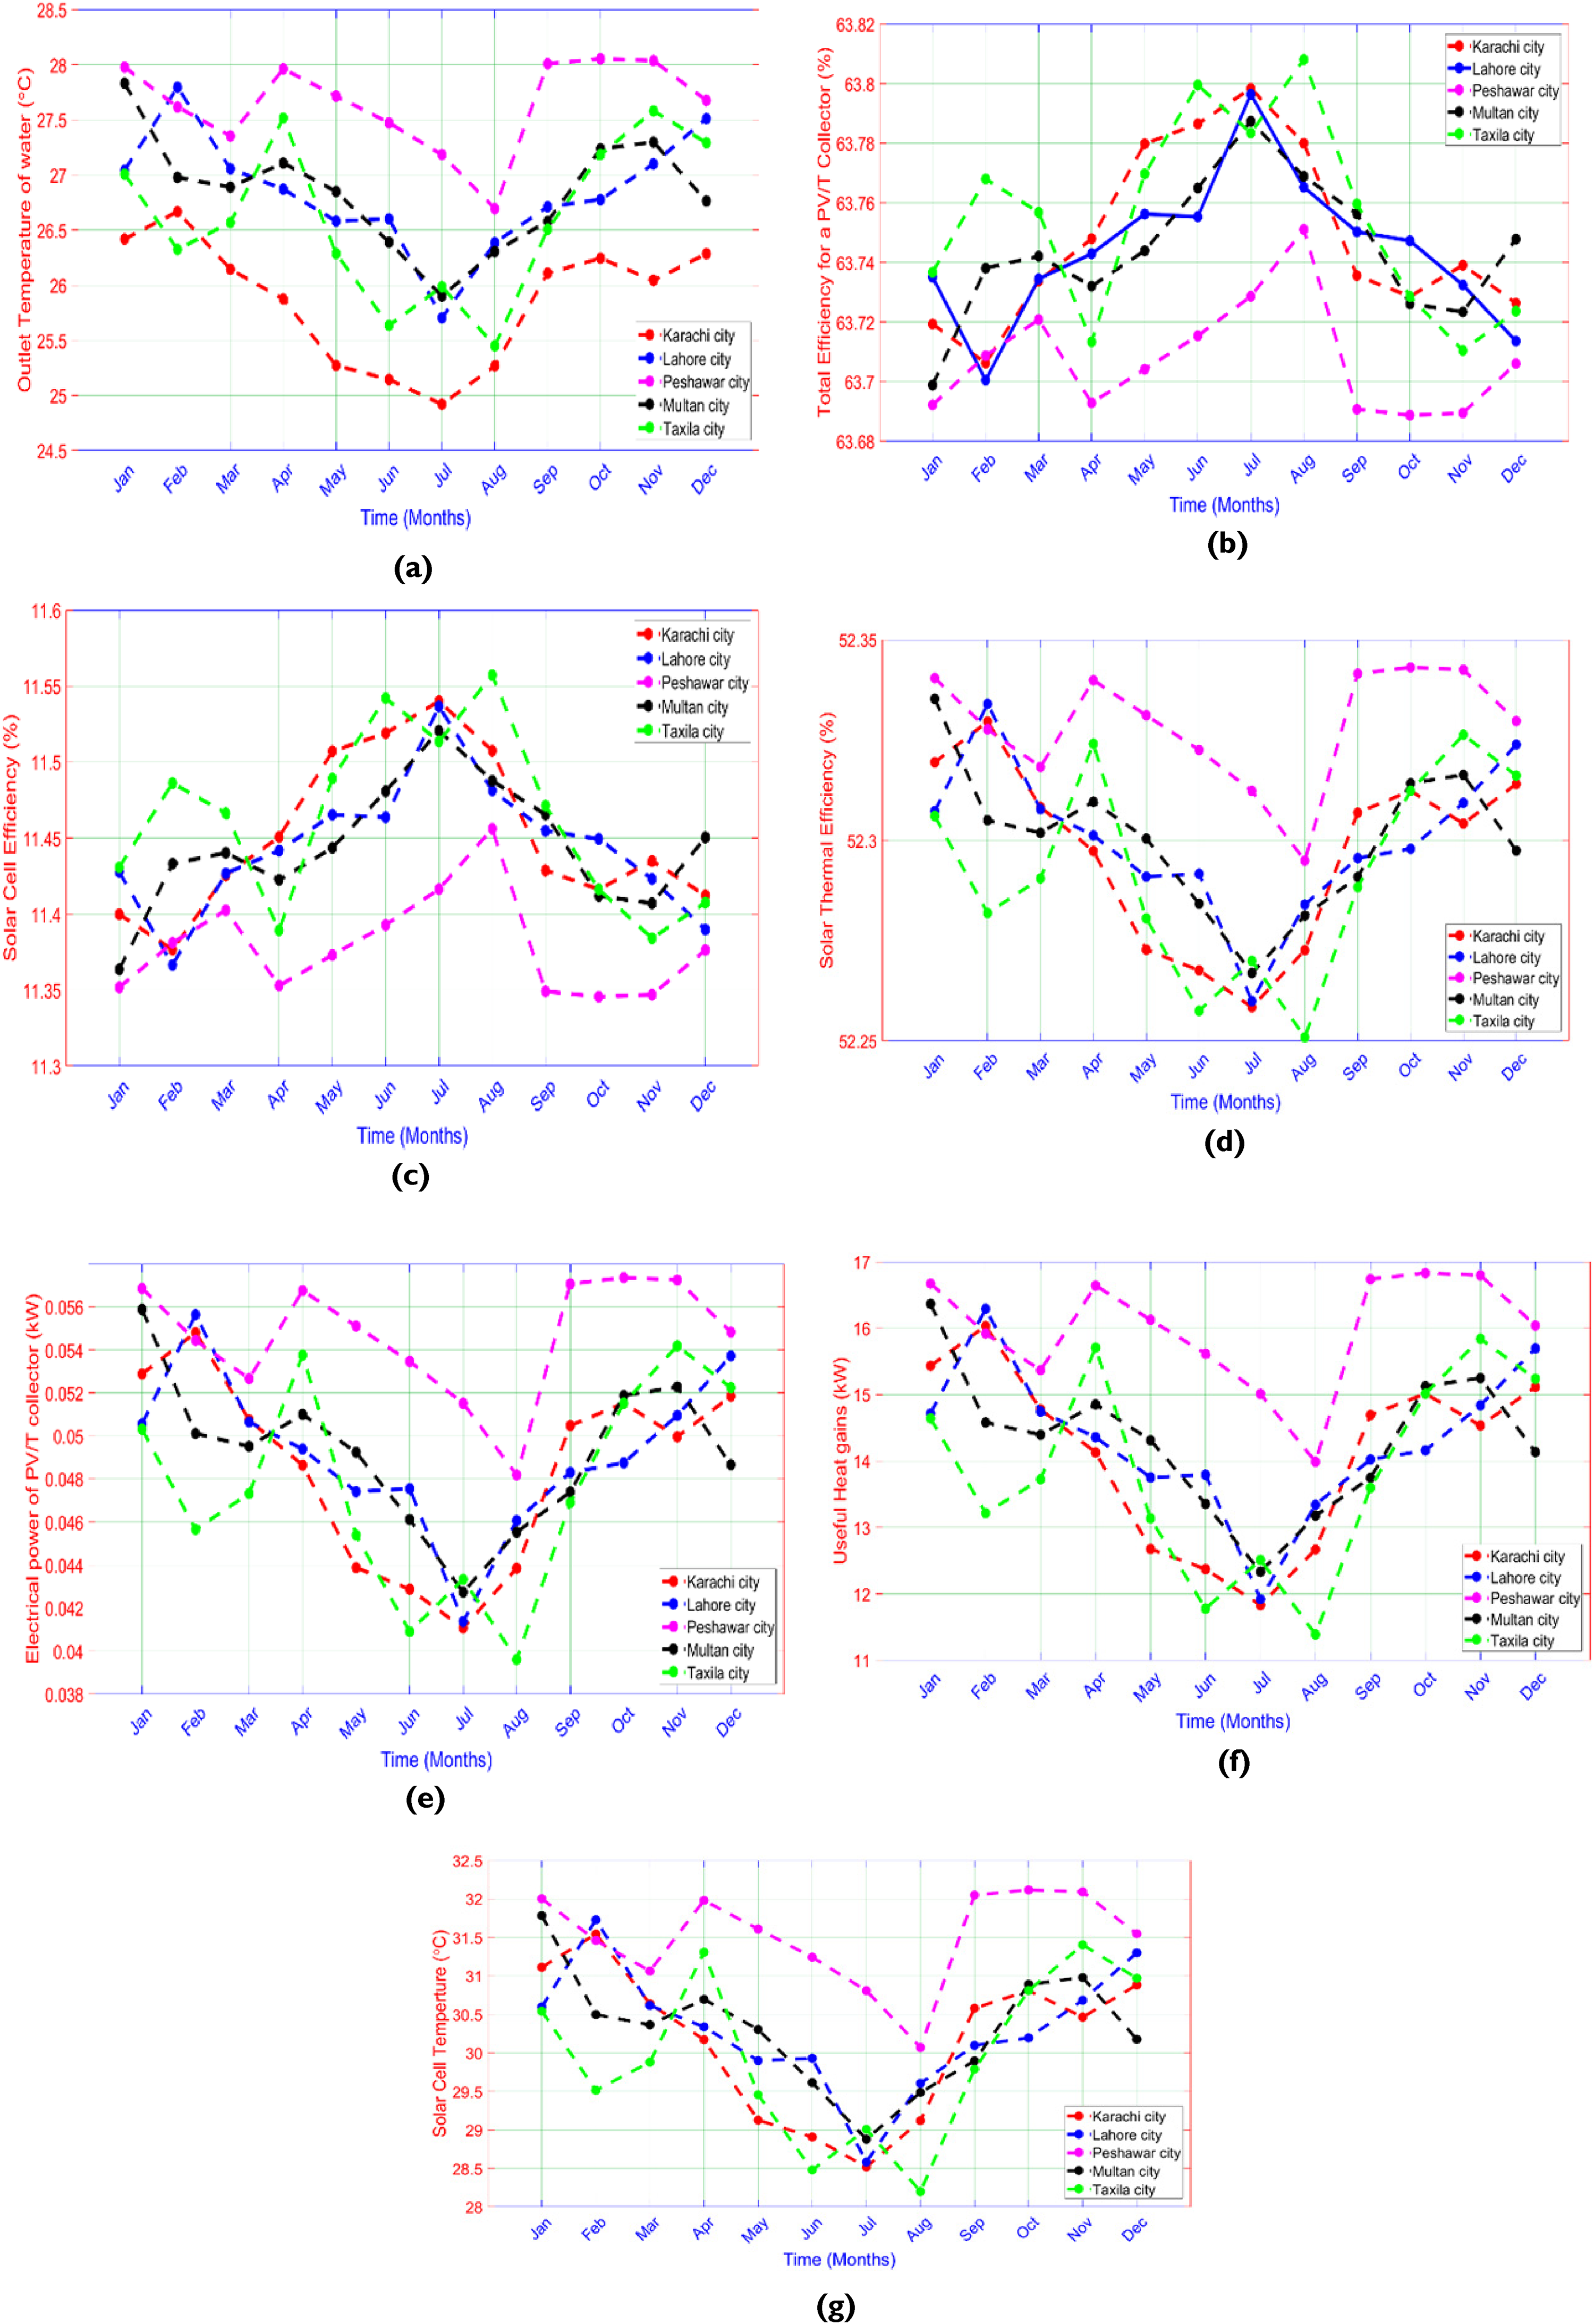
Results of PV/T thermal collector parameters using monthly average solar radiation intensity and water as base fluids on (a) outlet temperature of water (b) total efficiency (c) solar cell efficiency (d) useful heat gains (g) solar cell efficiency (e) electrical power (f) thermal efficiency (g) solar cell temperature.
Performance indices of Pv/T collector using Ag/water nanofluid as a working fluid
In this section, the findings of the numerical simulation are reported which displays the performance of PV/T collector using Ag/water nanofluid. Hourly, daily, and monthly simulations are presented in the subsequent sections.
Hourly simulation results (Ag/water as a working fluid)
Different volumetric concentrations are taken from the experimental work of Li [23]. The selected volumetric concentration
(Ag/water) nanofluid with different concentrations (Shan et al., 2013) experimental research (Li et al., 2019).
The maximum solar cell temperature at 07:00 AM is 32.63°C and the maximum solar cell temperature at 12:00 PM is 35.56°C but it is decreased to 29.99°C (see Figure 6). The results have indicated that using silver nanofluid as base fluid, the solar cell efficiency decreased from 12% to 11.16% at 12:00 PM and it increased from 11.46% at 06:00 PM (see Figure 6). The electrical power increased from 07:00 AM to 12:00 PM from 0.07 kW to 0.09 kW and decreased to 0.05 kW as shown in Figure 6. The outlet temperature increased from 20°C to 34°C from 07:00 AM to 12:00 PM and it decreased to a maximum of 29°C at 06:00 PM. The useful heat gains increased from 07:00 AM to 12:00 PM from 22.81 kW to 28 kW and it decreased to 18.04 kW using hourly solar radiation intensity on sunny solar days. The solar cell efficiency, thermal efficiency, outlet temperature of silver nanofluid, solar cell temperature, useful heat gains, and electrical power of photovoltaic thermal collector against different concentrations of nanofluid are given in Table 4.
(a) hourly solar cell temperature variation with hourly solar radiation intensity at a mass flow rate of 0.015kg/s using (Ag/water) nanofluid. (b) Variation of electrical power for each hour at a mass flow rate of 0.015kg/s with hourly solar radiation intensity.
Hourly variation of PV/T thermal collector performance with a concentration of (Ag/water) nanofluid.
Daily simulation results (Ag/water as a working fluid)
The findings of this section are reported in Table 5. Using daily average solar radiation intensity of five different cities with silver/water nanofluid at different concentrations, with a mass flow rate of 0.015 kg/s, the ambient temperature of 20°C and inlet temperature of the water is 20°C, it was found that using 0.1% volumetric concentration of silver/water nanofluid has highest electrical power for Peshawar city but the lowest electrical power for Multan city which is 0.07 kW and 0.07 kW. It has also shown that Peshawar city has high thermal efficiency by using 0.1% volumetric concentration of silver/water nanofluid with daily average solar radiation intensity which is 52.82% but Multan city has lowest thermal efficiency which is 52.79%, The results of outlet temperature of silver/water nanofluid, solar cell efficiency of photovoltaic thermal collector, useful heat gain for the system and total efficiency of the photovoltaic thermal collector for 0.1% volumetric concentration of silver/water nanofluid (Figure 7).
Hourly useful heat gains variation with hourly solar radiation intensity at a mass flow rate of 0.015kg/s using (Ag/water) nanofluid.
Results of performance indicators of a photovoltaic thermal collector using Ag/silver nanofluid as a working fluid for different nanofluid concentration.
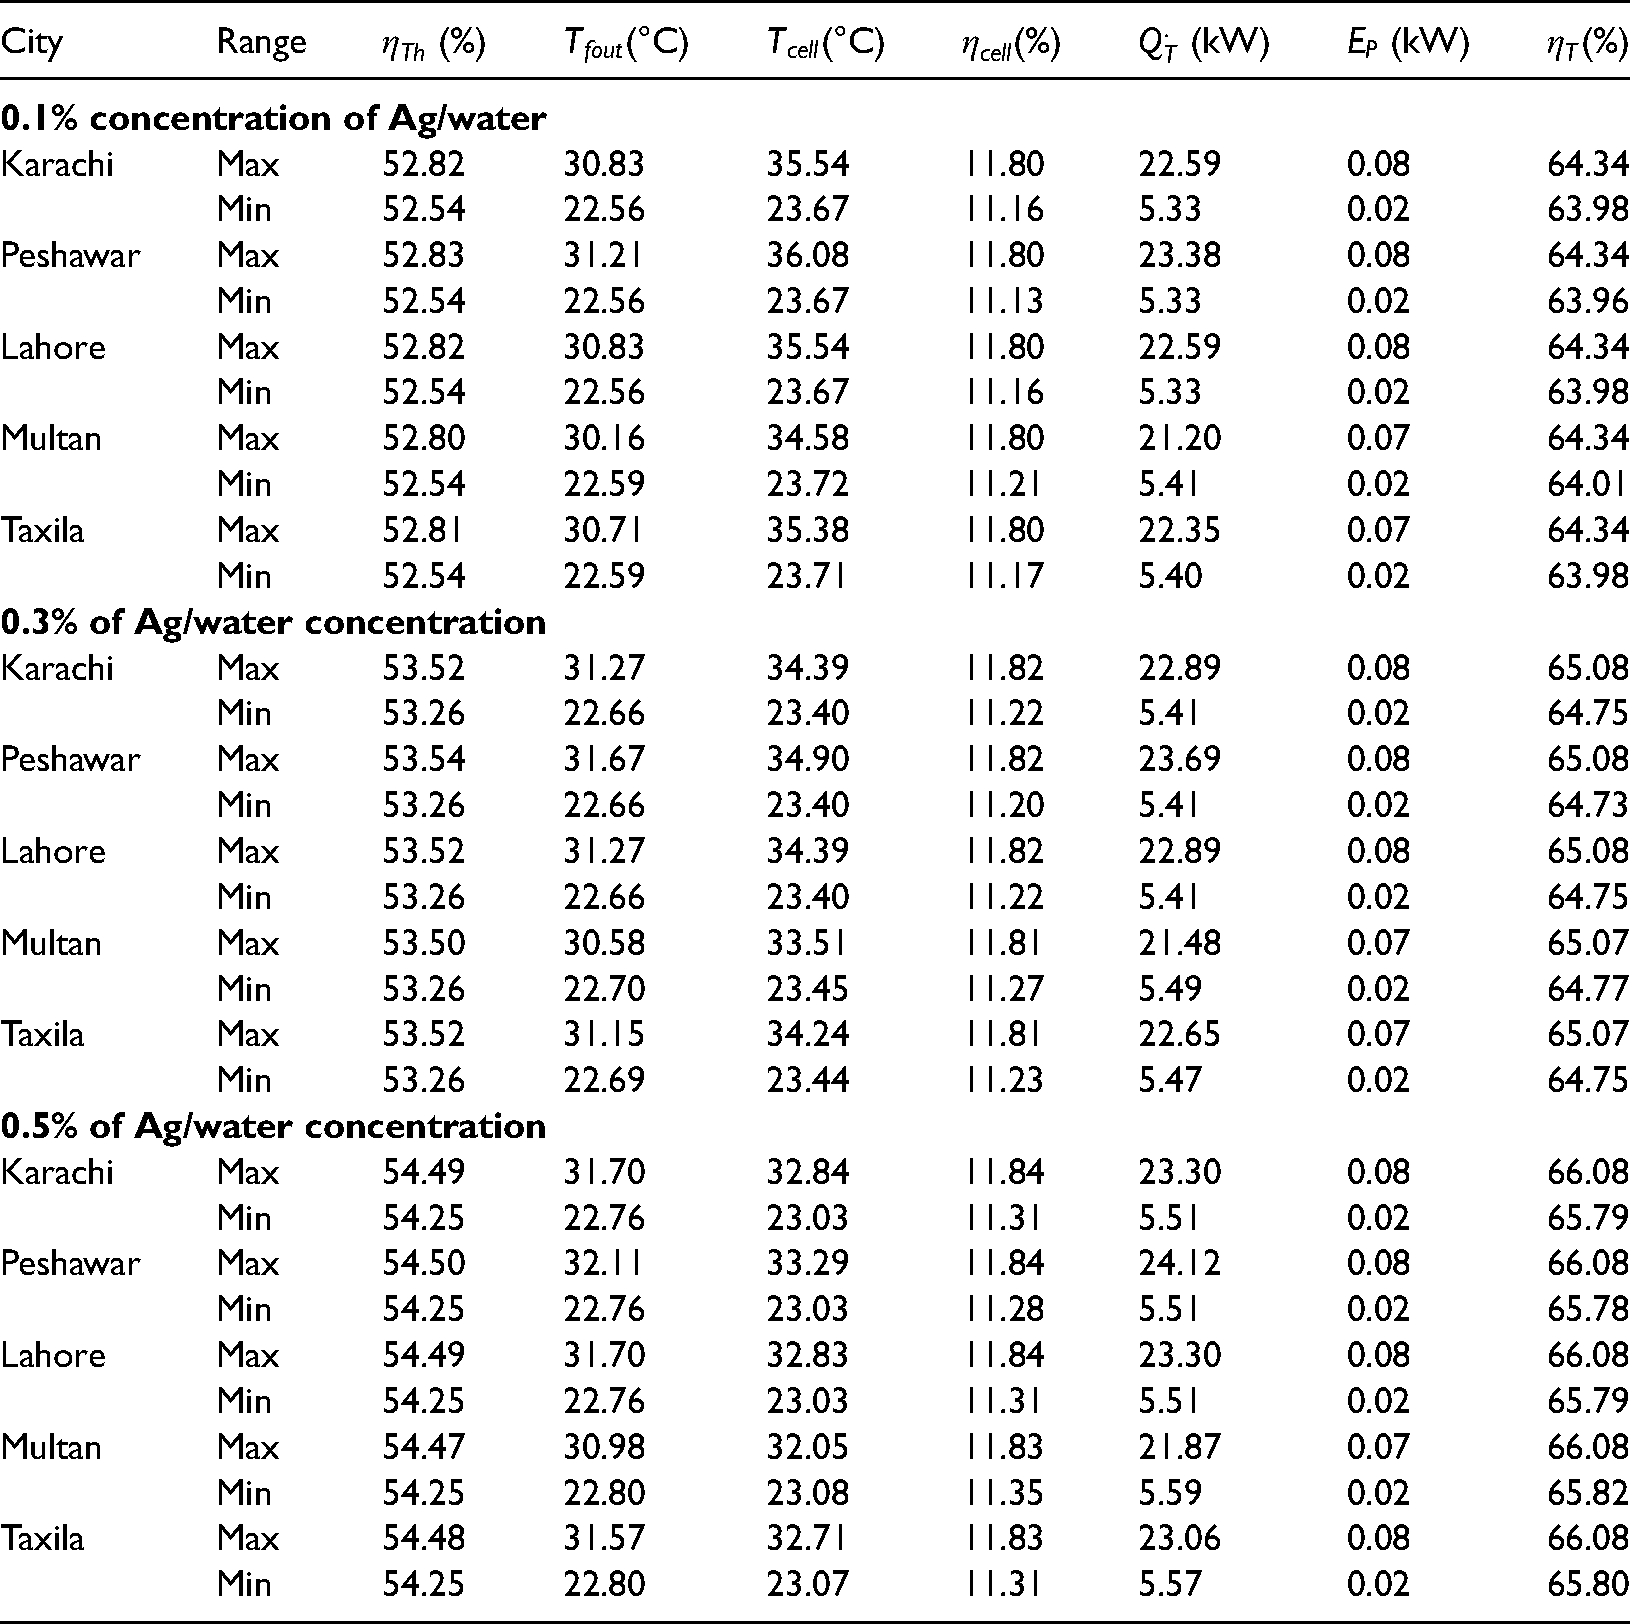
Using 0.3% volumetric concentration of silver/water nanofluid to investigate the performance of photovoltaic thermal collector at a fixed inlet temperature of the fluid and ambient temperature with mass flow rate, it is found that using silver/water nanofluid instead of pure water. The electrical power increased for Peshawar city from 0.01 kW to 0.07 kW, electrical power for Multan city increased from 0.01 kW to 0.07 kW, and the total efficiency of the photovoltaic thermal collector for Karachi city increased from 64.74% to 65.07% respectively as shown in Table 5.
The maximum solar cell efficiency for Karachi, Lahore, Peshawar, Multan, and Taxila city is 11.81%, 11.81%, 11.22%, 11.27%, and 11.81%, respectively. The maximum outlet temperature of nanofluid for 0.3% volumetric concentration of particles for Karachi, Peshawar, Lahore, Multan, and Taxila city is 31.27, 31.66, 31.27, 30.57, and 31.15°C respectively. It is also found that the solar cell temperature increased by using silver/water nanofluid instead of pure water and useful heat also increased for the photovoltaic thermal collector.
Using 0.3% volumetric concentration of silver/water nanofluid to investigate the performance of photovoltaic thermal collector at a fixed inlet temperature of the fluid and ambient temperature with mass flow rate, it is noted that using silver/water nanofluid instead of pure water, the overall performance has increased (see Table 5). The electrical power is increased for Peshawar city from 0.01 kW to 0.07kW, electrical power for Multan city increased from 0.01kW to 0.07 kW, the total efficiency of the photovoltaic thermal collector for Karachi city increased from 64.74% to 65.07%, respectively.
The maximum solar cell efficiency for Karachi, Lahore, Peshawar, Multan, and Taxila city are 11.81%, 11.81%, 11.22%, 11.27%, and 11.81% respectively (see Table 5). The maximum outlet temperature of nanofluid for 0.3% volumetric concentration of particles for Karachi, Peshawar, Lahore, Multan, and Taxila city is 31.27, 31.66, 31.27, 30.57, and 31.15°C respectively. Similar patterns are noted for a particle concentration of 0.5%.
Monthly simulation results (Ag/water as a working fluid)
The findings of this section are reported in Figure 8. It has been found that the outlet temperature of silver/water in Karachi city increased from 26.17°Cto 28.36 °C, the outlet temperature of silver/water for Lahore city increased from 26.22 to 28.49°C, the outlet temperature of silver/water for Peshawar city increased from 27.30 to 28.78°C, the outlet temperature silver/water for Multan city increased from 26.43 to 28.53°C and the outlet temperature of silver/water of Taxila city increased from 25.94 to 28.26°C for the photovoltaic thermal collector. The results have also shown that the total efficiency of a photovoltaic thermal collector using silver/water Nanofluid for Karachi, Lahore, Peshawar, Multan, and Taxila cities increased from 65.86%, 65.86%, 65.85%, 65.86%, and 65.87% to 65.94%, 65.93%, 65.90%, 65.93%, 65.94%, respectively. The solar cell efficiency of photovoltaic thermal collectors for the city of Karachi, Lahore, Peshawar, Multan, and Taxila cities increased from 11.50%,11.49%,11.48%,11.49%, and 11.51% to 11.63%, 11.63%, 11.57%, 11.62%, and 11.65%, respectively. Thermal efficiency of the system increased from 54.30%, 54.30%, 54.33%, 54.31%, and 54.30% to 54.36%, 54.36%, 54.37%, 54.37%, and 54.36% for the city of Karachi, Lahore, Peshawar, Multan, and Taxila, respectively. It is found that using silver/water nanofluid as base fluid, the electrical power increased from 0.04 kW, 0.04 kW, 0.04 kW, 0.04 kW, and 0.03 kW to 0.05 kW, 0.05 kW, 0.05 kW, 0.05 kW, and 0.05 kW for the cities of Karachi, Lahore, Peshawar, Multan, and Taxila, respectively, The numerical study shows that useful heat gains for photovoltaic thermal system increased from 12.29 kW, 12.39 kW, 14.53 kW, 12.82 kW, and 11.84 kW to 16.66,16.92, 17.48, 17 and 16.46 kW. The solar cell temperature of photovoltaic thermal collectors for the city of Karachi, Lahore, Peshawar, Multan, and Taxila is increased from 26.81 °C, 26.86 °C, 28.05 °C, 27.10 °Cand 26.55°C.
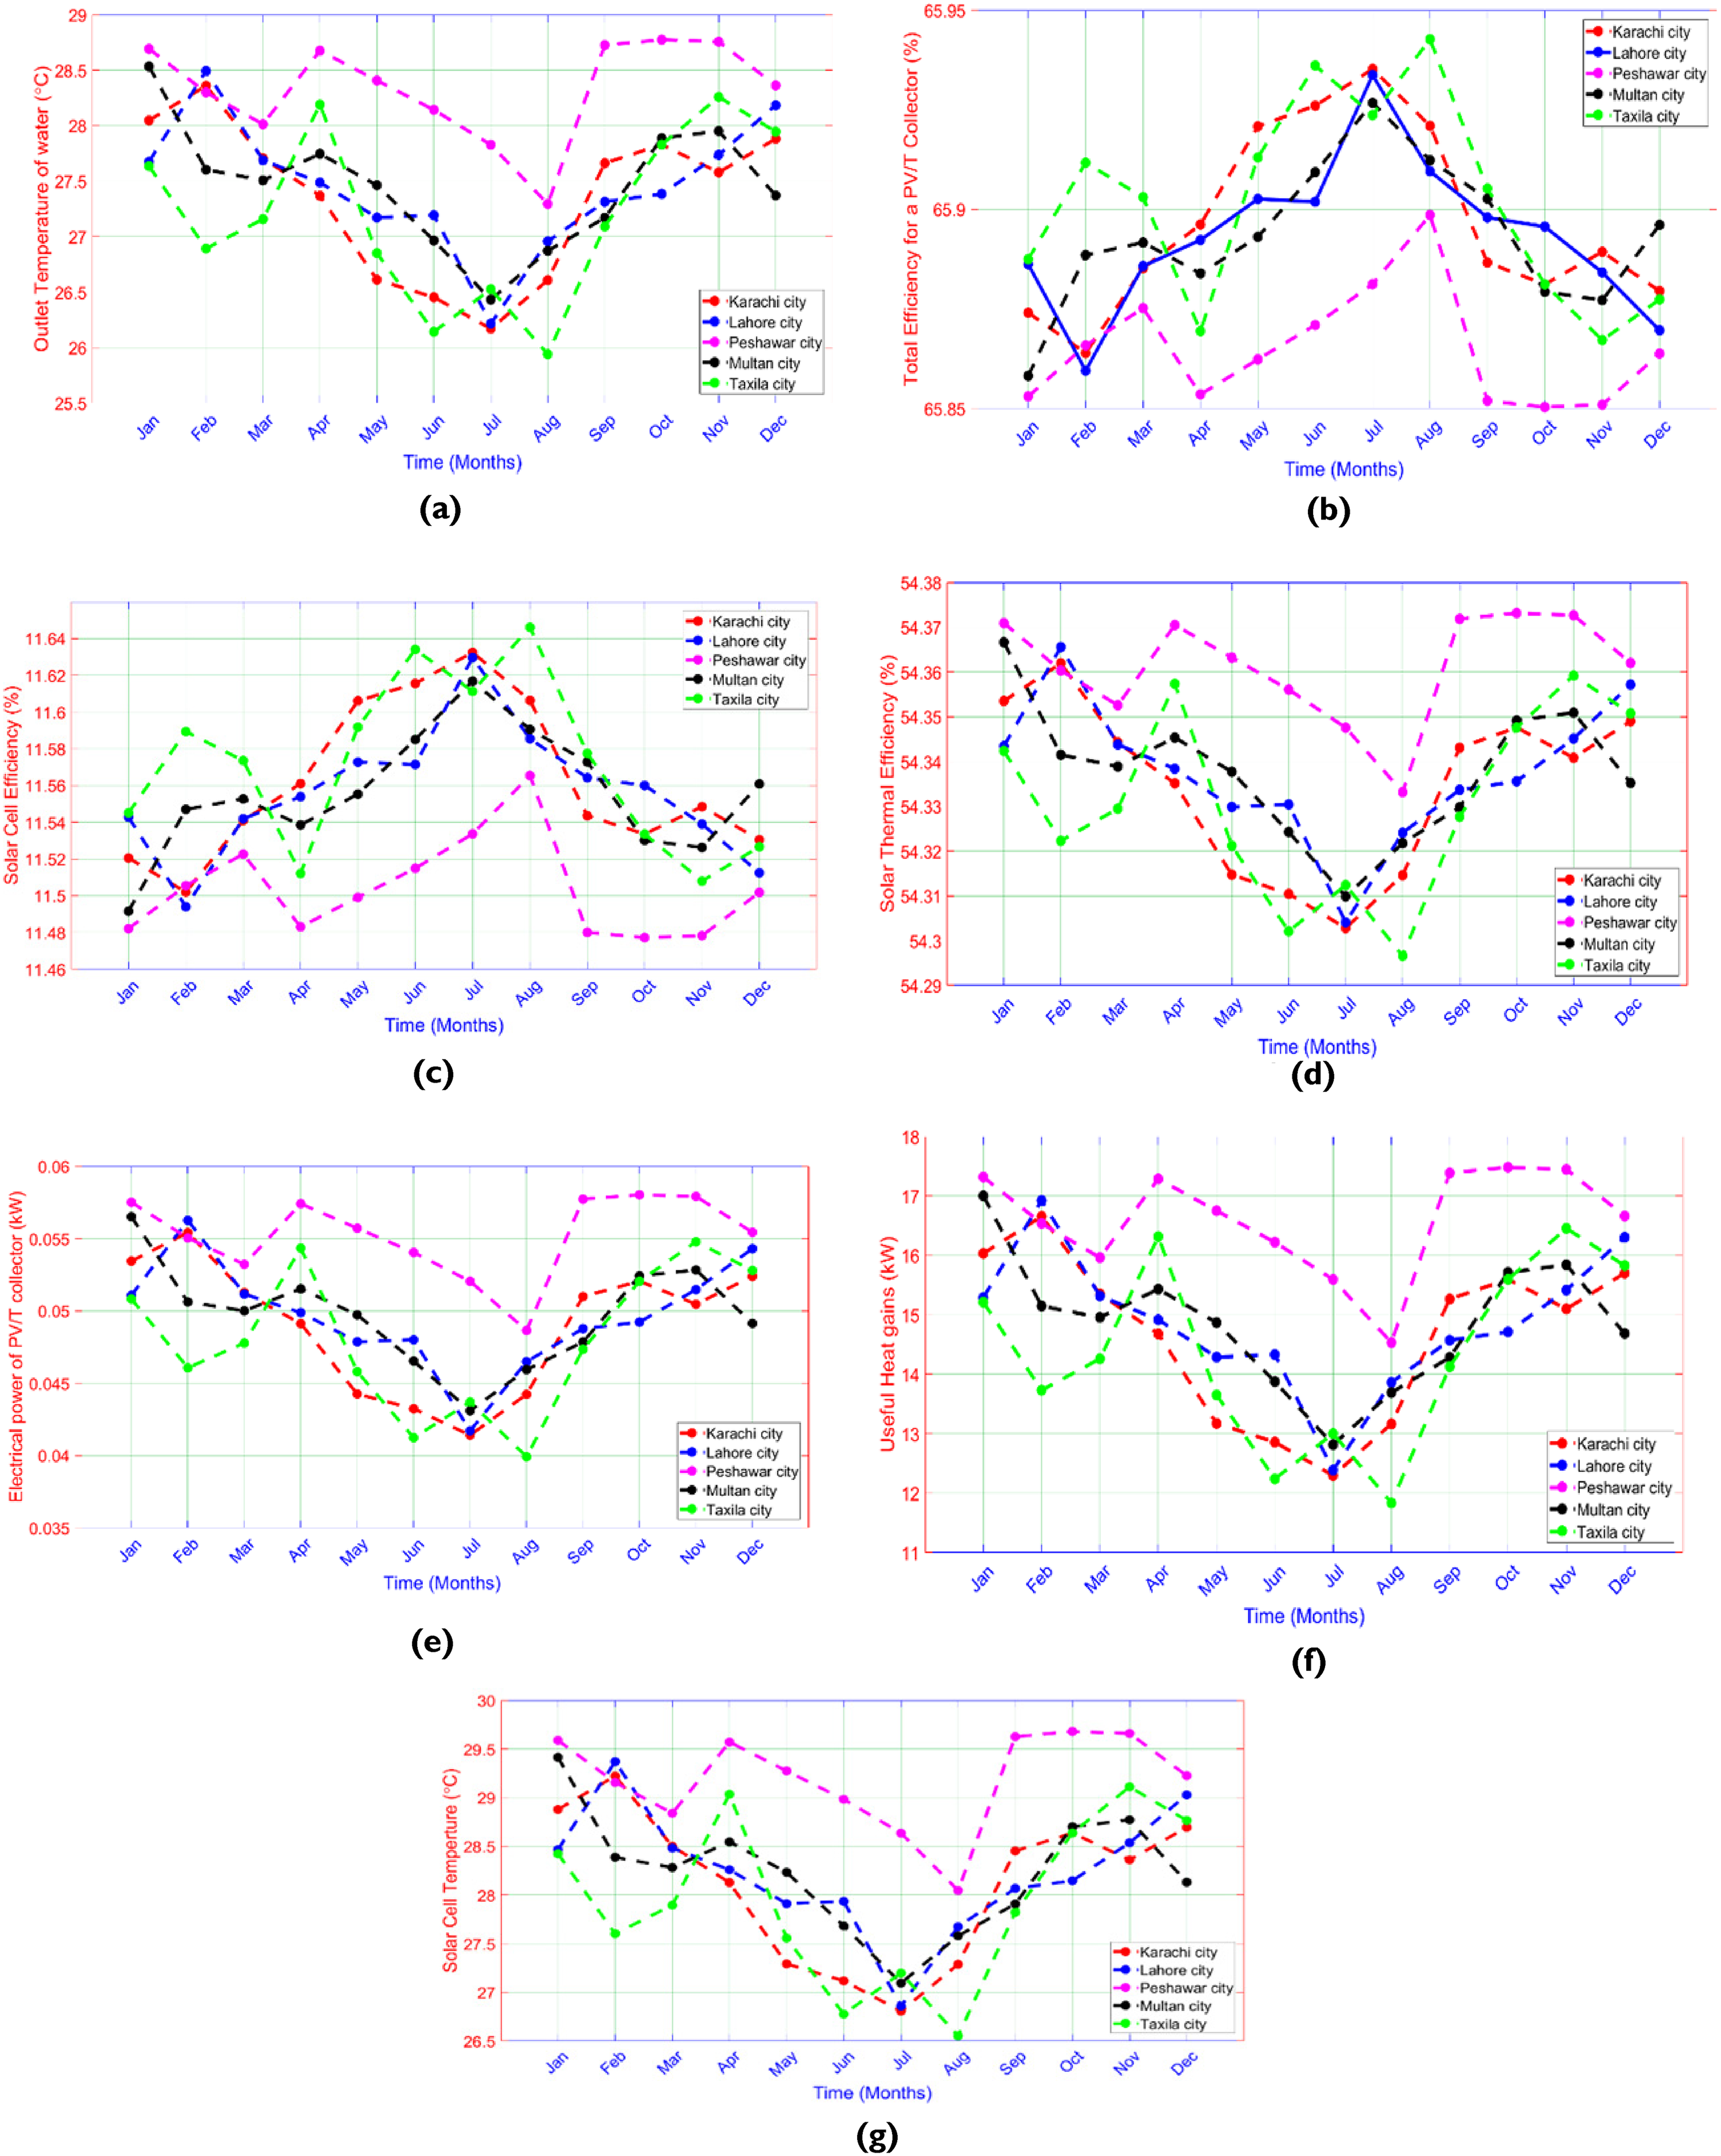
Results of PV/T thermal collector parameters using monthly average solar radiation intensity and (Ag + water) nanofluid as base fluid on (a) outlet temperature of water (b) total efficiency (c) solar cell efficiency (d) useful heat gain (g) solar cell efficiency (e) electrical power (f) thermal efficiency and (g) solar cell temperature.
Comparative assessment of water and Ag/water nanofluid
The comparative assessment is carried out by considering two different working fluids (water and Ag/water nanofluid) to review the performance indicators of the PV/T assembly. The results are reported in Figure 9. The outlet temperature of the fluid increased from 20°C to 23.99°C using water as working fluid but it increased from 20°C to 24.35°C by using Silver nanofluid. The solar cell temperature increased from 23.64 to 36.64 °C using water as working fluid but by using silver nanofluid the solar cell temperature increased from 23.64 to 41.34°C. According to solar cell efficiency the result shows that cell efficiency dropped from 12.51% to 11.56% respectively using water as base fluid but it dropped form dropped from 12.51% to 11.81% by using silver nanofluid as working fluid, the useful heat increased from 1.42kW to 8.34kW using water as working fluid but it increased from 1.35kW to 7.95kW using silver nanofluid as working fluid using a mass flow rate of 0.055kg/s.
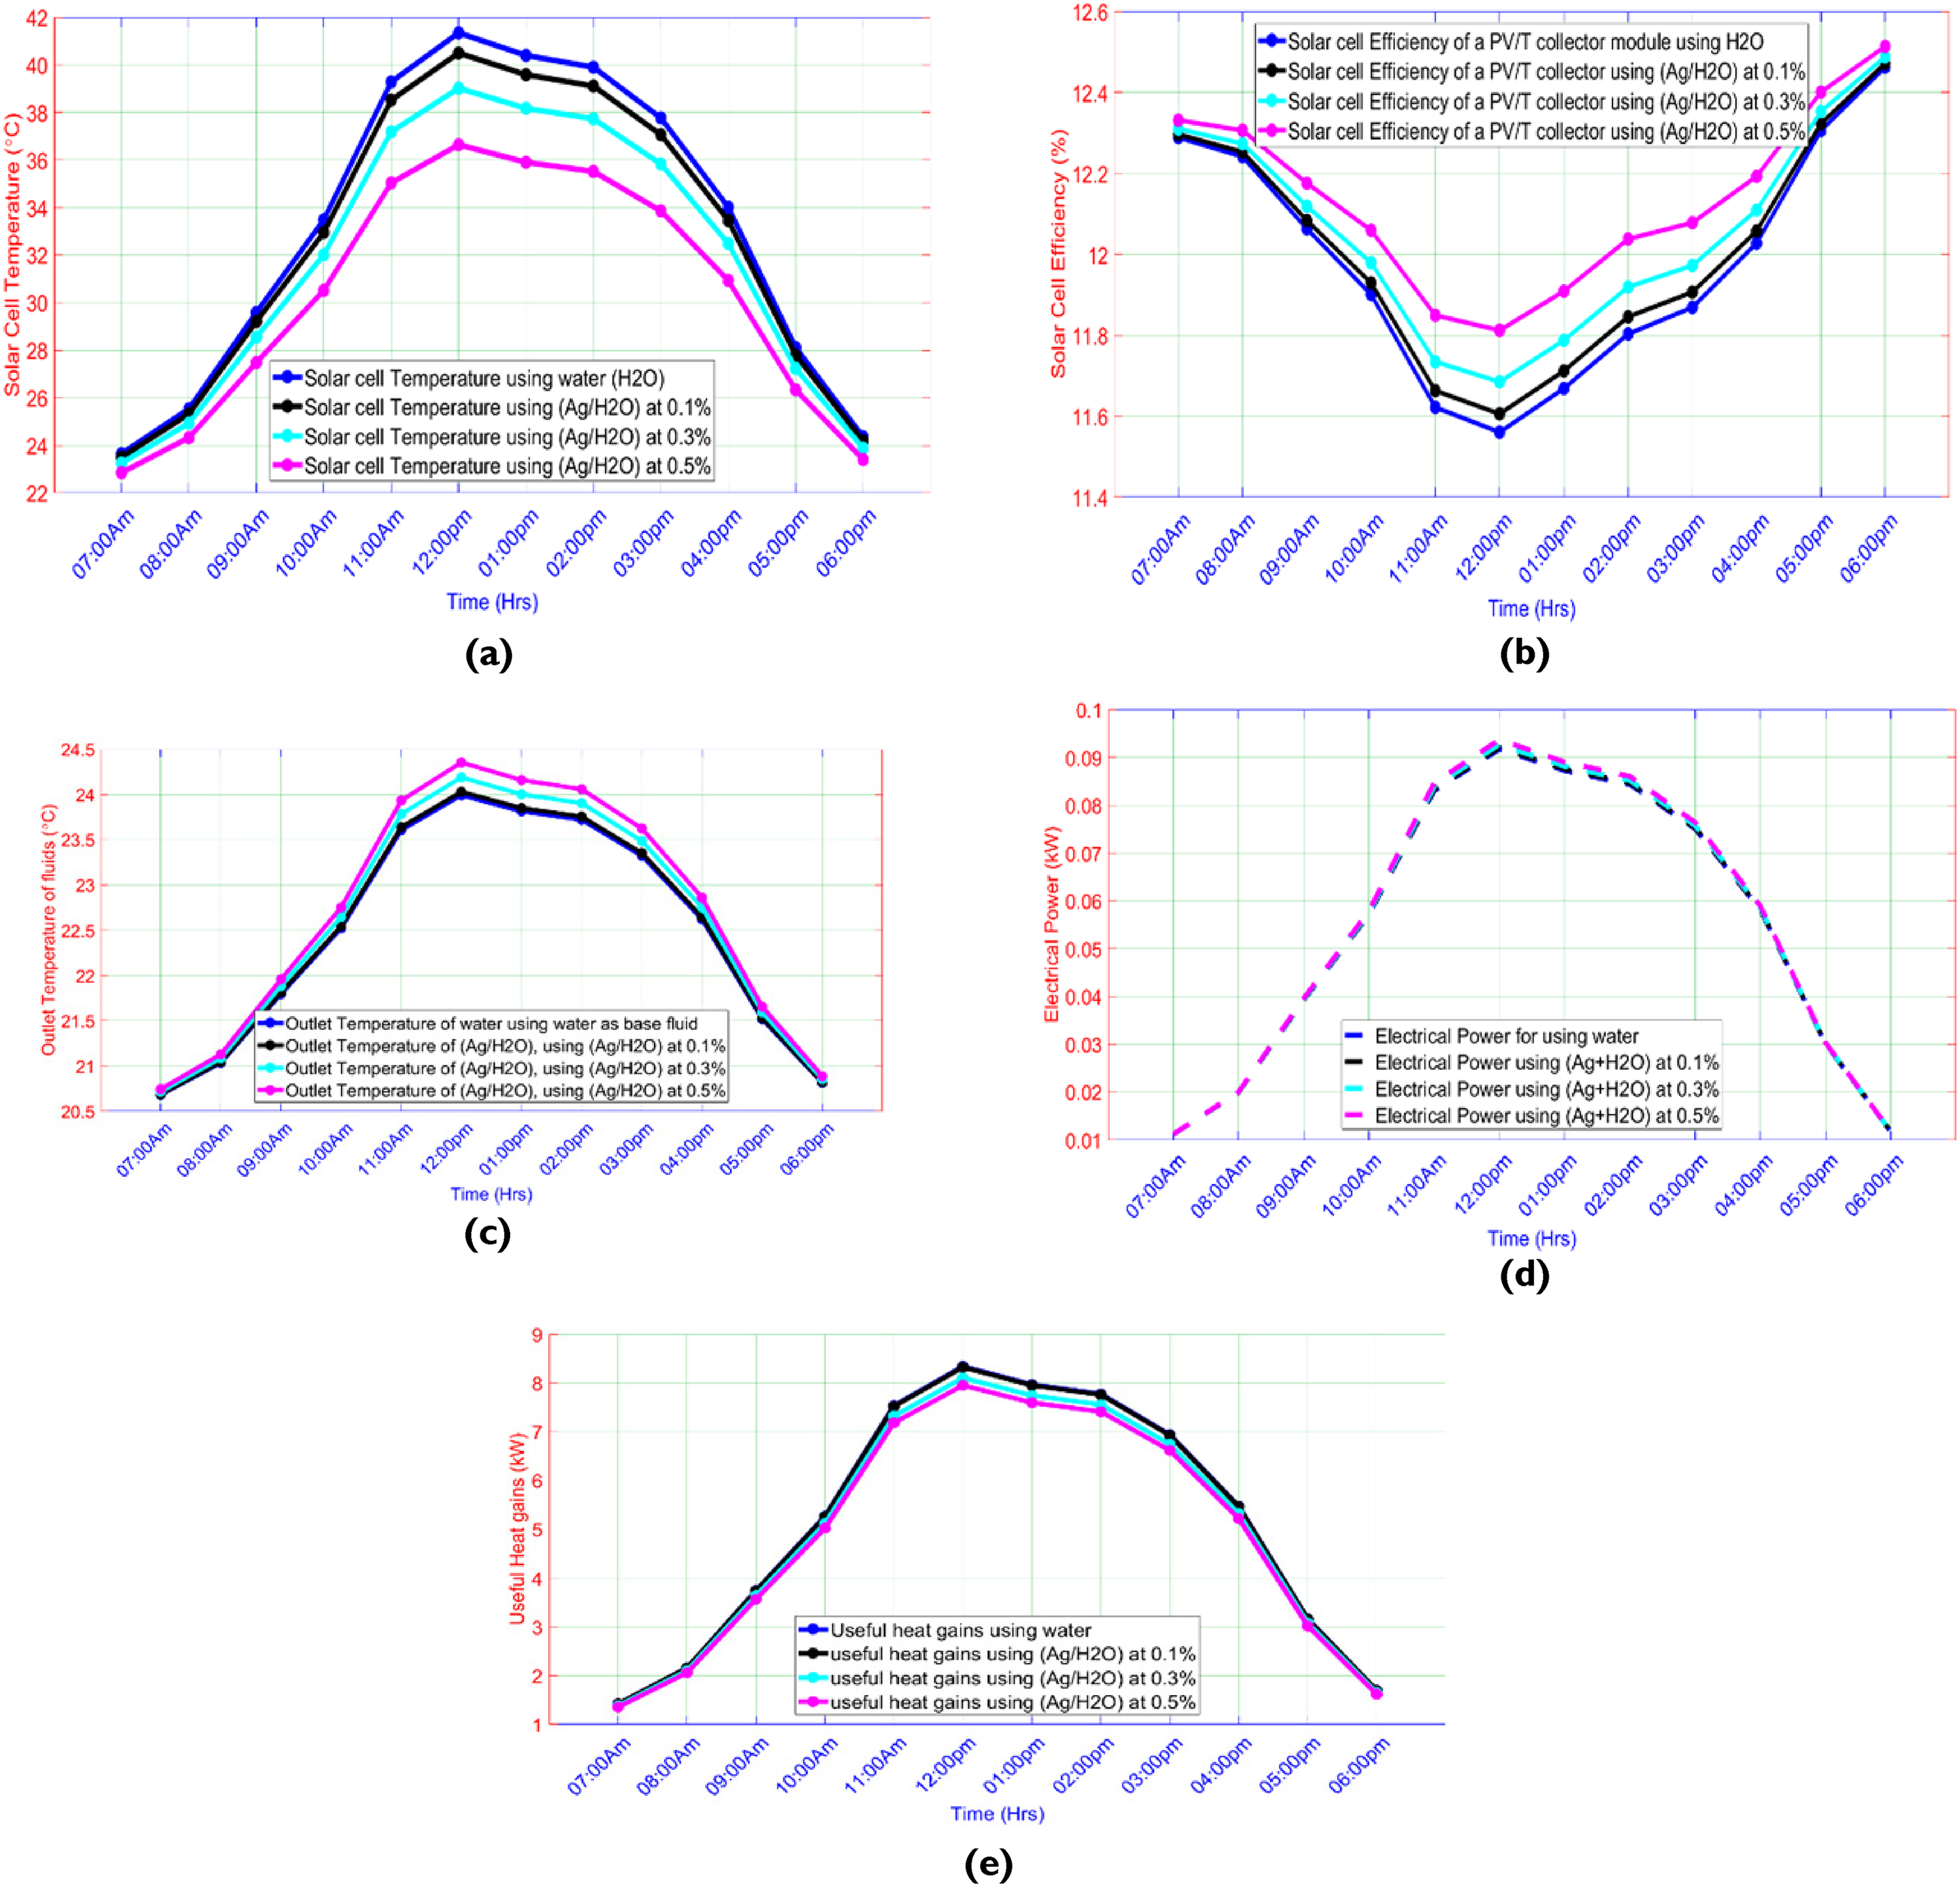
Results of comparative assessment between water and Ag/water working fluids on (a) solar cell temperature, (b) solar cell efficiency, (c) fluid outlet temperature, (d) electrical power, and (e) useful heat gain.
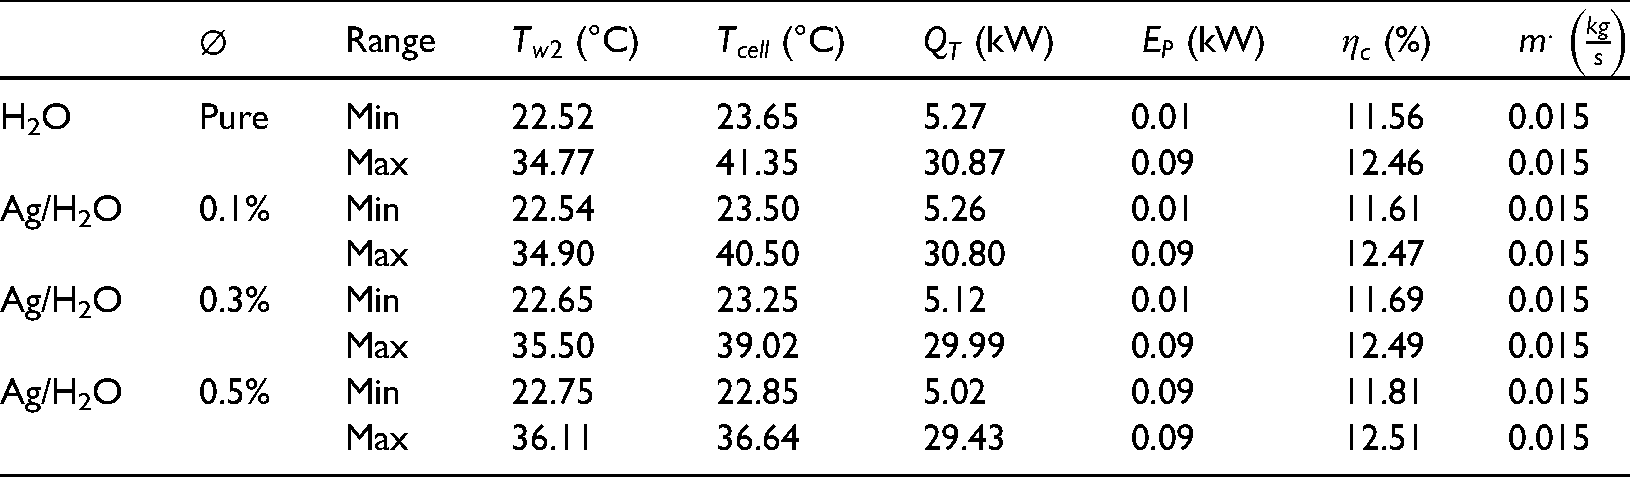
The outlet temperature of the fluid increased from 22.52°C to 34.77°C using water as working fluid but it increased from 22.75°C to 36.10°C by using silver nanofluid. The solar cell temperature increased from 23.64 to 36.64 °C using water as working fluid but by using silver nanofluid the solar cell temperature increased from 23.65 to 41.35°C. According to solar cell efficiency the result shows that cell efficiency dropped from 12.46% to 11.56% respectively using water as base fluid but it dropped form dropped from 12.51% to 11.81% by using silver nanofluid as working fluid, the useful heat increased from 1.42 kW to 8.34 kW using water as working fluid but it increased from 5.03kW to 29.43kW using silver nanofluid as working fluid using a mass flow rate of 0.015kg/s and Table 6.
Variation of parameters using nanofluid and water at different volumetric concentrations and mass flow rates.
Sensitivity of nanofluid’s mass flow rate and concentration on the performance indicators: Case for Peshawar city
In this section, sensitivity analysis of nanofluid's mass flow rate and concentration on the performance indicators for the case of Peshawar city are reported. The findings are displayed in Table 7. The solar cell temperature of the photovoltaic thermal collector is decreased from 32.34°C to 30.25°C for water but it is reduced from 29.63 to 28.01°C when different volumetric concentrations of (Ag/water) nanofluid are considered. The solar cell efficiency of the photovoltaic thermal collector increased from 11.33% to 11.44% when water is used as the base fluid. The result shows that for (Ag/water) nanofluid, the solar cell efficiency increased from 11.48% to 11.56%. The useful heat gains increased from 13.94 kW to 16.70 kW when water is used as the base fluid, but this useful heat gain increased from 13.94 to 17.49 kW when Ag/water nanofluid is used at a mass flow rate of 0.015kg/s.
Variation of parameters using nanofluid with different volumetric concentrations and mass flow rates.
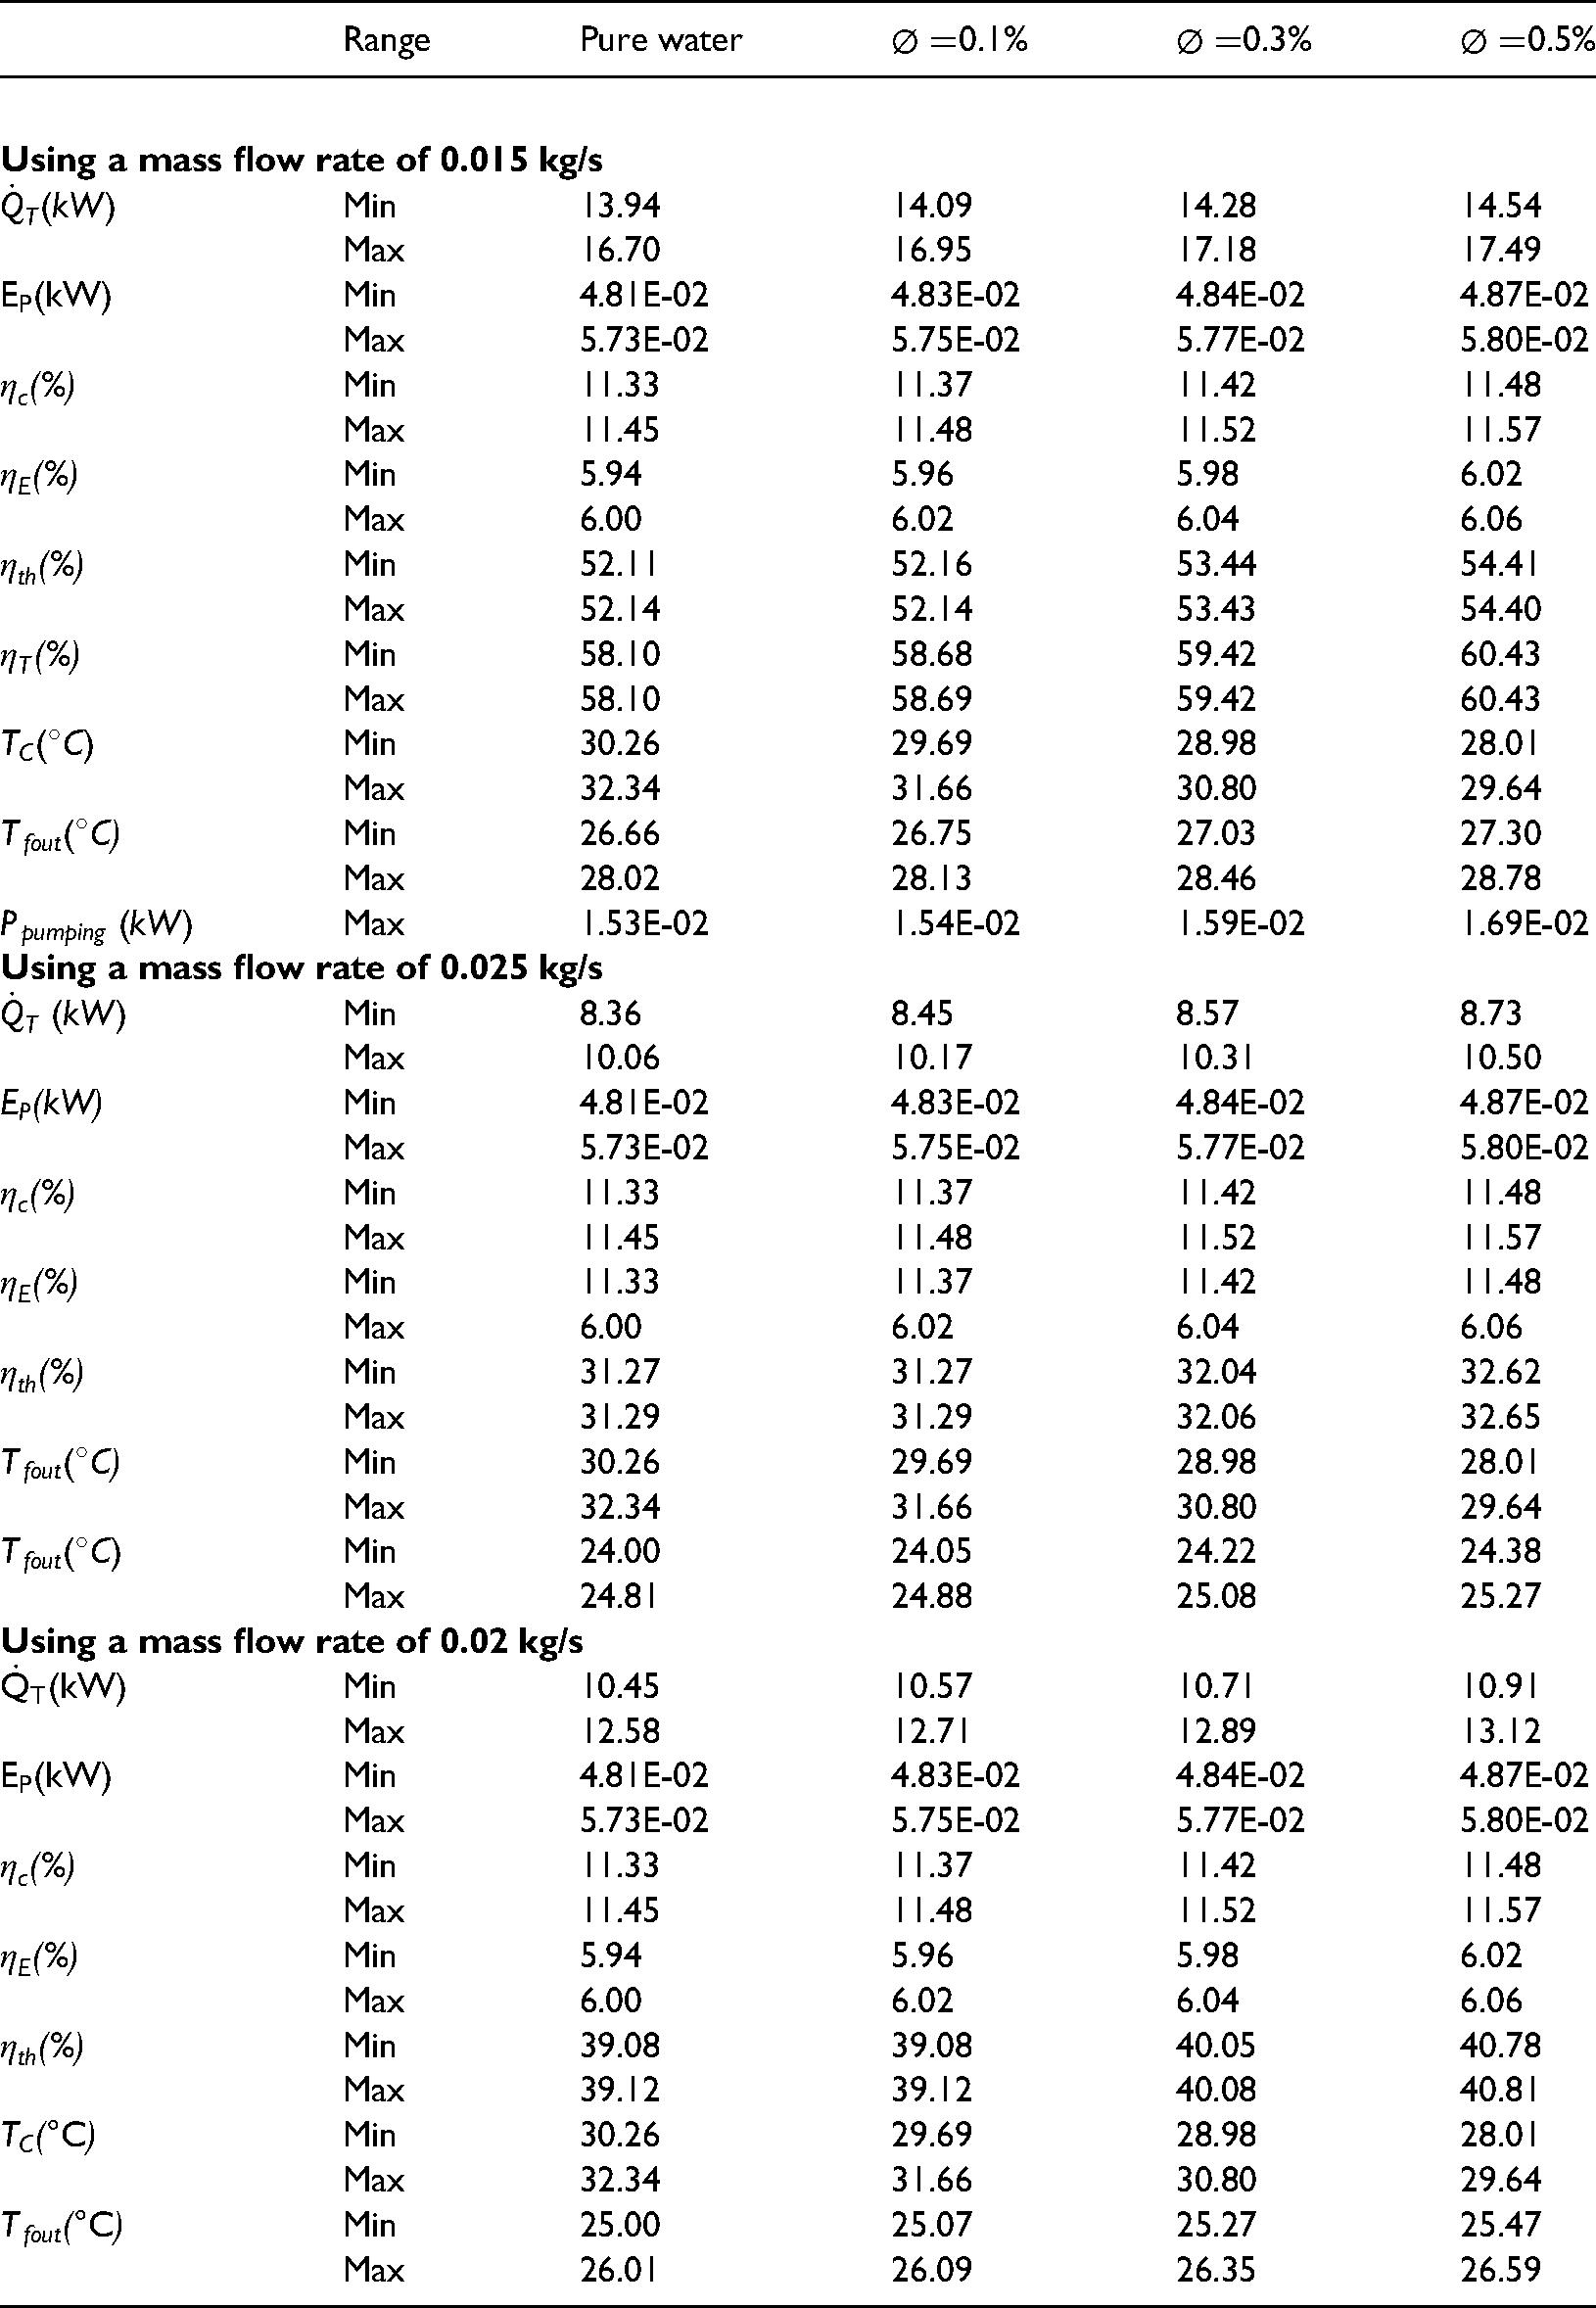
Useful heat gain is increased from 8.36 kW to 10.49 kW at a mass flow rate of 0.025kg/s and base fluid of Ag/water nanofluid, result shows that useful heat gains increased from 10.45 kW to13.12 kW at a mass flow rate of 0.025kg/s for the same Ag/water working fluid. The overall efficiency of the photovoltaic thermal collector increased from 58.10% to 60.43% at a mass flow rate of 0.015kg/s for Ag/water working fluid, but for a mass flow rate of 0.025kg/s overall efficiency of photovoltaic thermal collector 45.05% to 46.84% respectively. The thermal energy efficiency of the photovoltaic thermal collector increased from 52.01% to 54.40% at a mass flow rate of 0.015kg/s, it is also found that thermal energy efficiency increased from 31.26% to 38.66% at a mass flow rate of 0.025kg/s and it increased from 39.08% to 40.80% at a mass flow rate of 0.02kg/s, respectively as shown in Table 7.
Sensitivity of nanofluid characteristics on the pumping and net power
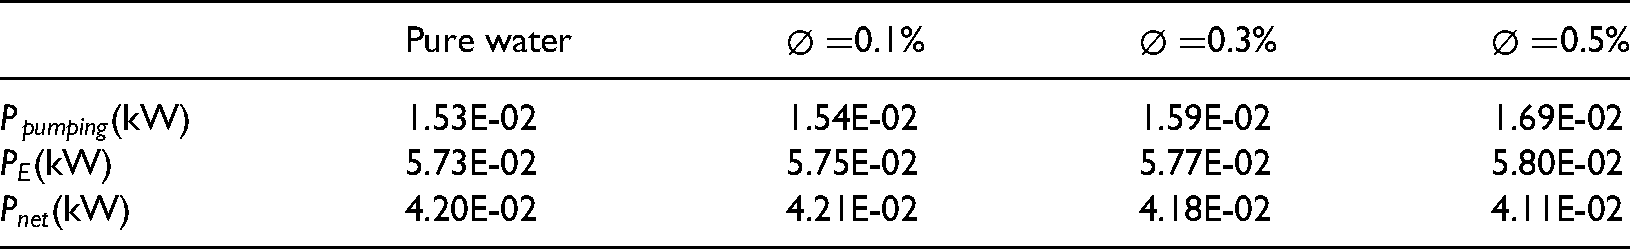
Power consummation is required in order to know whether the system is useful or not for this purpose we investigate the consumption of pumping power, using (Eqs. (20), (21), and (22)) to investigate pumping power requirements for different volumetric concentrations of (Ag/water) nanofluid. After pumping power consumption, it is important to know the system is useful or not we need to find net useful electrical power so for this purpose we need to use Eq. (23), the result shows that pumping power consummation for water is 1.53E-02 kW but it increased from 1.50E-02 kW to 1.60E-02 kW for different concentrations of (A/g/water) nanofluid, It is also investigated that electrical power is generated in photovoltaic thermal collector about to 5.70E-02 kW for water base fluid but it increased to 5.80E-02 kW for different concentrations of Ag/water, After consummation of pumping power, the system net useful power is about 4.20E-02 kW when water is used as base fluid but it decreased to 4.10E-02 kW as shown in Table 8.
Variation of pumping power, electrical and net electrical power with (Ag/water) volumetric concentration, and mass flow rate (0.015kg/s).
Conclusion
A numerical model is studied for cooling of a PV/T thermal collector which can produce both electrical energy and thermal energy efficiency. Here we have used both working fluids such as water and Ag/water nanofluid and studied the calculation and improvement of the performance of a PV/T thermal collector and also the required pumping power. Both cooling mediums were used in this research, and it is found that a large amount of solar cell temperature can be reduced by using Ag/water nanofluid with different concentrations instead of pure water and increase both a solar cell and thermal efficiency of a hybrid PV/T thermal collector.
Using Ag/water nanofluid with high concentration Nanofluid can increase the level of useful heat gain along with increasing photovoltaic power. Using Ag/water nanofluid working fluid instead of pure water can reduce the level of wasting water level in some areas where it faces drinking water shortage currently such as Karachi and Baluchistan where it has a high level of solar radiation capability, and it is the main source of Pakistan economy. Using Ag/water nanofluid at a mass flow rate of 0.015kg/s the maximum useful heat gain is 16.36 kW at a monthly average solar radiation intensity of Karachi city which is a high amount of heat energy for daily purposes, using a mass flow rate of 0.02kg/s the useful heat gain is 12.27 kW while using a mass flow rate of 0.025kg/s and at a mass flow rate of 0.03kg/s the amount of useful heat gain is about to 9.82 and 8.18 kW respectively. Using monthly average solar radiation intensity of Peshawar city with different concentrations of Ag/water nanofluid can achieve the highest level of useful heat gain among all five cities which is selected in this research as climate conditions, the amount of useful heat produced from 17.49 to 16.7 kW respectively. It is observed that both thermal and electrical performance of photovoltaic thermal collector improves using Ag/water nanofluid instead of pure water as discussed in the result and discussion chapter. It is also observed that the access viability of a PV/T thermal collector for other similar locations in the global climate such as the Pakistan climate condition is suitable. The proposed model and methodology can be used as a base model for an extensive digital twin (Tariq et al., 2020; Tariq et al., 2021a).
Footnotes
Acknowledgment
The author, Rasikh Tariq, is thankful for the financial support granted by Consejo Nacional de Ciencia y Tecnología (CONACYT) under the following details: CVU no. 949314, scholarship no: 784785, and programme: Becas Nacionales para Estudios de Posgrado, to pursue a postgraduate degree, Doctorate in Engineering (option: Renewable Energy) Doctorado en Ingeniería (opción: Energías Renovables), in Facultad de Ingeniería, Universidad Autónoma de Yucatán, Mexico.
Declaration of conflicting interests
The author(s) declared no potential conflicts of interest with respect to the research, authorship, and/or publication of this article.
Funding
The author(s) received no financial support for the research, authorship, and/or publication of this article.
Appendix A: validation of the mathematical model
(Shan et al., 2013) constructed a mathematical model for photovoltaic/ thermal collectors using water as base fluid and used energy balance equations to evaluate the performance of photovoltaic thermal collectors. The validation of this model is conducted through a comparison with this study. The model results are compared with the finding of (Shan et al., 2013), which includes both numerical simulations along with benchmarking with experimental datasets. In essence, the model was compared with the results of referred published data which is duly validated.
For this purpose, the required relative physical parameters and the design parameters of (Shan et al., 2013) are reported in Table A. I and Table A. II. Similarly, Fig. S1(a) reports the solar data of (Shan et al., 2013) which is used for the regeneration of the simulation model. It is noted that the solar radiation intensity is increased from 07:00 AM to 12:00 PM and decreases from 12:00 PM to 06:00 PM on a sunny summer day. The ambient temperature increased from 07:00 AM to 1:00 PM and decreases from 1:00 PM to 06:00 PM.
(Shan et al., 2013) constructed a numerical model by using energy balance equations to study the effect of mass flow rate, the inlet temperature of the water, and a number of photovoltaic modules on the performance of thermal efficiency, electrical energy efficiency, the outlet temperature of the water, and solar cell temperature of the PV/T module. In our research, we also studied the numerical model of a PV/T thermal collector by using pure water and water/silver nanofluid as working fluid to find the outlet temperature of the water, solar cell temperature, and other parameters for a PV/T thermal collector. The influence of (Ag/water) Nanofluid and mass flow rate on the performance of photovoltaic thermal collectors such as outlet temperature of Nanofluid, thermal efficiency, electrical efficiency useful heat gain, electrical power, and pumping power. According to (Shan et al., 2013), the numerical study outlet temperature of the water is from 20.47 to 24°C with the variation of solar radiation intensity and ambient temperature, in our research the outlet temperature of the water is increased from 20.68 to 23.99°C by using the same inlet temperature, ambient temperature and solar radiation which is given in Fig. S1(b).
Solar cell temperature in this research increased from 23.6 to 41.4°C but in the case of the findings of (Shan et al., 2013), it is increased from 22.5 °C to 42.5°C. Useful heat gains increased from 1.43 kW to 8.32 kW but in the case of the findings of (Shan et al., 2013), it is increased from 0.90 kW to 8.32 kW. Solar cell efficiency is increased from 11.81% to 12.52% in this research but in the case of the findings of (Shan et al., 2013), it is increased from 11.54% to 12.35%. Consequently, a comparison between these indicators is summarized in Table A. III.