
Abstract
Quantifying residual oil saturation (SOR) in the inter-well region of oil and gas reservoirs is key for successfully implementing EOR solutions. Partitioning inter-well tracer tests (PITTs) has become a common method for quantifying SOR. A new group of seven chemicals – pyridine, 2,3-dimethyl pyrazine, 2,6-dimethyl pyrazine, 4-methoxybenzyl alcohol, 3,4-dimethoxybenzyl alcohol, 4-chlorobenzyl alcohol, and 2,6-dichlorobenzyl alcohol – have been proposed as potential partitioning tracers for quantifying SOR. Using these tracers can lead to their environmental release in the marine environment through produced water discharges, with currently limited knowledge on impacts in the marine ecosystem. The primary objective of the present study is to assess the environmental risk of discharging the tracer compounds in the marine environment. We investigated the fate and effect of these tracers in the marine environment. Biodegradability in seawater was measured to understand the fate of tracers in the marine environment. The acute toxicity of tracers was measured in terms of the percent cell viability of a rainbow trout gill cell line (RTgill-W1) and growth inhibition of the algae Skeletonema costatum. The ecotoxicological information obtained from these experiments was used in the dynamic risk and effects assessment model (DREAM) to calculate the tracers’ contribution to the environmental impact factor (EIF). The results from the DREAM simulations suggest no contribution towards EIF values from any of the tracers at the expected back-produced concentrations. Results from simulations at higher concentrations suggest that both pyrazines have the lowest environmental risk, followed by 3,4-dimethoxybenzyl alcohol, 4-methoxybenzyl alcohol, and pyridine; while both chlorobenzyl alcohols show the highest environmental risk.
Keywords
Introduction
The implementation of enhanced oil recovery (EOR) solutions is essential for continued oil production from existing oil and gas reservoirs (Smalley et al., 2018; Wever et al., 2011). Quantifying residual oil saturation (SOR) in the inter-well region of oil and gas reservoirs is key for successfully implementing EOR solutions (Sanni et al., 2018). First introduced by Cooke (1971), the use of oil-water partitioning tracers in partitioning inter-well tracer tests (PITTs) has become a common method for quantifying SOR (Cooke, 1971; Tang & Harker, 1991; Viig et al., 2013).
In a recent study, seven chemical compounds from three chemical families (benzyl alcohols, pyrazines, pyridines) were shortlisted for their potential use as oil-water partitioning tracers in PITTs (Silva et al., 2018, 2019, 2021a, 2021b). The use of tracers in PITTs from offshore installations usually results in their operational (e.g. with produced water) discharges in the marine environment. If discharged into the sea, the tracer compounds may pose an environmental risk to the marine ecosystem. (Beyer et al., 2020; Sanni et al., 2017b). The three important parameters for assessing the environmental risk of any chemical compound in seawater are the octanol-water coefficient, biodegradation potential, and toxicity of the compound (Oslo and Paris Commission (OSPAR), 2012). The octanol-water coefficient values were available from the literature for all seven tracers (Silva et al., 2018, 2019, 2021a, 2021b). However, the biodegradability and toxicity data for most of the tracers considered in the current study are not available. The potential tracer compounds to be used for offshore application are shortlisted based on their ability to remain stable at high reservoir temperature, pressure, and salinity (Silva et al., 2019). Considering their stability at extreme reservoir conditions, further research to understand the biodegradation potential and toxicity become especially important from environmental risk assessment and regulatory perspectives.
The primary objective of the current study is to generate key data i.e., biodegradability and toxicity of newly shortlisted tracer compounds. Once these key data are available, the environmental risk of these compounds can be estimated for operational as well as accidental releases into the sea. The secondary objective is to compare the environmental risk of seven tracer compounds and, subsequently, rank them to give insights regarding the compounds that are more environmentally friendly than others. Although the accidental releases will presumably have a higher environmental impact due to the release of pure substance, the probability of such an event is assumingly low compared to the operational discharges of tracers along with produced water. Moreover, the ranking of these compounds in terms of environmental risk concluded from operational release would remain the same for the same amount of accidental release. Therefore, we mainly focus on estimating the environmental risk from operational discharges of the tracer compounds in the marine environment.
The environmental risk was evaluated based on the data obtained from laboratory experiments and simulation modelling of environmental fate and impact upon release in a known produced water discharge on the Norwegian Continental Shelf (NCS). A modelling tool called dynamic risk and effects assessment model (DREAM) was used to simulate the produced water discharges for assessing the environmental risk of tracers in the marine environment (Reed & Hetland, 2002; Johnsen & Frost, 2011). The environmental risk in the DREAM model is expressed in terms of the environmental impact factor (EIF). EIF is a specified volume of water where the ratio of environmental concentration to no-effect concentration for a particular chemical is greater than 1, thereby posing an environmental risk to the ecosystem. Other chemicals used in similar offshore applications are proven to contribute to EIF values and pose unacceptable environmental risks to the marine environment (Beyer et al., 2020; Johnsen & Frost, 2011).
To assess environmental risk, the toxicity of chemicals in the produced water is usually measured according to the standard methods suggested by European Chemical Agency (ECHA) and the OSPAR Commission (ECHA, 2008b; OSPAR, 2021). In this study, to strengthen the ERA results, a combination of standard laboratory test methods and an alternative method was chosen to measure the toxicity of tracers. A standard method for measuring toxicity to algae-Skeletonema costatum as recommended by the OSPAR commission was chosen as one of the methods. Along with this, a recently introduced method for measuring the acute toxicity of pollutants to fish gill cell lines was included in the study (Dayeh et al., 2013). The chemicals in the produced water are at present not normally tested for toxicity using fish gill cell lines. Therefore, the combined results from these two methods will help in understanding the variation in the toxicity of tracers to two different species and thereby strengthening the basis and results for ERA.
We conducted three sets of experiments to measure the biodegradability and toxicity values of seven tracer compounds. The first set of experiments was conducted to measure the biodegradability of tracers in seawater following Organization for Economic Co-operation and Development (OECD) guidelines (OECD, 1992). These experiments were aimed to understand the fate and exposure of tracer compounds once discharged into seawater. The second set of experiments was conducted to measure the acute toxicity of tracers in a rainbow trout gill cell line (RTgill-W1) (Dayeh et al., 2013). In this study, the cellular function of RTgill-W1 cells exposed to tracers was evaluated using Alamar Blue as an indicator dye. The third set of experiments was conducted to measure the growth inhibition of the algae Skeletonema costatum when exposed to tracers following the guideline from ISO 10253 (ISO 10253, 2016). Finally, the ecotoxicological information obtained from these experiments was used in a numerical dispersion and environmental risk assessment model to quantify the environmental impact related to operational discharges of the tracers compounds in the marine environment (Reed & Hetland, 2002).
Materials and methods
Chemicals and reagents
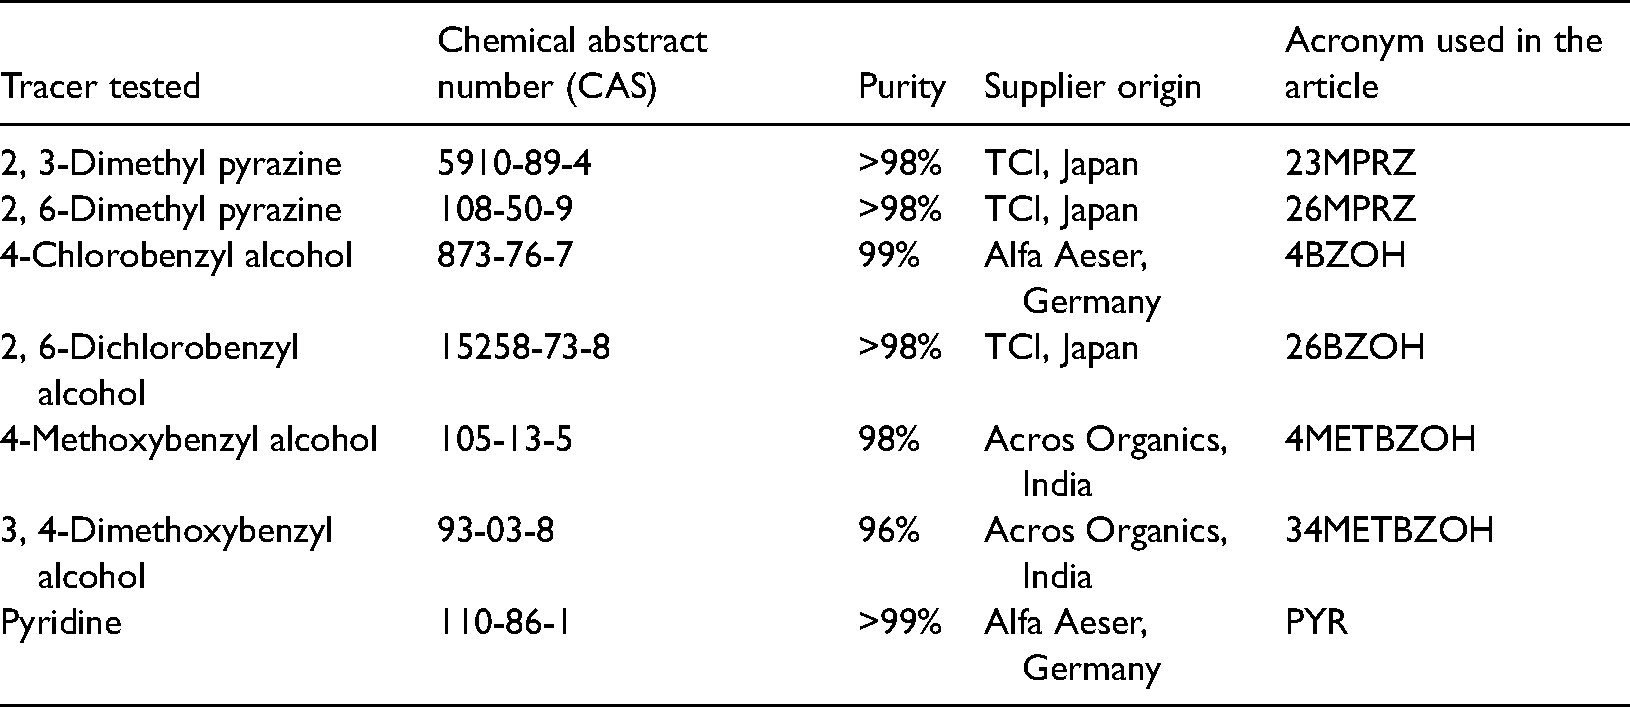
In this study, seven chemicals shortlisted as potential tracers are tested for their biodegradability and acute toxicity (Table 1). The following are chemicals and reagents used in the biodegradability studies: Aniline (CAS: 62-53-3), sodium acetate (CAS: 127-09-3), and other chemicals used to make the nutrient stock solution as prescribed in OECD 306 guidelines. For cytotoxicity studies, these were as follows: Leibovitz's L-15 Medium (catalog number-11415064) supplied by ThermoFisher scientific; Fetal bovine serum (FBS) supplied by Biowest, France; Penicillin Streptomycin & Phosphate buffered saline (PBS) supplied by Life Technologies; trypsin-EDTA and hydrogen peroxide supplied by Merck-Norway; Alamar Blue (resazurin) supplied by Alfa Aeser-Germany; and Dimethyl sulfoxide (DMSO, CAS: 67-68-5) supplied by AppliChem GmbH, Germany. For algae growth inhibition experiments, the stock solution for Z8 growth medium was supplied by the Norwegian institute of water research – Norway, and CO2 was supplied by Nippon Gases-Norway.
List of tracers tested in this study.
Biodegradability experiments
The biodegradation of tracers in seawater was measured using a closed bottle method following OECD-306 test guidelines (OECD, 1992). In a closed bottle method, a pre-determined amount of test substance is dissolved in the test medium, and the consumption of dissolved oxygen (DO) is monitored over 28 days. A total of 8 closed bottles were used for each tracer compound and DO was measured on days 0, 5, 15 and 28 (i.e. duplicates for each day). Different sets of bottles were used each day to avoid the issue of possible oxygen loss during the measurement. A set of 8 blank bottles with no test substance were included to determine the oxygen demand of seawater alone. The difference in oxygen depletion between blank and test substances is then compared with the theoretical oxygen demand (ThOD) of the test substance to determine the biodegradation potential of the test substance. The amount of test substance added in each bottle was calculated based on the theoretical oxygen demand of 50% of the oxygen available in the test medium on day zero. This was done to avoid oxygen being a limiting factor for biodegradation. Seawater was collected at an 80 m depth in Byfjorden (59.03 °N, 5.63 °E) and then aged at room temperature for 4-5 days to overcome the high uptake value of dissolved oxygen in the blank bottle over 28 days. The test medium was prepared by adding 1 milliliter (ml) of mineral nutrient stock solution per liter of seawater as prescribed in OECD-306. The experiments were carried out in 300 ml biological oxygen demand (BOD) bottles. The amount of DO in the test medium was measured using a multimeter MU 6100 L with pHenomenal® OXY-11 probe, both from VWR – Germany. The test bottles were incubated at a constant temperature of 20 ± 2°C in a Liebherr Lovibond-TC 445 incubator.
Toxicity experiments: Exposure of chemicals to the RTgill-W1cell line
Cell culture and growth media
The RTgill-W1 cells (ATCC; CRL-2523), derived from rainbow trout (Oncorhynchus mykiss), were routinely maintained at 20 ± 1°C in a 75 cm2 tissue culture flask in 10 ml of a Leibovitz-15 (L-15) medium, with 10% FBS and 2% penicillin streptomycin. The growth media was changed three times a week. Cells were examined under an inverted phase-contrast microscope (Olympus CKX41) for growth and confluency. Once around 90% confluency was reached (around 7-10 days) in the original flask, cells were washed with PBS and dissociated with trypsin-EDTA for subculturing and experiments. All experiments related to the culturing of cells and exposure of chemicals to cells were performed under a laminar flow hood in a sterile environment in the bio-safety cabinet.
Cytotoxicity studies
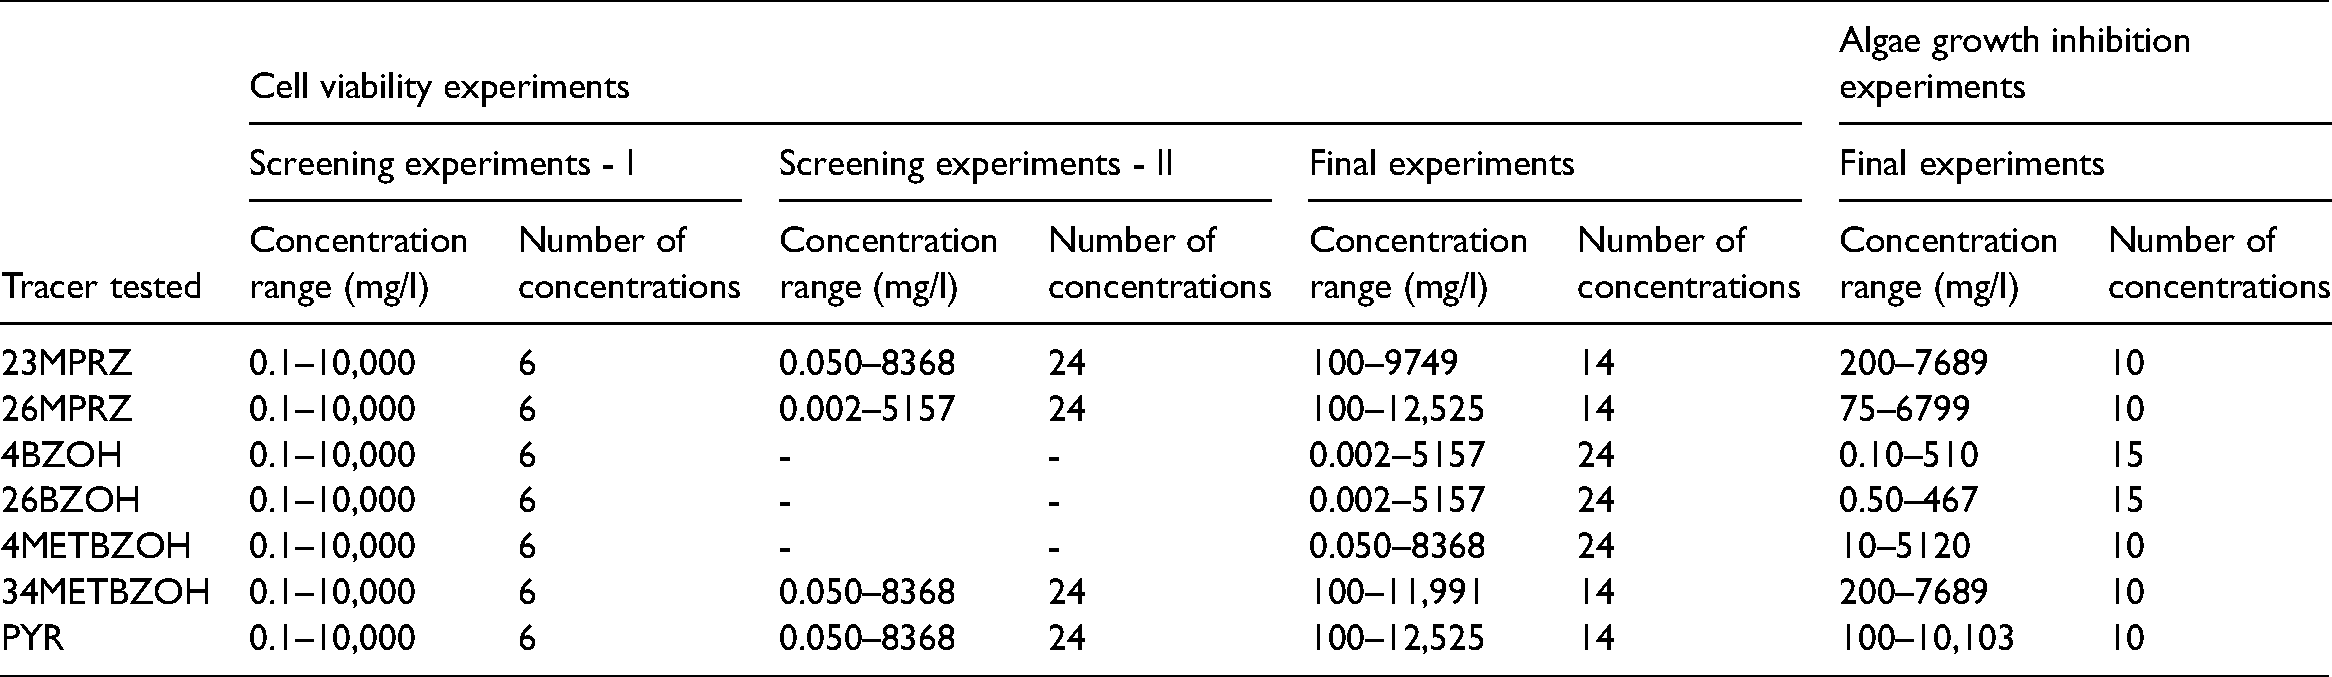
The cytotoxicity experiments using the RTgill-W1 cell line followed procedures described in Dayeh et al., 2013. The cytotoxicity of potential tracer compounds to RTgill-W1 cells was measured using Alamar Blue dye (Dayeh et al., 2013). Alamar Blue is a commercial product derived from the dye resazurin that has low fluorescence. Alamar Blue is reduced to a product called resorufin by the enzymes of living cells. Resorufin is highly fluorescent, and the amount of resorufin produced is directly proportional to the number of living cells. Hence, measuring fluorescence makes it possible to conclude about the number of living cells. Screening experiments were conducted for all tracers to determine the potential concentration range and value of a 50% loss in cell viability (EC50). Table 2 summarizes the entire setup of experiments carried out for the cell viability of RTgill-W1. Two sets of screening studies were conducted to narrow down the final concentration ranges for four tracers: 23MPRZ, 26MPRZ, 34METBZOH, and PYR. For the remaining three tracers, final experiments were conducted after the first set of screening experiments. Three tracers – 4METBZOH, 4BZOH, and 26BZOH – showed a clear indication of concentration ranges for a 50% loss in cell viability after the first set of screening experiments. There was therefore no need for these three tracers to undergo an additional screening experiment.
Information about concentration ranges for screening and final experiments on the cell viability of a RTgill-W1 cell line and growth inhibition of Skeletonema costatum.
The stock solution for the other five tracers, apart from 4BZOH and 26BZOH, were prepared by directly dissolving a pure chemical in L-15 growth media. Stock solutions were then diluted with L-15 growth media to make lower concentration solutions for exposures. 4BZOH and 26BZOH were found to be poorly soluble in water and growth media; therefore, DMSO was used as a solvent carrier for these two compounds. The 96-well tissue culture plates were used to seed the cells and for exposure to tracers. RTgill-W1 cells were seeded in a 96-well plate at a density of 40,000 cells in 200 microliters (μl) of medium per well. The plates with seeded cells were incubated at 20°C for 24 h for cells to attach and form a monolayer. After 24 h, the growth media was replaced by the tracer solutions in the growth media at different concentrations (triplicate for each concentration). A 100 micromolar hydrogen peroxide solution was used as a positive control. The plate was then incubated again at 20°C for 48 h. Tracer exposures were removed after 48 h, and a 484 micromolar Alamar Blue solution in the growth media was added to each well before incubating the plate for 4 h. The results were obtained as relative fluorescence units (RFU) at the excitation and emission wavelength pairs of 530-590 nanometer (nm) in a SpectraMax Paradigm Microplate Reader (Molecular devices – USA). The percentage of cell viability was calculated using equation 1 (Dayeh et al., 2013), and the percentage of cell viability for each tracer was used to fit four parameter log-logistic equations using drc package in R program (Ritz et al., 2015). The dose-response curves were plotted, and EC50 values were calculated using drc package in R program.
Toxicity experiments: The marine algae growth inhibition test
The marine algae growth inhibition test utilized Skeletonema costatum as the test species and followed the procedure described in ISO guideline 10253. The S. costatum strain NIVA-BAC 1 and stock solutions for growth medium were acquired from the Norwegian Institute of Water Research (NIVA). The Z8 growth medium was prepared using these stock solutions by following the procedure described in Kotai, 1972. This growth medium was used to maintain the algae strain and for growth inhibition experiments. The NIVA-BAC 1 algae strain was transferred into the growth media and grown under steady conditions of 15 ± 1° C in the incubator with 12 h light/dark cycle. A pre-culture of NIVA-BAC 1 at a cell density of 5000 cells/ml was started in a 100 ml growth medium under the direct exposure of light for 24 h and at a temperature of 20 ± 2° C. This pre-culture was used to plot the calibration curve. The algae cells were counted under the microscope using a counting chamber and the corresponding fluorescence was measured at the excitation and emission wavelength pairs of 430–671 nm with a SpectraMax Paradigm Microplate Reader. The fluorescence units obtained from the calibration curve were used to calculate the cell density in growth inhibition experiments.
The experiments were carried out in 250 ml Erlenmeyer flasks under direct exposure to light with 6500 Luminex (lx) light intensity. The EC50 concentration values from RTgill-W1 tests were used as a reference for determining the concentration ranges for the algae growth inhibition tests. The range and number of concentrations tested for each chemical are summarized in Table 2. Appropriate amounts of pure test substances were directly added into the growth medium to achieve the final concentration needed in the exposure. DMSO was used as a solvent carrier and control for 4BZOH and 26BZOH. For all other chemicals, a blank control was used.
A pre-culture with a cell density of 5000 cells/ml was started by incubating cells from an algal stock culture 2-3 days before the exposure experiments. The required volume from the pre-culture was added to the test flask to create initial cell densities of 5000 cells/ml for the exposure experiments. The test flasks and control were then exposed under direct exposure to light for 3 days at a temperature of 20 ± 2°C. Fluorescence was measured in a 24 well plate using a 1 ml test solution daily for 3 days (72 h) starting from day 0. The cell density is calculated from these fluorescence units using a calibration curve. Cell density was used to calculate the average specific growth rate (μ) using equation 2, where NL and N0 are the measured cell densities after specified time tL and initial time t0, respectively (ISO 10253, 2016). The percentage growth inhibition (Iμi) was calculated based on the difference between the average specific growth rate in control and exposures using equation 3, where μc and μi is the average growth rate of the algae in the control flask and in the exposed tracer flask, respectively (ISO 10253, 2016). The pH of the test solution was measured before and after the exposure experiments. Test flasks were shaken manually once a day during the exposure period.

Modeling of tracer release with produced water
The dynamic risk and effects assessment model (DREAM) was used to assess the fate and effects of the tracer compounds discharged in the seawater (Reed and Hetland, 2002). The model calculates the environmental impact factor (EIF) values for produced water discharges in the sea. The EIF unit is defined as a water volume of 105 m3 where the ratio of environmental concentration to no-effect concentration is greater than 1 (Reed and Hetland, 2002). A typical produced water stream from the Brage field on the Norwegian Continental Shelf (NCS) containing naturally occurring oil components and production chemicals was used as a representative case for produced water discharge. The produced water discharge rate was 15,572 m3/day released at a depth of 17 m below the sea surface. The expected concentration range of tracer in the produced water was chosen based on the available literature data (Viig et al., 2013). Even though the expected tracer concentrations are lower, simulations with higher concentrations were included to understand the relationship between concentration and potential contributions to EIF from tracers. Default ocean currents and wind data available from the model for the month of May-1990 were used for simulation. The ocean currents and wind data for any month/year can be used for simulation. This will assumingly not influence the calculation of EIF values. The simulation time span and discharge duration of produced water was kept at 30 days. A centrally located produced water discharge site with the coordinates 3°2.0’ East and 60°32’ North in a 50*50 kilometers habitat grid was used in the simulation.
Data treatment
All statistical analysis for plotting dose-response curves and calculation of EC50 values was done using ‘drc’ package in R program (https://cran.r-project.org/web/packages/drc/drc.pdf) (Ritz et al., 2015). Different models such as 4 parameter log-logistic, 2 parameter log-logistic, lognormal, weibul, etc., were tested to shortlist the model that best fits the toxicity data. The four-parameter log-logistic model was found be the best fit for all chemicals, both for cell viability and growth inhibition data. The calculation of EC50 values and fitting of dose-response curves was done using the four-parameter log-logistic model by applying maximum and minimum restrictions as 1 and 0, respectively. For toxicity experiments, the significance level was set at p < 0.05, and hypotheses testing was done using a general linear hypotheses test (glht).
Results and discussion
Bio-degradability experiments
The biodegradability of tracers was measured indirectly as a function of oxygen consumption. Net oxygen consumption in the test bottles was calculated by subtracting the oxygen consumption in the blank bottle from the oxygen depletion recorded in the test bottles. The percentage of biodegradation over 28 days was then determined by comparing net oxygen consumption in the test bottles with the theoretical oxygen demand of the test chemical (OECD 306, 1992). Results in terms of percentage biodegradation for all tracers are summarized in Figure 1 and Table 3. Out of all the tested tracers, 4METBZOH and PYR show the highest potential for biodegradation over 28 days at 100% and 91%, respectively. The tracers that showed the lowest biodegradation were 23MPRZ, 4BZOH, and 26BZOH at 22%, 25%, and 32%, respectively. The remaining tracers, 26MPRZ and 34METBZOH, showed biodegradation at intermediate levels (49% and 45%, respectively).
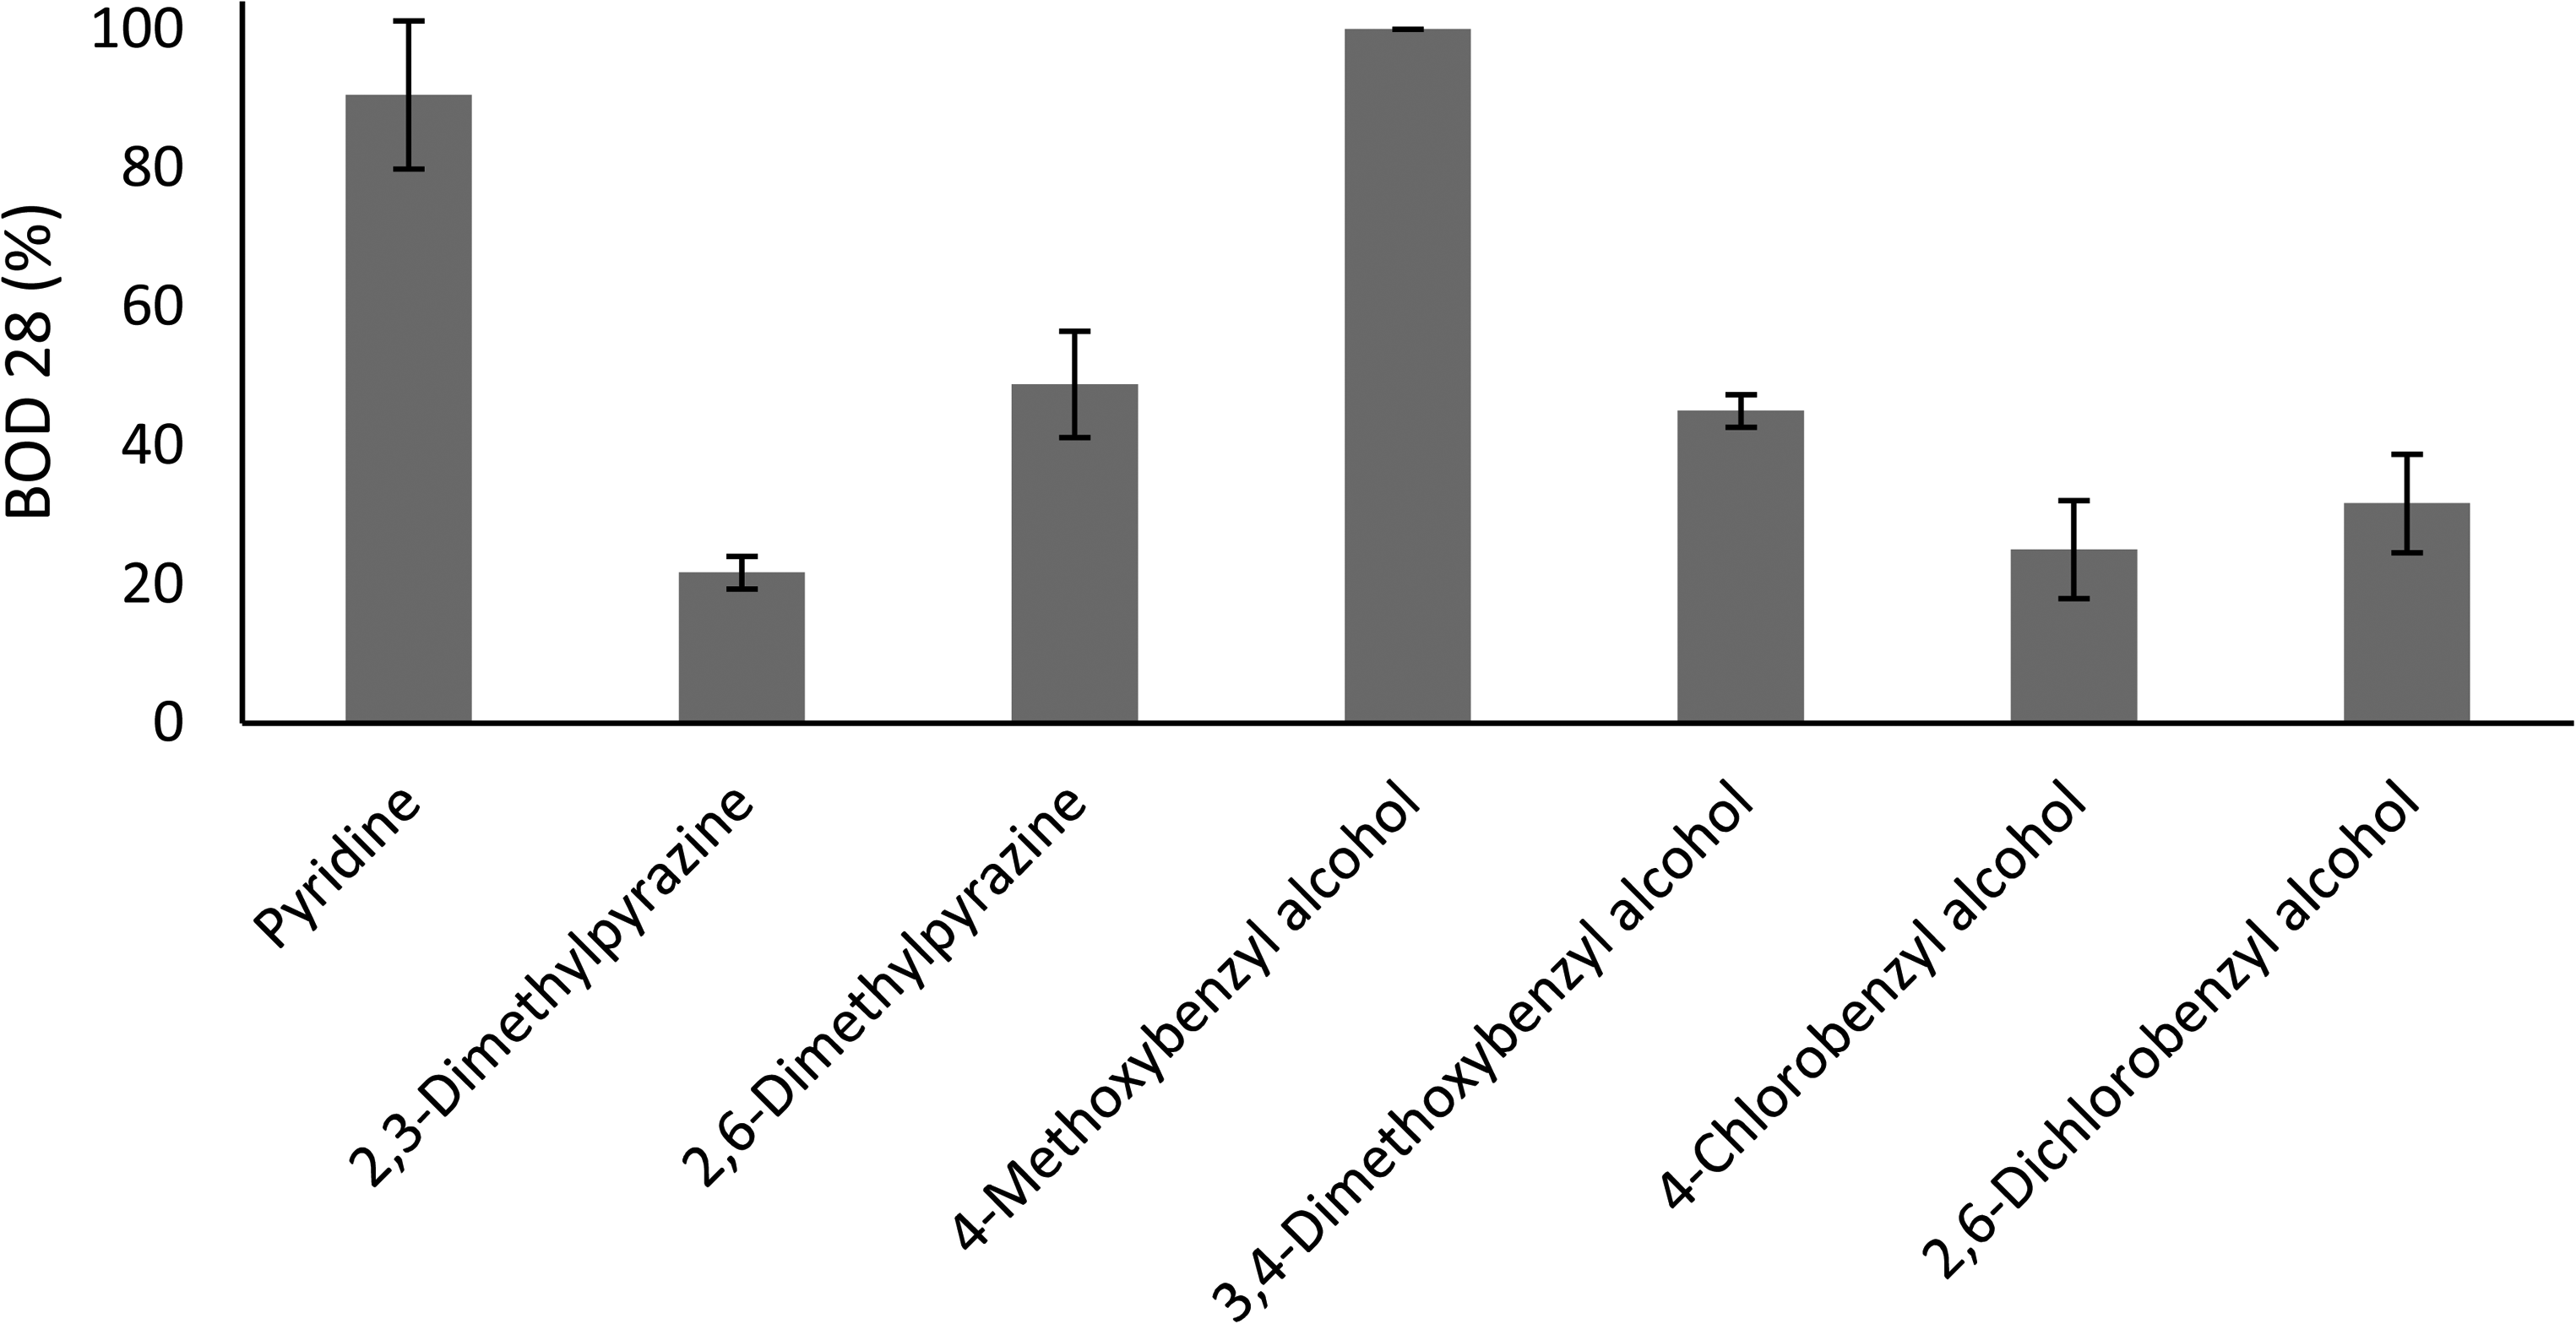
Comparison of biodegradation potential of all PITT tracers.
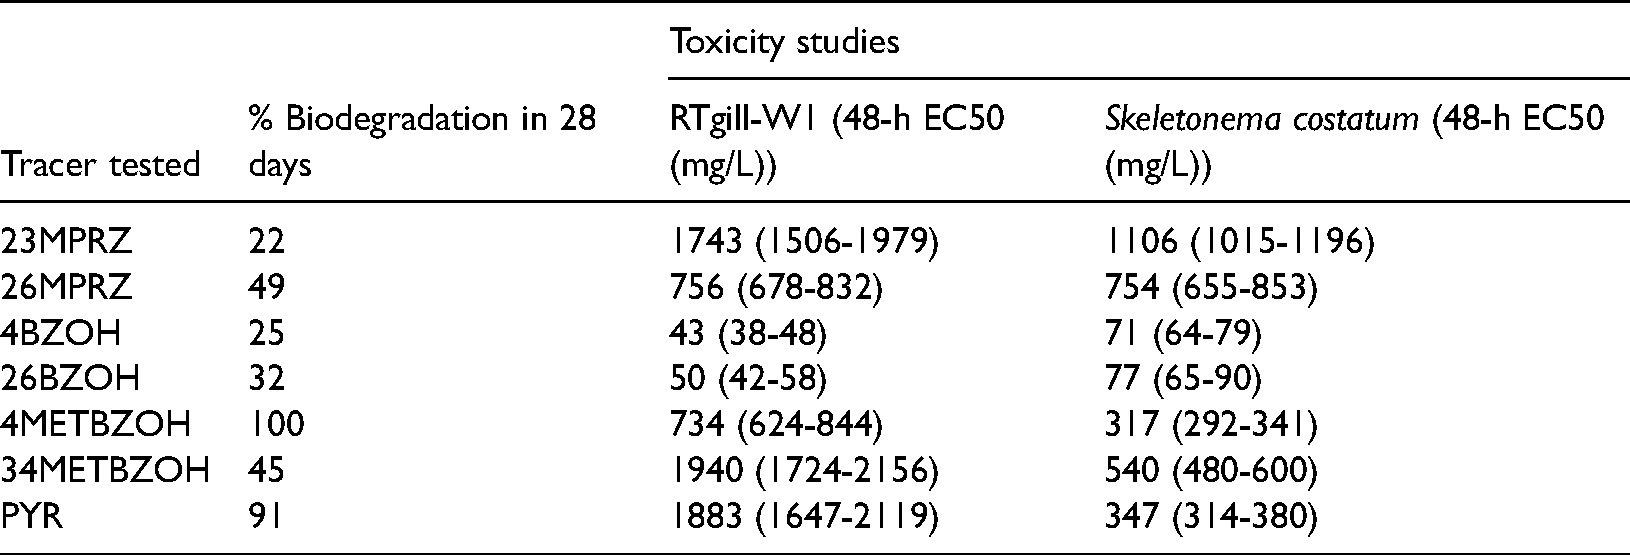
Summary of biodegradability and toxicity results for the tracers tested. Numbers in brackets indicate 95% confidence intervals (min-max).
The measurement of biodegradability using the OECD 306 method is largely dependent on the composition of microorganisms in the seawater used for the test Seawater from another area or depth may have a different composition of microorganisms, which could give different biodegradation readings. It should be noted that there could be interference in oxygen uptake due to nitrification (OECD-306, 1992). However, the use of blanks in the experiments will assumingly nullify such possible interference. Moreover, a biodegradation percentage of, say, 30% for a particular chemical means that microorganisms were able to degrade 30% of the chemical over 28 days. This value of 30% may increase with time due to the extended lag phase involved in the degradation process. Although quite similar in structure, a reasonable difference in biodegradability is observed between 23MPRZ and 26MPRZ. This could be due to an extended lag phase in 23MPRZ compared to 26MPRZ. One reason for an extended lag phase could be a lower rate of growth in microorganisms. More accuracy in determination of the tracer degradation might have been achieved by chemical analyses, however, this was beyond the scope of the study. It is also important to note that multiple degradation processes other than biodegradation may influence the overall degradation of a chemical in the marine environment. These processes include hydrolysis of chemicals, aquatic photodegradation, etc. (Hughes et al., 2020).
Cell viability experiments
The EC50 based on the metabolic activity in RTgill-W1 cells was determined after 48 h of exposure to all the tracer compounds at different concentrations. A progressive decline in cell viability of RTgill-W1 cells with the increase in tracer concentrations was measured using Alamar Blue dye. Dose-response curves showing the effect of all tracers on the cell viability of RTgill-W1 cells after 48 h of exposure are shown in Figure 2. Table 3 summarizes EC50 values for all tracers when exposed to RTgill-W1. Among all tracers, both chlorobenzyl alcohols were observed to have the lowest concentrations at 50% cell viability (EC50). The lowest EC50 values were 43 mg/l and 50 mg/L for 4BZOH and 26BZOH, respectively. Almost 100% loss in cell viability was observed around 100 mg/l for both chlorobenzyl alcohols. The EC50 values for 26MPRZ and 4METBZOH were observed to be 755 mg/L and 734 mg/L, respectively. The remaining three tracers, 23MPRZ, 34METBZOH, and PYR, were within a high range of similar EC50 values (1743–1939 mg/L). The dose-response curves for 4METBZOH, PYR, and 23MPRZ deviate from the common s-shaped sigmoidal curve, exhibiting almost a linear relationship over a large range of higher exposure concentrations. Comparison of cytotoxicity data measured for the group of chemicals in the current study is difficult due to a lack of published data.
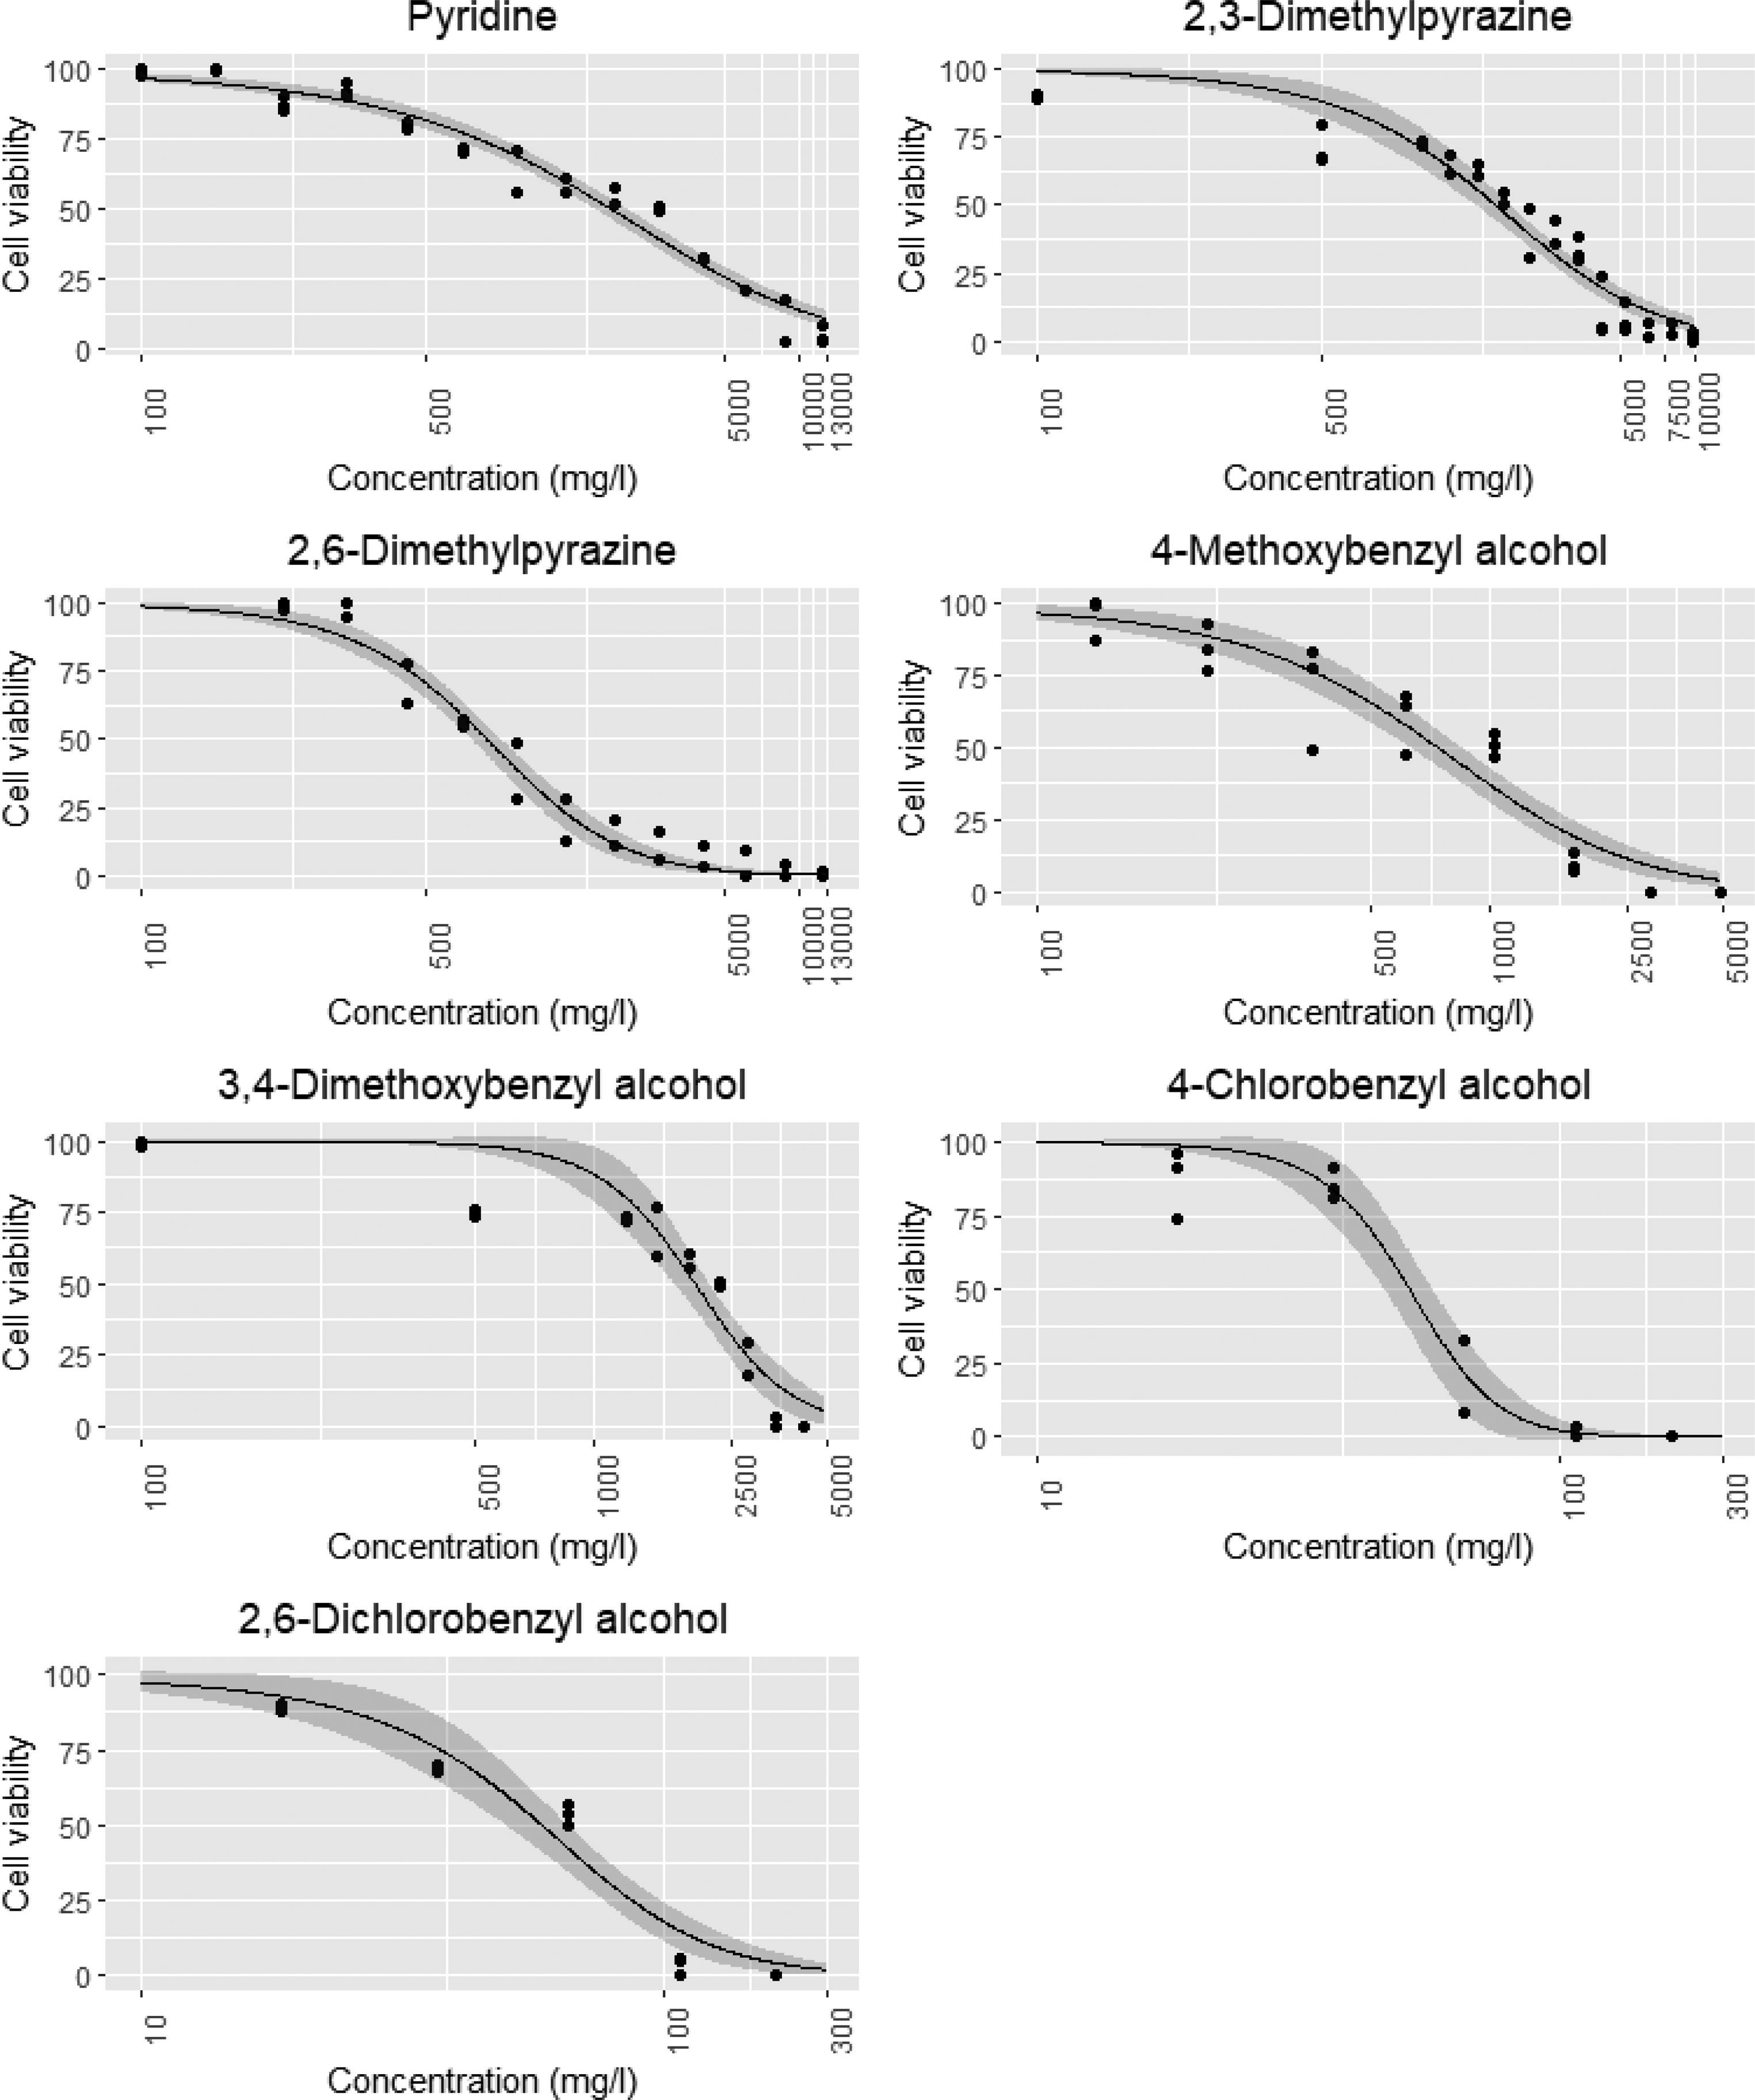
Cell viability of RTgill-W1 cells compared to control after 48 h of exposure to 7 tracers. Data are fitted using a four parameter log-logistic equation, and the ribbon around the dark line indicates a 95% confidence interval. Number of replicates: Three for each concentration (p < 0.05).
Marine algae growth inhibition tests
Growth inhibition of the algae Skeletonema costatum was determined after 48 h of exposure to all the tracer compounds at different concentrations (Table 3). A gradual increase in growth inhibition was observed with higher tracer concentrations. A decline in growth rate was observed in the control cultures in the last 24 h. During this time the exposed algae continued to be in a delayed exponential growth phase. The comparison of control and exposure at this stage may lead to a possibly incorrect conclusion concerning the decreased growth-inhibiting effect. To avoid this and obtain more consistent calculations, these were instead based on the last measurement within the exponential growth period after 48 h of exposure in both control and exposure cultures. Dose-response curves showing the effect of all tracers on growth inhibition after 48 h of exposure are shown in Figure 3. During the experiments, the cell density in the control group increased by a factor of more than 16, and the pH of the test medium did not increase by more than 1, fulfilling both validity criteria laid out by ISO 10253.
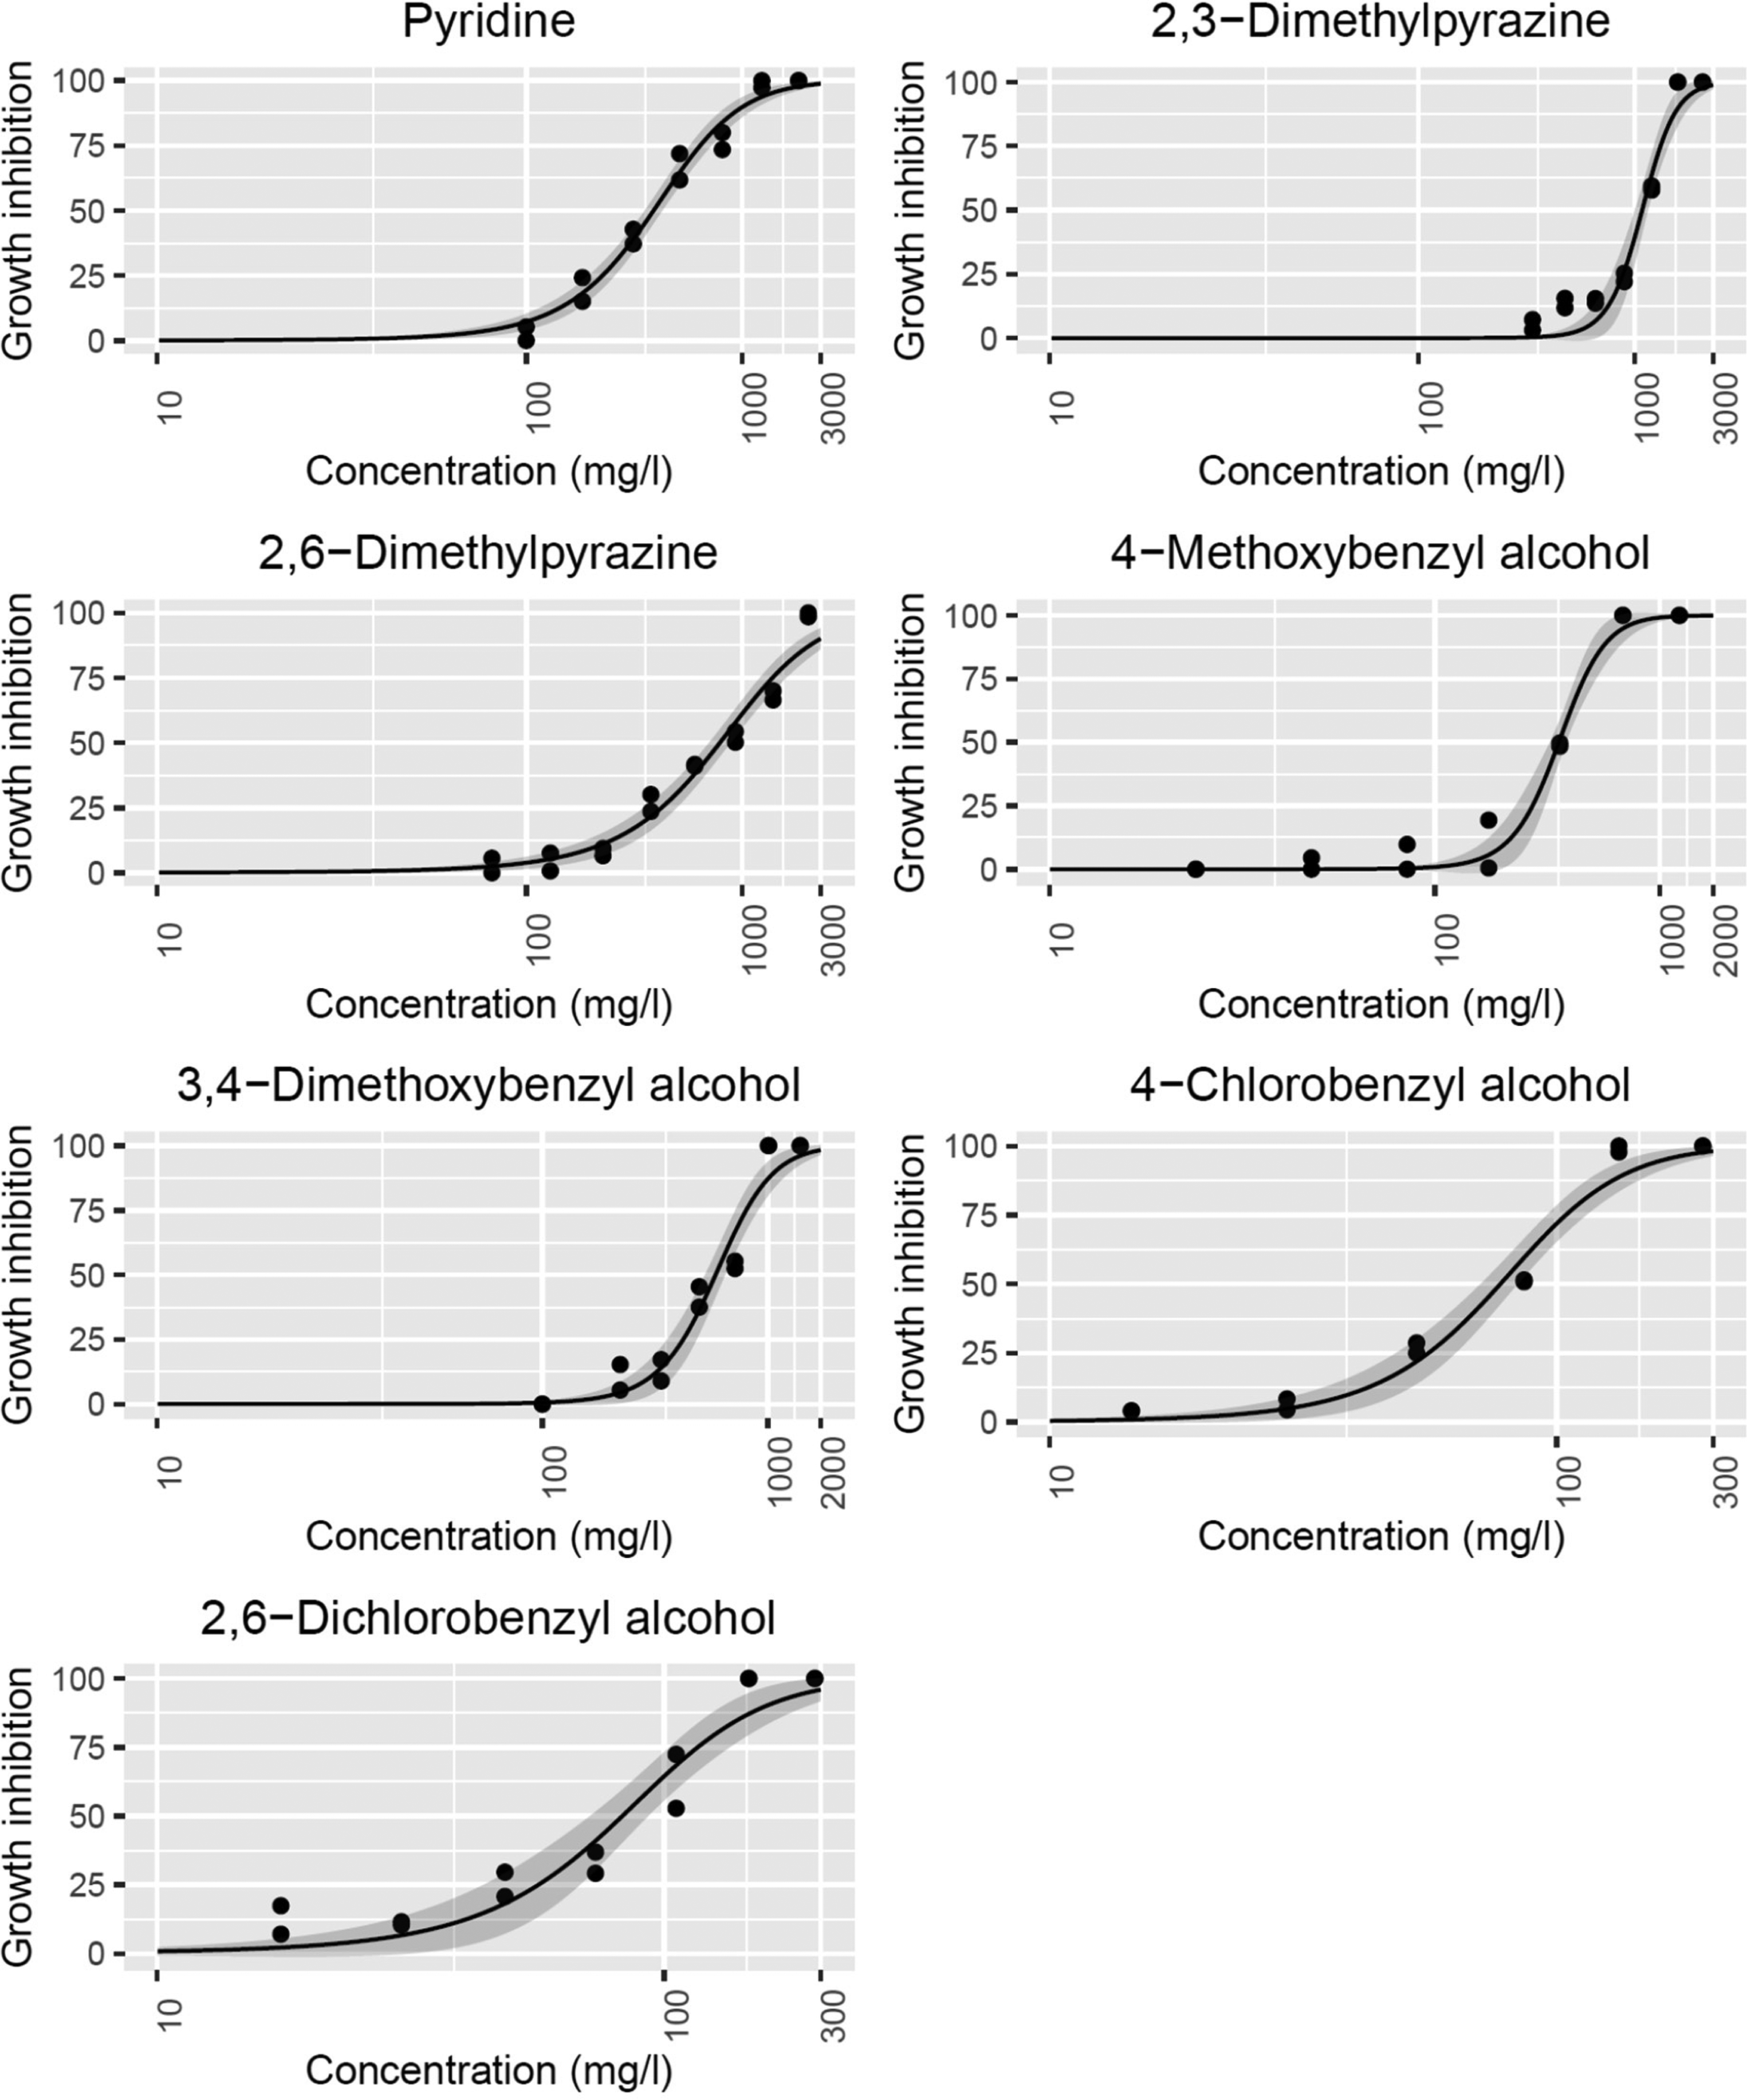
Growth inhibition of Skeletonema costatum compared to control after 48 h of exposure to 7 tracers. Data are fitted using a four parameter log-logistic equation, and the ribbon around the dark line indicates a 95% confidence interval. Number of replicates: Two for each concentration (p < 0.05).
Comparing the results from toxicity experiments to RTgill-W1 and Skeletonema costatum, we observed that S. costatum was slightly more sensitive to tracers than RTgill-W1 cells. Similar to the results for cell viability experiments, both chlorobenzyl alcohols showed the lowest EC50 values for growth inhibition experiments. The EC50 values for 4BZOH and 26BZOH were 71 mg/l and 77 mg/L, respectively, which were slightly higher than the EC50 values for cell viability studies which were 43 mg/l and 50 mg/l, respectively. Almost 100% growth inhibition was observed at around 150 mg/L for both these compounds. The EC50 values of 4METBZOH and PYR for growth inhibition experiments were observed to be in the same range, 317 mg/L and 347 mg/L, respectively. The highest EC50 value of all tracers for growth inhibition experiments was 1106 mg/L for 23MPRZ, followed by 754 mg/L for 26MPRZ and 540 mg/L for 34METBZOH. Compared to the other tracers, a considerable difference in EC50 values for PYR, 23MPRZ, 4METBZOH and 34METBZOH was observed between growth inhibition and cell viability experiments. The EC50 values measured for growth inhibition of algae were lower than the cell viability of RTgill-W1. A possible reason for this could be that the assessment endpoint is inhibition of growth in the case of algae whereas for RTgill-W1 the endpoint is the mortality of cells. It would perhaps take higher concentrations to cause mortality, but growth could be inhibited at lower concentrations. Moreover, each chemical has a distinct toxic mode of action on different species. This may also influence the difference in EC50 values recorded for algae and Rtgill-W1. If more than 1 toxicity value is available for a particular chemical, the lowest value is selected for conducting ERA (ECHA, 2008b). Therefore, the lower EC50 value measured among cell viability and growth inhibition experiments was chosen to calculate EIF using the DREAM model. The lower EC50 values for tracers 4BZOH and 26BZOH was measured for cell viability experiments. For all other tracers, the lower EC50 value was measured for growth inhibition experiments. The inclusion of two different laboratory methods in this study thus strengthened the basis for the ERA and contributed to available literature data on toxicity by fish cell method comparative to the standard OSPAR recommended algal test.
Simulation of tracer release using the DREAM model
The contribution to environmental impact factors from different chemicals in the DREAM model is mainly dependent on the concentration of a chemical and corresponding ecotoxicological data. There is limited data available on the expected concentrations of tracers in the produced water stream. A report from Viig et al. (2013) suggests that the expected concentrations could be in the range of a few micrograms per liter. However, the expected concentrations may vary based on the specific field applications and a group of tracers. This study uses the produced water release profile containing naturally occurring compounds and production chemicals from the Brage field on the NCS as a representative case for a typical produced water discharge in the North Sea. Tracers from the current study are added to this produced water stream, and the contribution to the time-averaged EIF from each tracer is calculated independently at different concentrations. A time-averaged EIF is an EIF value measured and averaged throughout the simulation (Reed and Hetland, 2002). The lowest EC50 values from cell viability and algae growth inhibition experiments were used to simulate tracers. An assessment factor of 1000 was used to account for uncertainties as recommended by the European Chemical Agency guidance document (ECHA, 2008b). Biodegradability values measured from this study are used, whereas octanol-water coefficient values are taken from the literature (Silva et al., 2018, 2019, 2021).
Table 4 and Figure 4 summarize the contribution to the time-averaged EIF from all tracers at different concentrations. The contribution to EIF remains zero at the expected concentration of a few micrograms per liter for all tracers. This is because the produced water stream is rapidly diluted in the marine environment, and the actual exposure concentrations will be significantly lower than the back-produced concentration of tracer in the produced water. The measured acute toxicity of tracers from this study is not high enough to contribute to EIF at such low concentrations. It is important to note that the assessed risk is based on the EC50 values obtained from acute toxicity experiments. To extrapolate from acute toxicity to chronic toxicity, an assessment factor of 100 is usually used for most of the chemicals (May et al., 2016). Moreover, the actual sub-lethal effects on marine species interpreted by different biomarkers may start at very low concentrations (Sanni et al., 2017a). This concentration might alternatively also be used as a criterion for assessing environmental risk (Sanni et al., 2017b). Data on sub-lethal effects for the group of chemicals in this study is lacking. To account for sub-lethal effects and other uncertainties, an assessment factor of 1000 is recommended by the European Chemical Agency (ECHA) (ECHA, 2008b). An assessment factor of 1000 is also used for other chemicals in the produced water release profile from the Brage field. Therefore, to have consistency and comparable assessment among all chemicals, an assessment factor of 1000 was used for tracers (ECHA, 2008b; May et al., 2016).
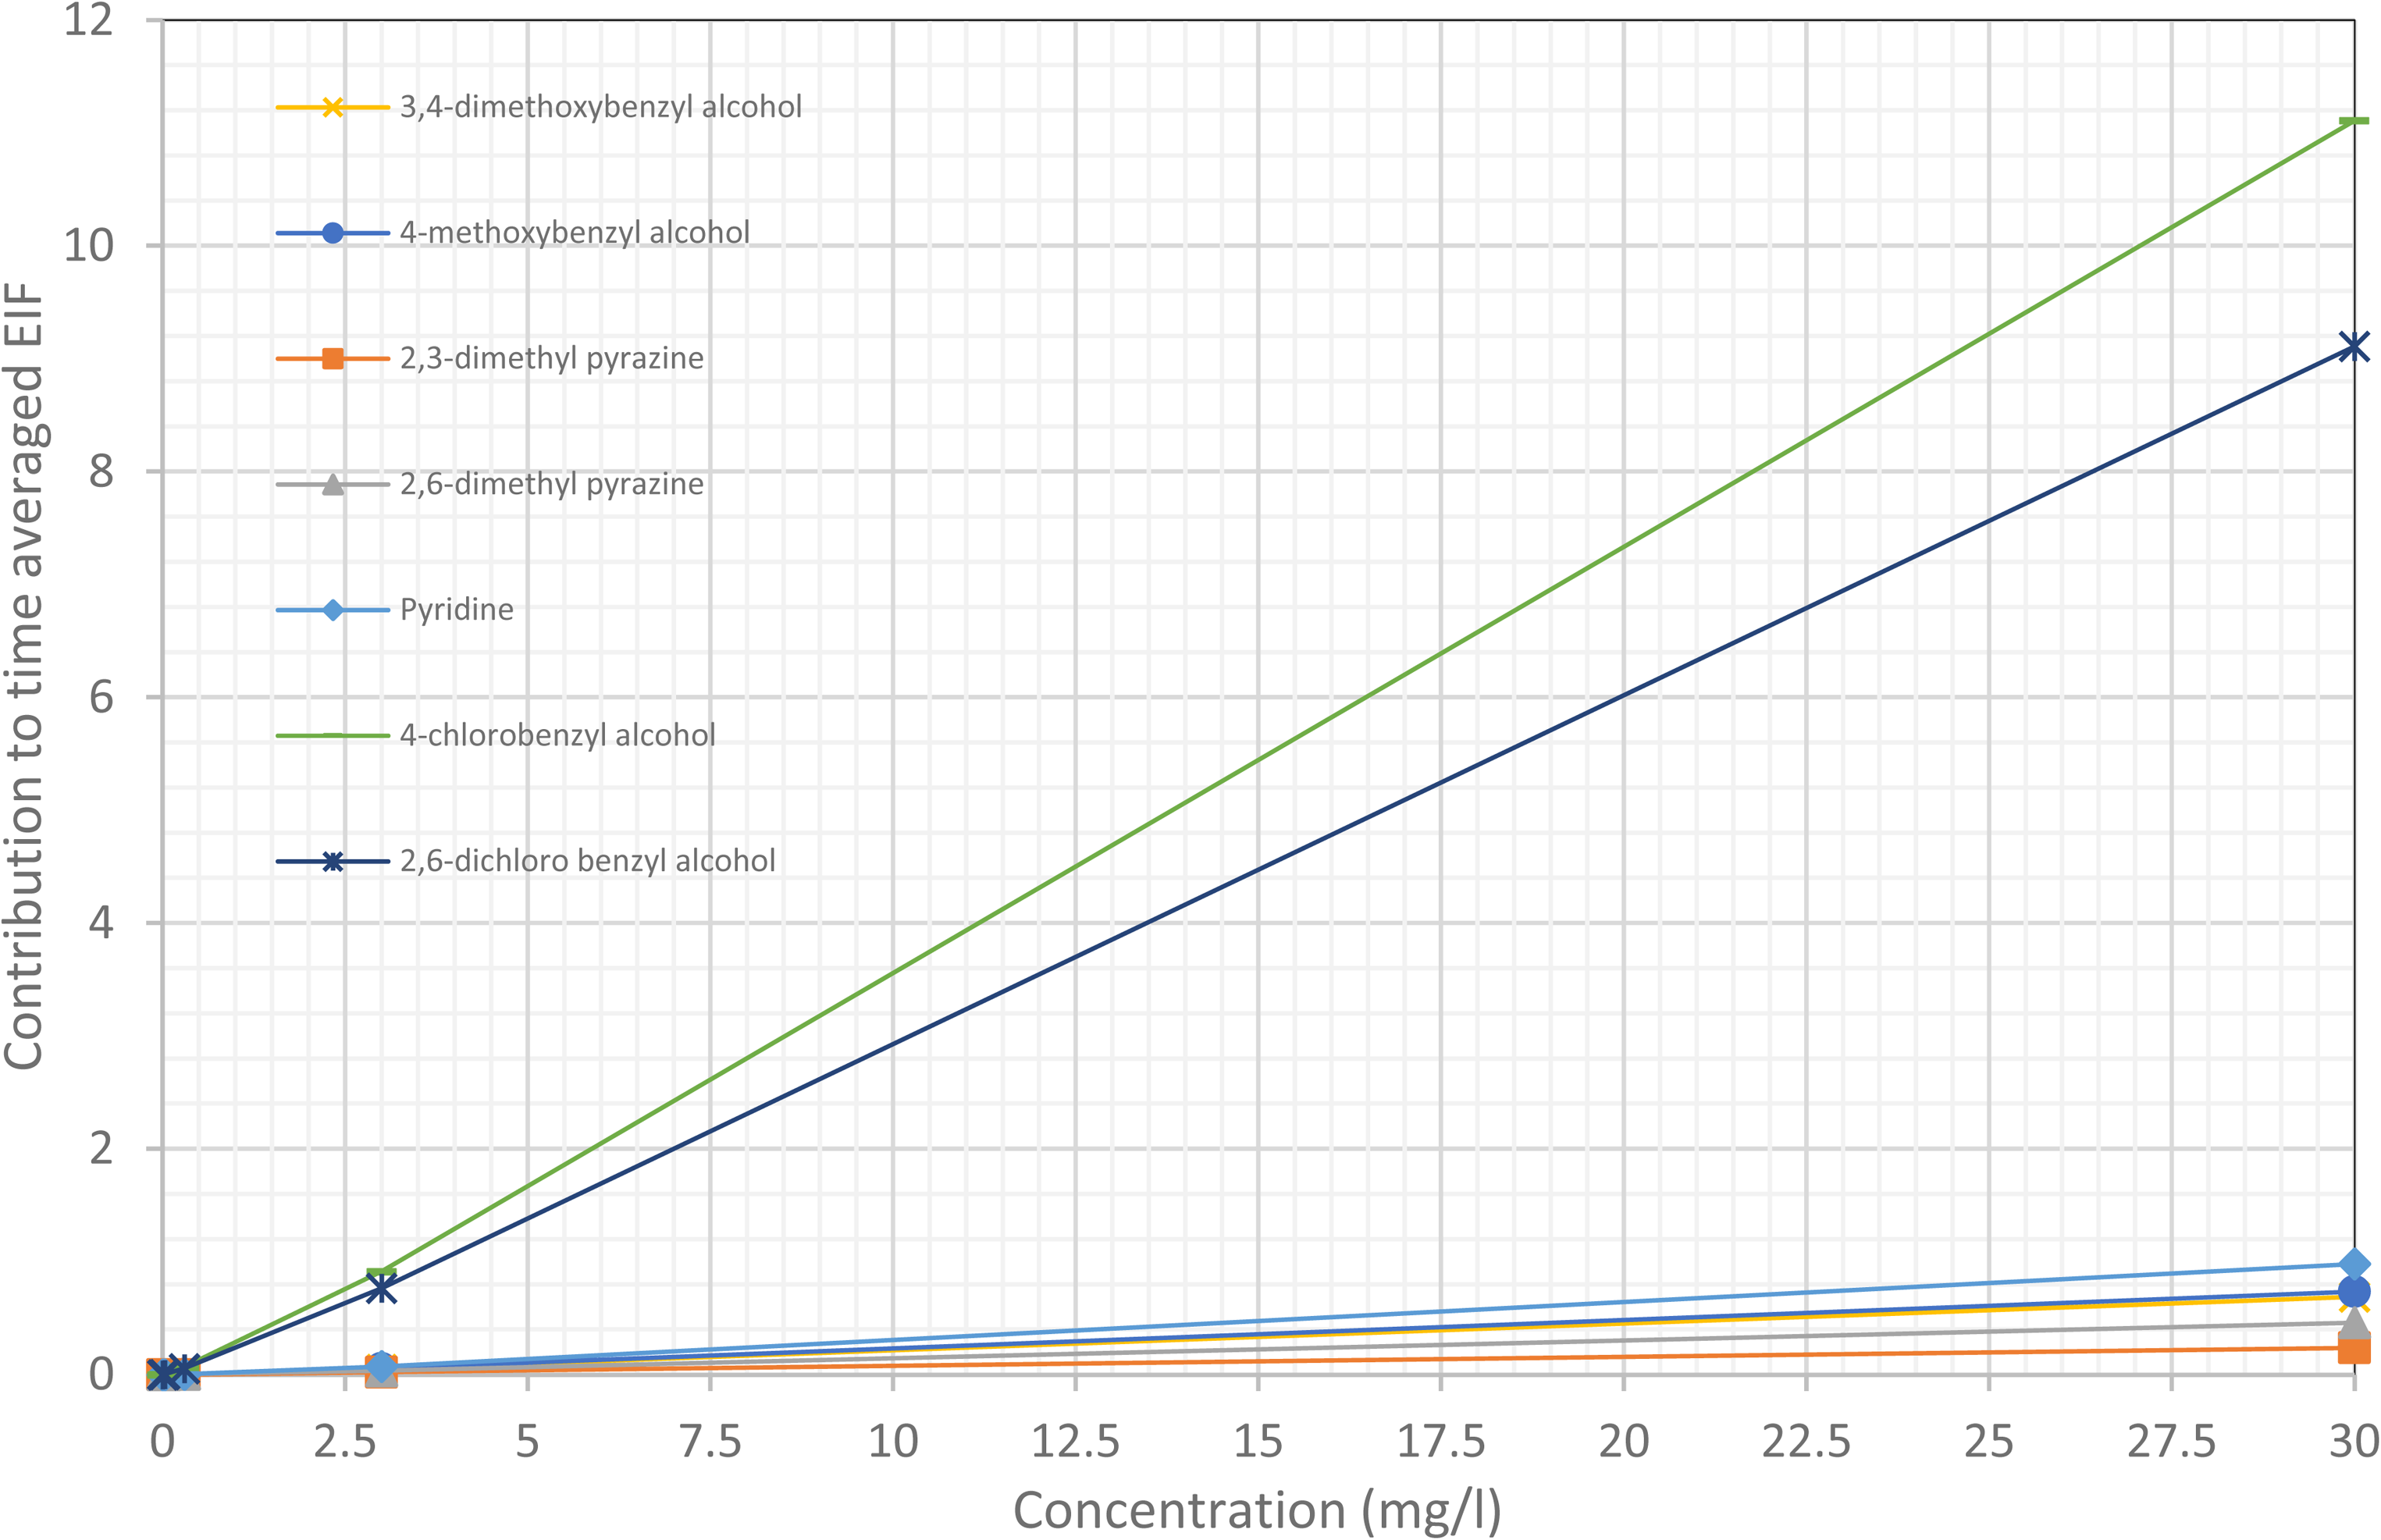
Contribution to time-averaged EIF from all tracers at different concentrations.
Summary of contributions to time-averaged Environmental Impact Factor (EIF) from all tracers at different concentrations.
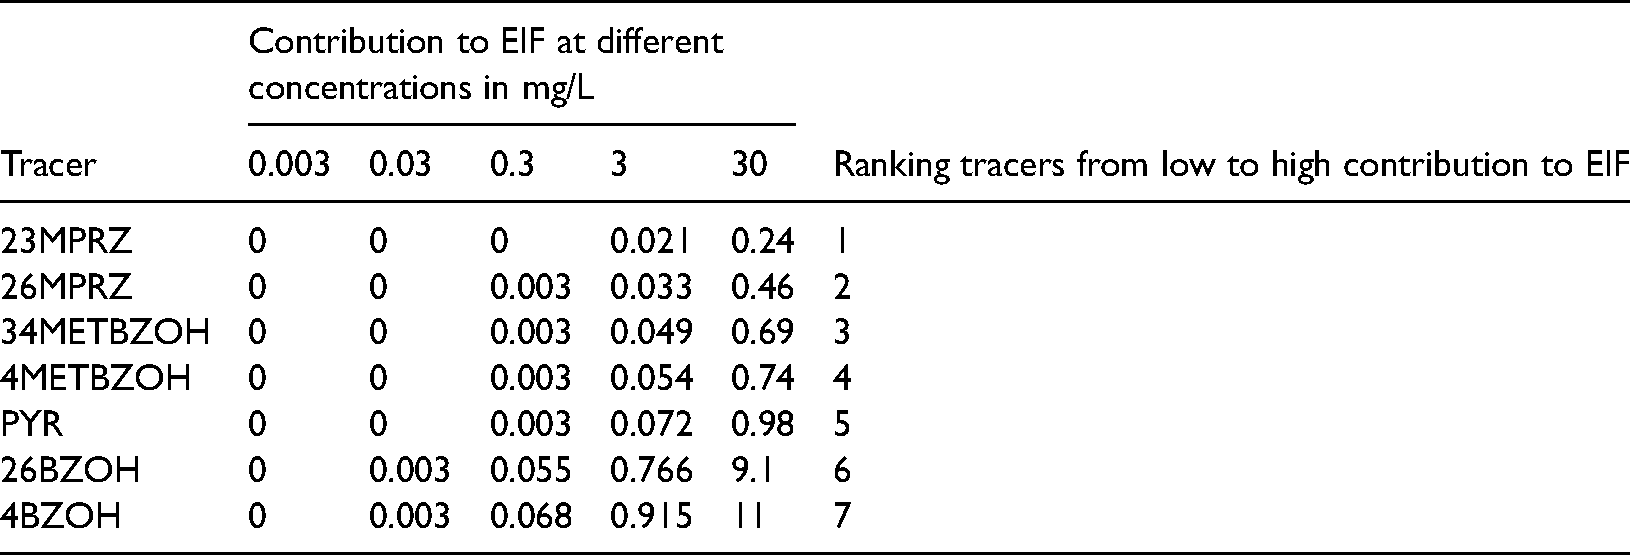
A minor contribution to EIF of 0.003 is seen for 4BZOH and 26BZOH at a concentration 10 times higher than the reported tracer concentration. This means that at 0.03 mg/L of 4BZOH and 26BZOH, the ratio of environmental concentration to no-effect concentration is greater than 1 in 300 m3 of water (Reed and Hetland, 2002). At unrealistically high concentrations of 3 mg/L and 30 mg/L, all tracers show some contribution to the EIF. In Table 4, all tracers have been ranked based on their contribution to EIF at different concentrations. The lower-ranked tracers, 23MPRZ and 26MPRZ, show considerably lower contributions to the EIF compared to other tracers. It is important to note that tracers are ranked based on their contribution to EIF at unrealistically high concentrations in the produced water. At the expected concentrations of a few micrograms/liter, none of the tracers shows any contribution to the EIF.
A harmonized pre-screening scheme is usually followed for permitting the use of chemicals offshore in the countries that are part of the Oslo and Paris Commissions (OSPAR, 2019). According to the pre-screening scheme, the chemicals with biodegradability of less than 20% are usually not allowed to be used and discharged offshore. From our study, 23MPRZ, 4BZOH and 26BZOH show biodegradability between 20% and 35% over 28 days, but none of the chemicals shows biodegradability less than 20% over 28 days. For chemicals showing biodegradability greater than 20%, if two of the following three conditions are met, the chemicals are usually not allowed to be used offshore: biodegradation less than 60% over 28 days, bioaccumulation potential (log Pow) ≥ 3 and LC50/EC50 < 10 mg/L. Of all the tracers tested in this study, only PYR and 4METBZOH show a biodegradability greater than 60%. However, one of the other two conditions, i.e., bioaccumulation potential (log Pow) ≥ 3 and toxicity (LC50/EC50 < 10 mg/L), is not fulfilled for the tested chemicals. The low biodegradability (between 20% and 60%) measured for most of the tracers suggests that it may take more than 28 days for these compounds to completely bio-degrade. In addition to biodegradation, there are several other factors such as chemical hydrolysis, aquatic photodegradation, etc., that influence the overall degradation of a substance (Hughes et al., 2020). The amount of tracers used and discharged in the marine environment is usually quite low (Viig et al., 2013), and with the relatively low measured biodegradability, it seems therefore reasonable to consider that only a minor amount of these compounds will potentially be accumulated in the marine environment over time. Of all the tested tracers, 4BZOH and 26BZOH show low biodegradability and high toxicity compared to other tracers. These two tracers are the most environmentally sensitive, and with all other factors being equal, these two might be given less priority in selections of tracers for offshore application. The acute toxicity based on EC50/LC50 values between 100–1000 mg/L and higher are classified as practically non-toxic (Patin, 1999). The toxicity of five of the tested tracers, apart from 4BZOH and 26BZOH, falls within this range. Therefore, any of these five tracers might be prioritized for offshore applications.
In this study, the primary focus was on assessing environmental risk from operational discharges of newly shortlisted tracer compounds in the marine environment. These tracers are usually transported in more concentrated form in the form of slugs to the offshore platform. There is a possibility of accidental release of these slugs into the sea during transportation and/or injection. The accidental release of these compounds in their pure form or together with other solvents will presumably result in higher environmental impacts than those associated with operational discharges. However, the frequency and probability of these accidental releases can be assumed as relatively low compared to the operational discharges of the tracers. In the event of accidental release, the predicted environmental concentrations (PEC) based on release amounts will be proportional to calculated operational releases in this paper, and the environmental risk will be reflected by assessed operational impact, PEC/PNEC (PNEC = threshold value), multiplied by the frequency (probability) of it occurring.
Conclusions
In this study, we measured the biodegradability and acute toxicity of seven chemical compounds that are shortlisted as potential tracers for quantifying residual oil saturation. All tracers showed some potential for biodegradation, with PYR and 4METBZOH showing over 90% biodegradation potential in 28 days. For toxicity tests, among all tracers, both chlorobenzyl alcohols displayed higher sensitivity towards RTgill-W1 and Skeletonema costatum and had the lowest EC50 concentration. All remaining tracers, barring 26MPRZ, showed a higher sensitivity towards S. costatum compared to RTgill-W1. Overall, the EC50 values for all tracers were in the range of 43–1940 mg/L. The ecotoxicological data obtained from this study can be used to assess the environmental impact and risk of using these chemicals in other anthropogenic activities.
We used this ecotoxicological data in the physical/chemical fate and effects modelling program to assess the environmental impact from the operational discharge of these tracers on the NCS. Out of all seven tracers, 4BZOH and 26BZOH were found to have the highest toxicity and contribution to EIF. The remaining five tracers were found to be practically non-toxic with reasonable biodegradability over 28 days. Therefore, these five tracers could be preferred over 4BZOH and 26BZOH for offshore application. At the same time, it is important to note that none of the tracers showed any contribution to EIF at the expected concentrations in the produced water. Moreover, the group of tracers in this study has achieved the limit of quantification in the range of nanograms/per liter using different analytical techniques (Silva and Bjørnstad 2020). The low limit of quantification means that a lesser quantity of these tracers could be used in the injection, which may reduce the expected concentrations in the produced water. In this case, the expected concentrations of tracers might reduce to levels even below micrograms per liter. It seems unlikely that these groups of tracers could pose an environmental risk at such low concentration ranges. Environmental risk of accidental release of tracer compounds can be calculated in a similar manner as in the case of operational releases, but with different release characteristics dependant on the case.
Supplemental Material
sj-docx-1-eea-10.1177_01445987221097999 - Supplemental material for Environmental risk assessment of inter-well partitioning tracer compounds shortlisted for the offshore oil and gas industry
Supplemental material, sj-docx-1-eea-10.1177_01445987221097999 for Environmental risk assessment of inter-well partitioning tracer compounds shortlisted for the offshore oil and gas industry by Mehul Vora, John-Sigvard Gamlem Njau, Steinar Sanni and Roger Flage in Energy Exploration & Exploitation
Footnotes
Declaration of conflicting interests
The author(s) declared no potential conflicts of interest with respect to the research, authorship, and/or publication of this article.
Acknowledgment
We thank Prof. Daniela M Pampanin and PhD candidate Giovanna Monticelli at University of Stavanger for training and guidance on conducting cytotoxicity experiments. We also thank Ms. Emily Lyng (Norwegian Research Centre) for training and guidance in running EIF simulations.
Funding
The author(s) disclosed receipt of the following financial support for the research, authorship, and/or publication of this article: The authors acknowledge the Research Council of Norway and the industry partners ConocoPhillips Skandinavia AS, Aker BP ASA, Vår Energi AS, Equinor ASA, Neptune Energy Norge AS, Lundin Norway AS, Halliburton AS, Schlumberger Norge AS, and Wintershall DEA, of The National IOR Centre of Norway, for their support. This work was supported by the Research Council of Norway (grant number 230303).
Supplemental material
Supplemental material for this article is available online.
References
Supplementary Material
Please find the following supplemental material available below.
For Open Access articles published under a Creative Commons License, all supplemental material carries the same license as the article it is associated with.
For non-Open Access articles published, all supplemental material carries a non-exclusive license, and permission requests for re-use of supplemental material or any part of supplemental material shall be sent directly to the copyright owner as specified in the copyright notice associated with the article.