
Abstract
Hot dry rock (HDR) geothermal resources are renewable energy source. Many of the findings of HDR resource evaluations have been used in energy planning and EGS design. However, to assess the amount of HDR resources in different locations, a consistent classification scheme and evaluation methods are still lacking. Considering geological credibility and economic feasibility, HDR resources are separated into three categories: vision, reserve, and exploitable. Vision and reserve are stationary resources that can be evaluated using the volume technique, and the exploitable resources can be evaluated using the numerical simulation approach. The HDR vision resource of the Gonghe Basin is evaluated to be 4.076 × 10²² J, and the reserve resource of the Qiabuqia HDR mass is evaluated to be 2.11 × 10²⁰ J. At the Qiabuqia HDR development site, a discrete fracture network (DFN) model is applied for numerical simulation computations, which is based on the notion of local thermal nonequilibrium. The K1 and K2 wells produce varying amounts of heat due to the heterogeneous features of the fractured medium model, which is primarily due to differences in fracture density, heat exchange area, and fluid migration pattern. The categorization system and assessment technique can be used as a guide for evaluating HDR resources in the future.
Introduction
Hot dry rock (HDR) geothermal resources have the advantages of great amount, global availability, minimal pollution, long-term stability, and renewability. In addition, it is regarded as a clean energy source with enormous potential for resolving energy problems and pollution. There has been a worldwide uptick in HDR exploration and development since the US Department of Energy launched the “Frontier Geothermal Observatory Research Project (FORGE)” in April 2015 (Xu et al., 2016). The GR1 well in the Gonghe Basin drilled a 236°C HDR mass at a depth of 3 705 m in August 2017, marking a key milestone in China's HDR exploration. Following that, the China Geological Survey held the “Qinghai Gonghe HDR Test Mining Scientific and Technological Battle,” officially launching China into the worldwide HDR exploration and development track.
HDR resources offer many promises. For instance, Xu Tianfu calculated that the energy stored in HDR at a depth of 3–10 km in the Earth's crust is 30 times that of all oil, natural gas, and coal on the planet (Xu et al., 2012). The quantity of HDR resources in the United States’ land area was assessed by Teste, and the findings revealed that the total geothermal resources of HDR in the United States at a depth of 3–10 km was 1.67 × 1025 J. (excluding the Yellowstone Park area) (Teste et al., 2006). The FORGE plan, which is based on this, is ambitious. Its application-level aim is to obtain over 100,000 megawatts of electricity in the United States to fulfill the green power needs of 100 million homes (Zhang et al., 2019a). Accordingly, Wang Jiyang calculated that the entire quantity of HDR resources in China's land area at a depth of 3–10 km is 2.09 × 1025 J, or approximately 714.9 trillion tons of standard coal, based on data from terrestrial heat flow (Wang et al., 2012). Lin Wenjing conducted comparable calculations on HDR resources in China's land regions at depths of 3 to 10 km and discovered that the entire HDR resource is 2.52 × 1025 J, or 860 trillion tons of standard coal. Assuming that the extractable amount accounts for 2%, it is equivalent to 5200 times of China's total energy consumption in 2010 (Lin et al., 2012).
The volumetric technique and numerical simulation method are the most widely used methods for evaluating HDR resources. The basic approach for evaluating stationary HDR resources is the volume method. Scholars such as Zhang Shengsheng, Yang Lizhong, Kang Zhiqiang, Tan Xianfeng, and Guo Pan employed the volumetric technique to analyze the stationary resources of HDR in various parts of China, in addition to the results produced by Xu Tianfu, Test, Wang Jiyang, Lin Wenjing, and others (Zhang et al., 2019b; Yang et al., 2016; Kang et al., 2020; Tan et al., 2020; Guo et al., 2020). When determining the quantity of usable HDR resources, numerical simulation approaches are frequently utilized. Xiao Yong, Li Zhengwei, Guo Liangliang, Lei Hongwu, Sun Zhixue, and others, for example, have performed research on the Thermal- Hydro- Mechanical- Chemistry (THMC) coupled numerical modeling of the enhanced geothermal systems (EGS) (Xiao, 2017; Li et al., 2015; Guo et al., 2016; Lei, 2014; Sun et al., 2016). Wang Yang, Zhai Haizhen, Qu Zhanqing, Azadeh Riahi, Xu Chaoshui, etc. studied the fracture simulation method of EGS (Wang and Zhang, 2011; Zhai et al., 2020; Qu et al., 2017; Riahi A et al., 2019; Xu et al., 2015). Pranay Asai, Zhang Chao, Gao ping, Maleaha Y. Samin, Yue Gaofan, etc. have studied the key parameters that affect the productivity of EGS (Asai et al., 2019; Zhang et al., 2018a; Samin et al., 2019; Gao, 2015; Yue et al., 2015). Based on the theory of local thermal nonequilibrium, Qu Zhanqing simulated the extraction of thermal energy from HDR with a fracture network (Qu et al., 2019). Liu Gang proposed an inversion algorithm for resource evaluation of EGS (Liu et al., 2018).
Despite the fact that many academics have worked on evaluating HDR resources, there is still a need for a uniform classification system and assessment approach that can give more reliable data to decision-makers. This study presents an HDR resource categorization system and assessment technique, using the Qinghai Gonghe Basin as an example to compute stationary and exploitable resources. It offers a reference for the following HDR resource evaluation while mastering the quantity of HDR resources in the Gonghe Basin.
Classification and evaluation methods of HDR
Classification scheme of HDR resources
Research goals have led to different HDR classifications. Based on the analysis of the genetic models of HDR resources found at home and abroad, Wang Guiling and Gan Haonan classified the occurrence types into high radioactive heat production, sedimentary basin, modern volcano and inner-plate active tectonic belt (Wang et al., 2016; Gan, 2015). This categorization approach, on the other hand, is not appropriate for assessing HDR resources.
The goal of HDR resource evaluation is to determine the quantity and offer fundamental data for decision makers based on the assumption of recognizing geothermal geological background. It ensures optimum resource efficiency while decreasing the danger of HDR development. A categorization method for HDR resources was suggested with this objective in mind. HDR resources are classified into three categories based on geological believability and economic viability: vision, reserve, and exploitable (Figure 1).
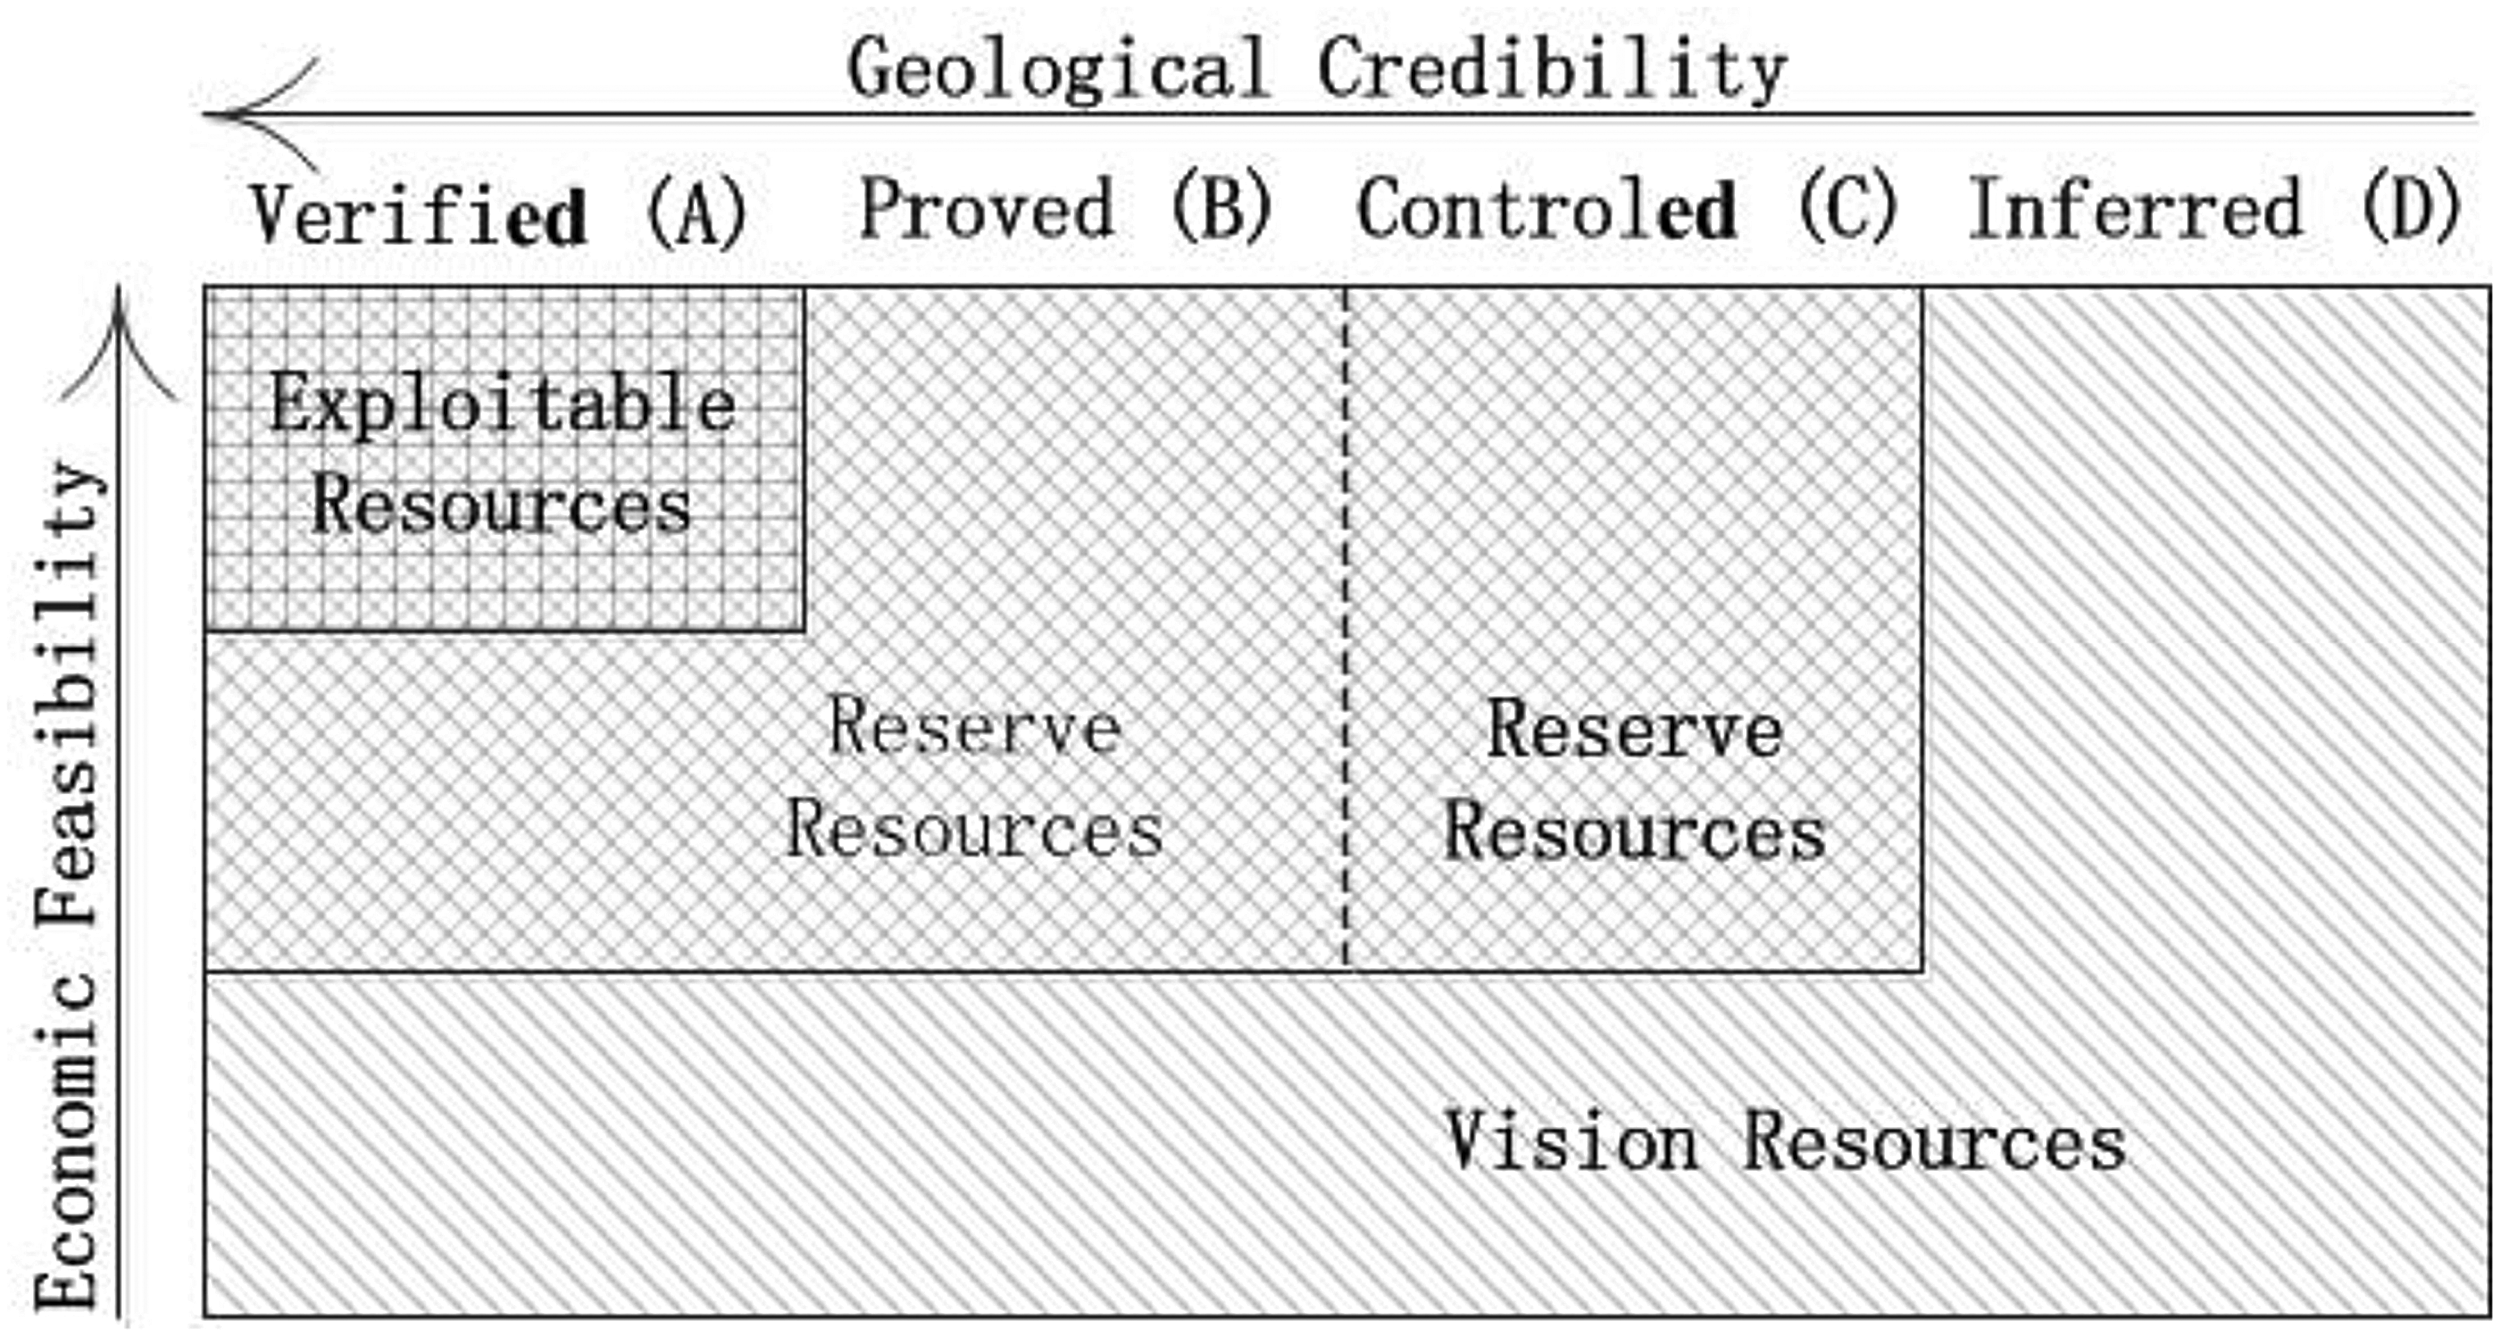
Classification scheme of HDR resources.
The vision resources located in rock masses with limited porosity and permeability within 10 km underground (the maximum depth of drilling) and temperatures greater than 180° C are HDR vision resources. It correlates to the research stage's inferred grade (D). The HDR within a depth of 6 km are reserve resources, and they match to the controlled grade (C) in prefeasibility exploration and the proven grade (B) in feasibility exploration. The exploitable resources correspond to the development stage's validated grade (A). Stationary resources may be evaluated using the volume technique for vision and reserve types, and the exploitable resources can be evaluated using the numerical simulation approach for exploitable kinds.
Volume method for stationary resource evaluation
Mathematical method
The volume technique is the most frequent way to calculate HDR stationary resources, and it is also the most fundamental method for calculating heat. The stationary resources are determined by the HDR volume, temperature, and thermophysical characteristics. It is the heat generated in a low porosity and permeability rock medium (ignoring the heat storage of fluid in the rock). The calculation formula is as follows (Teste et al., 2006; Wang et al., 2012; Lin et al., 2012):

Parameters settings
The parameter acquisition techniques for stationary resource appraisal are not the same, according to geological credibility. Below are the procedures for obtaining assessment parameters for inferred/controlled/proven (D/C/B) grade HDR resources.
Inferred grade (D)
The inferred HDR resource appraisal is primarily used to support the national energy development strategy by defining the major HDR target area. The density (ρ) and specific heat capacity (Cp) regulated by stratum lithology are typically regarded as constants, which may be determined by laboratory experiments or empirical values, due to the vast scale of evaluation and the limitations of exploration. The deep temperature can not be observed directly; instead, it has to be estimated using the steady-state heat conduction theory and temperature logging data, as well as rock thermophysical characteristics. The following is the calculation formula (Wang et al., 2012; Lin et al., 2012):


Controlled grade (C)
The controlled grade HDR resource evaluation is primarily used to define the best target region. Drilling core tests in the assessment region can be used to acquire thermal physical characteristics such as density (ρ) and specific heat capacity (Cp). Furthermore, the temperature field is mostly calculated using a mix of temperature monitoring, electrical methods, and seismic surveys. The temperature controlled by the borehole is appropriately projected based on the geological structure characteristics, and ultimately the temperature field is created.
Proved grade (B)
The assessment of high-quality HDR resources is mostly for development purposes. Thorough research is required to enhance evaluation accuracy, and the selection of various factors should be more acceptable. The stratum and fault distribution features are carefully shown using sophisticated 3D geological modeling. Drilling core tests can be used to determine the density (ρ) and specific heat capacity (Cp), as well as the impact of formation temperature and pressure. The temperature field distribution in faulted regions should be adjusted depending on the fault zone's water and heat conduction characteristics.
Numerical simulation method for exploitable resource evaluation
Factors affecting exploitable resources of HDR
The appraisal of exploitable resources is focused on the HDR development site, where geothermal geological conditions have been discovered and reservoir building has been completed successfully. The HDR exploitable resources may be estimated using a numerical simulation technique based on a clear well site architecture, mining plan, and other engineering designs.
The underlying geological conditions and the technical conditions are the two components that define the actual exploitable resources. The appraisal of HDR exploitable resources is based on geological parameters. Drilling, logging, geophysical prospecting, connectivity tests, and other methods are used to obtain information on the formation structure, rock properties, fracture distribution, and temperature field distribution within the HDR development site after the reservoir has been hydraulically fractured. These data may be used to create a geothermal geology model for numerical simulation. The key component for evaluating HDR exploitable resources is engineering conditions. It covers well-setting variables such as well location, well type, and injection-production interval, as well as mining process variables such as circulation flow rate and injection-production mode. Sanyal et al., discovered that when the thermal storage volume broken is higher than 0.1km3, the recovery rate of HDR resources remains constant at 40 ± 7%, regardless of well architecture, fracture spacing, or permeability (Sanyal and Butler, 2005). However, most engineering instances to far have failed to owe to “no injection or extraction” or “short circuit, resulting in thermal breakout” issues.
The recoverable coefficient was sometimes arbitrarily defined (approximately 2%, 20%, or 40%) in earlier research to estimate the HDR exploitable resources, but the findings were not convincing. As a result, the recoverable coefficient, which can be estimated by numerical simulation, is exclusively utilized to assess EGS performance. It may be used to assess the resources that can be exploited under similar geological conditions.
Numerical simulation process of HDR exploitable resources
HDR extractable resource assessment is a numerical simulation technique that is infinitely near reality. Aside from the fundamental geological and technical requirements, the extension of the geothermal geological model and the creation of a mathematical model are critical. The following is the procedure for evaluating HDR extractable resources.
Creation of a geological model for geothermal energy. Obtain fundamental geological information such as HDR mass, lithology, structure, permeability, porosity, thermophysical characteristics, and temperature field, among other things, by drilling, logging, geophysical prospecting, and connection tests, among other things. Build a 3D geological model of geothermal energy using these data. Establishing boundary conditions. Establish the reservoir conceptual model based on the cycle test and microseismic monitoring data, and set the external boundary conditions according to the EGS effect range. When situations allow, the heterogeneous fractures conceptual model should be used initially. Creating engineering conditions. Well information and mining technique information, such as well position, well type, interval, circulation flow, and so on, are set according to the engineering design. Calculation of numerical simulation. Fit the measured data, such as engineering cycle rate, wellhead pressure, and temperature, to the fracture distribution, width, roughness, and other characteristics. It can fit the reservoir injection capacity and impedance of locations with similar geological characteristics if there are inadequate on-site observed data.
The evaluation of HDR extractable resources is a dynamic process that should be noted. Existing data may be utilized to forecast future resources that can be extracted. To verify the validity of the numerical simulation model, it must be adjusted after gathering adequate field observation data.
Mathematical method
Thermal power, reservoir life, and cumulative exploitable resources are all influenced by the fracture conceptual model. Oversimplified conceptual model findings on production temperature and reservoir life frequently differ from reality, making it difficult to persuade people (Zhai et al., 2020; Huang et al., 2017; Li et al., 2018). Based on this, we prefer to choose the DFN model in the simulation process.
We consider the reservoir as a dual medium model comprised of matrix rock mass and cracks, calculate using the local thermal nonequilibrium theory, and apply the following assumptions to simulate the energy transfer between rock mass and fluid: (1) Darcy's law applies to the seepage in the matrix and cracks; (2) Heat conduction follows Fourier's law, disregarding the effect of thermal radiation; (3) Seepage is a single-phase liquid flow with no phase change; (4) No chemical reaction occurs between the fluid and the rock; (5) Gravity and capillary force are ignored.
Local thermal nonequilibrium multiphysics coupling can truly reflect the heat transfer process at the interface between the fluid and fractured medium. This is achieved by coupling the heat equations in the solid and fluid subdomains through a transfer term proportional to the temperature difference between the fluid and the solid. The corresponding heat equations in the solid are :


Stationary HDR resources evaluation of the Gonghe Basin and Qiabuqia geothermal area
Geological background
The Gonghe Basin is Qinghai Province’s third largest basin. With a total size of approximately 1.52 × 10⁴ km2, it is roughly diamond-shaped in plane, small in the west and large in the east. The Yellow River divides the basin into two sections as it flows from southwest to northeast along its short axis. The Gonghe Basin is located in the West Qinling orogenic belt, straddling two tertiary structural units: the Zongwu Longshan-Xinghai Aola trough (a) and the Zeku back-arc foreland basin (b).
The Gonghe Basin is composed of sedimentary caprock and granite basement (Figure 2). The sedimentary caprock is mainly composed of the Xining Formation (EN1x), Xianshuihe Formation (N1x), Linxia Formation (N2l) and Gonghe Formation (Q1–2g). The Longwuhe Formation (T1−2l) and Gulangdi Formation (T2g) exist in some areas. The granite basement was formed in the Middle and Late Triassic, and its lithology includes granodiorite, monzonitic granite, granite porphyry, etc. (Figure 3).
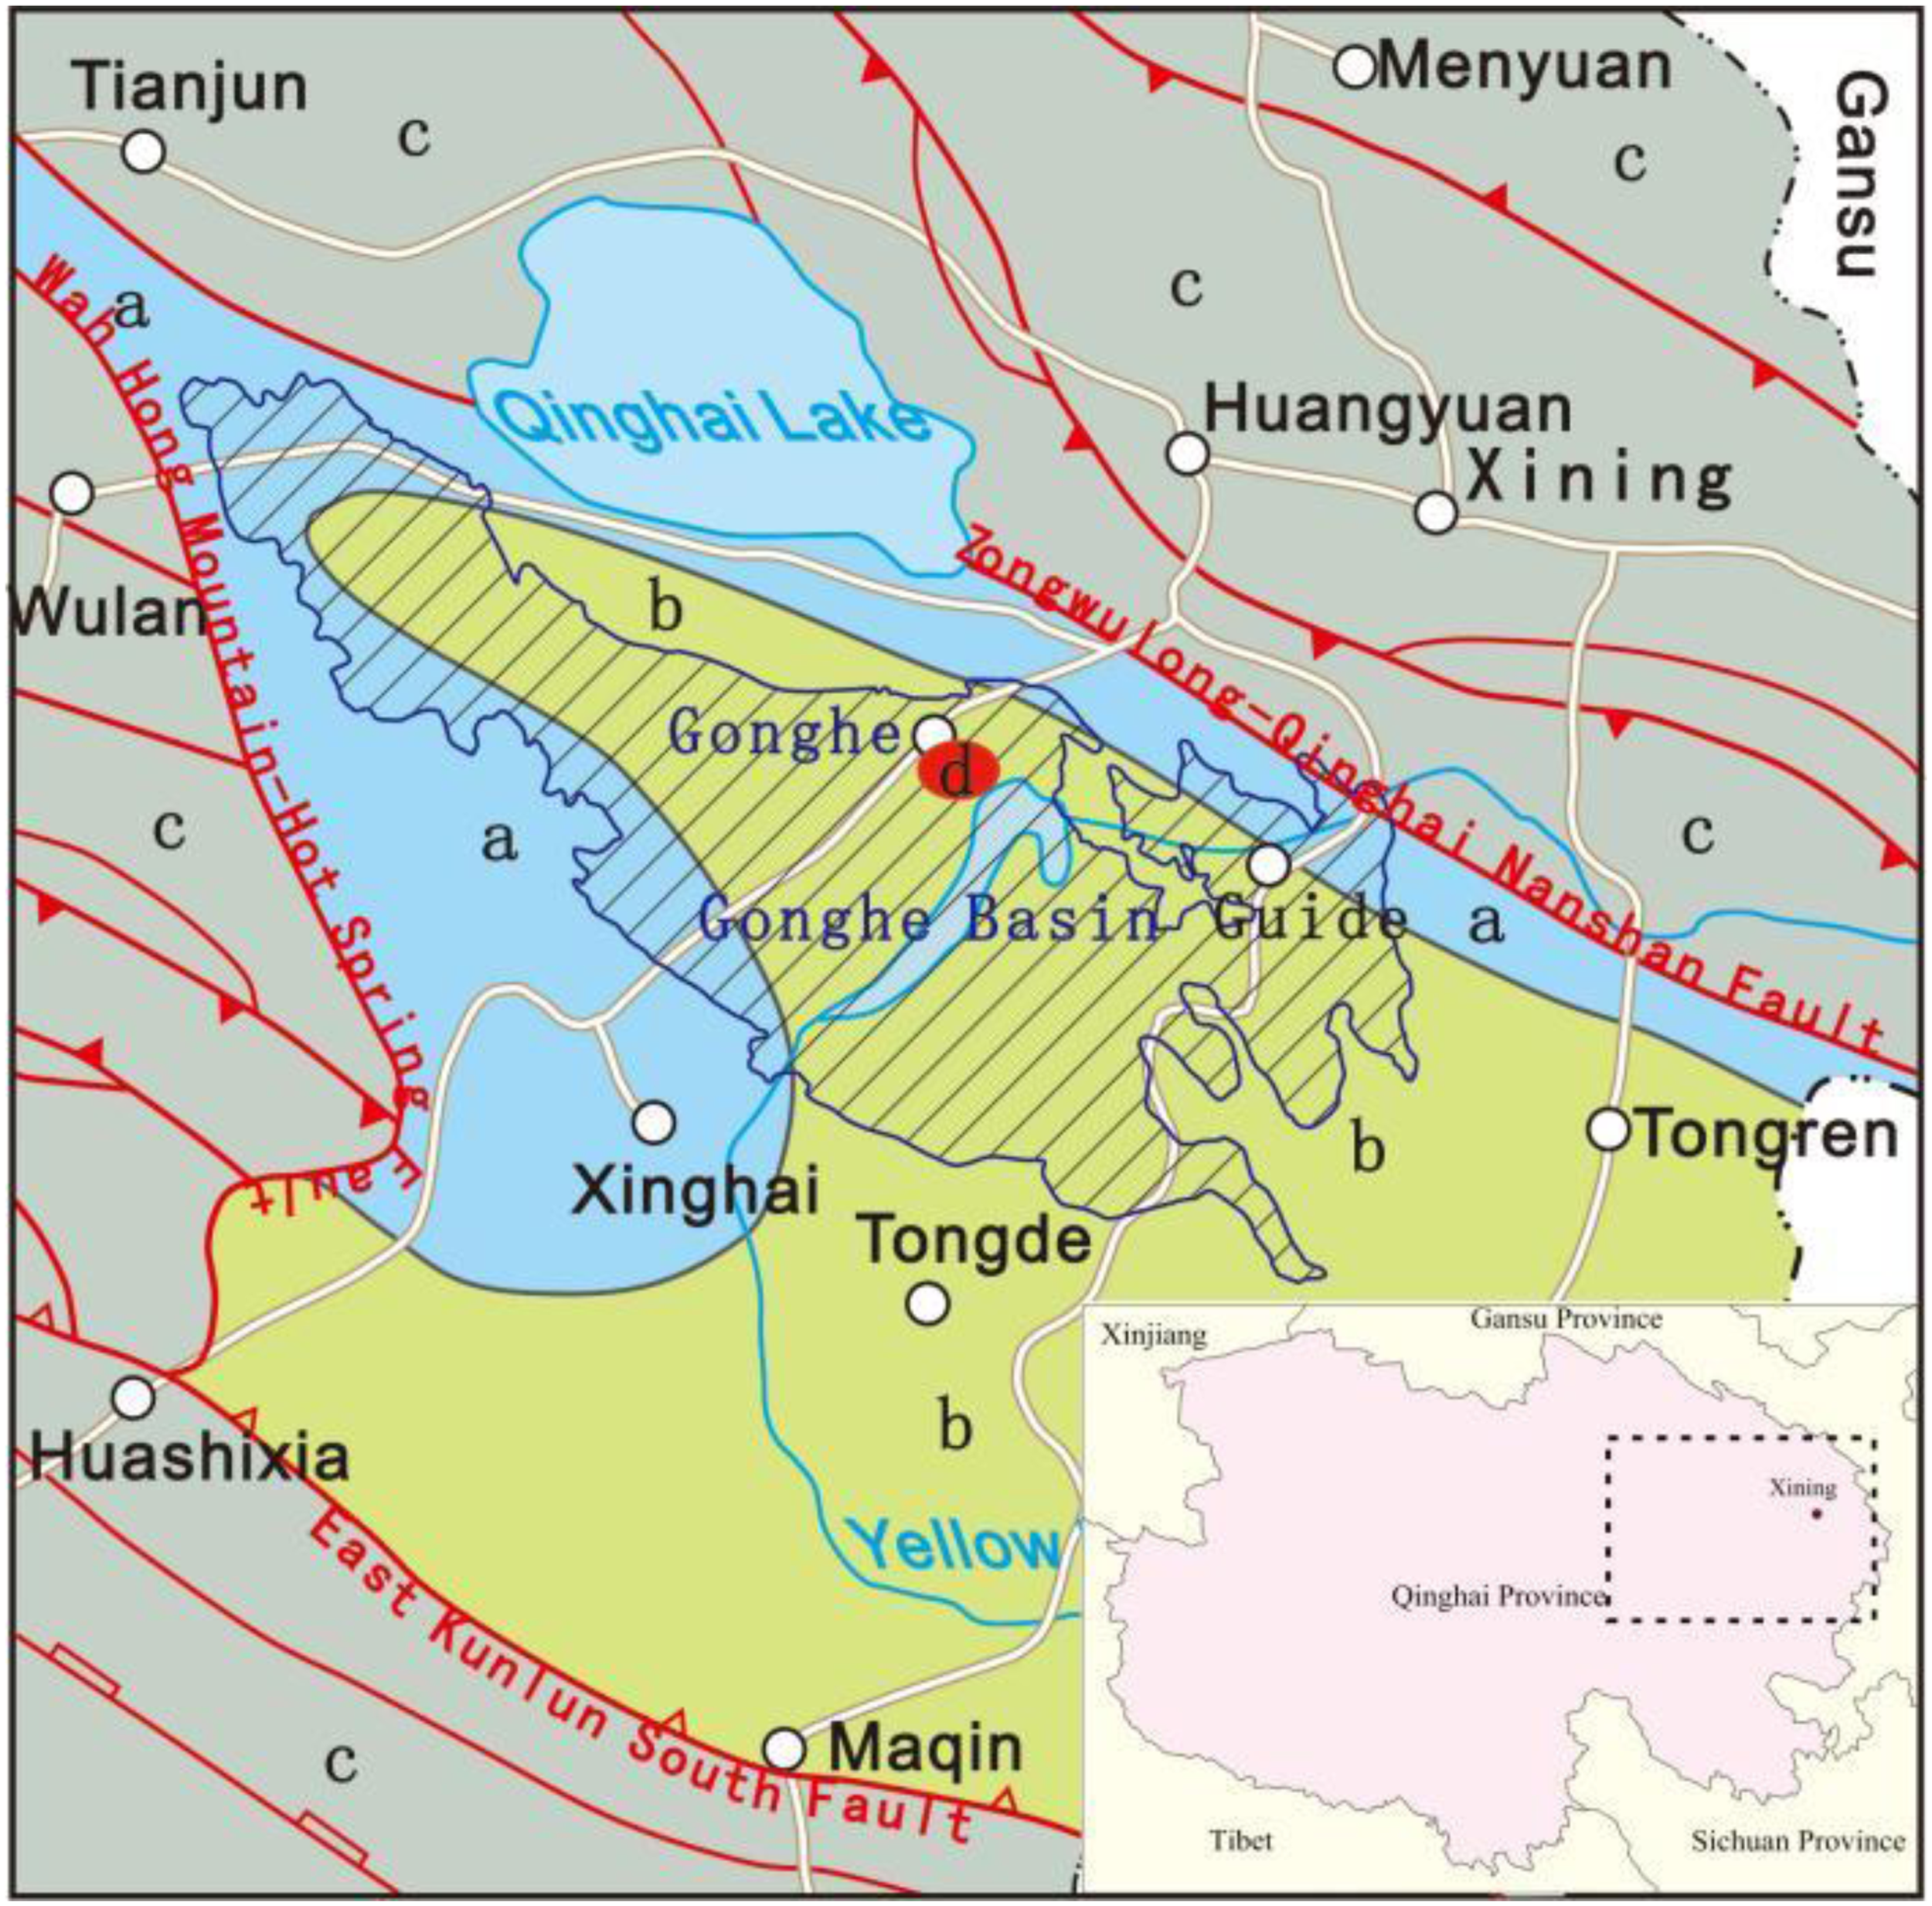
Tectonic location map of the Gonghe Basin (a. Zongwu Longshan-Xinghai Aola trough; b. Zeku back-arc foreland basin; c. Other Tectonic units; d. Qiabuqia HDR mass).
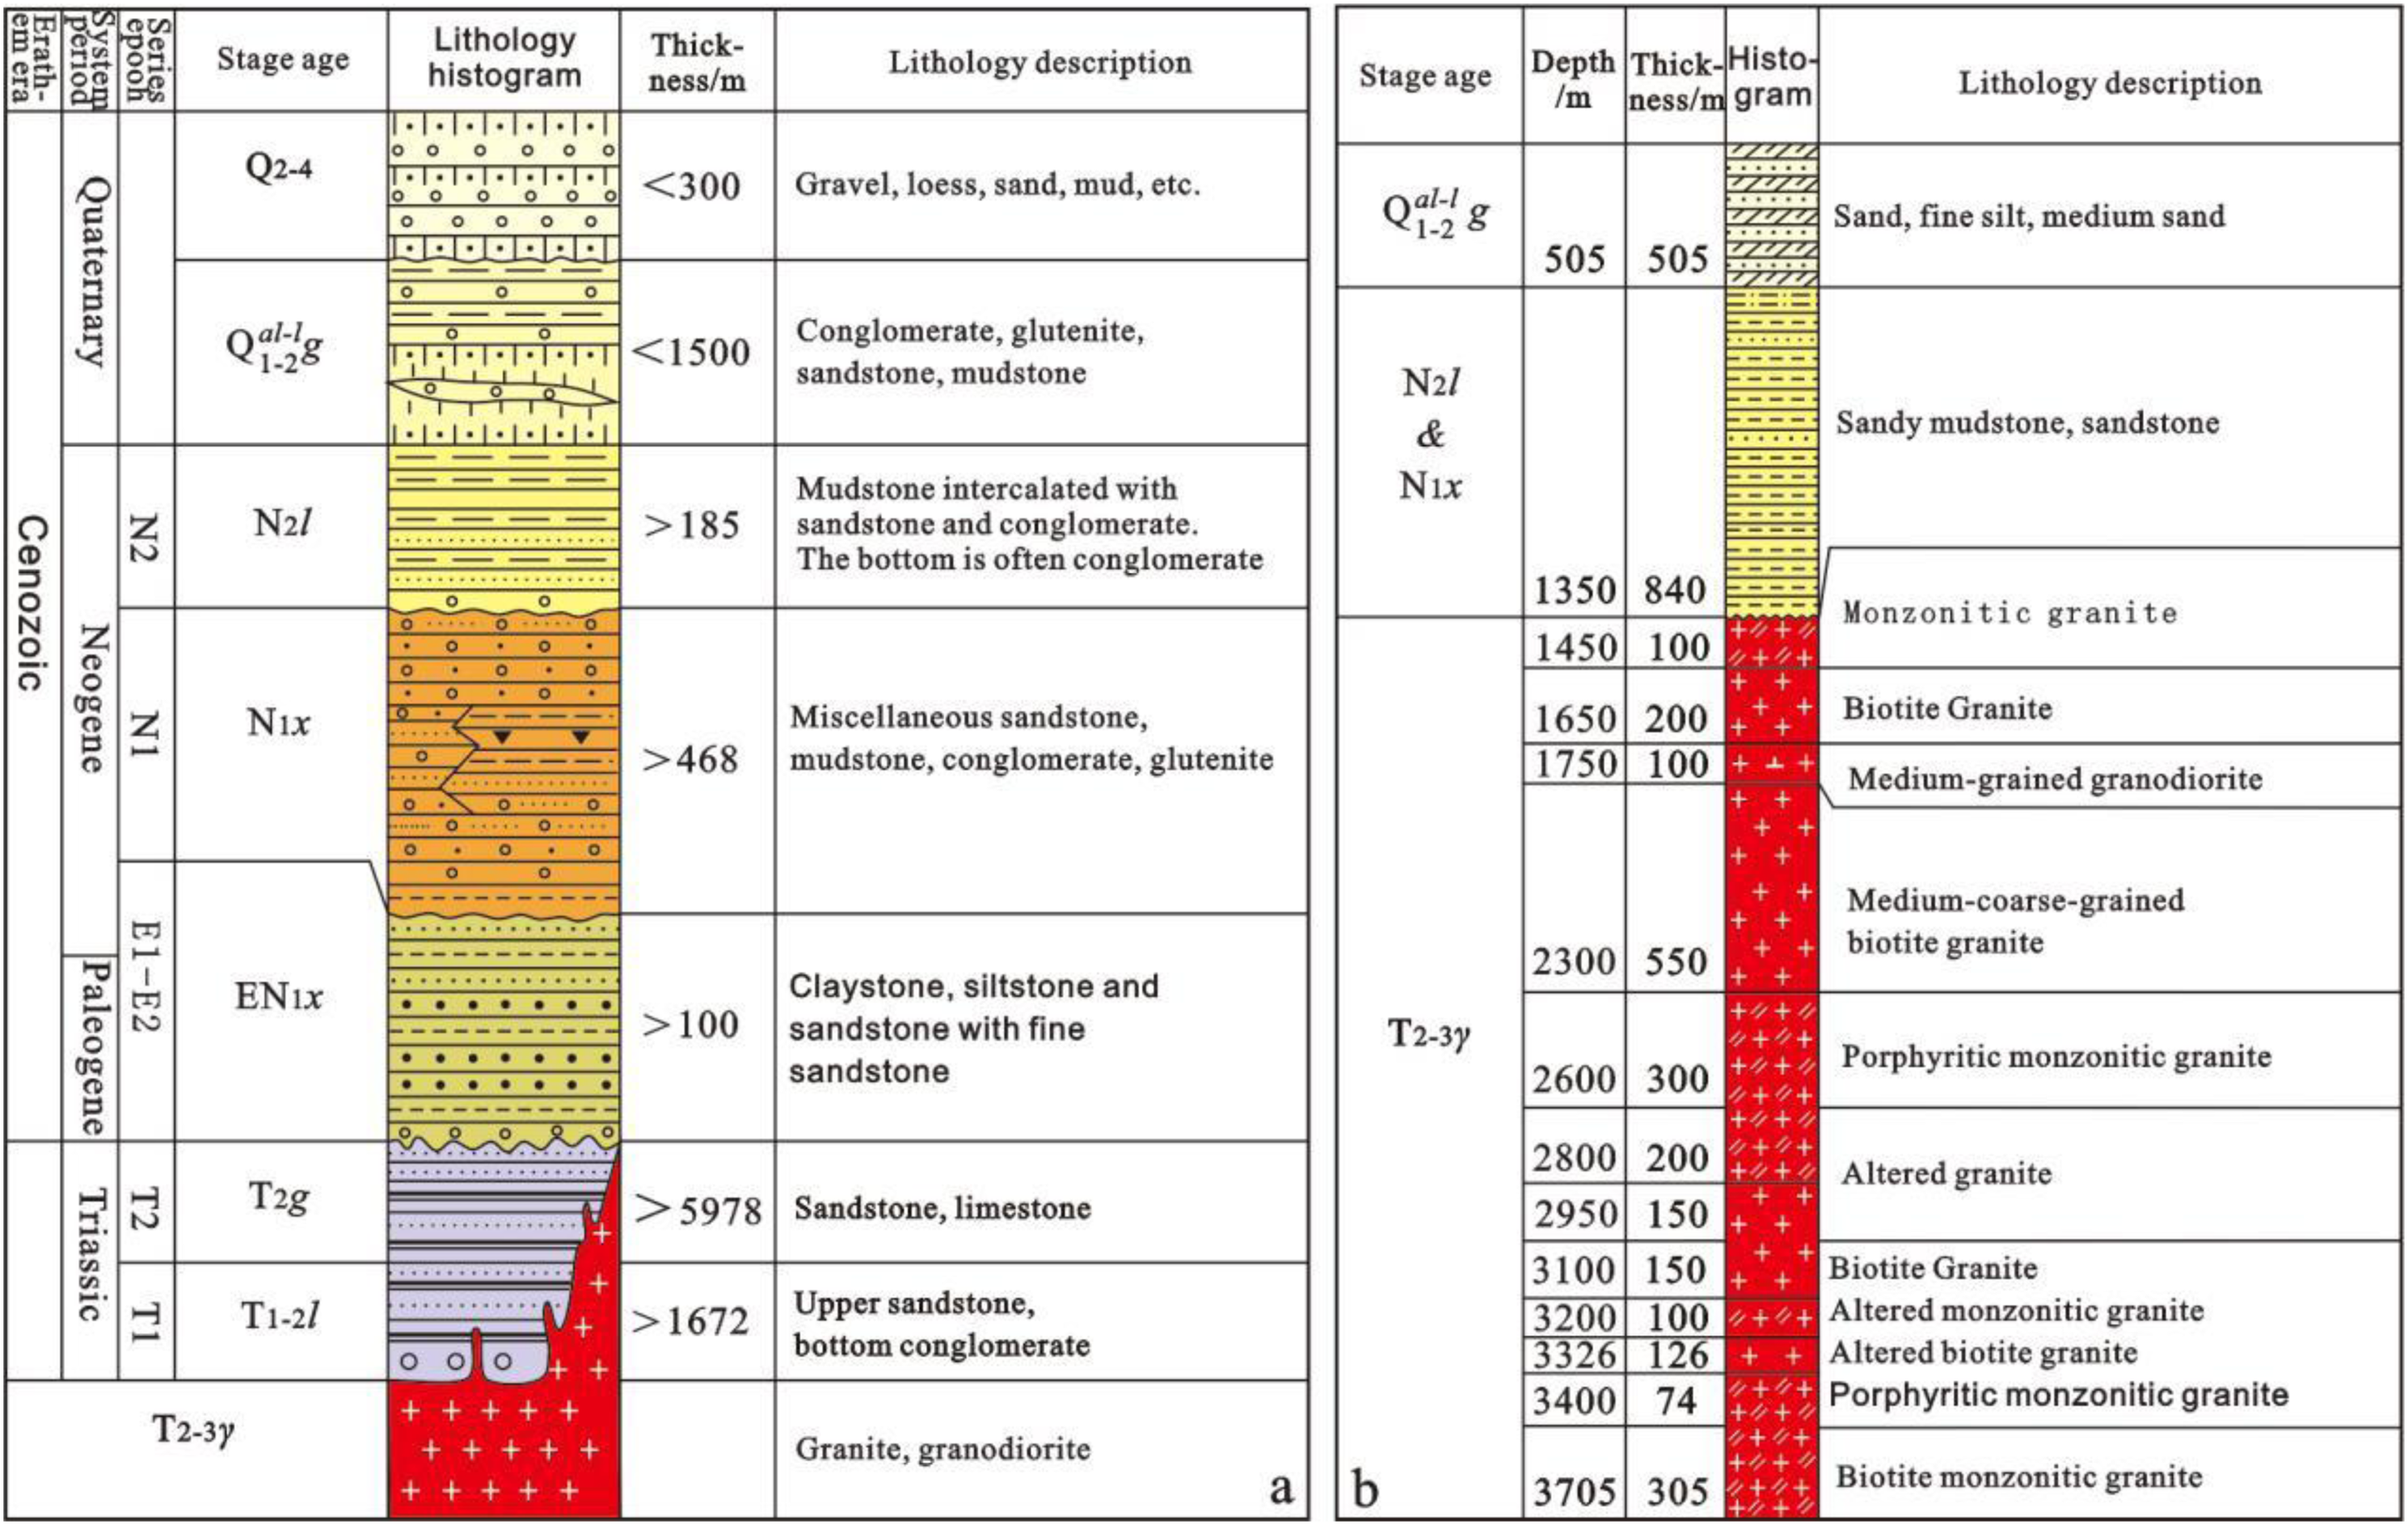
Stratigraphic histogram of the Gonghe Basin (a) and the GR1 hole (b) (Zhang et al., 2018b).
With a depth of 3705 meters, well GR1 is located on the platform southeast of Qiabuqia town. Well GR1 entered the granite section at a depth of 1 350 m, according to drilling data. CHEGS used a dispersed optical fiber to detect the temperature of GR1. The temperature of the granite reached 180 °C at a depth of 3 300 m, and it climbed practically linearly with increasing depth. The geothermal heating rate was 43.8°C/km, which is normal for a geothermal system with high thermal conductivity. The heat source for the Gonghe Basin, according to Zhang Senqi, might be a partial melting layer in the crust, augmented by heat generated by radioactive materials. The upper thick sedimentary caprock has strong thermal insulation properties, which allow HDR resources to accumulate secondary heat (Zhang et al., 2018b; Zhang et al., 2020).
Inferred HDR resource (D level) evaluation of the gonghe basin
Establishment on geological model
Because the Gonghe Basin has a single geological border, this assessment considers the whole Gonghe Basin when assessing inferred grade (D) HDR resources. The inferred grade (D) HDR resource is defined as the thermal energy stored in granite with a depth of less than 10 km and a temperature greater than 180°C, according to the categorization methodology. The Gonghe Basin's sedimentary caprock is considered to be glutenite for ease of computation, while the shallow foundation is supposed to be granite. The burial depth of the granite top surface is shallow in the east and deep in the west, according to geophysical methods such as magnetotelluric and ambient noise seismic imaging, which is also confirmed by drilling.
The top and bottom elevations of the Gonghe Basin have been merged for ease of computation. The top elevation is 0 kilometers, while the lower elevation is −10 kilometers. Granite burial depth and stratum lithology are both modified correspondingly. The processed 3D geological model is divided into equal size cube grids, which are 1 km long, 1 km wide, and 0.1 km high. The total number of divided blocks is 1,514,300.
Preference settings and calculation for evaluation
The evaluation of stationary resources is based on parameter setting. Temperature, volume, density, and specific heat capacity are the most important factors. In the Gonghe Basin, 123 typical rocks were gathered, with lithologies ranging from granite to granodiorite to sandstone. The density was measured by a true density meter (3H-2000) with a resolution of up to 0.0001 g/mL. The density range of the test granite is 2 546∼2 620 kg/m3, and the granite density is 2 550 kg/m3 in this evaluation; the variation range is large due to the difference in lithology, and the caprock density is 2 500 kg/m3. The specific heat capacity is measured by a specific heat meter DSC204F1, the measuring range is −180∼700°C, and the temperature rise and fall rate is 0∼200 K/min. The specific heat capacity of granite is distributed between 709∼800 J/(kg*K), and the value of this evaluation is 750 J/(kg*K); the specific heat capacity of sandstone is distributed between 805∼845 J/(kg*K), and the value is 825 J/(kg*K) in this evaluation. The rock heat generation rate is calculated using the following formula proposed by Rybach in 1976.

The multiyear average temperature in the Gonghe Basin is 6.34°C, and the terrestrial heat flow is 114.7 mW/m2 (Zhang et al., 2019b). Based on the steady-state heat conduction theory (Equation 3), the temperature field in the Gonghe Basin is calculated. The temperature distribution at the centroid of granite blocks shallower than 10 km in the Gonghe Basin is shown in Figure 4. Comparing the measured temperature with the inferred temperature of the GR1 well, the two temperature curves fit well, which also confirms the reliability of the parameters (Figure 5).
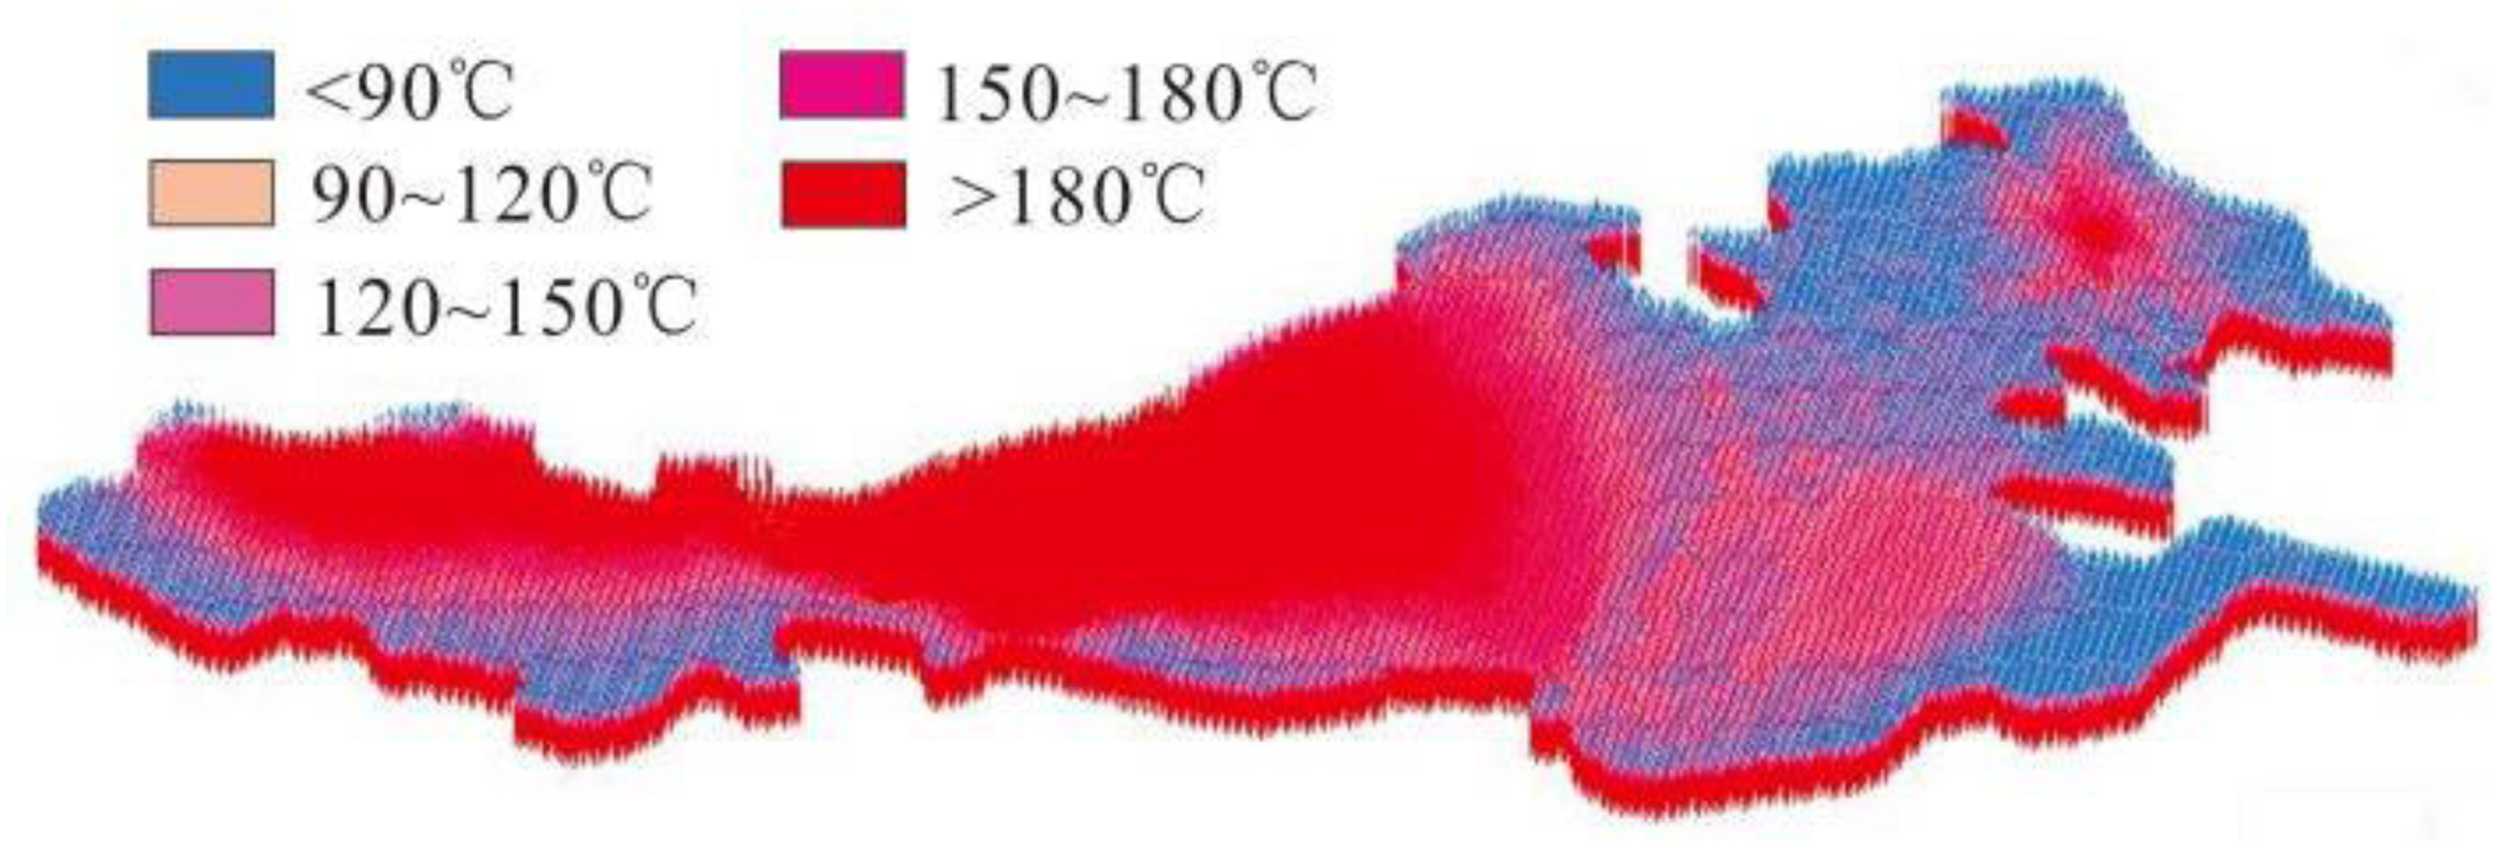
Temperature distribution at the centroid of granite blocks within a depth of 10 km in the Gonghe Basin.
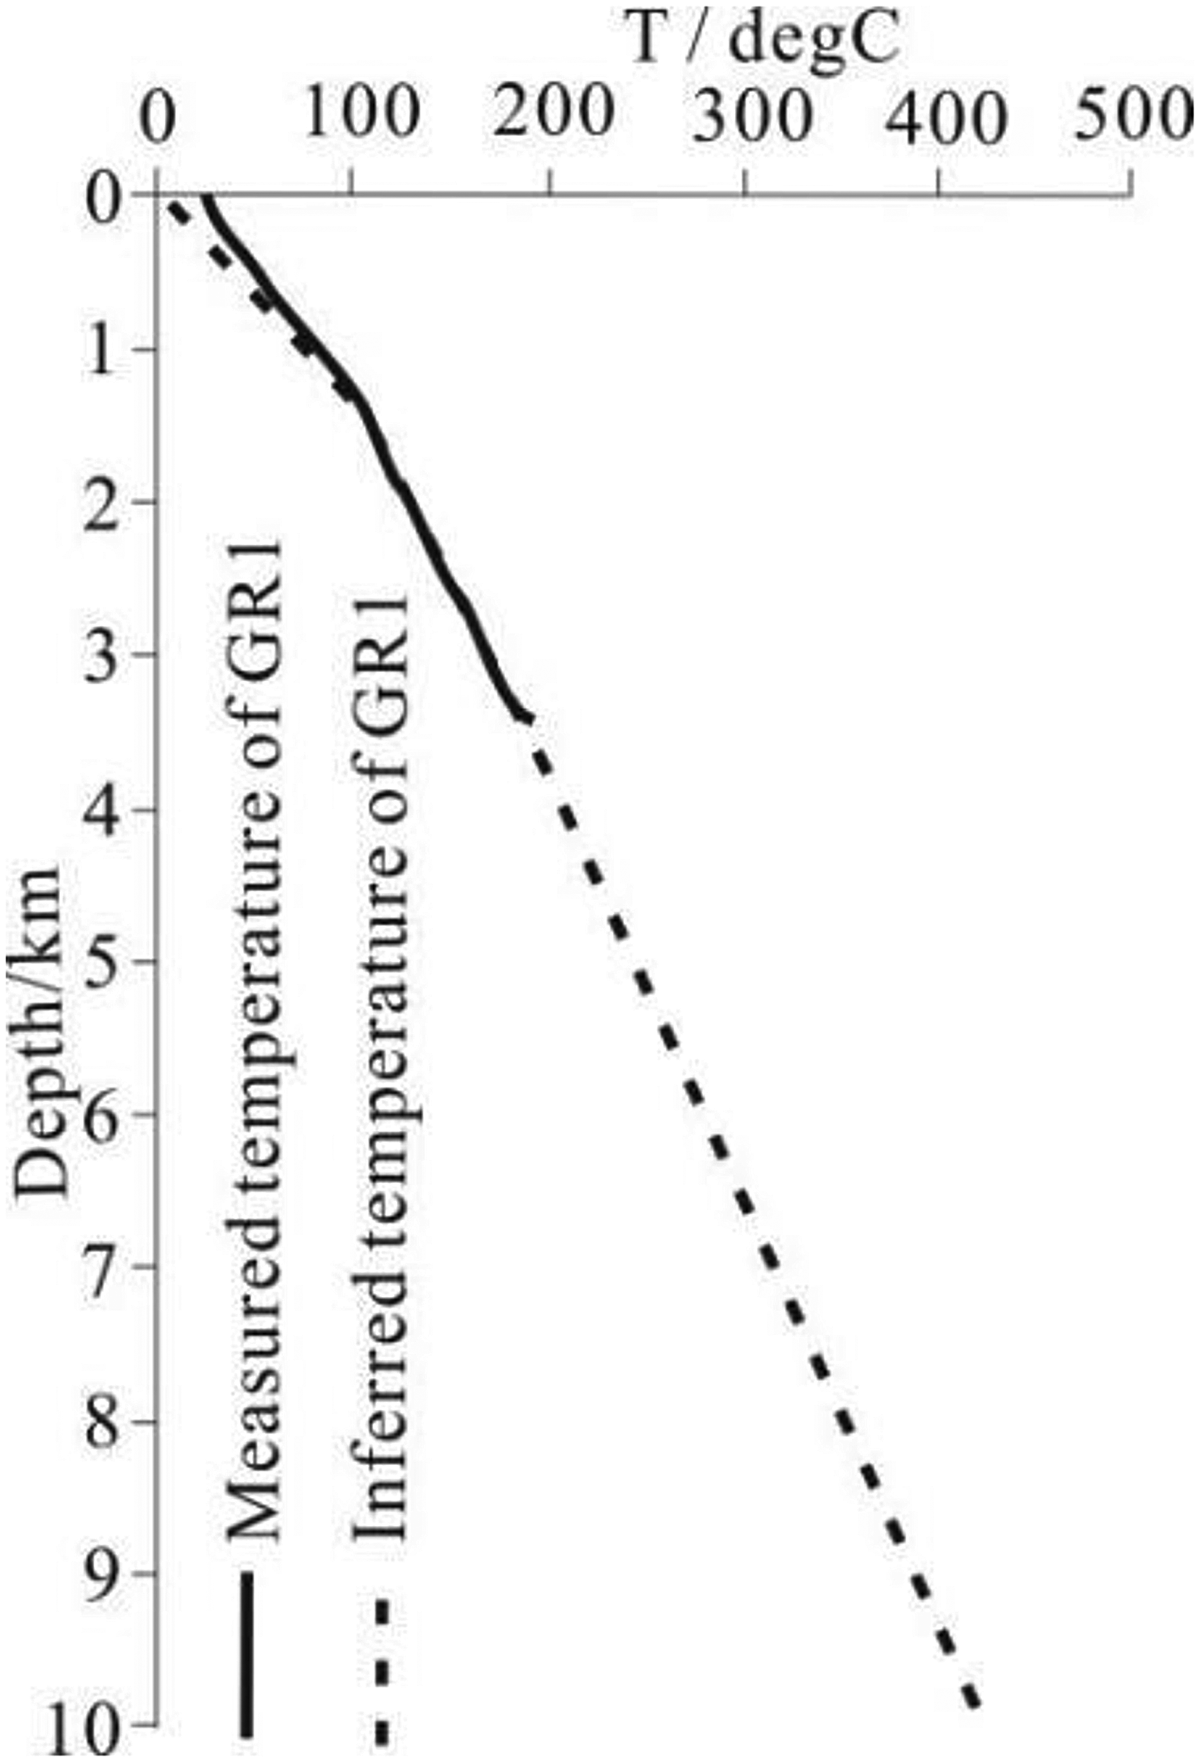
Comparison of the predicted and measured temperature curves of GR1.
Taking 90°C as the lower limit temperature for development, the cumulative calculation results show that the HDR resources within a depth of 10 km in the Gonghe Basin contain 4.076 × 10²² J of thermal energy, which is equivalent to 1.39 × 10¹² t of standard coal.
Controlled HDR resource (C level) evaluation of the Qiabuqia geothermal area
Establishment on geological model
Magnetic anomalies are present in concealed HDR Zhang Senqi used the V2D-depth technique to infer the HDR mass in Qiabuqia based on high-precision aeromagnetic survey data. The Qiabuqia HDR mass is additionally verified by the GR1, GR2, DR3, and DR4 HDR exploration holes (Figures 6 and 7). The control range of GR2 was extended by half based on the HDR mass range specified by high-precision aeromagnetic survey data to estimate the HDR mass distribution range in Qiabuqia. It stretches 21.2 kms east to the west and 14.3 kms north to south, with a total area of 246.90 km2 (Figure 6) (Zhang et al., 2018a).
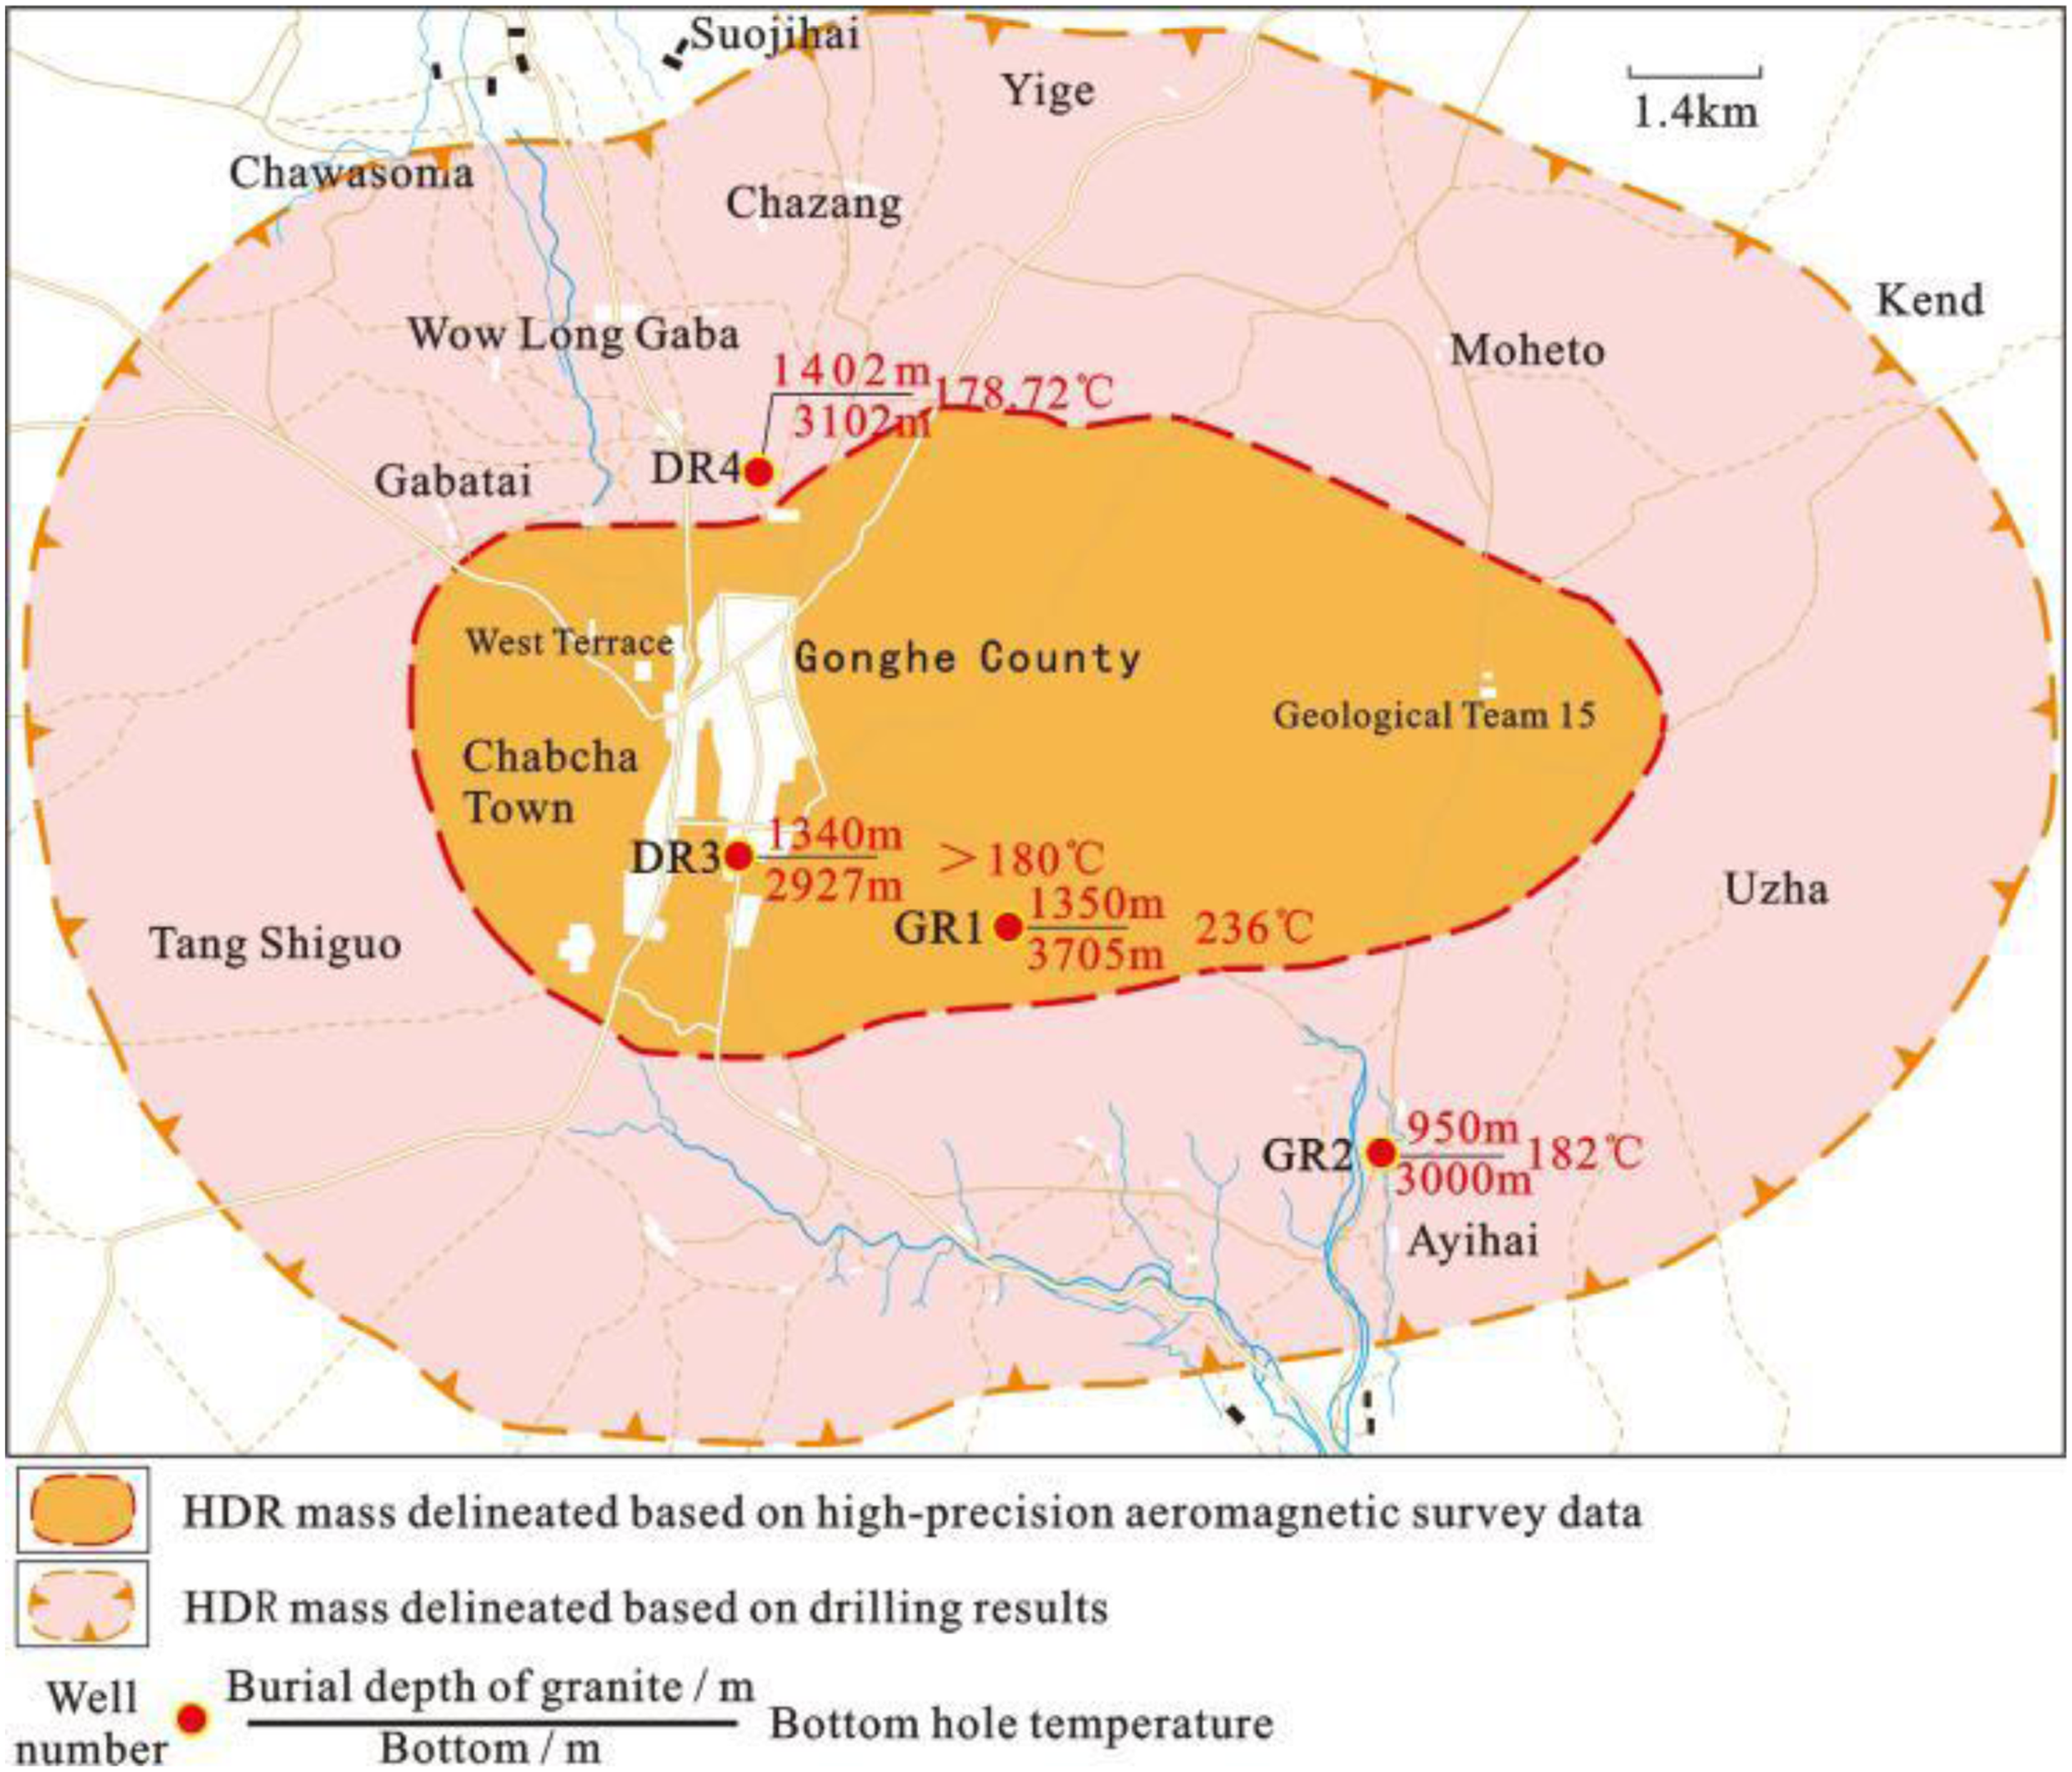
Distribution map of Qiabuqia HDR mass inferred based on high-precision aeromagnetic survey and borehole data (Zhang et al., 2018b).
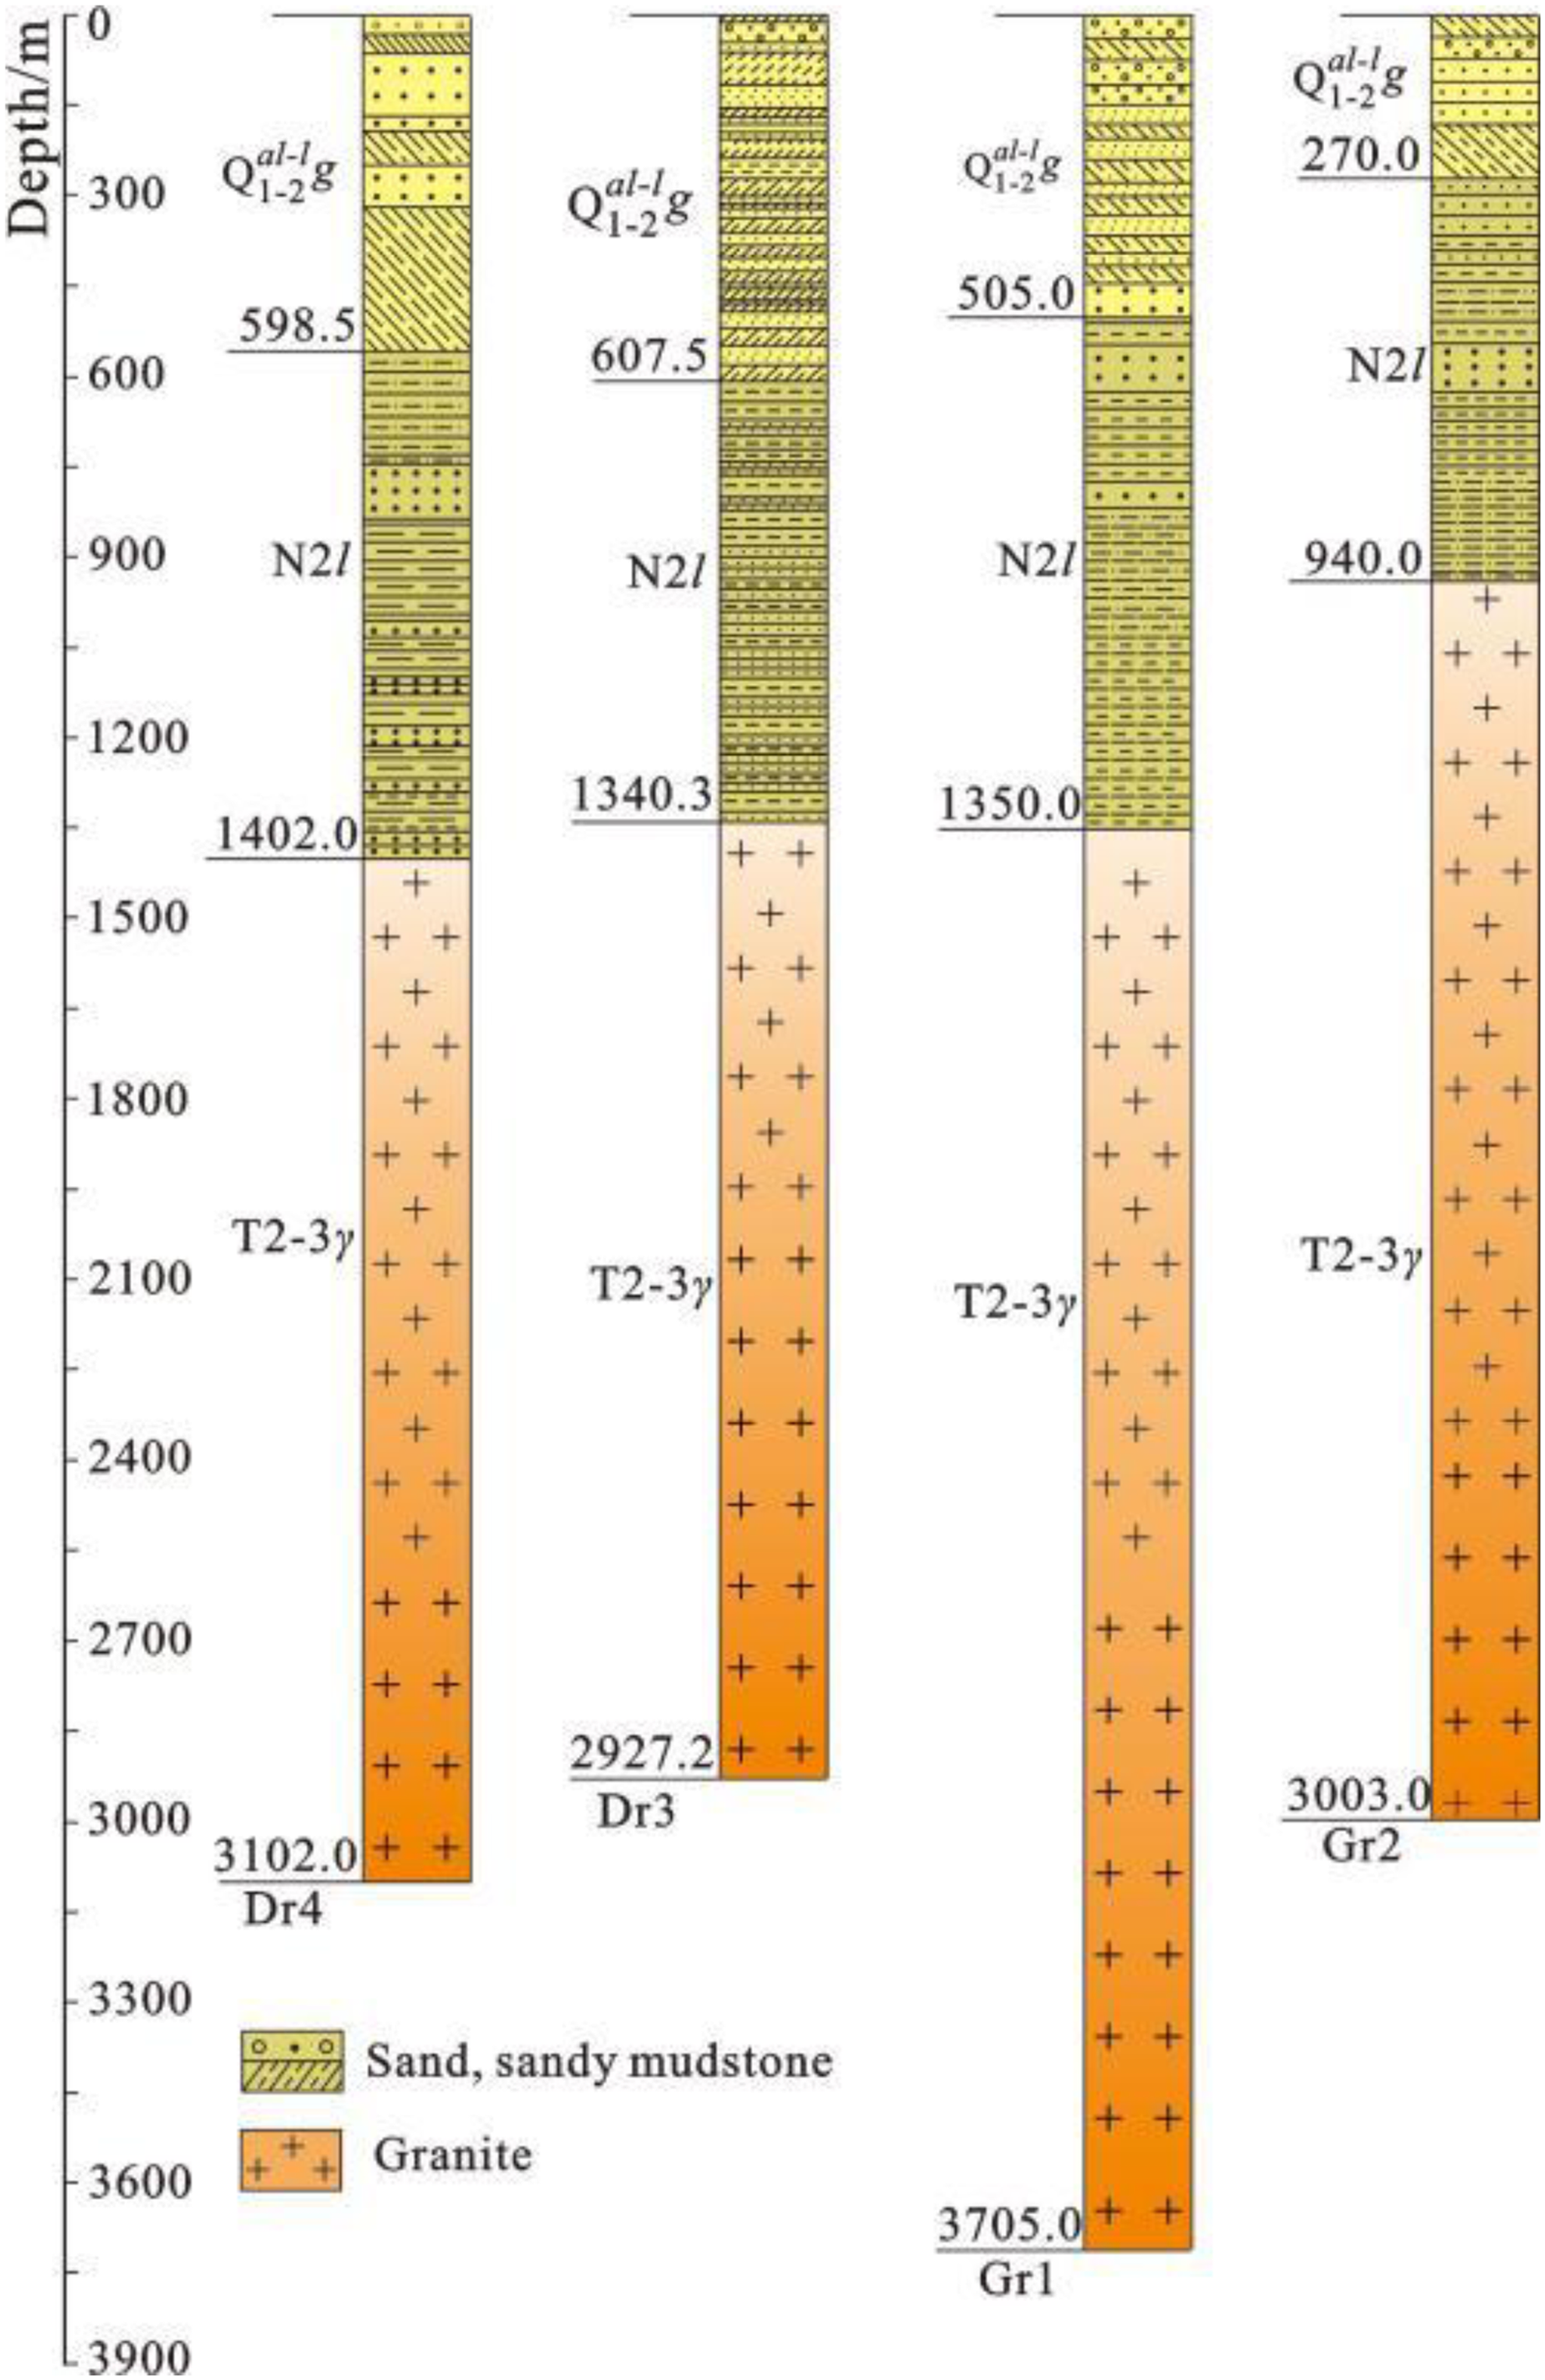
Histogram of HDR exploration holes in Gonghe area.
The reserve resources are computed using the Qiabuqia HDR mass as the assessment object. The HDR reserve resource is defined as the thermal energy stored in granite with a depth of less than 6 km, survey accuracy of control level (C), and temperature more than 180°C, according to the categorization system. The strata inside the defined Qiabuqia HDR mass are divided into two layers, with the sedimentary caprock being glutenite and the shallow foundation being granite. Geophysical research techniques such as magnetotelluric, high-power time-frequency electromagnetic approaches, and 2D seismic surveys have been used to establish the granite burial depth, which has been confirmed by drilling.
The top and bottom elevations of the Qiabuqia HDR mass model have been merged for ease of computation. The top elevation is 0 kms, while the lower elevation is −6 kms. Granite burial depth and stratum lithology are both modified correspondingly. The processed 3D geological model is split into 100 m long, 100 m wide, and 10 m high cube grids of equal size. The total number of divided blocks is 450,300.
Preference settings and calculation for evaluation
The data from borehole temperature measurements are crucial in determining the control grade(C) HDR reserves. Temperature logging was performed on the major holes in the Qiabuqia HDR mass. The temperature of the granite section varies practically linearly with depth (Figure 8), and the average geothermal heating rate can reach 45.5°C/km, according to the findings (Table 1). The deep temperature is inferred using the average geothermal gradient of the granite portion in each well, and then interpolated using the inverse power ratio technique to generate the temperature field of the Qiabuqia HDR mass. The parameter parameters for inferred HDR resources, such as density and specific heat capacity, remain the same (D).
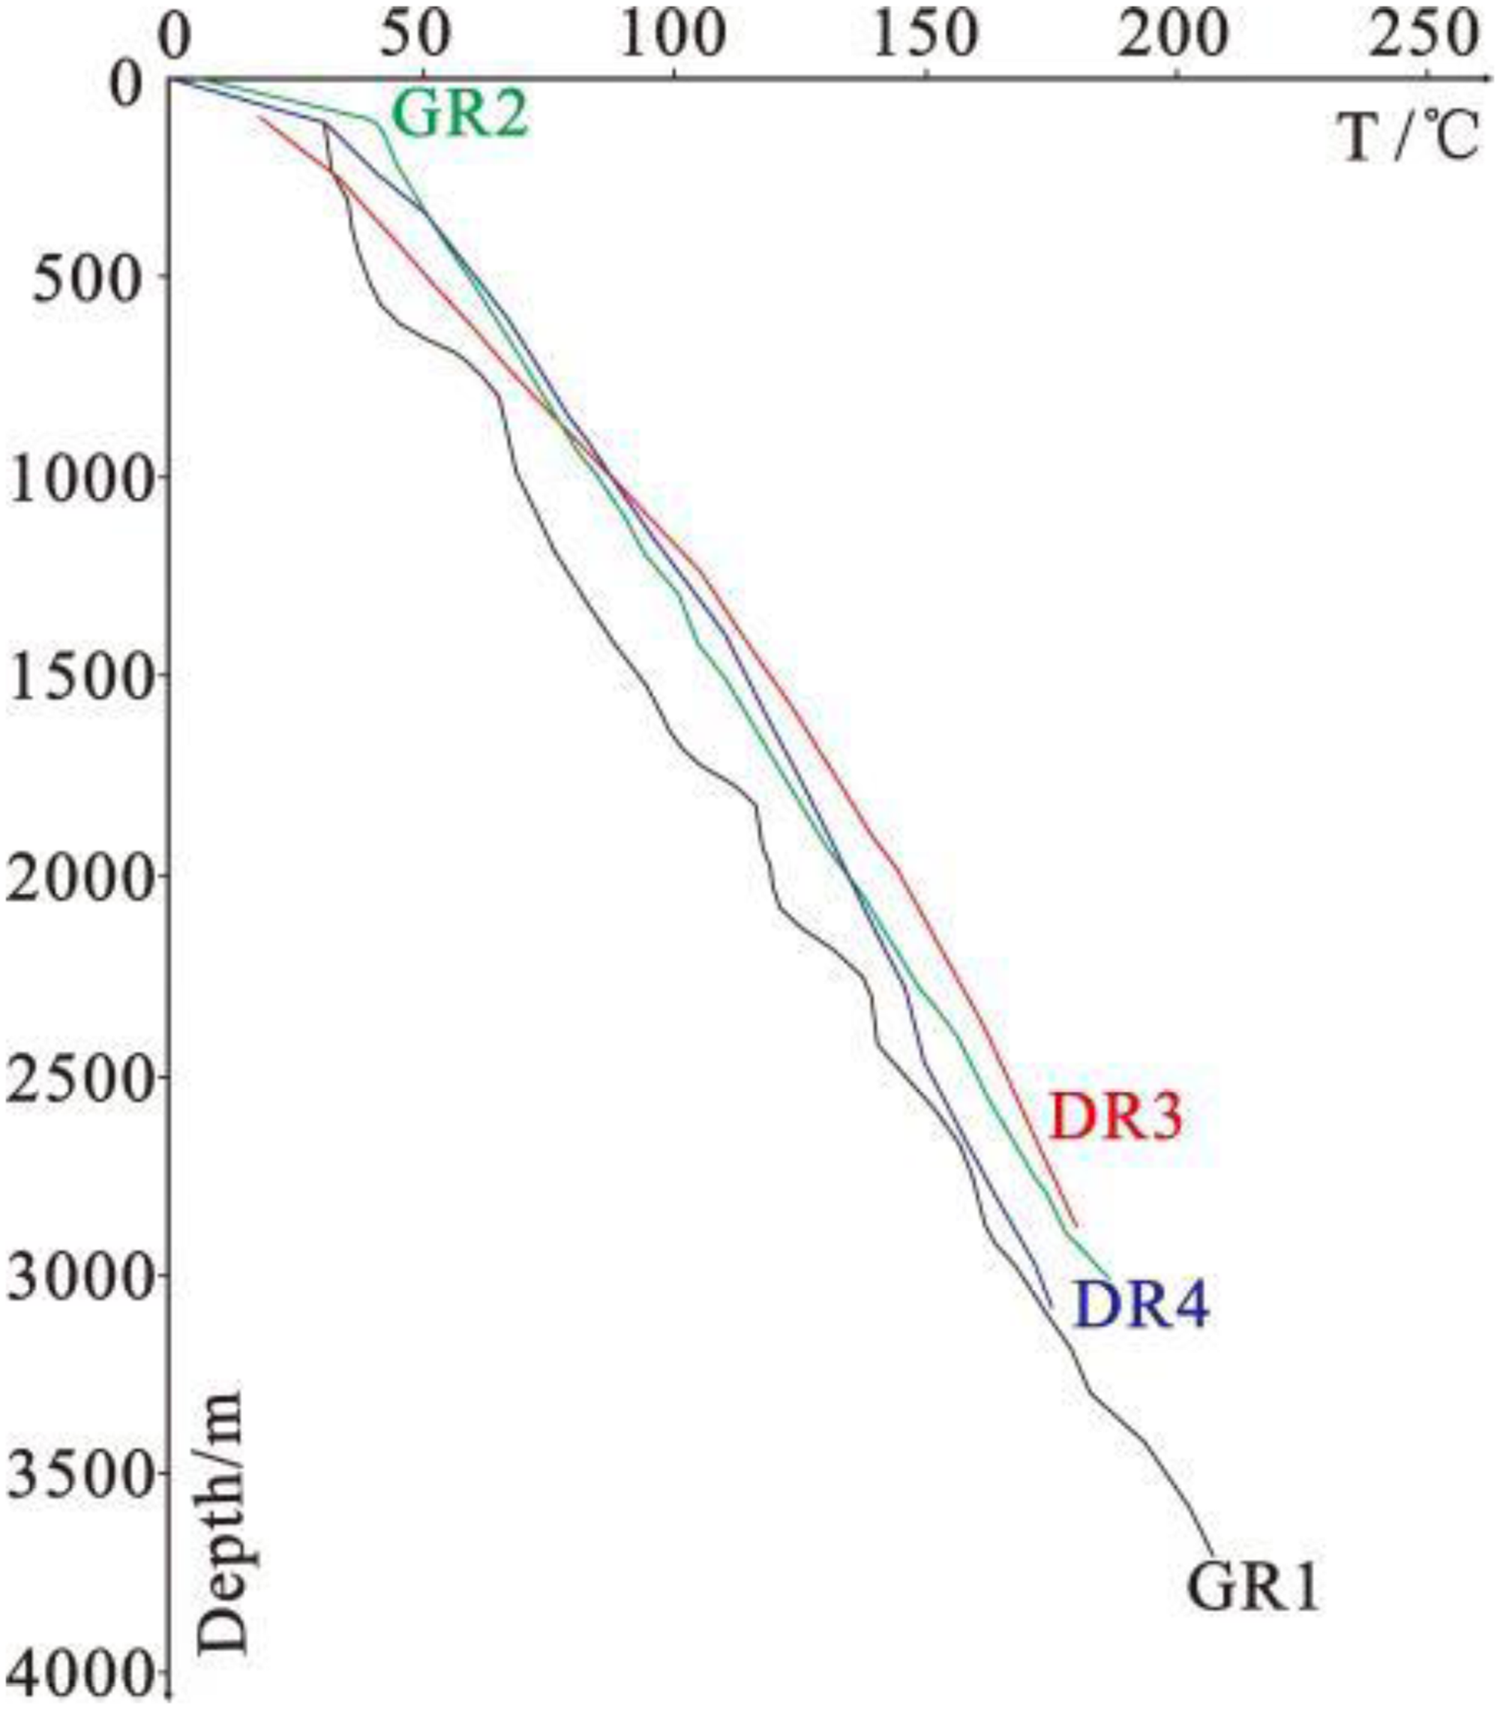
Depth-temperature relationship curve of HDR well.
Calculation table of the geothermal temperature increase rate in the granite section of the HDR well.
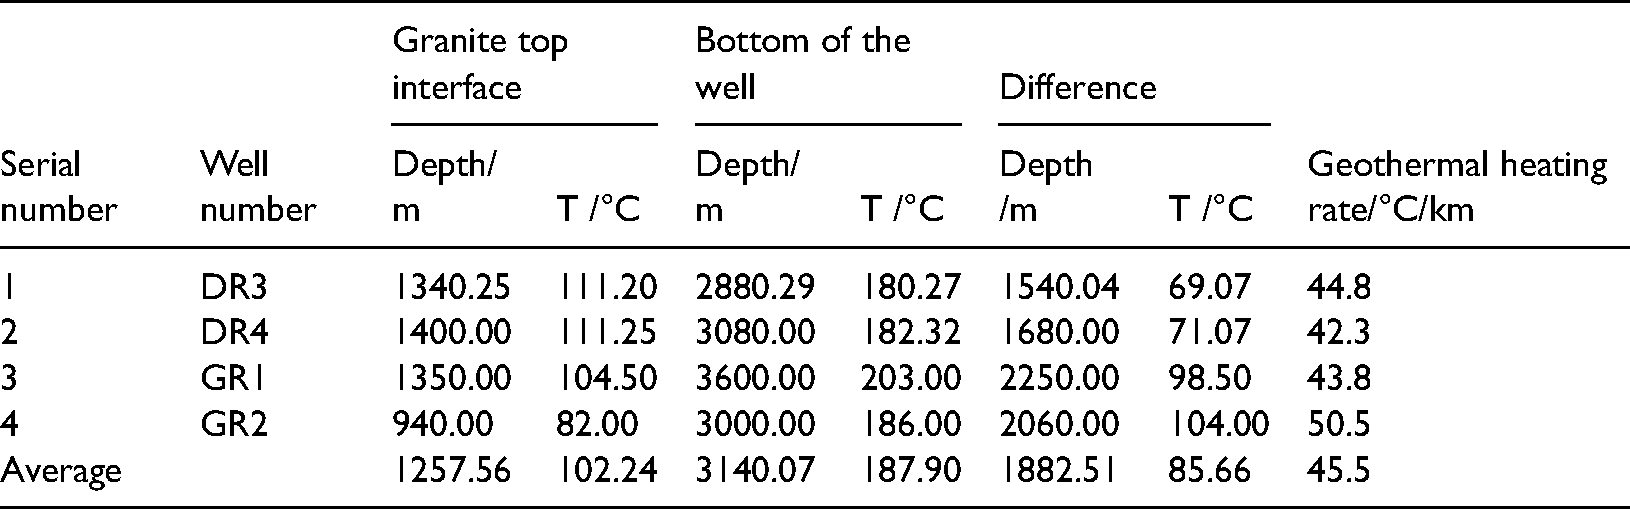
Taking 90°C as the lower limit temperature for development, the cumulative calculation results show that the HDR resources within a depth of 6 km in the Qiabuqia HDR mass contain 2.11 × 10²⁰ J of thermal energy, which is equivalent to 7.2 × 10⁹ t of standard coal.
Exploitable resources evaluation of Qiabuqia EGS site
Establishment on discrete fracture network model
The majority of cracks in new rock masses are caused by geological pressures such as extrusion, torsion, and stretching, which follow a strong statistical rule. The geological structural unit of the Cheji Sag, where the Qiabuqia HDR development site is located, has shallow burial in the east and deep burial in the west, according to drilling and geophysical data. On the east side, the Qiabuqia HDR granite mass is comparable to the Dangjiasi granite mass. We used this information to calculate the number of cracks in the Dangjiasi granite mass, which we used to estimate the number of fractures in the granite reservoir at the Qiabuqia HDR development site.
We investigated 8 fresh sections of the Dangjiasi granite body, with a total of 277 fractures. The length, width, mechanical properties and filling conditions of each fracture were recorded, and isodensity maps (Figure 9a) and rose maps (Figure 9b) were made. The Dangjiasi granite mass has 3 groups of dominant strike fractures, which are 30–40°, 90−100° and 160−170°, of which 30−40° accounts for the highest proportion. The dip angles of the fractures are concentrated in the low-angle area less than 45°, and the spreading characteristics are conducive to the communication between shafts.
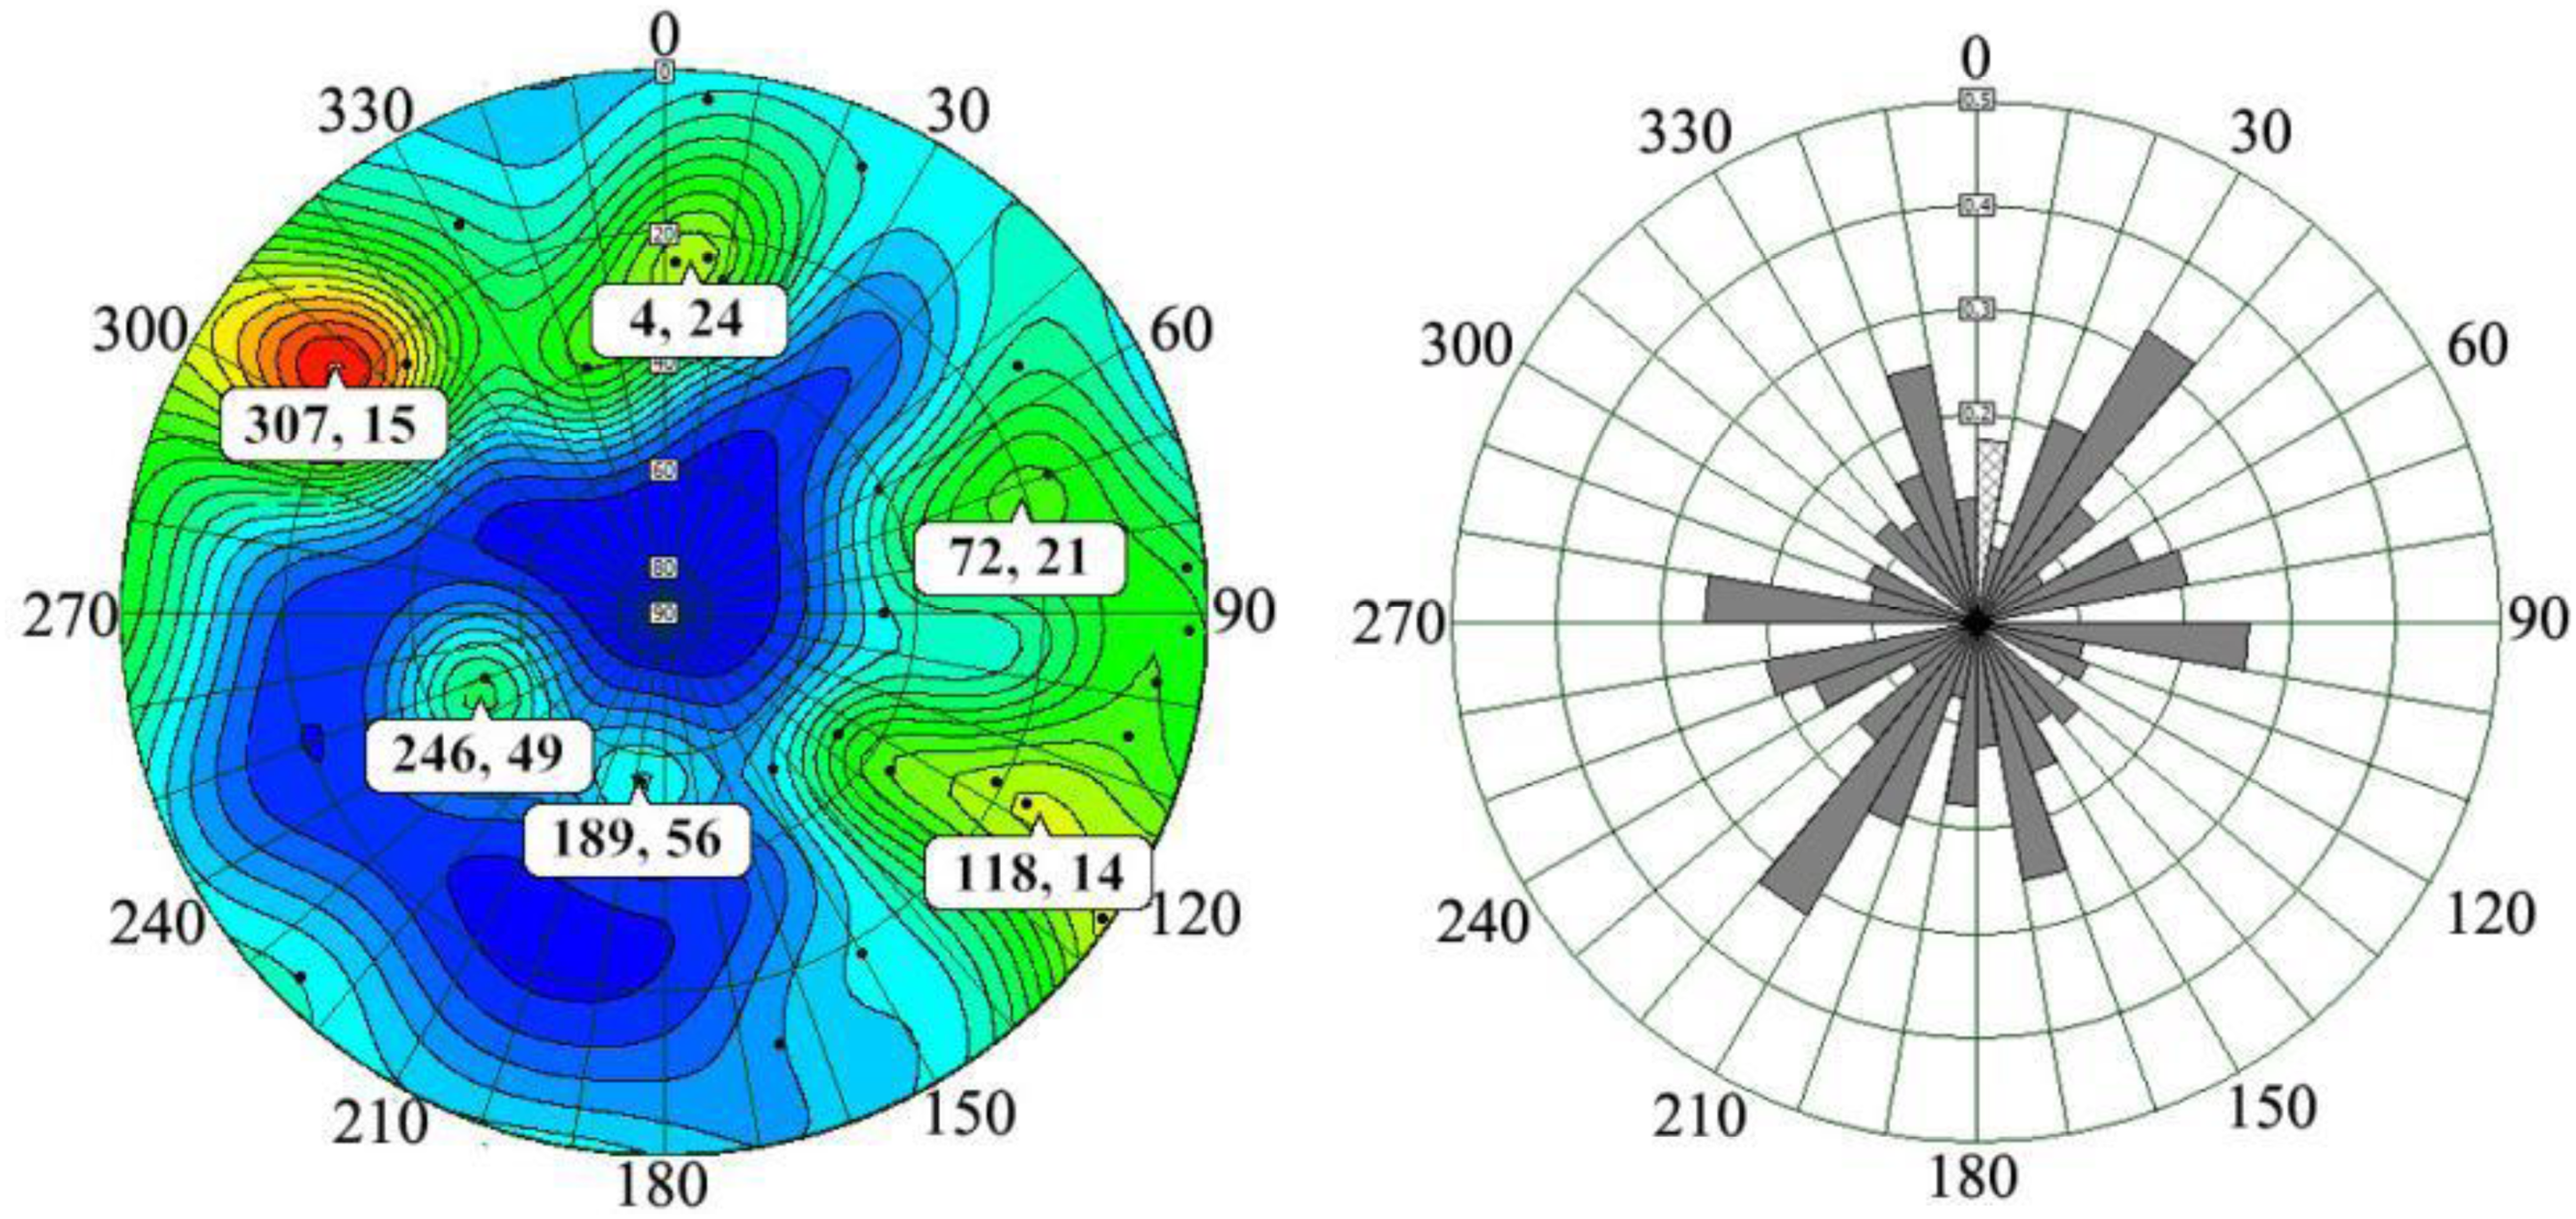
Isodensity map (a) and rose map (b) of Dangjiasi granite mass cracks.
The HDR exploitable resources are heavily influenced by fracture density. Physical modeling tests demonstrate that the fracture pressure of intact granite is more than 90 MPa and that during hydraulic fracturing, the granite preferentially begins cracks along natural fissures. Based on this, we describe the fracture density of the granite reservoir at the Qiabuqia HDR development site using the fracture line density of the granite section in Well GR1. According to GR1 logging, there are eight fracture zones in the 1 500∼3 350 m granite section, with a total length of 72.7 m and a fracture line density of 4.32/km.
In the granite portion, create a 1 000*1 000*500 m fracture distribution model. The model is spread east-west, with a buried depth of 3 500−4 000 meters. Referring to the crack occurrence of the Dangjiasi granite mass and the line crack density of the GR1, the average radius of the cracks was set to 300 m. Thirty-six random cracks with a total area of 6.92 km2 were created (Figure 10).
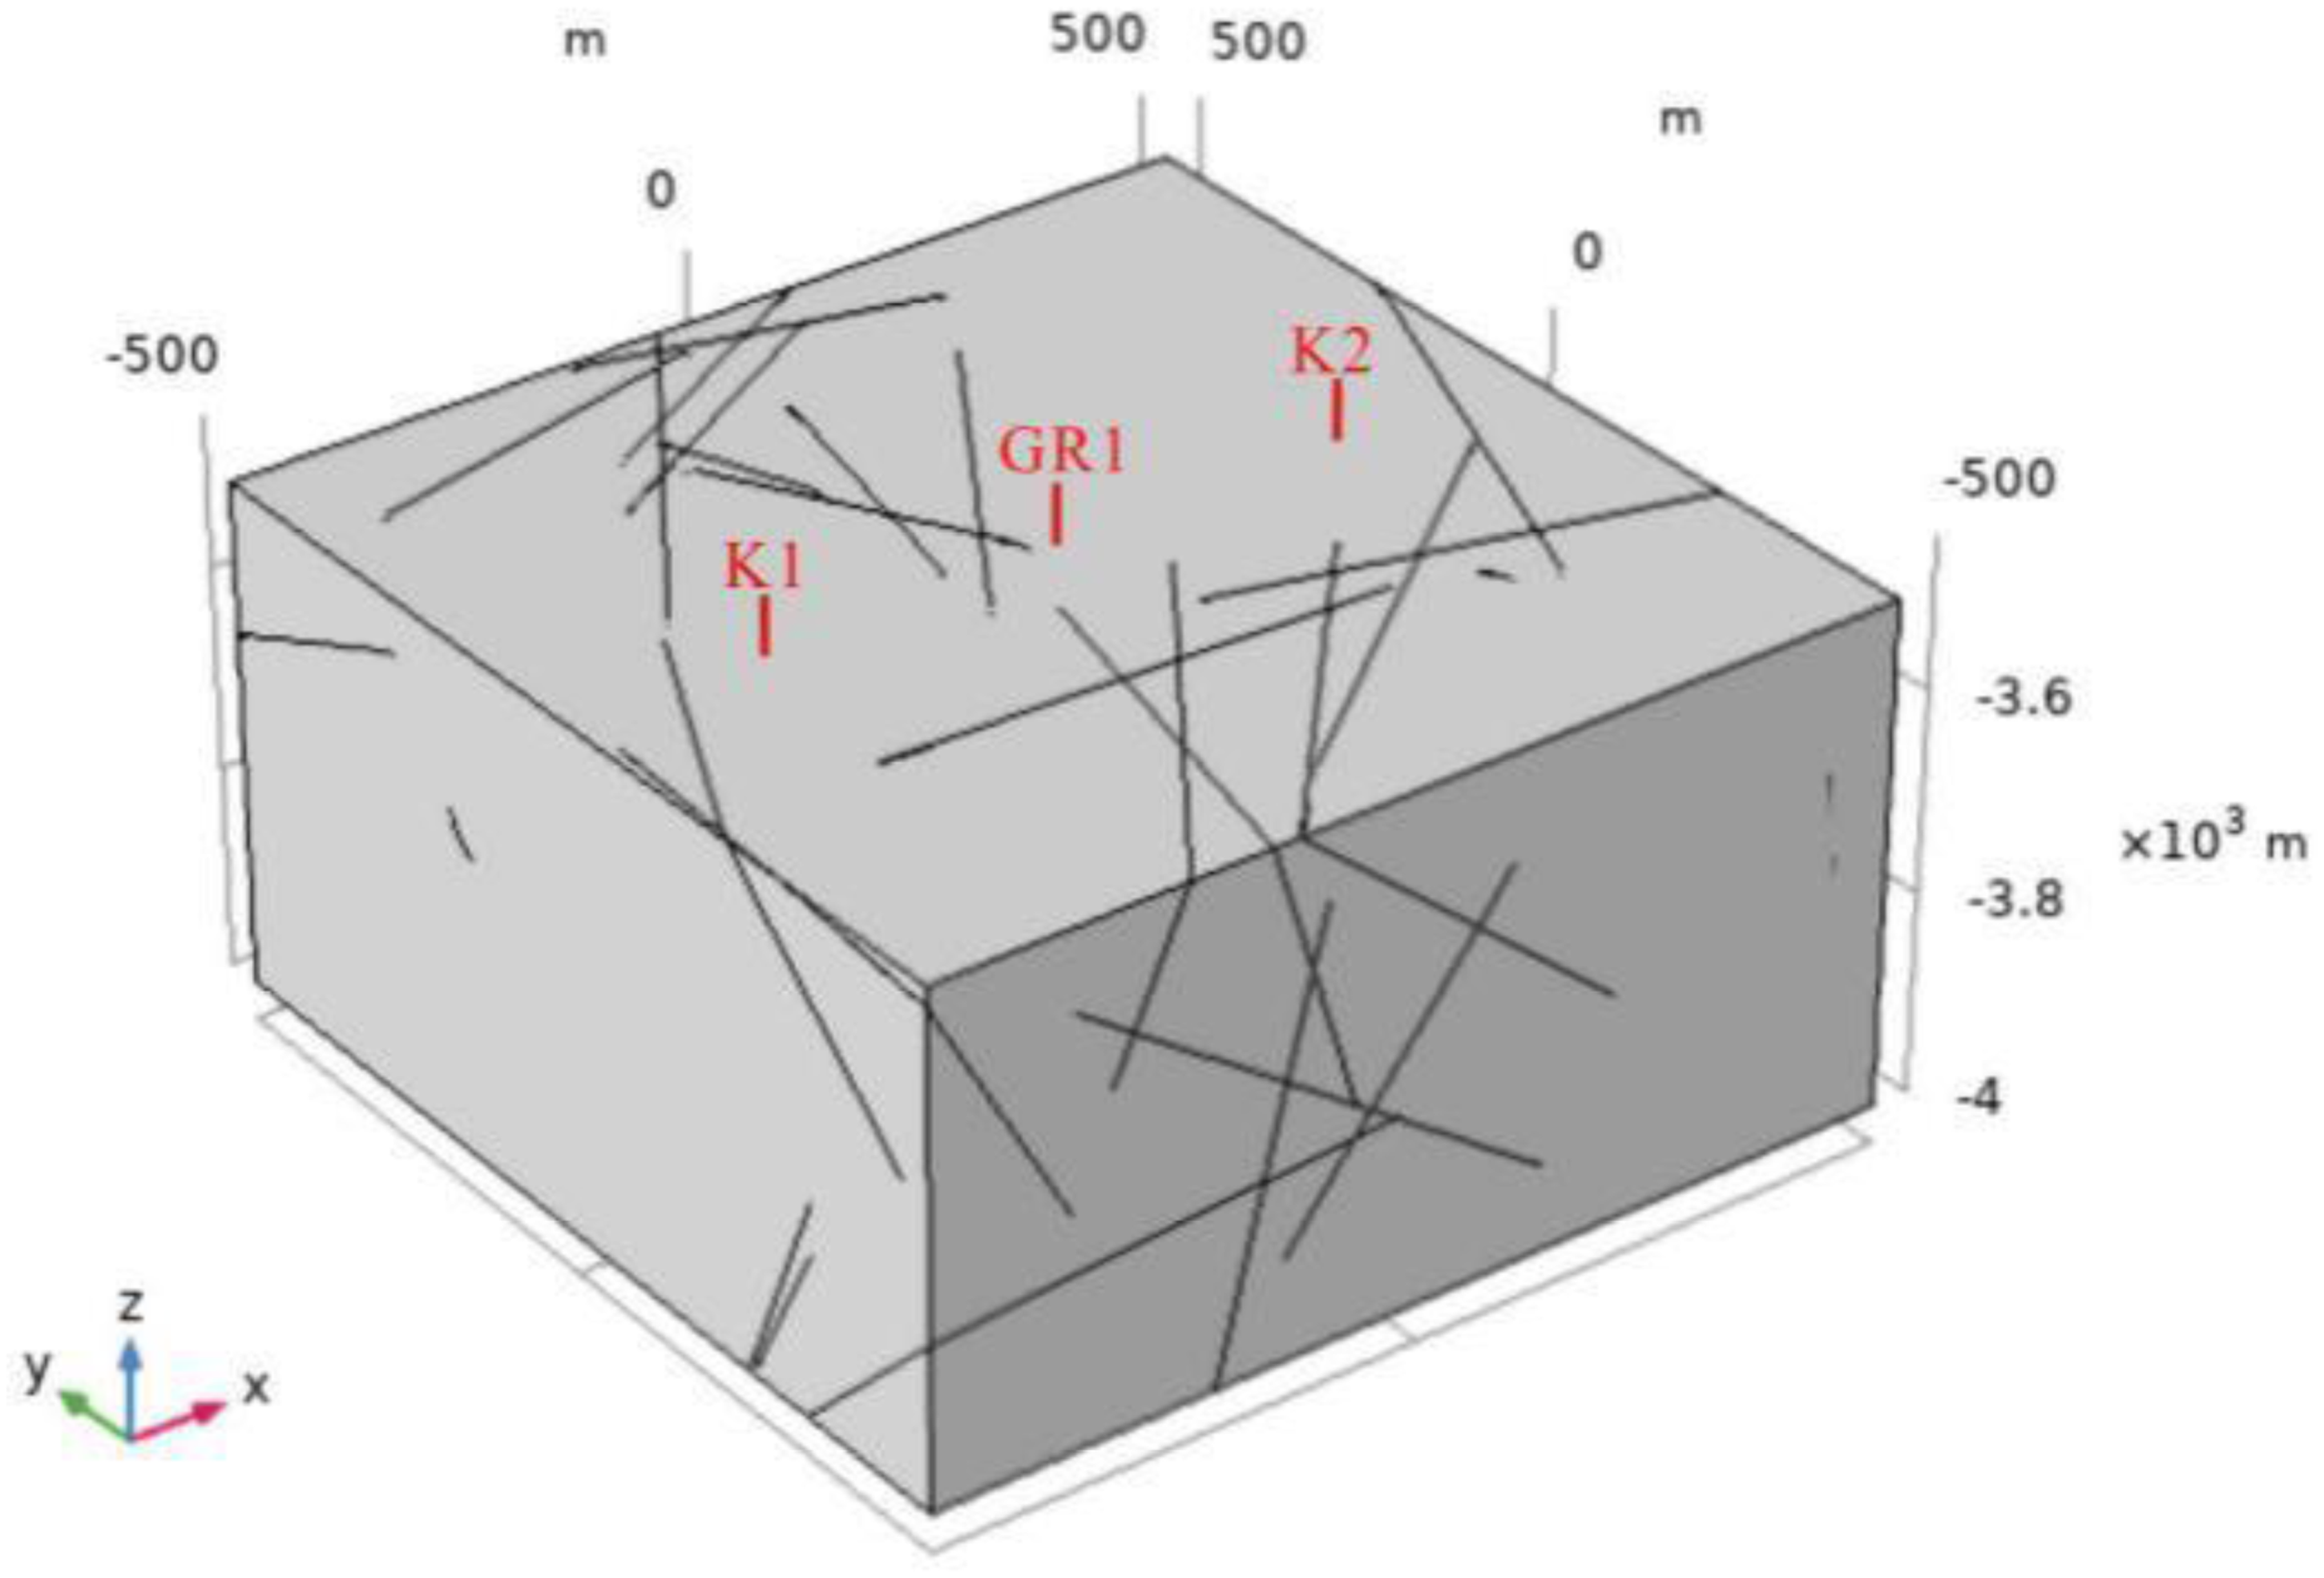
DFN model of the Qiabuqia HDR development site.
Initial conditions setting and simulation
The injection capacity and reservoir resistance are the two most important factors in determining reservoir connectivity following hydraulic fracturing. The reservoir performance is limited in this simulation using an analogous technique.
The EGS project in Sulz, France, began commercial power generation in 2013 and is now considered the most successful HDR power generating project in the world. The Upper Rhine Graben is home to the Sulz EGS project. The sedimentary layer in this location is approximately 1 400 meters thick, and the reservoir lithology is monzonitic granite. It shares geological similarities with the Qiabuqia HDR development location. The Sulz EGS drilling depth is 5 000 m, and the temperature at the bottom hole is 165°C. The HDR reservoir has a resistance of 0.23 MPa/(kg/s) after fracture, and an injection capacity of 2-4 L/s/MPa. The Sulz test site in France is used to describe the reservoir properties of the Qiabuqia HDR mass following fracture.
This simulation has the same scope as the DFN model, which has Well GR1 at its core. The top and bottom surfaces, as well as the surrounding borders, are established as water- and heat-insulating boundaries, ignoring the impact of ground heat flow and adjacent rock masses on heat transmission. The model is initially configured to a homogeneous temperature of 230°C, with one injection and two mining steps as the development mode. The GR1 well is an injection well with a 20 kg/s injection flow rate and a 60°C reinjection temperature; the K2 and K1 production wells are 300 meters to the east and west of the GR1 well. Ignoring fluid loss during mining, the density of granite is set to 2 550 kg/m3, the specific heat capacity is 750 J/(kg·K), the porosity is set to 0.03, and the permeability is 1 × 10⁻¹⁶. The thermal conductivity test is completed by the TCS (thermal conductivity scanning) thermal conductivity automatic scanner produced in Germany, with a measurement range of 0.2∼25 W/(m·K), and a measurement accuracy of ± 3%. The thermal conductivity of 22 granite samples in the Gonghe Basin varies from 2.173 to 3.273 W/(m·K). In this simulation, the average value of 2.87 W/(m·K) was adopted.
We simulated local thermal nonequilibrium by generalizing the reservoir as a dual medium model consisting of matrix rock mass and cracks. Equations (4) and (5) show the calculating formulas. Run for 30 years with a crack width of 0.75 mm, a crack specific surface area of 3, and a gap convective heat transfer coefficient of 100 W/(m2·K). In a steady state, the injection capacity of Well GR1 is 4.46 L/s/MPa, and the reservoir resistance is 0.224 MPa/(kg/s), which is in good agreement with the reservoir parameters of the French Sulz EGS project, which also confirms the model's reliability.
Results and discussions
Wells K1 and K2 display variable flow, temperature, and thermal energy characteristics during the mining operation due to the heterogeneous features of the DFN model (Figure 11). The output flow rate of the K1 well is approximately 12.7 kg/s under the same production bottom pressure, while K2 is approximately 7.3 kg/s, suggesting that GR1 is properly linked to K1. K1 produces more heat than K2 when the flow rate is changed. Wells K1 and K2 had initial thermal powers of 9.08 × 10⁶ W and 5.26 × 10⁶ W, respectively. The temperature of the generated fluid drops as production continues, and the thermal power of the K1 and K2 wells drops to 7.98 × 10⁶ W and 4.44 × 10⁶ W after 30 years, respectively.
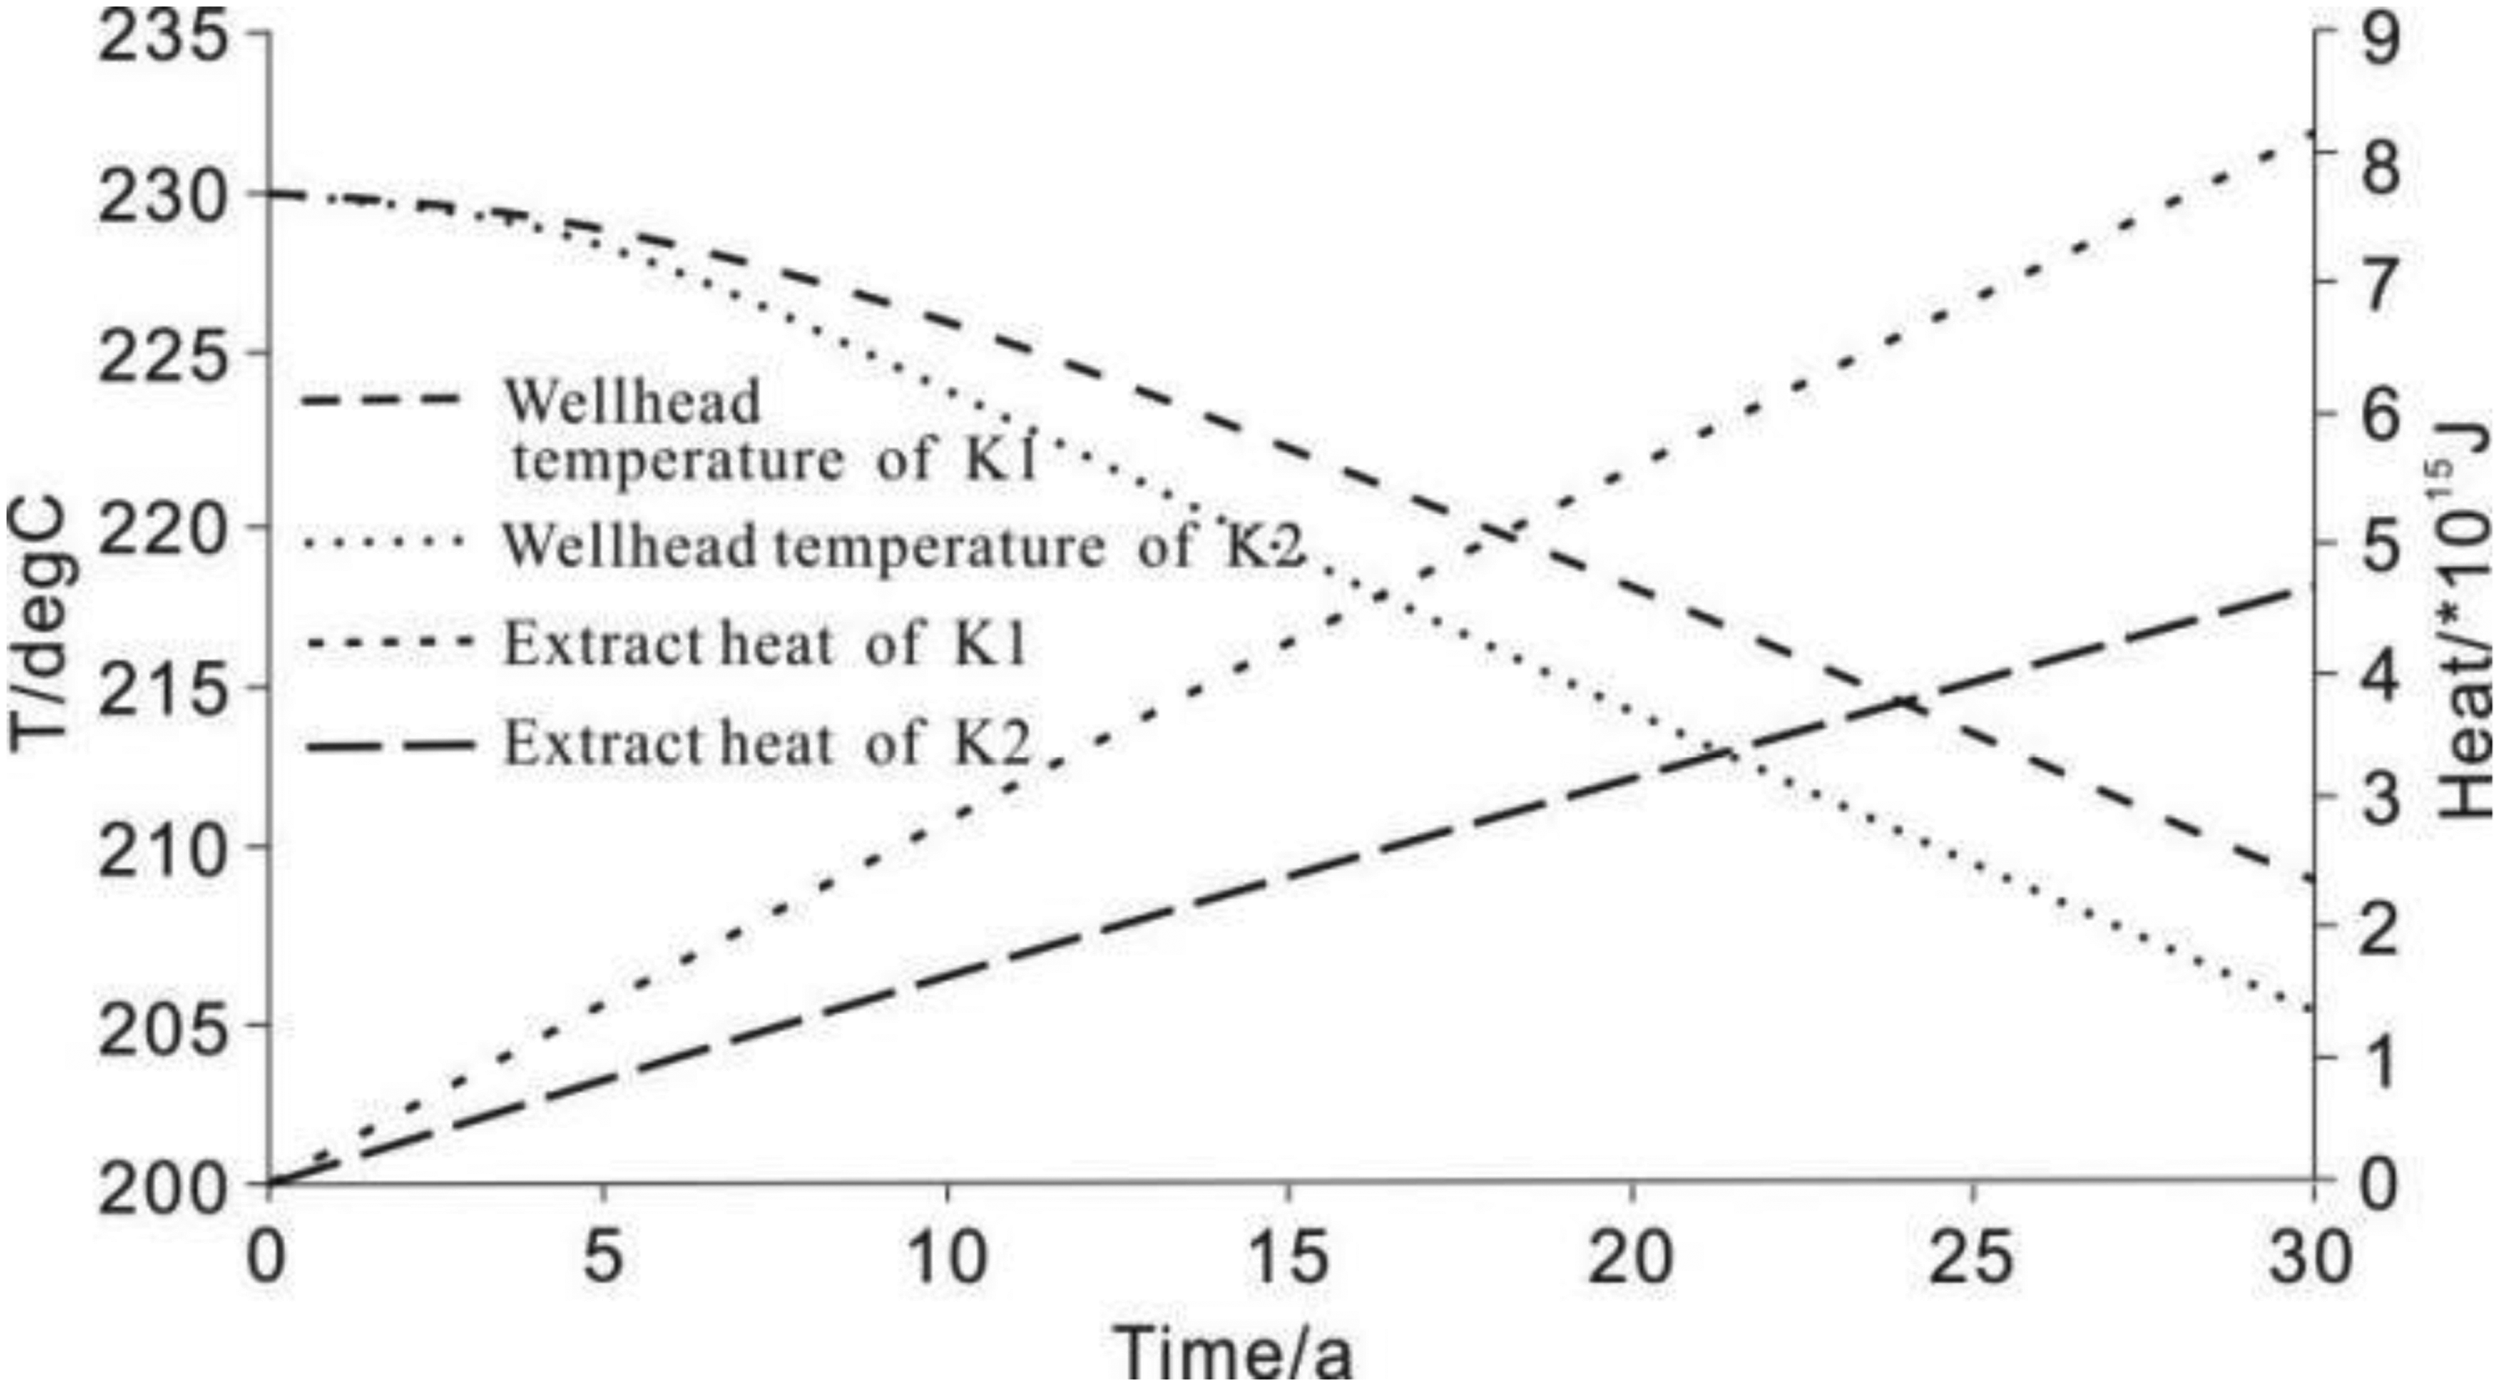
Variation curve of wellhead temperature and produced heat energy with time.
Due to the high flow rate, we did not find a substantial temperature reduction in Well K1. The temperature decline, on the other hand, was slower than K2. The major explanation is that between K1 and GR1, there are more complicated fractures, a larger heat exchange area, and longer fluid flow pathways (Figure 12).
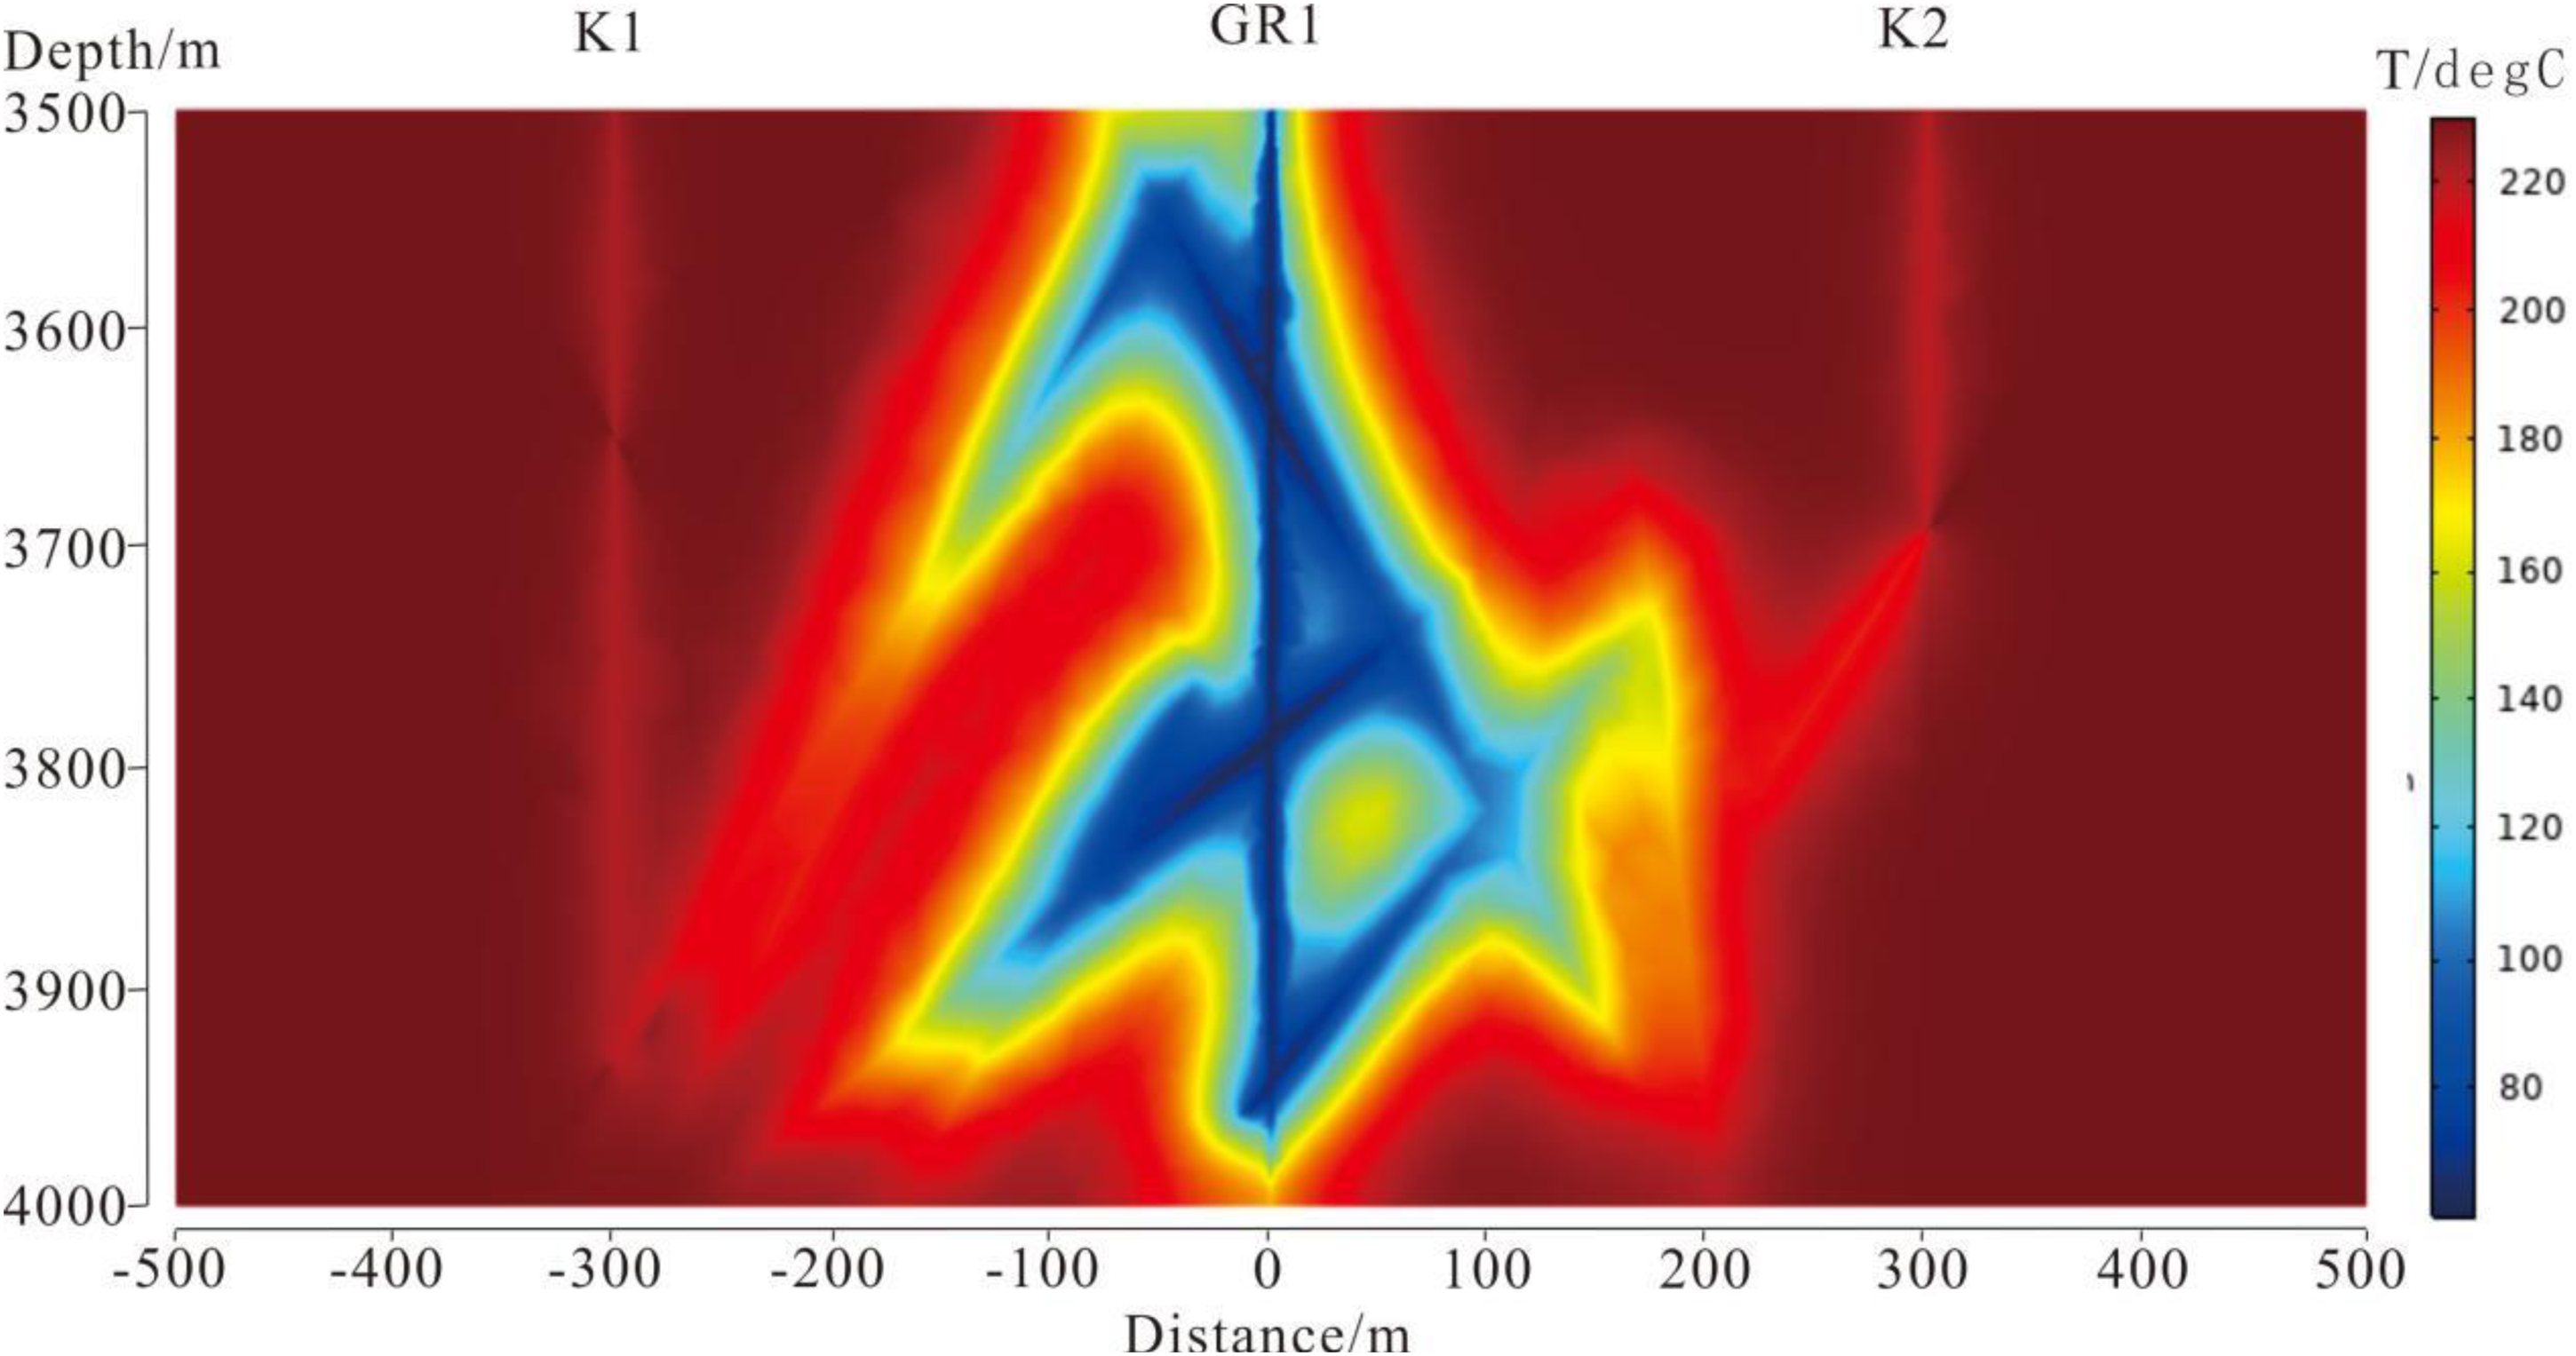
Temperature distribution map of the model profile for 15 years of mining.
With a temperature drop of 10°C as the lower limit, Well K1 can be continuously mined for 17.7 years, and the thermal energy produced is 4.99 × 10¹⁵ J; Well K2 can be mined continuously for 14.1 years, and the thermal energy produced is 2.29 × 10¹⁵ J. Under the condition of continuous mining for 30 years, the temperature at wellhead K1 will drop by 20.94°C, wellhead K2 will drop by 24.94°C, and the total thermal energy will be 1.28 × 10¹⁶ J. Taking 90°C as the lower limit temperature of HDR resources, the stationary resource is 1.34 × 10¹⁷ J. Under the model engineering conditions, the thermal energy mined in 30 years accounts for approximately 9.55% of the stationary resources.
Conclusions
This paper proposes a categorization method for evaluating HDR geothermal resources. HDR geothermal resources may be separated into stationary resources and exploitable resources depending on the purpose and technique. Based on survey accuracy, we can classify HDR resources into inferred (D), controlled (C), proven (B), and verified (A) resources. According to geological credibility and economic feasibility, HDR could be split into vision, reserves, and exploitable resources.
A summary of HDR resource evaluation methodologies is provided. The volumetric technique is used to determine stationary resources. The parameter acquisition techniques change depending on the precision requirements of different tiers of HDR resources. Numerical simulation methods are mostly used to calculate exploitable resources. The fracture concept model has a significant impact on thermal power, reservoir life, and cumulative exploitable resource findings. The heterogeneous fracture model should be studied initially in order to accurately replicate the energy transfer between the rock mass and fluid.
The volume method is used to evaluate the HDR vision resources of Gonghe Basin and the reserve resources of the Qiabuqia HDR mass. Taking 90°C as the lower limit temperature for exploitation, the HDR vision resources within 10 km of the Gonghe Basin are 4.076 × 10²² J, which is equivalent to 1.39 × 10¹² t of standard coal; the reserves resources within 6 km of Qiabuqia HDR mass are 2.11 × 10²⁰ J, equivalent to 7.2 × 10⁹ t of standard coal.
The usable resources of the Qiabuqia HDR development site were assessed using a numerical simulation approach. A DFN model of the Qiabuqia HDR development site was created using the fracture line density of the GR1 well and the outcrop fissure statistics of the Dangjiasi granite mass, which is closely linked to the Qiabuqia HDR mass. Local thermal nonequilibrium theory was utilized to determine the exploitable resources of the Qiabuqia HDR development site, using the reservoir resistance and injection capacity of the Sulz EGS project as limitations. The K1 wellhead temperature drops by 20.94°C, the K2 wellhead temperature drops by 24.94°C, and the total production heat energy is 1.28 × 10¹⁶J under circumstances of one injection and two production cycles, a circulating flow rate of 20 kg/s, and a reinjection temperature of 60°C, and continuous mining for 30 years. Accounting for approximately 9.55% of the HDR stationary resources.
As a result of the heterogeneous features of the fractured media model, wells K1 and K2 produce varying amounts of heat throughout the mining operation. Due to the high flow rate of continuous heat generation, K1 did not experience a substantial temperature drop when compared to Well K2. The temperature decline, on the other hand, was slower than K2. The major explanation is that between K1 and GR1, there are more complicated fractures, a larger heat exchange area, and longer fluid flow pathways. Reservoir fracture distribution features and fracture model generalization have a significant influence on the assessment of HDR exploitable resources.
Footnotes
Acknowledgements
I would like to express my gratitude to the teacher Zhu Jialing from Tianjin University for her patient guidance on the value of the model heat transfer parameters.
Declaration of Conflicting Interests
The author(s) declared no potential conflicts of interest with respect to the research, authorship, and/or publication of this article.
Funding
The author(s) disclosed receipt of the following financial support for the research, authorship, and/or publication of this article: This work was supported by the 干热岩地热能资源评价方法与靶区优选 (No.2018YFB1501801) and China Geological Survey Project (No. DD20190131).