
Abstract
The availability of cost-effective and environmentally friendly electricity to the entire population is a prime concern of the South African government. It has brought attention to microgrid projects, especially when rural population is considered properly. To address the energy needs of any country, the focus line should be the cost and availability of local resources. Due to the abundance of coal reserves and lack of alternative resources, coal dependence cannot be overlooked in the near future. This paper focuses not only on microgrid needs in South Africa but also on the possible use of hydrogen extracted from coal as a fuel in Proton Exchange Membrane Fuel Cell (PEMFC) in microgrids. The complete assembly of PEMFC and its use in the microgrid are discussed. To make the H2 extraction process eco-friendly and hence worth considering, Carbon capture and sequestration process is discoursed. Furthermore, cost benefit analysis and the long term benefit of the use of PEMFC in microgrids with coal-based hydrogen production are presented in this research.
Keywords
Introduction
The electricity is now essential for everyday life. To provide electricity to a remote area, an extensive transmission network and conventional grid facility are required, which are more costly than the generation of electricity. Therefore, these remote areas must be fed with a local electricity network that is equipped with cheap and reliable generation sources. This type of network is called microgrid; a microgrid is a simple form of distributed generation system which has its own low cost and reliable generation sources such as solar, wind, battery storage system, and diesel generators (Podder et al., 2019). The diesel generators and battery systems are used to provide continuous and reliable power to the consumers. However, due to environmental issues, the diesel generator is not a feasible option as it produces harmful gases for the environment. A battery storage system can also be used as a reliable source but involves huge costs, and battery maintenance is also a big problem (Neto et al., 2018).
Like other countries, South Africa is also looking to provide power to its remote consumers through microgrid projects. The government plan is to provide cheap and reliable electricity to all of its consumers. Also, South Africa is a signatory of the Paris Agreement in 2015 for reducing its carbon emission. On the other hand, South Africa has a lot of coal reserves, and it is not easy to abandon the use of coal reserves. The major indigenous energy resource of South Africa (S.A) is by far the coal. (Xu et al., 2016) globally, for electricity generation, 36% of generation is being produced with coal as a primary fuel. Approximately 77% of S.A’s primary energy demands are furnished with coal. Due to coal abundance and lack of alternative resources in S.A, the dependency on coal as an energy source cannot be overlooked at least shortly.
The estimated coal reserves of S.A are approximated to be around 53 Billion tons, and the annual marketable production is estimated to be 224 million tons (Abbas and Waqas, 2020). Around 28% of the coal production is exported, and the rest is utilized for various production industries across the country, e.g., petrochemicals (SASOL), metallurgical (MITTAL), general industry, and electric power generation (ESKOM) etc. Among the local industries being fed with coal, around 62% of coal is utilized for electric power generation (energy.gov.za). The utilization of various sources for power generation in S.A is depicted in Figure 1.
Utilization of various sources for power generation in S.A.
S.A’s coal for electricity generation is considered to be among the cheapest globally. The importance of coal reserves on S.A.’s economy can be perceived from the statistics that ESKOM (Electric Supply Commission) stands first globally as a steam coal consumer, 7th as an electric power producer, and SASOL is ranked as the largest coal-to-chemicals manufacturer (eskom.co.za). The coal-based generation in S.A is the most suitable option due to plentiful coal reserves, reliability due to availability of fuel, well-established infrastructure, and excellent efficiency of coal as fuel.
However, certain demerits make energy planners think about alternative options. It has adverse environmental effects due to huge waste (sulphur, nitrogen-based oxides, radioactive elements, GGEs, ash, etc.) emission problems. Due to far situated, concentrated coal reservoirs, transportation, and location of the plant create critical constraints. These limitations, however, motivated the electric energy planners to think about the environmentally friendly use of coal and, at the same time, provide electricity to rural areas. The idea is to extract Hydrogen (H2) from coal, use it as a supply of fuel to the Proton Exchange Membrane Fuel Cell (PEMFC) and integrate this clean, consistent and reliable source of electricity into the microgrid of S.A. The PEMFC for its operation requires an unremitting supply of fuel, which is Hydrogen (H2) and oxidant i.e. oxygen (O2) (Lin-Kwong-Chon et al., 2019). The hydrogen reactant for Fuel Cells can be extracted from various sources e.g. natural gas, methane, from coal gasification etc. The other reactant i.e. oxygen is abundantly available in the ambient air (Feroldi et al., 2011). The endeavor for alternate sources of energy has led to escalating use of H2. However, the international demand to decarbonize the respective energy sectors and thereof low/free carbon environment has prompted the energy planners to think of methods to extract H2 and at the same time resulting in low carbon contents. This global demand of decarbonization along with usage of hydrogen for energy purposes has urged energy sector to focus on Carbon Capture & Sequestration. The carbon capture and sequestration techniques have not yet been widely employed and currently there are only a few such projects in operational state. There is an ample room for research to devise new effective and practical methods to not only capture and store the carbon during the H2 extraction but make effective use of it when and where required.
This research paper addresses above highlighted issues, focuses on the microgrid needs in S.A and also the possible use of PEMFC in microgrids of S.A. The complete assembly of PEMFC and its use in microgrid has also been discussed. Further, the paper gives the potential cost-benefit analysis of the possible use of PEMFC in microgrids by comparing the cost and the long term benefits of the use of PEMFC in microgrids with coal-based generations.
The rest of the paper is organized as follows. The second section of the research paper discusses the need for microgrids in S.A, while the third section explains the use of PEMFC in microgrids and its complete assembly for power applications. “Coal gasification and hydrogen production” section explains the coal gasification where this process produces H2 to run PEMFC, including the suggestions to make this process more environments friendly. “Cost-benefit analysis of coal gasification and hydrogen-based fuel cell power gene” section gives the cost-benefit analysis of the use of PEMFC in microgrids based on the S.A electricity tariff rate. The final section concludes the paper.
Need for microgrids (M.Gs) in S.A
According to the South Africa Ministry of Energy (MoE), the total generation capacity of South Africa is about 51,309 MW, out of which 91.2% is generated from thermal power stations and 8.8% from Hydroelectric and other renewable resources (Abbas et al., 2017). However, S.A. is also planning to add further Independent Power Producers (IPPs) of 19,400 MW by 2030 (USAID, 2020), as depicted in Figure 2. The current installed capacity is dominated by the thermal or coal-based generation, and the target is to achieve the energy mix with 30% IPPs by 2030.
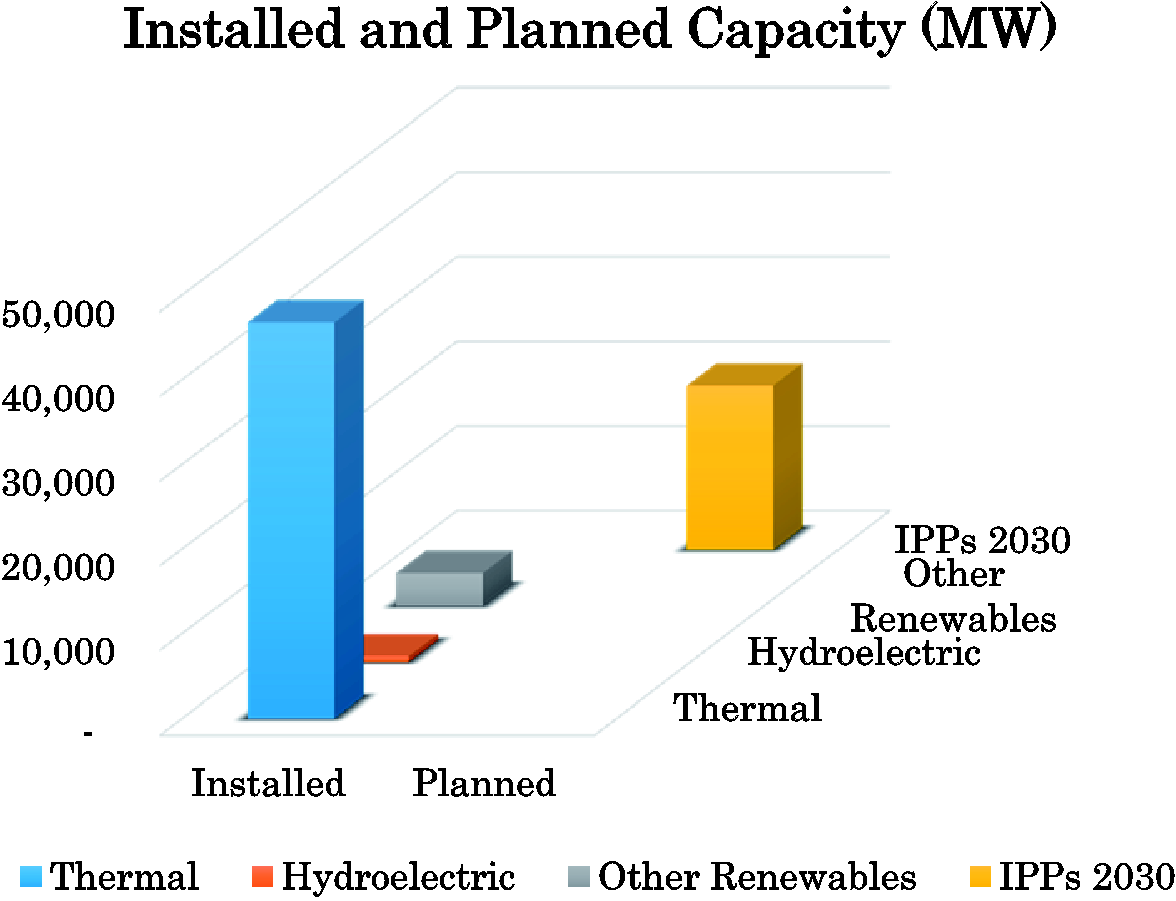
Installed power generation capacity and planned IPPs (MW).
The scarcity of thermal generation fuel, environmental constraints (Abbas et al., 2017), and growing trends towards renewables are leading towards the evolution of microgrids, especially in rural areas of South Africa. The extension of the conventional grid to these rural areas seems infeasible due to lower population density, higher costs involved in remote area transmission and distribution, escalated losses, high fuel transfer cost, and less industrialization. Therefore, it would be a small Return on Investment (RoI) (Longe et al., 2014). The microgrid is considered to be the best remedy for energy poverty for the areas of South Africa where grid infrastructure is unavailable or costly to develop. In addition to rural areas, commercial enterprises are also considering microgrid investment as a cost-effective solution to diversify their sources of energy. The microgrid should be powered by the prior available sources of solar, wind, cattle excretion based biogas available in such areas, hence make it environment friendly and self-sufficing (Longe et al., 2017).
Without the access of energy to the remote areas, the individuals will hardly be able to meet their basic needs and, thus, will not be able to participate in the development of the country. Further, they may not attain a developed economic status and hence participate in improving the GDP of the country. To include this community in the national development and improve the economic status of the country, electric energy must be made available to these areas as well.
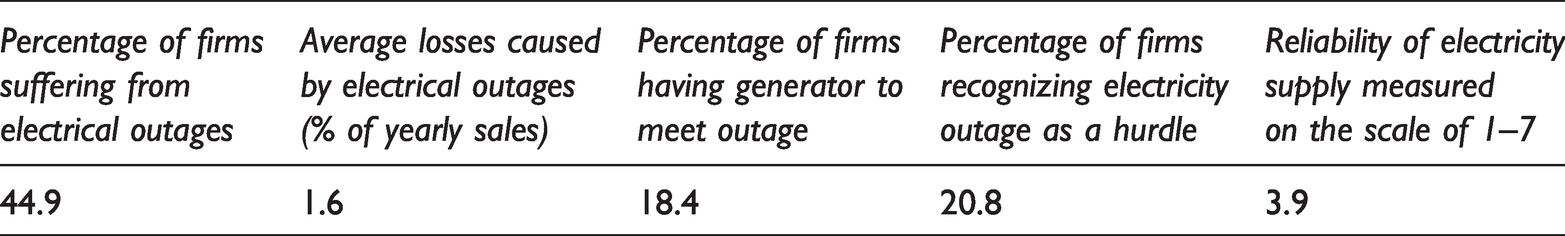
South African government has targeted to make the energy accessible to all the population across the country including those remote areas where there is still no access to energy. As per recent statistics, energy has been made available to around 93% of the population. Also, the consumption in the already energy accessed areas is escalating with the development of the country. KwaZulu-Natal & Eastern Cape are the two of such remote areas of South Africa where there is a reported scarcity of electric energy. Therefore, the government is aiming to provide the facility to these areas. According to International Energy Agency (IEA), the consumption of electricity per capita of South Africa is 4,148 kWh/capita compared to North Africa, where it is 1,442 kWh/capita, which indicates the higher energy demand in S.A. The electrical supply quality of South Africa, as assessed by the World Bank survey in South Africa, is shown in Table 1 (Manfred et al., 2018).
Electrical supply quality of S.A. as per World Bank Survey, 2017.
These energy statistics and dependence of S.A. on thermal/coal-based generation (above 90%) necessitates the growth of renewable energy (RE) based microgrids to facilitate the population deprived of electrical energy and improve the energy mix with cleaner energy (Ouedraogo, 2017).
The benefits and cost analysis of conventional grid extension and RES based microgrids for remote areas can assist in decision making for electric energy extension network, which is provided in section 5. The merits of microgrid like lower initial cost compared to conventional grid expansion, quick placement, flexibility to be connected with power grid or standalone operation, and economical energy provision to remote areas etc. make it a preferable choice of providing energy to developing or undeveloped areas/regions of the country. Today’s microgrid is the localized combination of distributed electric generations (from P.V., F.C., wind, biofuel based or conventional generation etc.) having storage mechanism (in certain applications) and various loads with the flexibility to either be connected to the main grid or operate as Standalone Microgrid (SAM) (Dawood et al., 2020). Due to the intermittent and variable nature of Renewable Energy Sources (RES) based generations, SAM or off-grid is considered a feasible solution. Based on the size of the population, the remoteness of the area, and the availability of fuels, the microgrid can be SAM or connected to the main national grid hence providing enough flexibility. For the specific remote areas of South Africa (e.g., KwaZulu-Natal & Eastern Cape), the identification of the available RES is the foremost step.
PEMFC in microgrids
The consistent pursuit of environment-friendly alternative/clean energy is inevitable due to escalating energy needs. There are consistent efforts in the developed countries to accomplish a diminution in greenhouse gas emanations. Fuel cell (F.C.) is envisioned as one of the potential candidates of alternative resources having negligible emissions and low noise levels. It has been discussed that an M.G. is the combination of distributed electric generations and has the flexibility to either connect to the national grid or facilitate the locality in an isolated manner. As M.G. may have generation sources that are sporadic and short-lived in nature (e.g., solar requiring battery/storage), F.C. can give its output 24/7 provided that fuel is available. So M.G. can rely on F.C. in the absence of other generating sources giving it more flexibility in operation. Thus this M.G. & F.C. integration results in dependable generation with innovative intelligence (fuelcellenergy.com). The major benefits of integrating F.C.s into M.G. are (Choudhury and Khandelwal, 2020):
Due to developments in research and applications, the F.C. cost has declined down in recent times. The fuels (H2 and oxidant/air) are quickly and cheaply available. The extraction of H2 from other fuels (e.g., coal, natural gas, biofuel etc.) makes it a cost-effective and attractive choice for M.G. For rural and remote areas where connection to the national grid involves many costs causing high utility rates of electricity, F.C. is a cost-efficient solution. Being stationary, F.C.s require less Operation and Maintenance (O&M) costs, hence further economizing the overall cost. Incorporating Combined Heat & Power (CHP) systems, the customers can have an additional advantage of utilizing byproducts (water & heat) for building, homes, industrial temperature control and/or as useful steam for boilers etc. F.C.s in M.G. are considered environment friendly due to significantly less GGE emissions. The consistent 24/7 generation (if the fuel is supplied) as compared to intermittent supplies (e.g., solar), the F.C. has improved the power quality and reliability of M.G.
Due to the above mentioned distinguishing factors, the F.C. integration with M.G. is considered advantageous as compared to other sources and diesel generators previously incorporated. It has been emphasized that in the areas where connection to the main grid is not feasible due to remoteness and low population density, microgrids, and especially FC based microgrids are effective and viable technology. FC microgrids are being popular across the globe. In the state of California, there are beyond 480 FC based systems and contribute more than 210 MW of generation. In Connecticut, more than 115 MW and in New York 14 MW and more are likely to come (Wang et al., 2018). The Australian government is focusing on investing in this area, and ATCO is working on one such project involving FCs and PVs. 'Philippine's government is getting legislation on the “Microgrid System Act” to make electric energy available to 100% household consumers by 2022 through cleaner energy (Khan et al., 2020; Rodríguez-Licea et al., 2018). Off-grid FC systems in S.A are contributing to lessen the burden of the national grid in peak load times/season. Impala Platinum is employing about 2 MW off-grid FC systems to alleviate the national grid load in peak times, and 22 MW systems are under development. Various telecom companies in SA are alleviating the national grid to feed their baseload stations via off-grid FC systems (mg.co.za). All such local small FC systems and other R.E sources can be combined to a microgrid to facilitate energy-deficient locality.
Fuel cells are categorized based on efficiency, catalysts & electrolytes employed, operating temperature ranges, and power output. Among these, the PEMFC employing a thin layer of polymer electrolyte has an efficiency of 40–50%, working temperature around 80°C and O/P from 50 and 250 kW (Nayana and Chakrasali, 2020). The distinctive features like its simplicity of structure, quick start-up, large power density, handleable operating temperature, good power to weight ratio, long life, lesser/negligible gas emissions and advancement in its literature make it attractive for most of the industrial applications and integration with the power grid (Georgakis et al., 2005).
F.C. reacting electrochemically with O2, is capable of transforming the chemical energy of fuels (rich in Hydrogen) into electrical energy, quality heat, and water as a byproduct in an emission-free process. Due to the pollutant-free electrochemical process, F.C.s has cutting edge advantage for reducing Greenhouse Gas Emission (GGE). F.C.s require H2 abundant fuels that can be extracted from various origins, e.g., coal, RES, biofuels, natural gas etc. and hence relax our reliance on full of emissions fossil fuels (Li et al., 2019). Among many types of F.C.s, PEMFC has grabbed attention due to developments in its research and extent of practical applications, as shown in Figure 3.
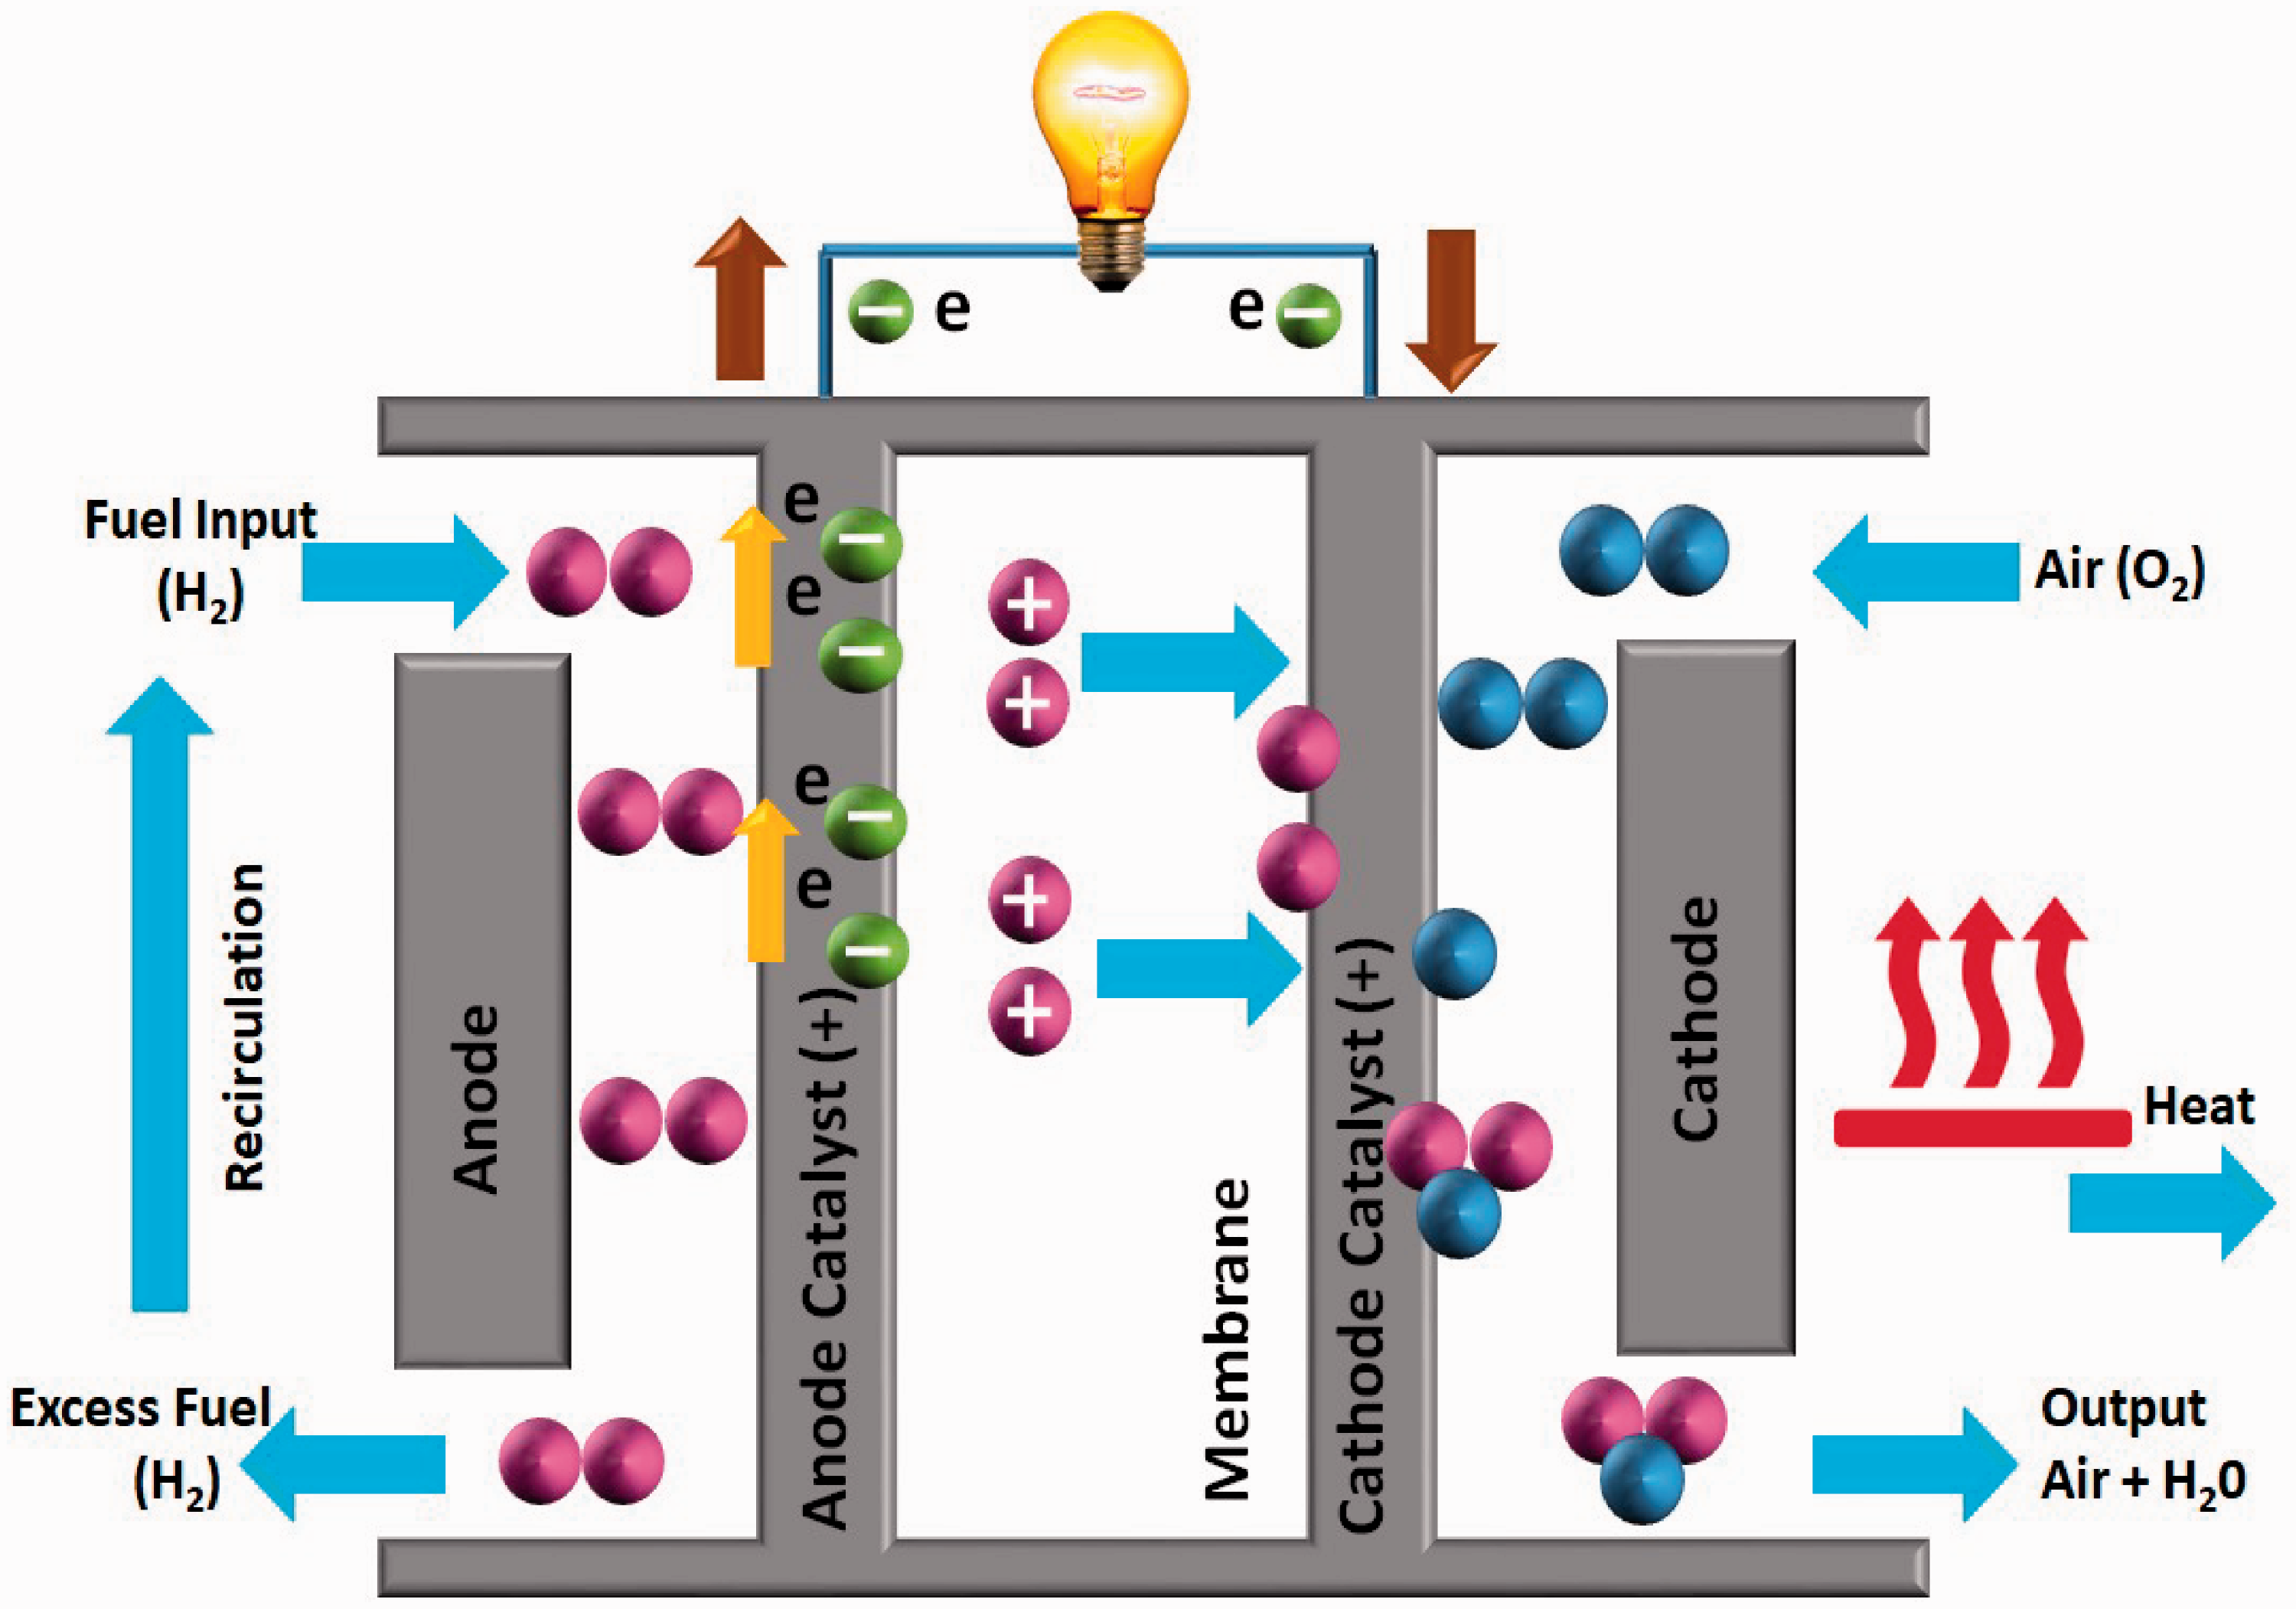
Schematic diagram of PEMFC working.
At the mid of PEMFC, there is a sparse polymer membrane acting as an electrolyte and having the characteristics of the impending path of electrons but permitting the flow of protons. The anode is fed with the H2 supply, whereas the cathode with air to receive a continuous output current. In contrast to a battery that gets discharged because the material makes the battery gets consumed during the electrochemical reaction, F.C. engenders continuous electrical energy provided that fuel is being supplied (i.e., H2 at anode and oxidant at the cathode) (Basualdo et al., 2012).
Hydrogen supplied at anode gets oxidized and split into major components i.e protons and electrons. The splitted electrons make their way through the anode catalyst to the external electric circuit doing the useful work and then to the cathode. The protons passing through the membrane go to the cathode catalyst. The above process is summarized in following equation (1) and Figure 3.
The reaction at the anode:

At cathode, oxygen is fed which diffusing through the cathode catalytic layer reacts with protons (coming from the anode) and produce water as delibrated in following equiation (2) and Figure 3.
The reaction at the Cathode:

Overall reaction combining both above reactions is given in equation (3) below:

The Voltage–Current characteristic known as Polarization Curve is shown in Figure 4 along with losses associated with PEMFC:
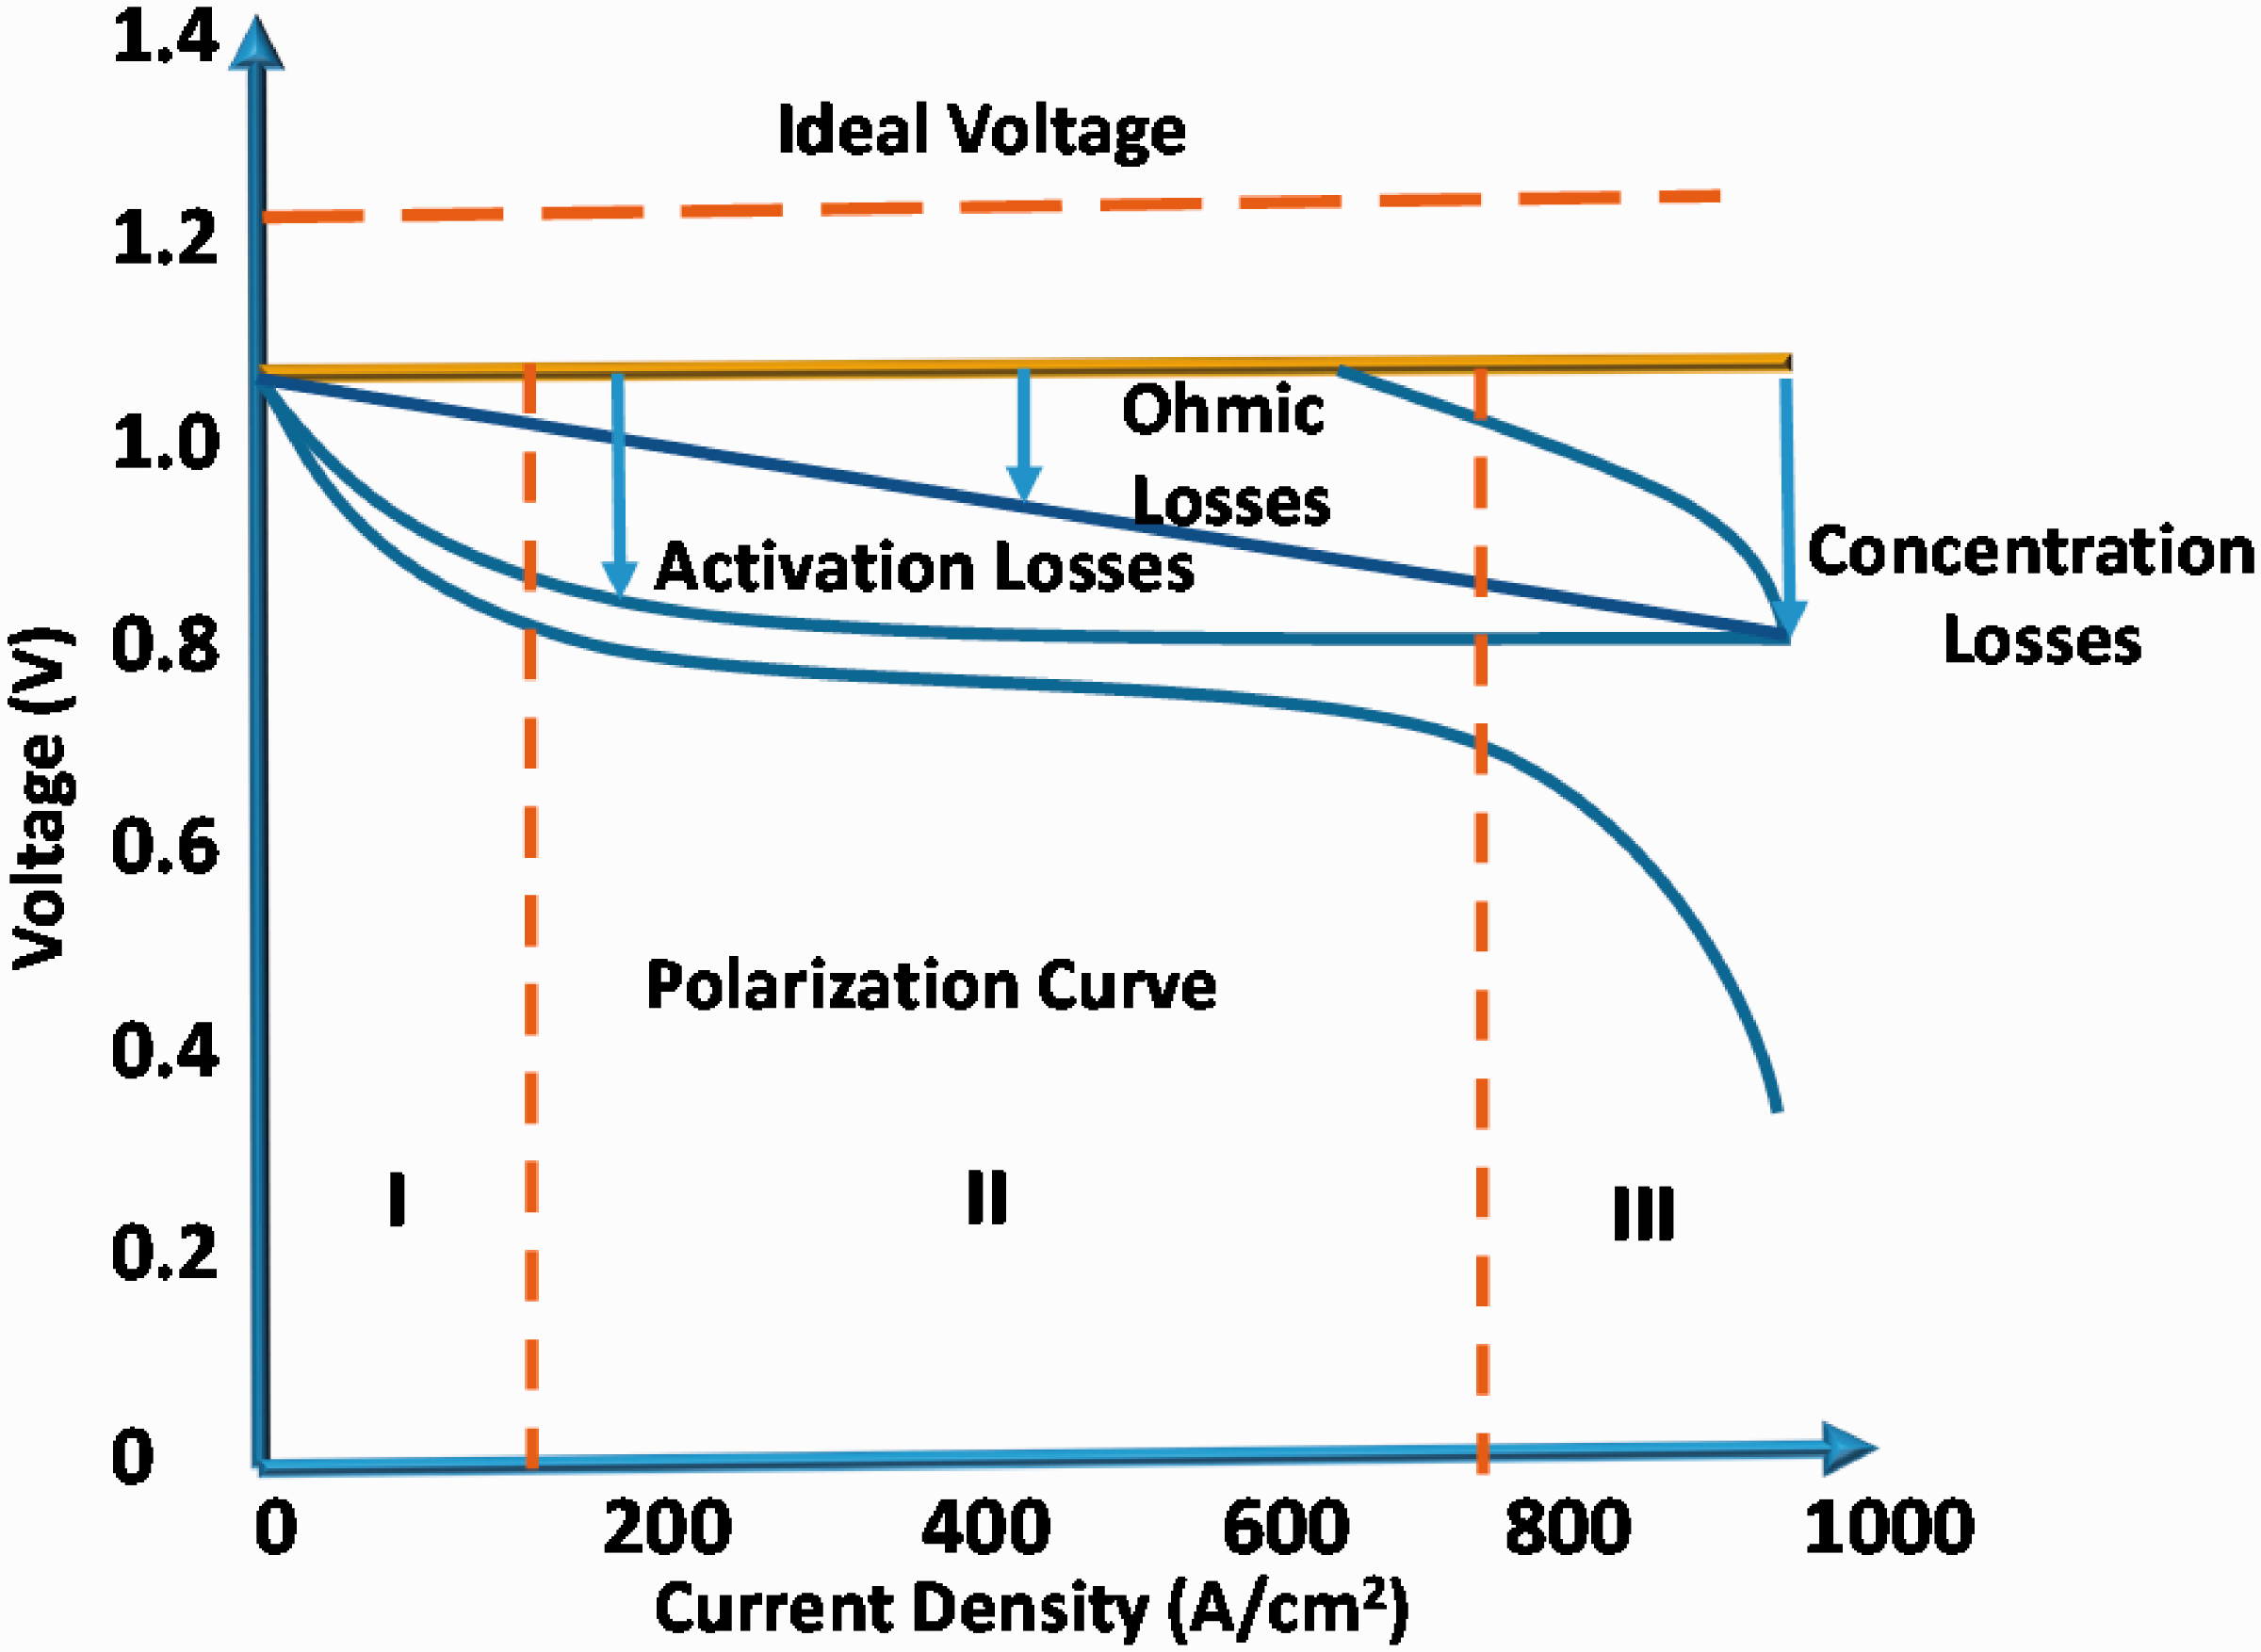
Polarization curve of PEMFC and related losses.
For the F.C. stack to work efficiently, proper arrangement of the Power Conditioning Unit (PCU) and healthy working and coordination of various subsystems is necessary. These subsystems include; fuel supply management (i.e., H2 at anode and oxidant/air at the cathode), heat/temperature control for efficiency management, humidification control for membrane conductivity management, and supervisory system for coordination of all these subsystems (May and Shuda, 2016).
The fuel cells can be easily interfaced with the utility grid by using appropriate inverter arrangement to regulate active and reactive powers. However, the poor voltage regulation of PEMFC as compared to other power sources and low cell stack output voltage demand for certain conditioning elements (known as PCU) may be present as depicted in Figure 5. The voltage conditioning function is performed by a DC-DC converter and DC/AC inverter that convert D.C. to A.C. for load or grid connection (Li et al., 2019). It can be visualized from Figure 5 that the output of FC is connected to DC–DC Converter for the desired amplitude, and its output is fed to DC–AC Inverter to perform inversion (DC to AC). The inverter output is transformed with a transformer as per requirement and then connected either directly to load, main grid, or microgrid in a locality.
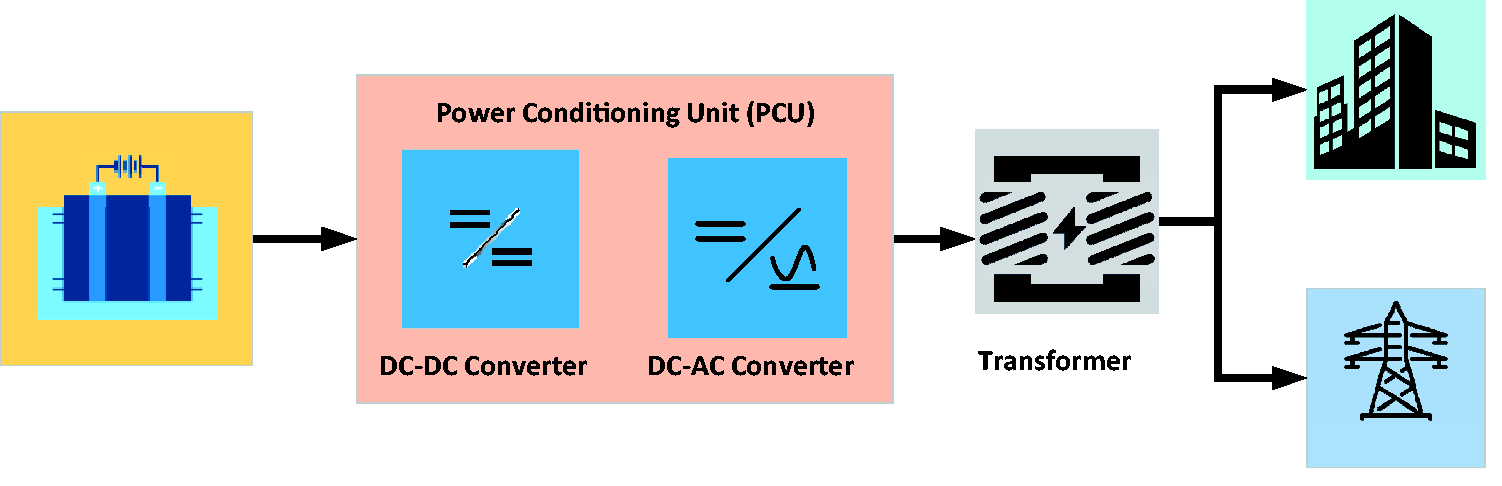
Basic configuration of fuel cell connected with load/grid/microgrid.
Power conditioning unit
The PCU should have the capability to control the F.C. voltage and convert the output to the desired type. DC–DC converters elevate the D.C. voltage to the appropriate DC voltage magnitude, and DC–AC inverters invert D.C. into A.C. for load/grid/M.G connection. The addition of a transformer after the inverter, if incorporated, facilitates isolation and transformation to high-voltage as per requirement. Batteries/storage systems, special circuit breakers (C.B.), and filters can also be incorporated depending on application (Mahapatra and Singh, 2013).
DC–DC converters in F.C.s facilitate system control and regulation of the output power. Unregulated output D.C. voltage of F.C. stacks is fed to these converters, which convert it to a regulated voltage as per application. The desired characteristics of the DC–DC converter in power applications are given below (Rao and Phadke, 2017; Ravi et al., 2019; Sumathi et al., 2015):
Good power conversion efficiency Low cost and long life Light in weight and modest in size High power density Less electromagnetic interference (EMI) Controlled ripple current to evade the damage to F.C.
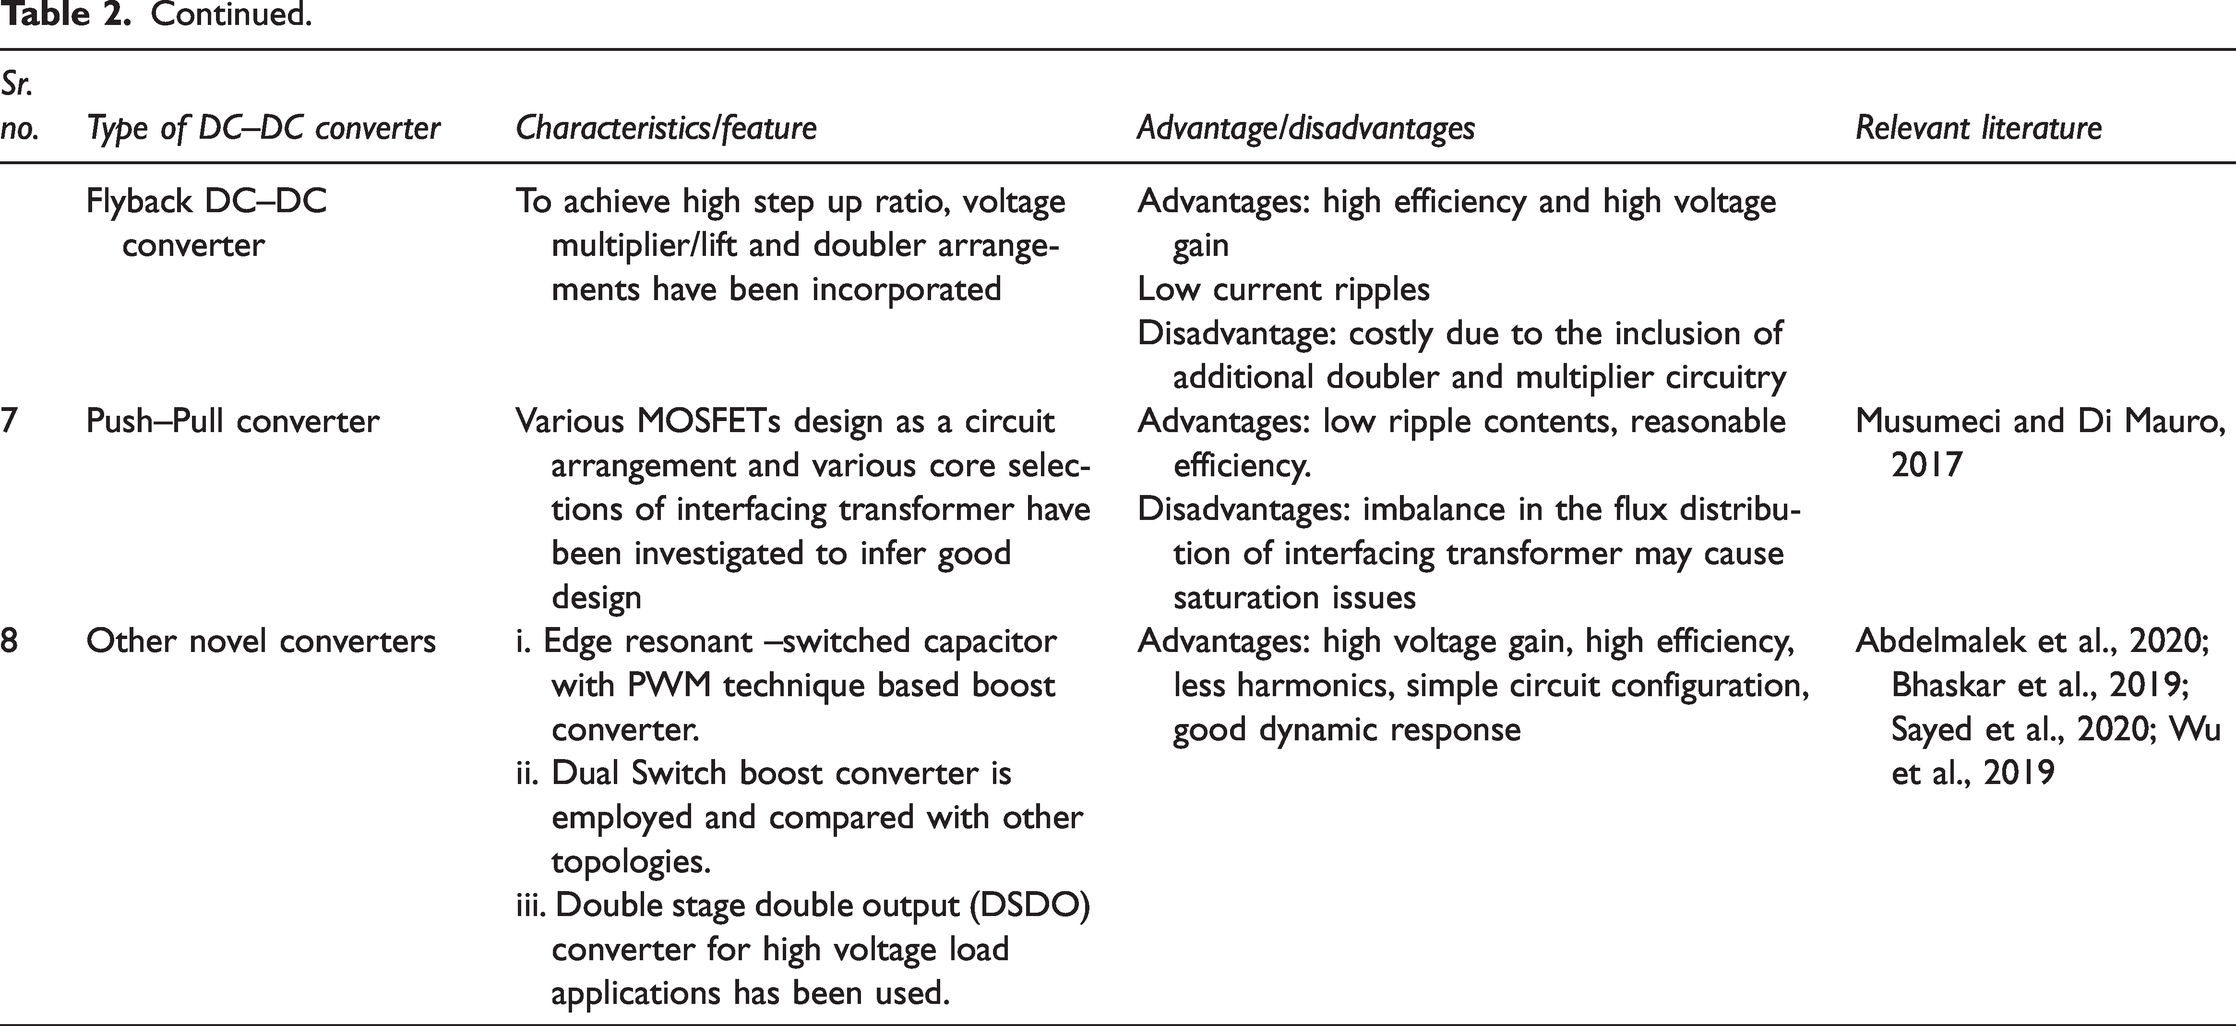
Table 2 gives a brief overview of various DC–DC Converters topologies employed for F.C. applications. The pros and cons of each topology are concisely outlined.
The brief overview of DC–DC converters.
As F.C. output is connected to A.C. load or grid/microgrid (as per application), it is needed to be converted to A.C., requiring the incorporation of an inverter in PCU. The output of the DC–DC converter is the input for the inverter, which generates A.C. of the desired magnitude and frequency (Liu and Li 2019). For most of the industrial applications, 3-Φ inverters are employed, and the main objective of the inverters is to furnish a 3-Φ voltage source with controllable amplitude, phase angle, and frequency employing PWM (Pulse–Width–Modulation) strategies.
The major types of the inverters are voltage source (VSI) and current source (CSI), each having certain merits/demerits, but VSI finds it in larger applications (Bahceci et al., 2016). CSIs use thyristors as switching elements hence demanding forced commutation, and their dc source has high impedance. VSIs employ IGBTs as switches; hence self-commutated and their dc source possesses negligible/small impedance. The dc side of VSI has a dc-link capacitor that performs energy buffer function, helping maintain a constant dc voltage of the converter. The output side of the inverter has a low pass filter to attain a uniform sinusoidal output voltage and phase currents with reduced harmonic contents. The mostly employed inverter arrangements for F.C applications have been discoursed in Table 3.
The brief overview of DC–AC inverters.
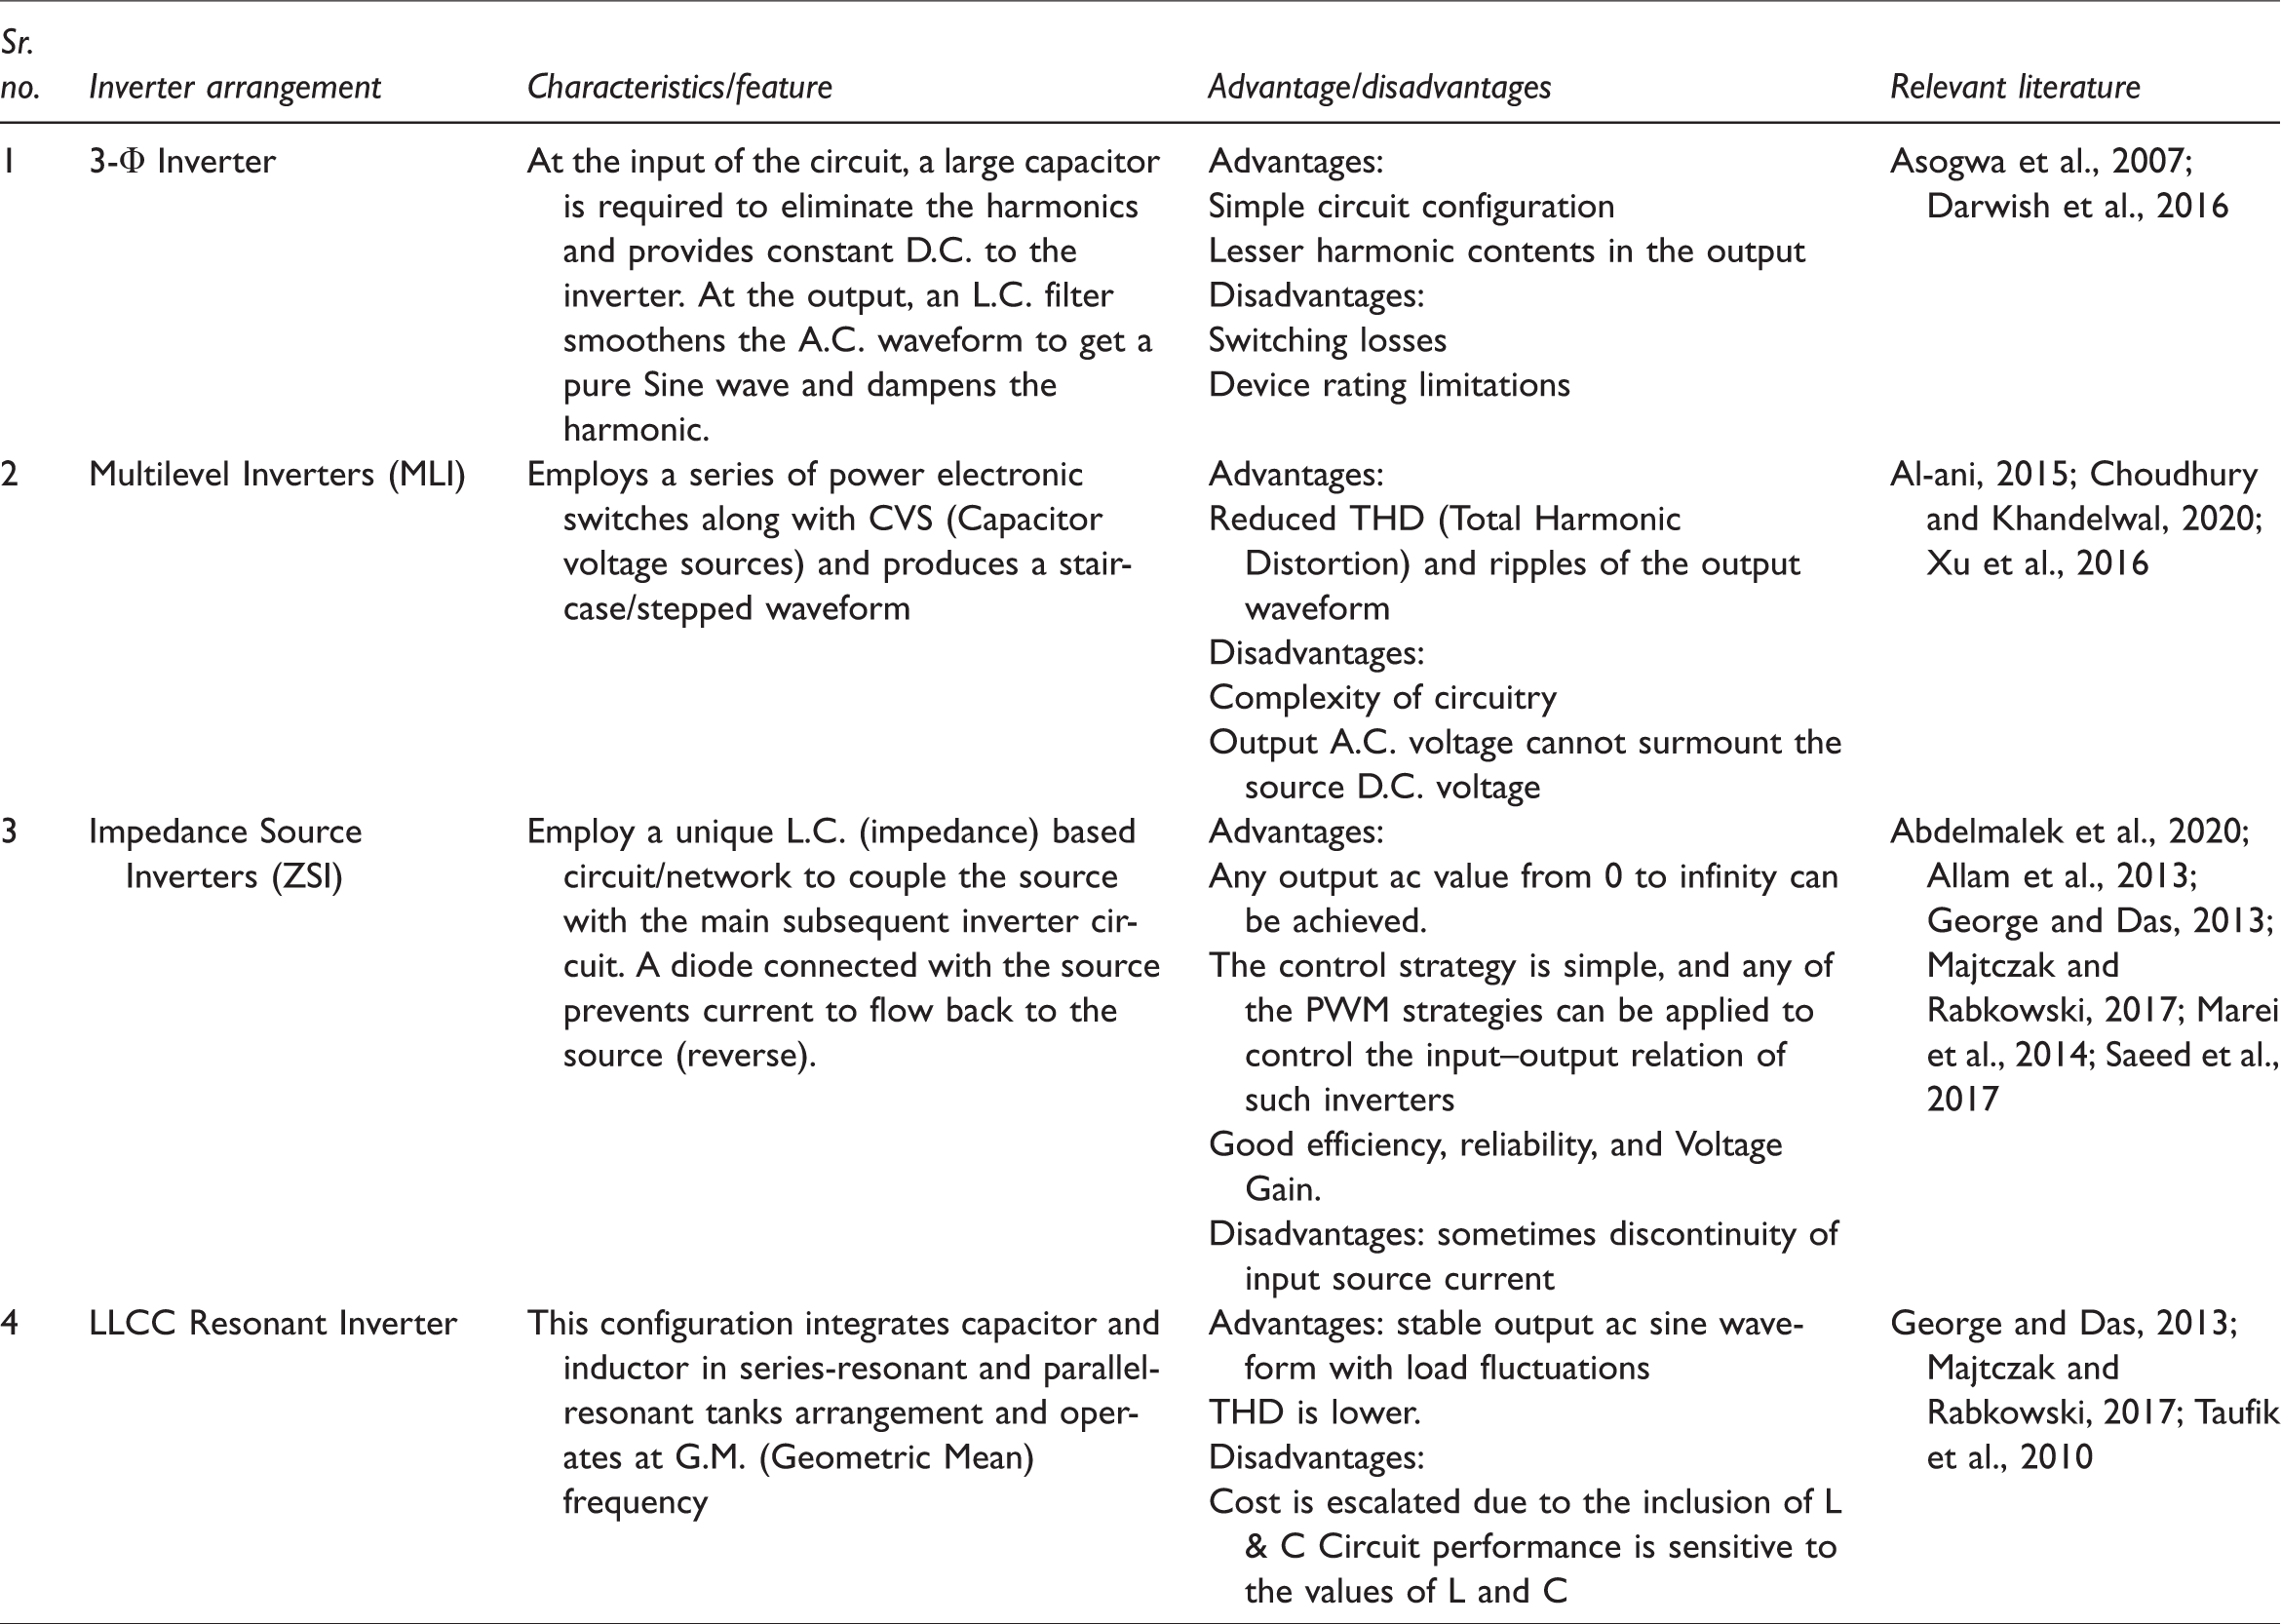
For grid-connected applications, mostly MLIs are employed due to lesser harmonic contents. With the incorporation of L.C. filters, near to pure sine waves can be achieved, which is the key feature for grid connection. This arrangement facilitates high efficiency; lower dV/dt stresses, and reduced EMI (Amamra et al., 2017; Mahalakshmi and Thampatty, 2015).
Coal gasification and hydrogen production
To understand the basics of gasification, it is required to know the combustion and burning process, which results in the complete oxidation of solid fuel like carbon and synthesizes heat and CO2. On the contrary, in gasification, the fuel (coal) is not thoroughly oxidized but partially oxidized. Comparing with other fuel transition methods, the efficiency of gasification is the highest and allows the control & diminution of gaseous pollutant discharges (Gnanapragasam and Rosen, 2017). With respect to energy requirements during the conversion process, the coal gasification process is considered a better option for a coal abundant country (Staffell et al., 2019; Stiegel and Ramezan, 2006). In the coal gasification process, the coal is made to react with air (O2) and steam maintaining high pressure and temperature, which results in the production of CO (Carbon Mono,Oxide) and H2 (the combo is called Synthesis Gas or SynGas) in the 1st stage which has been narrated in the chemical reaction given in equation (4). The CO gas, in the 2nd stage, reacts with steam in Water Gas Steam Reaction (WGSR) where pure H2 is segregated, and CO2 is captured and sequestrated (Liu and Li, 2019) and the same has been summarized in equation (5) below. The summarized reaction during the process is as follows


The extracted H2 can be utilized directly as fuel for an on-site fuel cell (PEMC) to produce electricity and integrated with M.G. to fulfill the electricity requirements of an electricity deficient area. The schematic of the process is shown in Figure 6.
Schematic of coal gasification for H2 extraction and electricity production.
The impact of various operating parameters (catalytic activity, porosity, volatile matter, reaction time, temperature, pressure etc.) has been studied in detail which helps improving the overall efficiency of the gasification process. Reaction time, catalyst percentage and temperature have linear relation with the carbon conversion process while others parameters also affect the process but no general tendency can be inferred (Lekbir et al., 2018; Mishra et al., 2018; Verdugo et al., 2018). Research & development on gasification methods evolved through time ensued many new advances in the process e.g. coal-water slurry gasification, integrated gasification combined cycle (IGCC), Pyrolysis, entrained flow gasification etc. and these methods accompanied with carbon capture technologies (Kaplan and Kopacz, 2020).
The environmental aspects of coal gasification: A challenge in opportunity
Although the Hydrogen itself is a clean fuel with negligible GGEs yet the extraction process through Coal Gasification (C.G.) poses environmental challenges. The process of Hydrogen production, electricity generation, and consequent M.G. integration will lead towards better alternative fuel of future if the extraction process is made eco-friendly by improving the C.G. through Carbon capture and sequestration warranting zero/negligible CO2 emission (Pareek et al., 2020).
Carbon capture and storage/sequestration
CCS represents various techniques targeted at plummeting CO2 emissions during energy conversion, like H2 extraction from C.G. CCS facilitates a cost-effective CO2 emission reduction methodology. CCS is the process of capturing and separating CO2 in the form of a concentrated stream such that it can be transported and stored. The process primarily consists of 3 steps; Capturing, transporting, and storage.
Capturing CO2
Capturing is the first step in which CO2 is captured from the source and segregated from the rest of the gases. The primary capture methods are: Post or after combustion capture, Pre or before combustion capture, Oxyfuel combustion capture (Rao and Phadke, 2017).
Post or after combustion capture
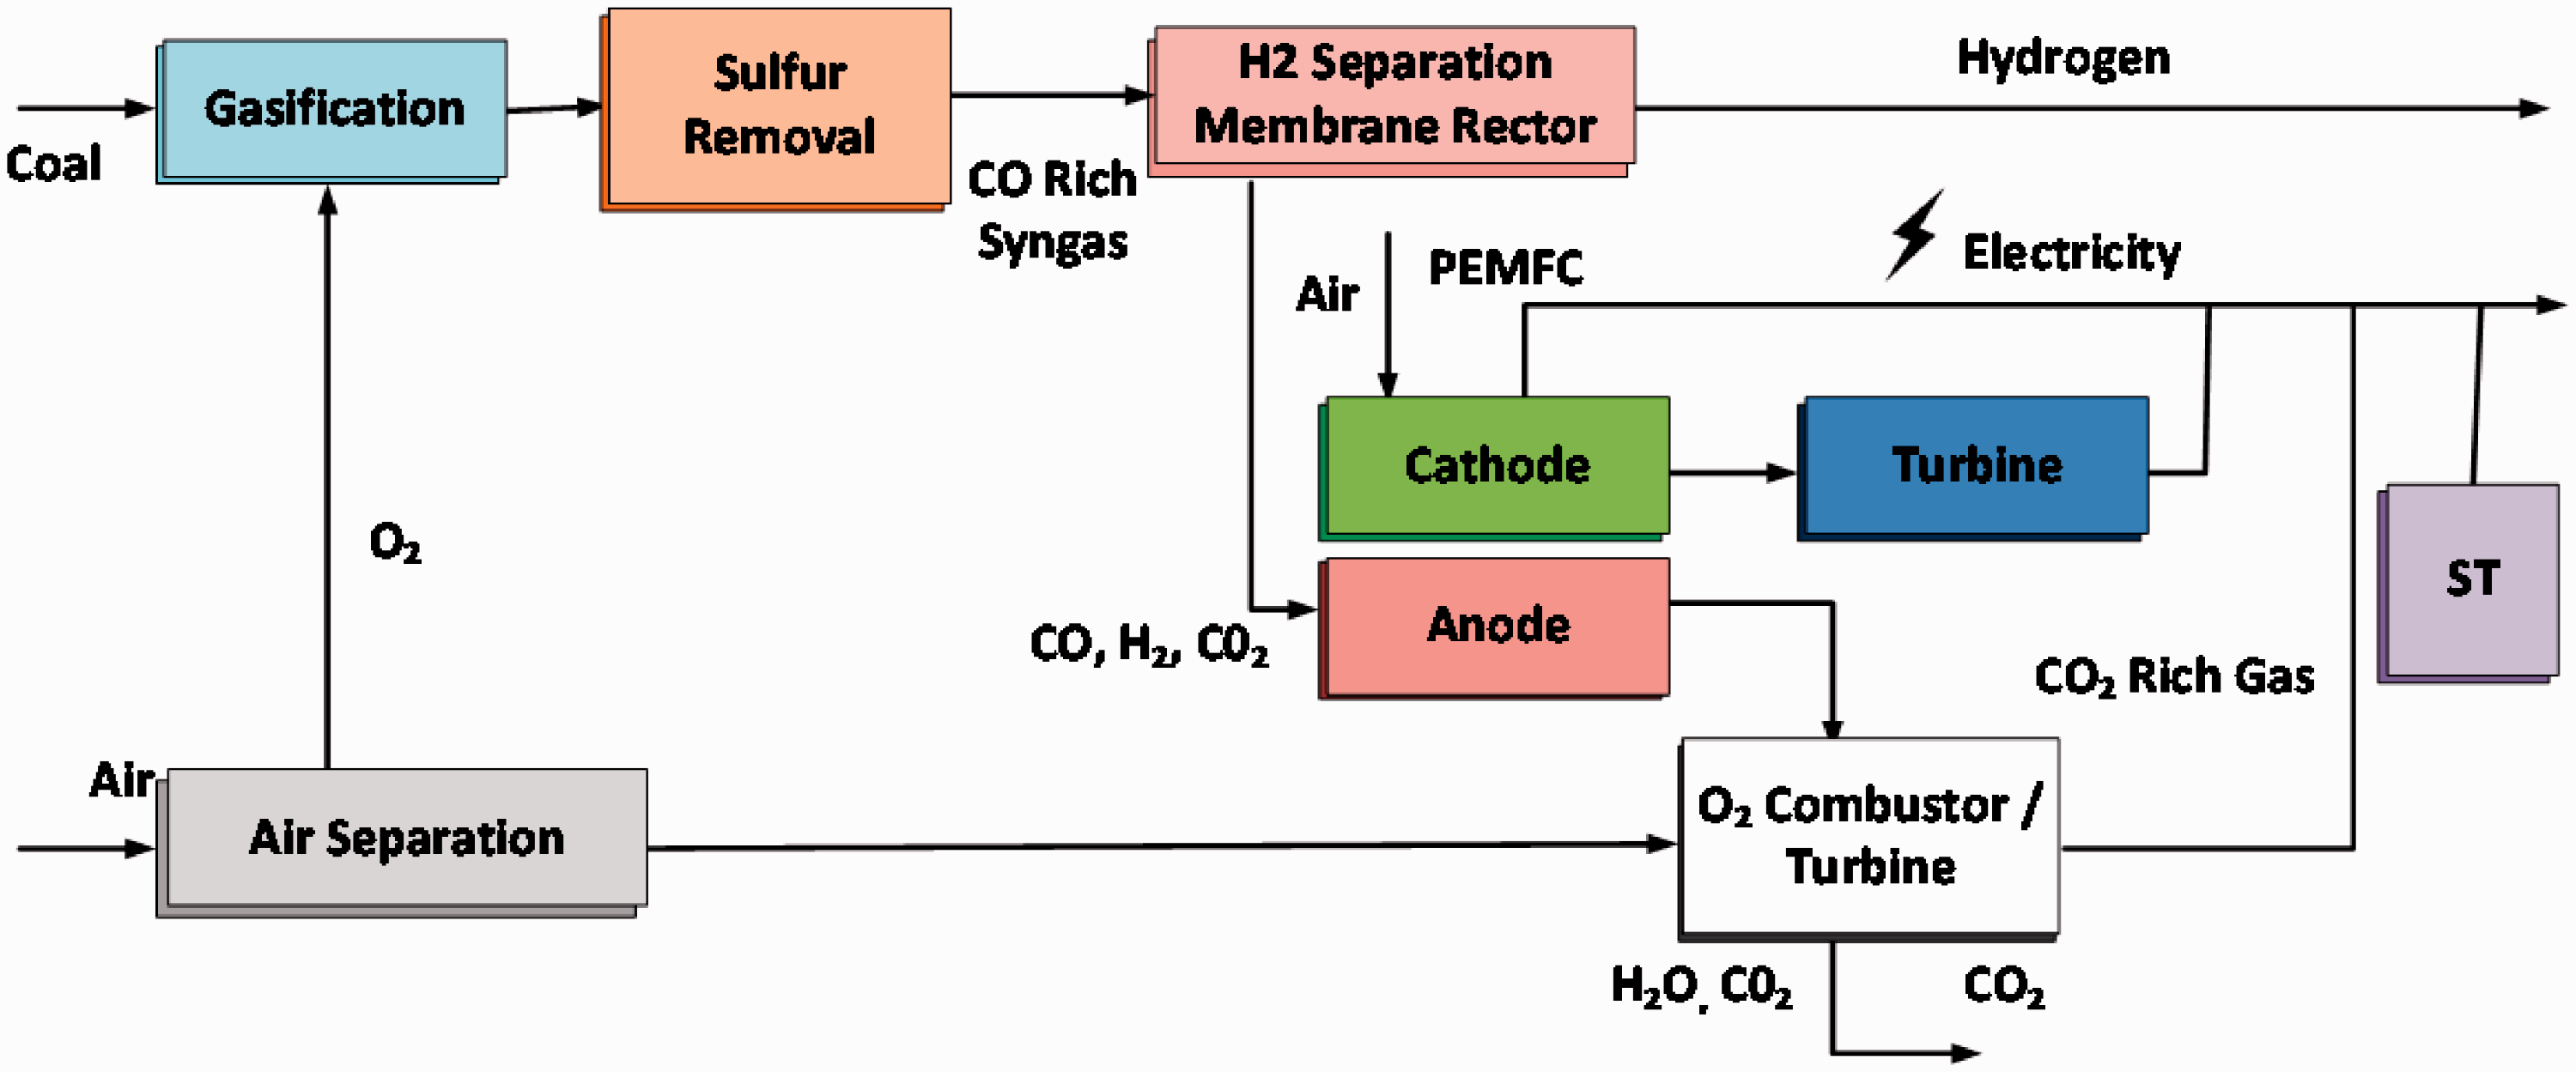
Captivating the CO2 from the exhaust/flue gases (particulate matter, oxides of Nitrogen, Sulphur etc.) generated after coal combustion refers to Post/after-Combustion capture. Absorption/capture methods usually employed are based on solvents, sorbents, membranes, cryogenic etc. The overall cost of this technique is high (Mathieu, 2006). Post or after combustion capture, is depicted in Figure 7.
Post-combustion CO2 capture.
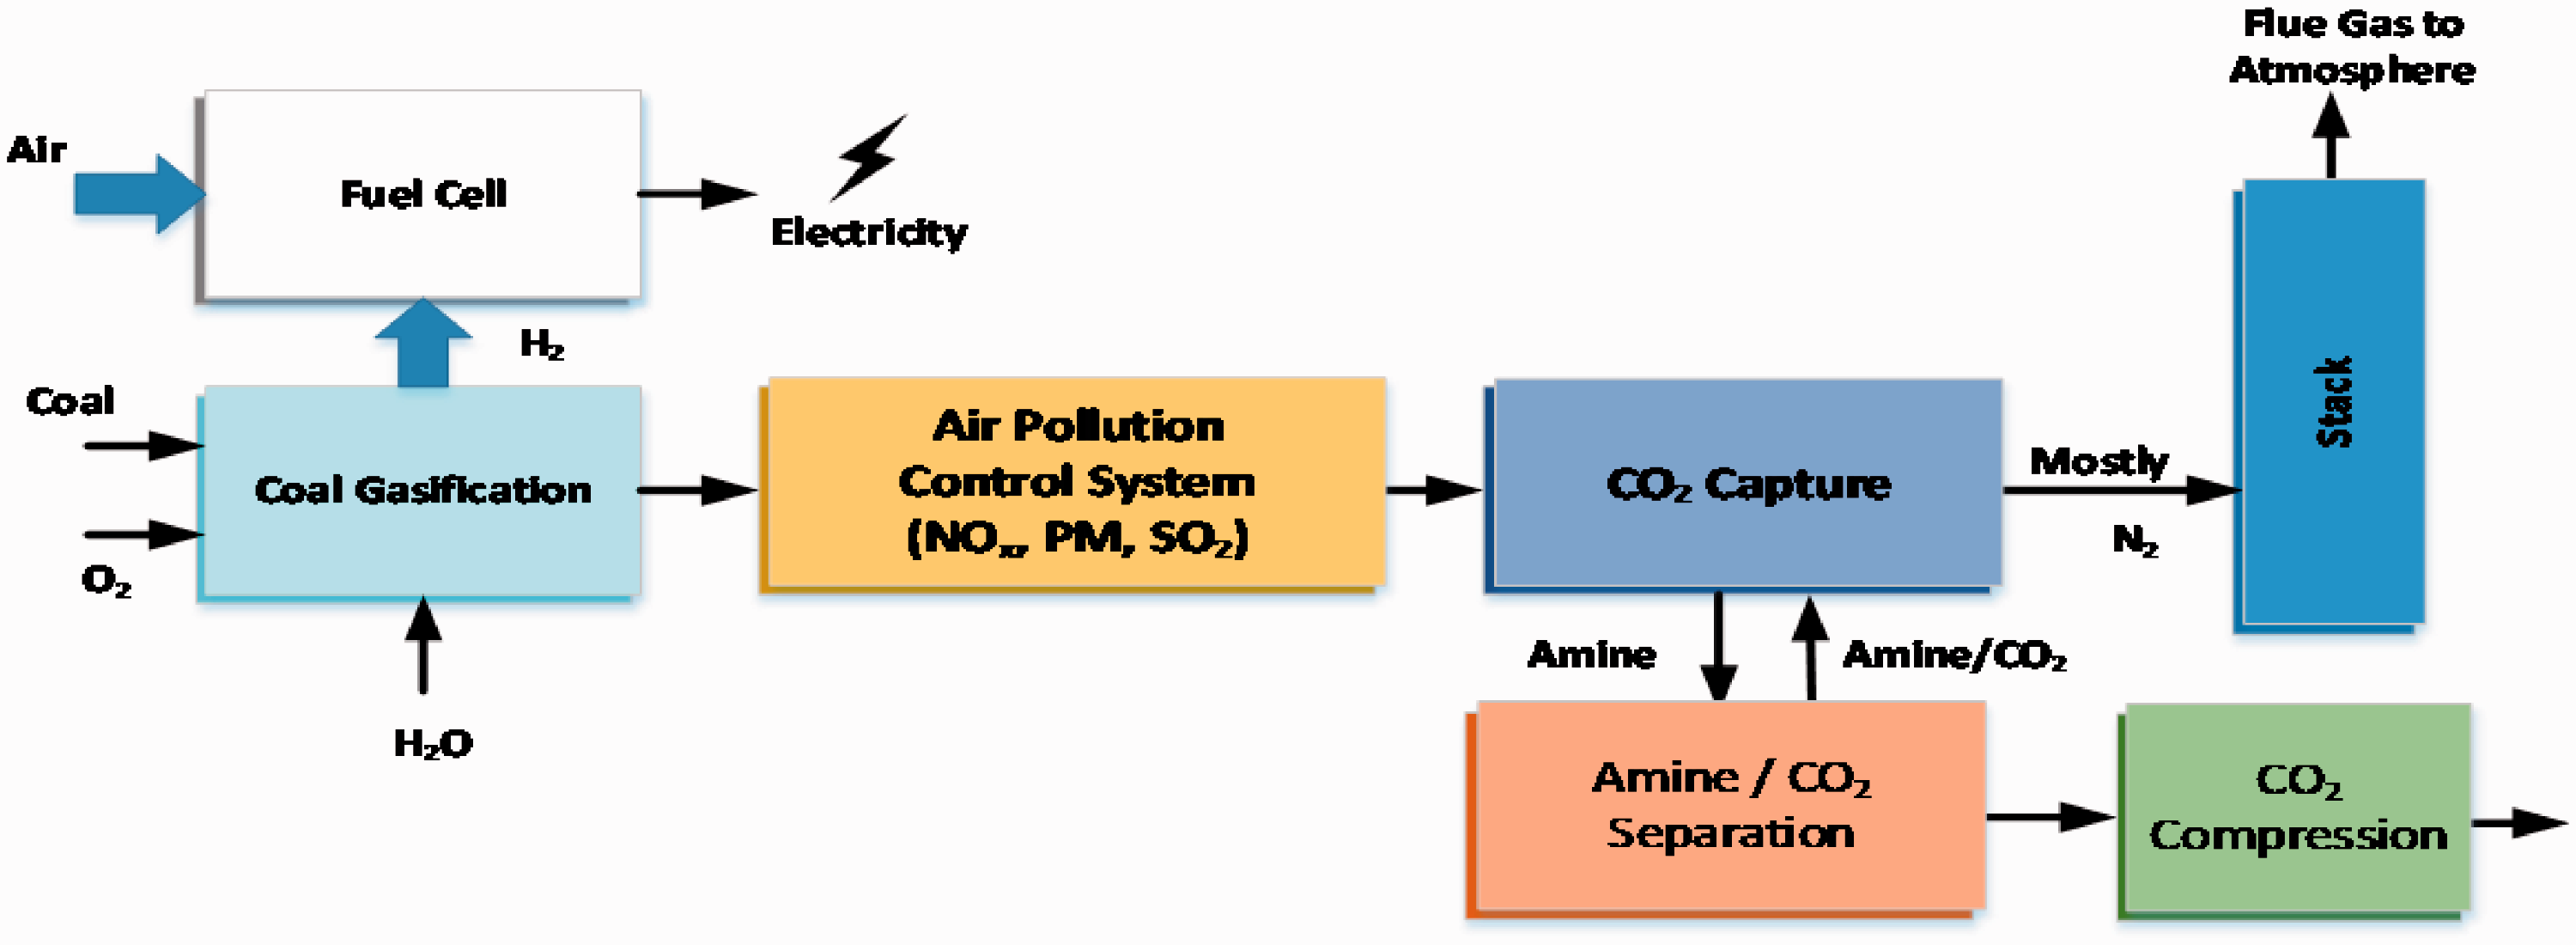
Pre or before combustion capture
This technique is explained through block diagram in Figure 8. In this capturing method, a fuel is made to react with air (O2/steam) to give syngas (Co + H2). A catalytic/shift reactor gives CO2 and more H2. The CO2 removal/separation is achieved by chemical absorption technique. This separation is achieved by increasing partial pressure at removal stage and hence increasing the driving force for capturing. This technique is less expensive than the Post technique (Adams et al., 2017).
Pre-combustion CO2 capture.
Oxyfuel combustion
This CO2 capture method as illustrated in Figure 9. In this process coal is combusted in pure O2 resulting in high temperature and the resultant flue gas consists of CO2 and H2O which moderate the temperature. For capturing CO2 water is condensed in the exhaust steam. This method has the additional merits of reduced NO x emissions, high Hg (Mercury) removal and wide spread applicability (Hou et al., 2020).
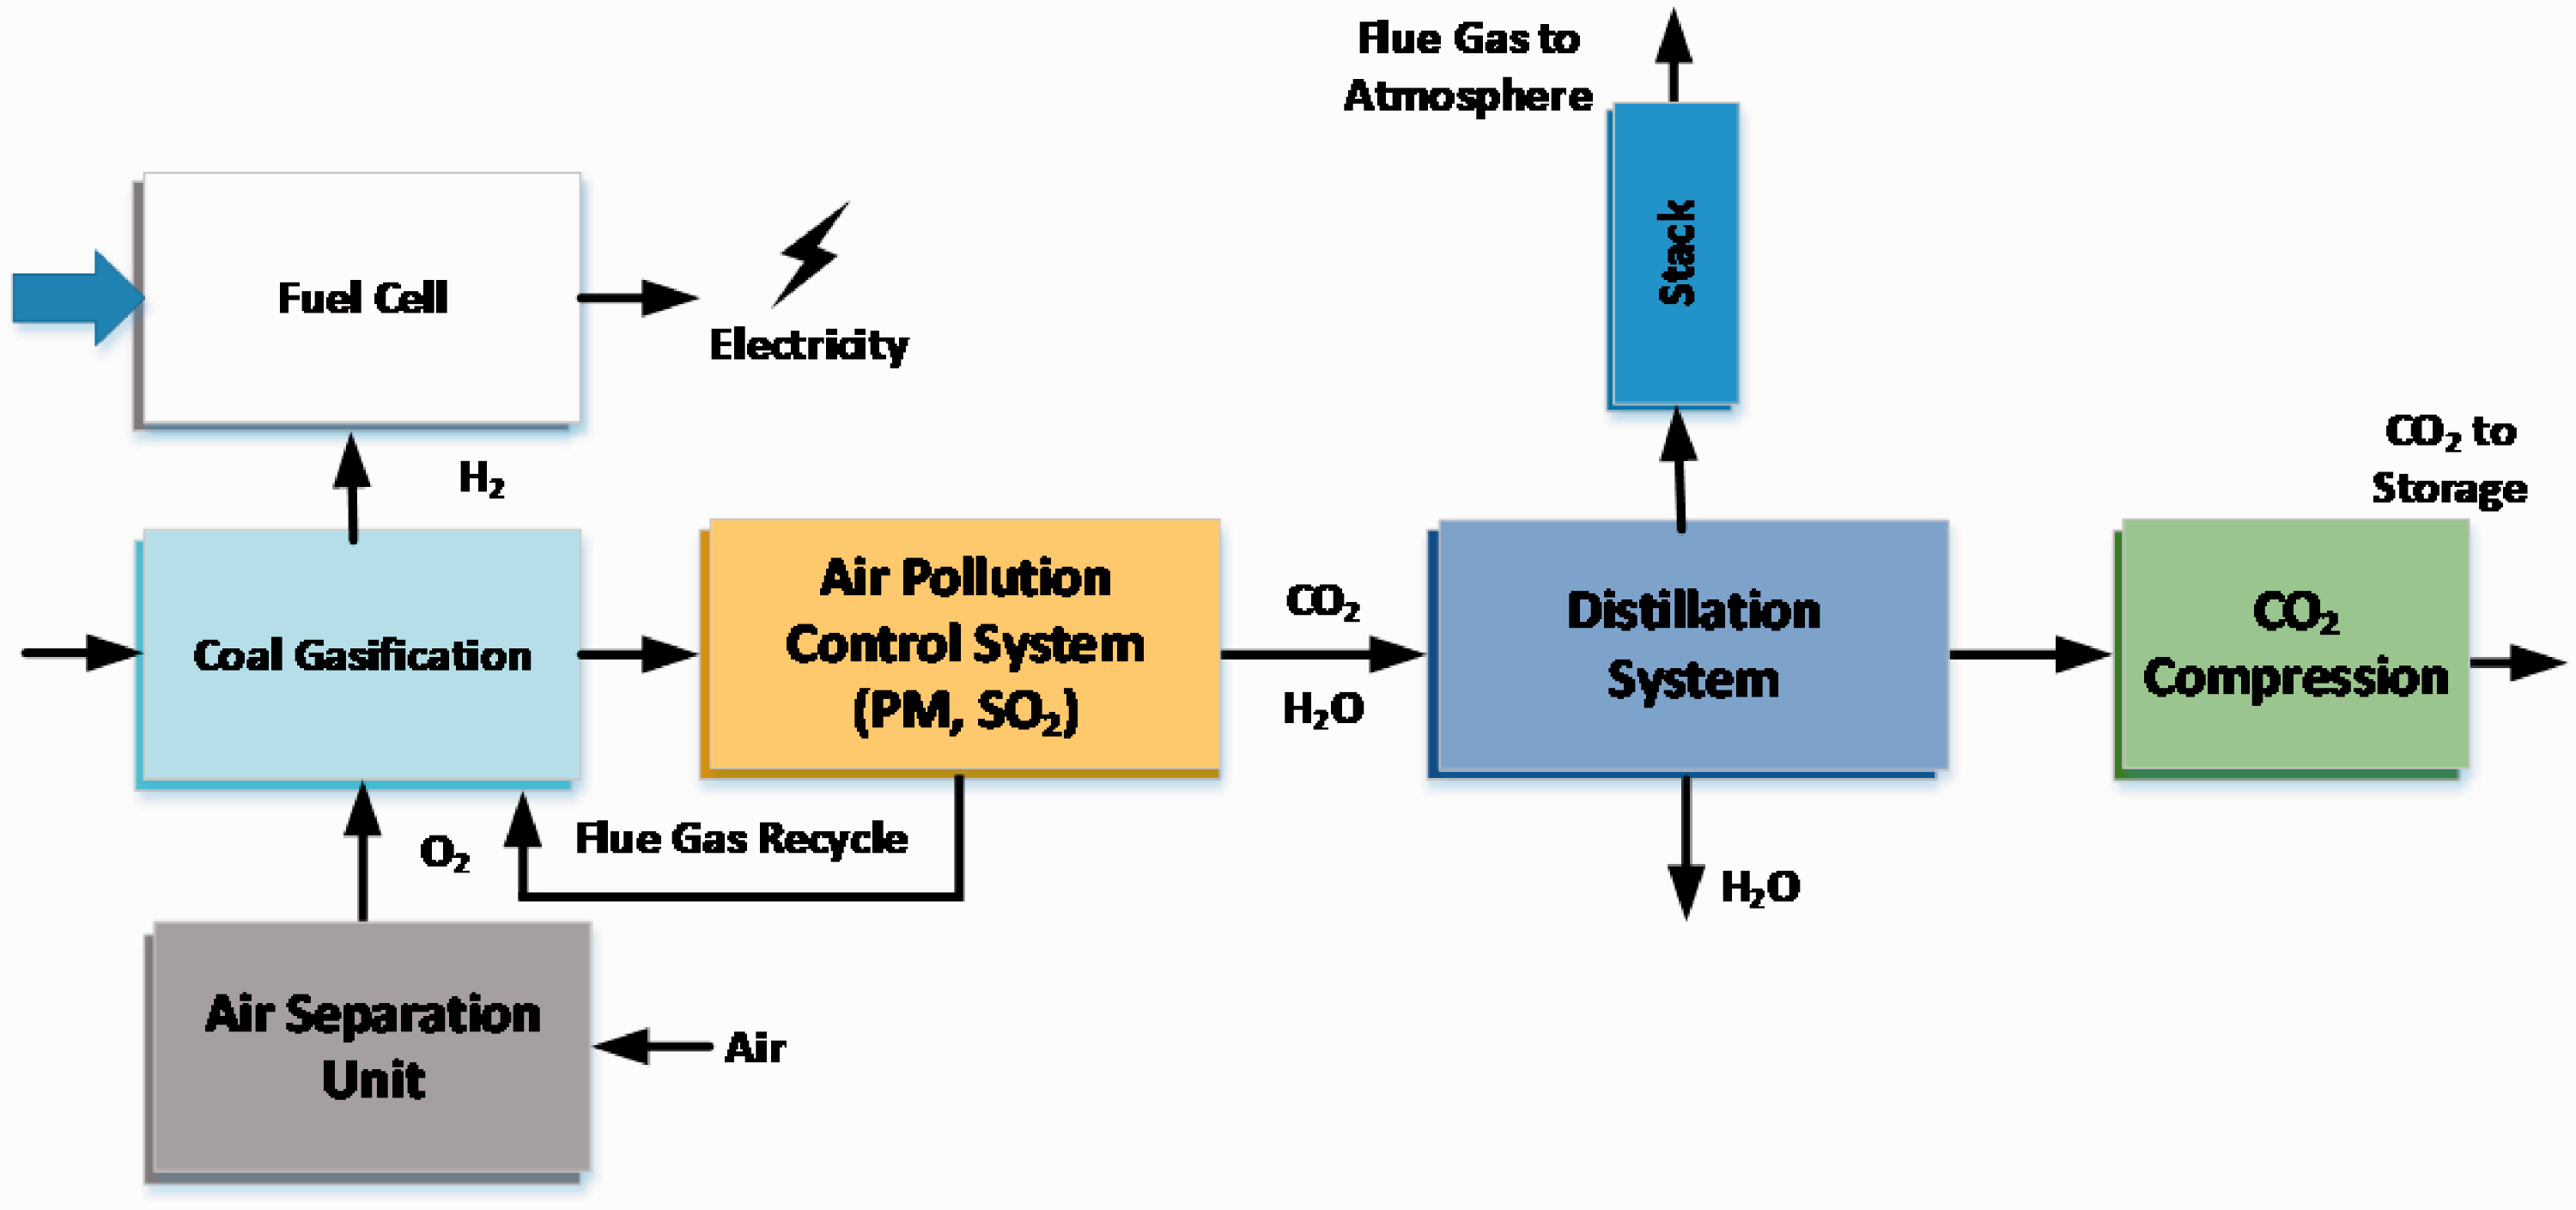
Oxyfuel combustion.
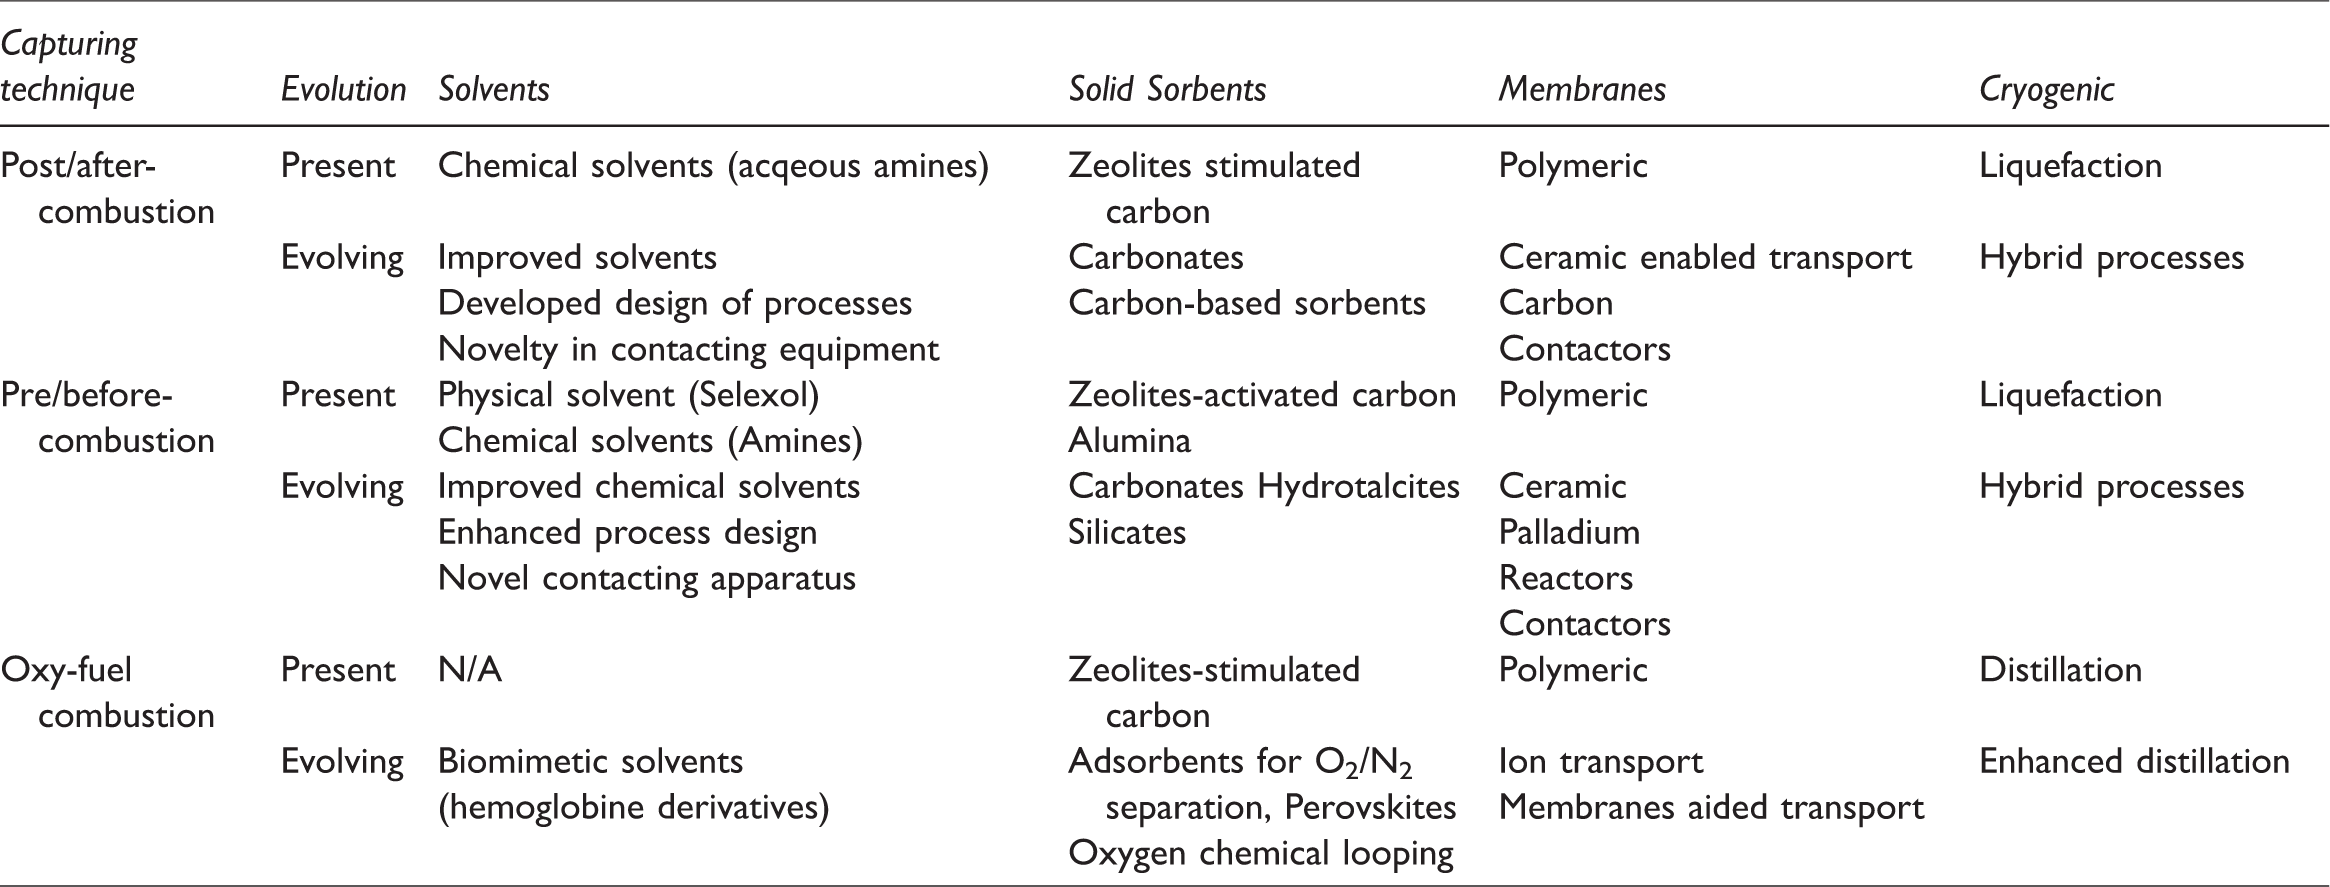
The following Table 4 presents the comparison of capturing techniques in the existing study.
Comparison of capturing techniques.
Transporting CO2
Furthermore, near the capture step, the gas is purified and compressed to provide a concentrated stream for transportation. The captured/collected CO2 can be transported via suitable conveyance to appropriate storage locations. Pipelines, ships, rail cars, trucks etc. are the common transport sources.
Sequestrating/Storing CO2
Sequestration of CO2 is done in a dense fluid/supercritical state. The geological formations preferred for CO2 injection as sequestration steps are: exhausted oil and gas reservoirs, deep down saline formations, un-mined coal beds, oceanic storage and mineral carbonates etc. and can be utilized later for various industrial processes. Among these, the most energy demanding and cost determining (about 75–90%) step is separation or capture of CO2 (Yosuke et al., 2019; Sood and Vyas, 2017). The overall process has been illustrated pictorially in Figure 10.
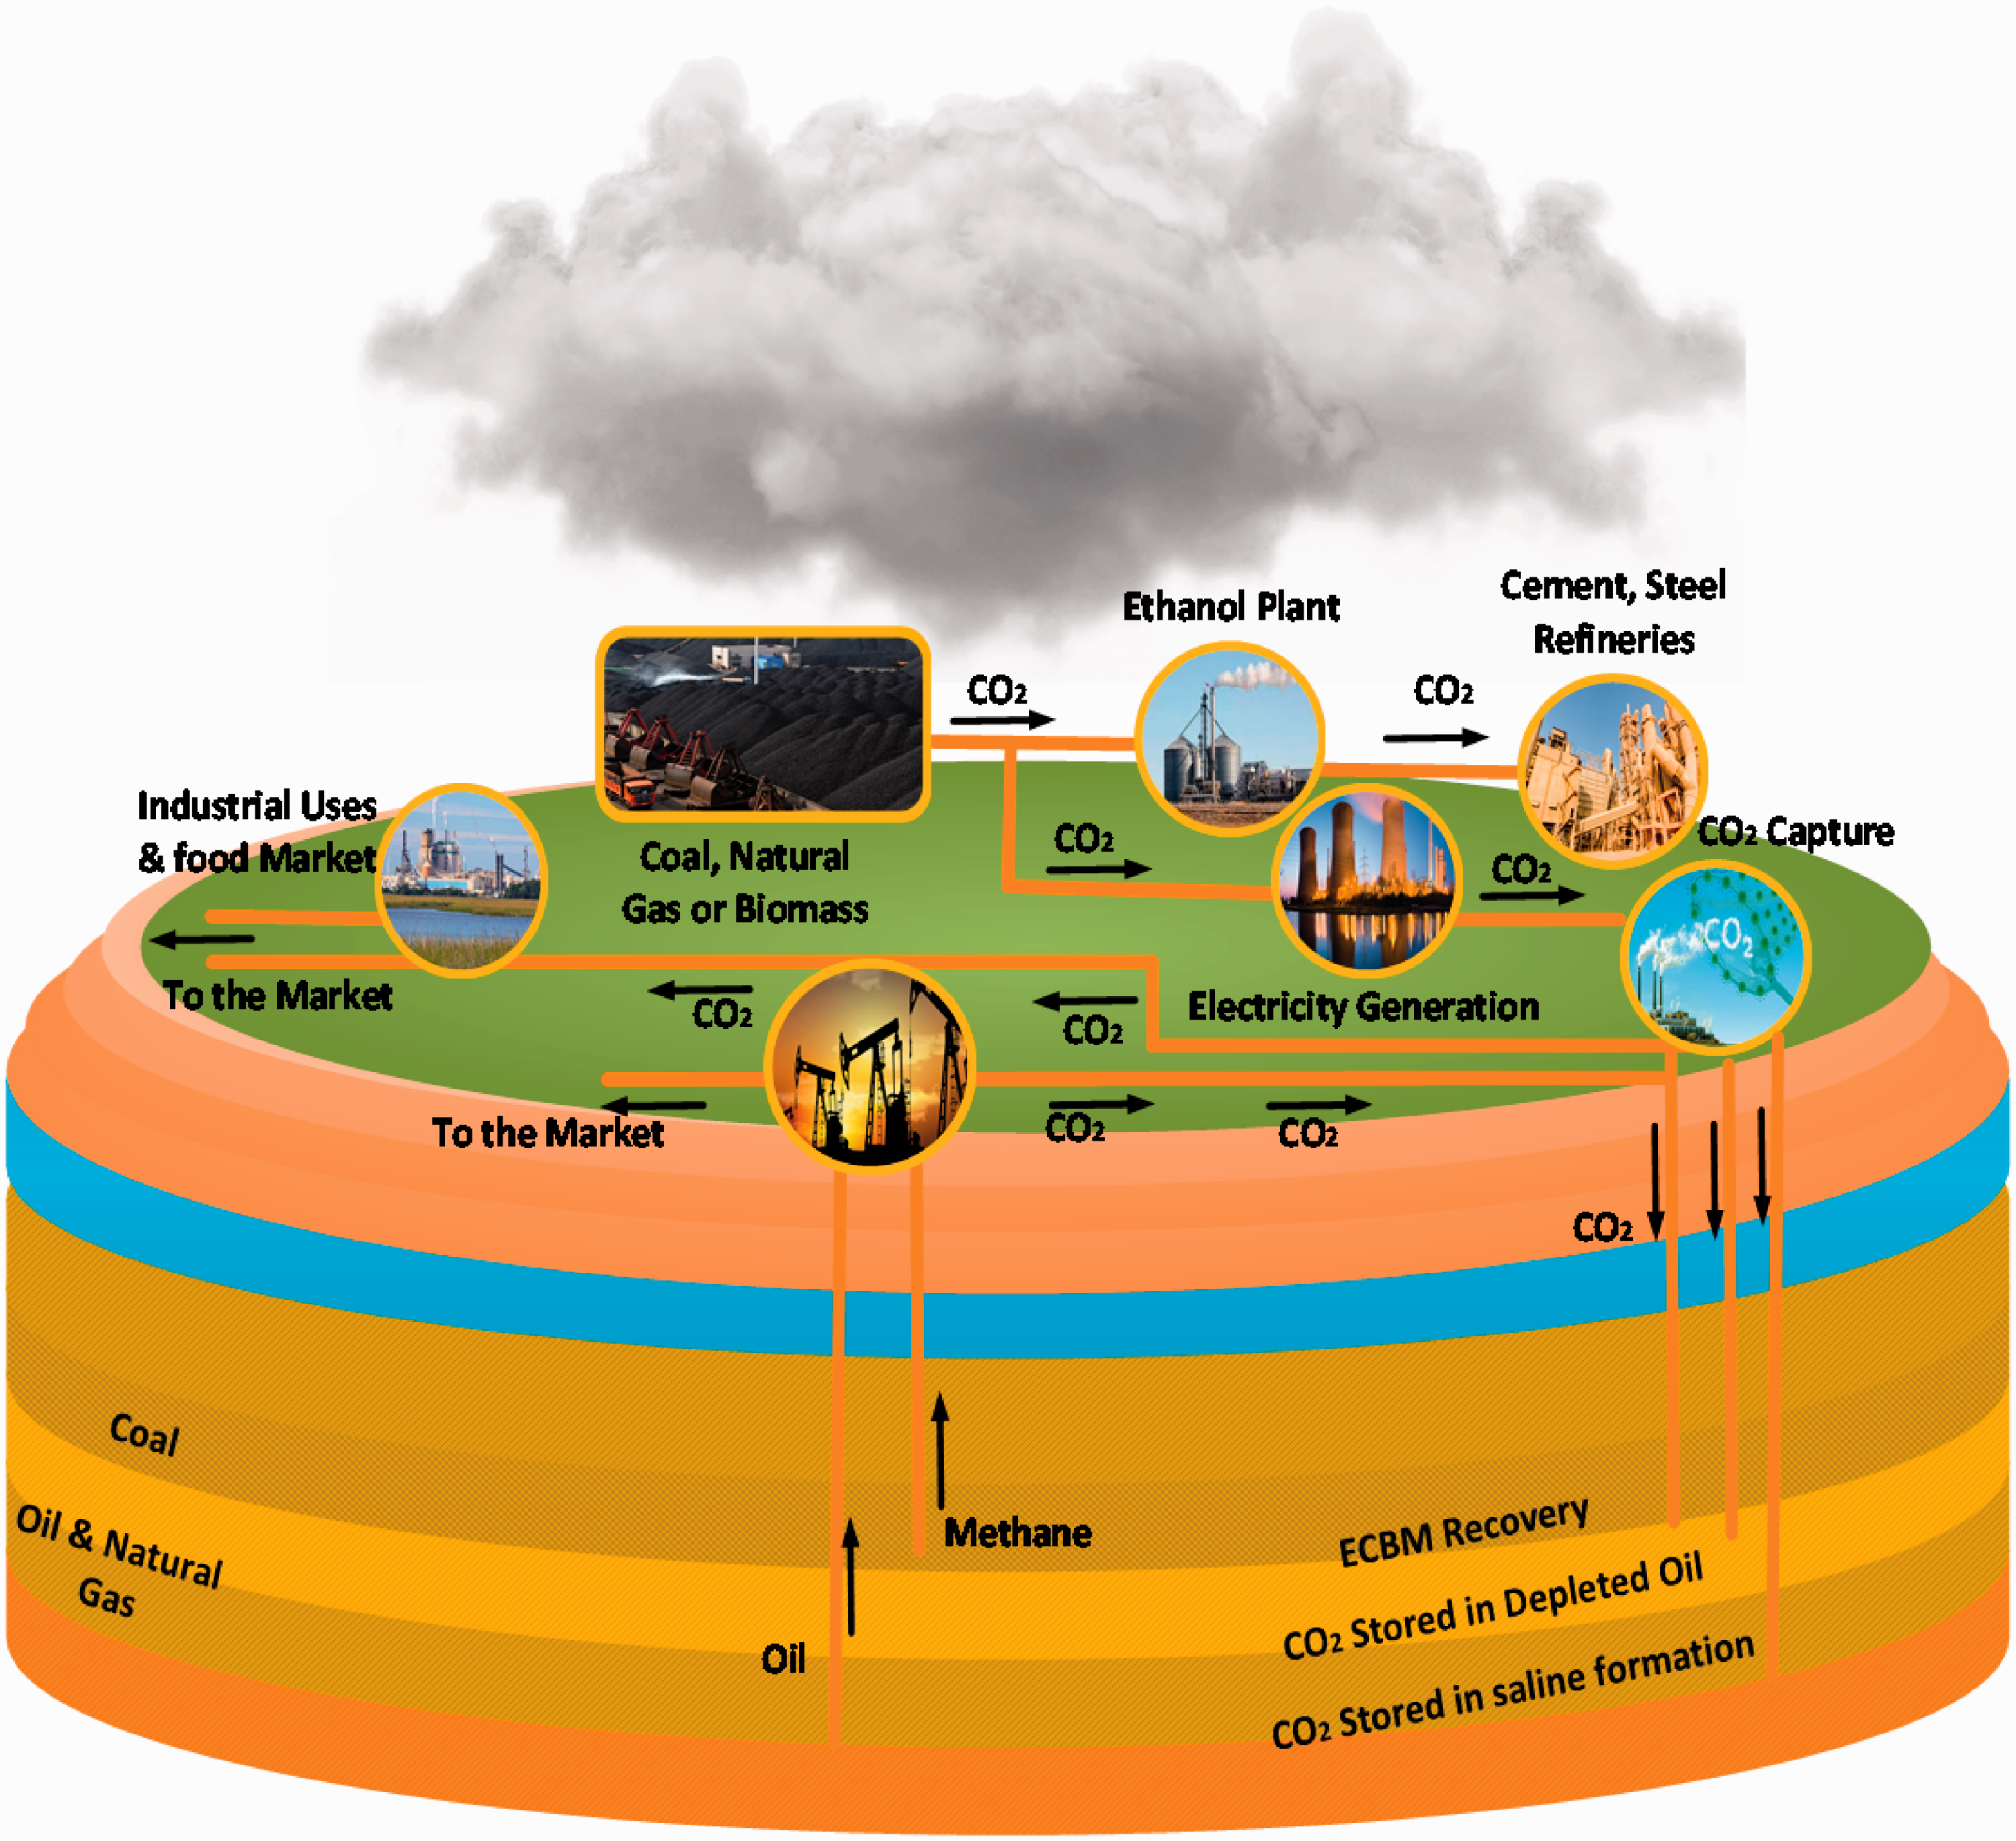
Carbon capture and storage/sequestration (CSS) process.
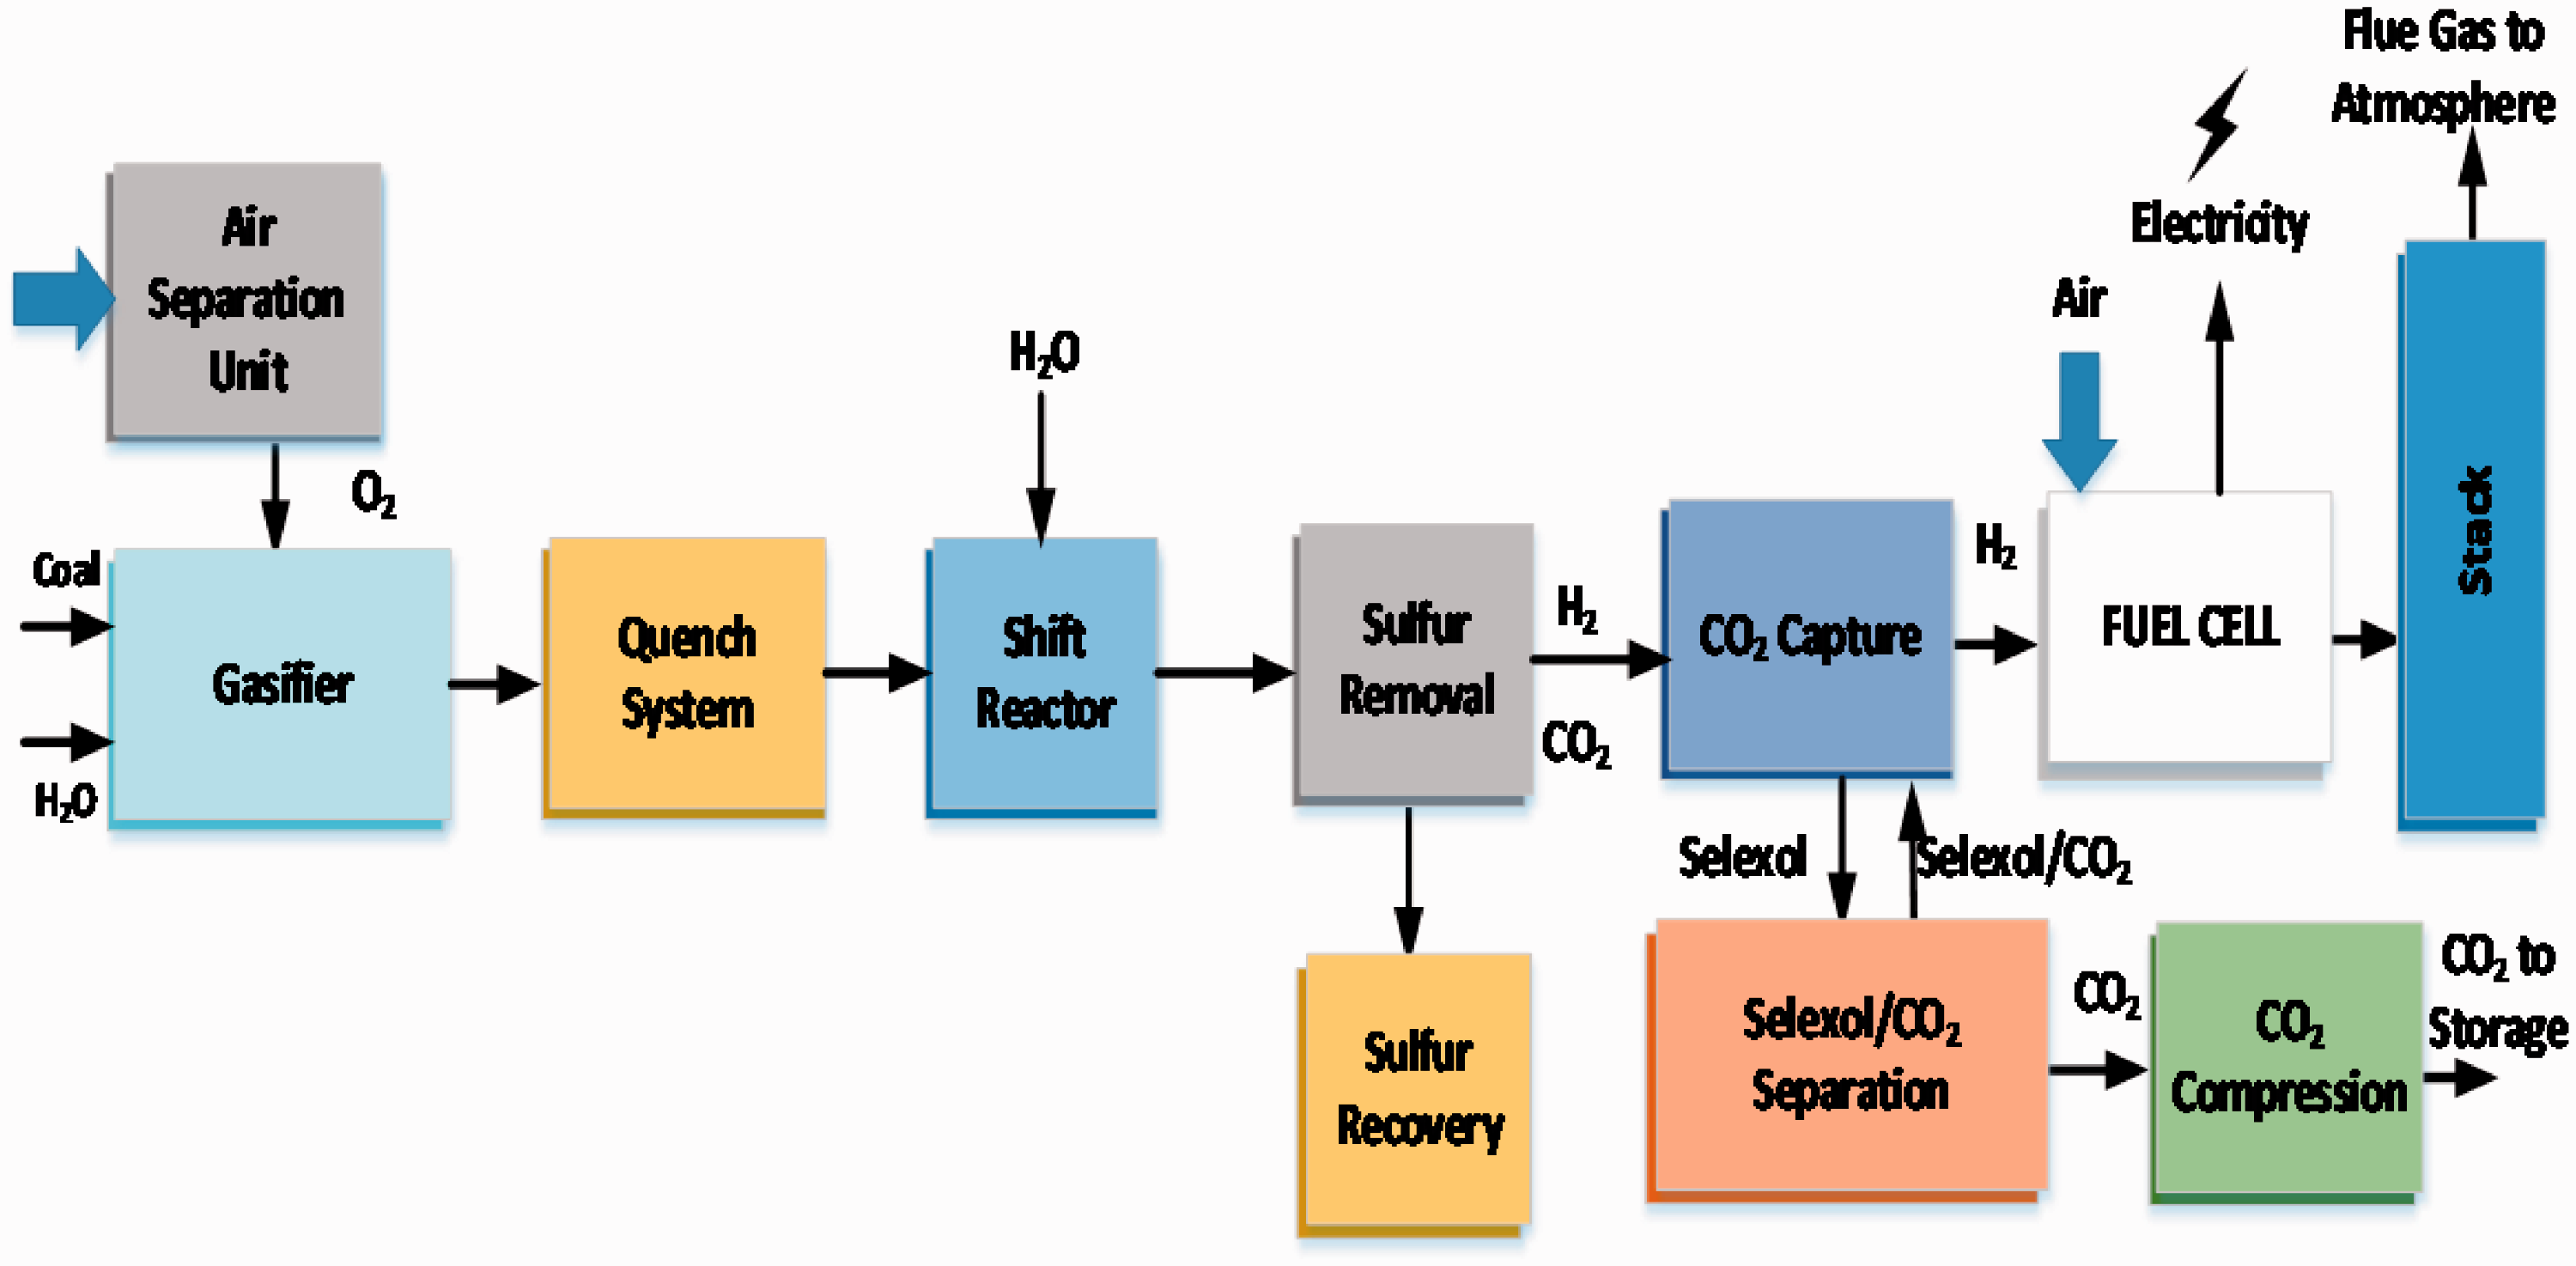
These steps are depicted by block diagram in Figure 11. The coal in the dried form is fed to a high-pressure gasifier, and O2/air and H2O/steam are injected to synthesize hot syngas. From this syngas, particulate matter is isolated by cooling and filtration. For cooling of syngas, heat is extracted, which helps in generating high-pressure steam. The most important step of this process is Sour Water Gas Shift Reaction (SWGSR), in which CO of syngas reacts with steam to synthesize supplementary H2, CO2, and H2S (the combination is termed as acid gas). A special-purpose system recovers sulfur as a useful byproduct, and CO2 is captured, compressed, and sequestrated for use/transportation etc. The H2 production from C.G. along with CCS is the cheapest source of clean H2. Due to advanced research and use at the commercial level, the technique is proven and practical.
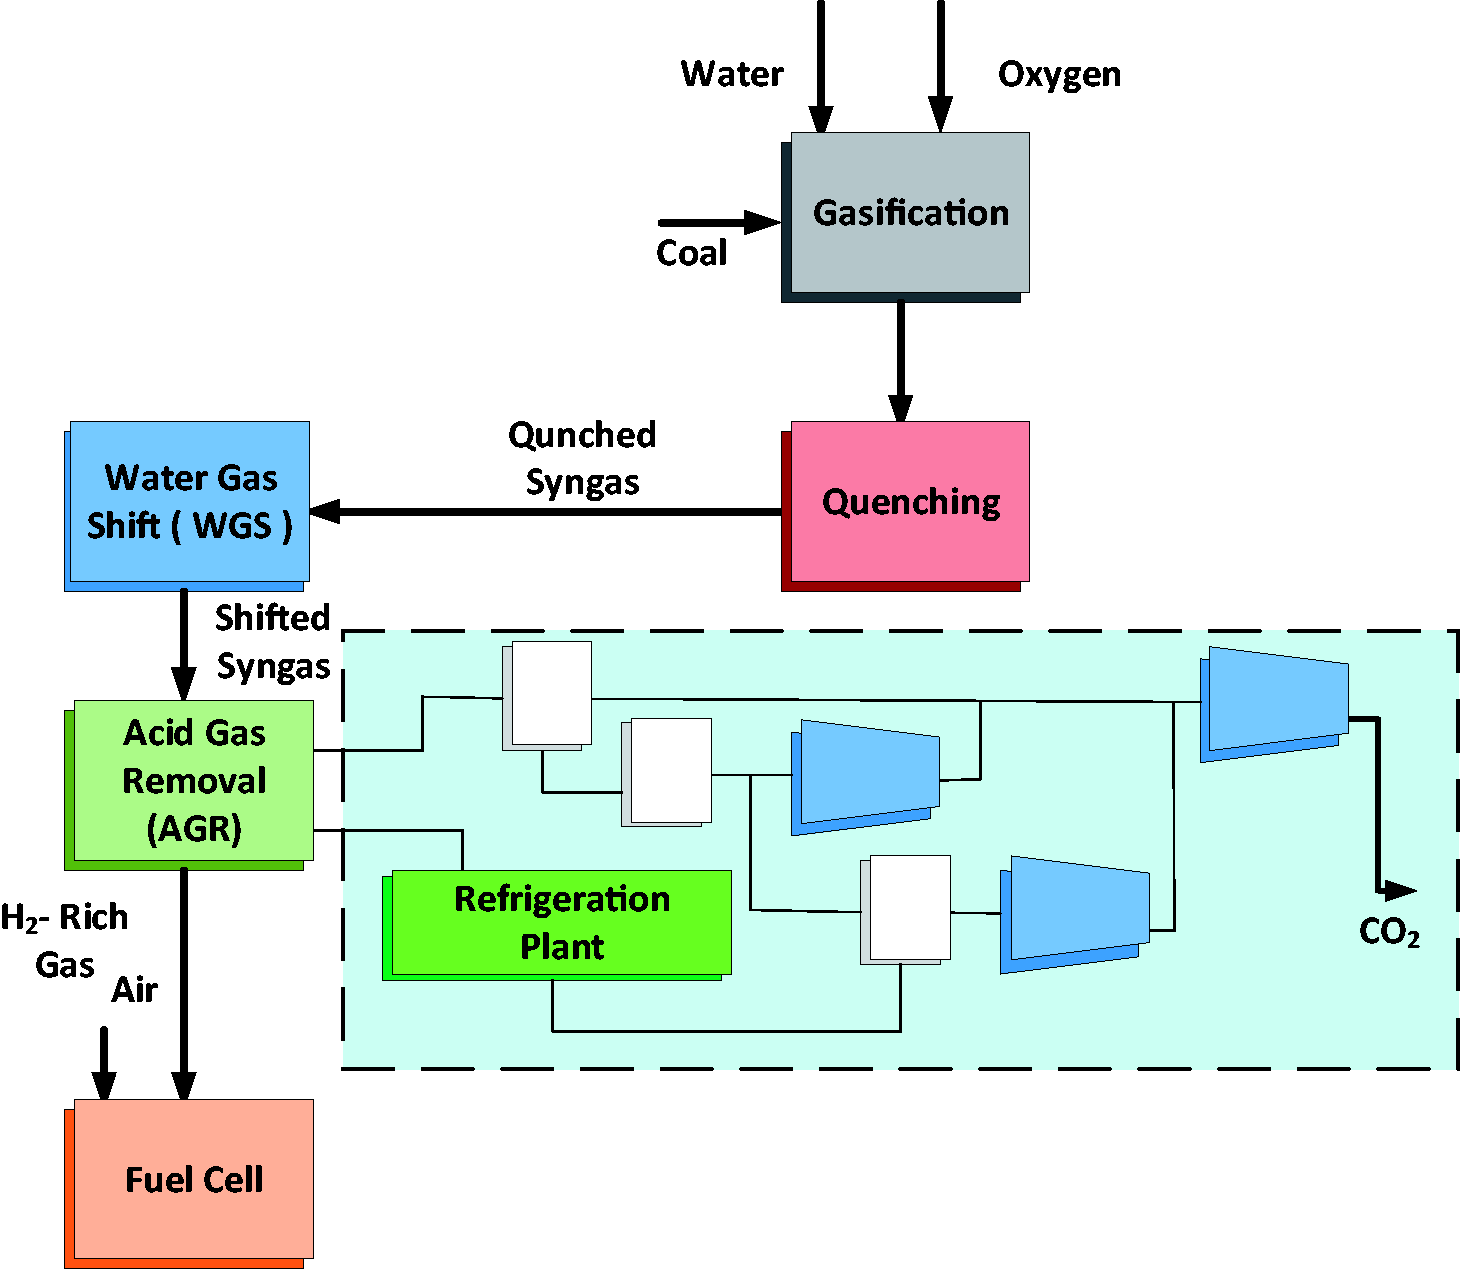
Block diagram of the process for H2 extraction from gasification and CCS.
Such CCS plants are successfully operating across the world, e.g., in Texas Valero Refinery with CCS generating 500 tons/day of H2 from natural gas gasification. Other plants are Coffeyville Gasification Plant in Kansas, giving 200 tons/day of H2 from petroleum coke gasification, Quest CCS in Alberta (Canada) etc. (Global CCS, 2019). With successful CCS implementation in C.G., > 90% CO2 emissions can be evaded and further improvements in the CCS can increase this percentage. Although CCS operation increases energy utilization of the overall process, yet the future is about to find eco-friendly, steady energy resources. (Vairakannu and Kumari, 2016) employed underground C.G. with Chemical Looping Reforming (CLR) to extract pure H2 along with CCS and used H2 for PEMFC. The efficiency with and without CCS is compared to get an insight into the CCS process affectivity. The efficiency with CCS is found to be 43.59% and without CSS 45%, but the environmental impact of CO2 can be avoided with little loss of efficiency.
Cost-benefit analysis of coal gasification and hydrogen-based fuel cell power generation
An investment decision invariably depends on evaluating one option against another. Sometimes, there are options in multiple projects lineup, or sometimes there is no other option except for the doing of one project. The cost-benefit analysis (CBA) is the basic tool to evaluate, compare, and determine the selection of the project. The CBA principal works on determining the benefits of projects and compares it with required investment/costs, and identifying the actions to maximize the return (Mouter, 2014). A cost-benefit analysis used to evaluate the ideas in the real world in a wide variety of situations regarding power generation:
Capital investment evaluation. Determining a project or operating change feasibility. Benchmarking for comparing projects. Prioritizing investments through investment and cost.
This paper will evaluate the cost comparison of hydrogen production cost ($/kg) and electricity generation cost ($/MWh). For cost-benefit analysis, the computation of cost for hydrogen production and electricity generation is required for the following factors:
Capital cost (CAPEX) Fixed and variable operating cost (OPEX)
Capital cost
The investment required to build up the production facility is capital cost, which has different components as under:
Total Capital Cost = Equipment & Plant Cost + Building & Construction Cost + Accessories Cost
The capital cost pertains to the base year and required to be true on the present year basis; therefore, the following formula has been used which is given in equation (6)
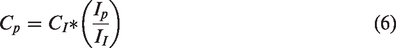
The present capital cost (C.P.) is calculated through Initial Capital Cots (CI) and times with Chemical Engineering Plant Cost Index (Stiegel and Ramezan, 2006) of initial year (II) and present year (I.P.).
Fixed and variable operating cost
The operating cost is categorized under fixed and variable costs in Table 5.
Categorization of fixed and variable costs.
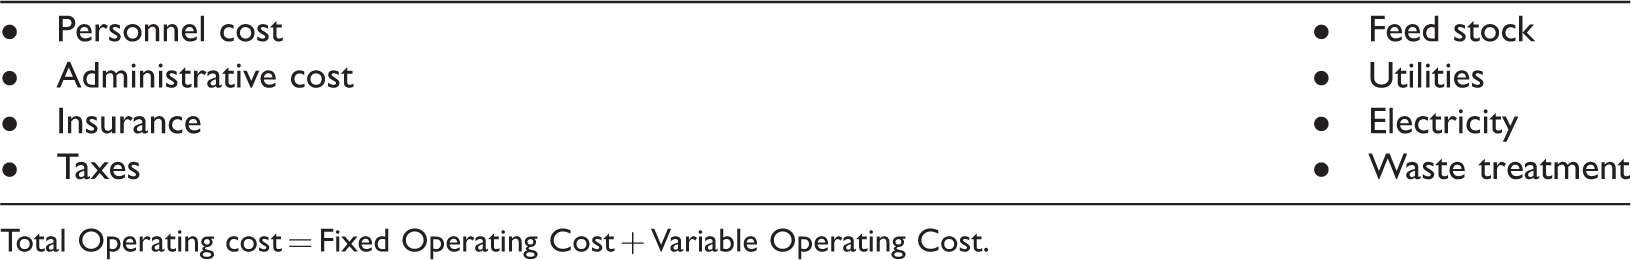
Total Operating cost = Fixed Operating Cost + Variable Operating Cost.
Annualized cost
The total capital cost is spread throughout the economic life of the plant. To have the annual cost impact, the cost is required to be annualized through Capital Recovery Factor (CRF) by taking net present value.
Annualized cost = (total capital cost × CRF) + total operating cost
Where equation (7) represents total capital cost of the economic plant throughout the study
Levelized cost
The CAPEX and OPEX are averaged out over the life of a project according to projects and on a particular set of assumptions. The annualized costs are calculated for each option and divided it with total units of measure, and the Levelized cost will be in $/MWh.
Hydrogen production cost
The hydrogen production cost $/kg is estimated through Coal Gasification (C.G.) by considering without and with CO2 sequestration. The C.G. with CO2 sequestration will have an additional impact on capital and operating costs due to additional equipment and labor. The assumptions are used for calculating the hydrogen per kg cost is tabulated in Table 6.
Assumptions calculating hydrogen production cost.
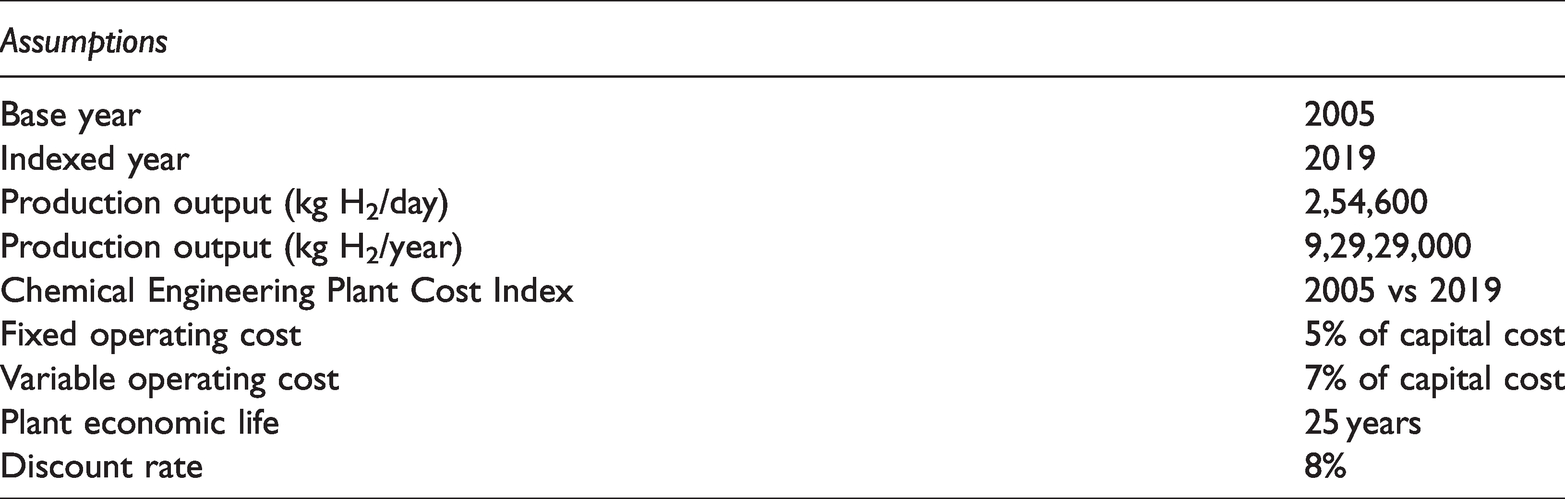
The different assumptions used by (NREL, 2009; Thengane et al., 2014) and (chemengoline.com) are as under:
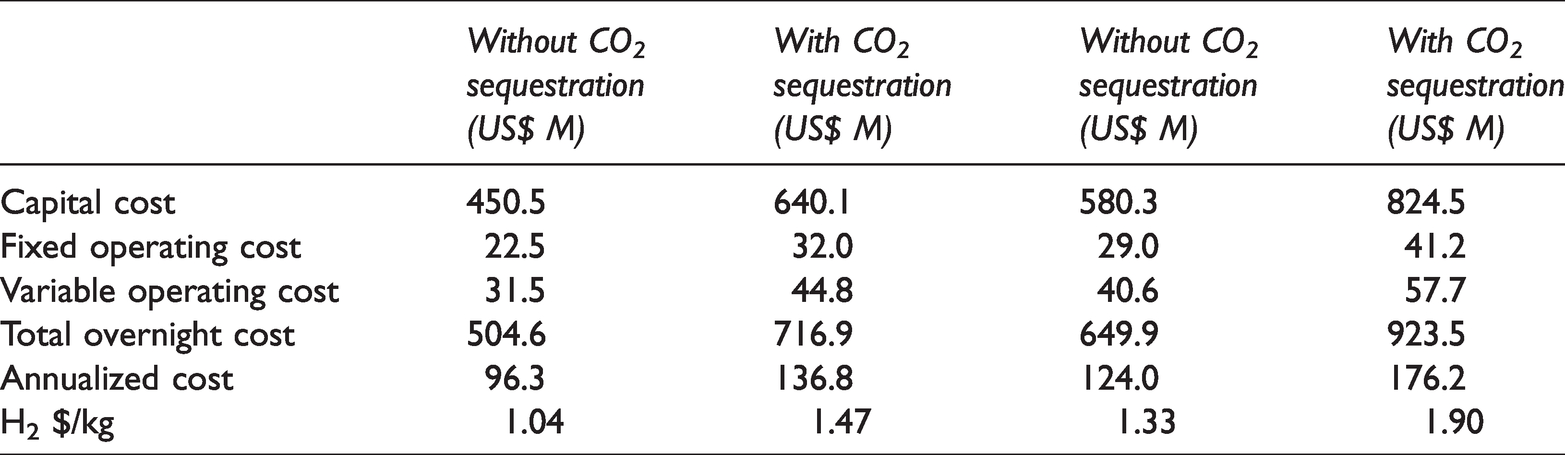
The comparison of cost Coal Gasification (C.G.) considered without and with CO2 sequestration is depicted in Table 7 and Figure 12, respectively.
Comparison of hydrogen against base year and 2019 under with and without CO2 sequestration.
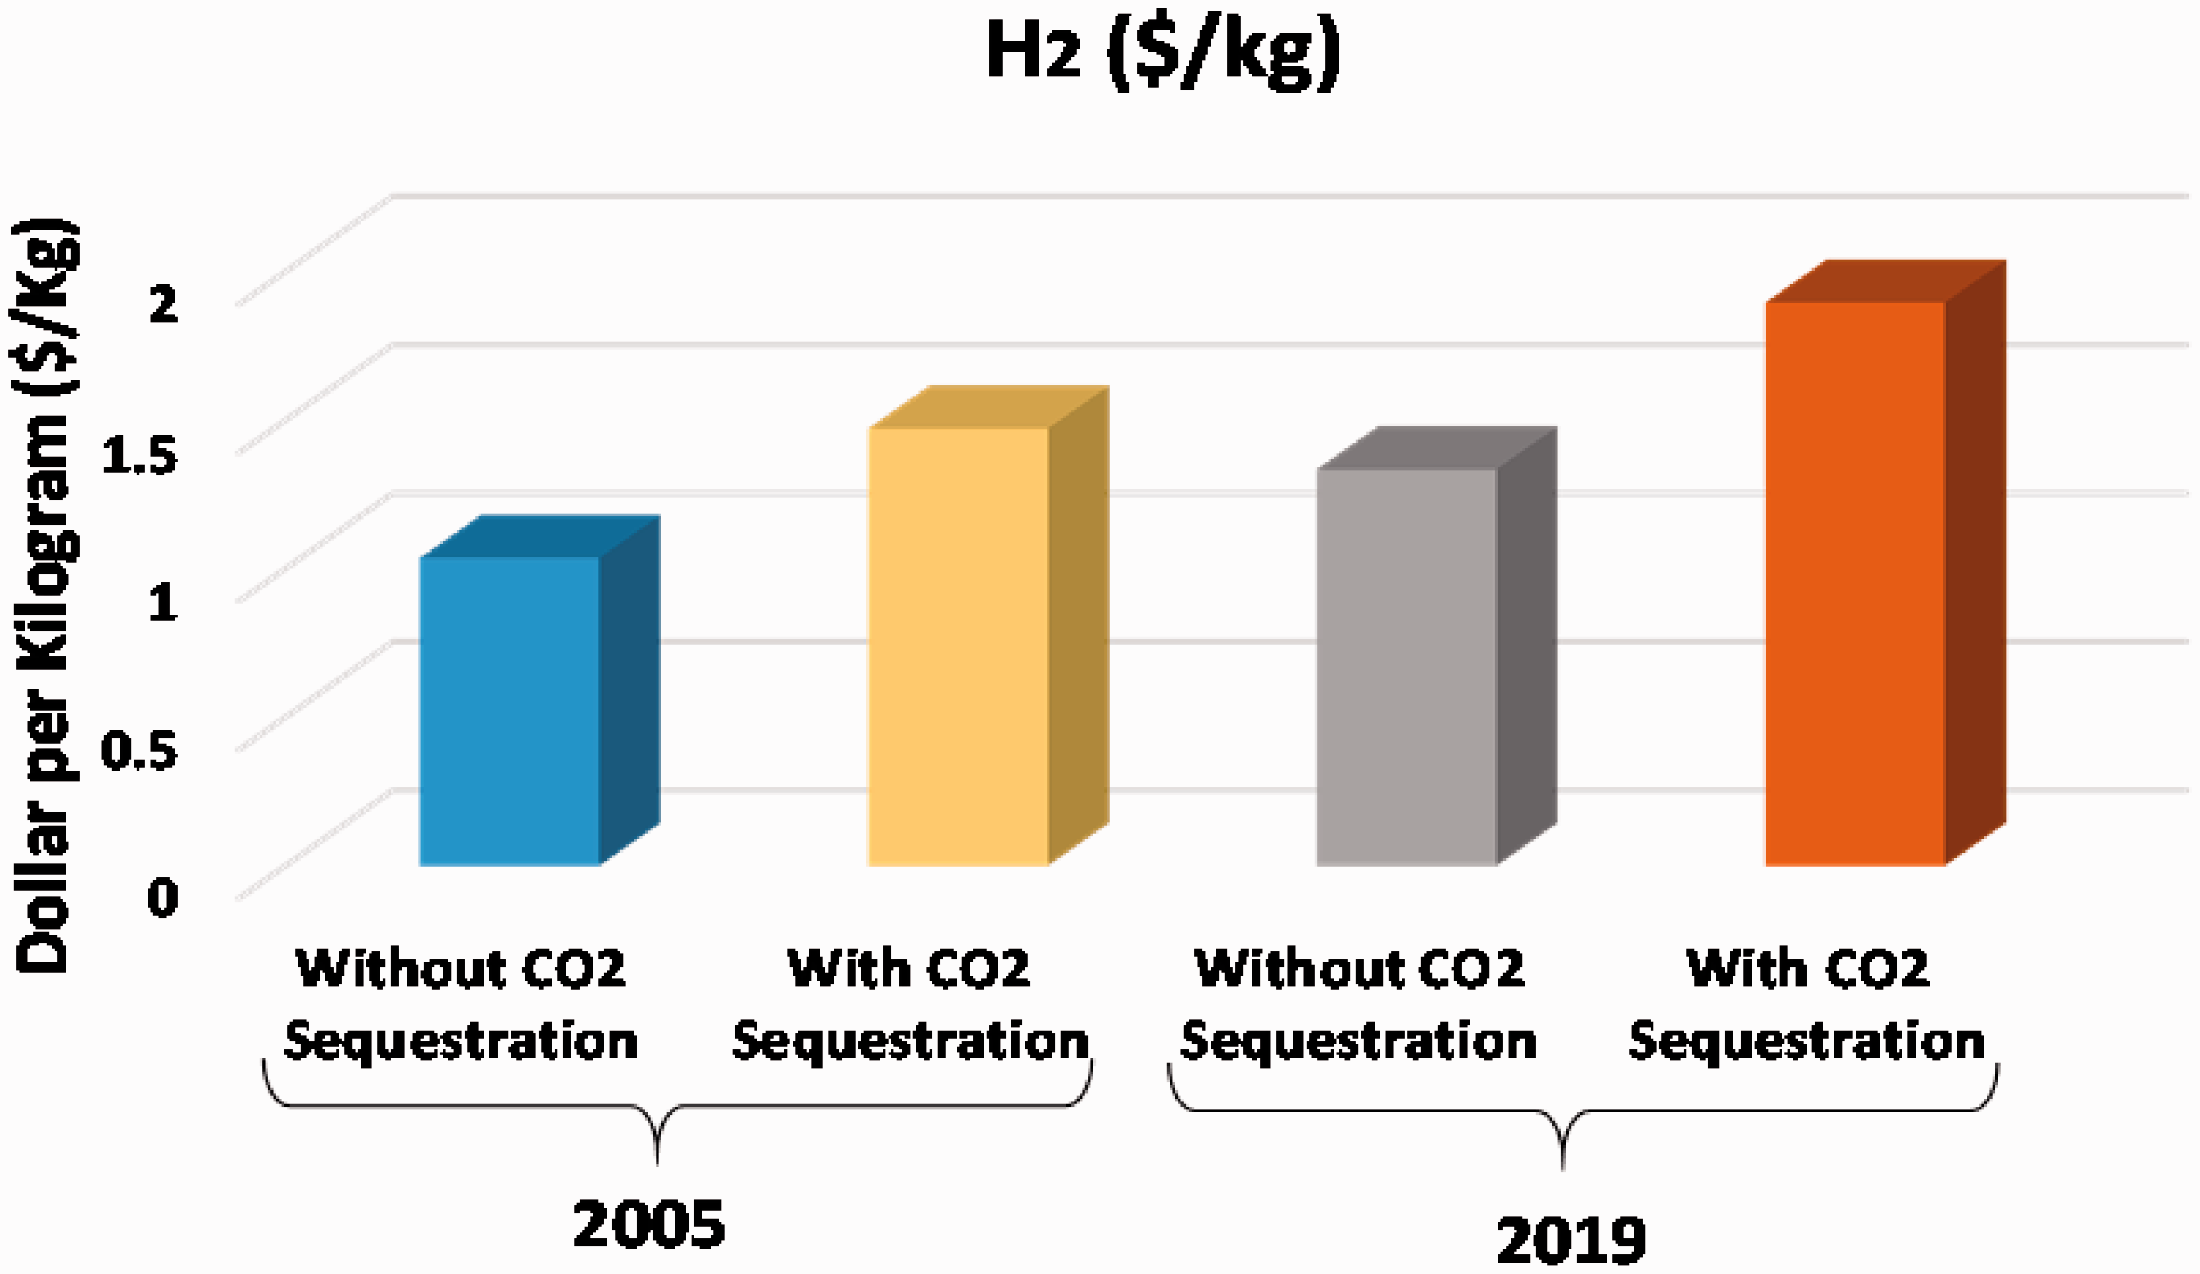
Comparison of hydrogen cost of production.
Production of Hydrogen from C.G. is one of the economical ways as compared to the other sources corresponding with the energy efficiency as well. Pyle et al. (1994) and Schoonman and Van De Krol (2011) has narrated the hydrogen production cost from other processes is depicted in Figure 13.
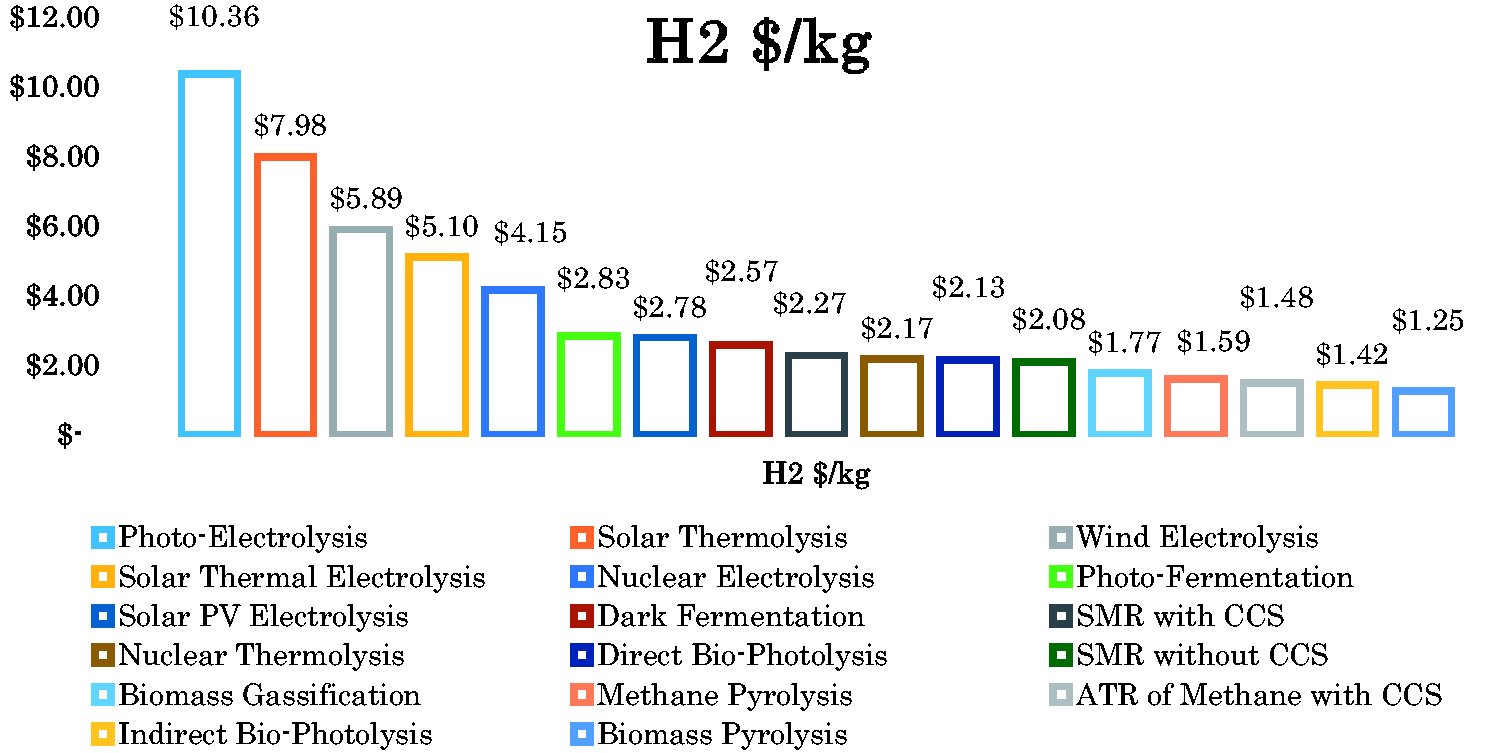
Hydrogen cost of production from other resources.
The other processes may have a low cost as compared to the C.G., but that operates at a limited short amount of capacity per day and lacks economies of scale. If the production is made equivalent to the C.G. process, which is not feasible in case the requirement is in huge quantity per day for electricity generation. So, to get the desired product from other processes, a sizeable investment is required and eventually will have a higher annualized cost (Thengane et al., 2014). Moreover, in S.A., coal is indigenous and available at an economical price; thus, it reduces the import of energy resources. Therefore, the C.G. process is the most promoted among others.
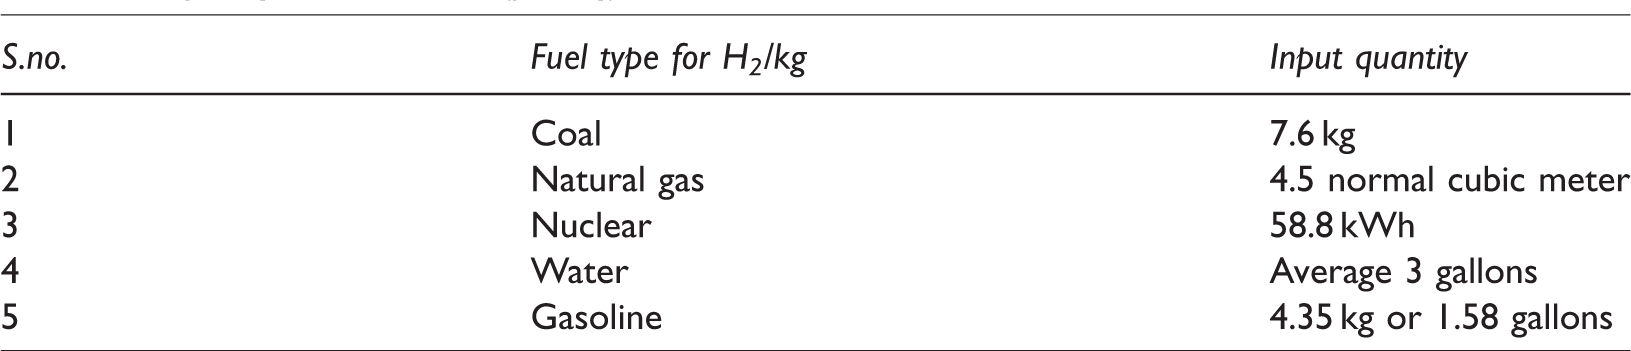
After analyzing the hydrogen production, the cost of power production will be determined to compare it will existing power generation costs. It is worth to mention that the 1 kg (33.6 kWh) of Hydrogen holds as much energy as 2.1 kg of natural gas or 2.8 kg of oil with 60% efficiency (Witkowski et al., 2017).
Hydrogen conversion rate from different fuels
The hydrogen conversion rate against the different fuels can be considered for assessment, as shown in Table 8. These values only are considered for input as raw material, and the other costs as described in the above sections be accounted for to compute per kg cost of Hydrogen (Bala et al., 2020; Kang et al., 2014).
Hydrogen conversion (per kg) from different resources.
PEMFC fuel transportation cost analysis
The integral part of PEMFC fuel usage is its transportation and storage, which is an extreme task due to its high flammability. Thus, the central corridors for the production of Hydrogen are advocated (Witkowski et al., 2017). The supply of hydrogen is required to be made at site for power generation that necessitates the dedicated hydrogen transmission infrastructure to ensure uninterrupted supply with due care of safety standards. The cost determining factors are mainly depending on the hydrogen transportation mechanism that pivots on the production capacity and its itinerant distance. There are a number of options to carry the hydrogen production from generation to consumption end, as per the requirement, whether it is for vehicle fueling, industrial consumption, or for the generation of power (Khzouz et al., 2020). The broadly workable options for power generation are mentioned, as below, which will be elaborated sequentially.
Hydrogen shipped via tube trailers Hydrogen shipped via cryogenic liquid trucks Hydrogen transmitted via gas pipelines
The stated supply mechanisms are used as pre-requisite for power generation at micro-grids, and afterward, the cost analysis of the same will be carried out, and the least cost option will be evaluated accordingly.
Tube trailers
The tube trailers are the semi-trucks that carry gaseous compressed Hydrogen. The tube trailers comprise 10, 20 long cylinders mounted on the bed of the trailer, which holds the gas pressure within defined limits, i.e., 160–400 (2400–6000 psi). The carrying capacity of the tube trailer is comparatively low; however, it can be used for small-scale production (Vogt et al., 2019).
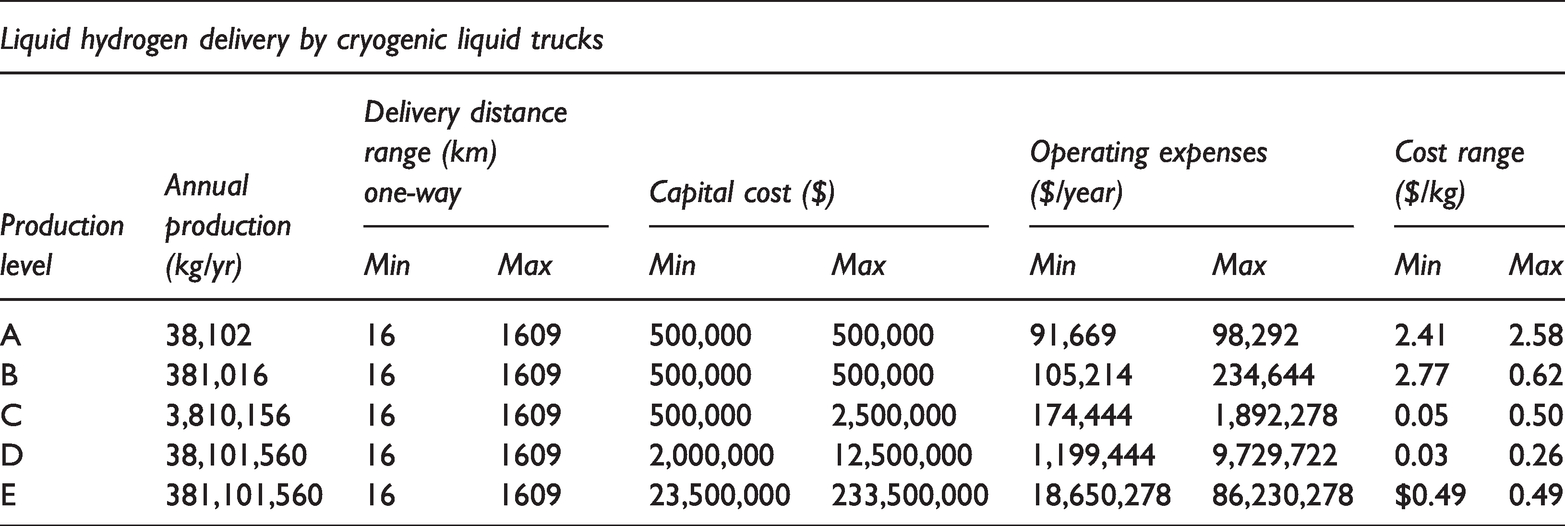
Cryogenic liquid trucks
The cryogenic liquid trucks are intended to carry liquefied loads by roads in a large quantity to long distances. Seemingly, the cost and energy requirements are higher for liquefaction, but in comparison, it also carries 10 times more liquid hydrogen than tube trailers (compressed gas trucks). Due to its voluminous density, round trips, and the number of trucks reduced. Though the cost of cryogenic liquid trucks is higher, the same is compensated through per unit cost, which is lower as compared to tube trailers (Vogt et al., 2019).
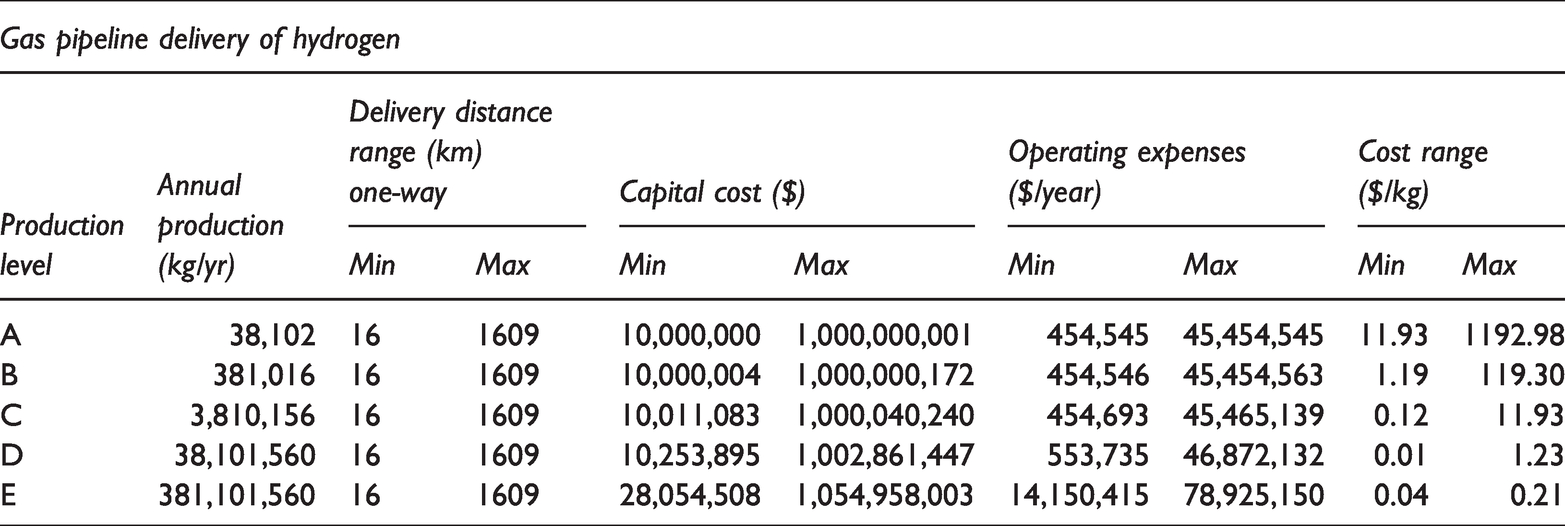
Gas pipelines
A widely and commercially adopted solution for long-distance and bulk transmission of Hydrogen is a gas pipeline. It covers the long distances through spread pipelines and connects the hydrogen production and energy generation sites. The hydrogen delivery via pipelines cost mainly depends on the capacity of compression, storing facility, installation cost, and pipe diameter. However, the cost may adversely be affected by the right of way (ROW) issues (Archer et al., 2016).
Cost evaluation
The costs are computed and evaluated by Wade (1998) at different annual production levels with a short-term and long-term distance scenario. The cost estimation covers the capital expenditure (CAPEX) and operating expenditure (OPEX) for both scenarios along-with cost ($/kg). The same will be discussed in the forthcoming paragraphs. The other researchers (Reddi et al., 2018; Shayegan et al., 2006) have also been deliberated for computing the average costs.
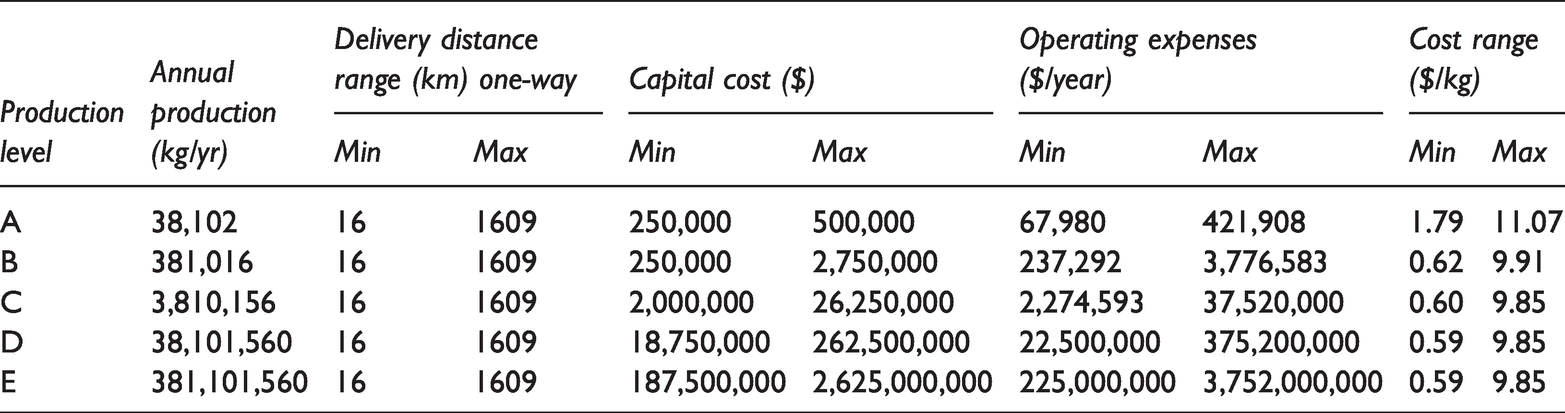
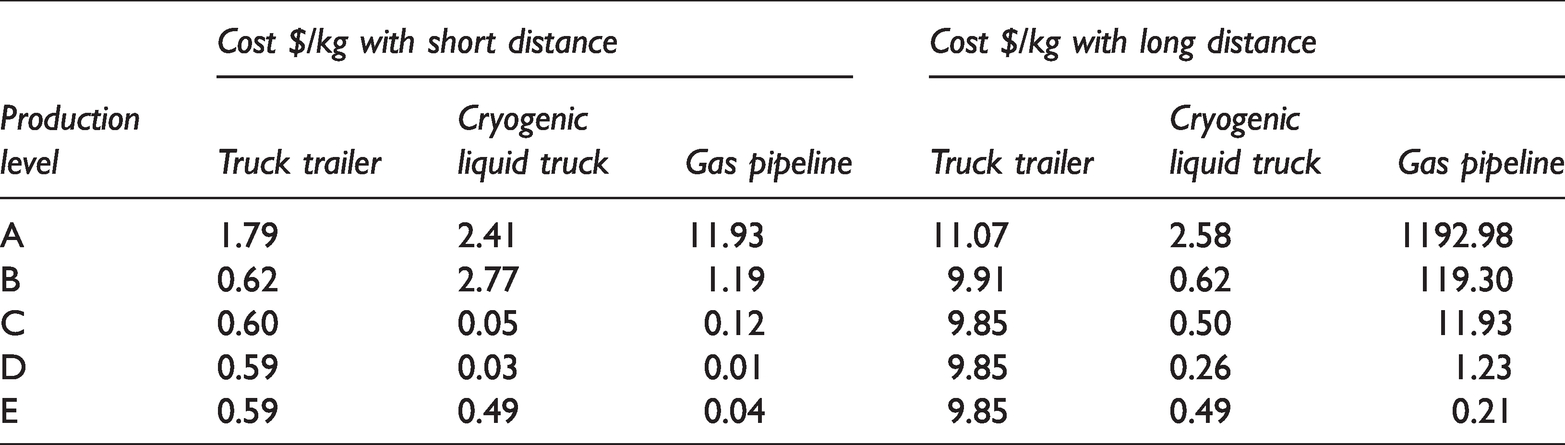
The cost analysis concerning truck trailer transmission is limited in nature as it has the low carrying capacity and shot distance as depicted in Table 9, although it has a nominal cost of $0.59/kg with short distance but, if the trailer capacity opts for maximum production with long-distance, the cost will increase dramatically to $9.85/kg.
Cost evaluation for hydrogen gas transmission via truck trailer.
Consequently, to cover the long-distance, the other options need to be evaluated. Firstly, the cryogenic liquid truck choice will be considered as shown in Table 10 wherein at maximum production capacity, the cost $0.49/kg is same for both short and long-distance and seems a feasible option. However, before evaluating the pipeline transmission cost, it would be too early to select this option.
Cost evaluation for hydrogen gas transmission via cryogenic liquid trucks.
Secondly, the pipeline option assessed in Table 11 that shows that the cost of transmission at low production is extremely high at $1,192.98/kg due to low production capacity and high infrastructure cost. The cost ($/kg) decreases with the increase in production either distance is short or long and reached to $0.04/kg and $0.21/kg, respectively.
Cost evaluation for hydrogen gas transmission via gas pipelines.
The CAPEX and OPEX relationship has been exhibited in Figures 14 (for a short distance) and 15 (for long distance), wherein it can be observed that the truck trailer has the highest CAPEX and OPEX relatively to cryogenic liquid truck and gas pipeline has the low cost. Figure 15 is also showing the same state under both expenditure categories except the gas pipeline CAPEX that has substantially increased as compared to other mechanisms.
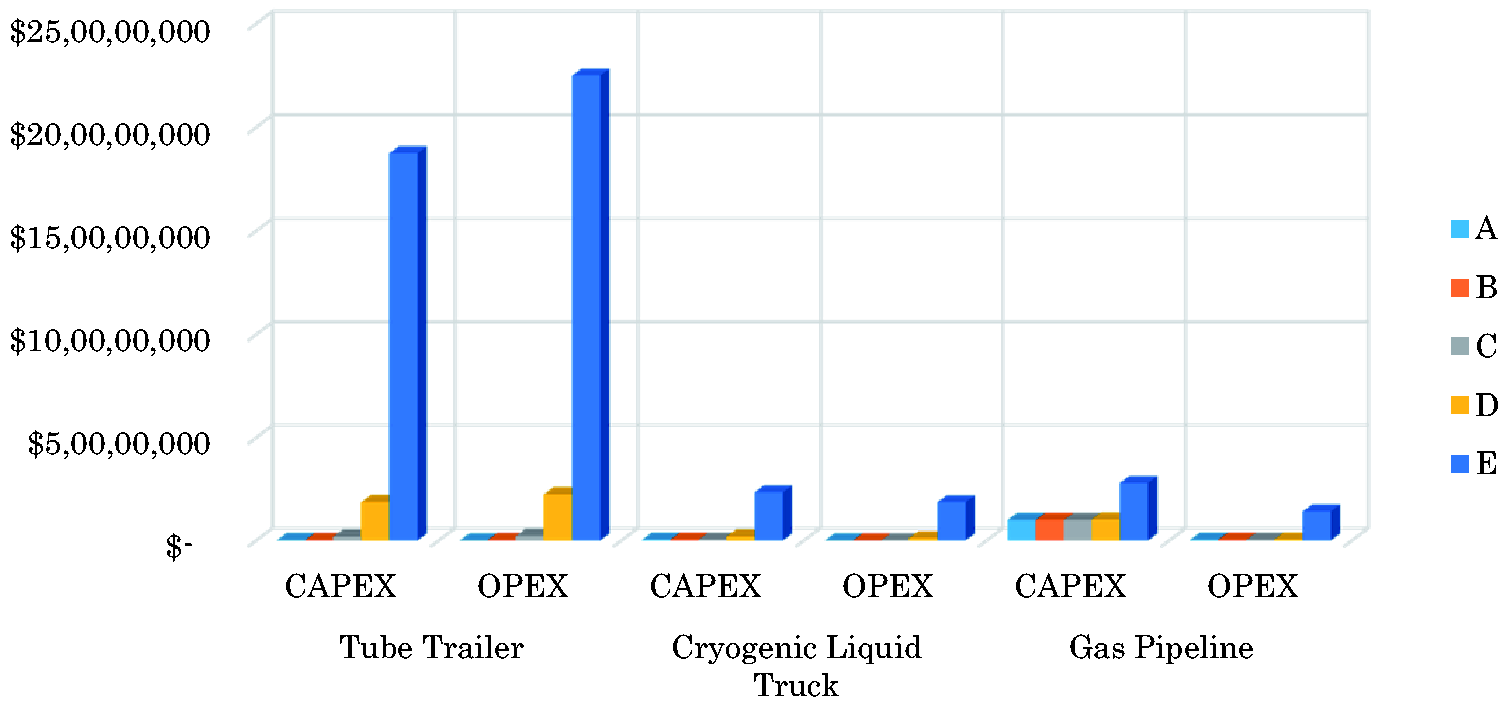
CAPEX and OPEX at different production levels with short distance.
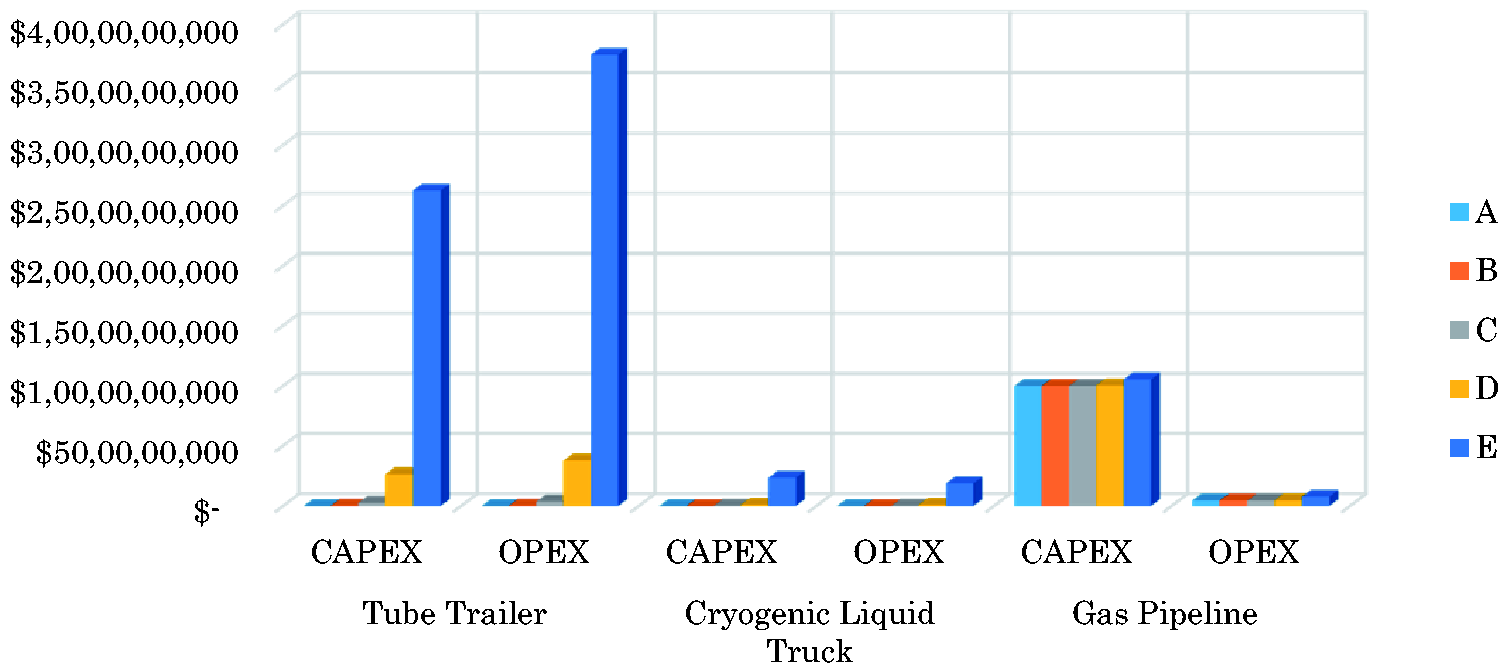
CAPEX and OPEX at different production levels with long distance.
However, merely evaluating the CAPEX and OPEX in total will be subjective and does not provide a conclusive opinion; therefore, it is required to be assessed as per unit cost i.e., $/kg. For that reason, the per-unit cost is gauged, and recommendations will be made accordingly. At a certain point, the costs start to increase, and that point indicates the optimal utilization of the particular transportation method. As the power generation required an annually high volume of hydrogen intake, thus the low production i.e., level A is insignificant and only be considered for small-scale supply. The assessment has been made under minimum and maximum distance scenarios. Figure 16 shows the cost ($/kg) at different production levels with a short distance. At production Levels A and B with short distance, the cost of the truck trailer is low. As the production level increases at Level-C the cost of cryogenic liquid truck and gas pipeline start to decrease and signifying the cryogenic liquid truck an appropriate option for that particular level. At maximum production Level E with the low distance, the gas pipeline method is most cost-effective.
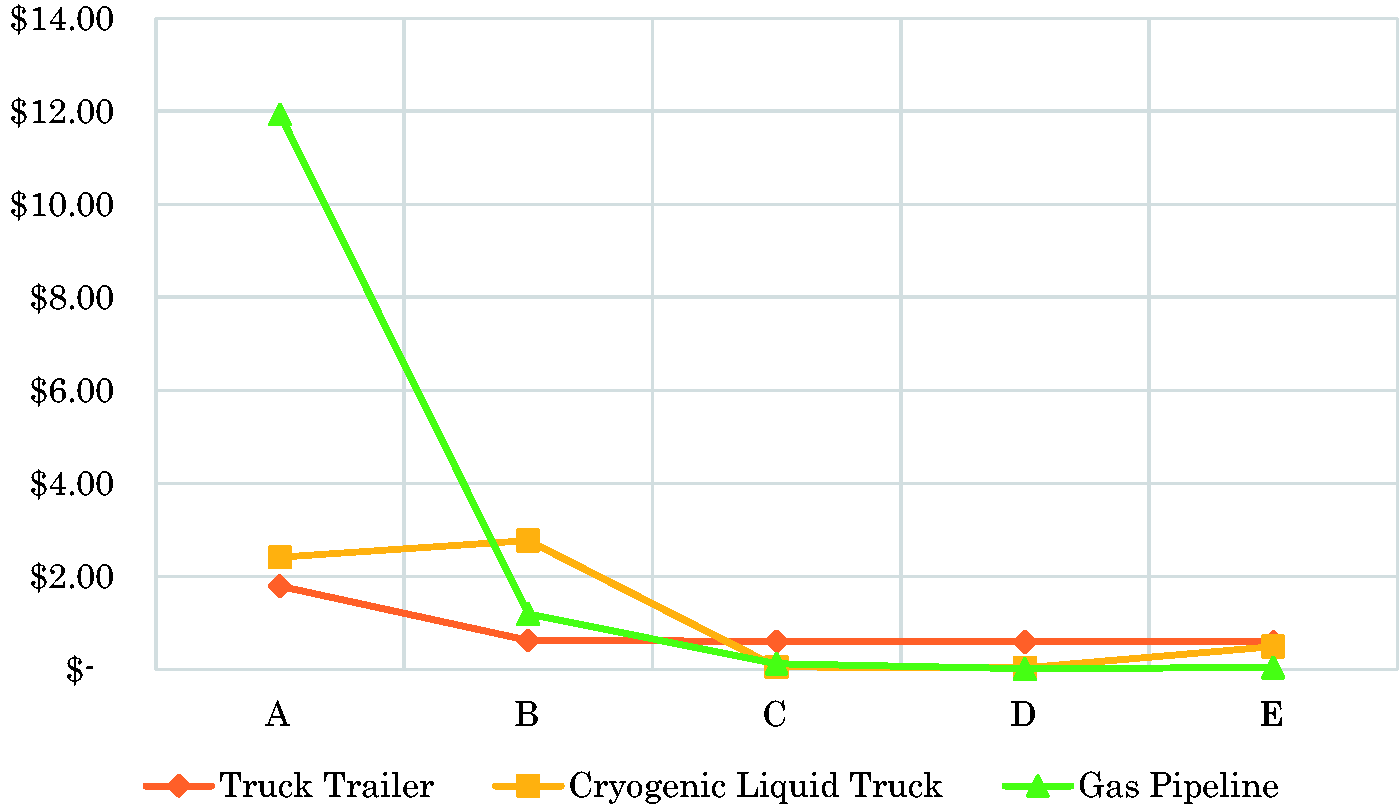
Cost of hydrogen transportation ($/kg) at different production pevels with short distance.
Moreover, while evaluating the different production levels at long-distance, the Levels A and B excluded being the outlier and depicted in Figure 17, which specifies that at production Level-C, the cost of the pipeline is at the higher side, and the trailer truck cost is close to it. However, the cost of the cryogenic liquid truck is at a lower level and marks it feasible for that operating point. After taking into account the increase in production capacity at Level D, the cost of the pipeline exponentially decrease and spot near to the cryogenic liquid truck. In contrast, the cost of the trailer truck remained constant for all levels. Moving to Level E, the cost pipeline transmission is the least cost option, and the cryogenic liquid truck is marginally elevated; hence, at the long-distance with high production, the gas pipeline may be suggested for point-to-point transmission (Fan et al., 2019; Hyunjae et al., 2019).
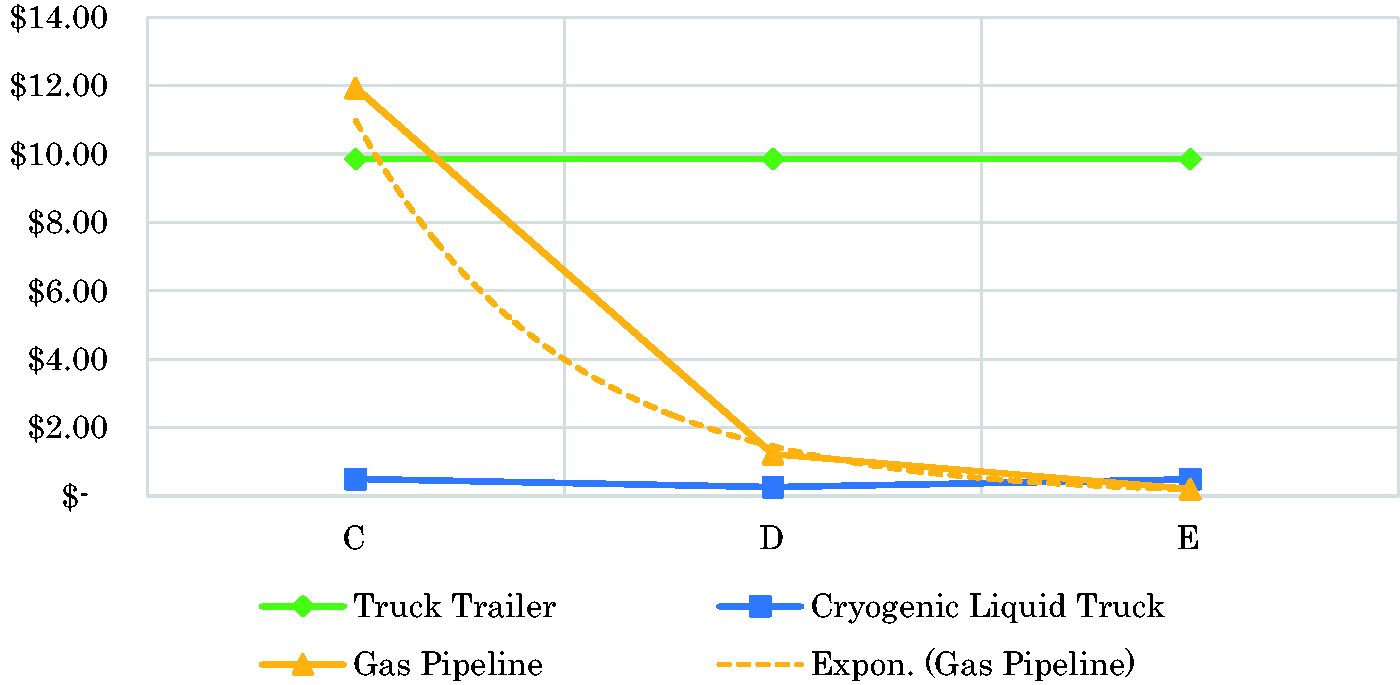
Cost of hydrogen transportation ($/kg) at different production levels with long distance.
Thus, the above evaluation shows that the transmission mechanism of the Hydrogen is greatly dependable on the two factors firstly, the distance that is required to cover the supply area, secondly, the per day production capacity as per demand. Figure 18 is showing the matrix for guiding the mechanism with a relationship of distance coverage and production capacity. The less coverage area and low production capacity will set the supply channel through tube trailers, and as the distance and capacity will increase, then options will start moving from cryogenic liquid trucks to pipelines (Fan et al., 2019).
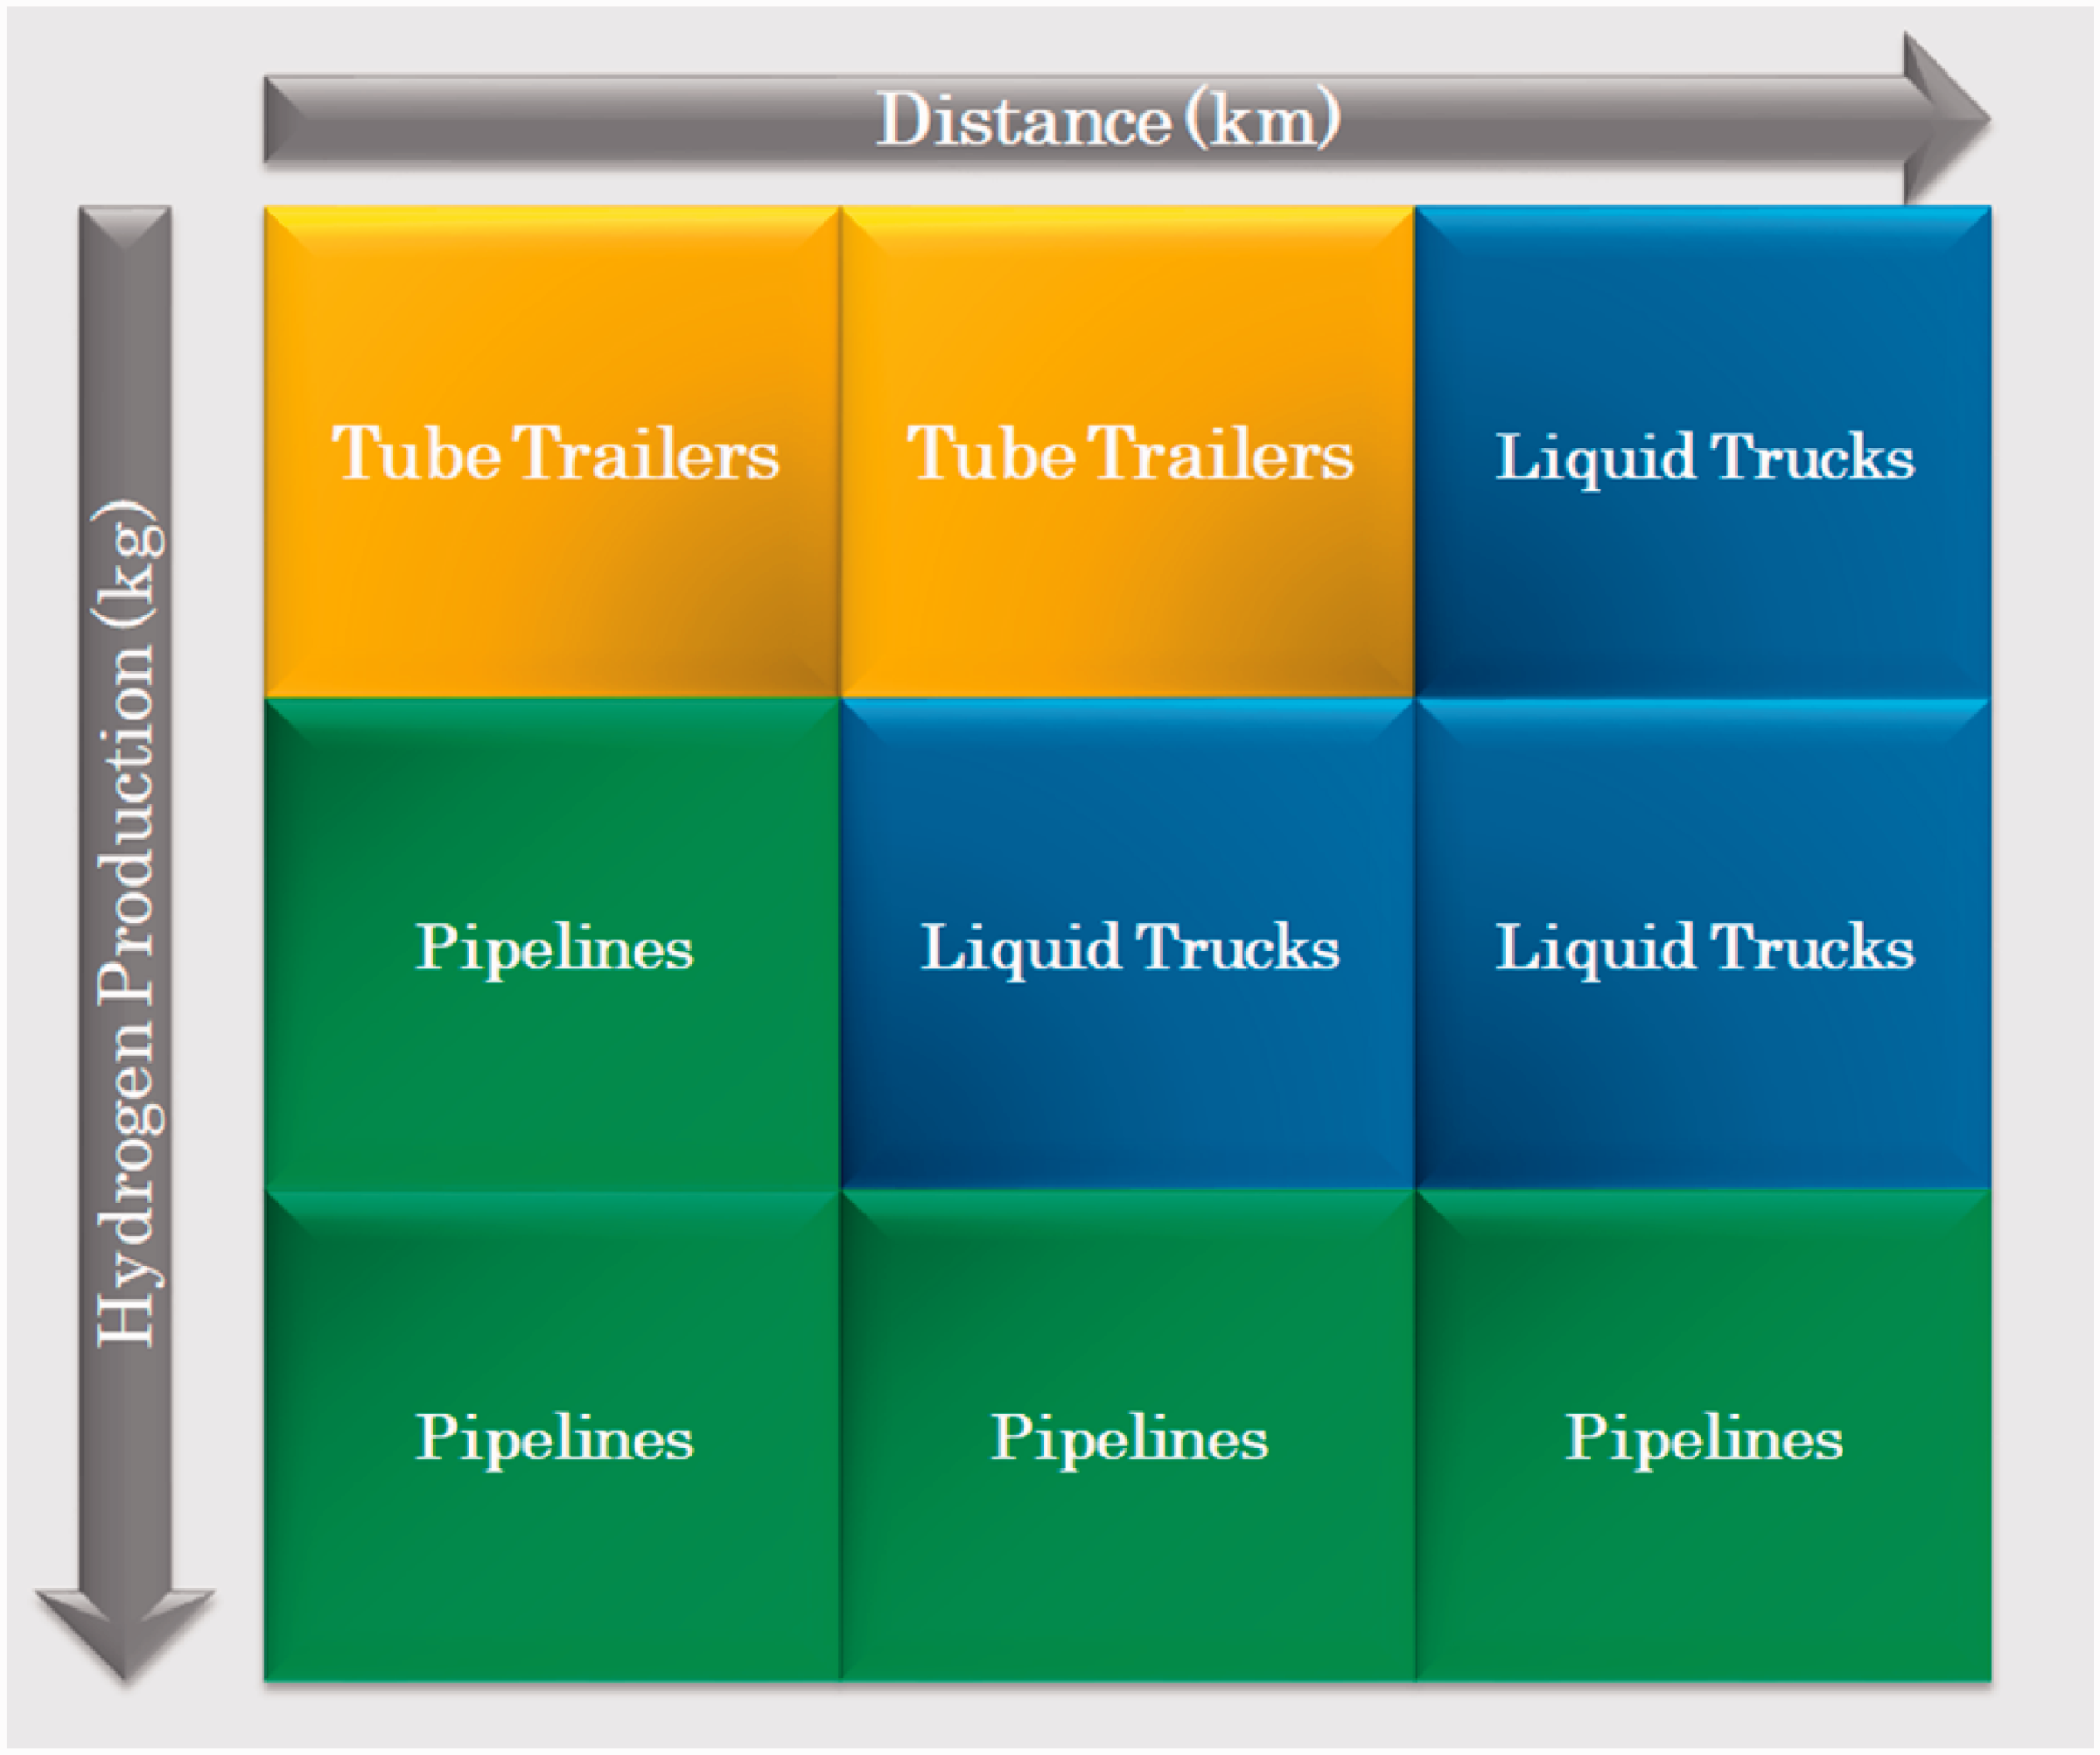
Hydrogen transmission matrix about distance and production.
The cost ($/kg) as discussed in the foregoing paragraphs (Abbas et al., 2020) duly conform with the (Hyunjae et al., 2019) hydrogen transmission matrix when we highlight the lowest cost option in the given category as shown in the Table 12 accordingly, the same may be considered for computing hydrogen transportation cost with.
Cost evaluation for hydrogen gas transmission via gas pipelines.
Amalgamation of all options
In the period of ramp-up, to cater to the demand, all the delivery mechanisms can be employed based on “mix and match” in a probable scenario. Tube trailers are haul for smaller quantities and suitable for the preliminary period. With the passage of growing demand, the cryogenic tanker trucks can be served longer areas located distant from the central generation plant. Subsequently, further production of hydrogen transmission can be made through hydrogen pipelines and connect the plants to selected power generation sites (Vogt et al., 2019).
Levelized cost of electricity generation (LCOE)
To analyze the generation cost of different sources, the Levelized costs of generating electricity (LCOE) approach is considered. LCOE is a helpful tool to compare the costs for different resources and technologies. Firstly, the investment costs are the key factor for power generation, which varies due to technology differences. Secondly, “Overnight cost” is also incorporated in power investments, which is the construction cost of a project assuming that no interest during construction (IDC) has been incurred, and the project was completed instantaneously. The LCOE is essential to evaluate an investment in the competitive generation markets. On the contrary, the traditional market functions on monopolistic methodology and arbitrarily determined the prices to cover-up the costs.
The prices are to be determined by the marginal cost of the latest employed technology. The (Romeri, 2020) and Organization for Economic Co-operation and Development (OECD)/International Energy Agency (IEA) – Nuclear Energy Agency (NEA) (OECD/IEA-NEA (IEA)) have given the Levelized electricity cost against the different sources and technologies, as shown in Figure 19. The H2FC Powertrain is a cost-competitive option, suitable for stationary power generation applications. By operating the production at a high and conceiving it as power generation plants, the economies of scales can be achieved. Therefore, the LCOE will be competitive when compared with other current technologies (Davison et al., 2009; Mazzocchi et al., 2007).
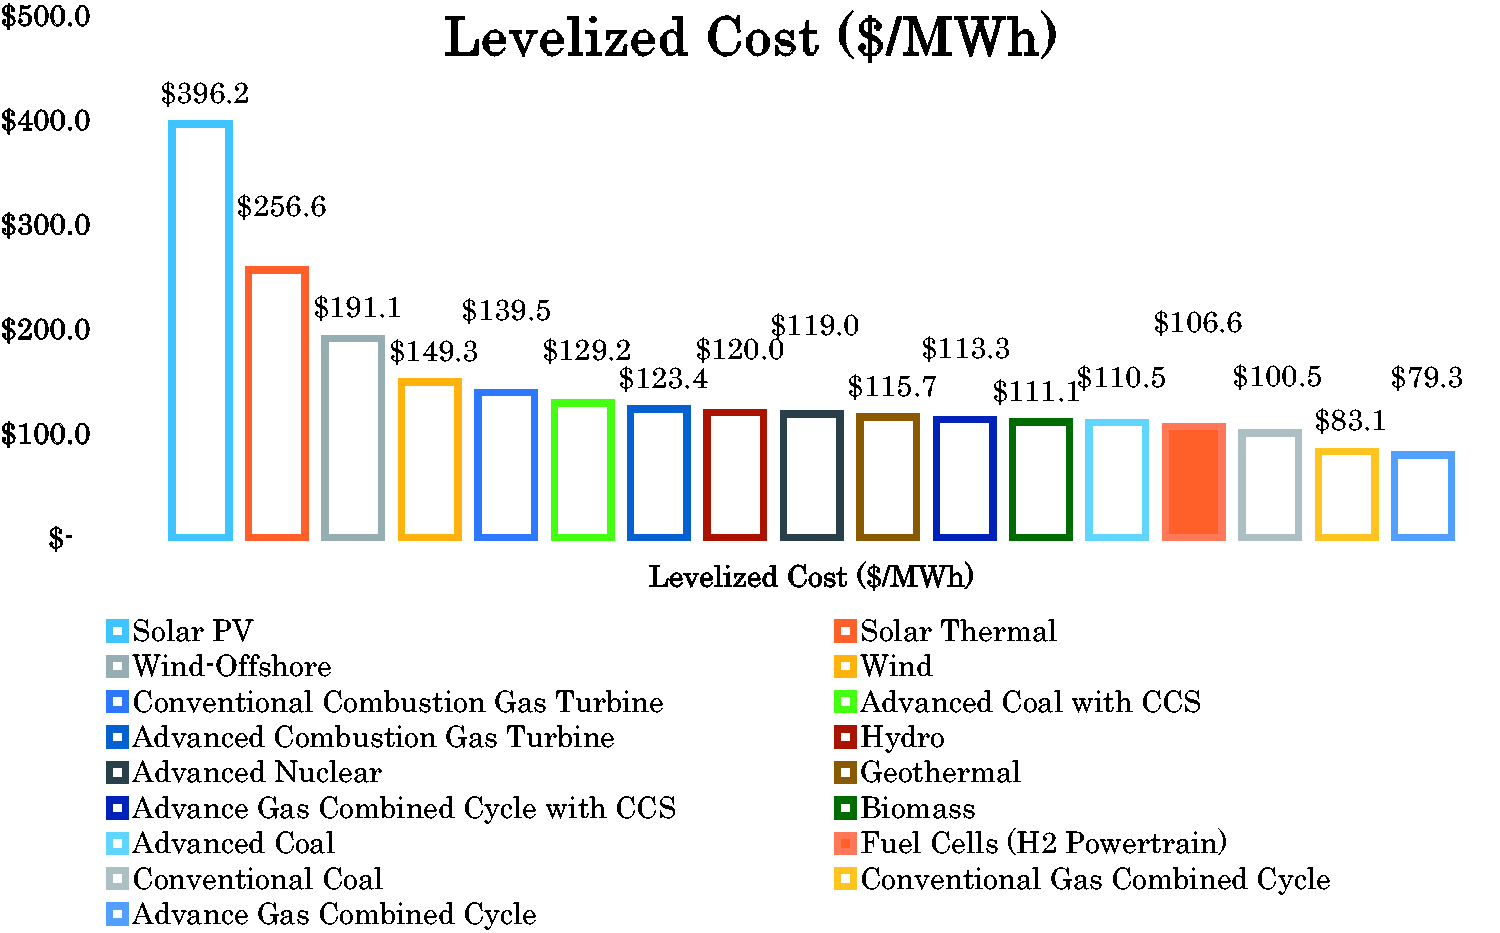
LCOE against the different resources and technologies.
Coal to hydrogen conversion margin in electricity generation capacity of SA
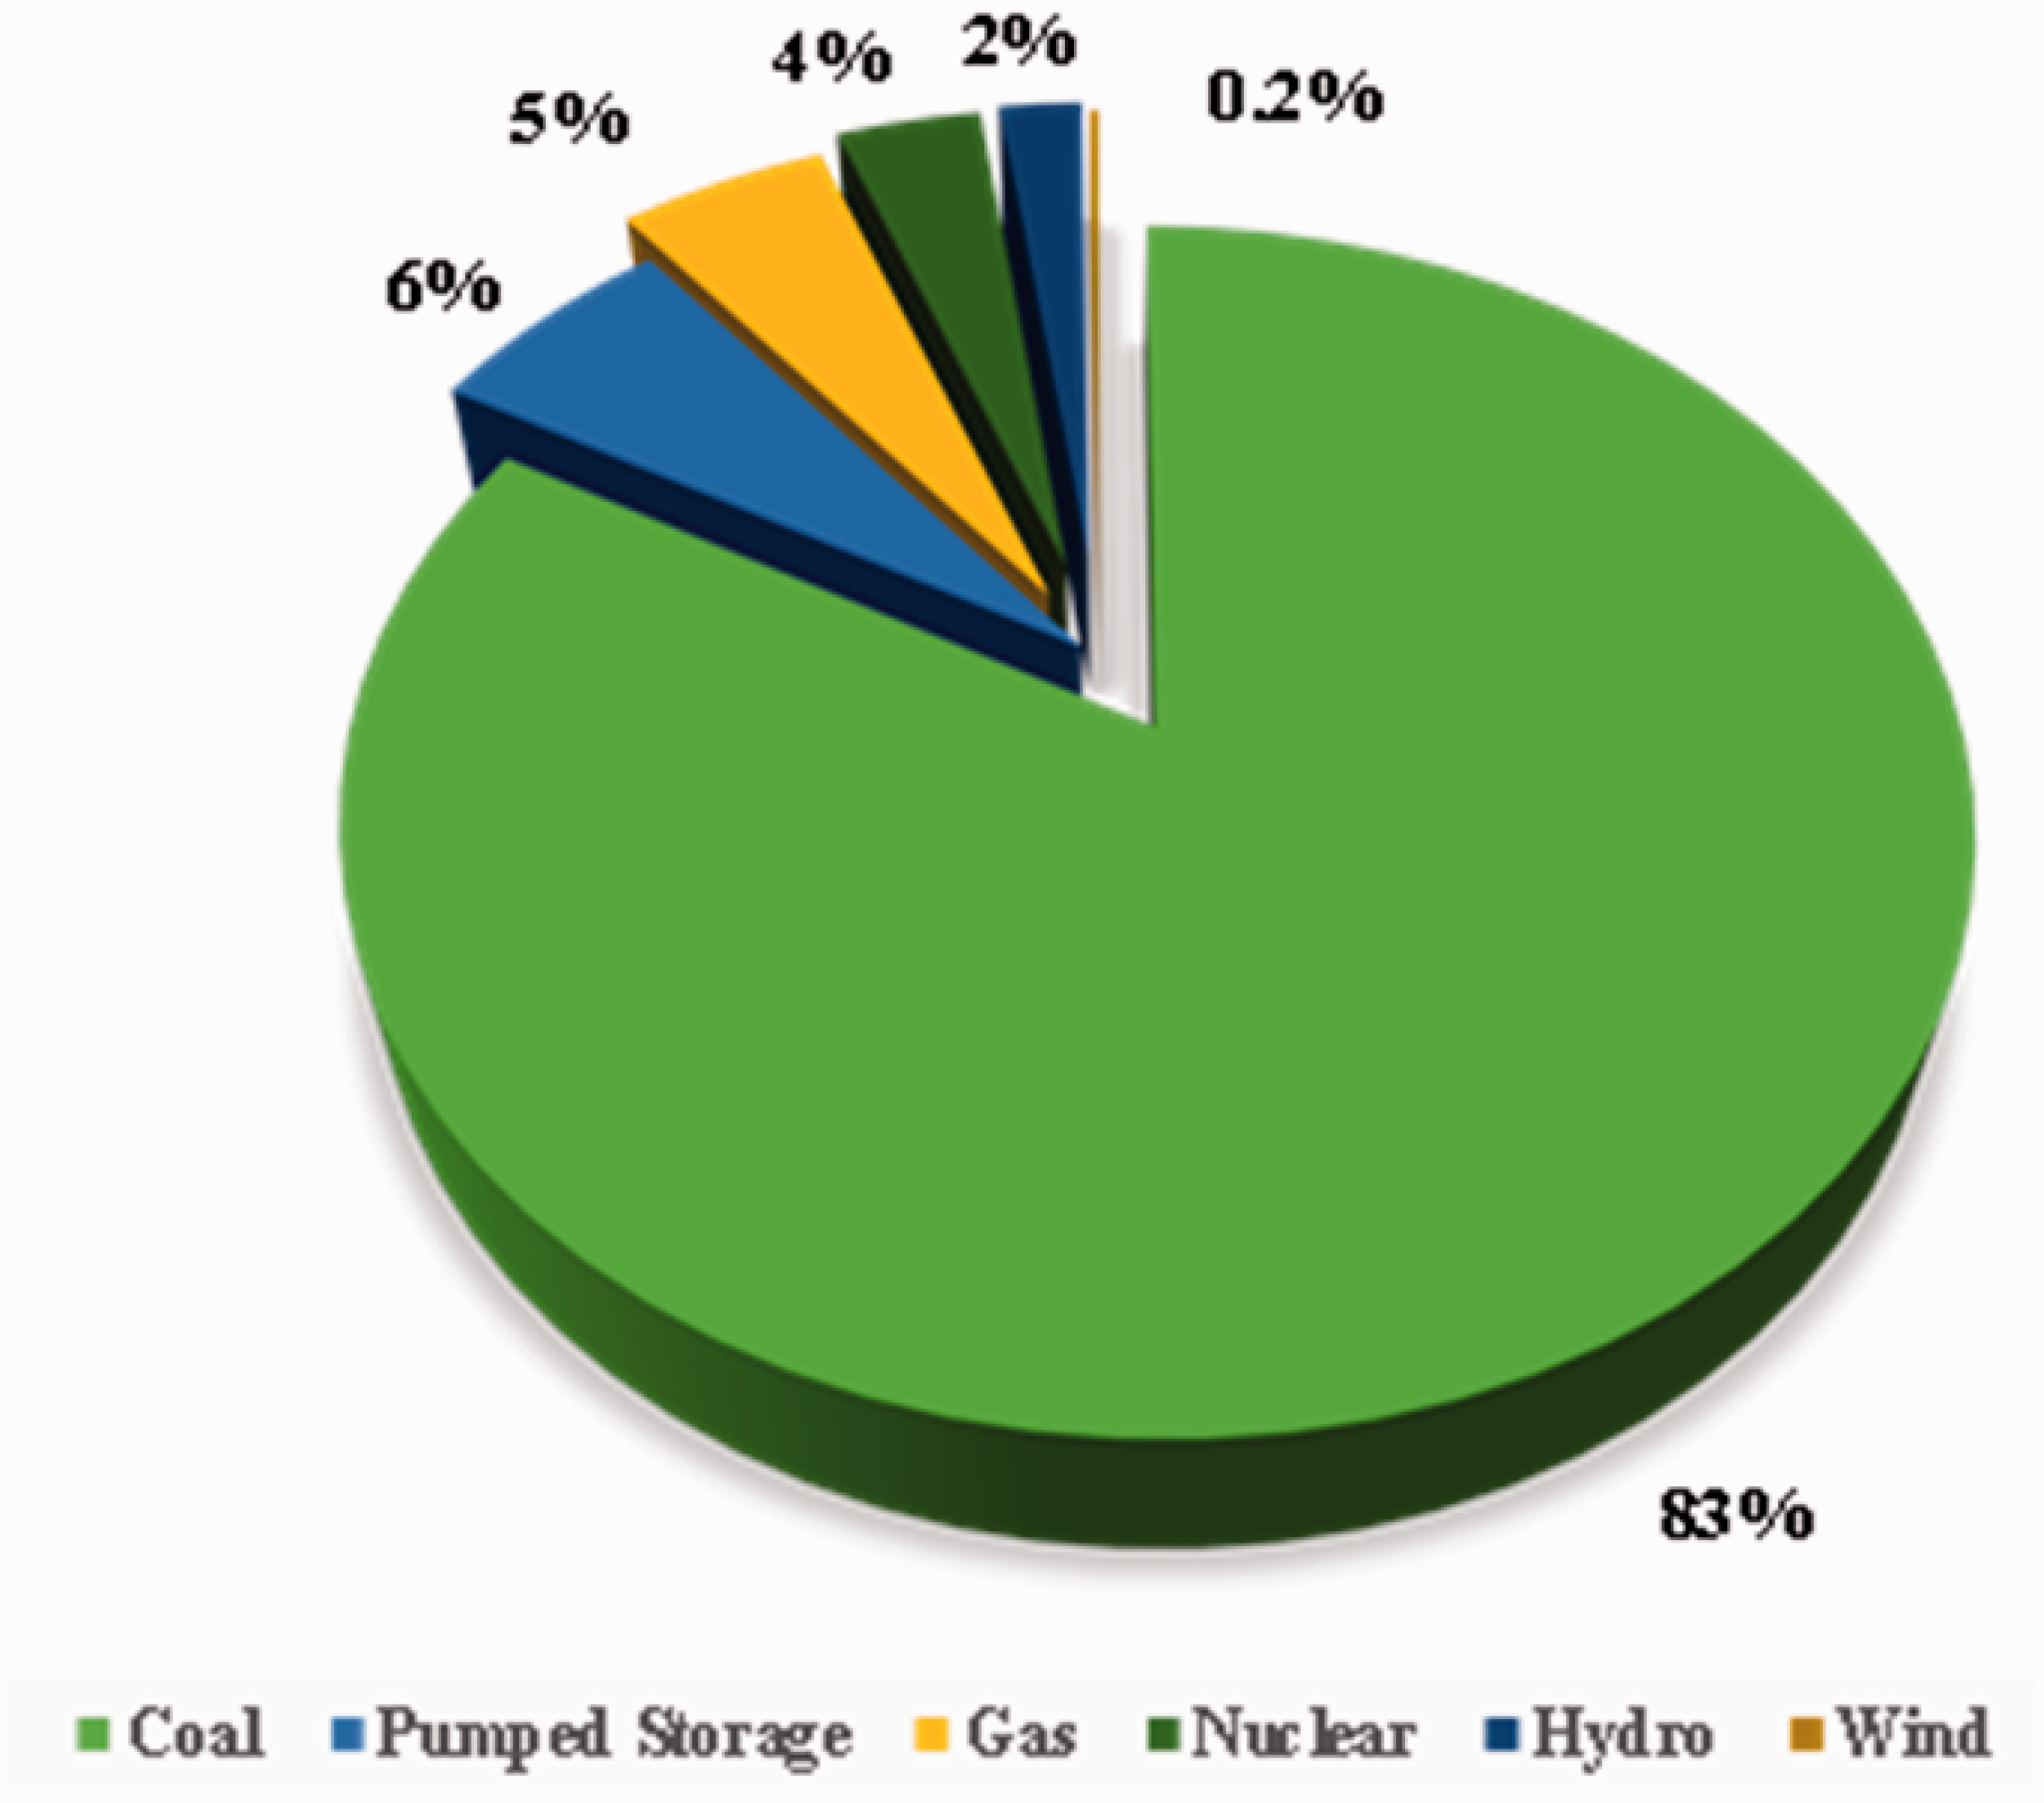
The Eskom has a maximum 48 GW generation capacity and substantially hinge on coal-fired power stations for power generation with 83% capacity and then pumped storage, gas, and nuclear with 6%, 5%, and 4%, respectively. The other resources are insignificant. The composition has shown in Figure 20 (Meyer and Sunjka, 2019; Villiers, 2017).
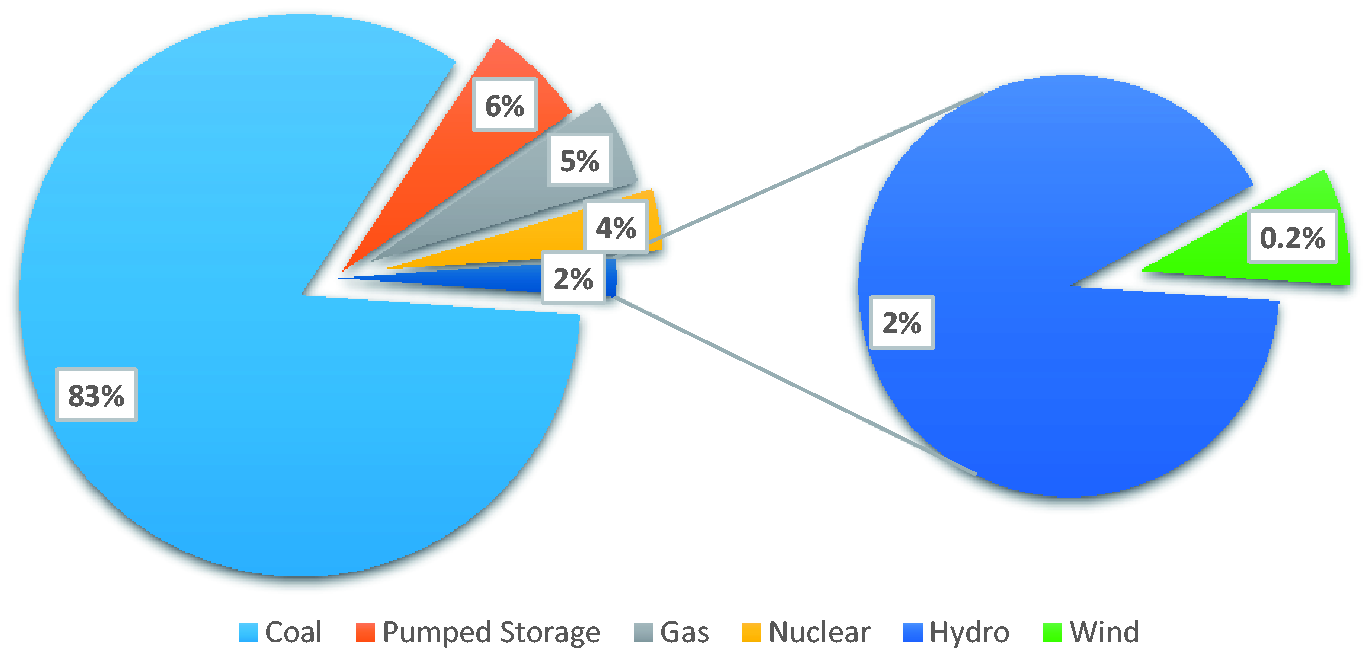
SA generation capacity composition.
Pumped storage is not a generation capacity – generally, the pumped storage is filled from the coal-fired power stations at night and used in the morning and evening peaks. It should, therefore, be excluded. Gas is also not accurate – they could be gas-powered by are currently fed with diesel as peaking plants.
By opting, the least-cost option of hydrogen-based power generation, i.e., C.G. the 83% of the major area in generation capacity, can be targeted for carbon emission reduction and to develop hydrogen-economy. Further, the addition of future coal power generation, as mentioned in Figure 2 through IPPs of 19,400 MW by 2030 May opportune and planned investment, shifted towards hydrogen-based power generation.
Carbon emission cost
The carbon (CO2) emission costs $30/ton, which is incorporated in fossil fuel for power generation cost (OECD/IEA–NEA (IEA)). The benefit of hydrogen power generation can also be calculated by identifying the saving in carbon emission and times with the emission cost.
Power generation is the major source of carbon emissions, and in order to counter the impact of carbon emission, South Africa has planned to impose a carbon emission tax to balance the socio-economic growth. Initially, the electricity prices inclusive of the carbon tax may get high, but after phasing-out, the fossil fuel-based power plants and adding renewable energy resources in the energy mix, the cost will be decreased. However, the tax imposition may adversely affect economic growth in terms of low GDP. Therefore, it must be balanced out by creating equilibrium between tax rates and GDP growth rates (Alton et al., 2014).
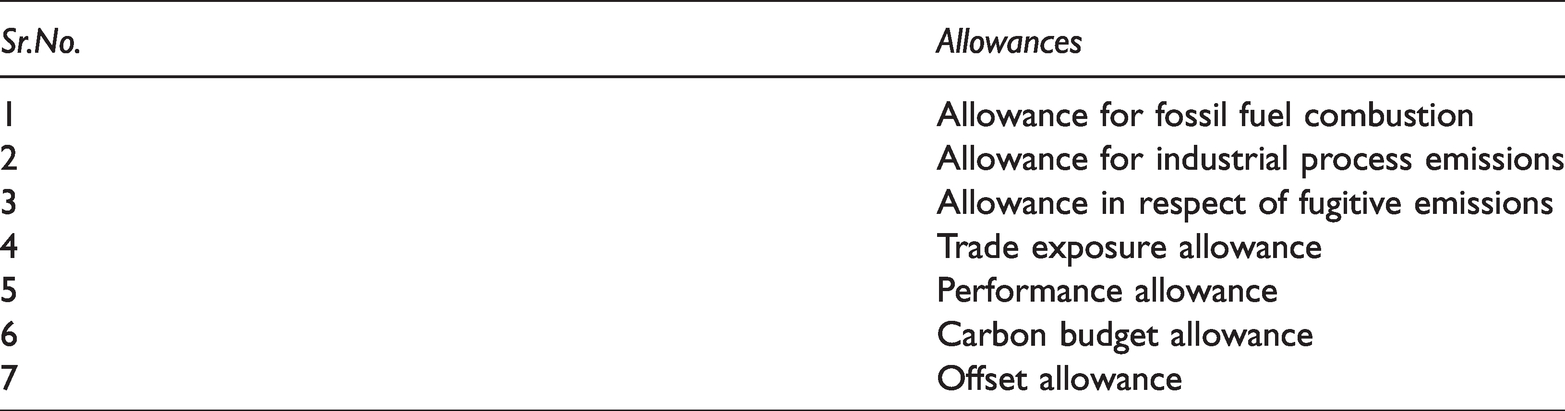
In the recent past, South Africa has introduced the carbon tax amounting to R120/ton CO2 equivalent to around $8 until 2022, and later the rate will be increased in accordance with the consumer price index (CPI). On one side, SA has imposed tax, and on the other side, some allowances are also given, as shown in Table 13, to encourage the reduction in carbon emission and to promote participation in this process. The allowances have been divided into different categories to attain the maximum benefit (Zhidong et al., 2021; Pollet et al., 2015).
Allowances offered by the SA government to reduce greenhouse gases emission.
Other economic benefits
Funding from international donors can be achieved due to environment-friendly features. Clean energy can be generated through indigenous coal resources and reduced imports, thus improve energy security through a diversified energy mix Minimized dependency on other fossil fuel power generation options. New business opportunity lead to economic growth No carbon tax. Creation of new jobs. Indirect cost savings are achieved through a protected environment e.g. health.
Future work
For the lifecycle cost assessment (LCA) different variables a sensitivity analysis required to be conducted in different stages of H2 production, logistics and electricity production (Verma and Kumar, 2015). There is need to identify the optimal variable points such as raw material pricing, CAPEX, OPEX and taxation where all these areas will provide the lowest possible cost without compromising the H2 output, electricity generation and reducing carbon emission (Li and Cheng, 2020). The assessment will provide feasibility on different level of pricing corresponding with the end unit cost.
Conclusion
This paper deliberates PEMFC application through coal gasification along with cost-benefit analysis. The detailed cost-benefit analysis carried out for various aspects of coal gasification and hydrogen based fuel cell power generation revealed that the coal gasification (G.S.) is an economical selection for H2 production. The analysis further disclosed that the electricity production cost is competitive amongst the other comparable resources. Therefore, in the future, the hydrogen from coal gasification and hydrogen-based electricity generation will be the backbone of the hydrogen economy. Similarly, 83% of the main area in generating capacity can be aimed at reducing carbon emissions and developing hydrogen economy in the country. The economic competitiveness and environment-friendly features offered by hydrogen-based economy can appeal foreign funding from international donors and will diminish dependency on other fossil fuel based power generation alternatives in the country. The immediate advantage can be fostered by substituting outdated power stations with new hydrogen based power plants and shifting planned investments towards hydrogen-based power generation. The gradually escalating taxation impact with respect to per ton CO2 generation and allowances on carbon reduction encourage the economy to ponder on reduction/capture of CO2 techniques. Hence hydrogen based power generation with a focus on carbon capture/reduction will foster cleaner, eco-friendly energy and cost-effective economy of the country.
Footnotes
Declaration of conflicting interests
The author(s) declared no potential conflicts of interest with respect to the research, authorship, and/or publication of this article.
Funding
The author(s) disclosed the following financial support for the research, authorship, and publication of this article: The research is funded by Africa New Energies Limited, United Kingdom (Funding Code ANE0053).