
Abstract
As an important type of unconventional hydrocarbon, tight sandstone oil has great present and future resource potential. Reservoir quality evaluation is the basis of tight sandstone oil development. A comprehensive evaluation approach based on the gray correlation algorithm is established to effectively assess tight sandstone reservoir quality. Seven tight sandstone samples from the Chang 6 reservoir in the W area of the AS oilfield in the Ordos Basin are employed. First, the petrological and physical characteristics of the study area reservoir are briefly discussed through thin section observations, electron microscopy analysis, core physical property tests, and whole-rock and clay mineral content experiments. Second, the pore type, throat type and pore and throat combination characteristics are described from casting thin sections and scanning electron microscopy. Third, high-pressure mercury injection and nitrogen adsorption experiments are optimized to evaluate the characteristic parameters of pore throat distribution, micro- and nanopore throat frequency, permeability contribution and volume continuous distribution characteristics to quantitatively characterize the reservoir micro- and nanopores and throats. Then, the effective pore throat frequency specific gravity parameter of movable oil and the irreducible oil pore throat volume specific gravity parameter are introduced and combined with the reservoir physical properties, multipoint Brunauer-Emmett-Teller (BET) specific surface area, displacement pressure, maximum mercury saturation and mercury withdrawal efficiency parameters as the basic parameters for evaluation of tight sandstone reservoir quality. Finally, the weight coefficient of each parameter is calculated by the gray correlation method, and a reservoir comprehensive evaluation indicator (RCEI) is designed. The results show that the study area is dominated by types II and III tight sandstone reservoirs. In addition, the research method in this paper can be further extended to the evaluation of shale gas and other unconventional reservoirs after appropriate modification.
Keywords
Introduction
With continuous progress in oil and gas exploration and development theory, domestic and international oil and gas exploration and development have gradually developed from conventional to unconventional resources (Aguilera, 2018; Guo et al., 2018; Liu et al., 2019a; Stephen et al., 2020; Wang et al., 2015). Meanwhile, the world’s oil and gas exploration and development turn to deeper, more complex and more challenging unconventional oil and gas fields with more complex enhanced oil and gas recovery approaches than those applied to conventional sources (Liu et al., 2019b, 2020; Wei et al., 2020; Zhang et al., 2020; Zhong et al., 2020).
At present, China's oil and gas exploration has entered a stage in which both conventional and unconventional oil and gas resources are equally important, and unconventional oil and gas play an increasingly important role (Jia et al., 2012; Zhao et al., 2013; Zou, 2013). Tight sandstone oil and gas, as important elements of unconventional oil and gas, have great resource potential and are the focus of domestic oil and gas research in China (Liu et al., 2009; Wang, 2014; Wang et al., 2016). Both the 13th five-year plan of China's national energy development and the energy production and consumption revolution strategy (2016–2030) take unconventional oil and gas exploration and development and related technology research as the focus in the oil and gas field.
Reservoir quality evaluation is the basis of tight sandstone oil development. Due to the influence of sedimentation and diagenesis, tight sandstone reservoirs have poor physical properties (Guo et al., 2021), complex pore throat structures (Yang et al., 2020), strong reservoir heterogeneity (Ding et al., 2014; Dou et al., 2021; Kong et al., 2020; Lian et al., 2010; Liu et al., 2018), and small pore throat radii (Nelson, 2009). Detailed characterization of tight sandstone reservoirs is the key to unconventional oil and gas resource exploration and development (Cao et al., 2014). The micro- and nanopore throat structure of a reservoir refers to the geometry, size, distribution and connectivity of pores and throats in the reservoir (Brue, 2007). The micro- and nanopore throat characteristics play decisive roles in the reservoir and seepage capacity of the reservoir (Brent et al., 2008). The micro- and nanopore throat structures of tight sandstone reservoirs ultimately determine the differential distribution of productivity in tight reservoirs (Jacky, 2010). Therefore, studying micro- and nanopore throat structure characteristics of tight sandstone reservoirs is the basis for further understanding tight reservoirs and the key issue to improve the development efficiency of tight oil and gas (Yang and Wang, 2014).
Tight oil exploration has made a series of new discoveries and breakthroughs in the Ordos Basin (Zhou et al., 2020), Sichuan Basin (Guo et al., 2018), Songliao Basin (Xi et al., 2018), Junggar Basin, Tarim Basin (Wei et al., 2020), etc., with rapid growth of reserves and production (Zheng et al., 2017). The Ordos Basin is one of the main production areas of tight oil and gas in China. Tight sandstone reservoirs are relatively developed in the Upper Triassic Yanchang Formation, and oil and gas resources are abundant (Li et al., 2016; Zheng et al., 2017). It is of great theoretical and practical significance to strengthen and enhance understanding of the micro- and nanopore throat structure characteristics of reservoirs and to clarify the continuous distribution characteristics of pore throat structures, which provide a theoretical basis for pore throat structure characterization of tight sandstone reservoirs and oil and gas exploration and development (Bai et al., 2013). This research can provide a chart basis for the quality evaluation of tight sandstone reservoirs and play a guiding role in the exploration and development of tight sandstone oil and gas resources in the Upper Triassic Yanchang Formation in the Ordos Basin.
Reservoir quality is related to reservoir productivity. Accurate reservoir evaluation and classification can provide a theoretical basis for the exploration and development of favorable areas in tight sandstone reservoirs. Physical properties are generally considered the preferred parameters for reservoir research and classification evaluation (Zhong et al., 2017). However, due to the complexity of pore throats, it is difficult to accurately evaluate tight sandstone reservoirs by only physical properties. Development practice shows that the final recovery degrees of reservoirs with similar physical property parameters are also different. Therefore, the quality evaluation of tight sandstone reservoirs needs a more comprehensive evaluation index and accurate and a feasible evaluation method. The current standard for the study area reservoir type mainly considers the porosity and permeability. Type I is related to excellent reservoirs with porosities greater than 15% and permeabilities greater than 10 × 10−3 µm2, and Type II is related to good reservoirs with porosities greater than 10% and permeabilities greater than 1 × 10⁻³ µm2. Type III reservoirs have relatively moderate properties with porosities greater than 6% and permeabilities greater than 0.1 × 10⁻³ µm2, and Type IV reservoirs have poor characteristics with porosities less than 6% and permeabilities less than 0.1 × 10⁻³ µm2. Although the main variations are evident, the evaluation parameters are relatively simple. Meanwhile, the classification approach cannot fully represent the micro- and nanopore throats in tight sandstone reservoirs. Additional attributes need to be considered in tight sandstone reservoir evaluations.
The evaluation of tight reservoir quality involves reservoir petrological features such as clastic, interstitial material and rock structure characteristics and reservoir physical features such as porosity and permeability. Tight sandstone reservoirs also includes obtaining the distribution characteristics of micro- and nanopores and throats and other factors through specific experiments. The above factors jointly determine the reservoir quality, which is a typical multifactor comprehensive evaluation problem. Gray system theory encompasses the concept of gray correlation degree analysis for each subsystem (Shi, 2018; Yang, 2018). It is intended to seek the numerical relationship among subsystems (or factors) in the system through certain methods. Therefore, the characteristics of tight sandstone reservoirs can be evaluated by gray correlation analysis.
In this paper, a case study of tight sandstone samples from the Chang 6 reservoir in the W area of the AS oilfield in the northeastern Ordos Basin is presented. The pore throat types were characterized by rock thin sections, casting thin sections and scanning electron microscopy. The pore throat sizes were determined by high-pressure mercury injection and nitrogen adsorption tests. The micro- and nanopore throat frequency, permeability contribution and continuous volume distribution characteristics in the target area were analyzed. Based on the quantitative main evaluation parameters, the gray correlation analysis method is introduced to carry out comprehensive evaluation and classification of reservoirs. The reservoir comprehensive evaluation indicator (RCEI) is introduced to assess reservoir quality. RCEI values greater than 0.7 imply class I reservoirs. RCEI values between 0.5 and 0.7 represent type II reservoirs. RCEI values between 0.3 and 0.5 indicate type III reservoirs, and RCEI values less than 0.3 denote class IV reservoirs. The results show that the study area is dominated by types II and III tight sandstone reservoirs. The method in this paper uses multiple parameters to comprehensively evaluate reservoir quality well and can be extended to quality analyses of other unconventional reservoirs, such as shale oil and shale gas, after slight modification.
Geological background
The Ordos Basin is a sedimentary basin that developed on the paleoplatform of North China. It is located in western North China (Xiao et al., 2005), at approximately 106°20′ - 110°30′ E and 35°00′ - 40°30′ N. The structure is located in the transitional zone between the eastern and western tectonic domains in China. The Jinxi flexure fold belt in the eastern part of the basin is connected with the Lvliang ancient land, the western thrust structural belt is adjacent to the Liupanshan and Yinchuan Basins, the Weibei uplift belt in the south is separated from the Weihe graben, and the Yimeng uplift belt in the north is connected with the Hetao graben. The basin is approximately 800 km long from north to south and 400 km wide from east to west, with a total area of 37 × 104 km2. It is the second largest sedimentary basin in China and the location of the earliest oil and gas exploration in China. Additionally, it is rich in oil and gas resources (Zou, 2013).
The Ordos Basin is a large depression that developed on the North China Craton, with an extensive area and gentle stratigraphic structure. Affected by climate and frequent tectonic activity, the lake surface rose and fell alternately, and the alternation frequency was high, which is vertically manifested in the form of multicycle superposition. The depositional period of the Yanchang Formation in the Triassic experienced lake basin subsidence, depression, maximum lake surface to waning and extinction, which is a complete sedimentary cycle composed of transgressive and regressive sequences (Fu et al., 2020; Wu et al., 2004).
The Late Triassic Yanchang Formation in the Ordos Basin is the main Mesozoic target of oil exploration and development, with a thickness of more than 1000 m, and the maximum thickness of the western margin depression can reach 3000 m (Yang et al., 2017). From bottom to top, fluvial sand bodies are mainly composed of medium and coarse sandstones. Interbedded sandstones and mudstones represent a delta sedimentary system in the middle, and fluvial sandstone and mudstone deposits are found mainly in the upper part (Fu et al., 2020). The subsidence center of the lake basin is consistent with the depositional center; this area has the characteristics of long accumulation time, complete sequence structure, large thickness and wide distribution, and it represents the development stage of the main source rock and the large area of the superimposed reservoir in the basin (Wu et al., 2004).
The study area is located in Ansai County, Shaanxi Province, China, as shown in Figure 1. The structure is located in the east central part of the Yishan slope. The regional structure is gentle, and the average stratum dip angle is less than 1°. Under the influence of differential compaction, nose-like uplifts with a range of 10–30 m are developed locally. The sedimentary system is characterized by deposition along an inland river lake delta front. The sedimentary environment of Chang 6 in the Triassic Yanchang Formation represents an underwater distributary channel and channel sheet sand deposition. The target reservoir layer in the study area is Chang 6, and the main lithologies are sandstone, argillaceous sandstone, sandy mudstone and mudstone.
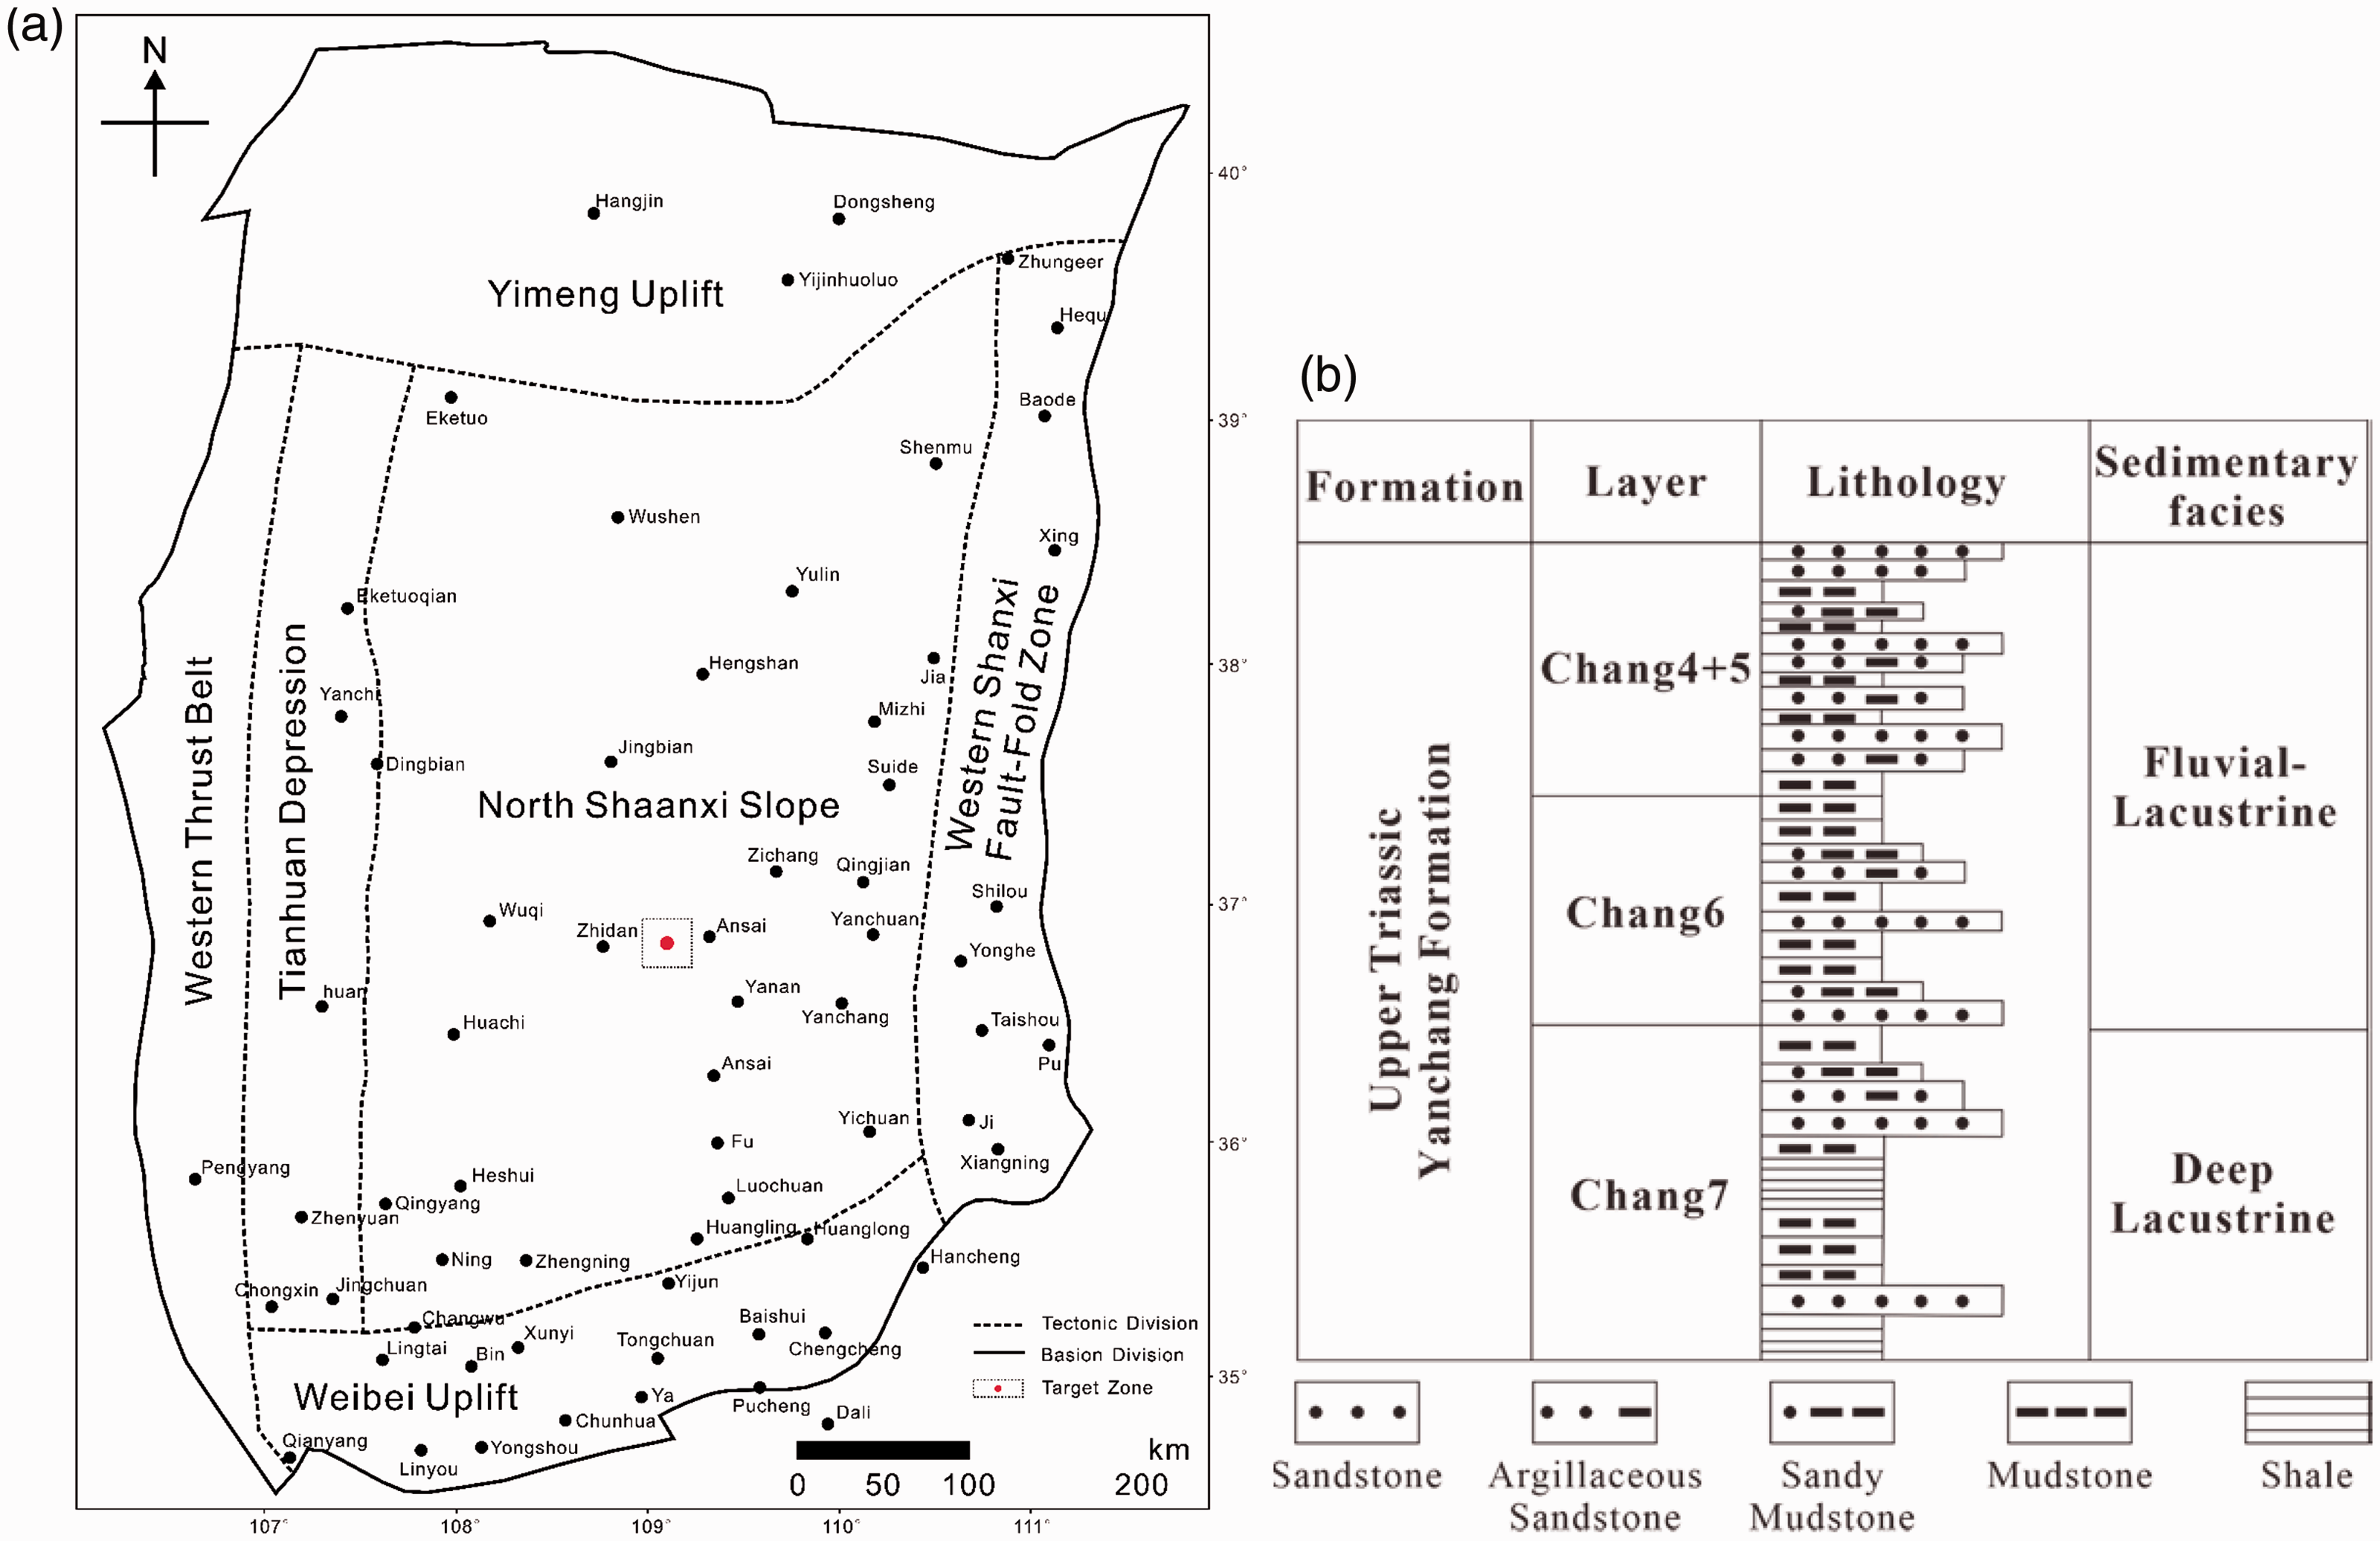
Geographical location map and stratigraphic histogram of the study area: (a) geographical location map of the study area; (b) stratigraphic histogram of the study area (Edited from Xiao et al., 2005; Fu et al., 2020).
Diagenetic characteristics
The diagenetic types of the reservoir in the study area are compaction, dissolution and cementation (Zhu, 2008). According to the results, diagenesis can be divided into destructive and constructive stages. In the study area, destructive diagenesis and constructive diagenesis occurred simultaneously.
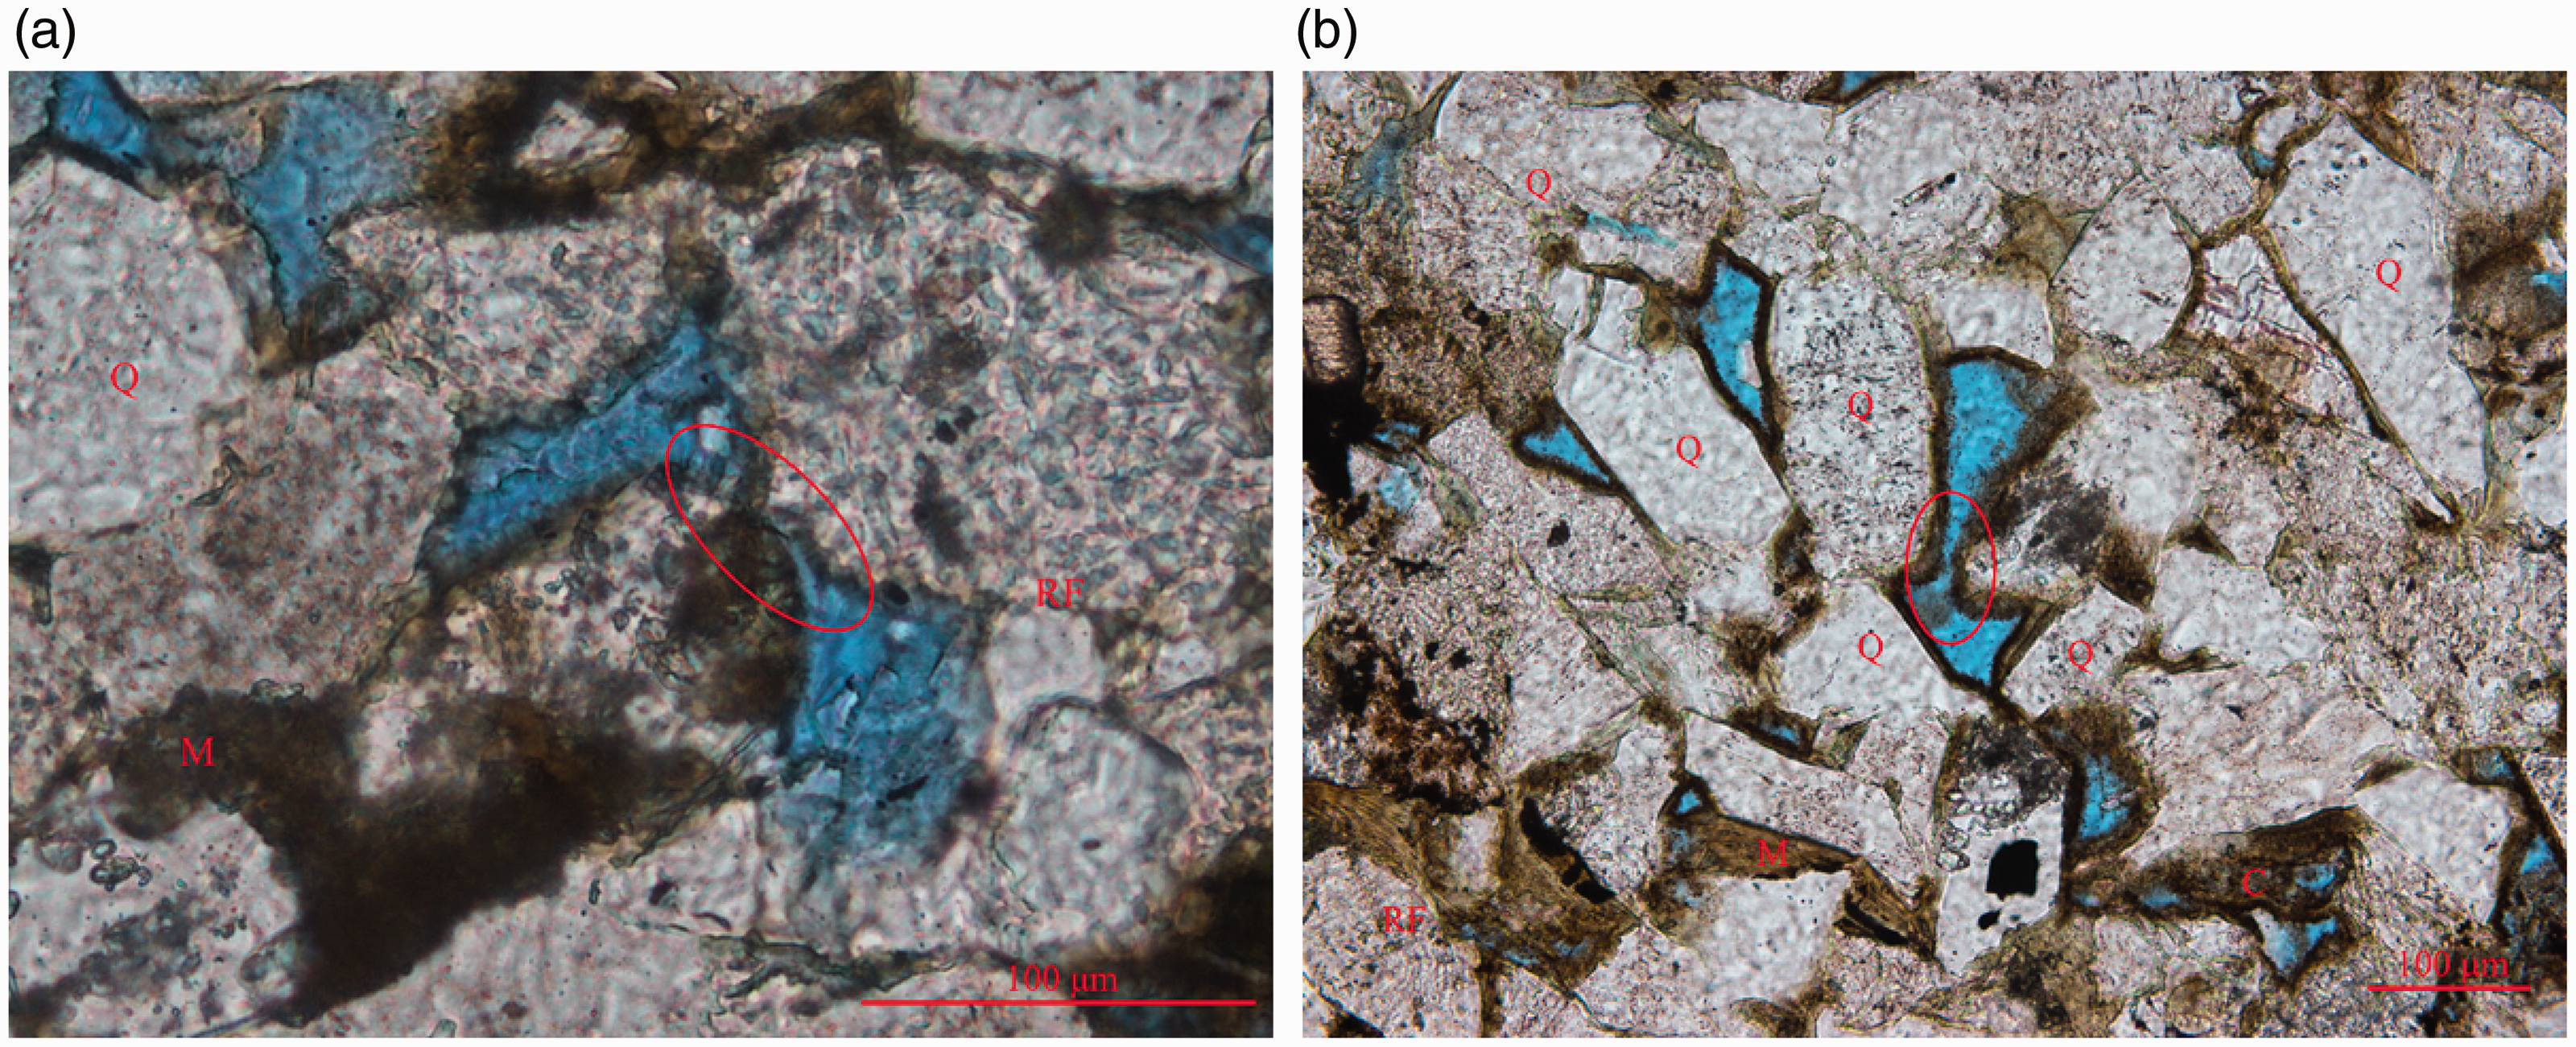
In terms of compaction characteristics, the burial depth of the reservoir in the study area is relatively large, ranging from 1000 m to 2500 m; consequently, the reservoir experienced a strong diagenetic compaction stage. With increasing burial depth, the clastic particles were closely arranged, and these particles have mainly line contacts or concave-convex contacts, which are reflected in rock thin sections (Figure 2(a)); primary pores are not developed, most pores are secondary, and skeletal particles are commonly broken.
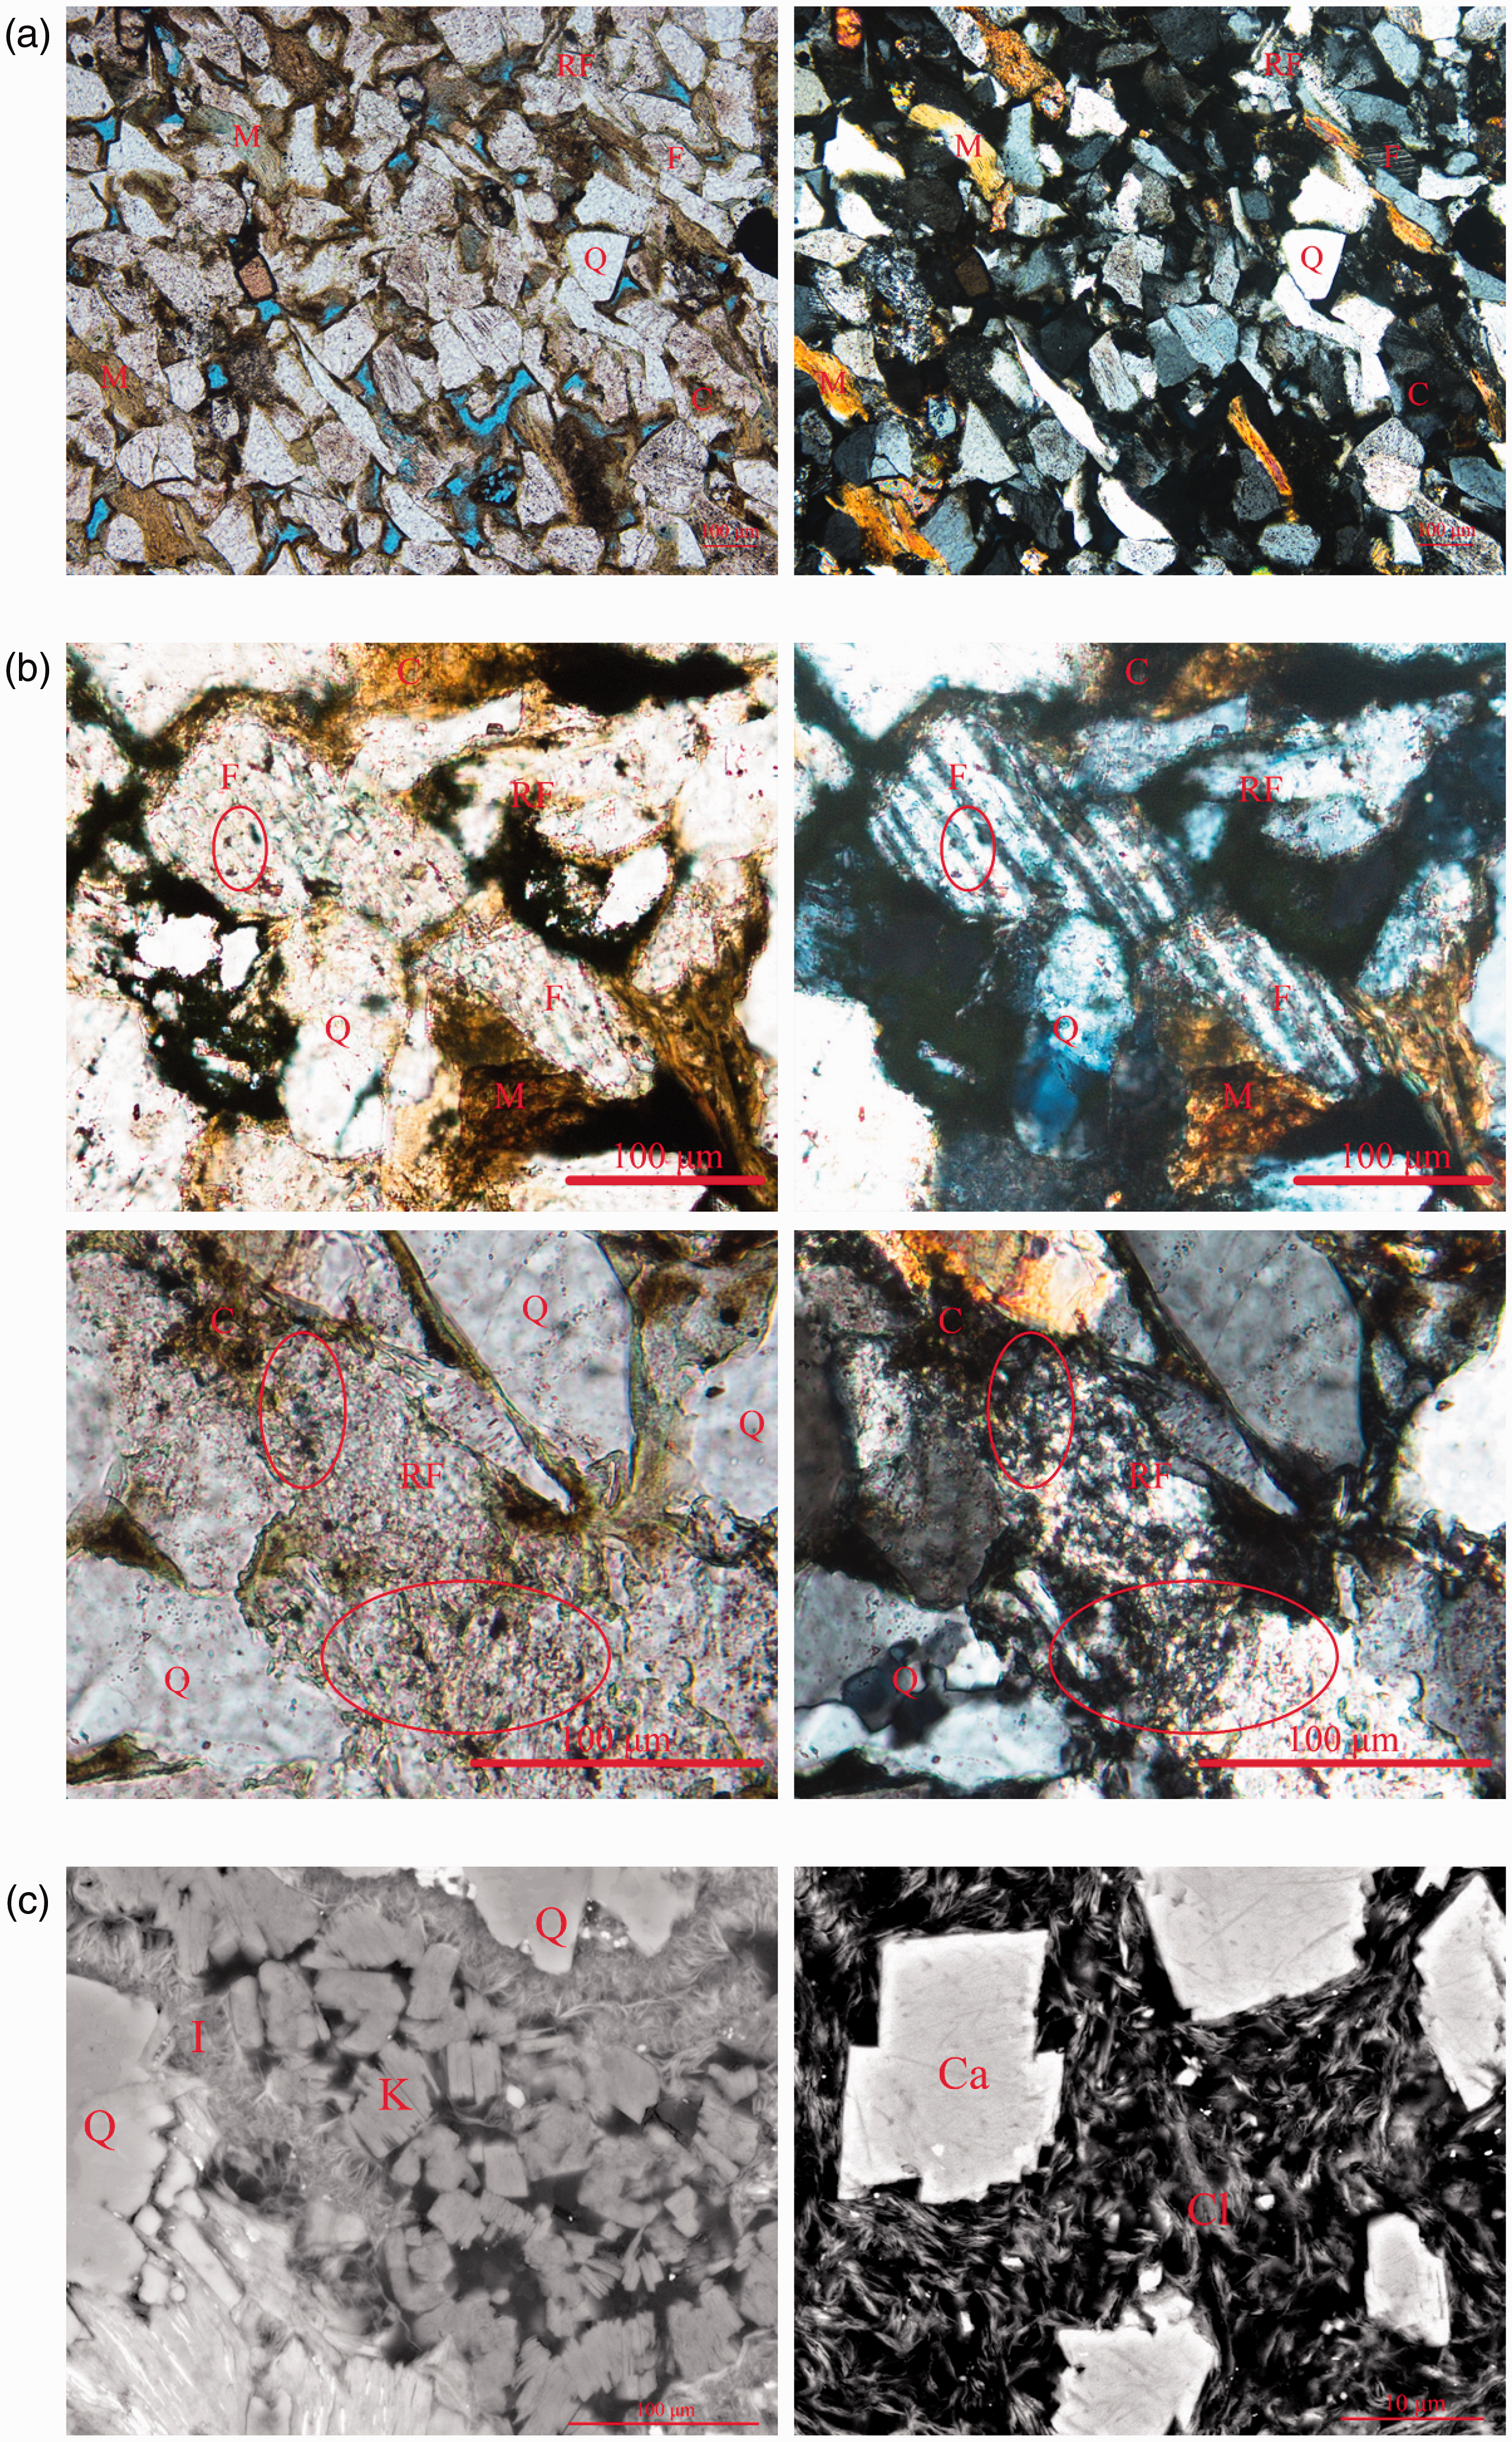
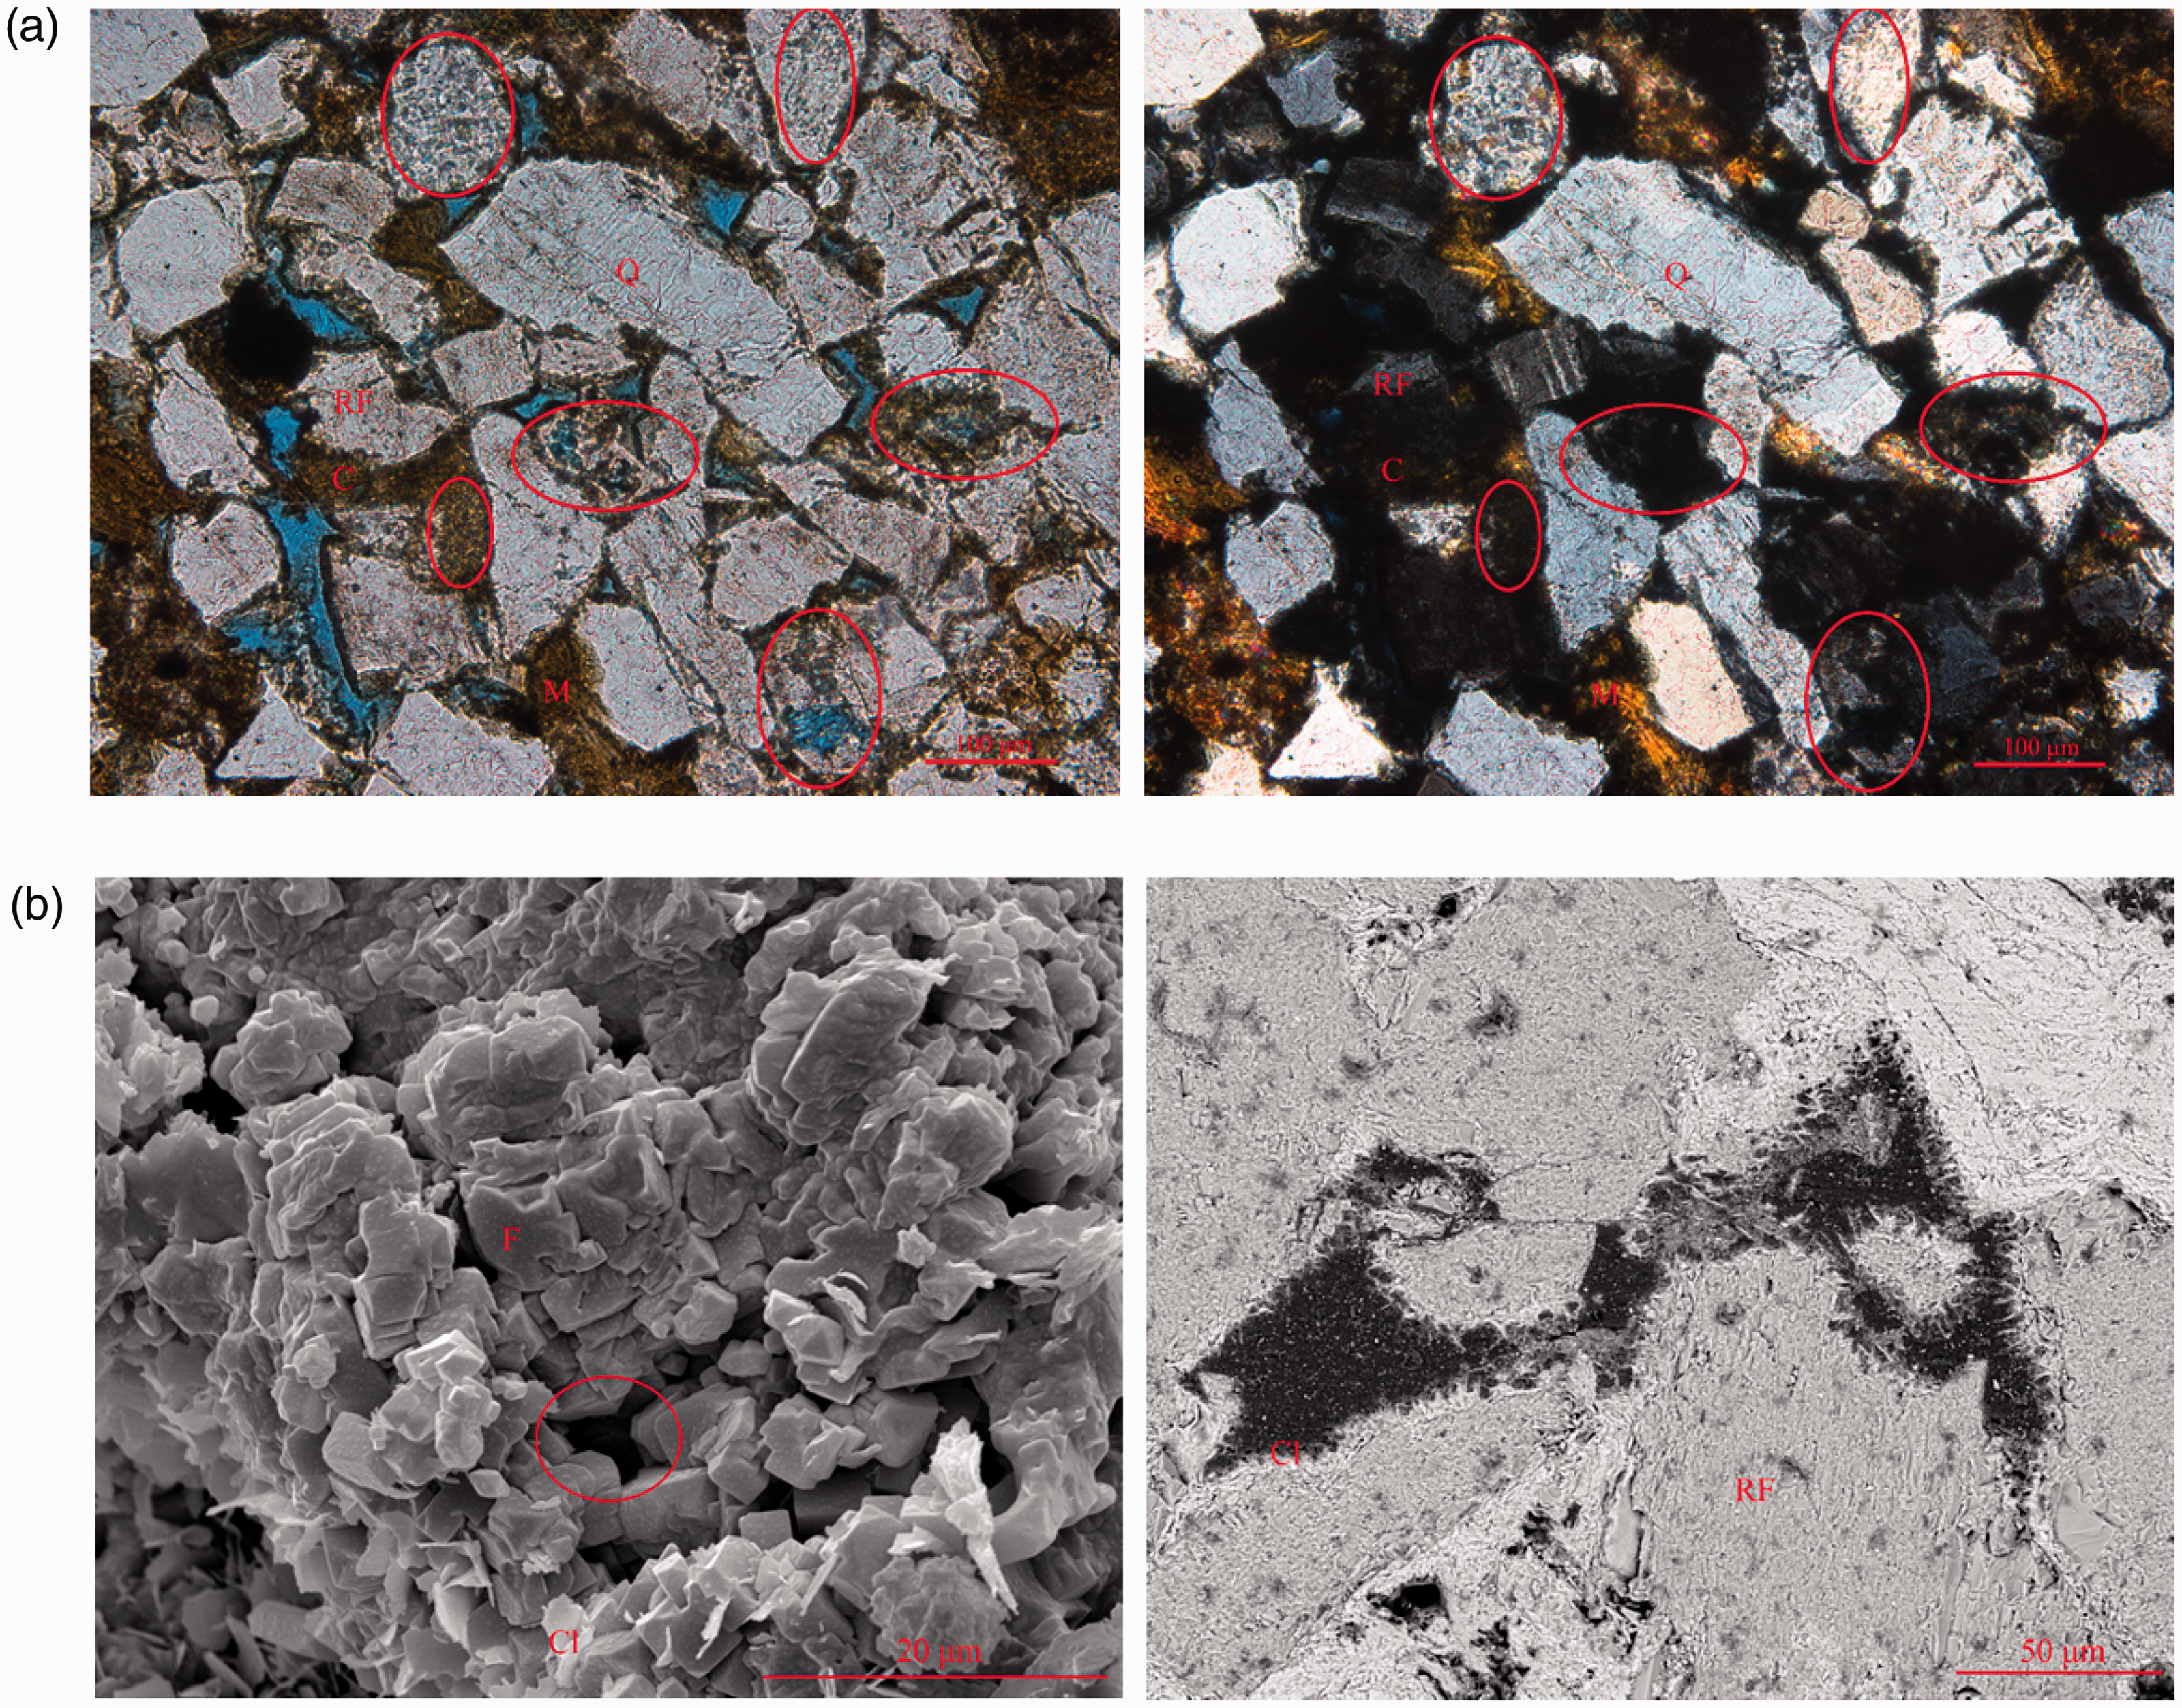
Typical thin sections of reservoir rocks in the W area: (a) compaction, W4, 1020.43 m, intergranular pores developed, and rock particles are arranged densely; (b) dissolution, W7, 1506.15 m, feldspar dissolution (Red Circles); W3, 1004.67 m, rock fragment dissolution (Red Circles); (c) cementation, W4, 1103.50 m, kaolinite developed and filled with intergranular pores, resulting in micro-intergranular pores; W5, 1272.60 m, illite filling intergranular pores in large area, with chlorite growing and developing along the grain to the pore space (Q – Quartz; F – Feldspar; M – Mica; C – Clay; RF – Rock Fragment; Ca- Calcite; I- Illite; K- Kaolinite; Cl- Chlorite).
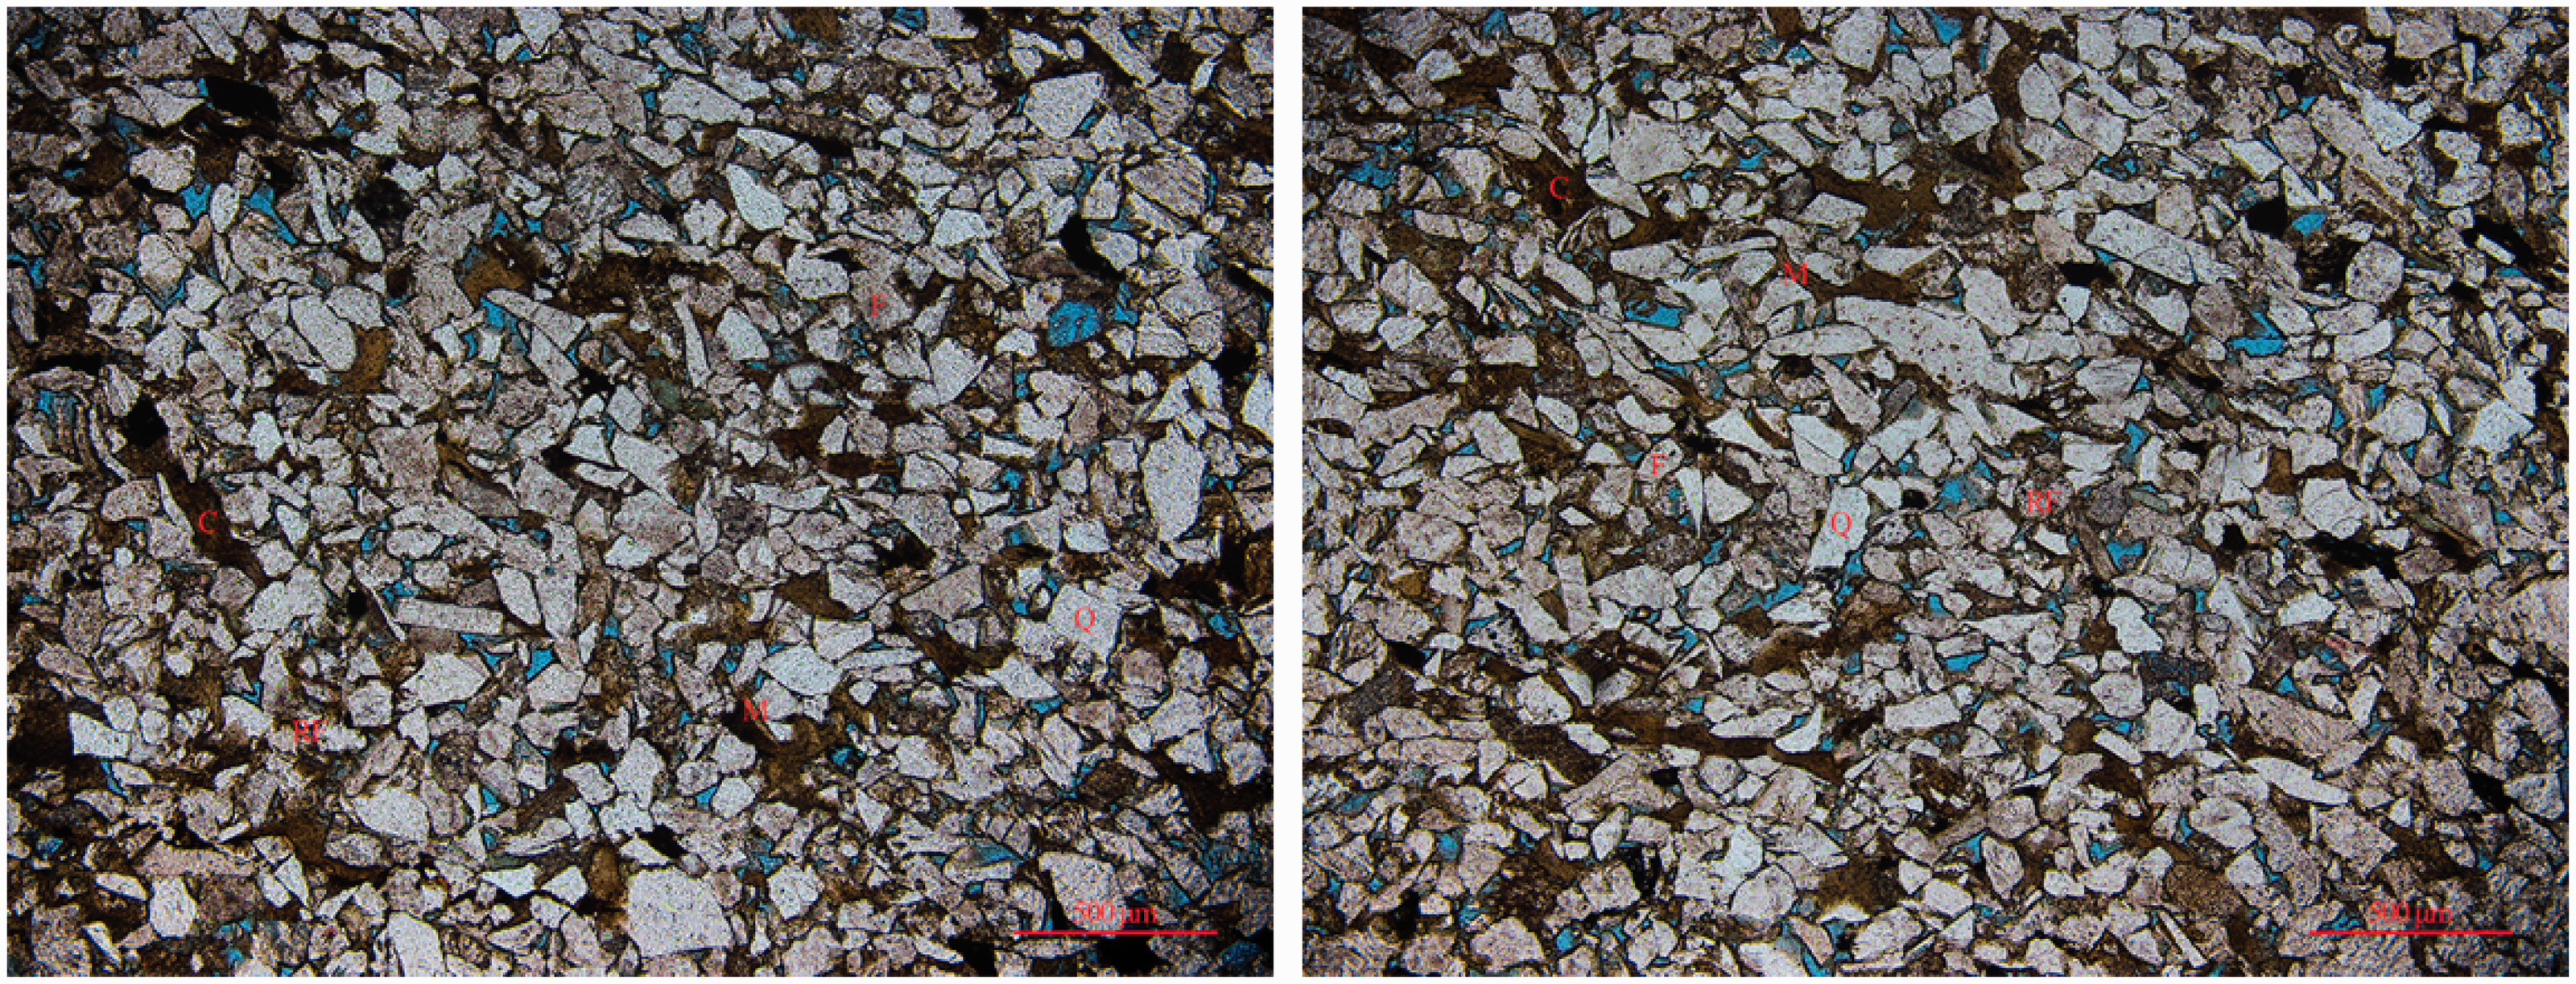
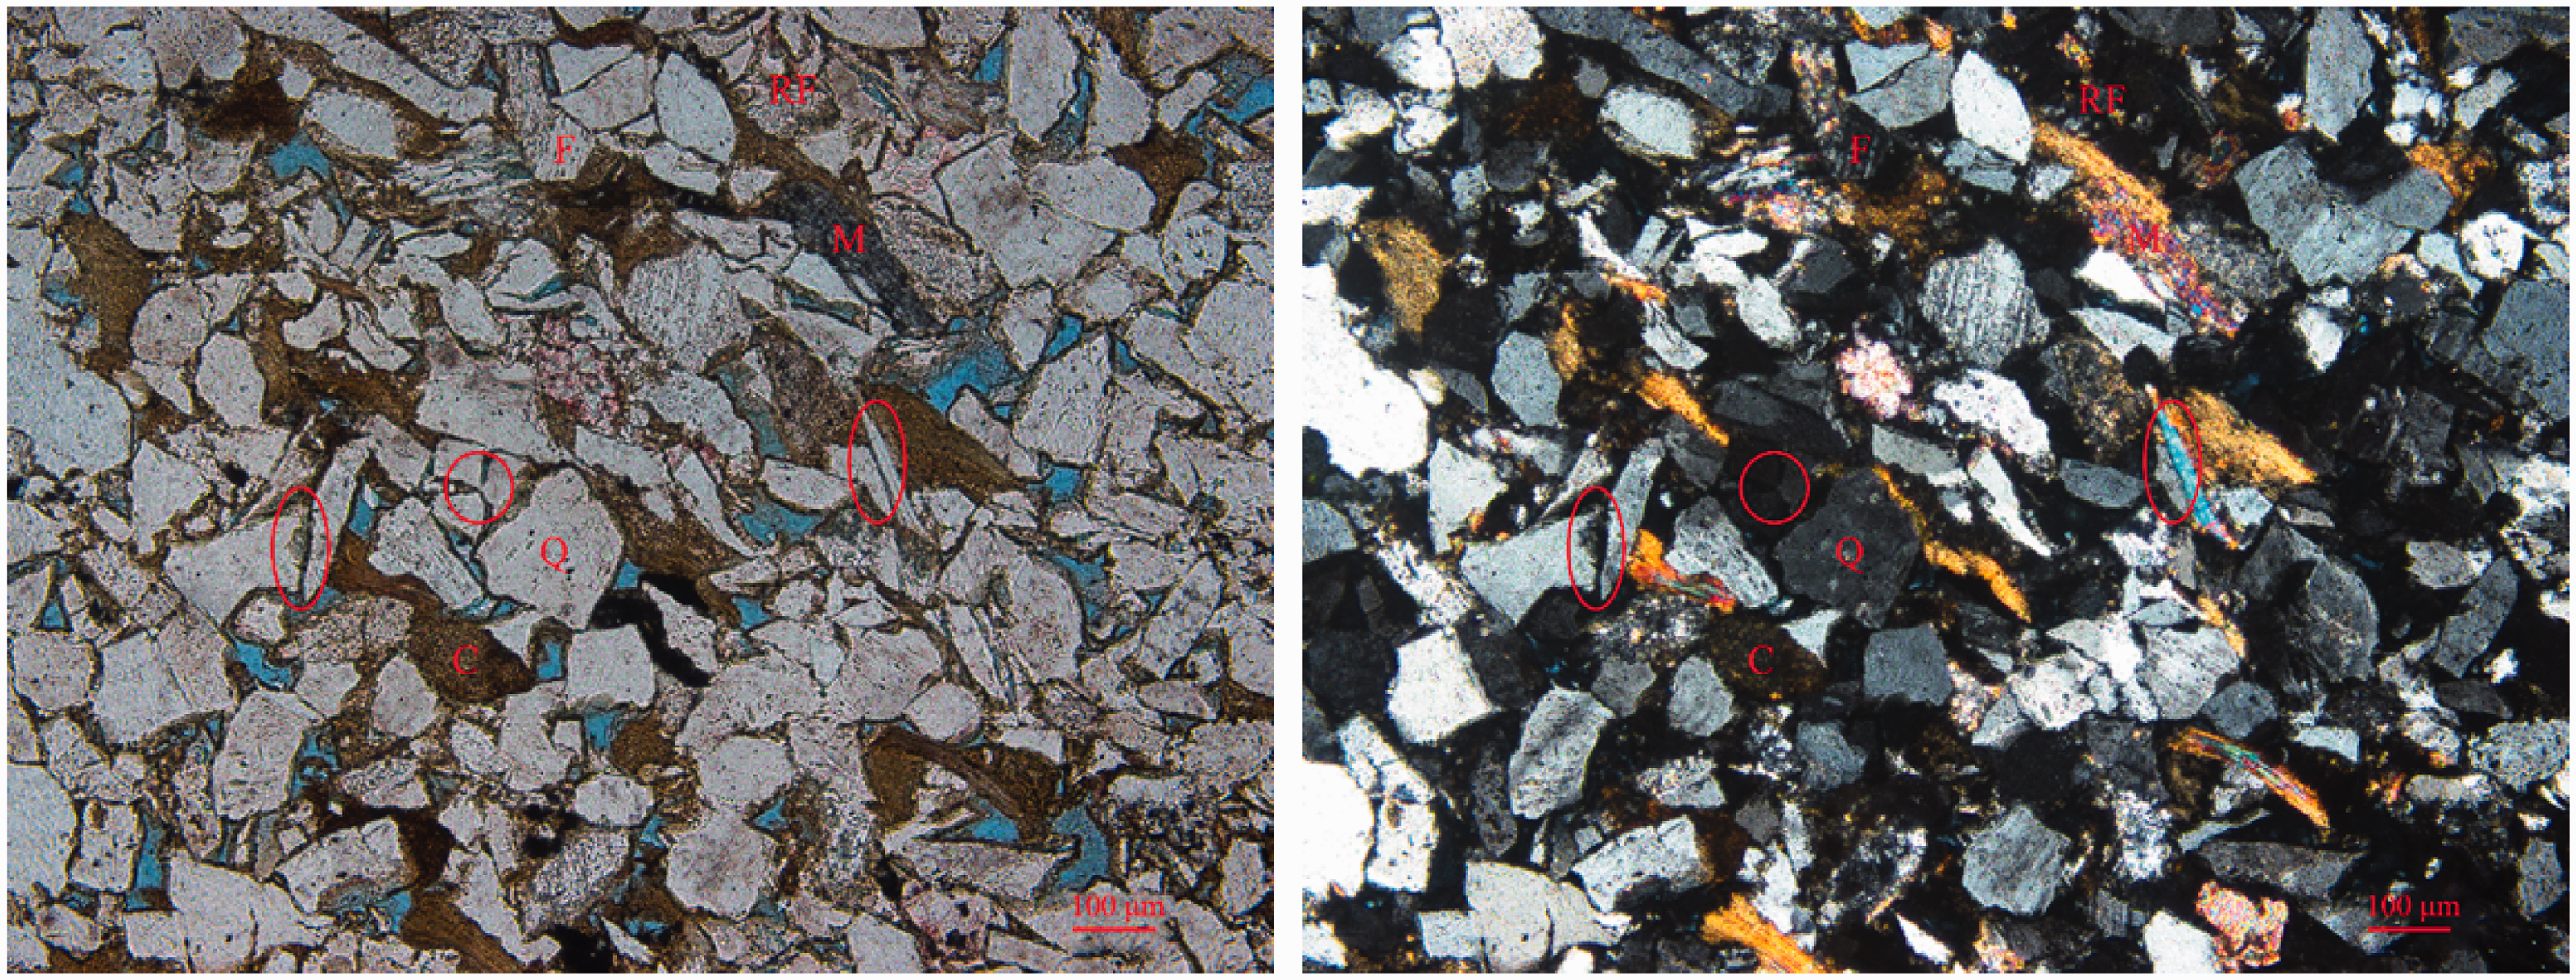
Thin sections of reservoir rocks for clastic and interstitial material characteristics of W area: W7, 1506.15 m (Q – Quartz; F – Feldspar; M – Mica; C – Clay; RF – Rock Fragment).
In terms of dissolution characteristics, feldspar dissolution is the main process observed in the study area, with small amounts of laumontite and rock fragment dissolution; dissolution provides many connecting channels, resulting in high porosity and permeability, as shown in Figure 2(b).
In terms of cementation characteristics, thin section and scanning electron microscope observations, as illustrated in Figure 2(c), show that the reservoir cementation types are mainly argillaceous cementation with clay mineral cements (chlorite and illite) and calcareous cementation mainly composed of carbonate cements (dolomite and calcite). Under the influence of sedimentation, chlorite and illite are widely developed in the study area. Chlorite and illite grow continuously from the grain wall to the pore space to fill the pores. Kaolinite is also developed in the study area, with kaolinite filling the intergranular pores. Carbonate binders are distributed in the W area, mainly calcite and dolomite. Moreover, a small amount of secondary quartz crystals can be seen, and the pore space between grains is filled.
Petrological characteristics
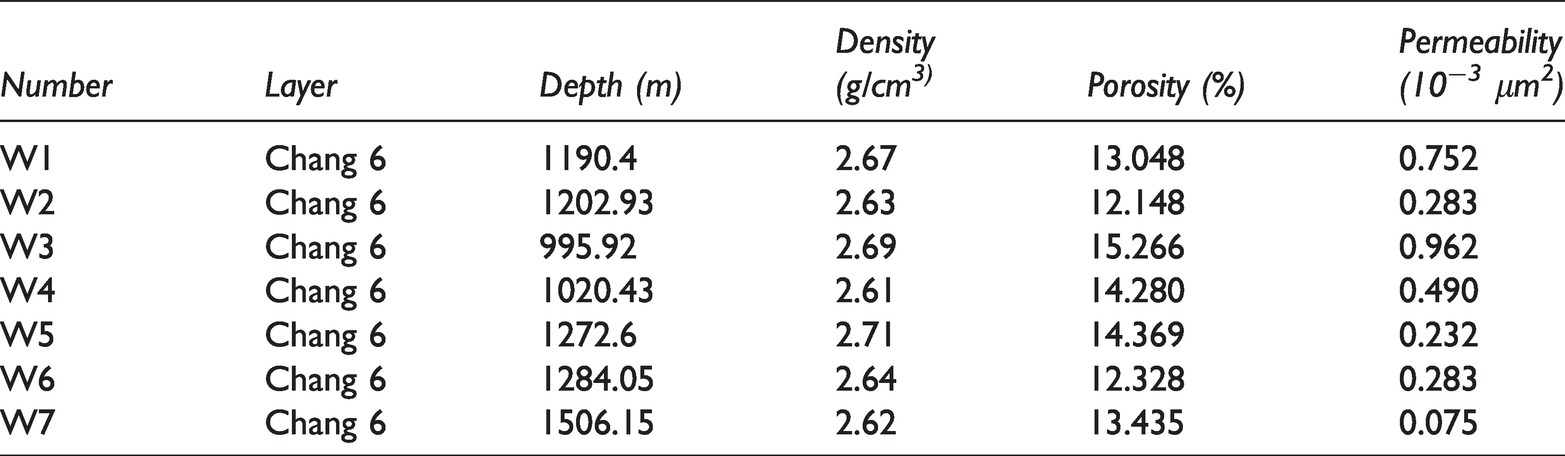
The petrological characteristics of a tight sandstone reservoir are some of the most basic features in reservoir evaluation. According to the diagenetic characteristics of the study area, seven representative samples of tight sandstone from the Chang 6 oil layer in the study area are taken as examples, as shown in Table 1. The depth, density, porosity, and permeability of the 7 core samples are listed in detail in Table 1. The samples are dried to constant weight at 105 °C, the porosity is tested by a 113 helium porosity device, and the permeability is tested using 112 air permeability devices. Both of the aforementioned equipment is produced by Core Laboratories Corporation (Core Lab).
Basic data for core samples from the W area.
The parameters of clastic composition, structure and maturity can reflect reservoir rock properties, and sandstone type, structural characteristics, rock fragment types and compositions and interstitial characteristics determine reservoir performance. Based on thin section observations and statistical analysis of rocks, combined with whole-rock and clay mineral contents obtained using X-ray diffraction (XRD), the reservoir rock types in the W area are mainly feldspathic lithic sandstone and lithic arkose, as shown in Table 2. The TTRAX III XRD equipment is a Rigaku Corporation theta/theta rotating anode system.
Mineral and clay contents of core samples from the W area.
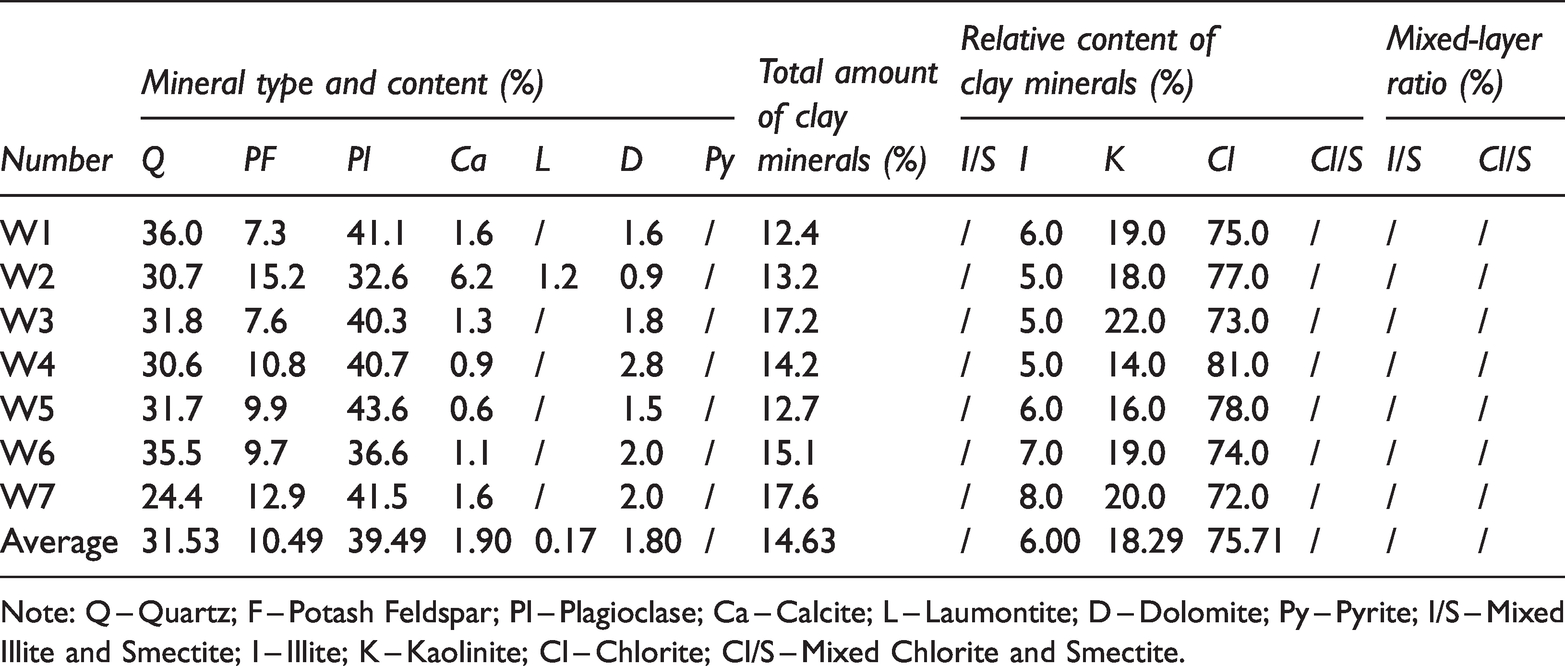
Note: Q – Quartz; F – Potash Feldspar; Pl – Plagioclase; Ca – Calcite; L – Laumontite; D – Dolomite; Py – Pyrite; I/S – Mixed Illite and Smectite; I – Illite; K – Kaolinite; Cl – Chlorite; Cl/S – Mixed Chlorite and Smectite.
Summary table of core pore throat characterization parameters in the W area.
Data for reservoir specific surface area in the W study area.
Evaluation parameters and results for the W area.
Clastic and interstitial material characteristics
From thin section identification, the clastic components of the reservoir are mainly quartz, feldspar, mica, clay and rock fragment. Calcite and dolomite can also be found in some thin sections. The clastic is about 80% ∼ 90% and interstitial material is about 10%∼20%. The quartz and feldspar are the main component of clastic, about 74% ∼ 83%. The rock fragments are about 18% ∼ 25%. Mica is about 1% ∼ 3% in the area’s thin sections.
Based on the XRD results, the clastic components of the reservoir are mainly feldspar and quartz, with an average total content of 81.50% (Table 2 and Figure 4(a)). The feldspars in the W area are plagioclase and potash feldspar, with contents ranging from 47.8% to 54.4% and an average total content of 49.97%. The proportion of plagioclase is relatively large, ranging from 32.6% to 43.6%, with an average content of 39.49%. The content of potash feldspar ranges from 7.3% to 15.2%, and the average content is only 10.49%. The quartz content can reflect the compositional maturity of clastic reservoirs to a certain extent. The quartz content of the reservoir in the W area ranges from 24.4% to 36.0%, with an average content of 31.53%.
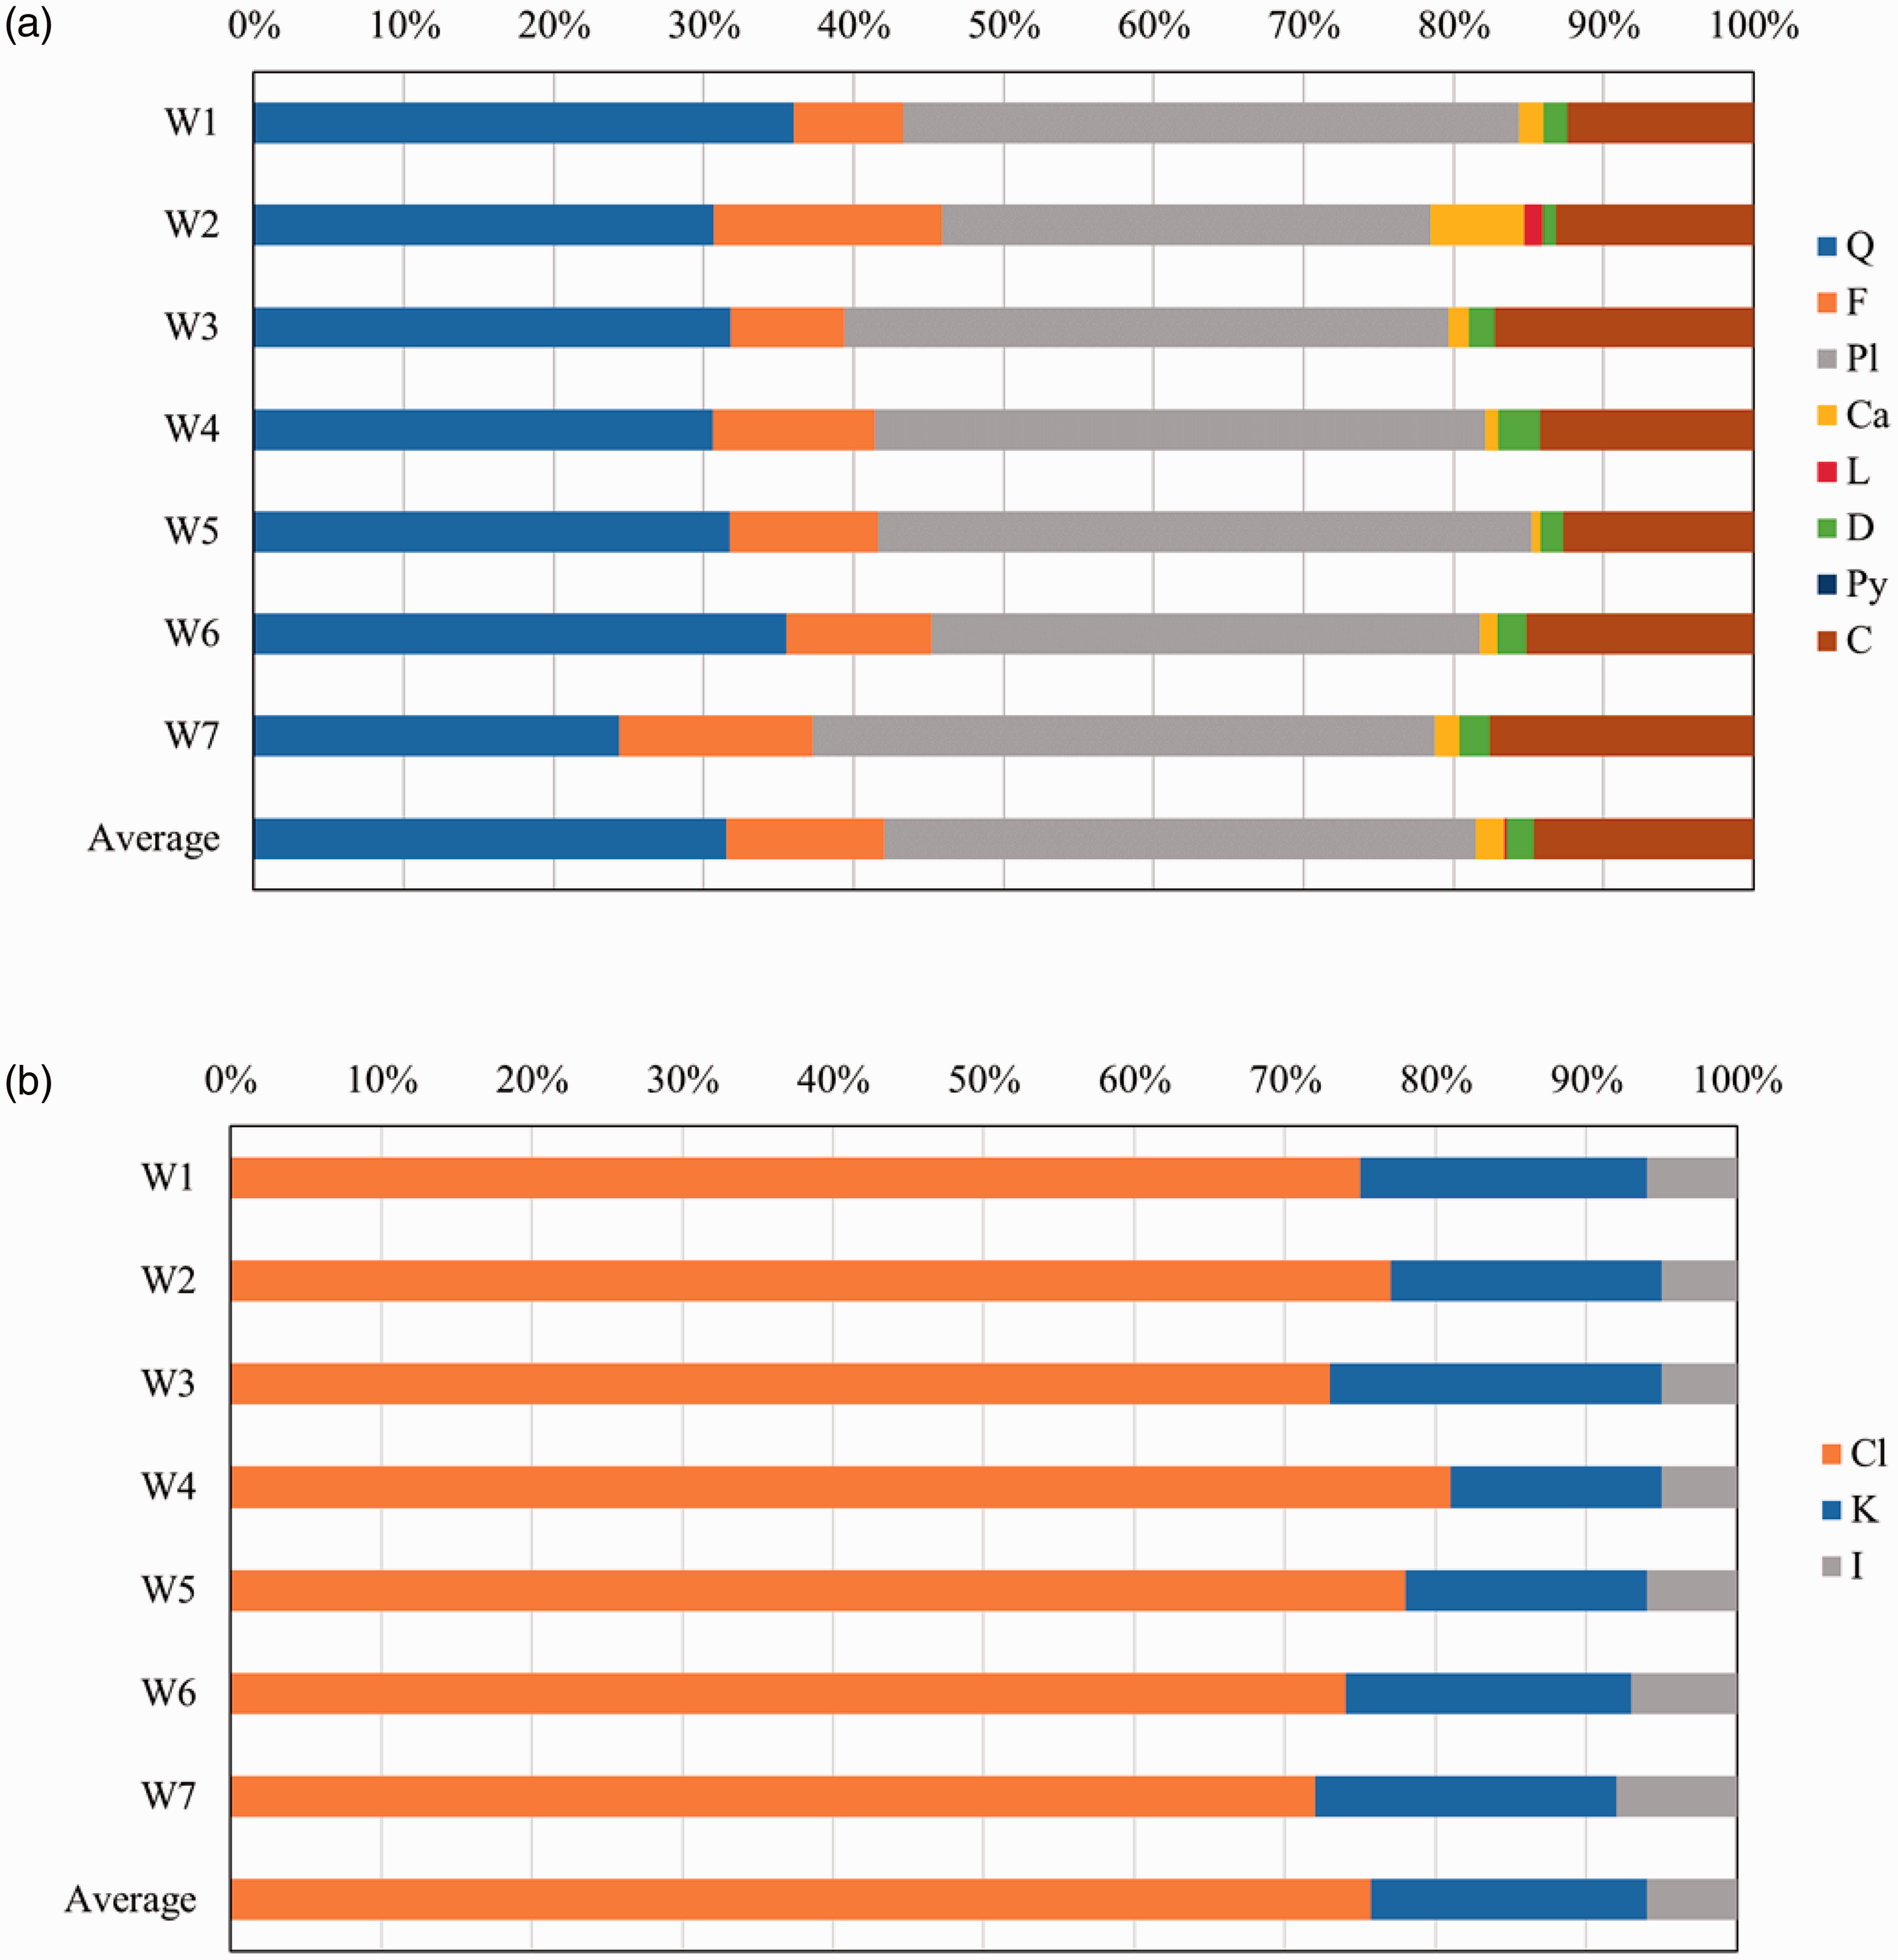
Mineral and clay contents of core samples from the W area: (a) clastic characteristics; (b) interstitial material characteristics (Q – Quartz; F – Feldspar; Pl – Plagioclase; Ca – Calcite; L – Laumontite; D – Dolomite; Py – Pyrite; C – Clay; I – Illite; K – Kaolinite; Cl – Chlorite).
Compositional maturity refers to the degree to which the detrital components in clastic rocks approach the most stable ultimate products under the transformation of weathering, transport and sedimentation. Generally, the relative content of stable components is used to mark the compositional maturity of clastic rocks. The formula for calculating the compositional maturity of clastic rocks is as follows
There are two types of interstitial materials in clastic reservoirs: matrix and cement. The matrix refers to the fine mechanical components that fill in between clastic grains, mainly argillaceous minerals. Cement refers to authigenic minerals that fill the pores of clastic grains and are formed by chemical precipitation. Siliceous, iron and carbonate cements are common, and gypsum and anhydrite can also be observed as cements.
Thin section identification and clay mineral diffraction analysis show that the total content of clay minerals in the W area ranges from 12.4% to 17.6% and that the average content is 14.63%, as shown in Table 2 and Figure 4(b). Clay minerals are chlorite, kaolinite and illite. The content of chlorite is dominant, and chlorite accounts for 72.0% - 81.0% of the relative content of clay minerals, with an average content of 75.71%. Kaolinite accounts for 14.0% - 22.0%, with an average content of 18.29%. The relative content of illite ranges from 5.0% to 8.0%, with an average content of 6.00%. The characteristics of clay minerals are not only closely related to diagenesis but also controlled by sedimentary conditions. The total content, types and relative contents of clay minerals in reservoirs developed under different sedimentary systems are also quite different.
The W area is dominated by argillaceous and carbonate cements. Argillaceous cements are mainly chlorite and illite, and carbonate cements are dolomite and calcite. The average total content of dolomite and calcite is 3.7%; the average content of calcite is higher, ranging from 0.6% to 6.2%, and the average content of calcite is 1.90%. The dolomite content is 0.9% - 2.8%, and the average content is 1.80%; a small amount of laumontite can be seen, but the content is low at approximately 1.2%.
Rock structure characteristics
Reservoir rock structure parameters include grain size, sorting, roundness, cementation type and particle contact relationship. The reservoir in the W area (Figure 5) is dominated by fine-grained sandstone; the particle size distribution ranges between 0.10 mm and 0.40 mm, and the maximum particle size can reach 0.75 mm. The particle sorting is good, and the distribution of roundness changes from subangular to subrounded. The main cementation type is membrane pore cementation, and the indirect contact system of particles involves mostly point-line and line contacts.
Structural characteristics of reservoir rock in the W area: W7, 1506.15 m, pore cementation, point-line contacts of clastic particles (Red Circles, Q – Quartz; F – Feldspar; M – Mica; C – Clay; RF – Rock Fragment).
Physical property characteristics
Reservoir physical properties are the most basic elements of reservoir research and provide a theoretical basis for the study of micro/nanopore structures. Through the physical property analysis of representative core samples from the W area, the maximum porosity is 15.2%, the minimum is 12.3%, and the average porosity is 13.6%; the maximum permeability is 0.962 × 10⁻³ µm2, the minimum is 0.075 × 10⁻³ µm2, and the average permeability is 0.440 × 10⁻³ µm2.
There is an exponential positive correlation between the porosity and permeability of the tight sandstone reservoir in the study area. The permeability has a certain upward trend with increasing porosity, which shows that the seepage capacity of the tight sandstone reservoir is strengthened with increasing porosity; that is, the greater the porosity is, the stronger the fluid seepage capacity of the reservoir. However, at the same porosity level, there are obvious differences in reservoir permeability. For a tight sandstone reservoir, the important factor restricting its development efficiency is the reservoir fluid seepage capacity. Permeability, as a characteristic parameter reflecting the reservoir seepage capacity, is controlled by the development of reservoir throats. The larger the throat distribution is, the better the reservoir permeability.
In tight sandstone reservoirs, clastic components and interstitial materials have important impacts on reservoir physical properties (Huang et al., 2001; Niu et al., 2004; Pechnig et al., 1997). The differences in clastic components affect the diagenetic and physical property evolution of reservoirs. In the study area, feldspar and quartz are the main clastic particles, and clay minerals are the most prominent interstitial materials.
Quantitative characterization of micro- and nanopore throat characteristics
Pore throat structure characteristics are the size, morphology, distribution, and interconnections of pores and throats in reservoir rocks, as well as the configuration between pores and throats. The pore throat structure is one of the core elements in the study of reservoir microstructure characteristics. Controlled by sedimentation and diagenetic evolution, the micro- and nanopore throat structure of the tight sandstone reservoir in the study area is complex, and the pore throat radii change greatly, which seriously restricts reservoir performance. To further understand the micro- and nanopore throat structure characteristics of the tight sandstone reservoir in the Ordos Basin, the morphological characteristics of micro- and nanopore throats in the reservoir were examined by casting thin sections, scanning electron microscopy, nitrogen adsorption experiments and high-pressure mercury injection experiments. The quantitative characterization and continuous distribution characteristics of micro- and nanopore throats were studied by nitrogen adsorption and high-pressure mercury injection tests.
Recognition of characteristics
Casting thin sections can be used to directly observe the micro- and nanopore throat morphology, size and connectivity. The micro- and nanopore type, throat type and pore combination characteristics of the reservoir in the study area are investigated by casting thin sections and scanning electron microscopy.
According to their occurrence, pores can be divided into intergranular pores, intragranular pores, interstitial pores and fractures. Among them, intergranular pores, intragranular pores and interstitial pores are related to the reservoir rock structure; fractures are mainly affected by tectonic action and can coexist with other types of pores (Di, 1991). The pore types of the reservoir in the study area are similar, but the proportions of each type of pore are different. The main types are intergranular pores, dissolution pores, micropores in interstitial material and microfractures.
Intergranular pores are the original pores that formed during the process of sedimentary and burial evolution of clastic particles, and some of the pores remain between the grains after others are filled. Intergranular pores are widely developed in clastic reservoirs and provide the main reservoir space with the largest pore content.
Dissolution pores are pores formed by the dissolution of clastic particles, matrix, authigenic mineral cements or soluble components (such as carbonates, feldspar and sulfate) in metasomatic minerals after sedimentation and diagenesis. This type of pore is widely developed in clastic reservoirs; its morphology is honeycomb or beaded, and feldspar dissolution pores and debris dissolution pores are common.
Micropores in the interstitial materials are tiny intergranular pores developed in the interstices of clastic reservoirs and the common intergranular pores in authigenic clay minerals. The pore radii are mainly nanoscale, and the pore throat connectivity is poor; thus, micropores make little contribution to the reservoir and the development of tight sandstone oil and gas.
Microfractures refer to reservoir spaces that run through rocks or even clastic grains under tectonic and diagenetic conditions. According to their genesis, they can be divided into structural fractures and diagenetic fractures. The fracture surfaces of structural fractures are flat, without corrosion phenomena, and can effectively connect with reservoir space over a large range, improve pore connectivity and enhance reservoir circulation capacity. Microscopic observation shows no obvious microfractures in the W area.
The main pore types in the W area are intergranular pores and dissolution pores, as shown in Figure 6. The total content of the two pore types accounts for 80% of all pores in the reservoir, and the dissolution pores are mainly developed in feldspar and laumontite. Scanning electron microscopy shows that a small number of interstitial micro- and nanopores are developed in the reservoir, mainly chlorite intergranular micropores. Microscopically, microdissolution or fractures distributed along the feldspar cleavage can be seen. This kind of dissolution fracture network reduces the fracture initiation conditions in the process of fracturing in the tight sandstone reservoir, provides a basis for the generation of medium-pressure fracture networks in the process of oilfield water injection development and significantly improves the seepage energy of the reservoir.
Typical pore types of the reservoir in the W area: (a) W3, 1004.67 m, interstitial dissolved pore and intragranular dissolution pore (Red Circles); (b) W1, 1190.4 m, intergranular micropore (Red Circle) and W3, 1004.67 m, chlorite rims (Q – Quartz; F – Feldspar; M – Mica; C – Clay; RF – Rock Fragment; Cl – Chlorite).
The throat refers to the narrow passage connecting different types of pore space in rock. Pore throats have little effect on pore volume construction but great significance for connecting pore spaces and controlling the reservoir seepage capacity. The smaller the throat is, the lower the seepage capacity of the reservoir, and vice versa.
The shapes and sizes of throats in reservoirs are mainly controlled by sedimentation and diagenesis. According to the debris particle morphology, support type, contact mode, cementation type, dissolution degree and microfracture development characteristics, throats are divided into pore shrinkage throats, necking throats, sheet throats (curved sheet throats) and tube bundle throats (Luo and Wang, 1986). According to the throat type of reservoir in the W area, the throats are mainly sheet (curved sheet) throats; a small number of necking throats and tube bundle throats can be seen, and the development of pore shrinkage throats is not obvious, as shown in Figure 7.
Typical throat types from the reservoir in the W area are as follows: (a) W7, 1506.15 m, curved flaky throat (Red Circle); (b) W3, 1004.67 m, pore shrinkage throat (Red Circle); (Q – Quartz; M – Mica; C – Clay; RF – Rock Fragment).
Scanning electron microscopy and casting thin section observations show that the main reservoir pore assemblage types in the W area are dissolved pores - intergranular pores and intergranular pores - dissolution pores; small numbers of intergranular dissolution pores - micropores, intergranular pores - intergranular micropores and intergranular micropores have also developed. In the pore assemblage types, intergranular pores are mainly residual intergranular pores and dissolution intergranular pores; dissolution pores are mainly feldspar dissolution pores with a small number of debris dissolution pores; there are also laumontite dissolution pores in the W area; intergranular micropores are mainly found in chlorite and illite.
Continuous distribution characterization
The high-pressure mercury injection method is the most commonly used technique to study reservoir micropore throat structures (Gen and Hu, 2011; Li and Xu, 2009; Zhong, 1997). Based on the capillary bundle model, the porous medium is assumed to be composed of capillary bundles with different diameters. Mercury is a nonwetting phase on a rock surface. Relatively speaking, the air or mercury vapor in the rock pore is the wetting phase, and the mercury injection process is the process by which the nonwetting phase displaces the wetting phase.
High-pressure mercury injection experiments were carried out with a Core Lab 13 helium porosity device, Core Lab 112 air permeability device and Quantachrome Instruments Poremaster PM-33–13 mercury device. The samples were dried to constant weight at 105 °C before testing. The maximum test pressure of the instrument was 200 MPa, and the lower limit of the measurable pore throat radius was 3.675 nm. This measurement range could effectively characterize the micro- and nanopore throat size characteristics of the tight sandstone reservoir.
A capillary curve can qualitatively reflect the micropore throat structure of a reservoir, and the curve shape can reflect the characteristics of pore throat sorting and skewness. Pore throat sorting refers to the degree of homogenization in the pore throat size distribution, and skewness refers to the tendency for the pore throat size distribution to be coarse or fine. The smaller the change in the capillary pressure curve in the low-pressure section is and the wider the distribution, the better the separation of pore throats; the more the capillary pressure curve deviates from the origin, the higher the proportion of large pores in the reservoir; under this condition, the pore throats are characterized by coarse skewness.
The capillary pressure curve, characteristic parameters of pore throats and continuous distribution characteristics of pore throats are obtained by high-pressure mercury injection experiments. The shapes of the capillary pressure curves in the W area are similar (Figure 8); the curvature is obvious in the upper left, and the change rate of the capillary pressure curve in the main mercury injection stage is large. The pore throat structure of the reservoir is complex; the capillary pressure curves show an upward trend twice as a whole, and there is basically no horizontal platform. According to the shapes of the capillary pressure curves, the pore throat separation of the reservoir is poor and is mainly characterized by medium to coarse skewness. According to the curve shapes, the reservoir can be divided into class I (W1, W5, W6, and W7), class II (W2 and W3) and class III (W4).
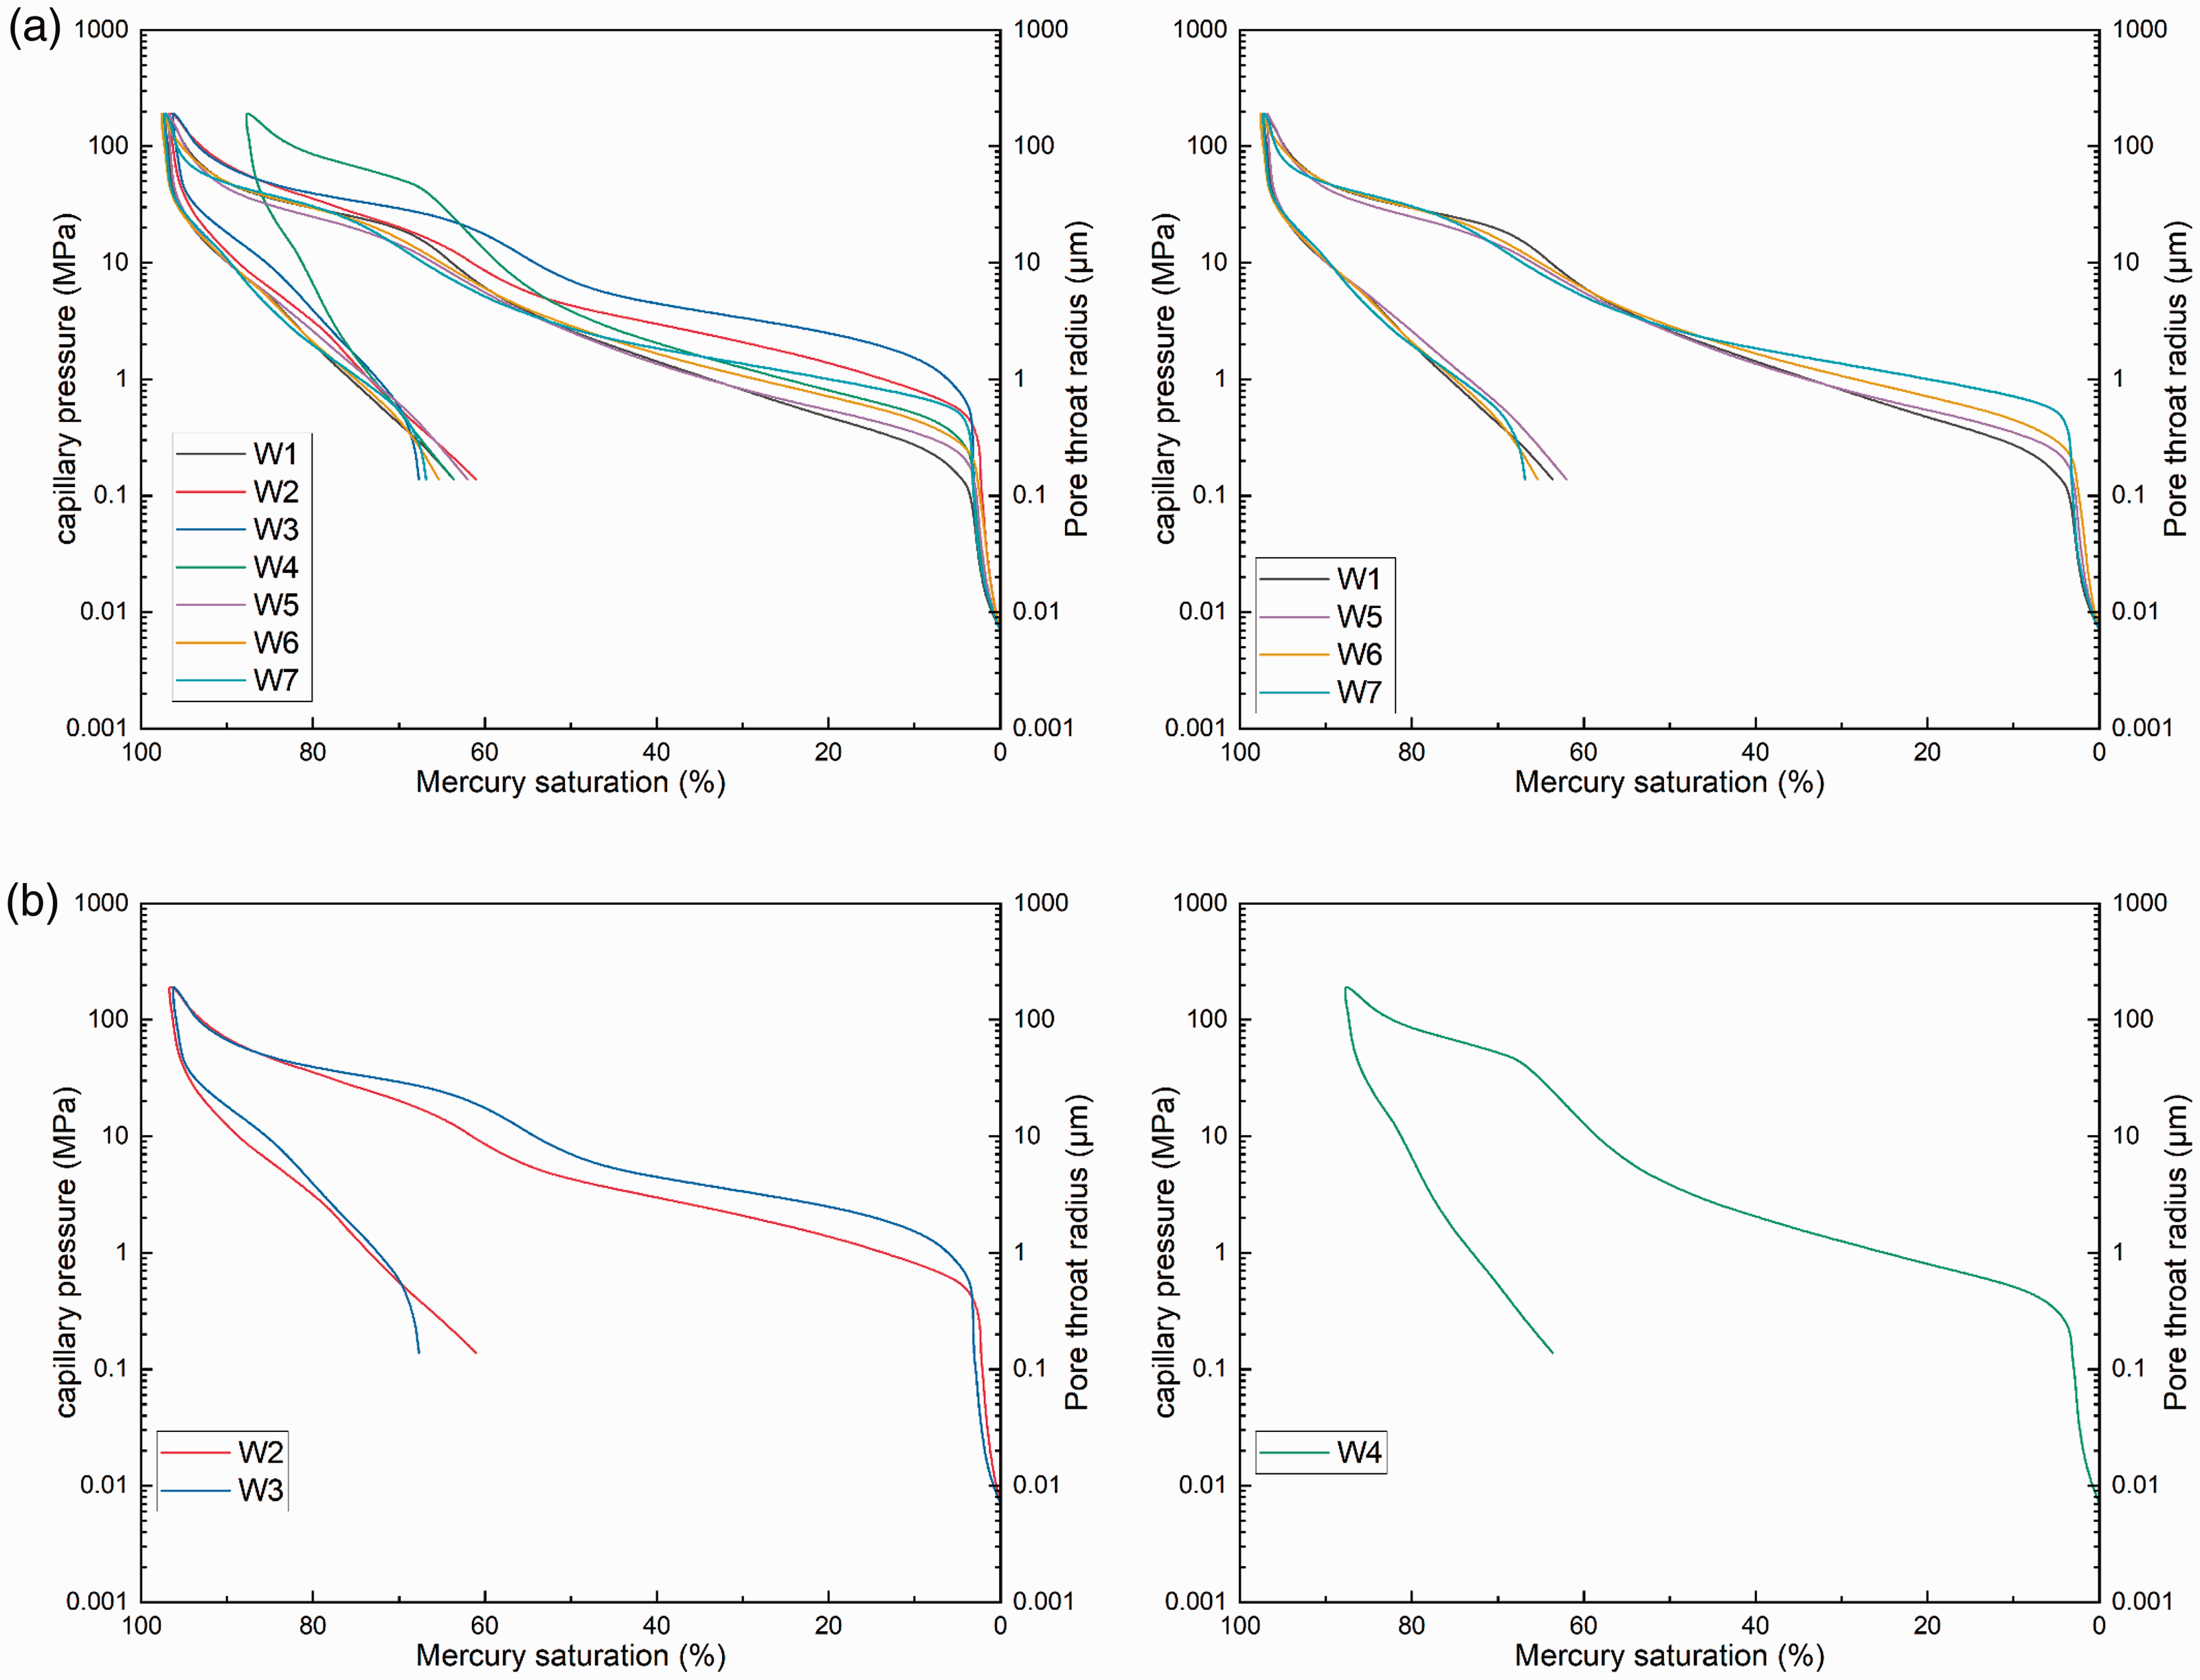
The capillary pressure curves for the cores from the W area are as follows: (a) Capillary pressure curves of all cores in the W area; (b) Capillary pressure curves of Type I; (c) Capillary pressure curves of Type II; (D) Capillary pressure curves of Type III.
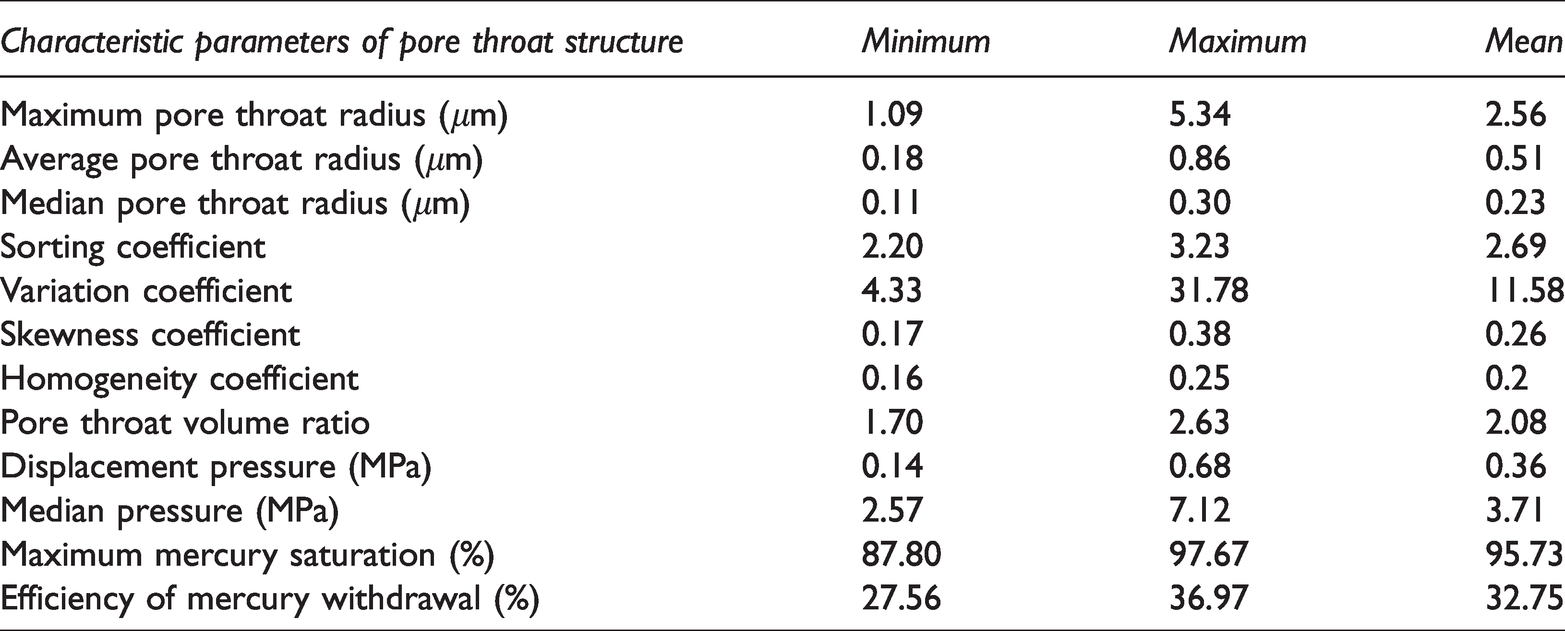
According to their meanings, these parameters can be divided into pore throat size characterization parameters (maximum pore throat radius, median pore throat radius and average pore throat radius), pore throat sorting and homogenization characterization parameters (sorting coefficient, variation coefficient, skewness coefficient and homogeneity coefficient) and pore throat connectivity characterization parameters (displacement pressure, median pressure, maximum mercury saturation and mercury withdrawal efficiency).
As show in Table 3, the average maximum pore throat radius of the reservoir in the W area is generally small at 2.56 µm; the average pore throat radius is 0.51 µm, and the average median pore throat radius is 0.23 µm, which indicates that the reservoir space is mainly composed of nanopores and throats. The average value of the sorting coefficient is 2.69, which implies that the distribution of pore throat size is highly concentrated in the study area. The variation coefficient of pore throats varies greatly from 4.33 to 31.78, with an average of 11.58. The skewness coefficient of the study area is between 0.17 and 0.59, and the variation in the deviation of the pore throat varies greatly. There are both fine skewness distributions (skewness coefficient 0.17) and coarse skewness distributions (skewness coefficient 0.59). The distribution of pore throat size has strong asymmetry, and the average skewness coefficient is 0.26. The average coefficient ranges from 0.16 to 0.2 with an average value of 0.20, indicating that the pore throat size distribution is relatively uniform and that the variation is small. The average throat volume ratio is between 1.70 and 2.63, indicating that the throat volume ratio is relatively small, and the reservoir capacity is relatively small.
The displacement pressure of the reservoir in the study area ranges from 0.14 MPa to 0.68 MPa, with an average of 0.36 MPa, which indicates that the largest connected pore throat radius in the W area is wide. The median pressure range of saturation is 2.57 – 7.12 MPa, and the average value is 3.71 MPa, which reveals that the reservoir has a strong seepage capacity. The maximum mercury saturation is between 87.80% and 97.67%, with an average value of 95.73%, indicating that the connectivity of reservoir space is high. The mercury removal efficiency ranges from 27.56% to 36.97%, with an average value of 32.75%, which implies that the pore throat structure distribution is conducive to the recovery of nonwetting phase oil and gas in the reservoir.
According to the test data from the high-pressure mercury injection experiments, the continuous distribution curves of pore throat frequency, pore throat permeability contribution rate and pore throat volume are constructed, and the continuous distribution characteristics of micro- and nanopore throats in the tight sandstone reservoir in this area are analyzed. The continuous distribution of pore throat frequency is characterized by a bimodal state (Figure 9). The smaller peak value mainly ranges from 0.0063 µm to 0.0160 µm, and the corresponding peak distribution of larger pore throats ranges from 0.16 µm to 1.00 µm. Pore throats with radii greater than 100 nm account for 62.3%. The continuous distribution curve of the pore throat permeability contribution reflects the quality of the reservoir more vividly than the structural characteristic parameters of mercury injection, indicates the contribution of different pore throats to permeability in the reservoir, and illustrates the interconnection degree of different pore throats.
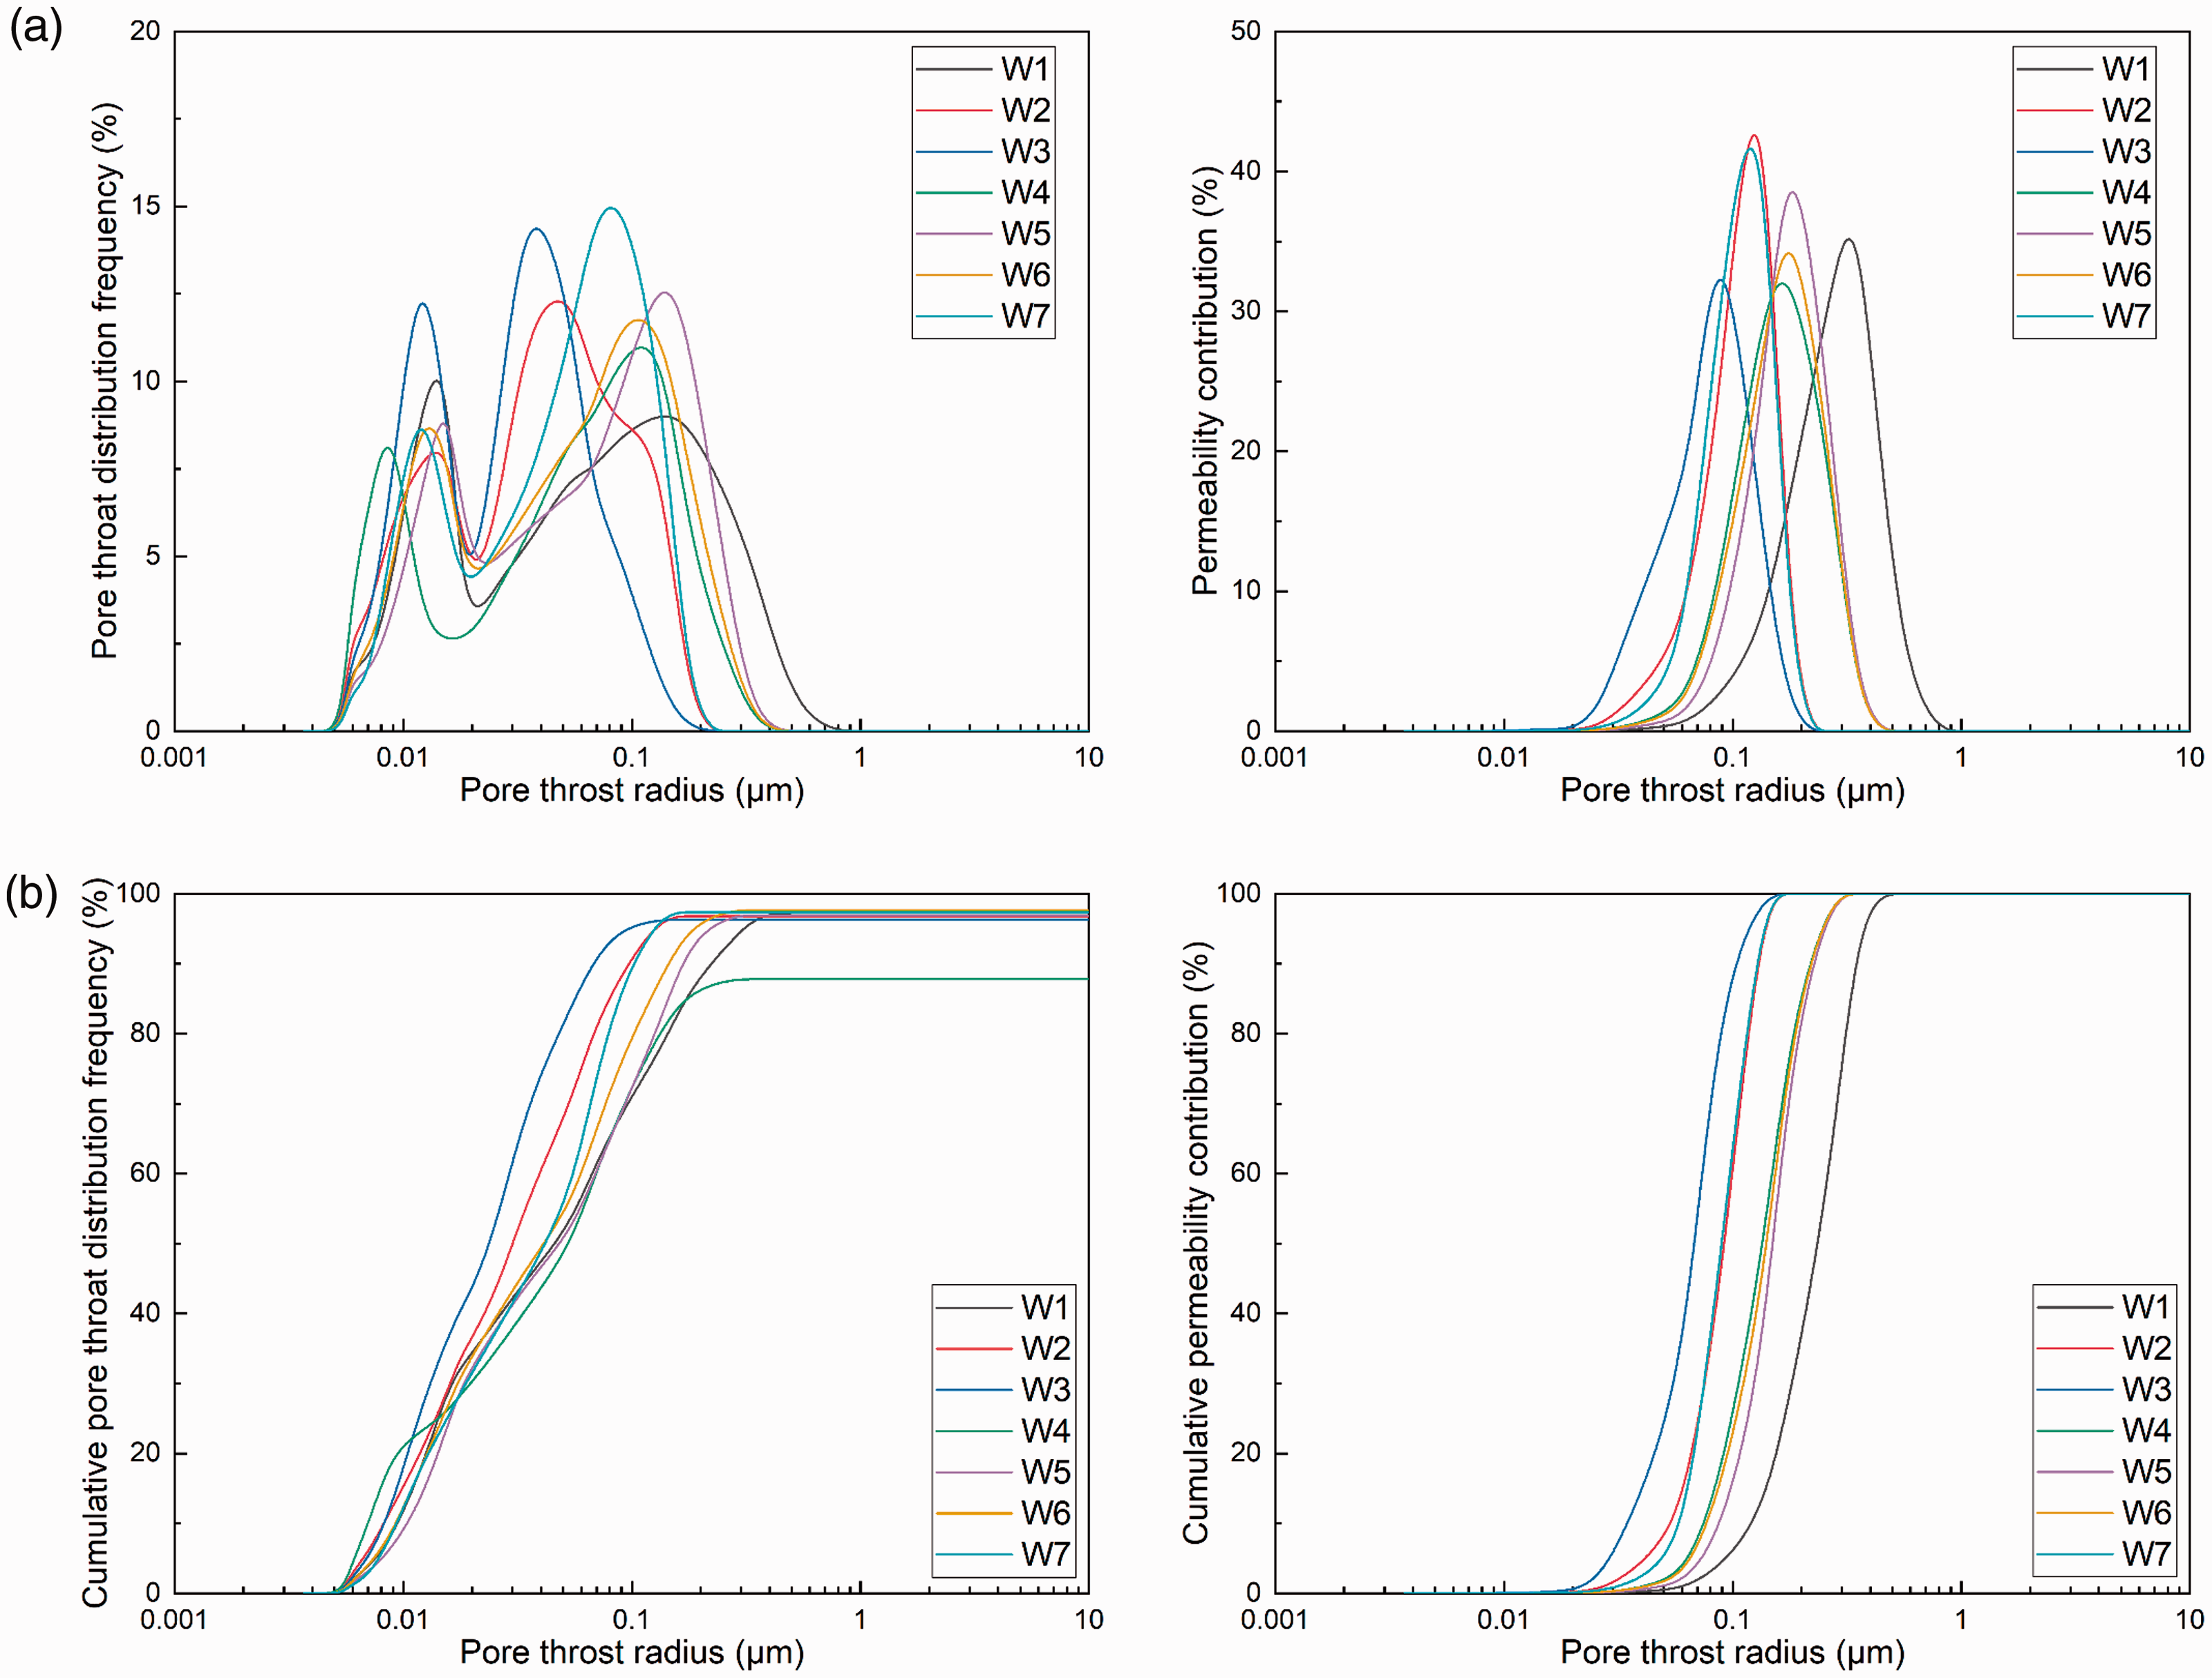
Continuous distribution curves of pore throat frequency and contribution rates of pore throat permeability in the W area: (a) pore throat frequency distribution curve; (b) pore throat permeability contribution distribution curve; (c) cumulative distribution curve of pore throat frequency; (d) cumulative distribution curve of pore throat permeability contribution.
From the continuous curve of the pore throat permeability contribution, the radius of main pore throat of permeability contribution can be seen to range from 0.63 – 4.00 µm due to the development of intergranular pores, dissolution pores and local microfractures in the W area, which contribute more than 85% of reservoir permeability. The main pore throat radius of permeability contribution is large, which indicates that the relative connectivity degree of main pore throat of W permeability contribution is high. The histogram of the pore throat volume ratio is similar to the continuous curve of the pore throat radius permeability contribution, which can indirectly reflect the reservoir performance and internal fluid seepage capacity of tight sandstone oil. In the W area, the double peaks are at 35.6 nm and 1087.5 nm, respectively.
Specific characteristics
The measurement of pore throat radius by the nitrogen adsorption method is based on the capillary condensation phenomenon and the volume equivalent exchange principle using Micromeritics ASAP2420 surface area analyzer. Under isothermal conditions, the pore size, specific surface area and volume size parameters are calculated by adsorption and desorption characteristics of nitrogen in a certain pressure range. According to the nitrogen adsorption-desorption experiments, the adsorption-desorption isothermal curves (Figure 10) are drawn. The adsorption-desorption characteristics in the W area are analyzed, and the adsorption pore type is determined by adsorption loop morphology.
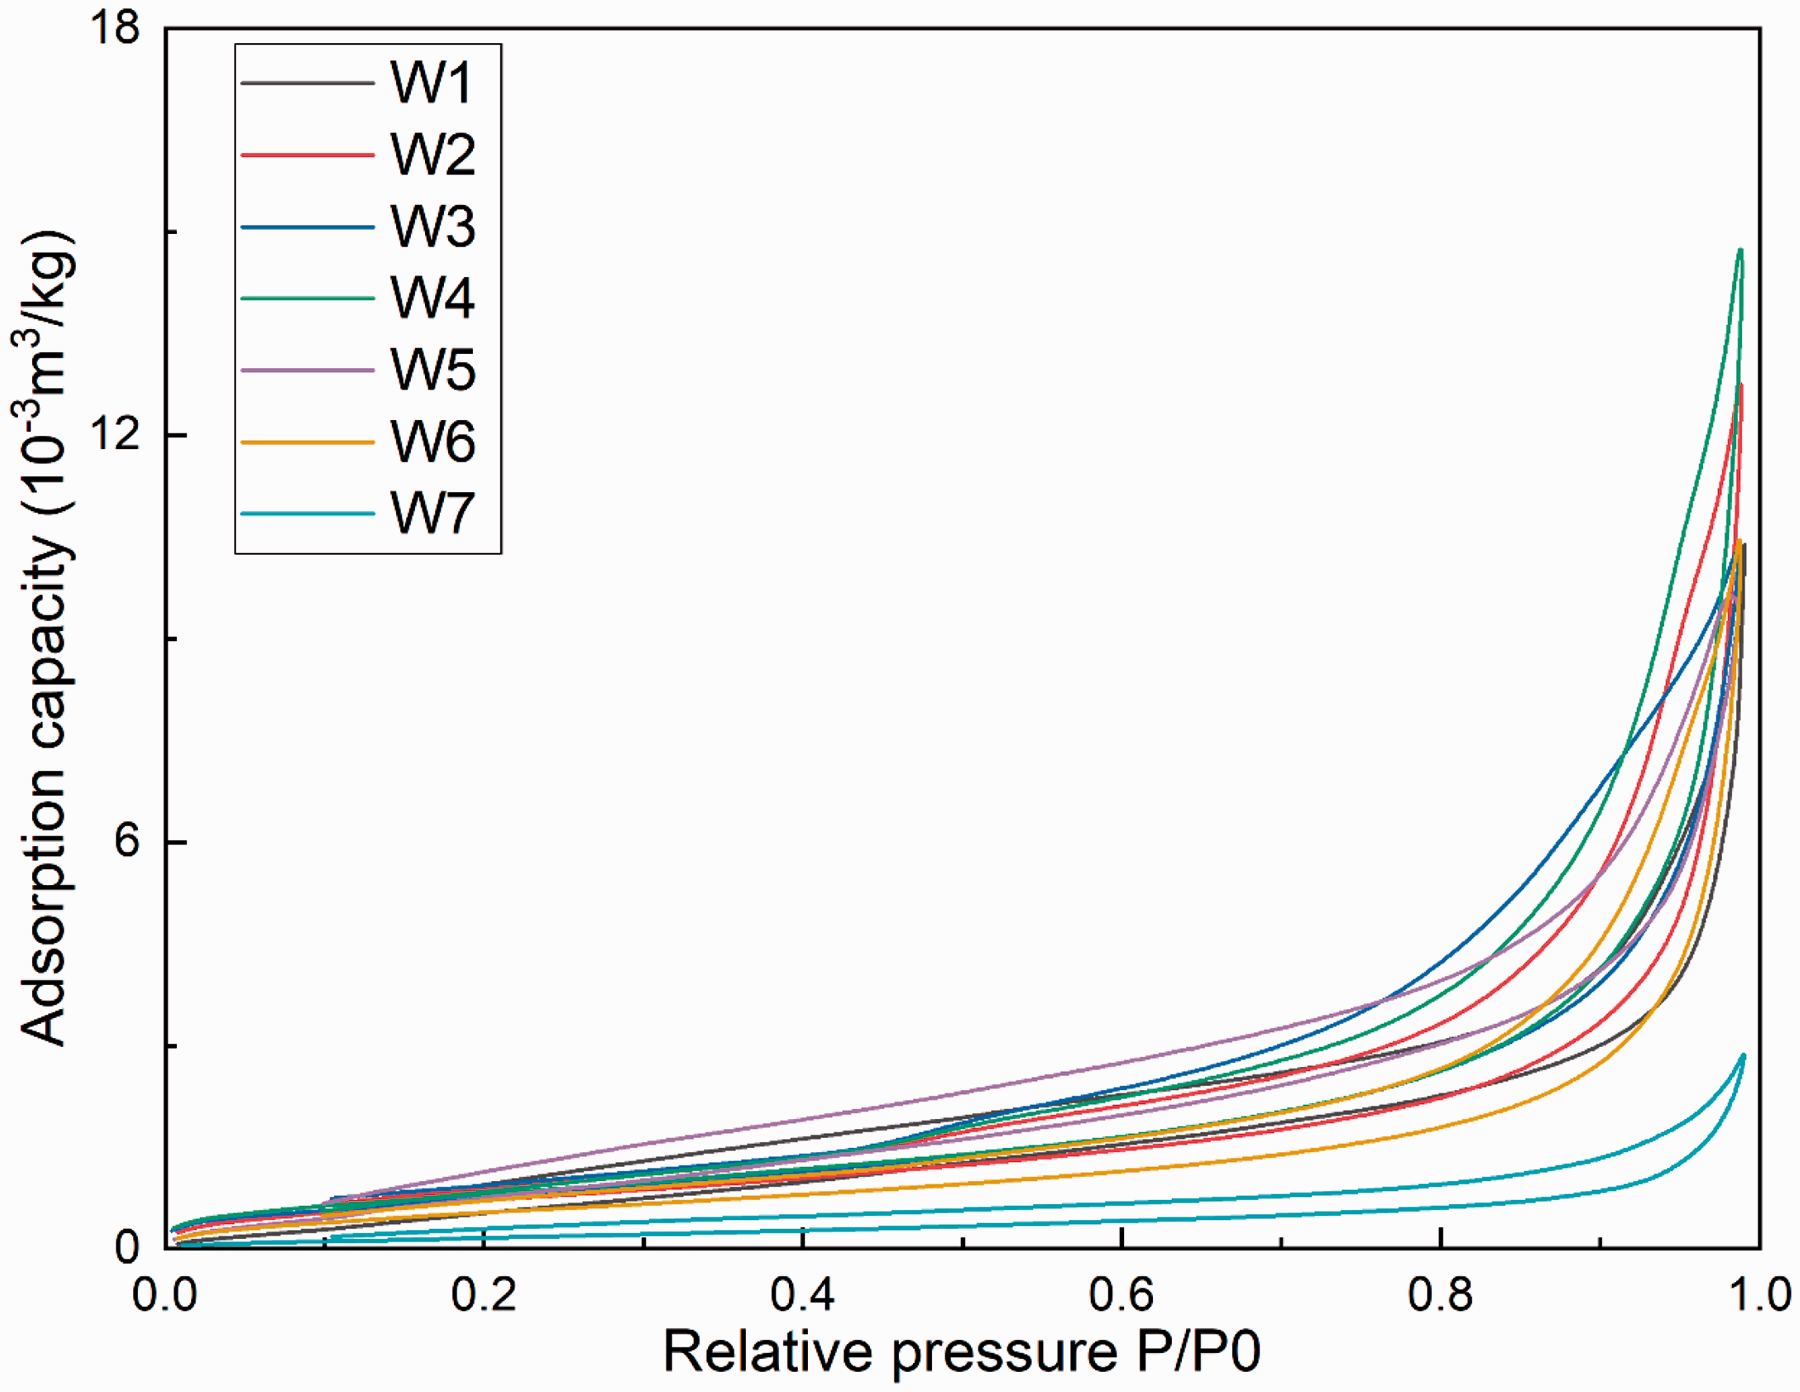
Isothermal nitrogen adsorption-desorption curves in the W zone.
At the temperature of liquid nitrogen (77 K), the adsorption capacity of nitrogen in rock samples depends on the relative pressure P/P0 (P is the partial pressure of nitrogen and P0 is the saturated vapor pressure of nitrogen at low temperature), which can be used to calculate the adsorption capacity of the samples. When P/P0 is lower than 0.05, the molecular number of adsorbed nitrogen cannot meet the requirements of multilayer adsorption, and it is difficult to establish an adsorption equilibrium state; in contrast, when P/P0 is higher than 0.35, the inner surface of the reservoir decreases due to capillary condensation, which hinders the increase in the number of multilayer physical adsorption layers.
With increasing test pressure, nitrogen condenses continuously from micropores to macropores. The corresponding nitrogen adsorption amount under relative pressure is recorded and converted into the corresponding pore volume according to the volume equivalent exchange principle. The relationship between pore throat radius and pore volume is obtained, and the pore size distribution and pore volume parameters of the sample are acquired.
To accurately determine the pore size distribution, specific surface area and pore volume, the samples were vacuumed before the tests to ensure that the adsorbed water and other adsorbed substances in the pore throat could be removed by high temperature without being oxidized. After the sample pretreatment, the experimental test process began: a certain mass of tight sandstone reservoir core sample was ground to 60 ∼ 80 mesh and placed in the sample tube. At low temperature, with the change in test partial pressure, the nitrogen adsorption and desorption amounts in the process of adsorption and desorption were obtained, and the nitrogen adsorption-desorption isothermal curves were plotted.
There are many theoretical models for calculating the specific surface area and pore size by the gas adsorption method. The main theoretical models of specific surface calculations include the single-layer adsorption theoretical model (Langmuir adsorption isotherm equation) and multilayer adsorption theoretical model (Brunauer-Emmett-Teller (BET) adsorption isotherm equation). In this paper, the standard method of measuring the specific surface area of a solid, namely, the BET adsorption isotherm equation, is selected to obtain the specific surface parameters. The main theoretical models of pore size calculation include the Barrett-Johner-Halenda (BJH) method based on the Kelvin equation under capillary condensation and the DFT method based on the equilibrium density distribution in pores. Different scholars have different opinions on the above methods. Because the BJH method is more mature and the accuracy of the test results is not different from that of the DFT method, it has been employed by many researchers.
The whole curve is an “anti-s” type, and adsorption loops are produced in all samples. When the relative pressure P/P0 is less than 0.4, the curve rises gently, and the adsorption capacity increases slowly, mainly by monolayer adsorption on the surface of the pore throat; when the relative pressure P/P0 exceeds 0.4, the curve begins to rise, the adsorption capacity continues to increase (when the relative pressure is approximately 0.45, some sample curves show significant decreases), and the main occurrence is multilayer adsorption on the pore throat surface and some pore throat hairs. When the relative pressure P/P0 reaches 0.9, the adsorption capacity increases linearly, and capillary condensation is the main phenomenon in this stage.
When the relative pressure is close to 1, that is, the equilibrium pressure P is close to the saturated vapor pressure P0, adsorption saturation does not occur. According to the International Union of Theoretical and Applied Chemistry (IUPAC) adsorption loop types, the adsorption loop is mainly type H3, corresponding to slot-shaped pores formed by lamellar particles. The results show that the types of adsorption loops and pore types from the nitrogen adsorption experiments on the tight sandstone reservoir in the Ordos Basin are basically the same, but the adsorption capacities of different areas and samples are obviously different.
According to the continuous distribution of pore throat volume (Figure 11), the distribution of pore throat volume has mainly a single peak, and only a few samples are bimodal. The half-width of the main peak is 60 nm, and the radius of the secondary peak is approximately 150 nm. The main pore throat radius of the single peak sample is basically consistent with that of the bimodal curve, and most pore throat radii are concentrated at 60 nm. The distribution of pore throats is relatively concentrated, and the reservoir space is provided by pore throat radii of 25 – 100 nm. The continuous distribution curve of pore area in the W area presents a reduced distribution, and the contributions of pore throats with different radii to the pore area is basically the same.
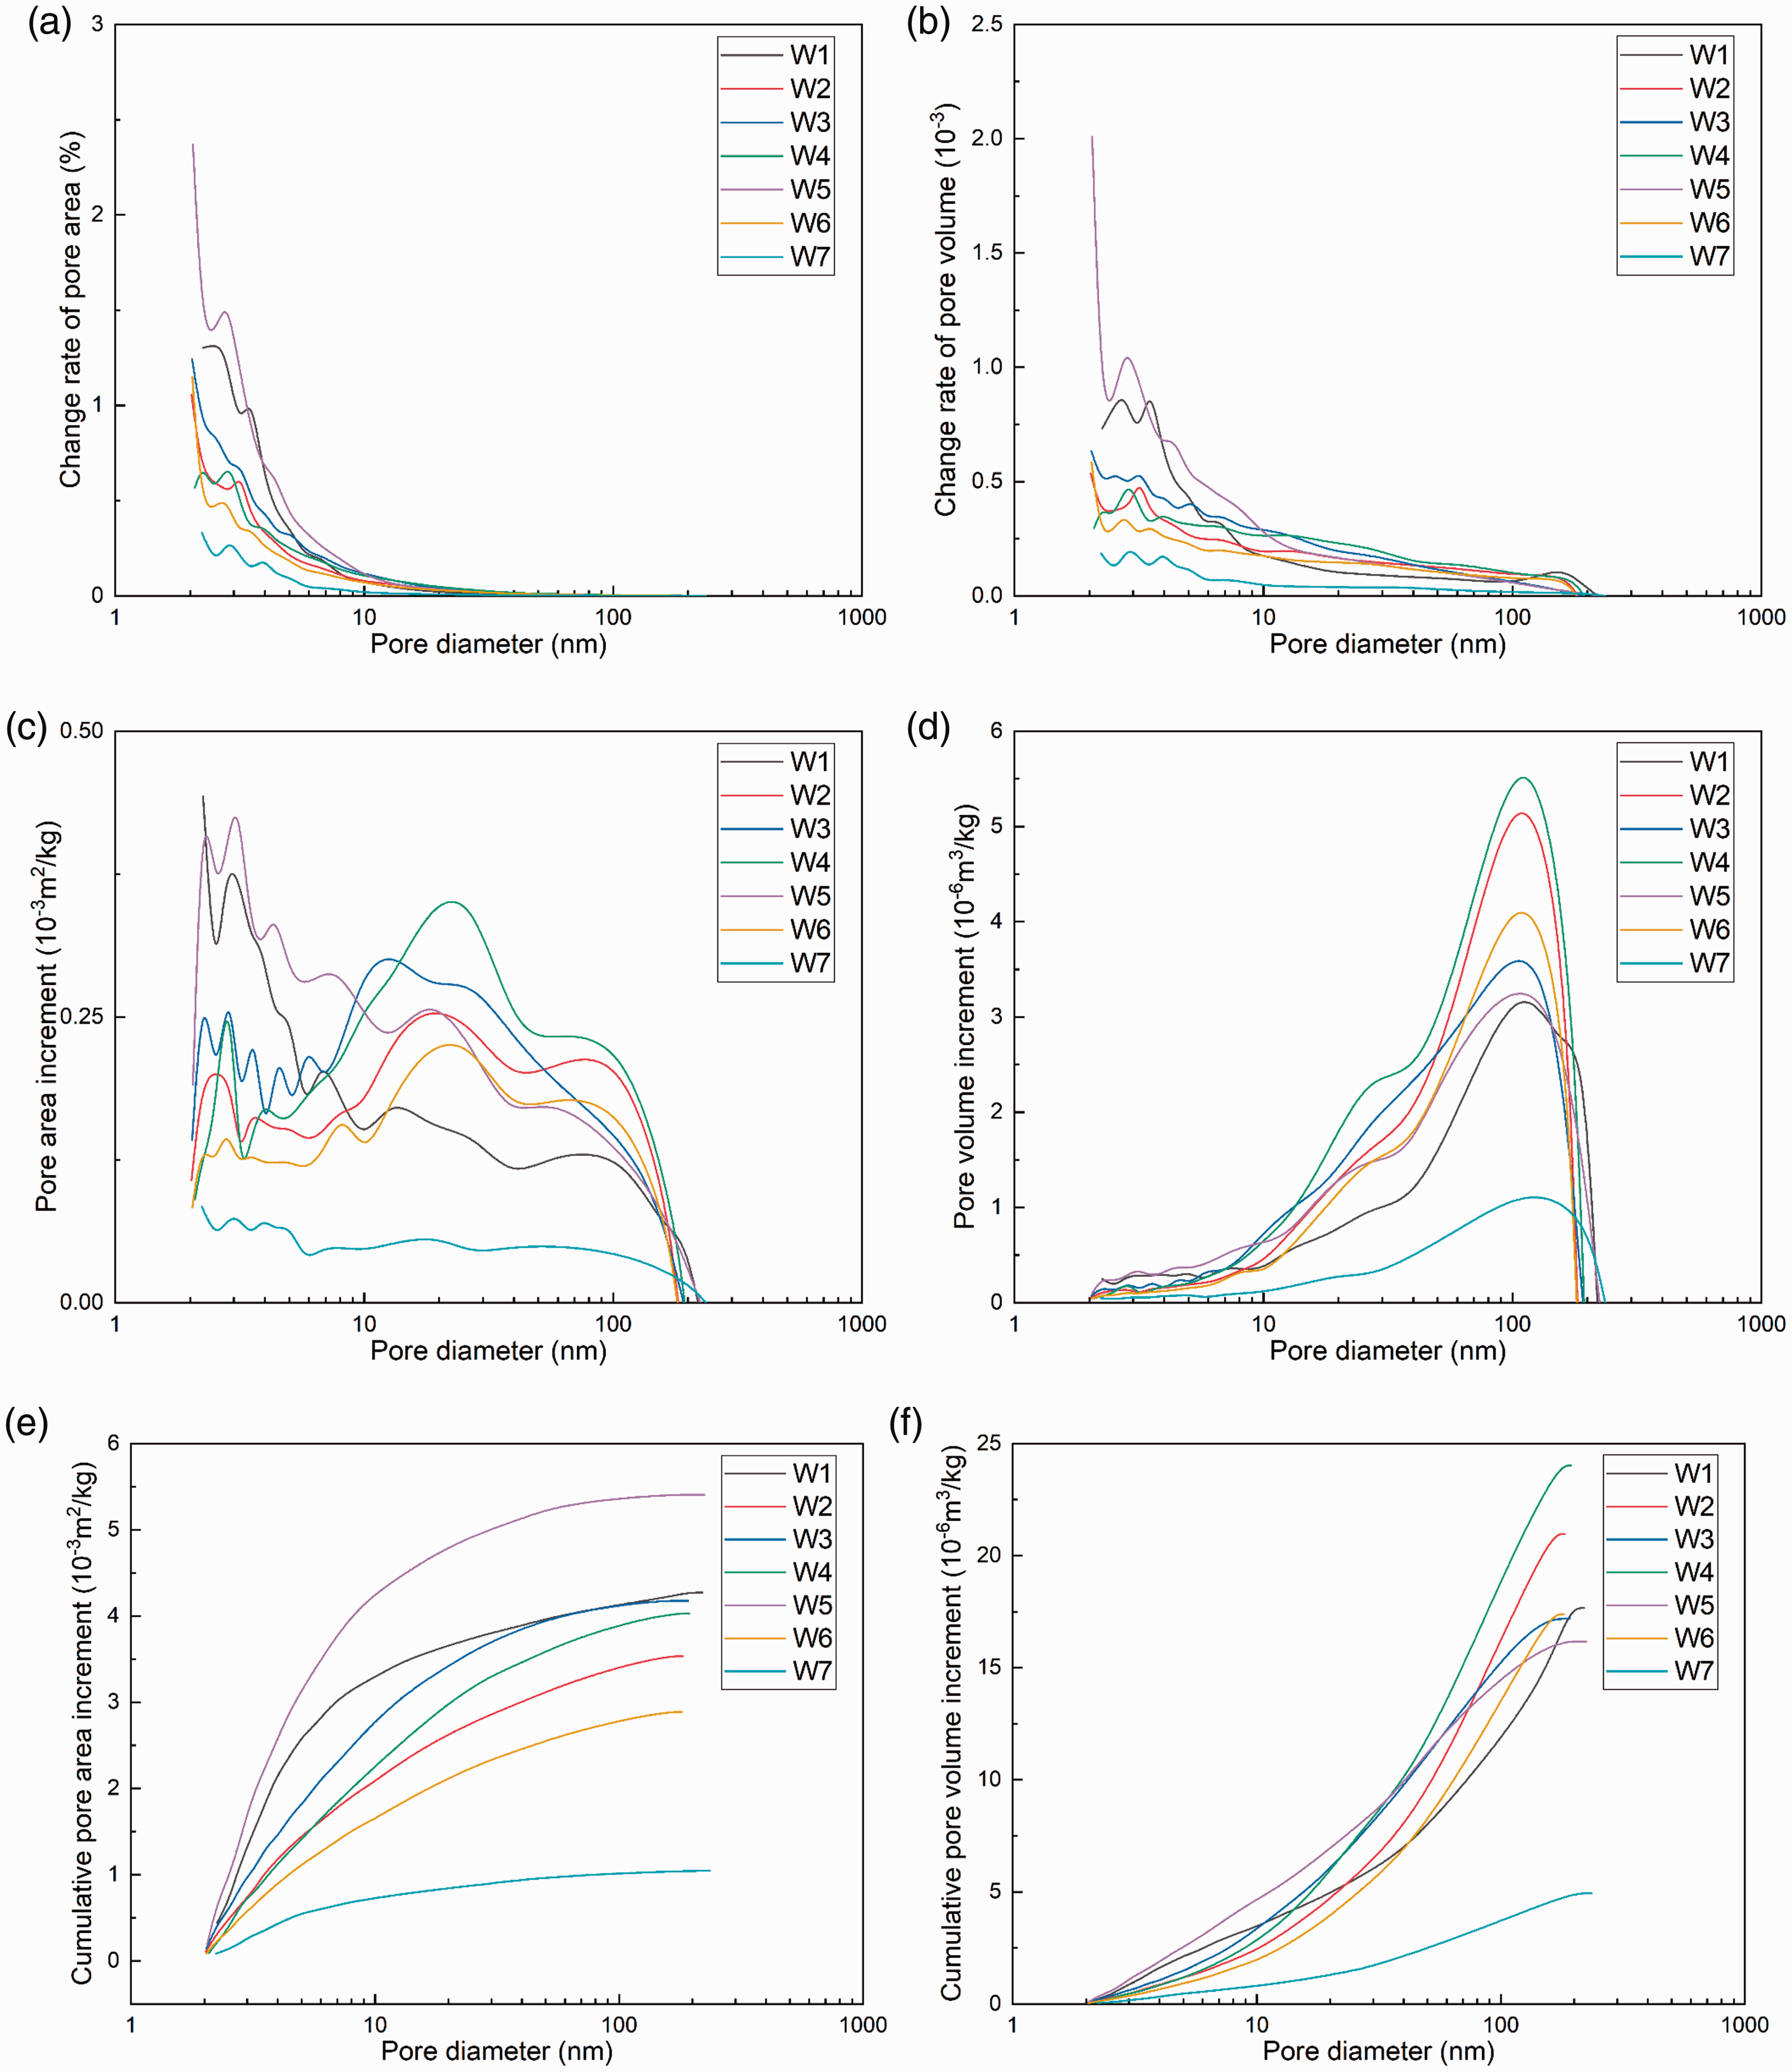
The relationships between pore diameter and pore area, pore volume change rate, increment and cumulative increment in the W area: (a) curve of pore diameter versus pore area change rate; (b) curve of pore diameter versus pore volume change rate; (c) curve of relationship between pore diameter and pore area increment; (d) curve of relationship between pore diameter and pore volume increment; (e) curve of relationship between cumulative pore area increment and pore diameter; (f) curve of relationship between cumulative pore volume increment and pore diameter.
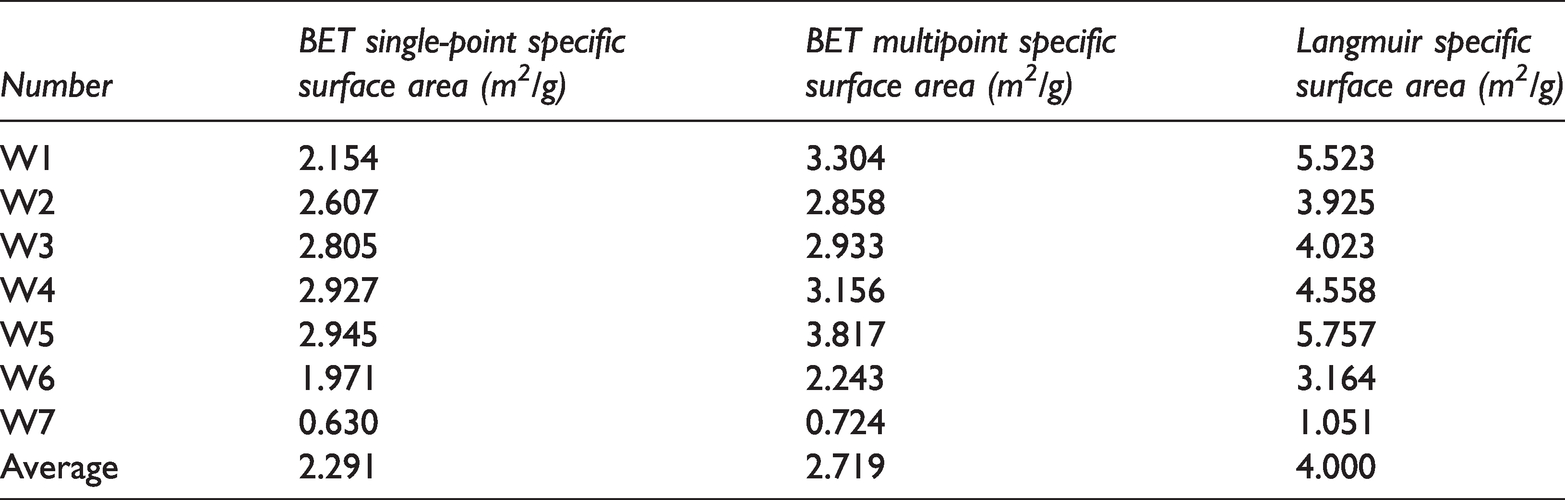
The Langmuir specific surface area, BET single-point specific surface area and BET multipoint specific surface area of the reservoir in the W area are calculated by a single-layer adsorption theoretical model (Langmuir adsorption isotherm equation) and a multilayer adsorption theoretical model (BET adsorption isotherm equation). Comparing the BET single-point specific surface area, BET multipoint specific surface area and Langmuir specific surface area of reservoirs in the W area (Table 4) shows that the Langmuir specific surface area varies from 1.051 m2/g to 5.757 m2/g, with an average of 4.000 m2/g. The single-point BET specific surface area and multipoint BET specific surface area change little; the single-point BET specific surface area ranges between 0.630 m2/g and 2.945 m2/g, with an average of 2.291 m2/g; the multipoint BET specific surface area varies between 0.724 and 3.817 m2/g, with an average of 2.719 m2/g, reflecting the tortuous and complex pore structure of the reservoir.
Quality evaluation based on gray correlation method
According to the boundary layer theory of reservoir pore throat fluid (Xie et al., 2002) and to oilfield development and production practice, crude oil in reservoir spaces with pore throat radii greater than or equal to 100 nm in tight sandstone reservoirs is easily used in the development process, and the recovery degree is high; the crude oil production degree in reservoir spaces with radii less than 100 nm is low (Zhang et al., 2017; Zou et al., 2012). The frequency and volume ratio parameters of micro/nanopore throat continuous distribution curves are introduced to optimize the commonly used reservoir evaluation indexes. The comprehensive evaluation factors of reservoirs are calculated by the gray correlation analysis method, and the reservoirs are divided into two types: good or poor.
The ratio of the effective pore throat frequency of movable oil is defined as the ratio of the pore throat frequency with radii greater than 100 nm to the total pore throat frequency of the rock in the continuous distribution curve of the pore throat frequency from high-pressure mercury injection experiments. The calculation formula (1) is listed.
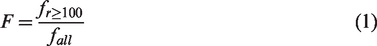

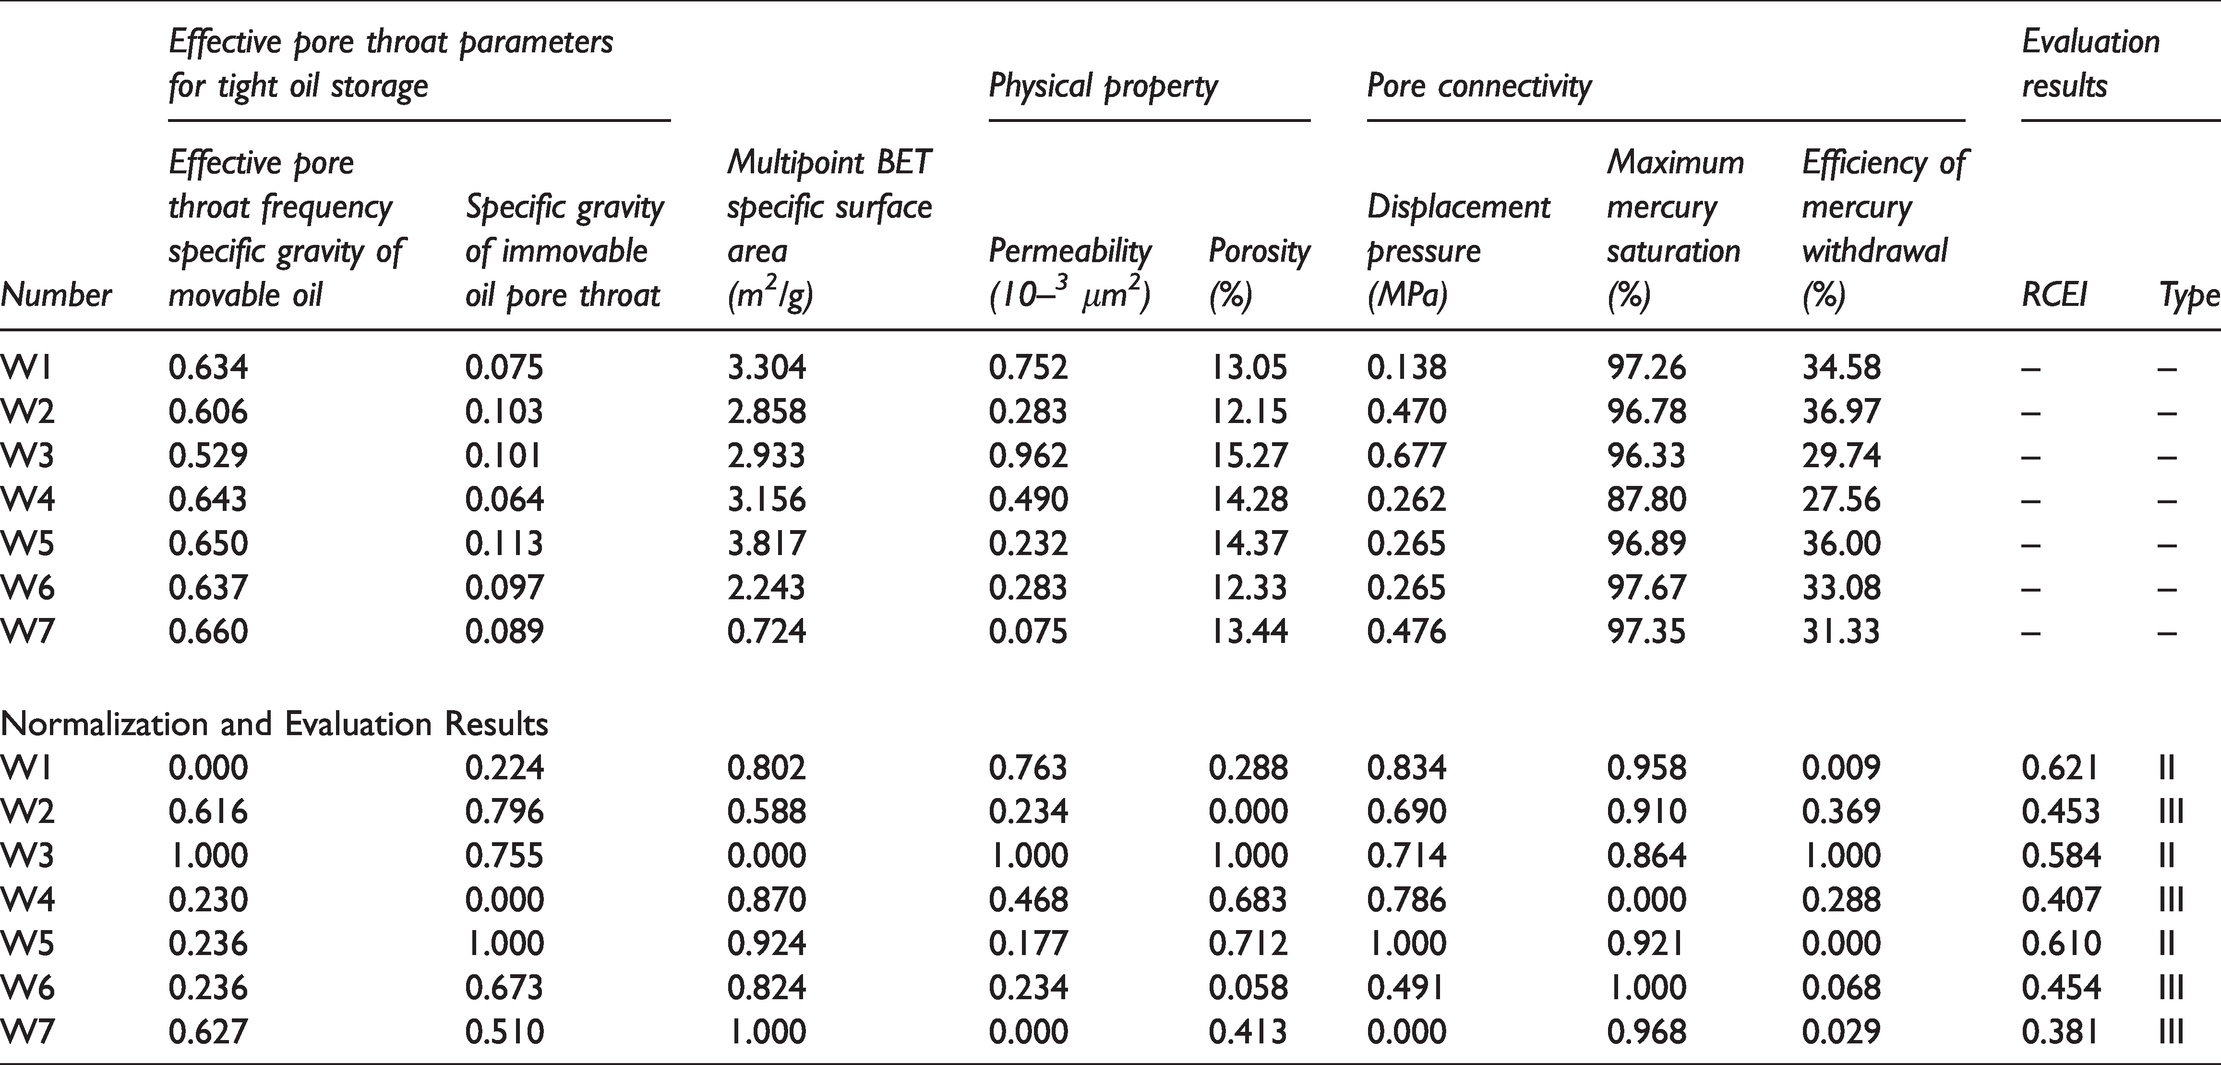
To improve the evaluation accuracy, the effective pore throat frequency parameter F, irreducible pore throat volume parameter V, multipoint BET specific surface area, displacement pressure, maximum mercury saturation, mercury removal efficiency, porosity and permeability parameters are selected to calculate the weight coefficient for each parameter by the gray correlation method, and the reservoir comprehensive evaluation factor (RCEI) is then obtained. The reservoir can be divided into types I and II, which are good and poor, respectively. The effective pore throat frequency specific gravity F of movable oil and the volume specific gravity of bound oil pore throat V are selected as the evaluation parent sequence 
The irreducible oil pore throat volume parameter V, multipoint BET specific surface area, displacement pressure, maximum mercury saturation, mercury removal efficiency, porosity and permeability are selected as evaluation subsequences 
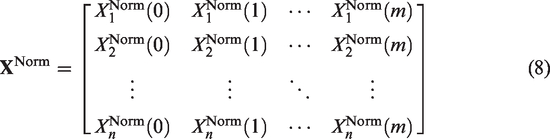
The original data matrix 
The permeability, porosity, maximum pore throat radius, median pore throat radius, average pore throat radius, maximum mercury saturation, mercury removal efficiency and effective pore throat frequency specific gravity parameter f of movable oil are positively correlated with reservoir properties; that is, the above indexes are all positive evaluation parameters. The displacement pressure, median pressure, multipoint BET specific surface area and irreducible oil pore throat volume specific gravity parameter are negatively correlated with reservoir quality. The correlation relationship is a reverse evaluation parameter. Therefore, the negative normalization method (6) is used for the reverse evaluation parameters, and the positive normalization method (7) is used for the normalization processing of the positive indicators to eliminate the errors caused by the different physical meanings and units of the original data of each evaluation index. A new matrix 

The absolute difference 
The sum of the secondary differences 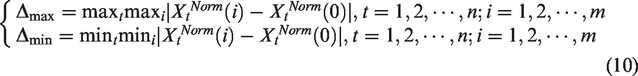
To reduce the error between the secondary difference 
The gray correlation coefficient between each subfactor and the permeability parameters is obtained. The gray correlation degree 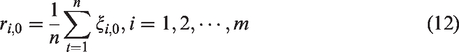

The larger the general weight coefficient
The weight coefficients corresponding to each evaluation index are calculated and sorted, and the correlation order among the evaluation indexes is obtained. The corresponding weight coefficients sorted from large to small are the movable oil effective pore throat frequency ratio parameter, multipoint BET specific surface, porosity, irreducible oil pore throat volume ratio parameter, maximum mercury saturation, mercury removal efficiency, displacement pressure, and permeability. Hence, in tight sandstone reservoir evaluation, the effective pore throat frequency parameter f of movable oil is the best parameter, and the permeability weight coefficient is lower than those of other parameters. The importance of permeability is different under different evaluation methods of tight sandstone reservoirs. The RCEI is defined on the basis of the weight coefficient 
Reservoir evaluation has progressed from single parameter qualitative classification to multiparameter coupled comprehensive quantitative evaluation. Hu et al. classified the tight sandstone reservoirs of the Upper Triassic Xujiahe Formation in the western Sichuan Basin into 4 types according to their physical properties and intensities of dissolution and fracturing (Hu et al., 2006). Cang et al. combined quantitative parameters such as physical properties, face ratio, displacement pressure, median radius, maximum mercury saturation and mercury removal efficiency with qualitative parameters such as pore combination mode and sorting to classify the Lower Jurassic tight sandstone reservoirs in the Baka Basin into 3 types (Cang et al., 2010). Lai et al. divided the Chang 8 tight sandstone reservoirs into 4 types by introducing a comprehensive diagenetic coefficient on the basis of physical properties, face ratio and interstitial content. Reservoir evaluation has progressed from single parameter qualitative classification to multiparameter coupled comprehensive quantitative evaluation (Lai et al., 2014). Ren analyzed the relationship between the characteristics of micro/nanopore throats and physical properties and production using thin section scanning electron microscopy (SEM) and normal and high-pressure mercury injection. Moreover, the geological meaning of the aforementioned analysis was analyzed in detail (Ren, 2018).
Conclusions
In this paper, tight sandstone samples from the Chang 6 oil layer in the W area of the AS oilfield in the Ordos Basin are studied through a variety of methods, the petrological and physical characteristics of the reservoir are discussed, and the micro/nanopore throats of the reservoir are quantitatively characterized. The gray correlation method is introduced to evaluate the reservoir quality by calculating the weight coefficient of each evaluation parameter.
The pore throats of the reservoir in the study area are generally small, with continuous distributions from several nanometers to several microns. The horizontal section of mercury injection is not obvious, and the maximum mercury saturation is high. The nitrogen adsorption loop is mainly type H3, and the corresponding pore type is slot-shaped pores. The average specific surface area of the reservoir is large, and the pore throat structure is tortuous and complex. The continuous distribution curves of pore throats with radii greater than 4 nm is constructed by using high-pressure mercury injection experimental data. The continuous distribution curves of pore throats in the study area generally have double peaks, which can characterize the micro- and nanopore throat distribution characteristics more comprehensively than the average pore throat radius, sorting coefficient and median pressure; this process can compensate for the pore throat radius, which cannot be accurately measured by ordinary mercury injection. The limitation is that pore throat distributions with radii greater than 100 nm cannot be measured by interval and nitrogen adsorption. Eight parameters, including the effective pore throat frequency specific gravity parameter, irreducible pore throat volume specific gravity parameter V, multipoint BET specific surface area, displacement pressure, maximum mercury saturation, mercury removal efficiency, porosity and permeability, are optimized. The corresponding weight coefficients sorted from large to small are the movable oil effective pore throat frequency ratio parameter, multipoint BET specific surface, porosity, irreducible oil pore throat volume ratio parameter, maximum mercury saturation, mercury removal efficiency, displacement pressure, and permeability. The comprehensive evaluation standard of reservoir quality in this area is determined by the gray correlation analysis method, and the reservoir comprehensive evaluation indicator (RCEI) is established. The results show that the tight sandstone reservoirs in the W area of the AS oilfield are mainly types II and III. The gray analysis method based on multiple parameters proposed in this paper can also be used to evaluate the quality of shale gas and other unconventional reservoirs after slight modification.
Data availability
The data used to support the findings of this study are included within the article.
Supplemental Material
sj-pdf-1-eea-10.1177_0144598721998510 - Supplemental material for A reservoir quality evaluation approach for tight sandstone reservoirs based on the gray correlation algorithm: A case study of the Chang 6 layer in the W area of the as oilfield, Ordos Basin
Supplemental material, sj-pdf-1-eea-10.1177_0144598721998510 for A reservoir quality evaluation approach for tight sandstone reservoirs based on the gray correlation algorithm: A case study of the Chang 6 layer in the W area of the as oilfield, Ordos Basin by Yuyang Liu, Xiaowei Zhang, Junfeng Shi, Wei Guo, Lixia Kang, Rongze Yu, Yuping Sun, Zhelin Wang and Mao Pan in Energy Exploration & Exploitation
Footnotes
Declaration of conflicting interests
The author(s) declared no potential conflicts of interest with respect to the research, authorship, and/or publication of this article.
Funding
The author(s) disclosed receipt of the following financial support for the research, authorship, and/or publication of this article: The work was supported by the funding of Major national science and technology projects of China (2016ZX05037-006–005) ‘Study on development characteristics of shale gas of China’, Major national science and technology projects of China (2016ZX05037-006) ‘Research of Shale gas development scale prediction and development model’ Major national science and technology projects of China (2016ZX05035-004) ‘Evaluation of shale gas industrial production area and Study on main control factors of high Production’. We appreciate Springer Nature Author Services for linguistic assistance.
References
Supplementary Material
Please find the following supplemental material available below.
For Open Access articles published under a Creative Commons License, all supplemental material carries the same license as the article it is associated with.
For non-Open Access articles published, all supplemental material carries a non-exclusive license, and permission requests for re-use of supplemental material or any part of supplemental material shall be sent directly to the copyright owner as specified in the copyright notice associated with the article.