
Abstract
In order to reduce the restroom envelope energy consumption, one optimization method on basis of analyzing the influence of heat transfer coefficient on the performance of a prefabricated restroom envelope in a hot summer and cold winter zone was proposed. An energy-consuming model of prefabricated restroom in Nanjing is initially built based on Designer's Simulation Toolkit software. Subsequently, the effect of external walls, rooftops, external windows with various thermal characteristics on the building envelope is analyzed respectively. Simultaneously, a method that only changes the heat transfer coefficient of the prefabricated restroom envelope while keeping other parameters unchanged is adopted. Results show that, for a prefabricated restroom, the optimal range of heat transfer coefficient of the external wall, rooftop, and external window in hot summer and cold winter zone is 0.199∼0.22, 0.16∼0.19, and 3.0∼3.1 W/(m2·K), respectively. When the window-to-wall ratio is less than 0.2, the priority of the wall heat transfer coefficient on building energy consumption is higher than that of the rooftop heat transfer coefficient, simultaneously, the rooftop heat transfer coefficient has priority higher than window heat transfer coefficient. Thus, it is of great significance to optimize the design of the prefabricated restroom envelope in a hot summer and cold winter zone, which provides relative reference for thermal performance improvement of prefabricated restrooms.
Keywords
Introduction
At present, energy issues have become the top priority of all countries. Building energy consumption in all countries accounts for a high proportion of national energy consumption, which is about 33% (Liu et al., 2019a). The development of the construction industry has been greatly promoted, which is caused by the rapid economic development and continuous advancement of urbanization (Zhao et al., 2017). It is urgent to save building energy consumption, especially in a HSCW (hot summer and cold winter) zone, which has a significant impact on building (Tan et al., 2020). HSCW zone is a typical climate region in China, take Nanjing as an example, the temperature is high in summer and it feels stuffy, the temperature in winter is low, giving people a humid feeling(Lang, 2004). Therefore, it is difficult for existing buildings to simultaneously solve the problems of winter and summer (Danish et al., 2020). In 1986, China first proposed the first standards related to building energy efficiency, but it has always focus on residential buildings in the north (Dexuan and Shuyan, 2018). Therefore, a decentralized air conditioner has long been in a HSCW zone, as a result, the energy consumption has risen rapidly, and it accounts for more than 50% of the total energy consumption of public buildings (Ge et al., 2018). In 2005, the state stipulated that the energy-saving rate of buildings in the southern region of China was 13%, which means that the design of the envelope structure in the HSCW zone has entered a new stage (Liao et al., 2010). However, with the fast pace of life and the escalating comfort requirements, low-cost, easy-to-build prefabricated buildings emerged in the area (Yao et al., 2018). Therefore, the development of prefabrication systems is seen as a positive trend in achieving high performance building (Gao and Tian, 2020). The optimization concept of the envelope, namely the principle of passive architectural design, is to use clever design techniques and materials to achieve low energy consumption (Liu et al., 2019c). The envelope is an important channel for heat exchange inside and outside the building, generally, it can be effectively predicted by computer simulation methods (Mirante et al., 2014), such as Designer's Simulation Toolkit (DeST) software (Qian et al., 2011). Therefore, 11 ultra-low energy consumption buildings in the HSCW zone were investigated (Qun et al., 2019), and the thermal design parameters of their envelopes were sorted out to refine the common range of design parameters of the envelope, including heat transfer coefficient (K), the indoor thermal disturbance, the plane area of the building, window-to-wall ratio, etc. (Qun et al., 2019). The influence of the change of envelope performance on the energy demand of low-density buildings in HSCW zone was evaluated (Yang and Yiqun, 2020). The influence of building envelope and external window thermal performance on the load was studied, and according to the characteristics of the building, the effective energy saving measures were put forward (Peng et al., 2014). The idea that future buildings should pay more attention to passive cooling was proposed, which can reduce the demand for surplus energy (Su et al., 2020). However, there have been relatively few studies on the prefabricated restroom. In the context of the toilet revolution in China, it is of great practical significance to study the restroom as a public building (Cheng et al., 2018). Therefore, the impact of the envelope on the energy consumption of prefabricated restrooms is analyzed based on DeST. Firstly, this study analyzed the hourly temperature changes in a typical year and the solar radiation distribution throughout the year in Nanjing, then the benchmark model of prefabricated restrooms is established based on DeST software. At the same time, the correctness of the model is verified by comparing with the previous studies. Finally, the evaluation indicators of different types of building envelopes such as the annual cumulative heating load index, the annual cumulative cooling load index, the annual maximum heating load index, and the annual maximum cooling load index can be obtained. The building envelope of low-energy restrooms most suitable for HSCW zone is summarized, and the suitability of different design structures is analyzed.
Methodology
Physical model
The prefabricated restroom is in Nanjing City, Jiangsu Province, which is in the HSCW zone. As shown in Figure 1, it shows the meteorological parameters of the Nanjing area, including the hourly temperature changes in a typical year and the solar radiation distribution throughout the year. These data are obtained through Meteonorm software, which is a professional global weather data analysis software. The data packets of this software contain data from 7,750 weather stations around the world. The annual average solar radiation is 505.07 kJ/(h·m2) in Nanjing by calculation. The annual temperature fluctuation range is −5.49 ∼38.09°C, and the annual average temperature is 17.05°C.
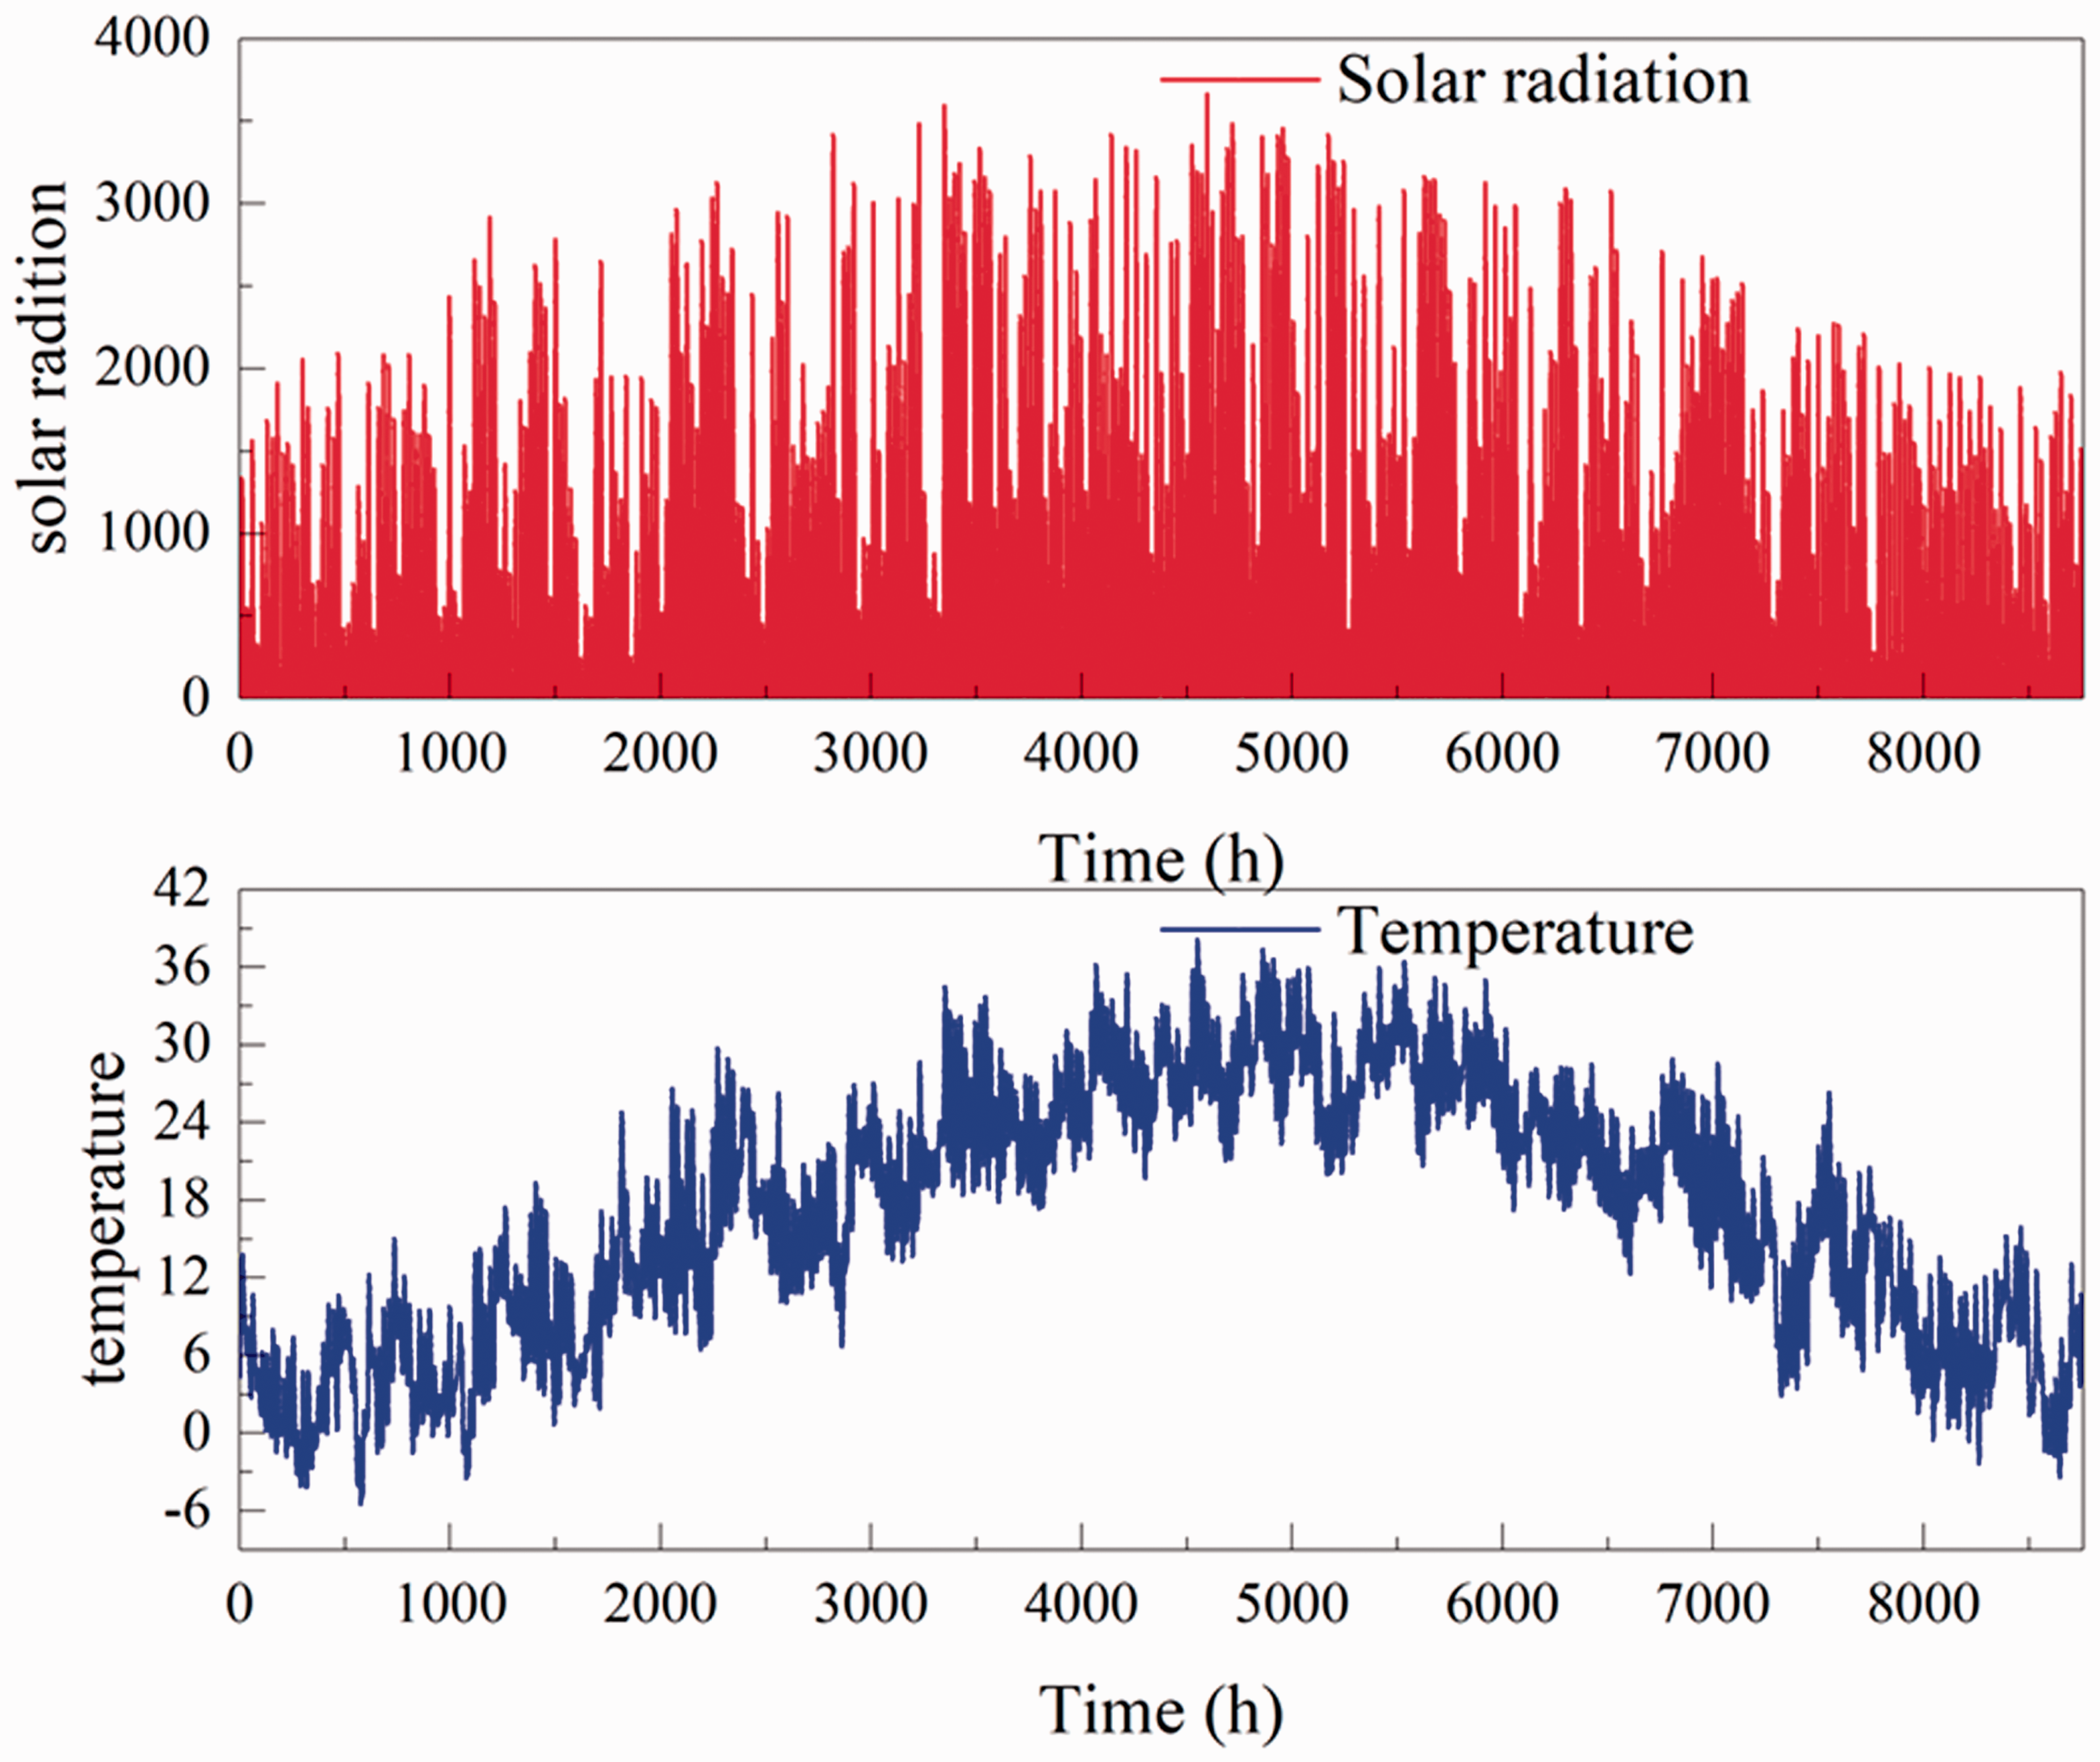
Meteorological parameters (data from: Meteonorm software).
Figure 2(a) shows a prefabricated restroom, whose area is 370.8 m2. The standard layer planning of the prefabricated restroom is shown in Figure 2(b). The envelope characteristics are shown in Table 1, which serves as the main parameter of the benchmark model. This study aims to establish the relationship between envelope and energy consumption by analysis of the influence of the envelope of the prefabricated restroom on buildings energy consumption.
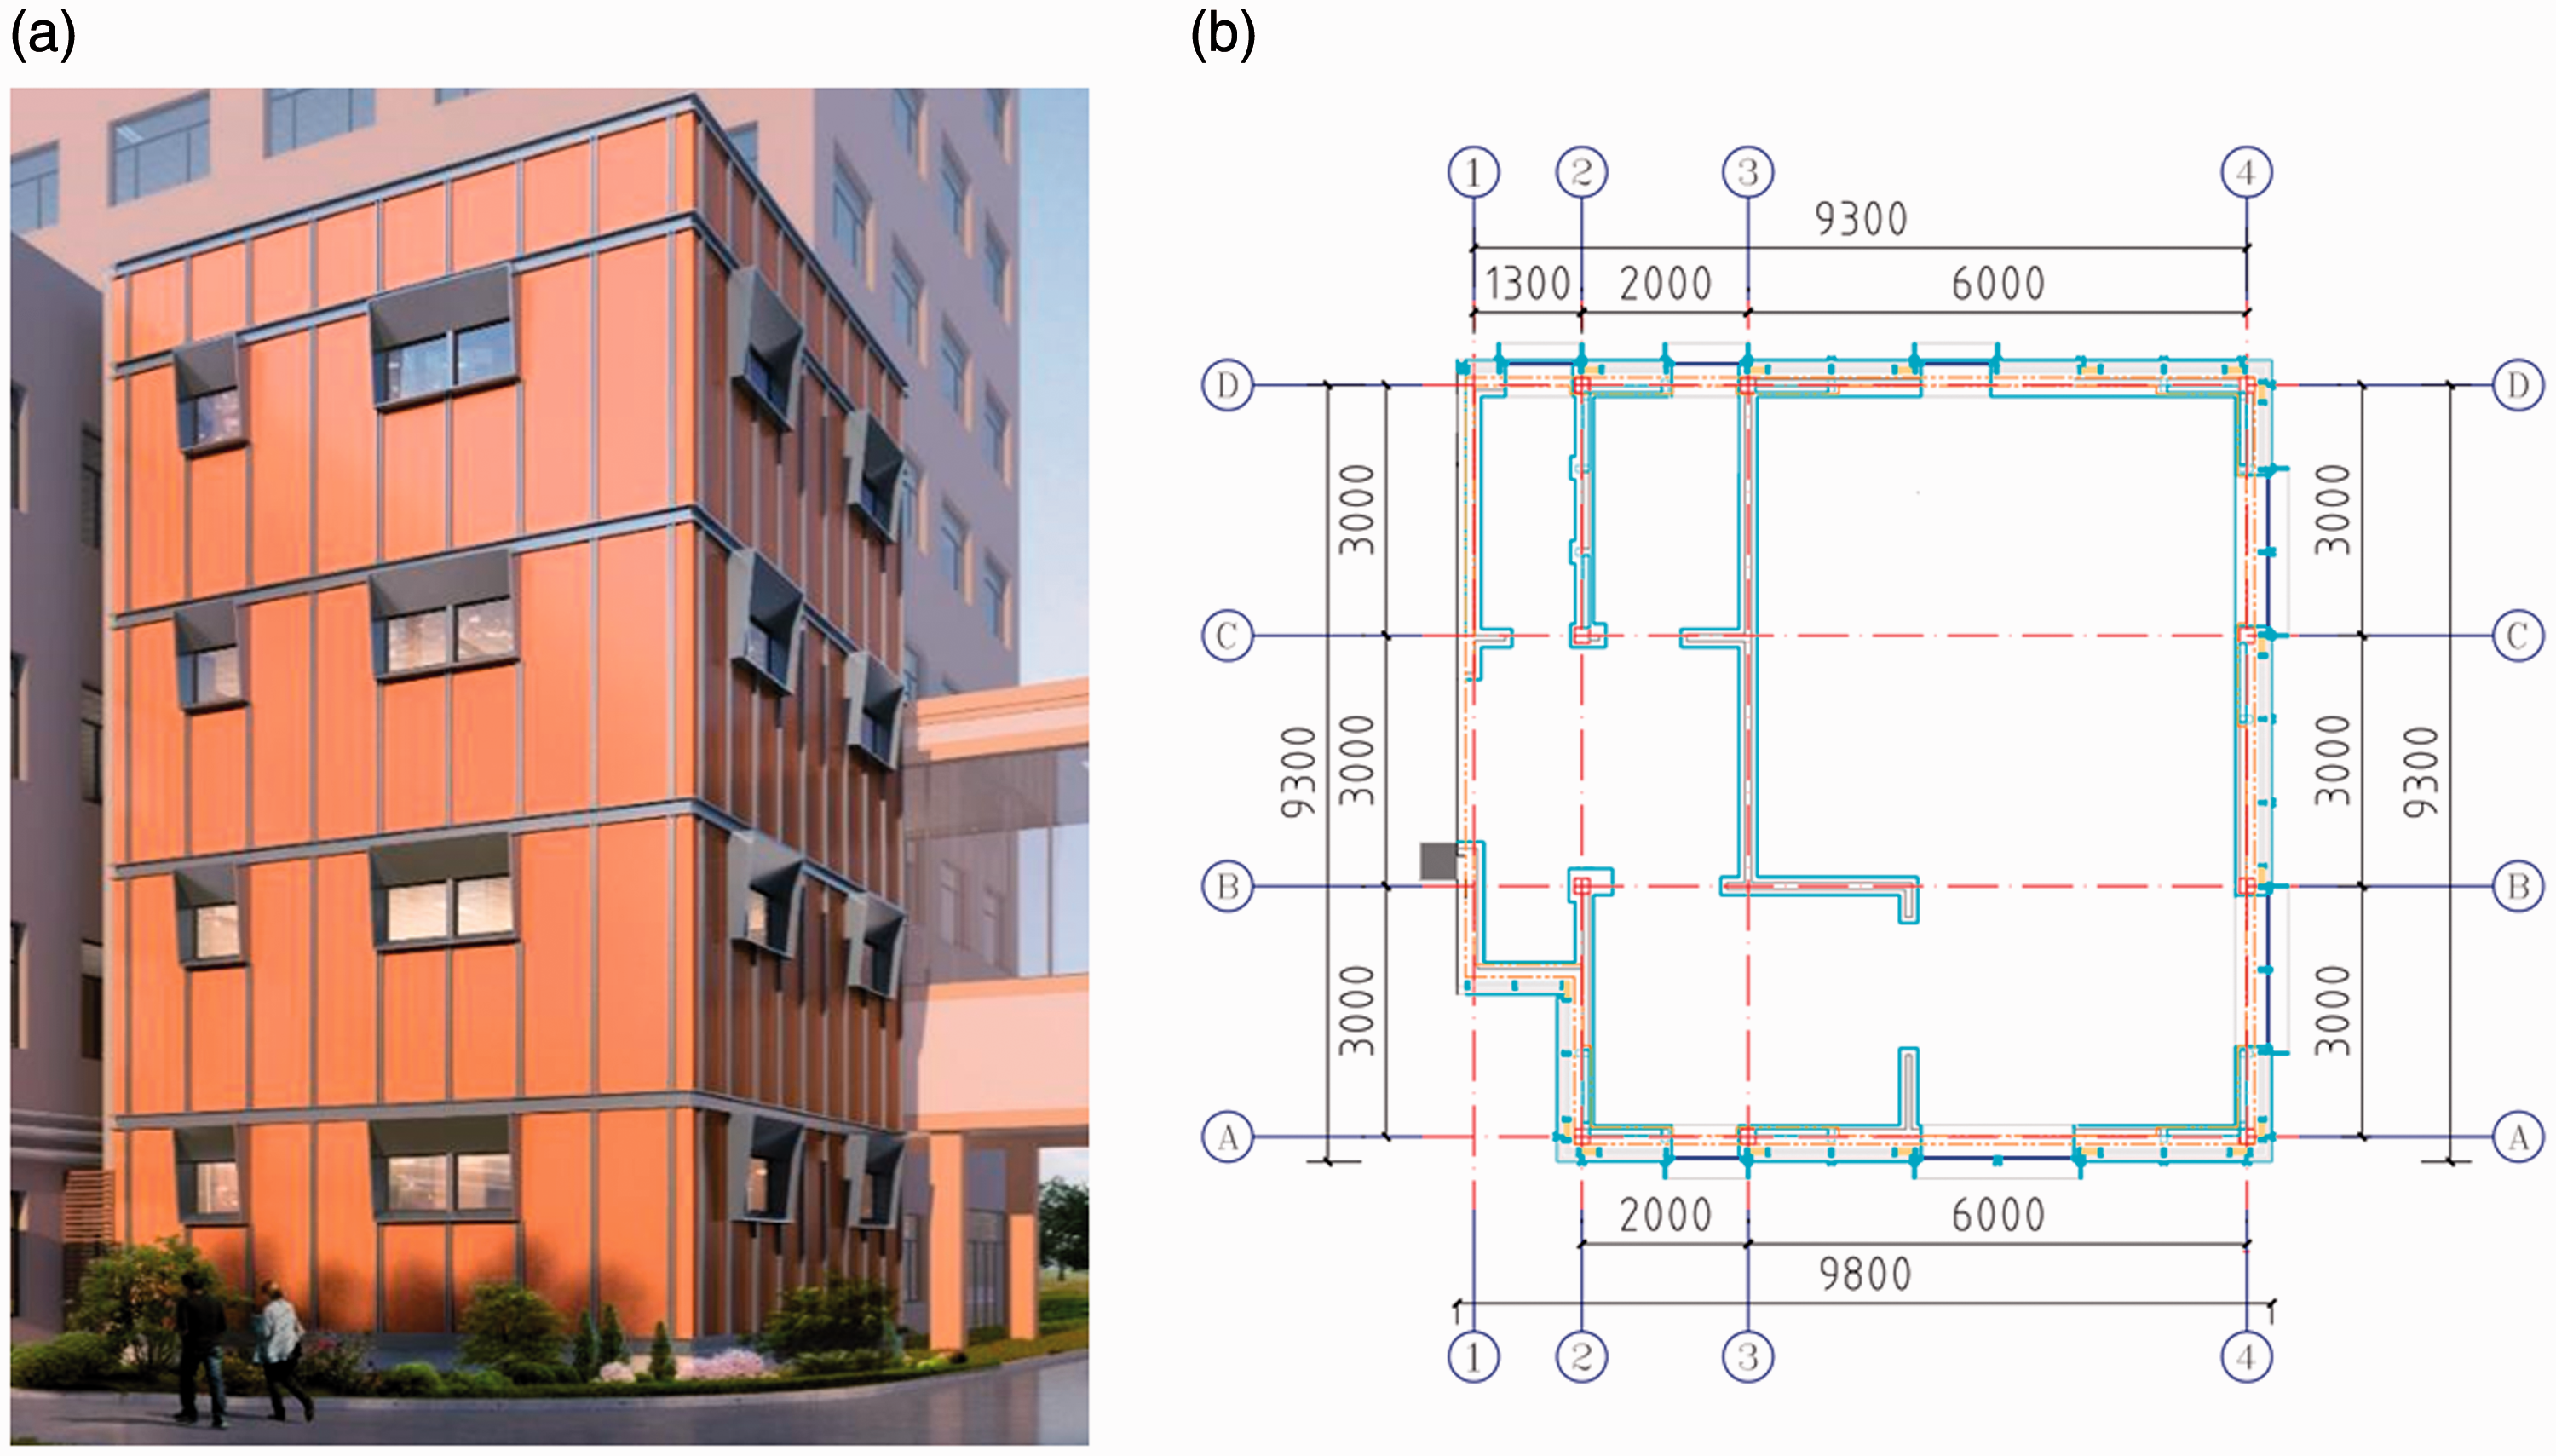
Renderings and standard layer planning of the prefabricated restroom. (a) Renderings of the building. (b) Standard layer planning.
The envelope characteristics of the benchmark model.
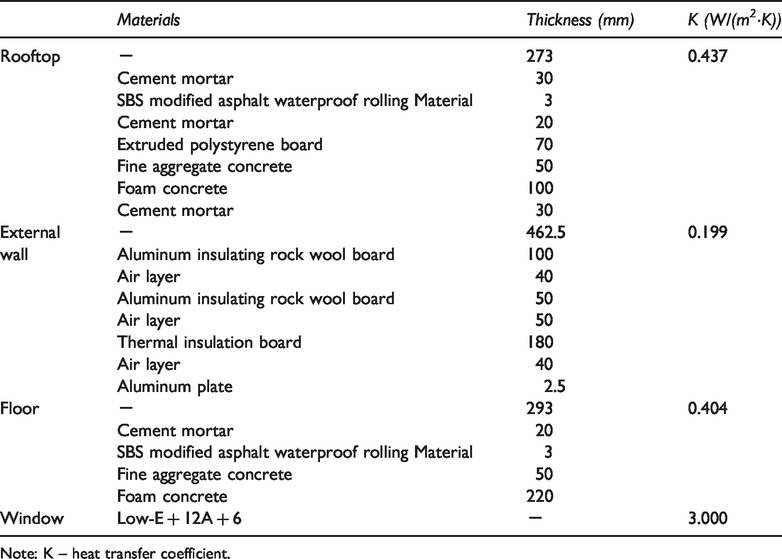
Note: K – heat transfer coefficient.
Simulation model and verification
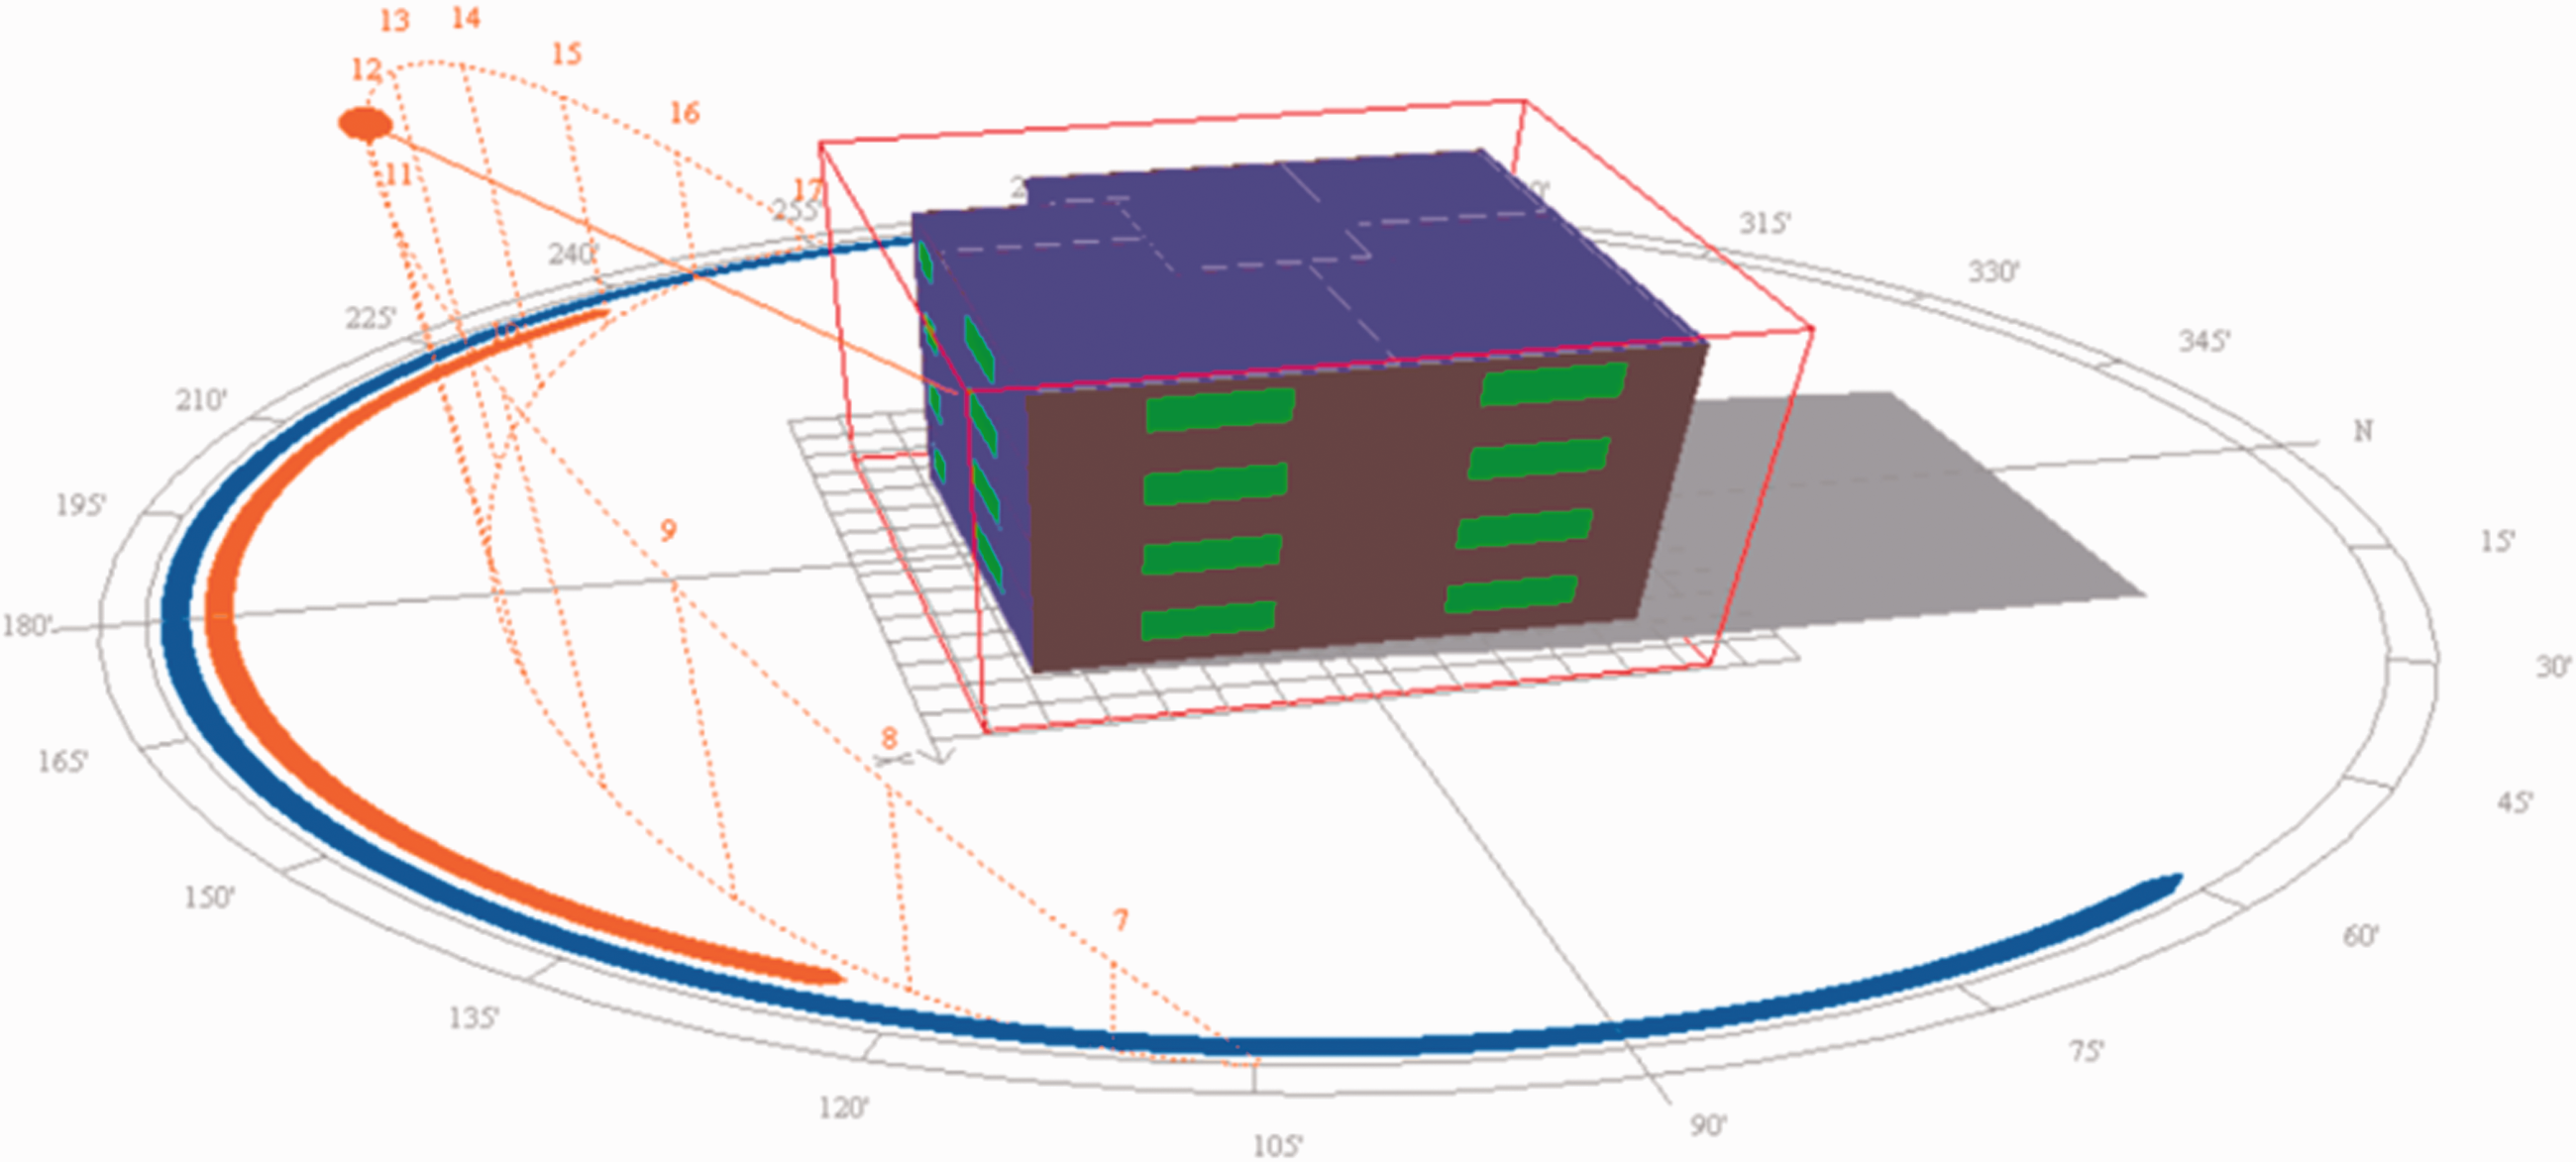
A simulation model of the initial building is built through DeST software, as shown in Figure 3, and indoor environmental parameters are set in accordance with the relevant provisions of the Design Standard for energy efficiency of public buildings (GB/T50189-2015). In addition, the setting of outdoor meteorological parameters is shown in Figure 1, and the setting of internal disturbance is shown in Figure 4. Based on the above data, the load results of the benchmark model can be obtained.
A simulation model of the building.
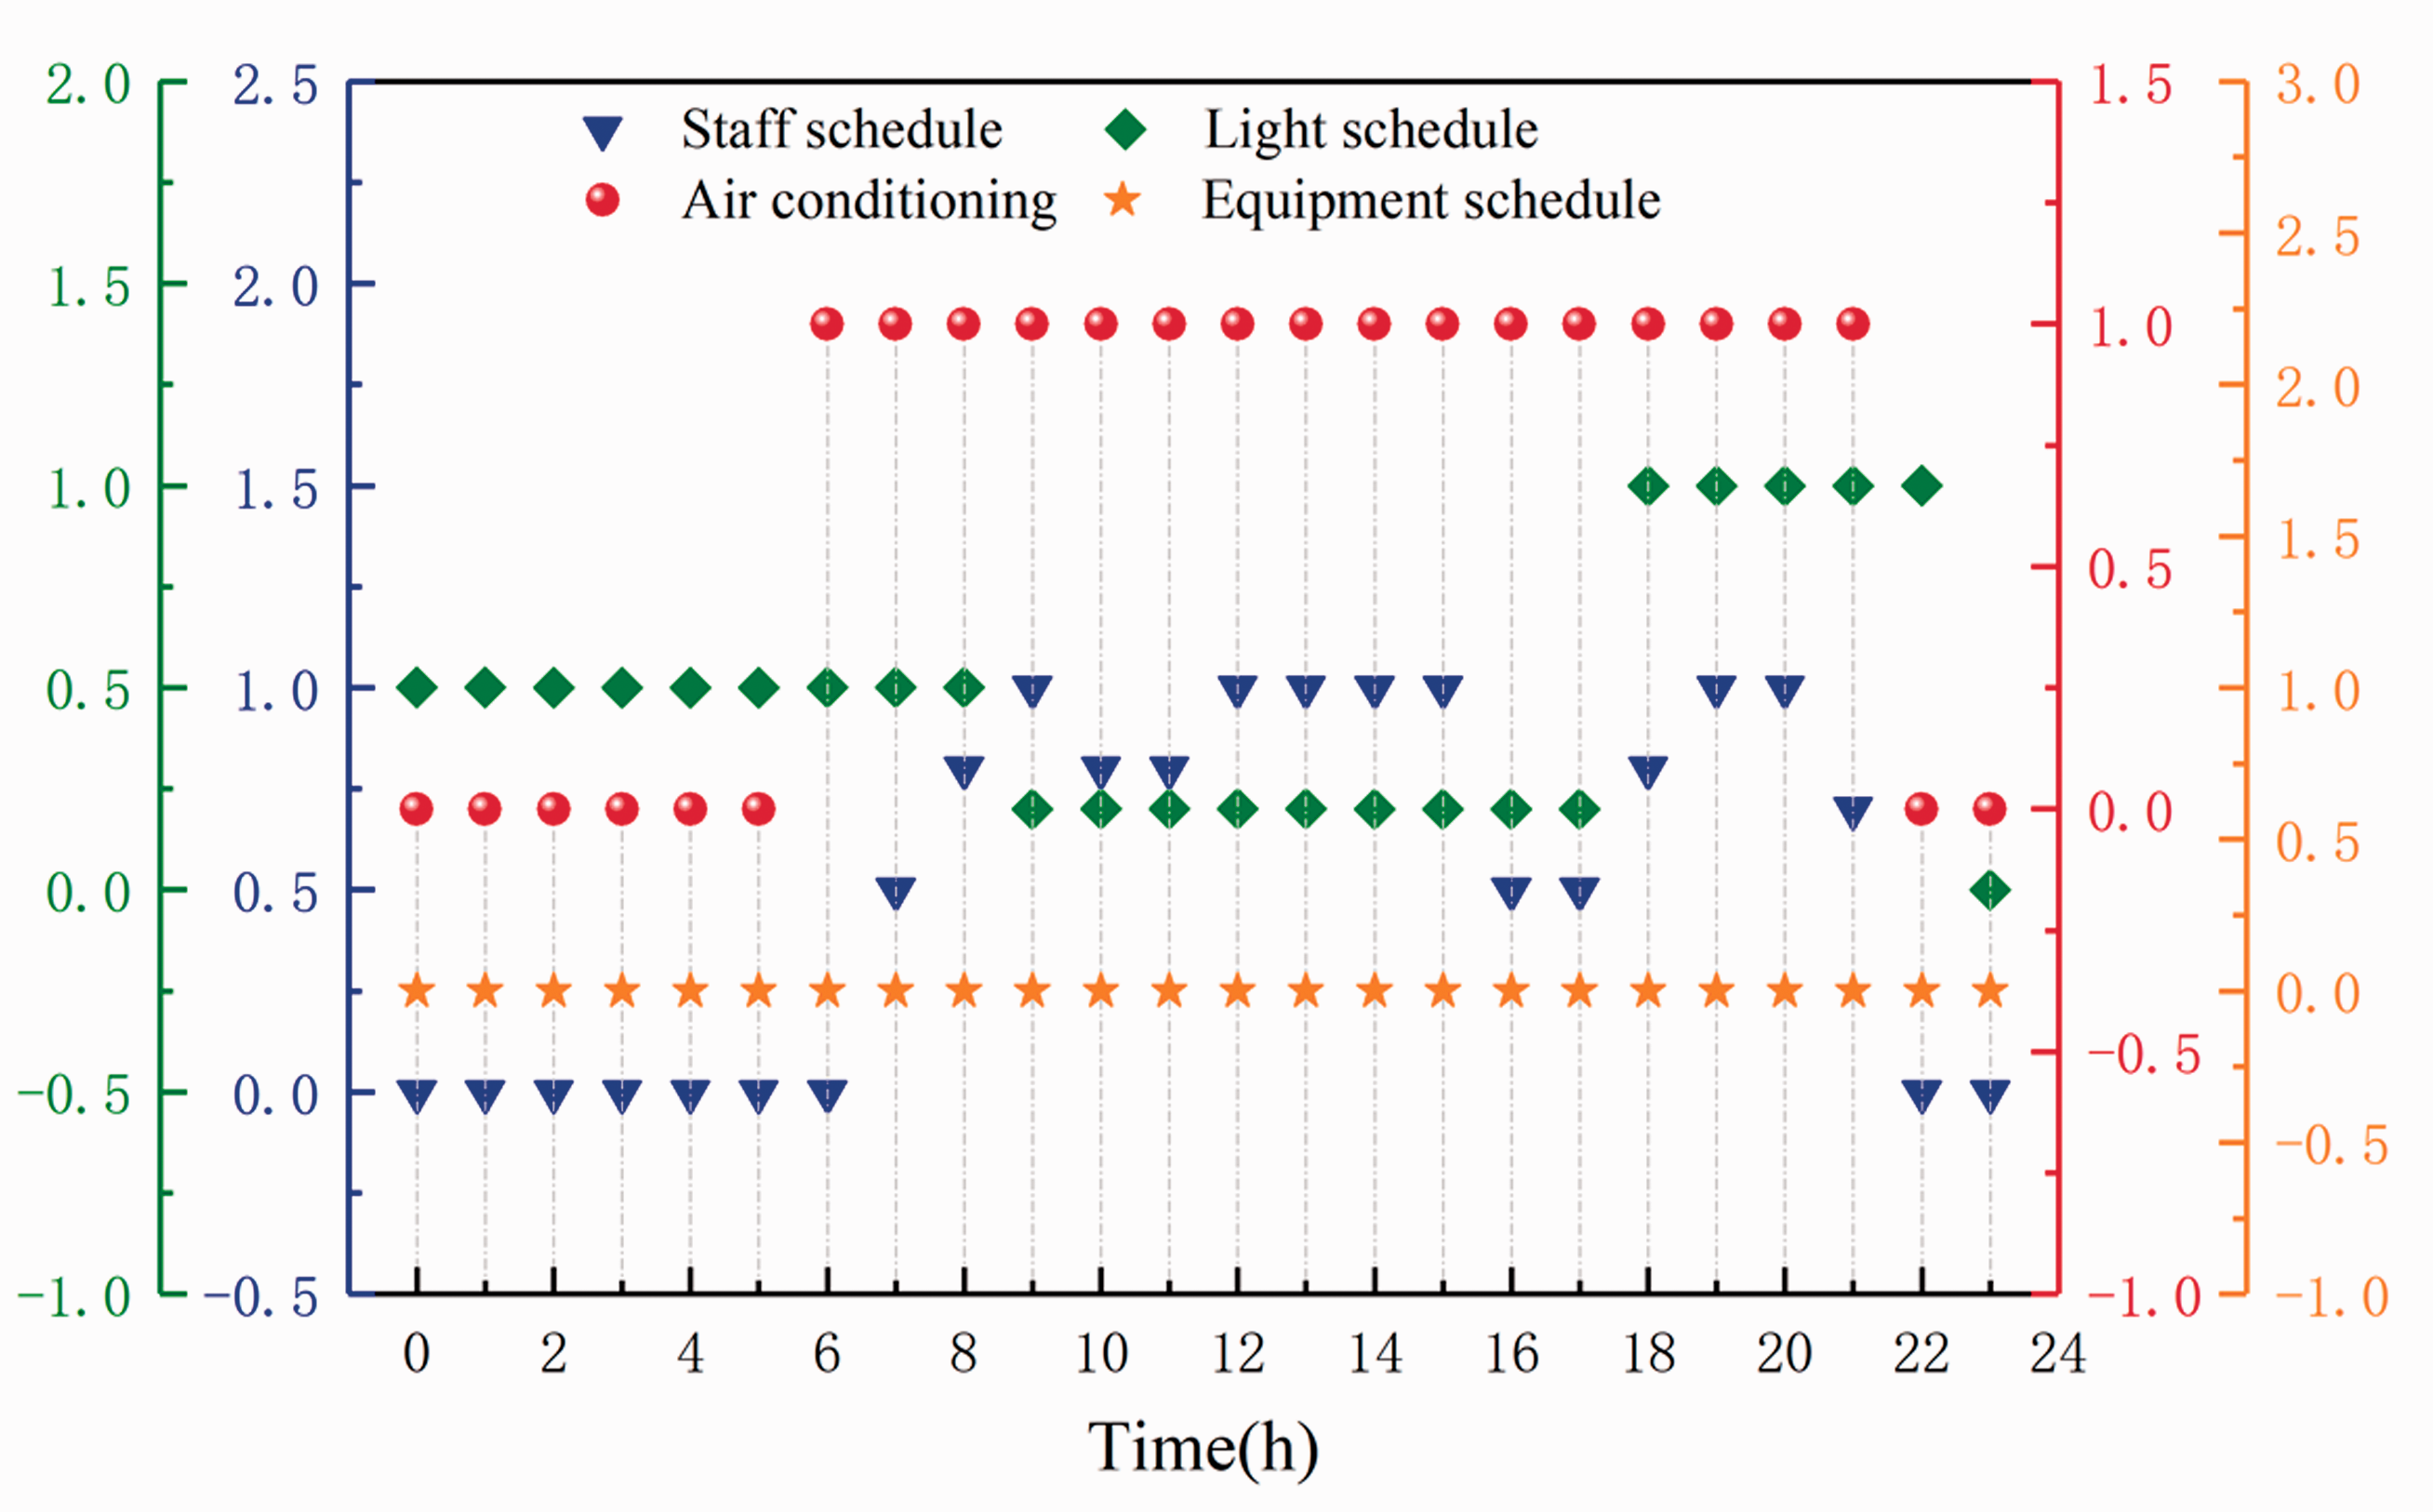
The setting of internal disturbance.
Based on the benchmark model, the parameters of the building envelope are changed by using a single variable control method. Simultaneously, to verify the model, another similar model is compared as a reference model. The area of the reference public building is 1,496.25 m2 (Hu and Wu, 2015). When the K of the building external wall, rooftop and external window is 0.199, 0.437, and 3.000 W/(m2·K), respectively, the annual cumulative heating load is 121.54, 134.71, and 148.41 kW·h/m2, respectively. However, the annual cumulative heating load of the benchmark model is only 31.83 kW·h/m2, which is more energy-efficient than the reference model. The energy-saving rate reaches 73.81%, 76.37%, and 78.55%, respectively, which had reached the design standard for energy efficiency of nearly zero energy building (Hu and Wu, 2015). Therefore, this prefabricated restroom benchmark model meets the requirement.
Therefore, evaluation indicators of different types of building envelopes such as the annual cumulative heating load index, the annual cumulative cooling load index, the annual maximum heating load index, and the annual maximum cooling load index can be obtained. The building envelope of the prefabricated restroom most suitable for the HSCW zone is summarized, and the suitability of different design structures is analyzed.
Results and discussions
Energy consumption analysis of external wall
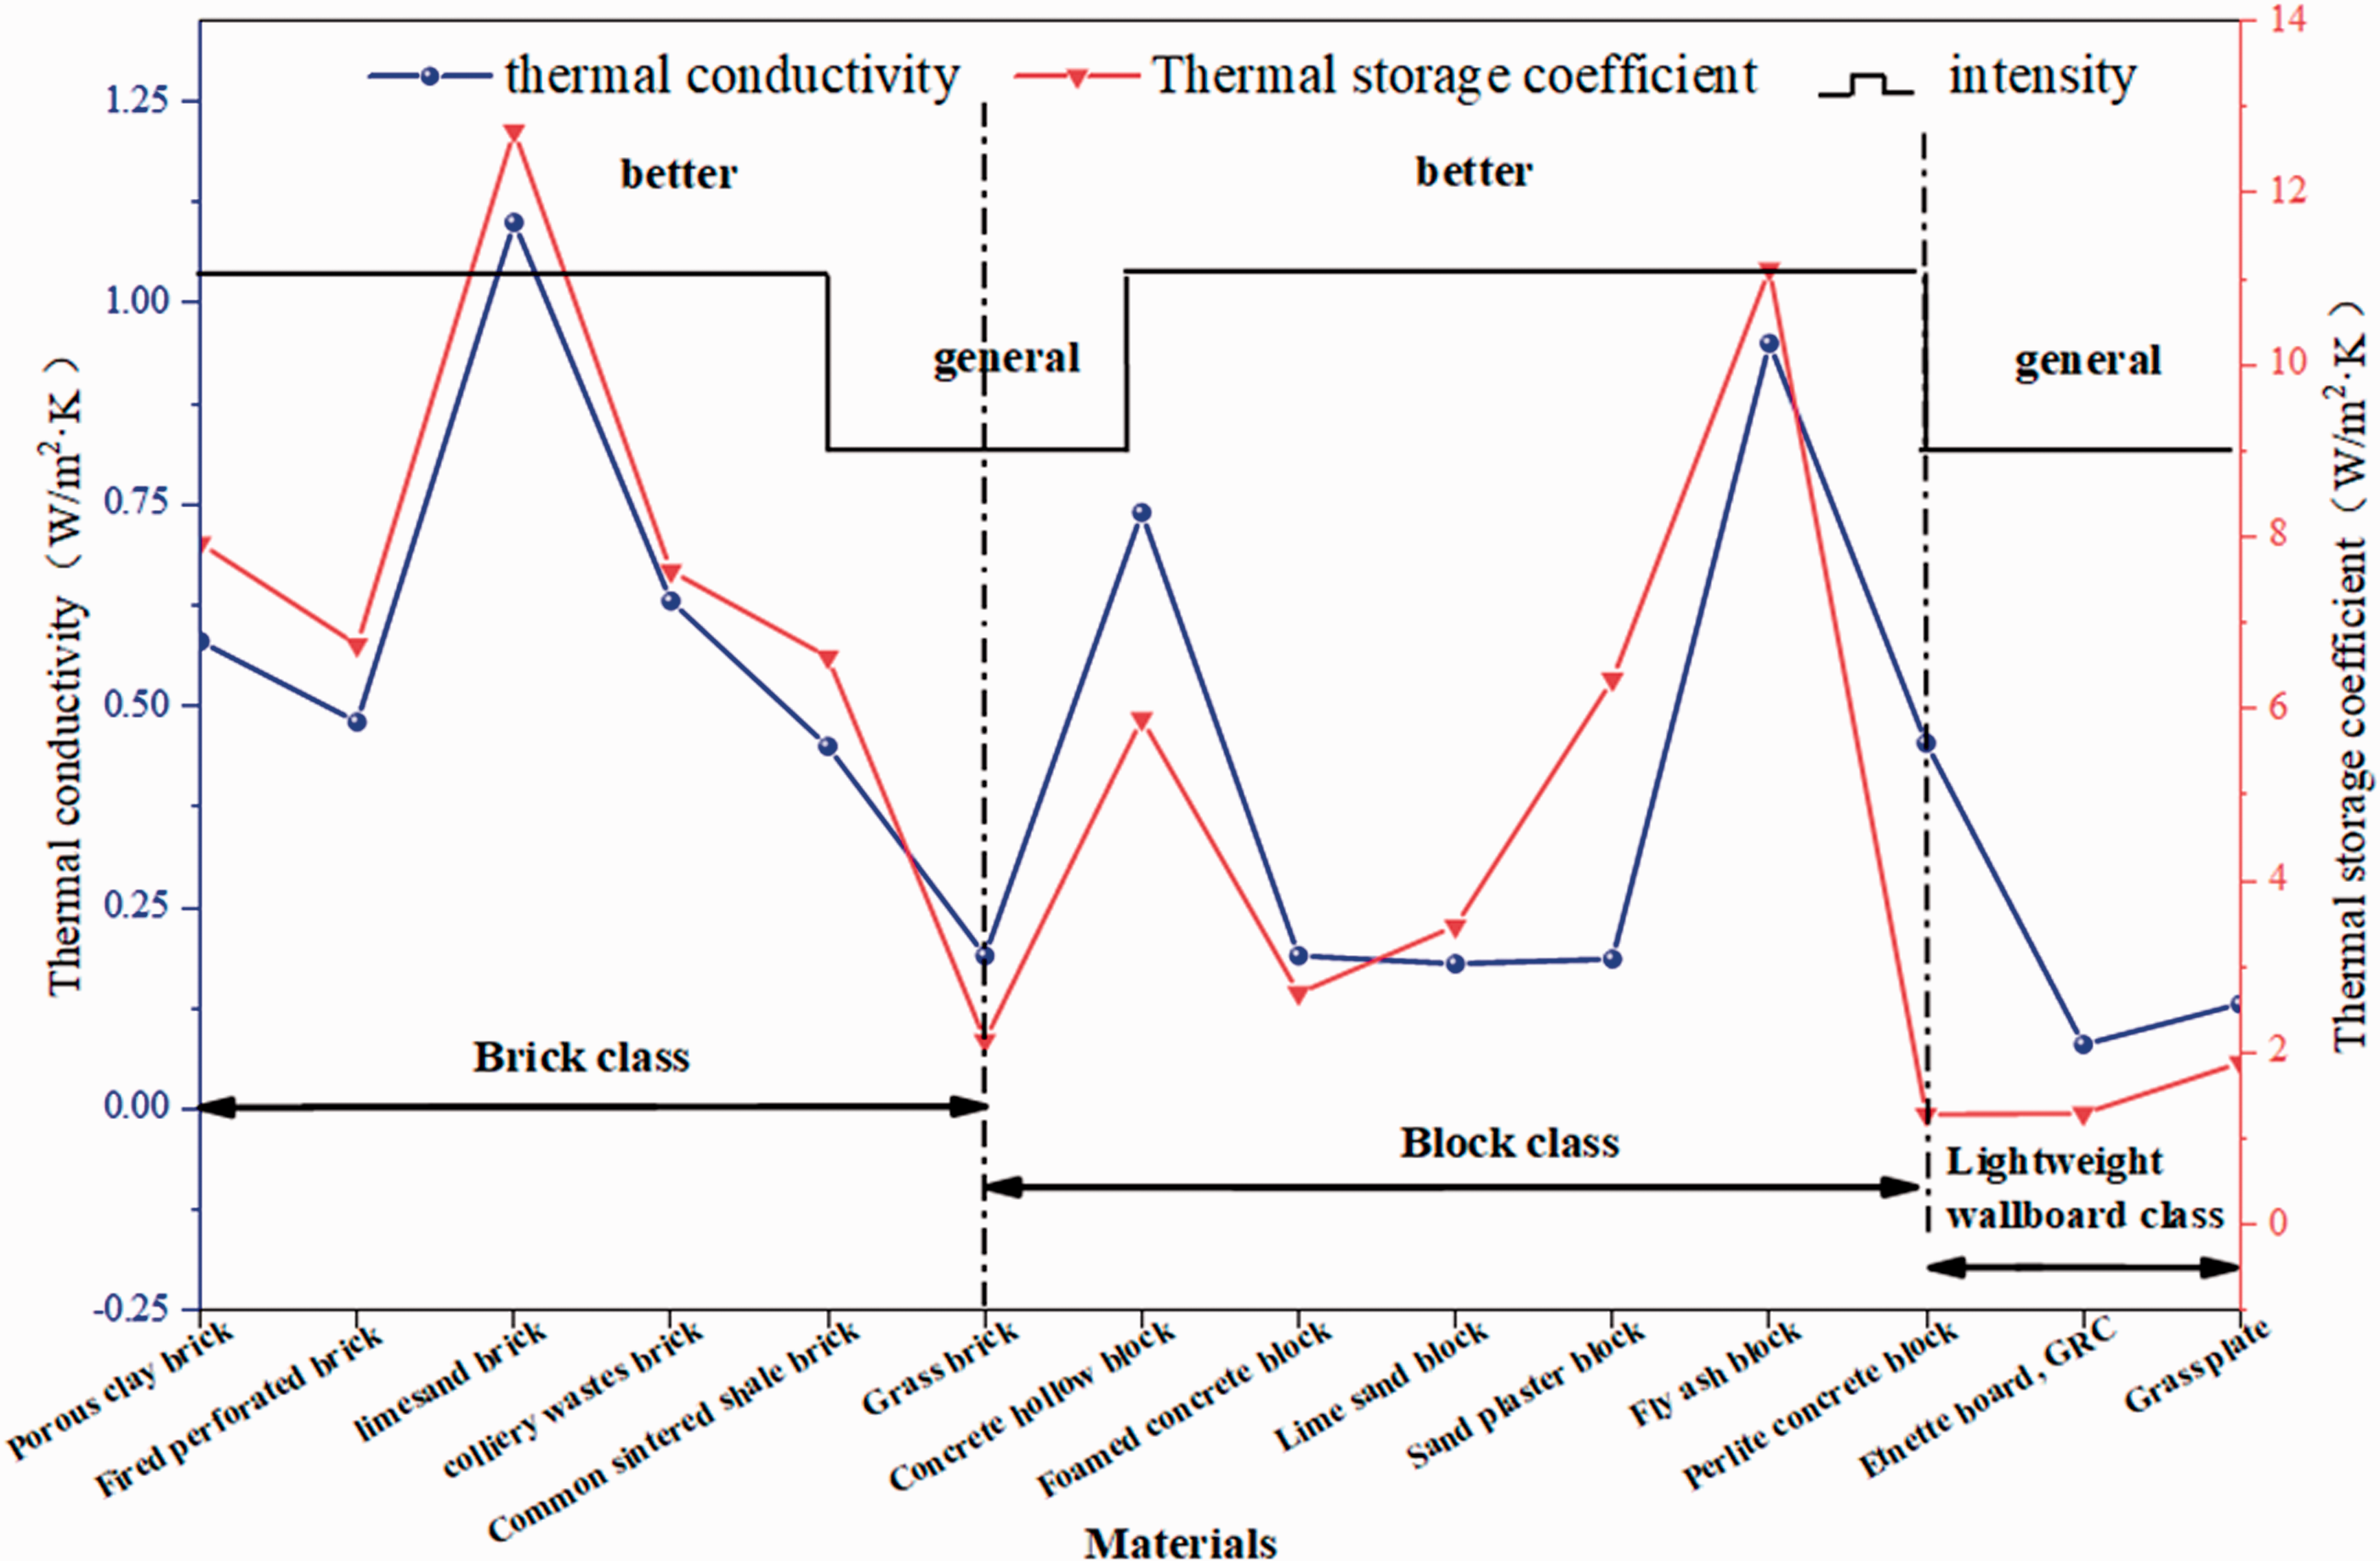
The primary task of the external wall design of the building envelope is to reduce indoor heat loss, that is, to take heat preservation and insulation measures as much as possible based on the premise of stable heat transfer and basic functions of external walls, namely to increase the thermal resistance of the wall (Kisilewicz et al., 2019). Generally, the thermal resistance of the external wall can be increased by improving the material properties of the external wall structure layer or using a composite thermal insulation system. In recent years, new wall materials, such as lime sand blocks and foam concrete blocks, have been increasingly used in low-energy prefabricated buildings, as shown in Figure 5. New wall materials, using more environmentally friendly materials or waste materials in raw materials, can not only provide thermal insulation function but also can reduce building energy consumption. The utilization of raw materials and the construction process are energy-saving, but the produced building materials have excellent properties, such as excellent insulation, fire resistance, and durability (Liu et al., 2019b).
Reference thermal performance of the different external walls.
Since the external wall plays an important role in the insulation function, the wall with only the structural layer cannot meet the requirements of heat preservation and heat insulation. Therefore, it is necessary to add a layer of efficient insulation material to the external wall structure layer. Currently, there are three types of thermal insulation: external wall thermal insulation, external wall internal thermal insulation, and sandwich thermal insulation wall (Xu et al., 2019). The thermal insulation layer of the external wall thermal insulation is placed on the outside of the external wall. This method has good integrity and does not occupy the internal use space of the building (Pedroso et al., 2020). It also largely eliminates the influence of cold and hot bridges. The thermal insulation layer of the external wall internal thermal insulation is placed on the inside of the external wall, and it can be used for intermittent heating of the room because of its fast heating and cooling speed (Cheng et al., 2017). However, it can occupy part of the indoor space, which is not conducive to indoor decoration and pipeline installation. The placement of external wall internal thermal insulation promotes condensation on the wall, mildew, or cracking of the insulation layer, which affects the life of the wall. The cyclical changes of unstable thermal expansion and contraction in summer can cause the hollow drum to crack, which affects the load-bearing capacity and integrity of the envelope structure. The insulation layer of the sandwich thermal insulation wall, as a board core or an insulation system, is placed in the middle of the external wall (Zhai et al., 2018). Therefore, the thermal insulation material of this method does not have high requirements for fire prevention. Simultaneously, this method can improve the thermal insulation performance of the external wall while protecting the thermal insulation material from environmental damage and release the interior space. But the approach is more complicated.
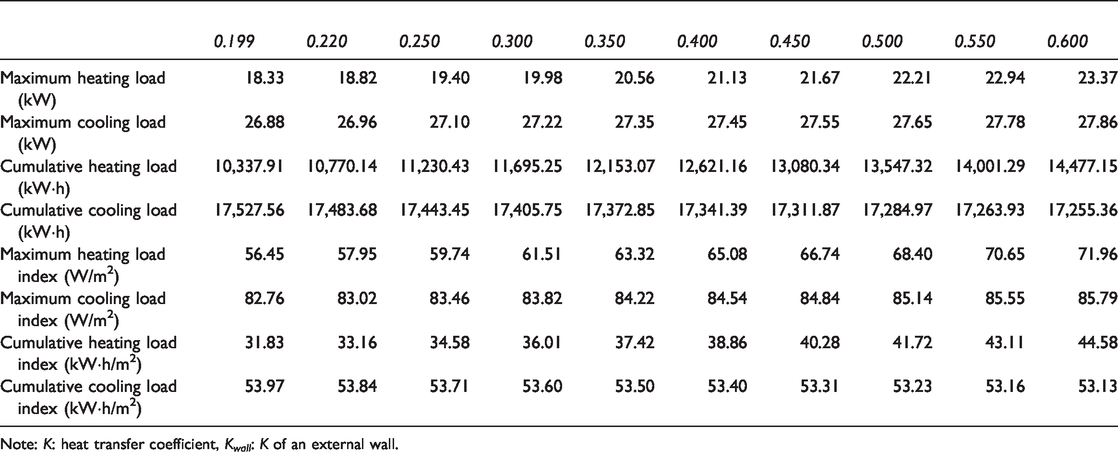
The envelope structure of the external wall is optimized by changing the K of the external wall and keeping the other parameters unchanged in the initial simulation, as shown in Table 2. The evaluation indicators of different types of building envelopes can be obtained by using DeST software such as the annual cumulative heating load index, the annual cumulative cooling load index, the annual maximum heating load index, etc., and the calculation results are shown in Table 3.
The K of an external wall under different working conditions.
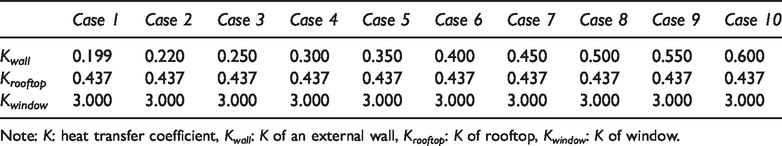
Note: K: heat transfer coefficient, Kwall: K of an external wall, Krooftop: K of rooftop, Kwindow: K of window.
Distribution of building energy consumption based on different Kwall.
Note: K: heat transfer coefficient, Kwall: K of an external wall.
Based on the above data, when the K of the external wall is 0.600 W/(m2·K), the maximum cooling and heating load of the prefabricated restroom reaches the maximum values of 27.86 kW and 23.37 kW, respectively. The cumulative heating and cooling load throughout the year are 14,477.15 kW·h and 17,255.36 kW·h, respectively. As the K of the external wall increases, the maximum cooling load, maximum heating load, and annual cumulative heating load show a gradual upward trend, but the annual cumulative cooling load shows a downward trend, as shown in Figure 6. In general, the trend in Figure 6 also reflects the linear relationship between energy consumption and the K of the external wall, that is, every time the K of the wall increases by 0.05 W/(m2·K), the annual cumulative heating load of the building increases about 4.0%.
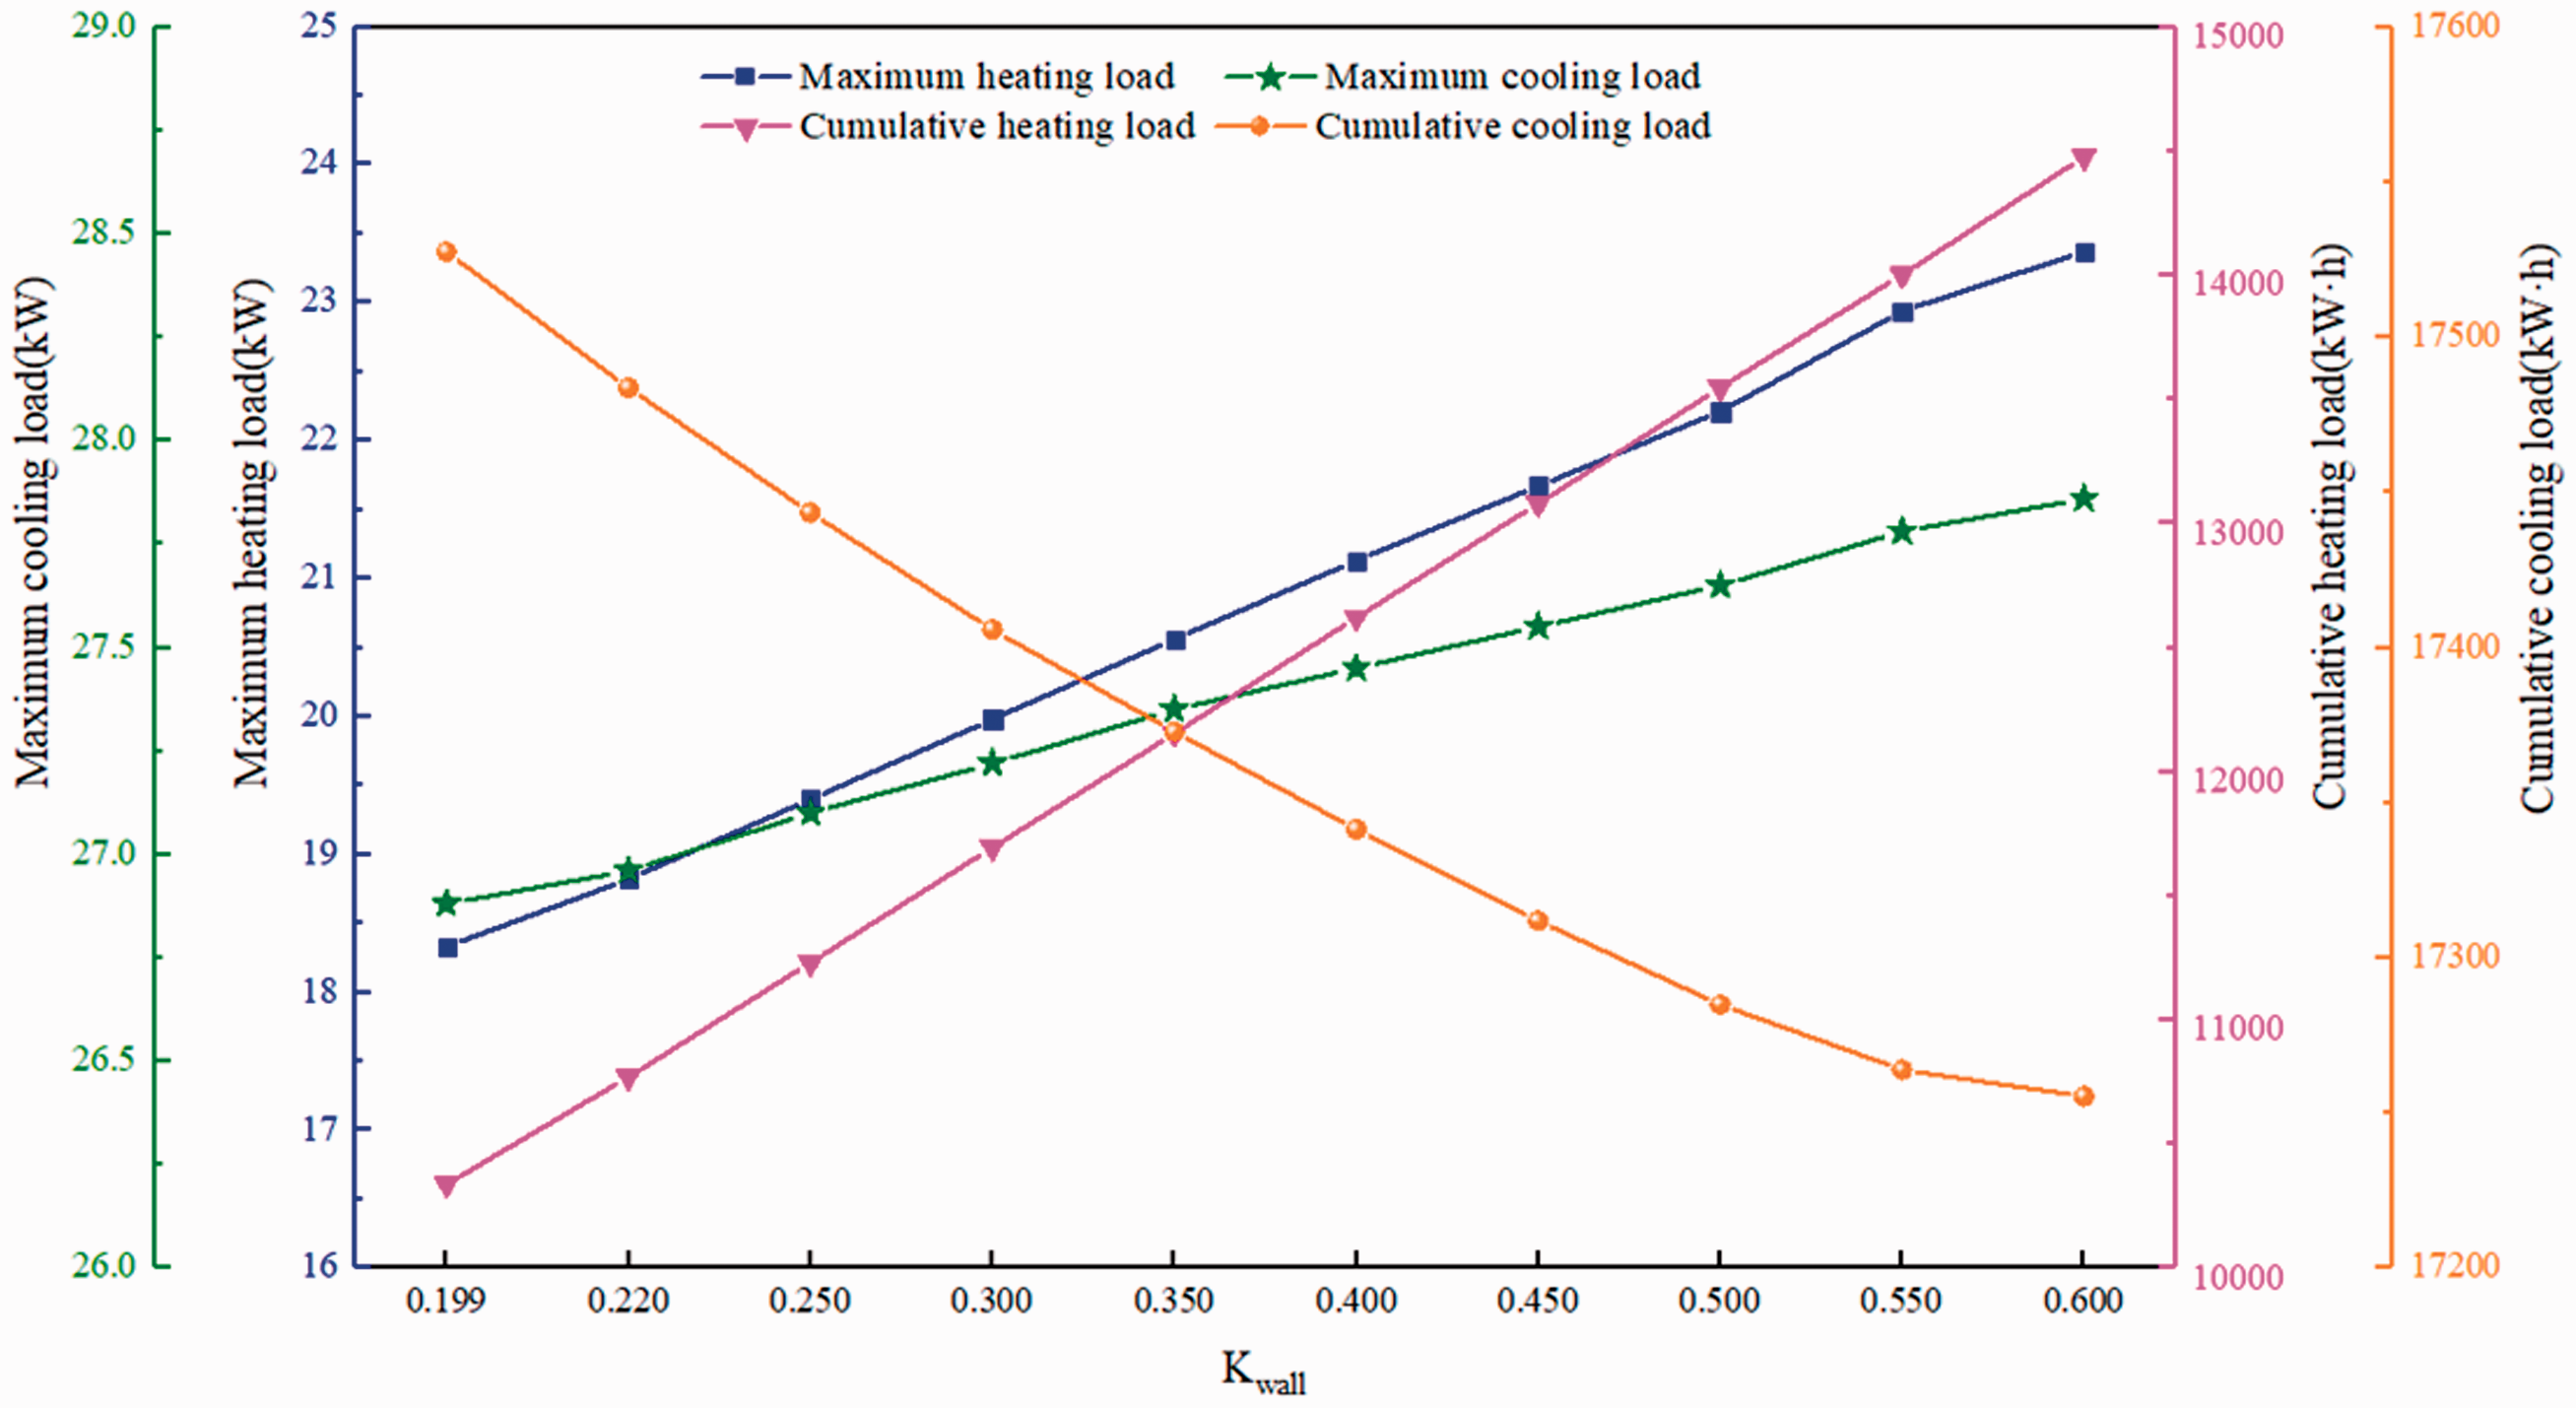
Simulation results of external wall energy consumption under different Kwall (Note: Kwall – the heat transfer coefficient of wall).
In order to further analyze the results, the growth rate of the annual cumulative heating and cooling load under the 10 working conditions is calculated, as shown in Figure 7. As the K increases, the growth rate of heating load generally shows a decreasing trend. When the K of the external wall is 0.220 W/(m2·K), the annual cumulative heating load increases by 432.23 kW·h than that when the K of the external wall is 0.199 W/(m2·K). When the K of the external wall is 0.6 W/(m2·K), the annual cumulative heating load increases by 475.86 kW·h than that when the K of the external wall is 0.550 W/(m2·K). In addition, when K increases from 0.550 to 0.600, the increment of cooling load is obviously larger than that of other conditions in Figure 7, which indicates that the greater K is, the more unfavorable the building is, correspondingly, the greater the energy consumption becomes. Overall, the increment of cooling load shows a decreasing trend, when the K of the external wall is 0.220 W/(m2·K), the annual cumulative cooling load decreases 43.88 kW·h than that when the K of the external wall is 0.199 W/(m2·K). When the K of the external wall is 0.600 W/(m2·K), the annual cumulative cooling load decreases 8.57 kW·h than that when the K of the external wall is 0.550 W/(m2·K).
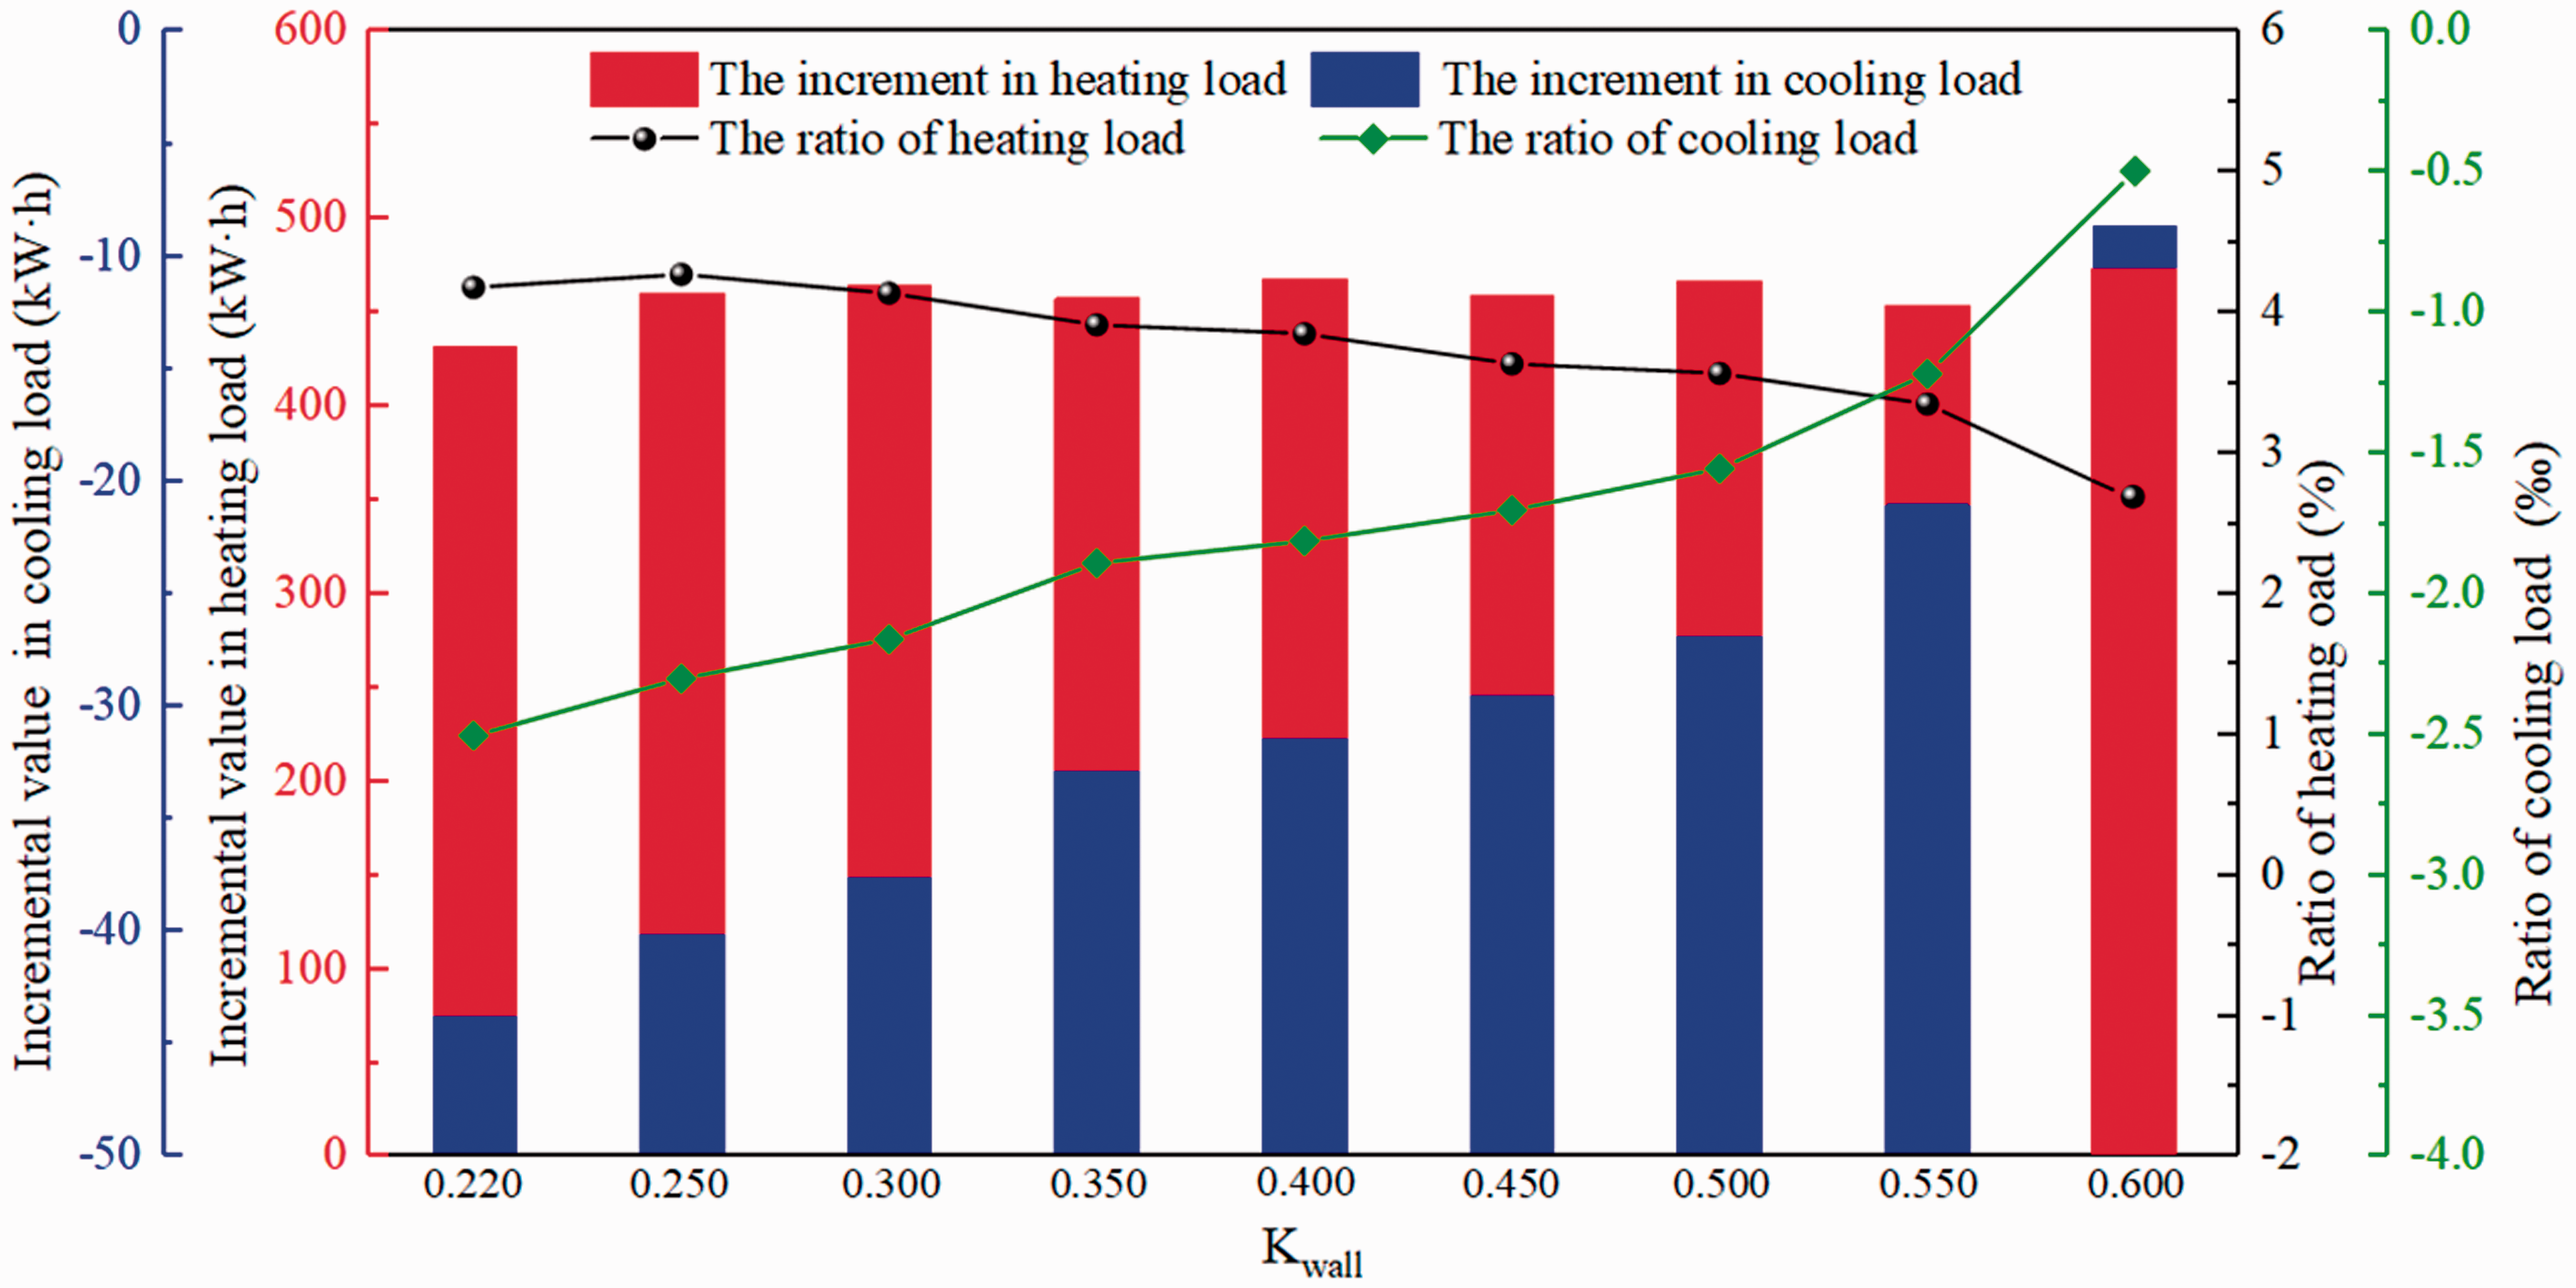
The influence of external wall design on building energy consumption (Note: Kwall – the heat transfer coefficient of wall).
Energy consumption analysis of rooftop
The roof is a very important part of building design. The principle of roof design is to ensure steady-state heat transfer and reduce heat exchange between indoor and outdoor by taking thermal insulation measures (Simões et al., 2019). There are two important index aspects for evaluating rooftop: K and thermal inertia index. The K is an evaluative index for rooftops under the premise of steady heat transfer. It characterizes the heat transfer capacity of the rooftop. Under the premise of unstable heat transfer, the thermal performance of the rooftop should also be characterized by the thermal inertia index (Soret et al., 2021). It refers to the propagation ability of heat flow waves and resistance to temperature waves on the rooftop. The thermal inertia of the rooftop is a dimensionless index that characterizes the attenuation of the temperature wave by the rooftop (Soret et al., 2021). The larger the value of the thermal inertia index, the better the thermal stability of the building envelope.
Generally, the thermal resistance of the rooftop is improved by improving the performance of the structural layer and placing insulation materials on the structural layer. In order to reduce energy consumption and indoor and outdoor heat transfer, it is necessary to reduce the K of the rooftop.
The envelope structure of the rooftop is optimized by changing the K of the rooftop and keeping the other parameters unchanged in the initial simulation, as shown in Table 4. The evaluation indicators of different types of building envelopes can be obtained by using DeST software such as the annual cumulative heating load index, the annual cumulative cooling load index, the annual maximum heating load index, etc., and the calculation results are shown in Table 5.
The K of rooftop under different working conditions.
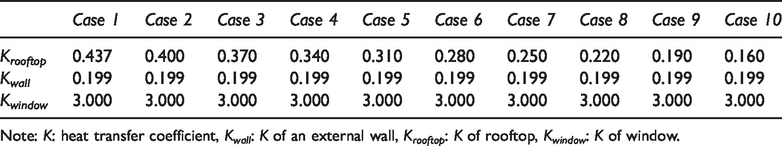
Note: K: heat transfer coefficient, Kwall: K of an external wall, Krooftop: K of rooftop, Kwindow: K of window.
Distribution of building energy consumption based on different Krooftop.
Note: K: heat transfer coefficient, Krooftop: K of rooftop.
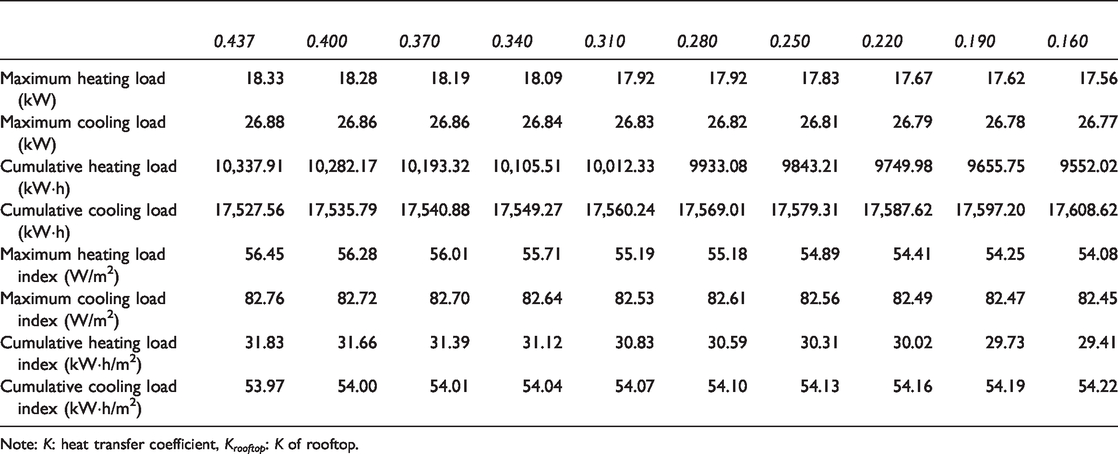
Based on the Table 5 data, when the K of the rooftop is 0.160 W/(m2·K), the maximum cooling and heating load of the prefabricated restroom reaches the maximum values of 26.77 kW and 17.56 kW, respectively. The annual cumulative heating and cooling load are 9552.02 kW·h and 17608.62 kW·h, respectively. Compared with the initial model, the annual cumulative heating load has decreased by 785.89 kW·h, with a decrease rate of 7.60%, and the annual cumulative cooling load has decreased by −81.06 kW·h, with a decrease rate of −0.46%. As the K of the rooftop decreases, the maximum cooling load, maximum heating load, and annual cumulative heating load show a gradual decline, but the annual cumulative cooling load shows an upward trend, as shown in Figure 8.
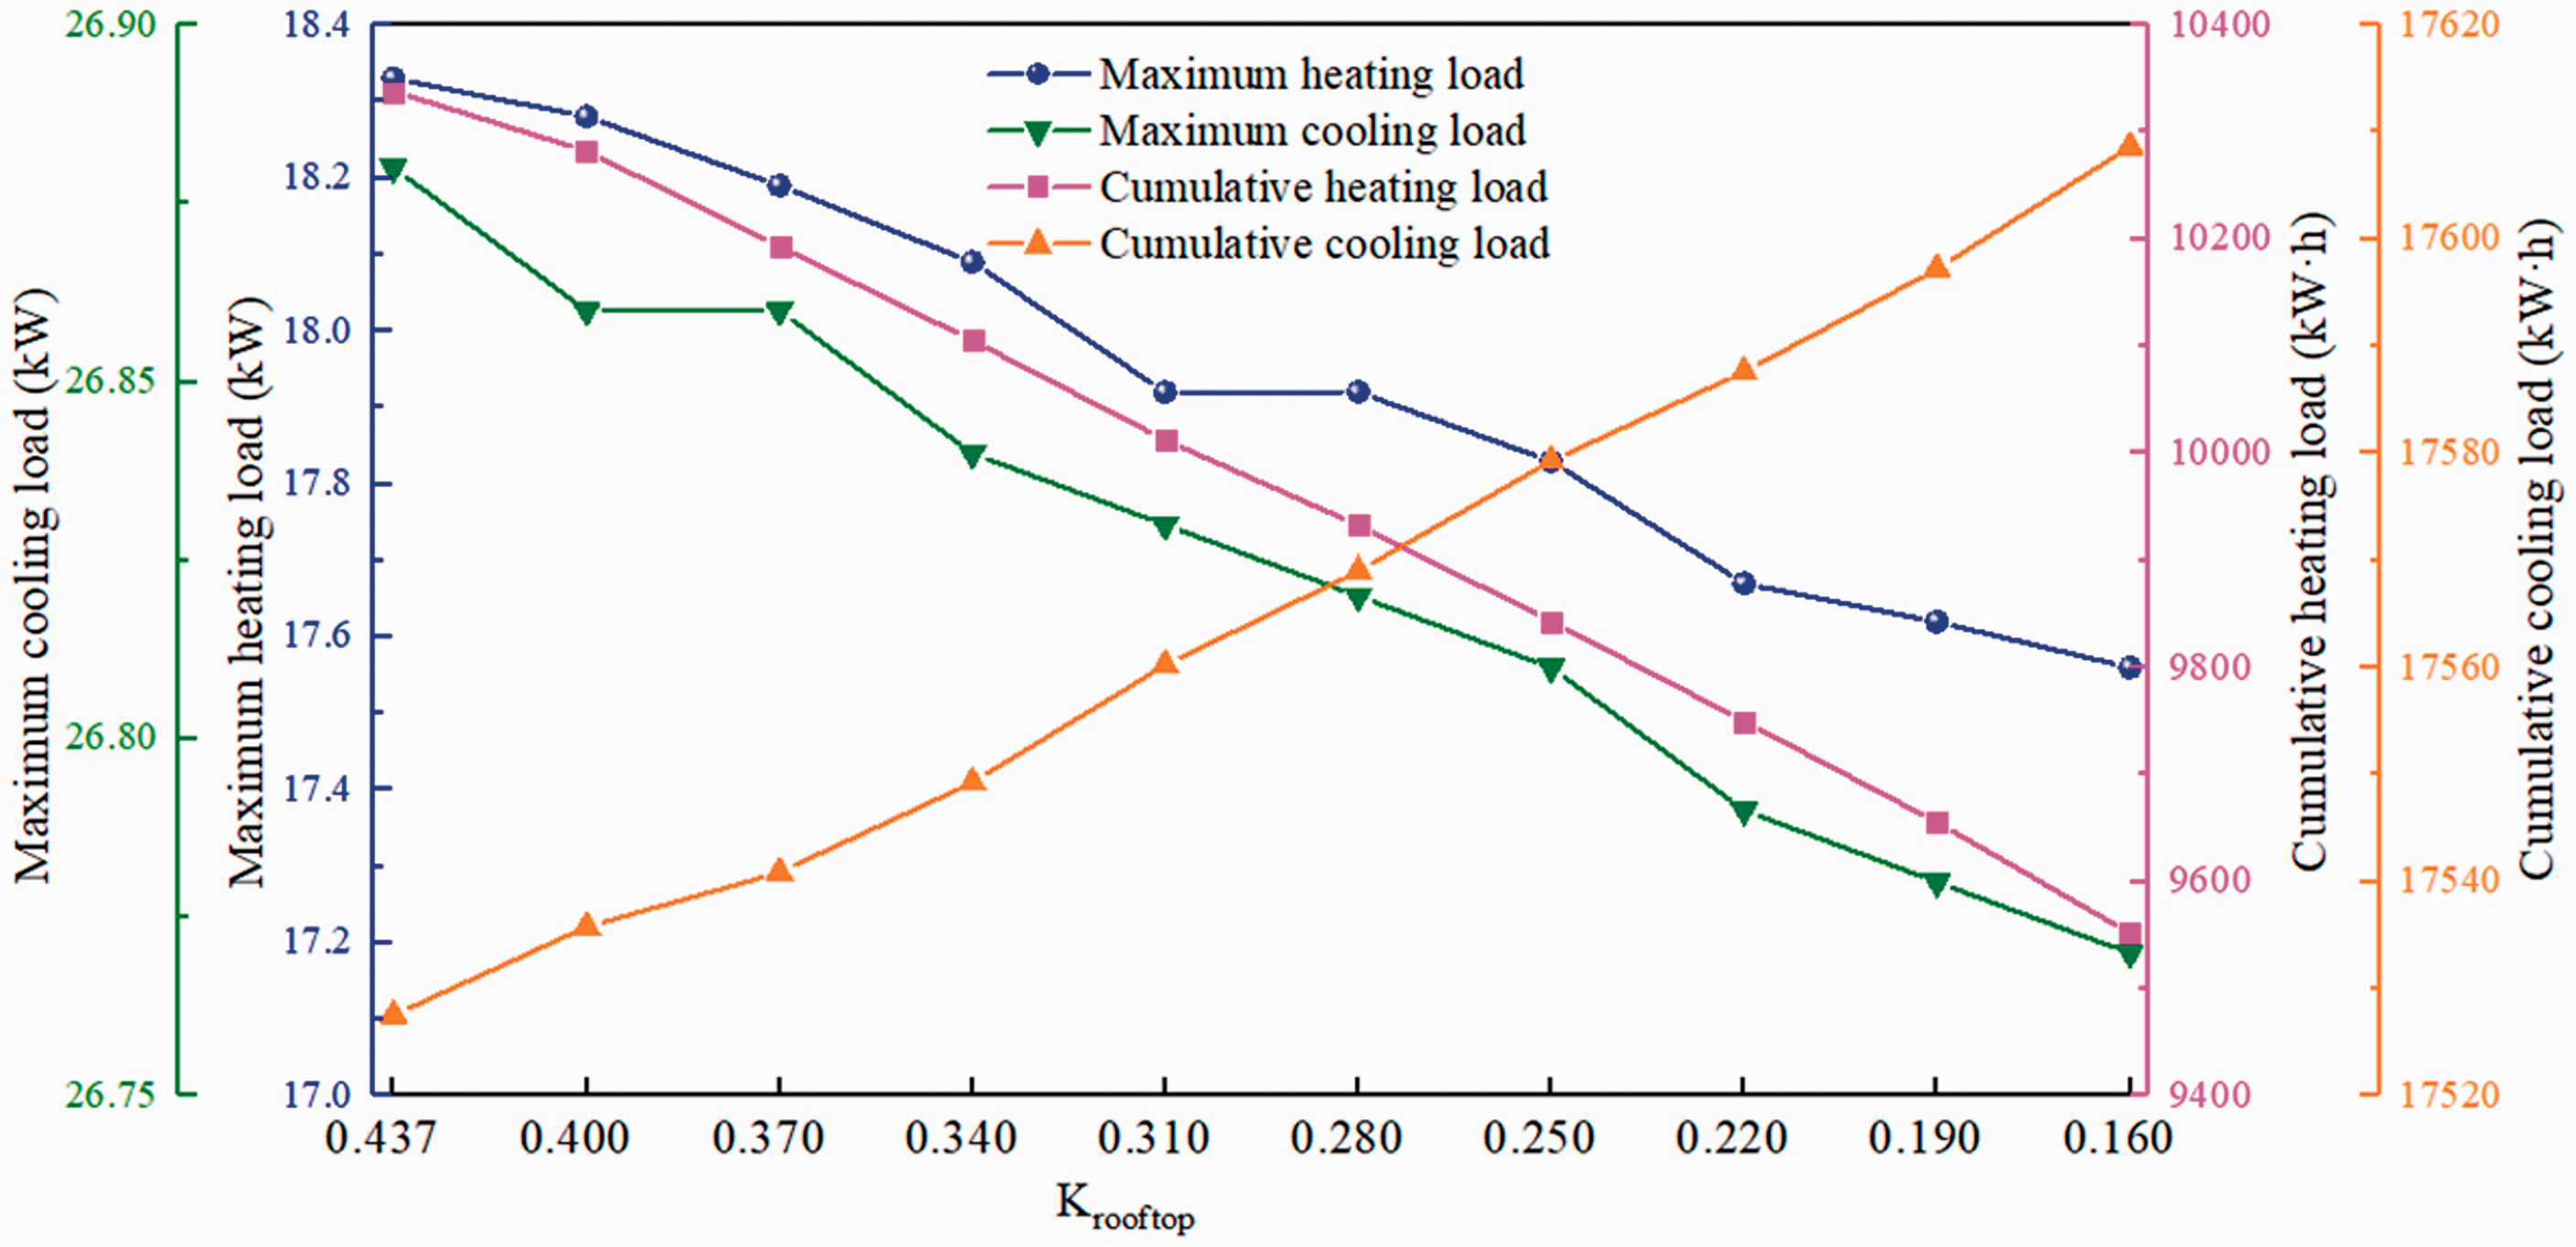
Simulation results of rooftop energy consumption under different Krooftop (Note: Krooftop – the heat transfer coefficient of rooftop).
In order to further analyze the results, the growth rate of the annual cumulative heating and cooling load under the 10 working conditions is calculated, as shown in Figure 9. As the K decreases, the growth rate of heating load generally shows a decreasing trend. When the K of the rooftop is 0.400 W/(m2·K), the annual cumulative heating load decreases by 55.74 kW·h than that when the K of the rooftop is 0.437 W/(m2·K). When the K of the rooftop is 0.16 W/(m2·K), the annual cumulative heating load decreases by 103.74 kW·h than that when the K of the rooftop is 0.190 W/(m2·K). Overall, as the K decreases, the increment of cooling load shows a decreasing trend, when the K of the rooftop is 0.400 W/(m2·K), the annual cumulative cooling load increases 8.23 kW·h than that when the K of the external wall is 0.437 W/(m2·K). When the K of the external wall is 0.160 W/(m2·K), the annual cumulative cooling load decreases 11.42 kW·h than that when the K of the rooftop is 0.190 W/(m2·K).
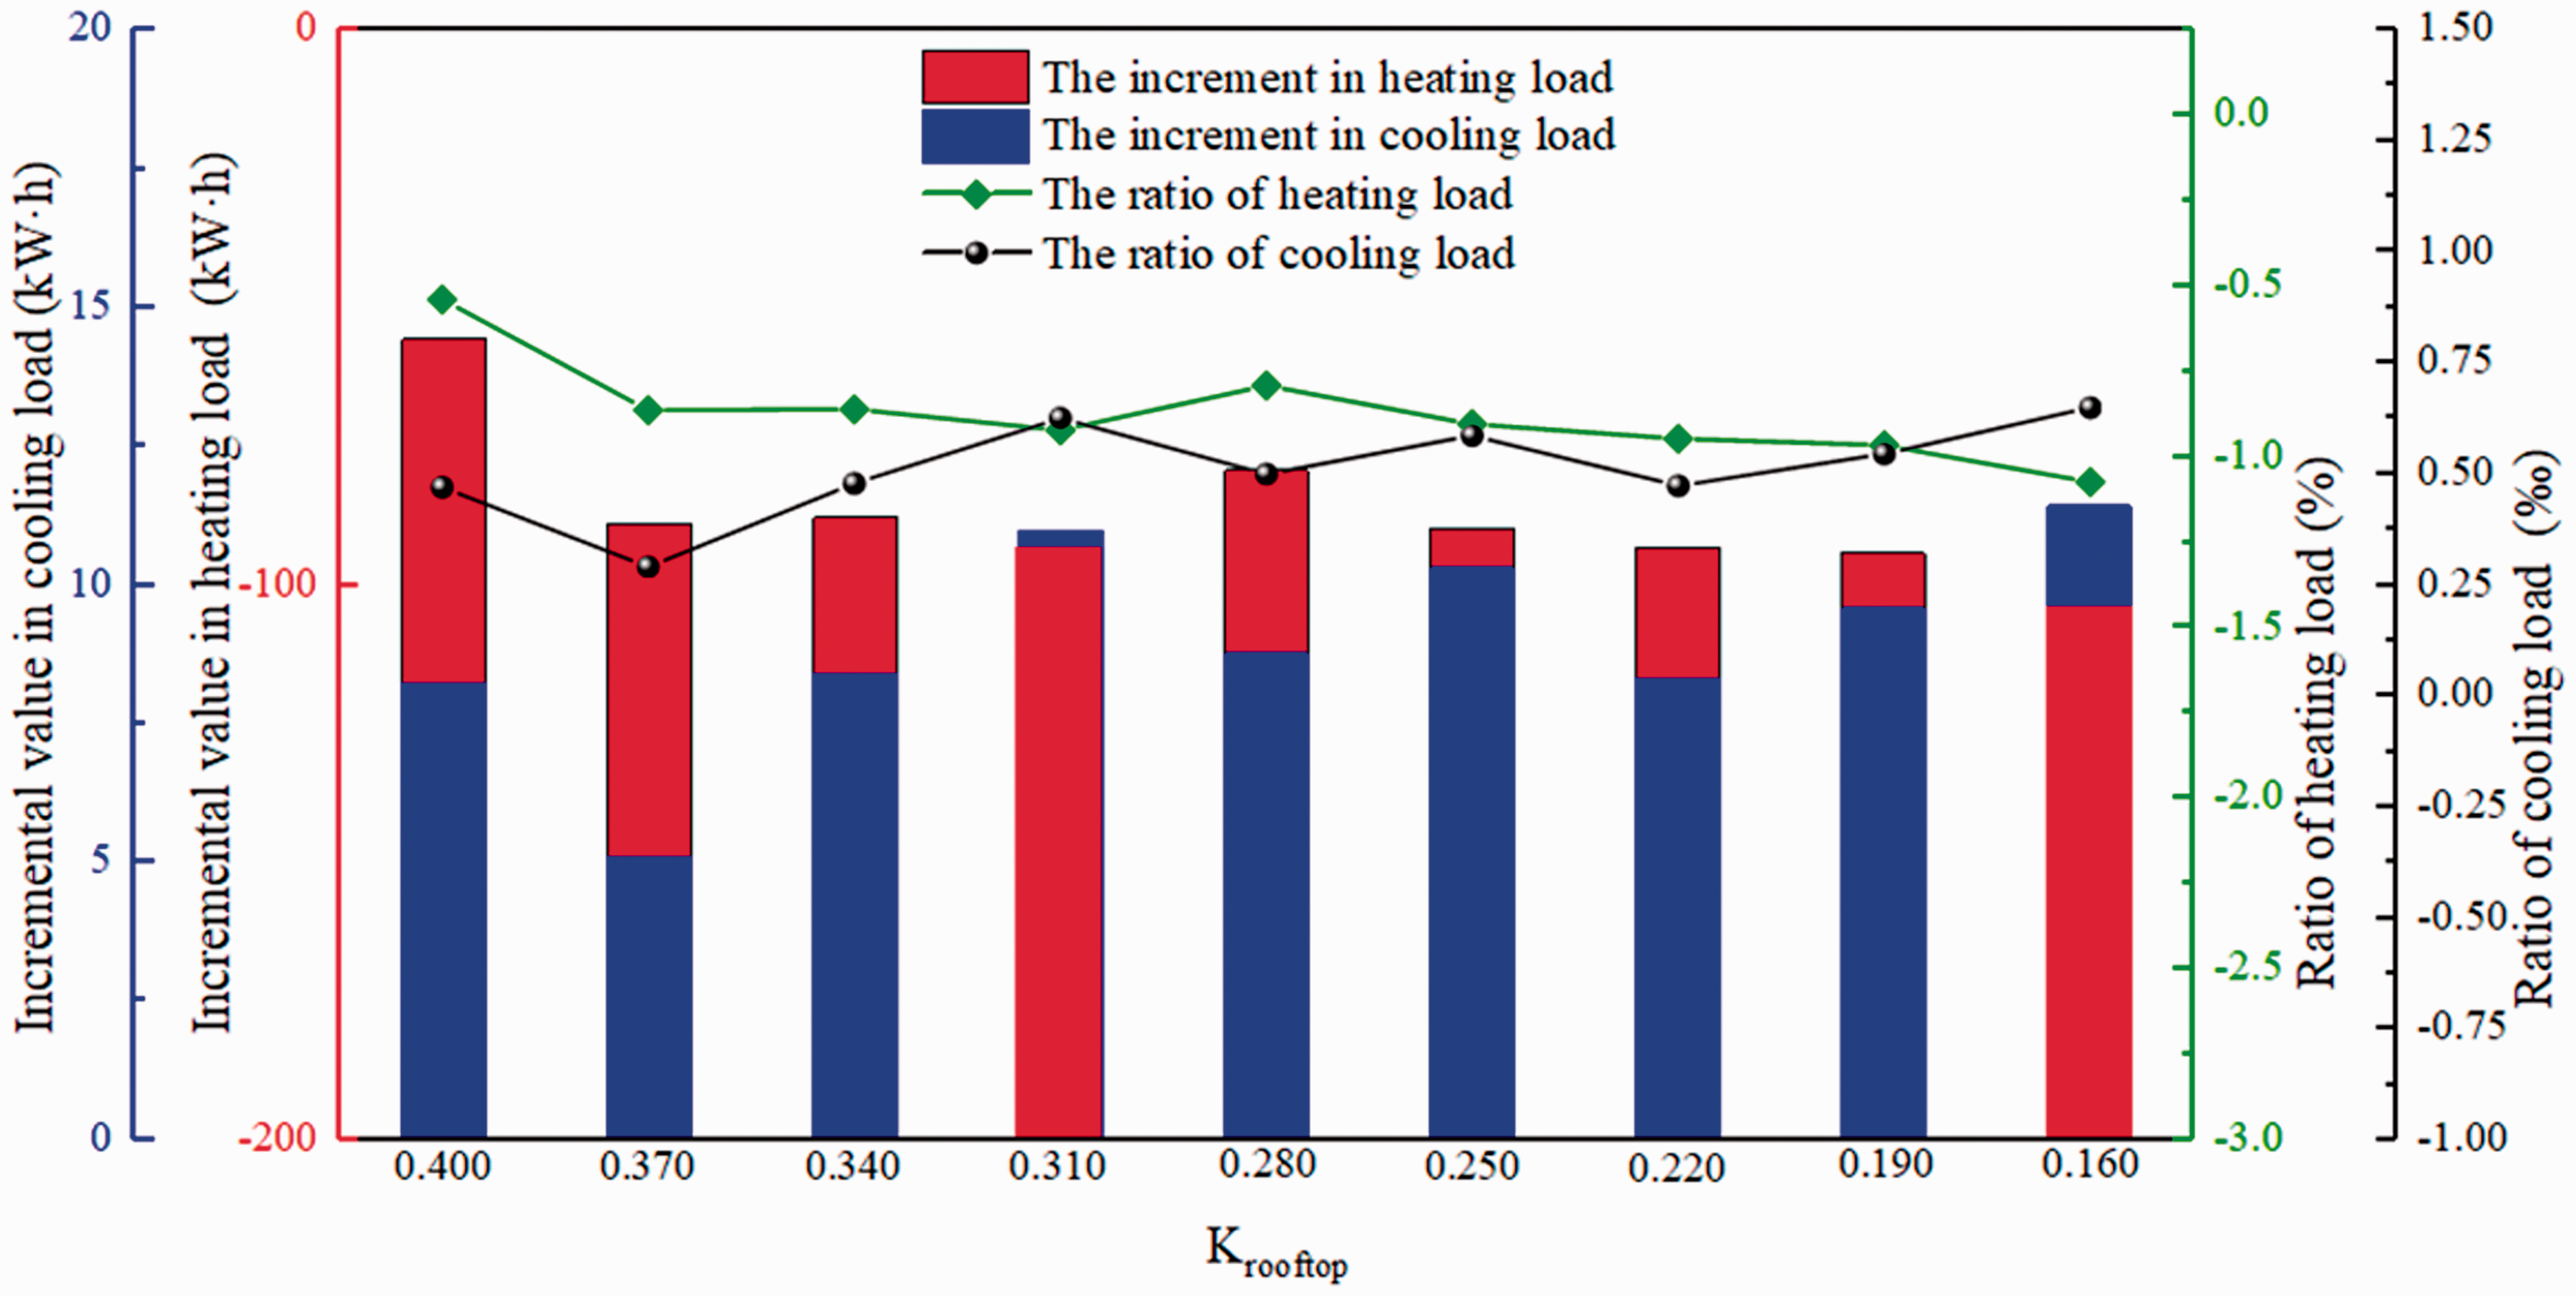
The influence of rooftop design on prefabricated restroom energy consumption (Note: Krooftop – the heat transfer coefficient of rooftop).
Energy consumption analysis of external window
The energy loss of the external window has become a problem (Michaux et al., 2019). Therefore, external window design is one of the main factors affecting the energy consumption of prefabricated restrooms. In China, the energy loss through external windows is 2 to 3 times that of developed countries based on conditions similar to latitude and climatic conditions, and the air permeability of doors and windows is 3 to 6 times that of developed countries, and the total energy loss is 3 to 4 times that of developed countries (Guiwen et al., 2011). With the improvement of the material and structure of the spacer between the glass, the overall glass component has a very good thermal insulation ability. The emergence of many new types of glass with very low heat transfer coefficient can make the heat lost through them less than the solar energy obtained, making glass into a pure heat-generating component.
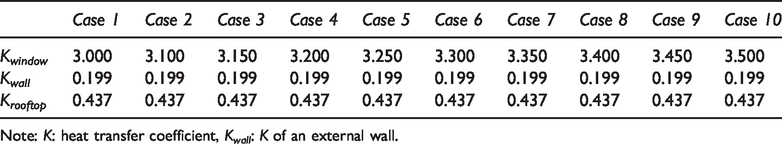
The envelope structure of the external window is optimized by changing the K of the external window and keeping the other parameters unchanged in the initial simulation, as shown in Table 6. The evaluation indicators of different types of building envelopes can be obtained by using DeST software such as the annual cumulative heating load index, the annual cumulative cooling load index, the annual maximum heating load index, etc., and the calculation results are shown in Table 7.
K of external window under different working conditions.
Note: K: heat transfer coefficient, Kwall: K of an external wall.
Distribution of building energy consumption based on different Kwindow.
Note: K: heat transfer coefficient, Kwindow: K of window.
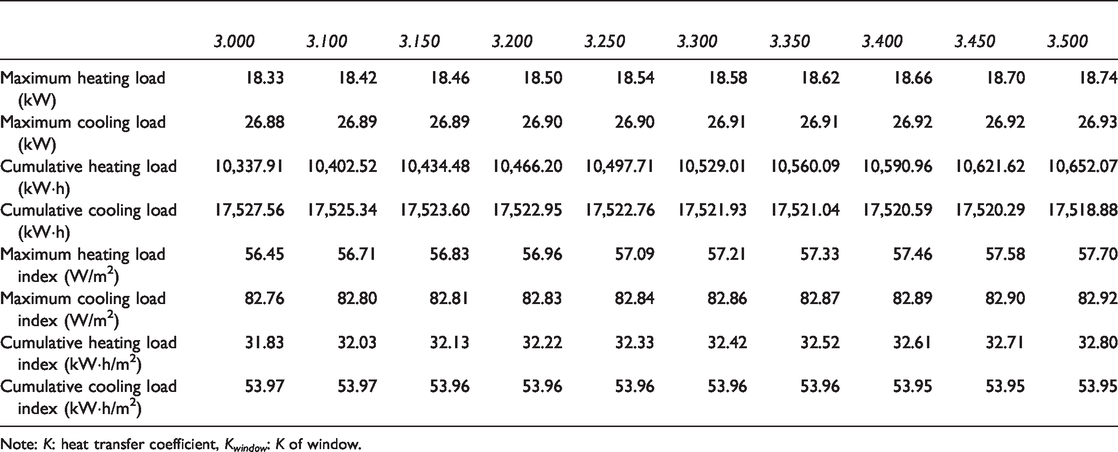
Based on the above data, when the K of the external window is 3.500 W/(m2·K), the maximum cooling and heating load of the building reach the maximum values of 26.93 kW and 18.74 kW, respectively. The annual cumulative heating and cooling load are 10652.07 kW·h and 17518.88 kW·h, respectively. Compared with the initial model, the annual cumulative heating load has increased by 3.04% and −0.05% respectively. In general, as the K of the external window increases, the maximum cooling load, maximum heating load, and annual cumulative heating load show a gradual upward, but the annual cumulative cooling load shows a declining trend, as shown in Figure 10.
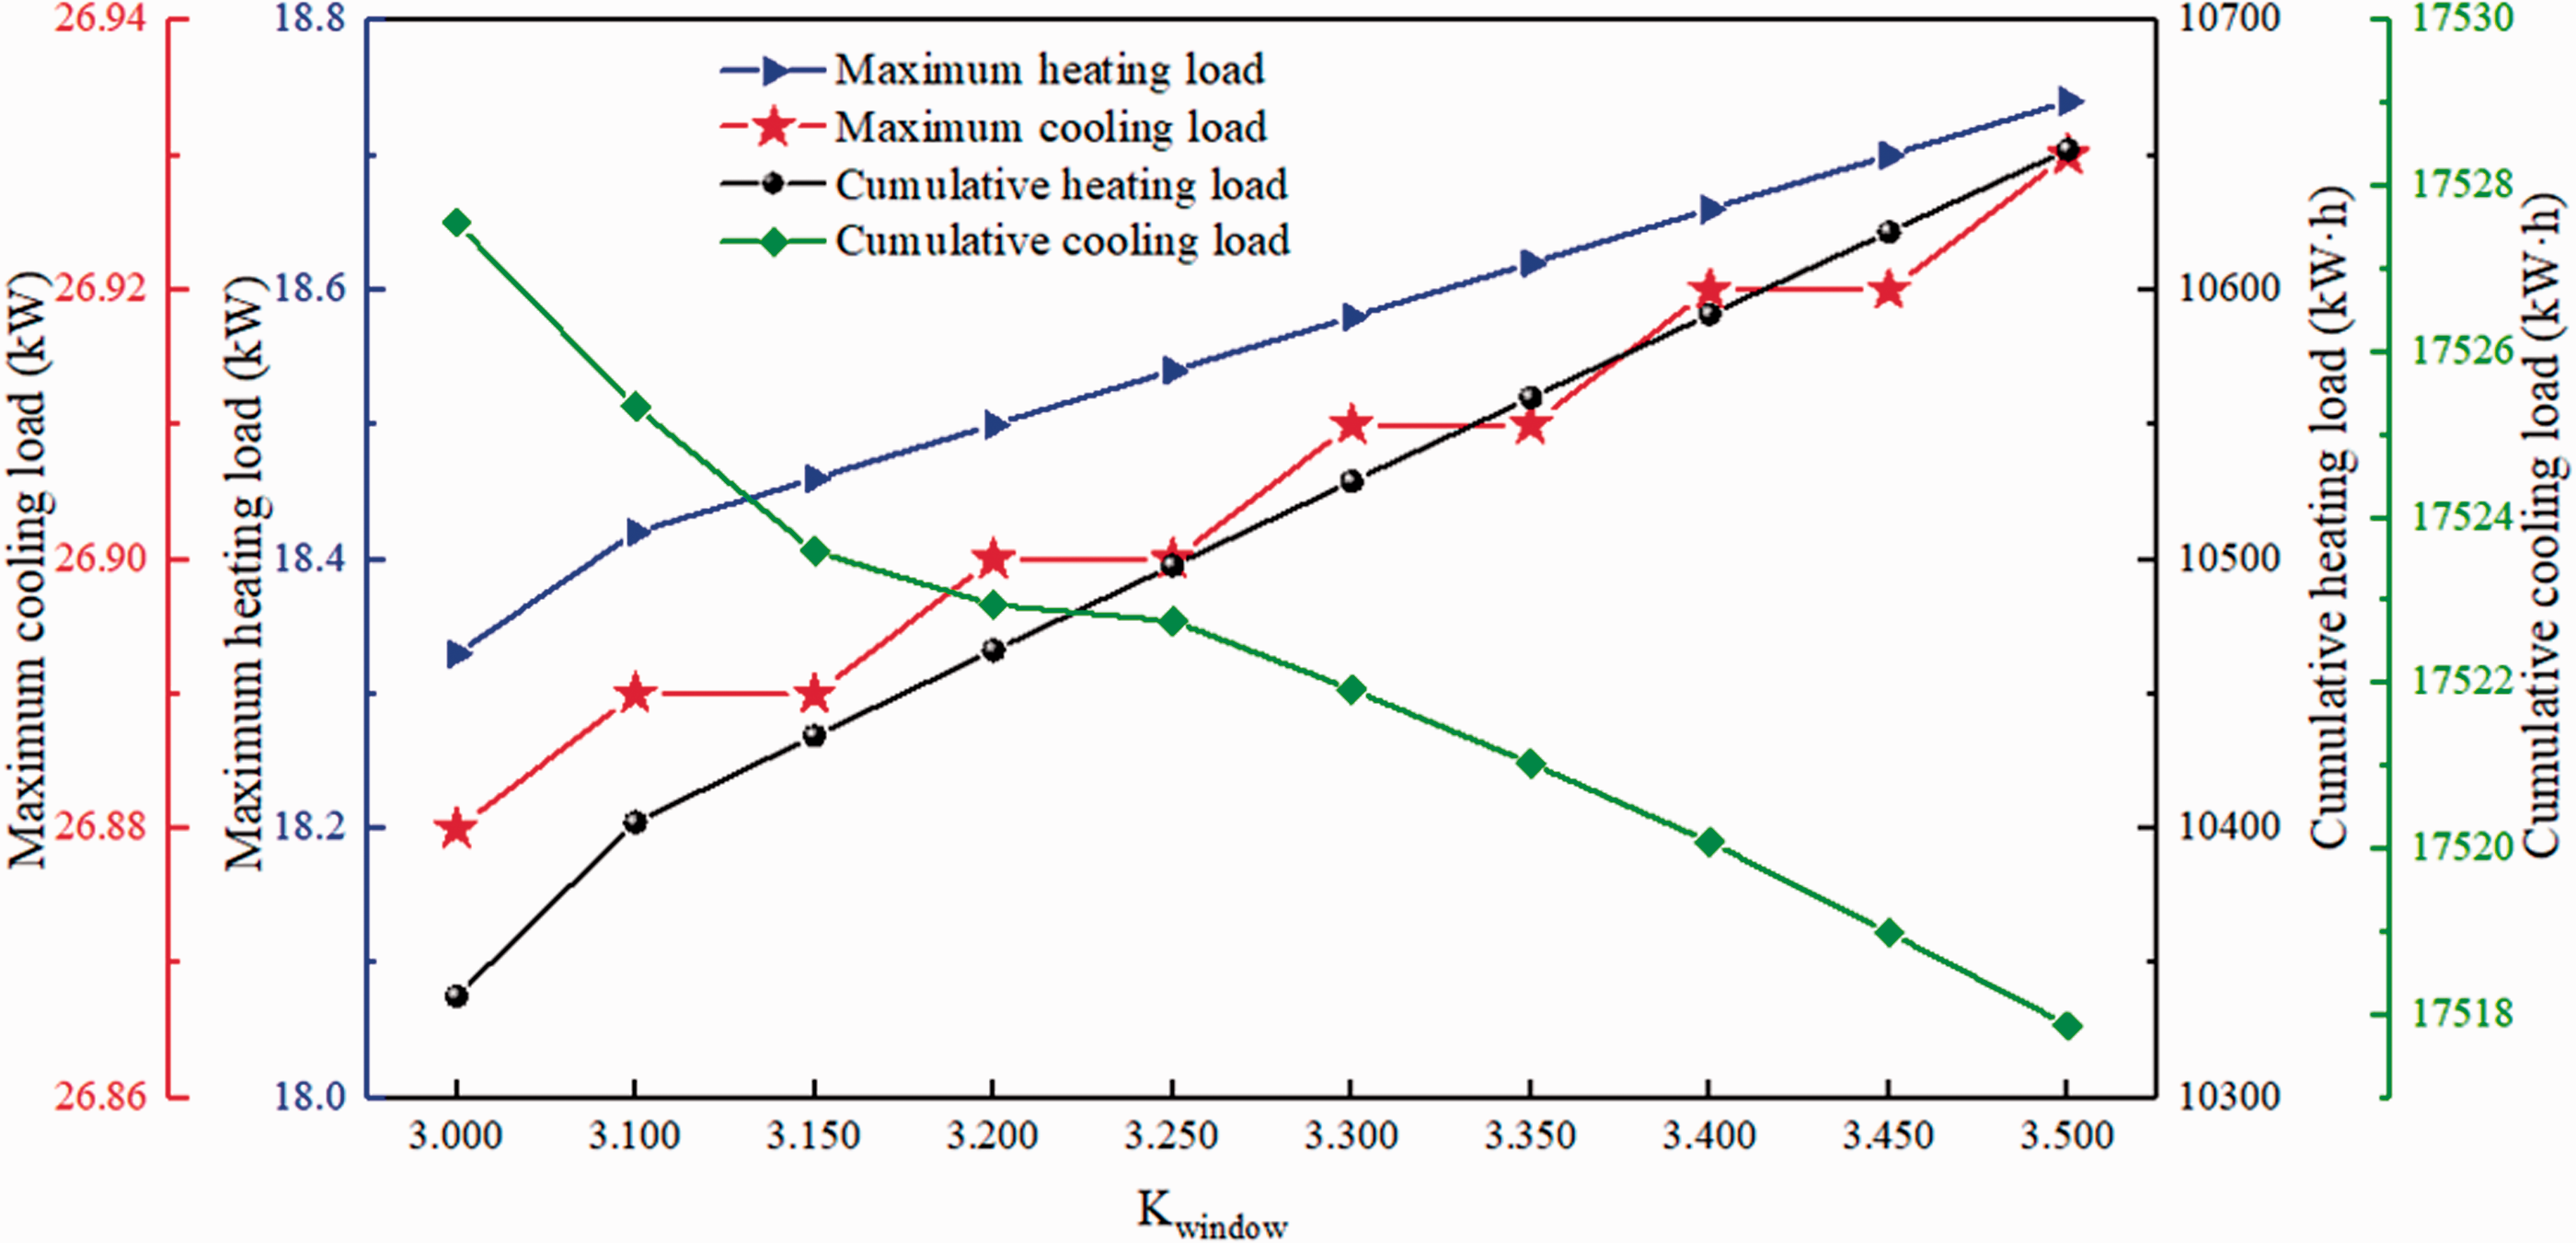
Simulation results of external window energy consumption under different Kwindow (Note: Kwindow – the heat transfer coefficient of window).
In order to further analyze the results, the growth rate of the annual cumulative heating and cooling load under the 10 working conditions is calculated, as shown in Figure 11. As the K of the external window increases, the growth rate of heating load generally shows a decreasing trend. When the K of the external window is 3.500 W/(m2·K), the annual cumulative heating load increases by 30.45 kW·h than that when the K of the rooftop is 3.45 W/(m2·K). When the K of the rooftop is 3.100 W/(m2·K), the annual cumulative heating load increases by 64.61 kW·h than that when the K of the rooftop is 3.000 W/(m2·K). However, as the K of the external window increases, the growth rate shows a trend of first increasing and then decreasing, but the general trend is still an increasing trend.
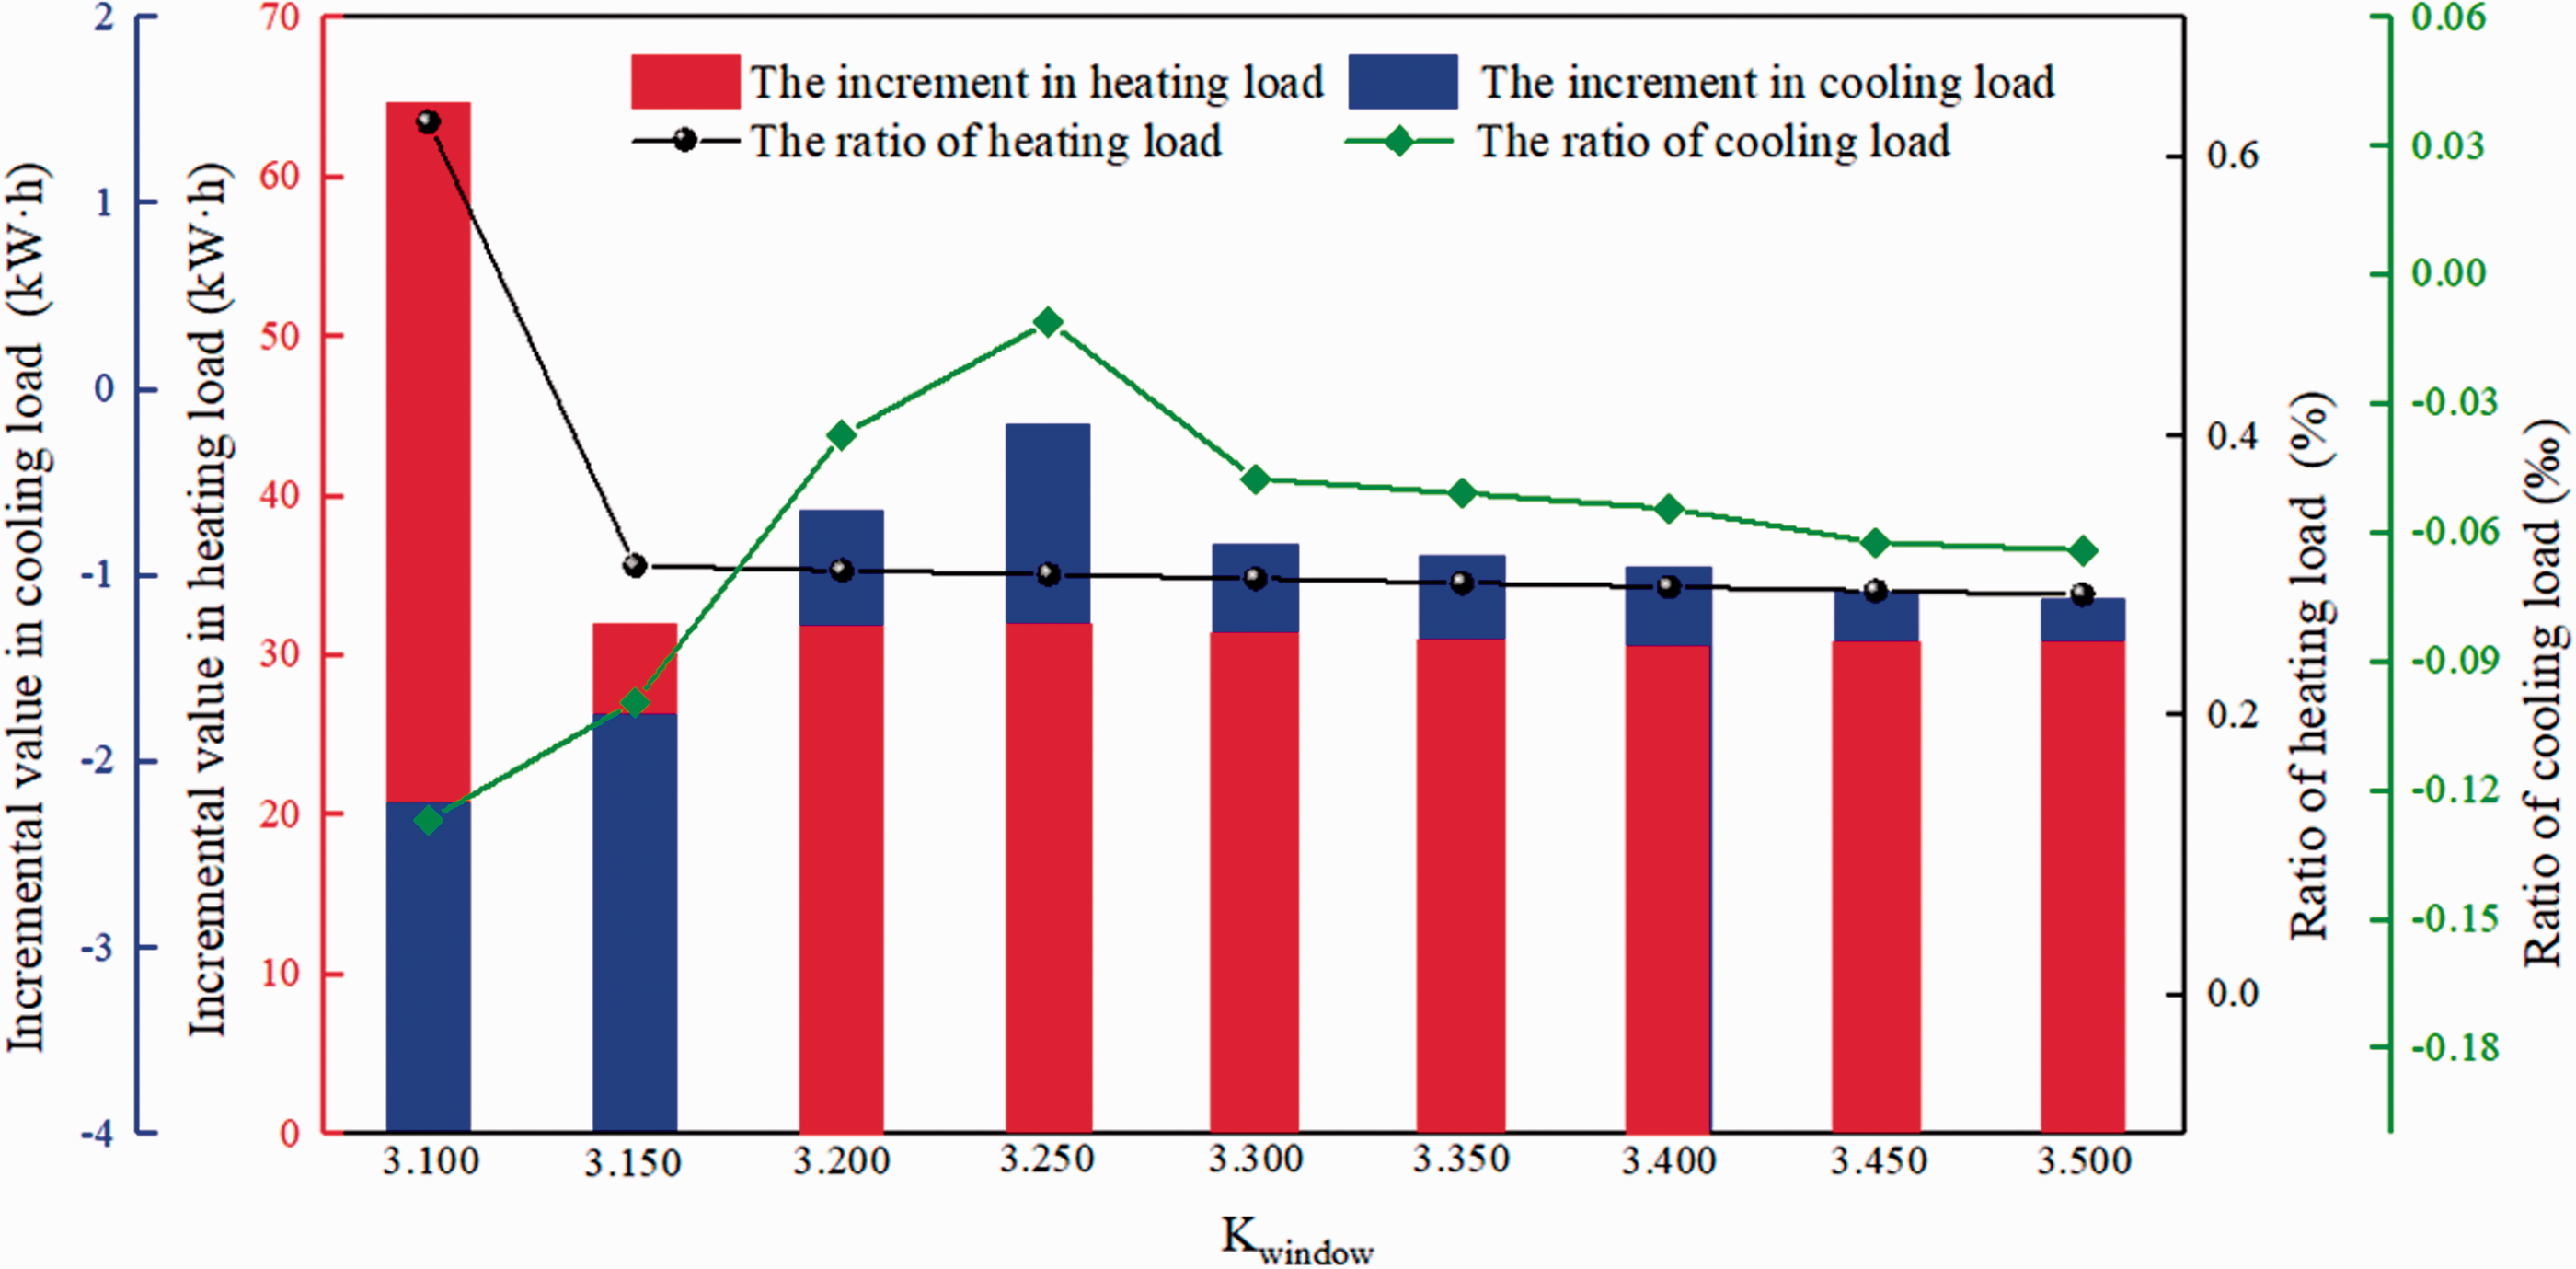
The influence of external window design on building energy consumption (
Discussion
Based on the above analysis and related standards, it is found that as the K of the external wall increases, the annual cumulative heating of prefabricated restroom building in the HSCW zone increases, the annual cumulative cooling load decreases. When the K increases from 0.199 W/(m2·K) to 0.600 W/(m2·K), the absolute value of the annual cumulative heating load increment is 4139.24 kW·h, and the absolute value of the annual cumulative cooling load increment is 272.2 kW·h.
For the rooftop, it is found that as the K of the rooftop increases, the annual cumulative heating of prefabricated restroom building in the HSCW zone increases, and the annual cumulative cooling load decreases. When the K increases from 0.160 W/(m2·K) to 0.437 W/(m2·K), the absolute value of the annual cumulative heating load increment is 785.89 kW·h, and the absolute value of the annual cumulative cooling load increment is 81.06 kW·h.
For the external window, it is found that as the K of the external window increases, the annual cumulative heating of prefabricated restroom building in the HSCW zone increases, and the annual cumulative cooling load decreases. When the K increases from 3.000 W/(m2·K) to 3.500 W/(m2·K), the absolute value of the annual cumulative heating load increment is 314.16 kW·h, and the absolute value of the annual cumulative cooling load increment is 8.68 kW·h.
For the prefabricated restrooms in Nanjing, it is very necessary to give priority to improving the thermal performance of the rooftop, external wall, and external window. If the K of the prefabricated restroom envelope is smaller, the total annual load of the prefabricated restroom is smaller, and the building energy-saving rate is also higher. It is not difficult to see that, for prefabricated restrooms in Nanjing, due to the window-wall-ratio is less than 0.2, the priority of the wall heat transfer coefficient on building energy consumption is higher than that of the rooftop heat transfer coefficient, simultaneously, the rooftop heat transfer coefficient has priority higher than window heat transfer coefficient.
Conclusions
This paper establishes a model of the prefabricated restroom in a HSCW zone. The impact of building envelope variables on the energy demand of prefabricated restrooms is simulated based on DeST software, and the following conclusions can be drawn:
The optimal range of K of the external wall of the prefabricated restroom is 0.199∼0.220 W/(m2·K), which is suitable for zones with hot summer and cold winter. The optimal range of K of the rooftop of the prefabricated restroom is 0.160∼0.190 W/(m2·K), which is suitable for zones with hot summer and cold winter. When the window-to-wall ratio is less than 0.2, the optimal range of K of the external window of the prefabricated restroom is 3.000∼3.100 W/(m2·K), which is suitable for zones with hot summer and cold winter. For prefabricated restrooms in hot summer and cold winter zone, due to the window-wall-ratio of the prefabricated restroom is less than 0.2, the priority of the wall heat transfer coefficient on building energy consumption is higher than that of the rooftop heat transfer coefficient, simultaneously, the rooftop heat transfer coefficient has priority higher than window heat transfer coefficient.
Footnotes
Declaration of conflicting interests
The author(s) declared no potential conflicts of interest with respect to the research, authorship, and/or publication of this article.
Funding
The author(s) disclosed receipt of the following financial support for the research, authorship, and/or publication of this article: This work was funded by the National Natural Science Foundation of China (No. 51778119): “Research on carbon emission quantitative method of prefabricated building construction and reuse, based on component-based architectural design”. This work was also funded by the Scientific and Technological Research and Development Plan of China Railway Corporation (No. P2018G049): “Research the technologies of passenger stations in Beijing-Tianjin-Hebei region.