
Abstract
The utilization of wind energy has attracted extensive attentions in the last few decades around the world, providing a sustainable and clean source to generate electricity. It is a common phenomenon of wake interference among wind turbines and hence the optimization of wind farm layout is of great importance to improve the wind turbine yields. More specifically, the accuracy of the three-dimensional wake model is critical to the optiamal design of a real wind farm layout considering the combinatorial effect of wind turbine interaction and topography. In this paper, a novel learning-based three-dimensional wake model is proposed and subsequently validated by comparison to the high-fidelity wake simulation results. Moreover, due to the fact that the inevitable deviation of actual wind scenario from the anticipated one can greatly jeopardize the wind farm optimization outcome, the inaccuracy of wind condition prediction using the existing meteorologic data with limited-time measurement is incorporated into the optimization study. Different scenarios including short-, medium-, and long-term wind data are studied specifically with the wind speed/direction prediction errors of
Keywords
Introduction
The Utilization of wind energy has attracted extensive attentions in the last few decades around the world, providing a sustainable and clean source to generate electricity (Latifi et al., 2017). In order to compete with the traditional fossil fuels or other potential renewable resources, reducing the cost of wind energy production is an imperative task which can be achieved either by cutting down the wind farm developing cost with the advancement of material, operational, and strategic technologies, or by enhancing the wind farm power production (Gonzalez-Rodriguez, 2017; Hao et al., 2017). Due to the clustered wind turbine placement inside a wind farm, the phenomena of wake interference among wind turbines is unavoidable which as a result curtails the total wind farm power output to a large extent(Fang et al., 2020; Feijóo and Villanueva, 2017; Li et al., 2018). In this regard, researchers have strived to come up with various approaches to mitigating the wake interference, among which wind farm layout optimization (i.e. optimal placement of wind turbines inside the wind farm) is one of the most prominent tools to reach the goal and it has been a hot topic of research in recent years (Amaral and Castro, 2017; Bossanyi, 2018).
The study of wind farm layout optimization consists of multiple aspects including: 1) complex wind farm modelling (Wang et al., 2017), 2) real wind condition inclusion (Wang et al., 2017), 3) accurate wake modelling (Kuo et al., 2016), and 4) efficient optimization algorithm and method (Beşkirli et al., 2018). Wang et al. (2015) considered the landowners’ decisions on the participation of different land plots of a wind farm, to investigate the importance of different land plots to the overall layout optimization results. Kusiak and Song (2010) proposed the discretization method for the calculation of wind turbine power output under Weibull wind distribution to find the optimum placements of wind turbines inside a circular-shape wind farm. Yang et al. (2018) modified the popularly genetic algorithm (GA) with the Boolean code to optimize the wind turbine positions inside the benchmark square-shape wind farm and the optimization results are compared to the previous publications. Bansal et al. (2018) improved the biogeography-based optimization method with the inclusion of fitness difference for a more efficient optimization process, and the effectiveness of the new optimization method is tested by comparing to the earlier published results. For the study of wind turbine wake modeling, Parada et al. (2017) developed a two-dimensional wake model which considers the variation of wind speed in the wake region with Gaussian wind distribution. The effectiveness of the proposed wake model is validated by comparison to the optimization results with other benchmark models. Kuo et al. (2015) proposed a mechanistic semi-empirical wake interaction model that differs from the widely employed sum-of-square model to accurately capture the wake effect of multiple wind turbines, and the new wake interaction model is based on the energy balance principle inside the far wake region. Ti et al. (2020) applied the novel machine learning method to develop a new model to describe the wake velocity and turbulence with high accuracy and good efficiency. Kuo et al. (2018) proposed a new wake model applied for the wind farm design on complex terrains which however is based on solving a simplified Navier-Stokes equation to save computational cost and hence may possibly lack accuracy. The similar means of proposing the three-dimensional wake model based on the simplified flow theory such as conservation law (Sun and Yang, 2018), linear propagation law (Song et al., 2016) and simplified two-dimensional wake model (Gao et al., 2020; Sun and Yang, 2020) has been in aid of the research in published references. However, the model is simplified two-dimensional and only applicable to an ideal wind farm with flat-terrain. Though various topics of the wind farm layout optimization research have been investigated, a lack of the realistic wind farm optimization study which considers the real wind farm design factors (such as the more accurate wake model) has been observed in literature.
When optimizing a wind farm layout, wind conditions are most commonly approached by using the past meteorological statistics to predict the future ones, which might bring big prediction errors (Foley et al., 2012). Large deviations of actual real wind condition from the design-employed, will probably jeopardize the outcome of wind farm operation and may lead to the wind farm optimization failure, if not properly considered at the initial design stage (Gaumond et al., 2014; Wang et al., 2016). MirHassani and Yarahmadi (2017) published a research paper on wind farm layout optimization under the uncertainty of different hub height wind turbines and a generalized optimization model expression for various wind characteristics, while the wind uncertainty factor was not investigated. Messac et al. (2012) characterized wind uncertainty by establishing a model to propagate the uncertainty into the wind farm power output evaluation. González et al. (2012) considered the uncertainty of wind conditions by testing four different wind direction scenarios and different Weibull distribution scale parameters in the wind farm layout optimization. Yin et al. (2016; 2017) took into account wind uncertainty with several different risk management models, and subsequently analyze the wind farm power output, cost, and risk by the layout optimization of the benchmark square-shape wind farm.
Based on the research gap, a real coastal onshore wind farm located in Southeastern Australia is targeted in this paper for the layout optimization study. A realistic three-dimensional wake model based on machine learning algorithm is proposed to quantify the wake effect of wind turbine interaction and topographic influence of the non-flat terrain. An advanced objective function integrating both the power output and power variability is employed. Due to the limited-time wind data measurement, the inaccuracy of wind condition prediction is studied for the wind farm layout optimization for the first time. The remainder of this paper is organized as follows. Section 2 describes the modelling and the methodology applied for the wind farm layout optimization, including the wind farm and wind turbine models, the new three-dimensional analytical wake model, the wind condition prediction model, and the mathematical optimization formulations. Section 3 discusses the comparison of the wind farm results between the existing and optimized wind farm layouts, followed by the wind farm optimization results under different scenarios of wind data prediction. Section 4 concludes the research work.
Modelling and methodology
Wind farm and wind turbine models
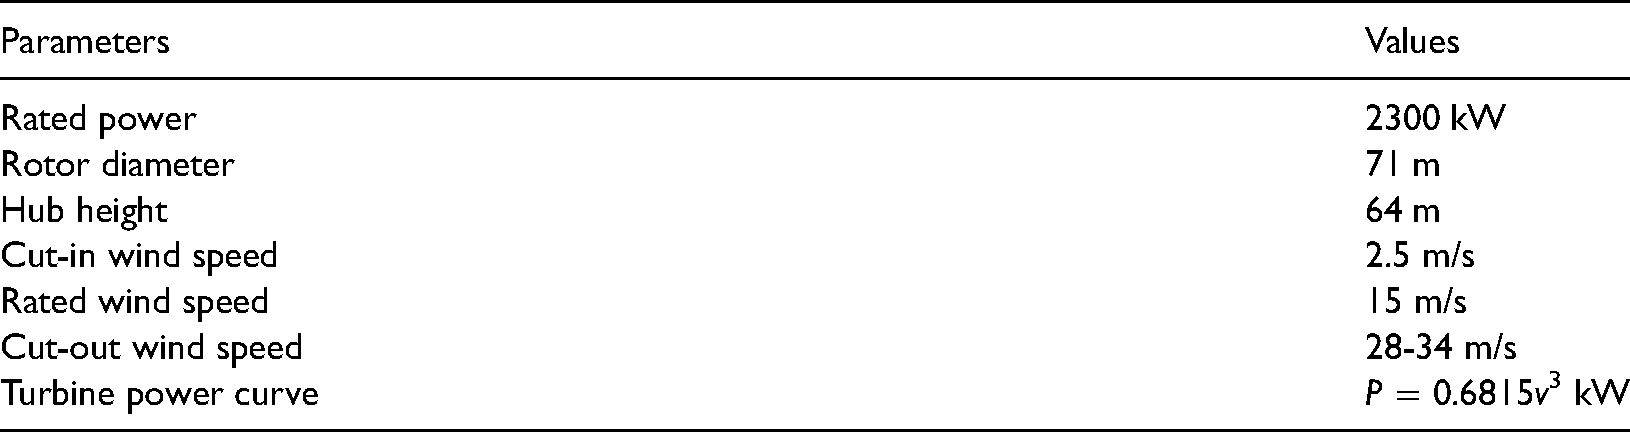
The real wind farm model studied in this paper consists of two separate small wind farms (named Grasmere and Albany wind farm), which is situated along the coastline of Southeast Australia (Gu and Wang, 2013). In this particular wind farm, a total of 18 Enercon 2.3 MW wind turbines (accomplished in 2011) have been installed with the detailed properties of the wind turbine shown in Table 1.
Details of the installed wind turbine properties.
Learning-based two-dimensional wake model
The widely applied Jensen's wake model (Jensen, 1983) for the wind farm layout optimization study is one-dimensional considering the axial wind speed deficit alongside the incoming wind. However, it is non-realistic since the wind speed deficit takes place both in the axial and radial wind directions. It has been further reported in literature that the wake speed variation with Gaussian axisymmetric profile is more accurate in predicting the wind characteristic (Chamorro and Porté-Agel, 2009; Tian et al., 2015). Nevertheless, the arithmetic-based wake model with analytical equations still lacks satisfactory accuracy in comparison to the computational model which is characterized by the advantage of capability in accurately predicting the flow field in the wake (Wang et al., 2016). Therefore, a learning-based two-dimensional wake model based on the CFD simulation method is applied in this paper which is introduced in detail as follows.
Actuator disc method
When quantifying the wind turbine wake effect with CFD simulations(Li et al., 2018; Li et al., 2018; Wu et al., 2015), the actuator disc model has been widely employed in the wind farm optimization and the model regards the wind turbine as a thin disc. According to the actuator disc theory (see Figure 1 (a) which is replicated from reference (Wang and Alden, 2017)), when the incoming free-stream wind with a velocity of 


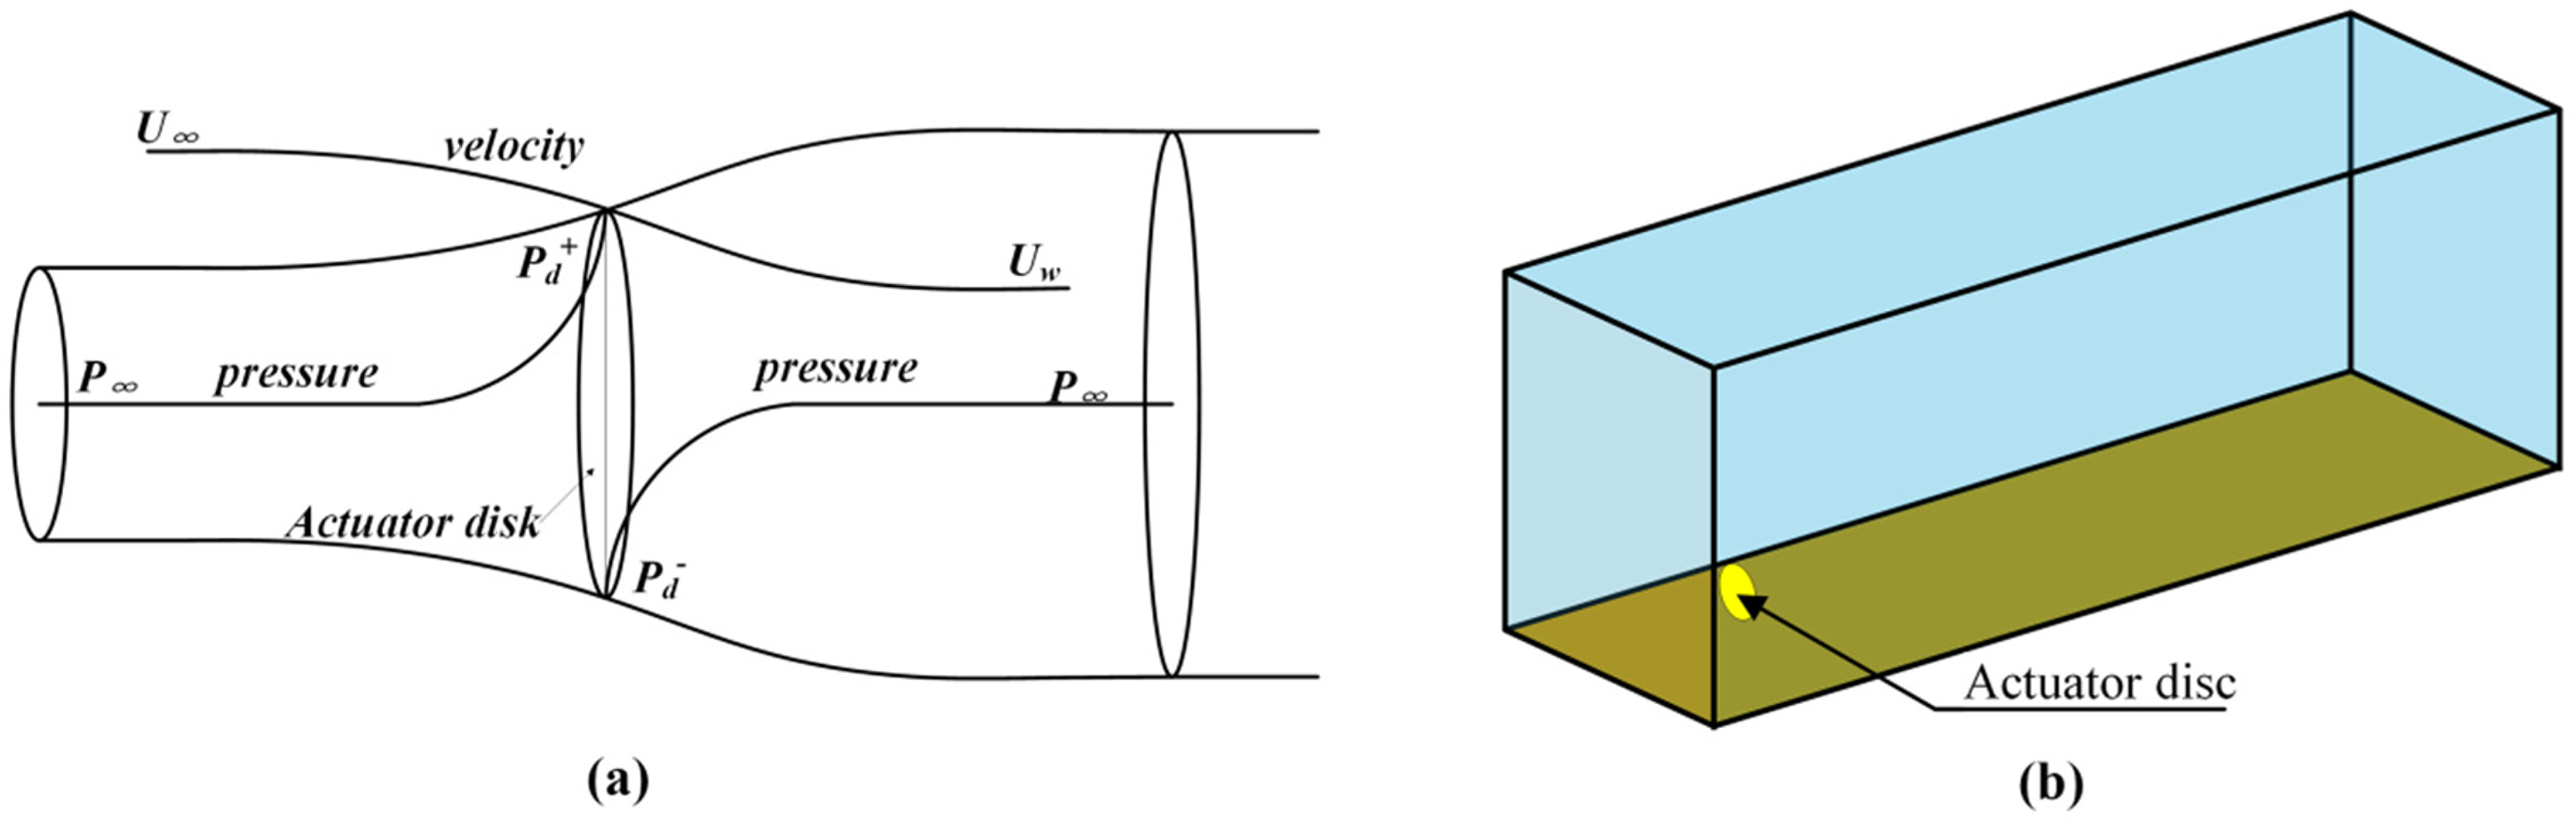
Schematic of wind turbine actuator disc theory for wind power extraction.
With all the parameters calculated based on the above formulas, the porous-jump scheme of the wind turbine actuator disc in Fluent software is set up to simulate the energy loss right in front of and after the disc which gives an expression of the pressure drop as:
Given the disadvantage of the high computational resource cost, the machine learning method is introduced for attaining the computational wind turbine wake model by training and learning the wake flow patterns out of the dataset. Figure 1 (b) shows the wind turbine actuator disc model in the CFD simulation for generating the wind turbine wake dataset. The boundary conditions are set as the velocity inlet and pressure output. The wall boundary is set as free slip wall boundary and the residual criterion is set as 10−4. Four different scenarios of the mesh size including 0.86, 1.13, 1.52 and 2.35 million are tested for the wind turbine wake simulation. Since our target of the simulation is to obtain the wake velocity field, the simulation outcomes of the velocity distribution are compared. It is found that once the meshes exceed the 1.13 million, there are no big differences of the velocity distribution for the ADM simulation results. Hence, the mesh size is chosen to be 1.13 million.
Wake model based on machine learning method
Dataset preparation
Prior to introducing the artificial neural network for the training purposes, the dataset of wind turbine wake under various wind speed conditions must be prepared beforehand.
In our established wake model, the only input variable is the incoming wind velocity. The output variables are the resultant two-dimensional wind speed distribution behind the wind turbine rotor, which are reshaped into a wind profile matrix
Between the cut-in and cut-out wind speeds, the wind speed samples are divided into 316 bins with 0.1 m/s interval to generate the wind turbine flow fields by CFD simulations. By creating the Python scripts to set up the wind speed value and automate the CFD simulation to run and post-process the simulation results under different wind speeds, the automatic CFD simulation platform to generate the flow field database in the wind turbine wake is established. As a result, the matrix of the detailed wind speed variation at the chosen data points behind the wind turbine rotor is obtained under various incoming wind conditions.
Architecture design of artificial neural network
With the massive data of wind speed distribution in the wake as a function of incoming wind conditions prepared, the connection between the incoming wind velocity and the wake flow profile is established with the Artificial Neural Network (ANN) which is based on the machine learning theory. Specifically, the back propagation (BP) ANN which has been one of the most widely applied ANN branch types is employed for training the dataset. The BP ANN consists of input layer, hidden layer and output layer in sequence. The number of input and output layers is constantly one while the hidden layer can be multiple depending on the settings. The adjacent layers are mutually connected with corresponding weight matrix. During the training procedure, the BP algorithm will pass the residual between the network output value and the real value backwards and the weights of all layers are updated along with the back-propagation process towards reaching a minimal value of the residual.
Figure 2 shows the schematic of the wind turbine wake ANN architecture. In the architecture design of our paper study, the input layer neuron number is one which is the incoming wind velocity and the output layer neuron number is 8192 which is equal to the wake profile data points. There are three hidden layers with the neuron numbers of 650, 1300 and 4096, respectively. Apart from the output layer, all other layers require the activation function to guarantee the accuracy of the back-propagation process. In our study, the widely applied Rectified Linear Unit (Relu) function is employed as the activation function. The network is established and trained in the Pytorch platform with the Mean Square Error loss function (MSELoss) as the loss function for training process and Adam as the optimization module. The training procedure is carried out by GPU means and the configuration of the operational hardware platform is RTX 2060 with 6 GB memory. As a result of the built and trained ANN architecture, the two-dimensional wake profile of the wind turbine can be acquired in seconds under any given incoming wind velocity.
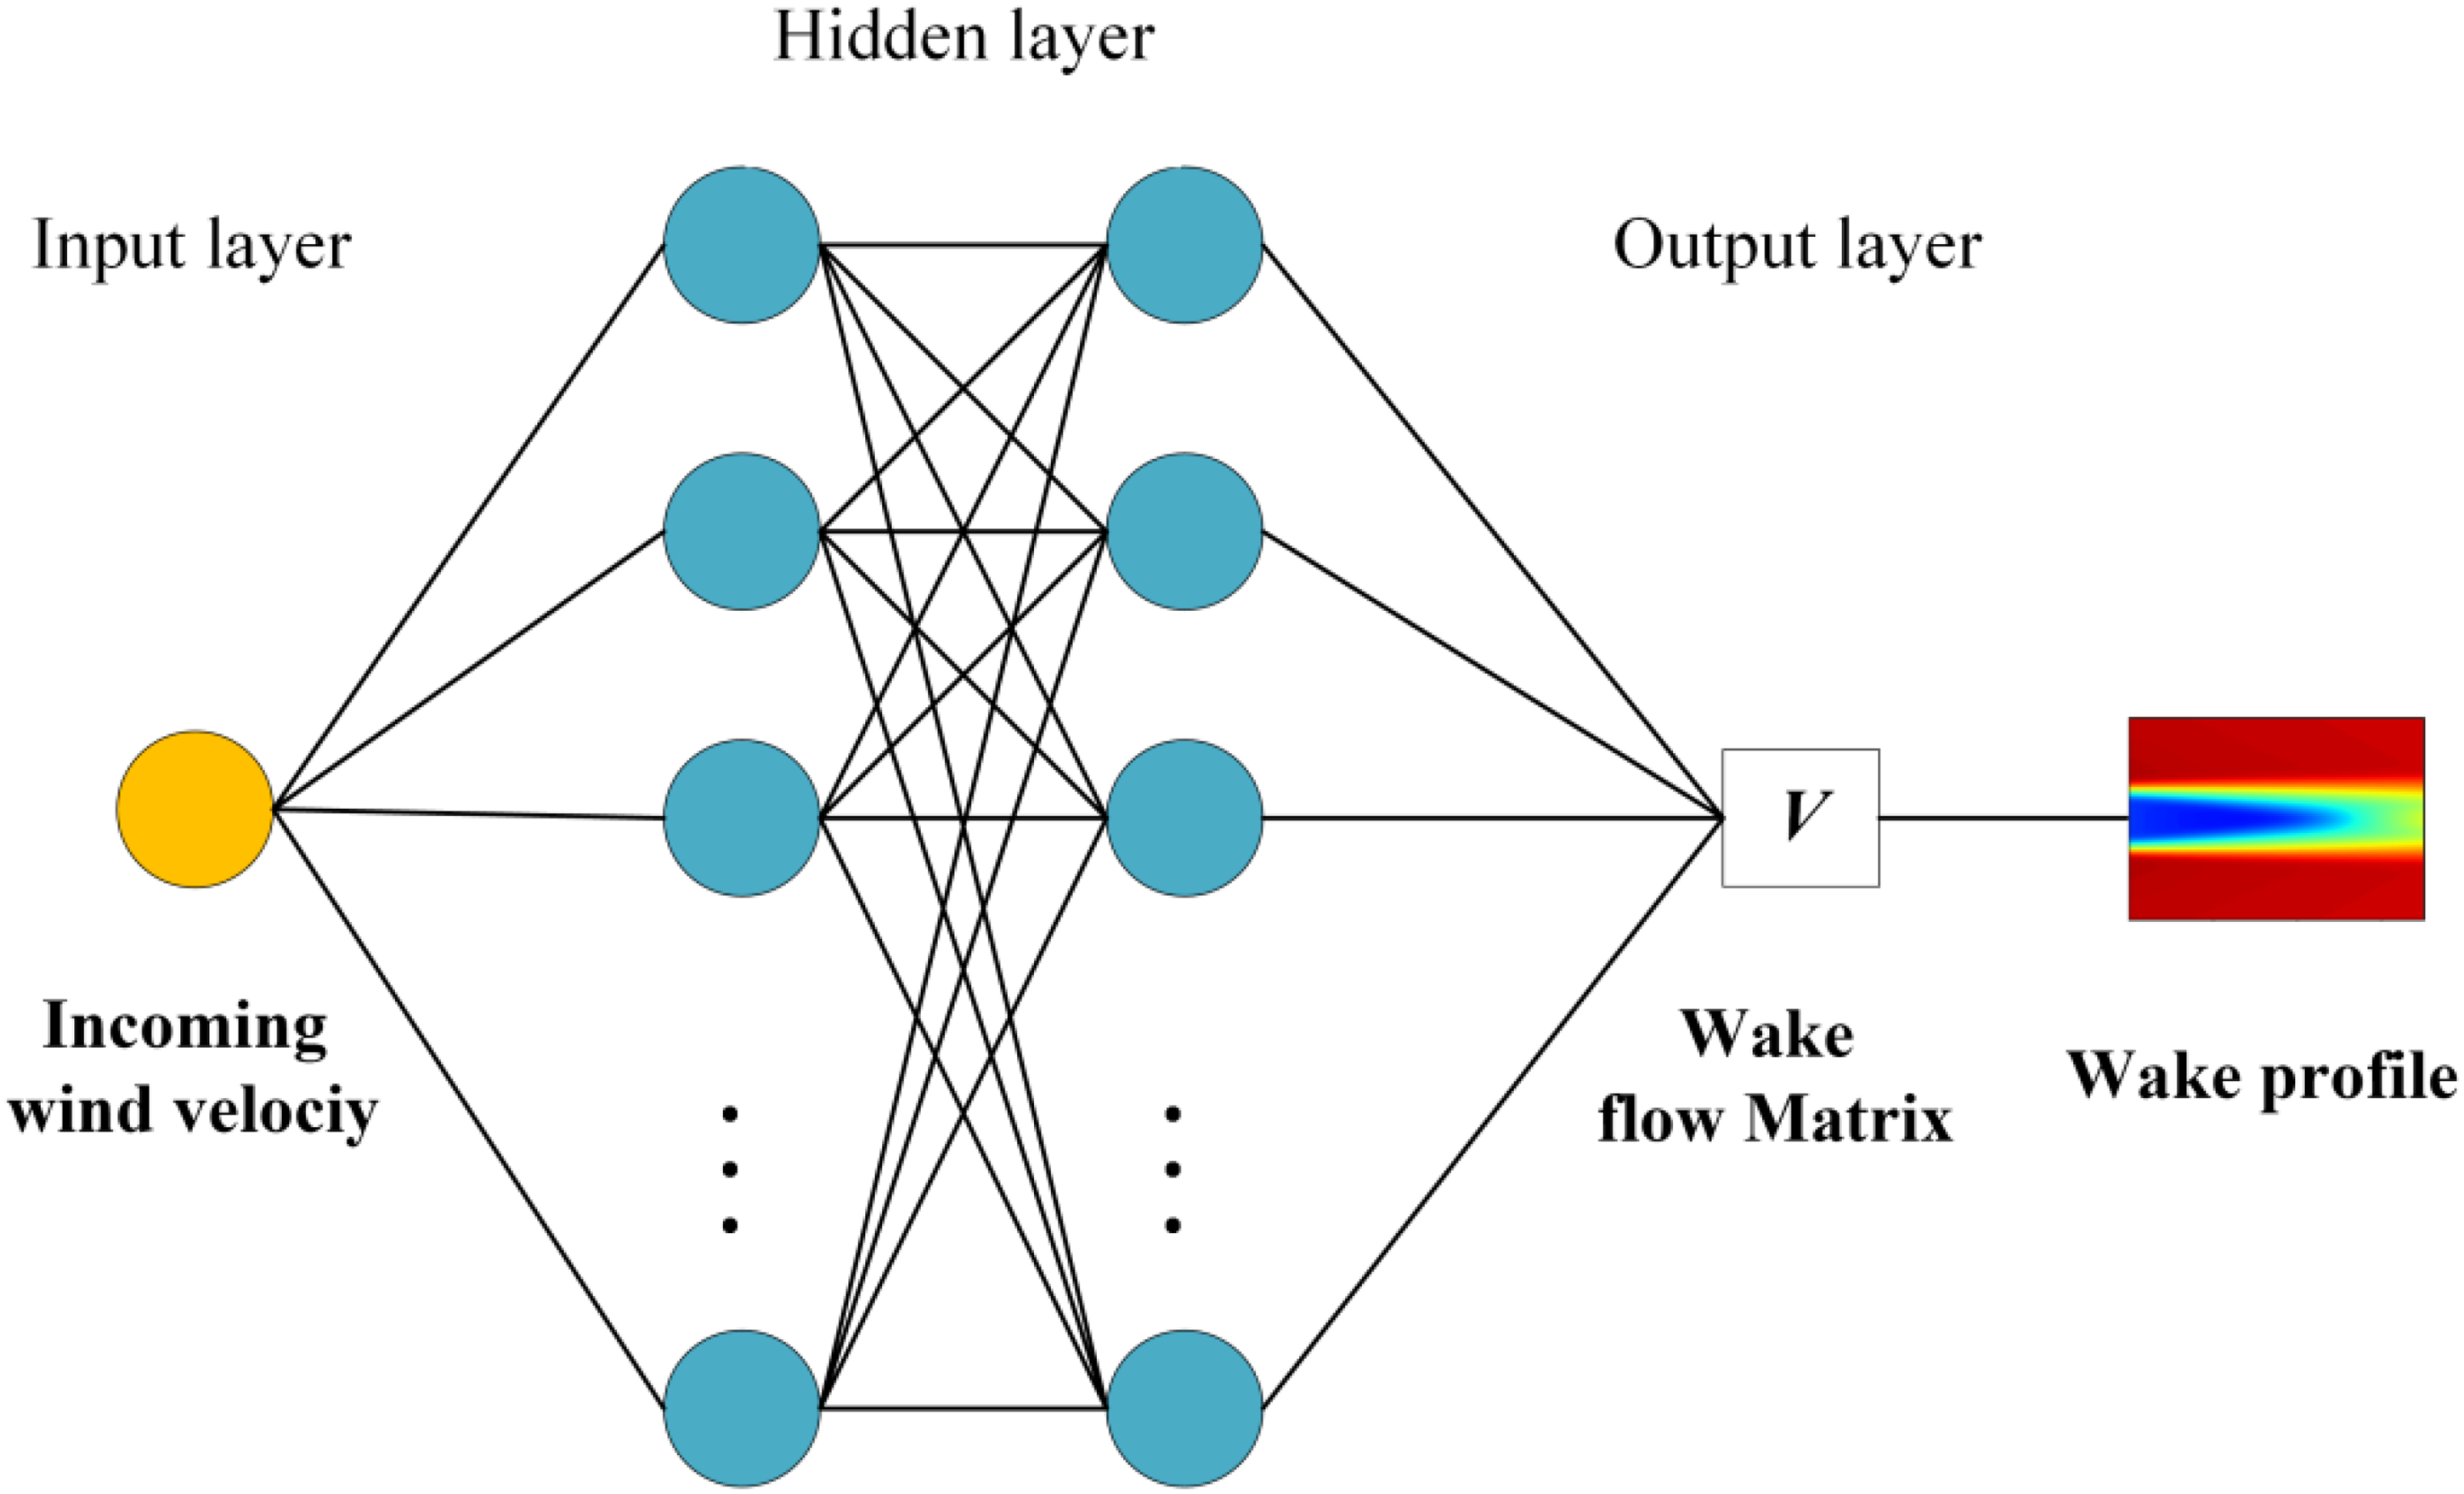
Architecture design of predicting the wind turbine wake profile.
Figure 3 shows the resultant two-dimensional wind turbine wake model established from the ANN machine learning method. Figure 4(a) and Figure 4(b) presents the CFD simulated and the ANN predicted wind turbine wake profiles respectively, while Figure 4(c) presents the error between the simulation and prediction results in percentage. As can be seen, the prediction results are fairly satisfactory with the largest discrepancy below 10% which is sporadically distributed along the axis direction of the wake.
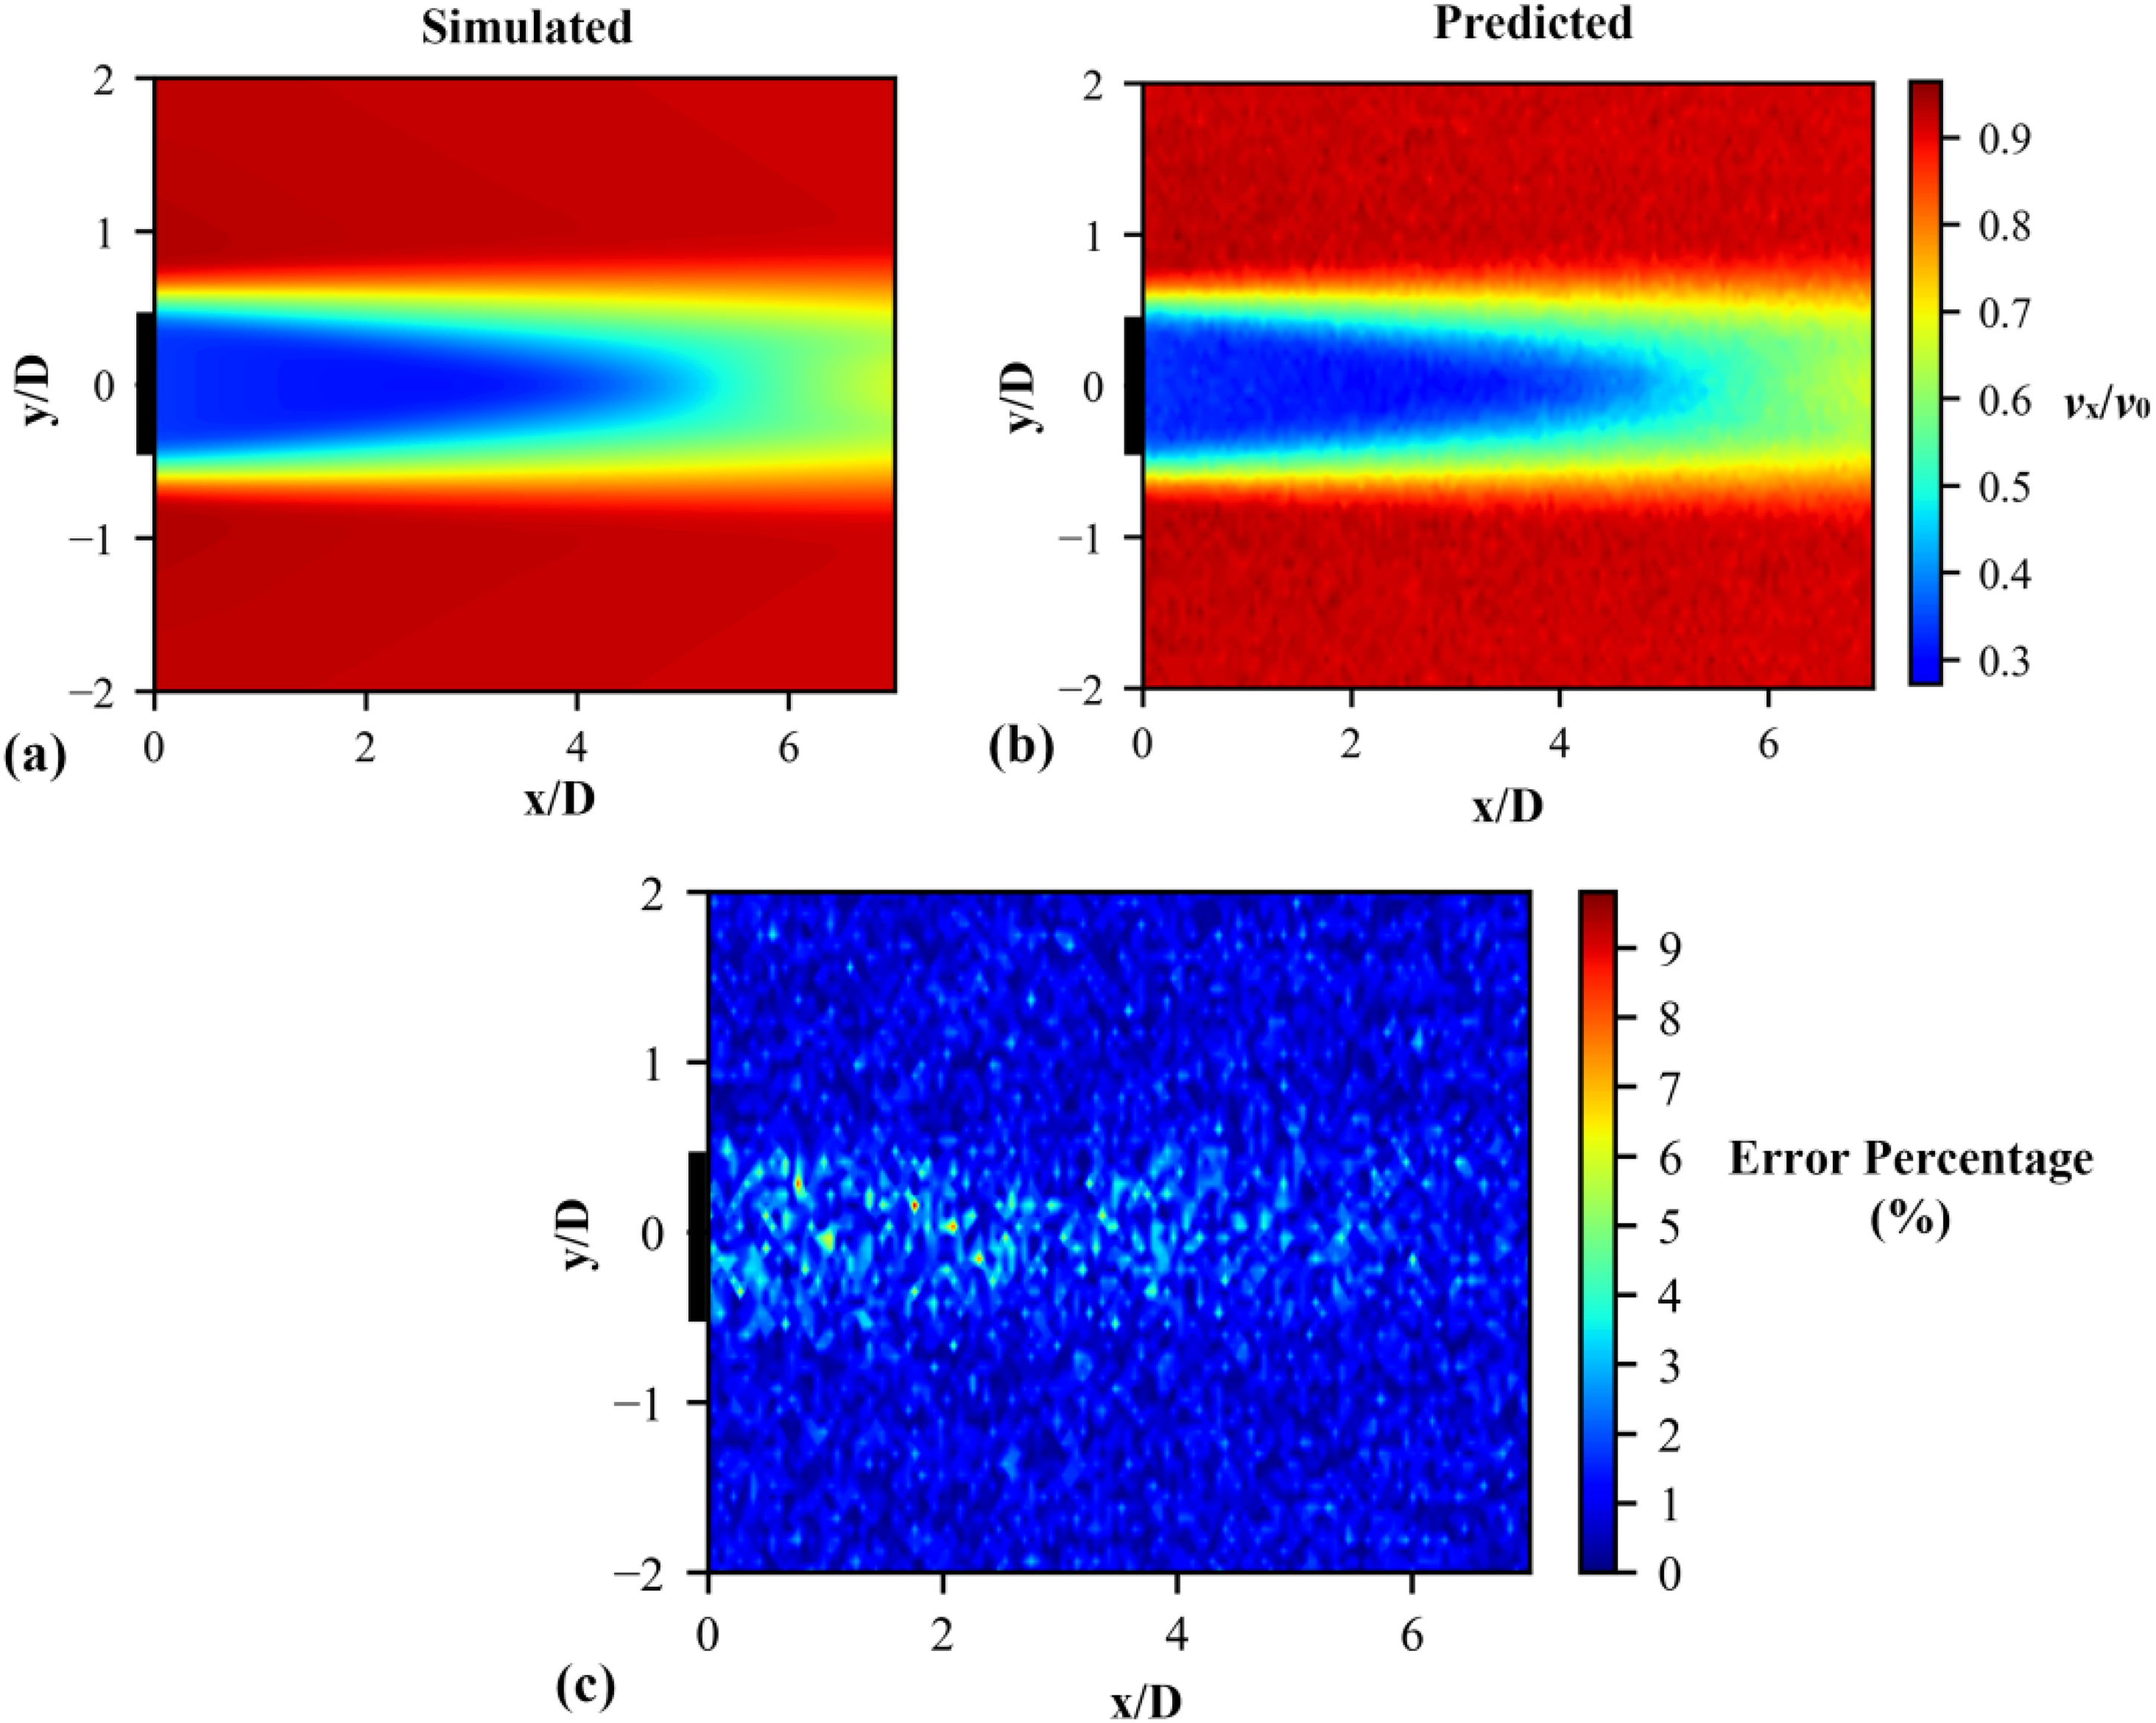
Wind speed contour calculated from the ANN machine learning method: (a) CFD simulation result, (b) prediction result and (c) distribution of prediction error over CFD simulation.
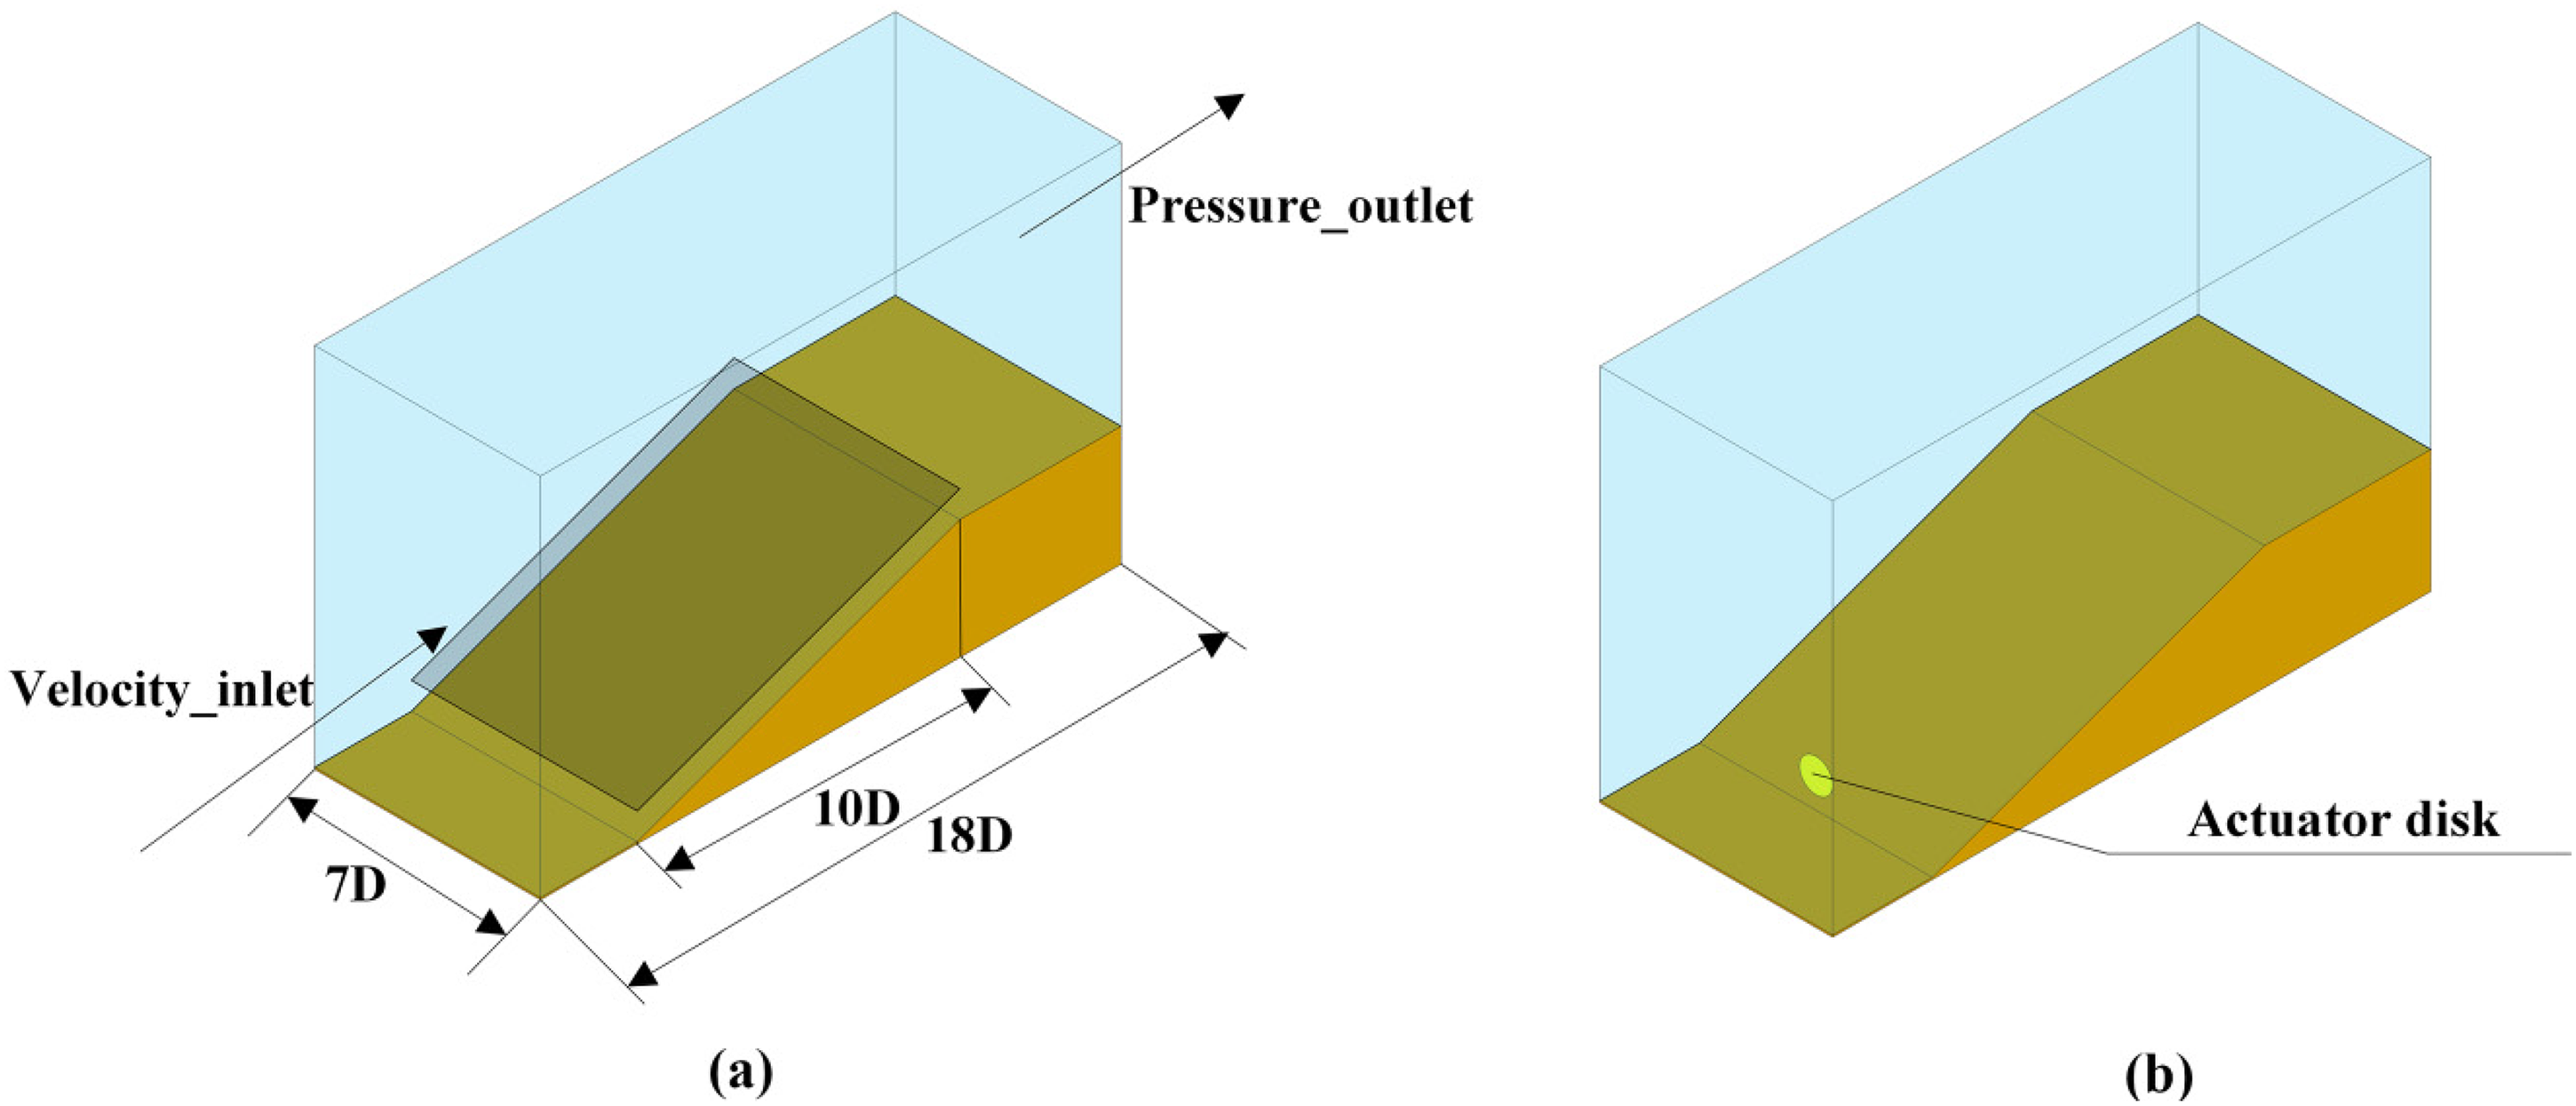
CFD simulation detail for validating the wake model: (a) dimension and boundary condition of the simulation model without wind turbine and (b) simulation model with an actuator disc wind turbine to calculate the wake wind speed.
The two-dimensional wake model is introduced above based on the machine learning method with the aid of actuator disc theory and artificial neural network. The learning-based two-dimensional wake model is extended to be three-dimensional accounting for both the wind turbine wake interaction and topographic effect inside a real wind farm with non-flat terrains.
Three-dimensional wake model incorporating terrain effect
On the basis of the aforementioned two-dimensional wake model, a novel three-dimensional wake model is proposed by incorporating the topographic effect of non-flat terrain into the wind turbine wake quantities. In this section, a 3-D wind multiplier method is introduced to account for the wind speed variation over non-flat terrain, followed by the verification of the novel wake model compared to the high-fidelity CFD simulation results.
Wind multiplier method
With the learning-based two-dimensional wake model, the wind turbine wake interactions inside a real wind farm cannot be accurately described due to the influence of the topography on wind behavior over non-flat wind farm terrain. Here, a 3-D wind multiplier method is employed to modify the wake-affected wind speed calculated by the two-dimensional wake model. The process of the wind multiplier calculation is presented below.
Firstly, a three-dimensional wind farm model free of wind turbines is generated by the combination of transforming the terrain altitudes into the contour data by a geographic information system (GIS) handling software package and the Rhino3D computer-aided design software is applied to establish the real wind farm terrain model. The real wind farm three-dimensional model is then subtracted from the encapsulated solid rectangle to obtain the air flow model for computational fluid dynamics (CFD) simulation of wind farm.
The wind farm CFD simulations are performed by importing the three-dimensional model into the ANSYS Fluent software with pre-processing steps taken. Specifically, the velocity inlet and pressure outlet are set as the inlet and outlet boundary conditions for the simulations, respectively. Furthermore, as the free-stream wind speed varies as a function of the altitude, a user defined function (UDF) for the velocity inlet boundary condition is programmed in the Fluent software and it obeys power law pattern by: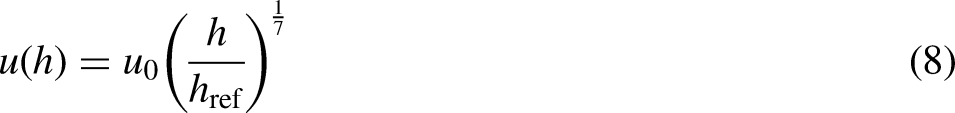

Based on the two-dimensional PARK-Gaussian wake model and the wind multiplier value, the resultant wind speed v over non-flat terrain under an free-stream wind speed 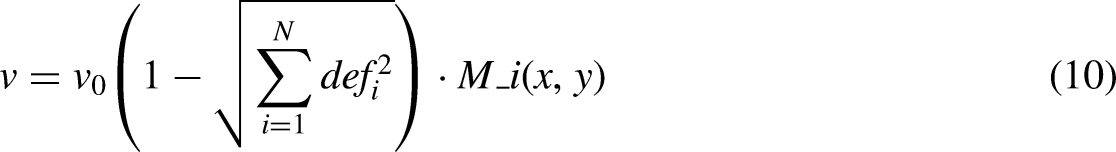
Wake model validation by high-fidelity CFD simulation
Due to a lack of the real onshore wind farm (with terrain altitude variations) test data to validate the accuracy of the proposed wake model, the high-fidelity CFD simulation is carried out for a standalone wind turbine to compare the proposed wake model and the simulation results of the wind speed variation over a non-flat terrain.
For the validation with CFD simulation, the exactly same wind turbine model shown in Section 2.1 is employed while the wind farm terrain is simplified. As can be seen in Figure 4, the tested wind farm has a fixed slope of
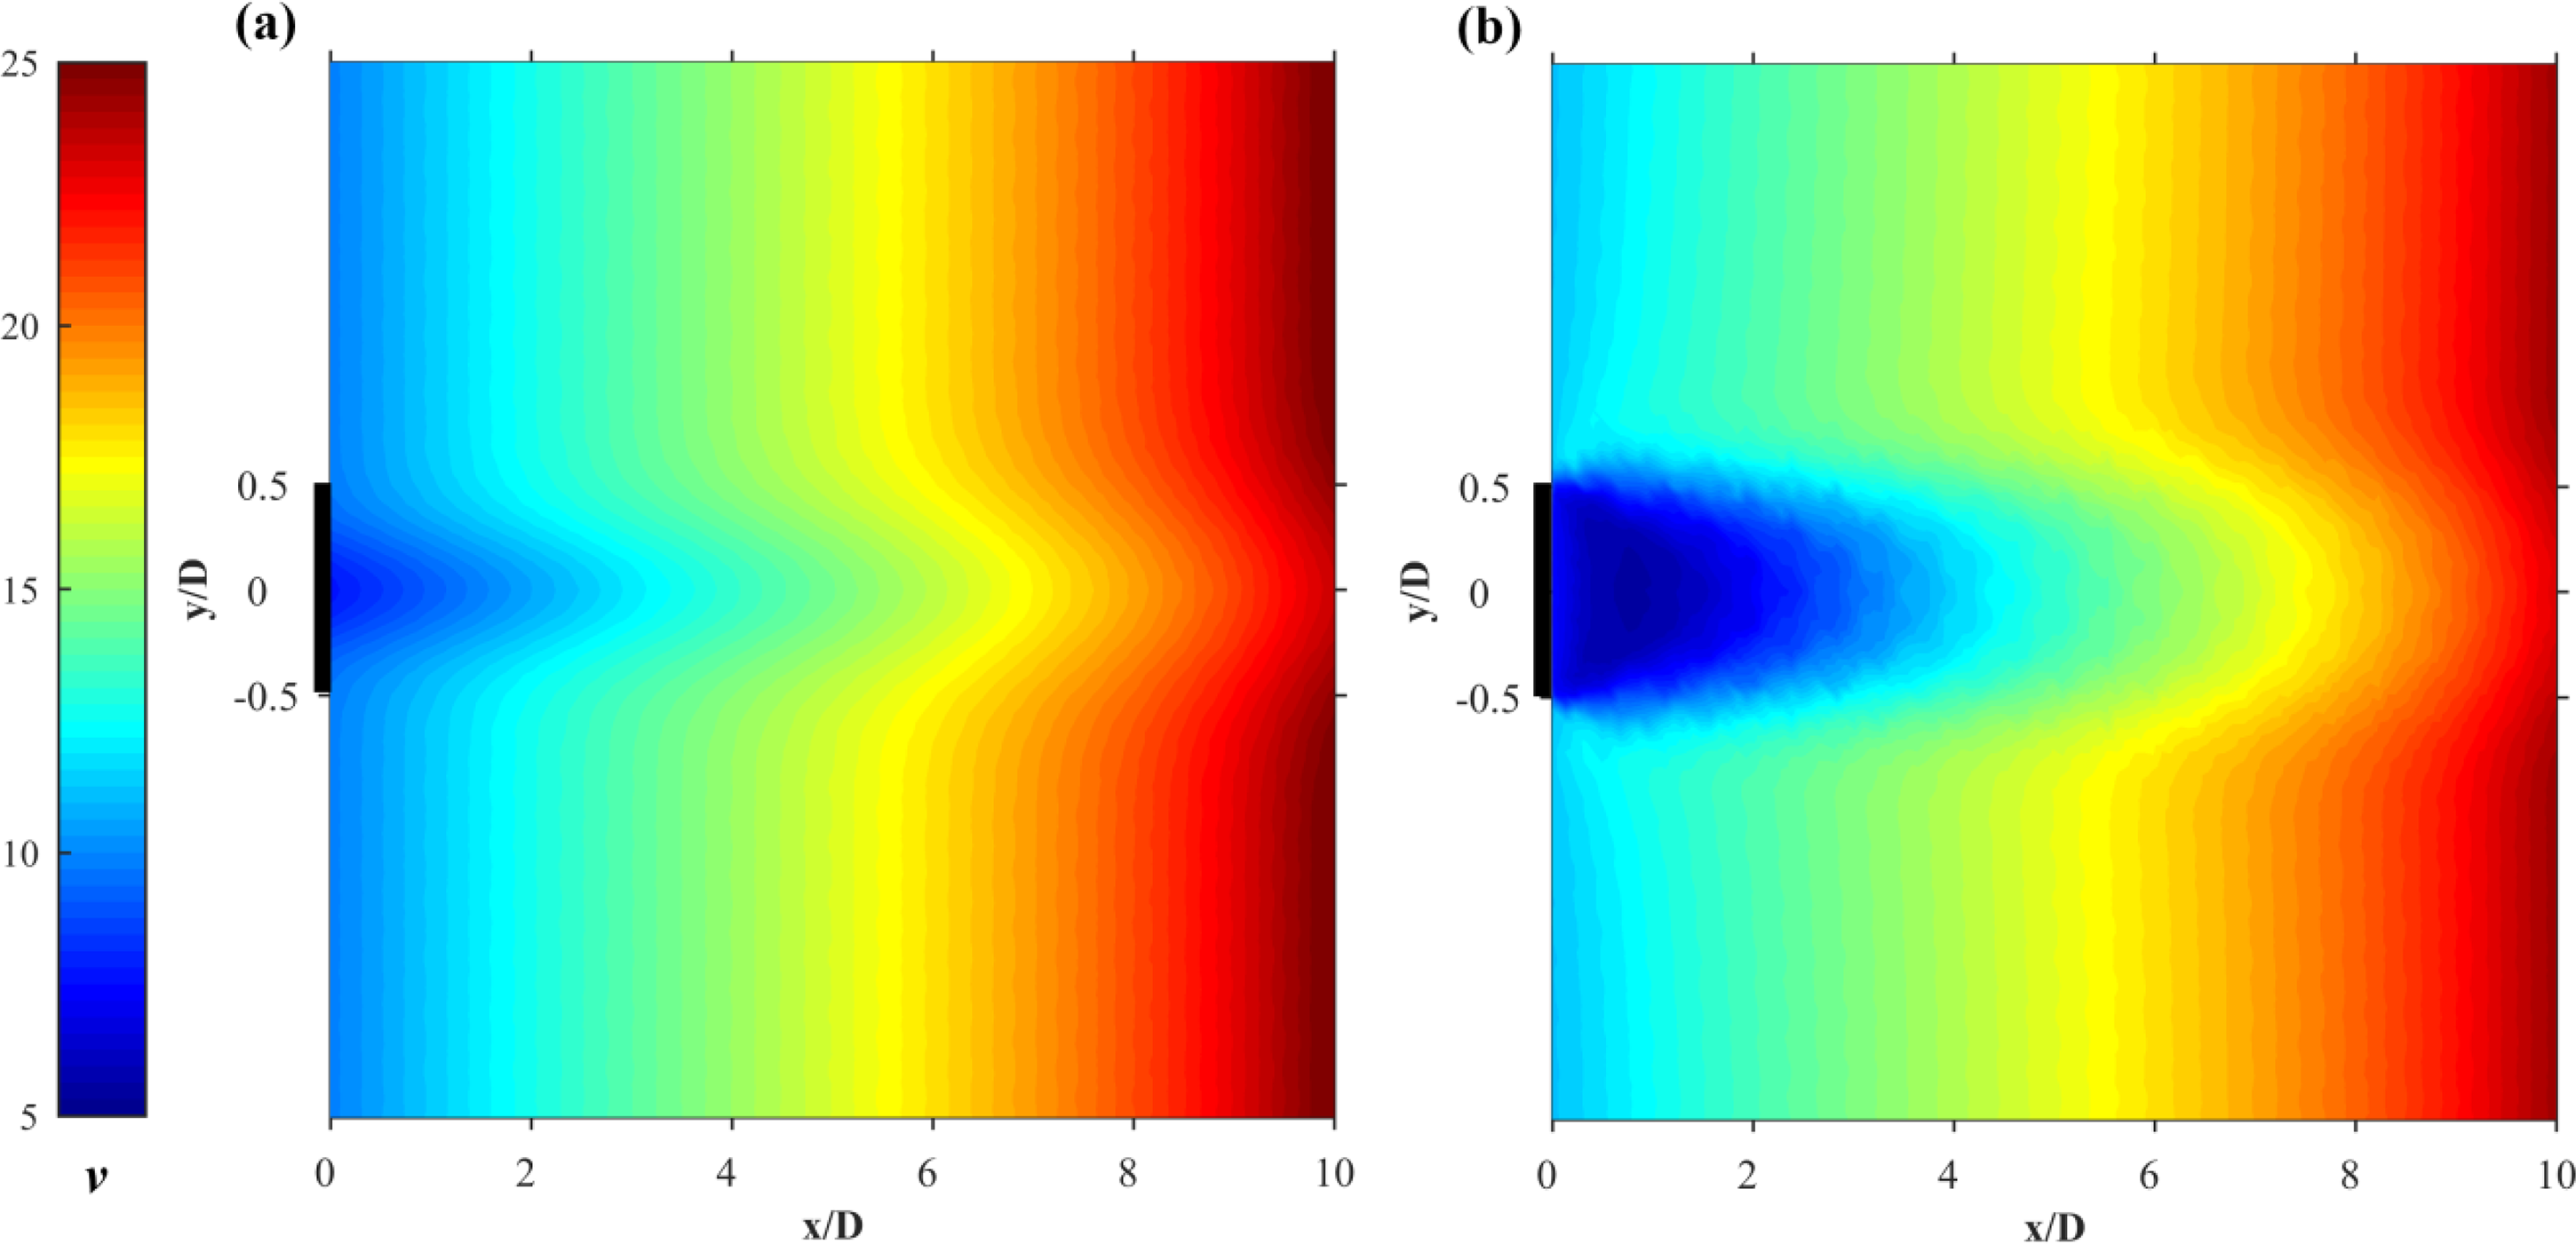
Comparison of (a) the proposed three-dimensional wake model and (b) the high-fidelity CFD simulation results.
In summary, a novel three-dimensional wake model based on complex Navier-Stokes equations (computational model), taking into account both the wind turbine interaction and the topographic effect on the wind speed variation (Gao et al., 2016), is proposed for a real wind farm optimization study. The novel wake model is achieved by means of: 1) machine learning algorithm to establish the implicit relationship between the wake velocity and incoming wind speed; and 2) distribution of the wind multiplier coefficient obtained by CFD simulation, which is incorporated into the original wake model to account for the wind speed variation over non-flat terrain. In order to validate the new proposed three-dimensional wake model, the comparison of the wind speeds calculated from the proposed wake model and the high-fidelity CFD simulation is made. Results show that though the discrepancy among the near-wake region (less than 4 times diameter) is non-negligible, the new wake model agrees very well with the CFD results among the far-wake region, which proves the validity of the new model applied for the real wind farm layout optimization (considering the proximity constraint of wind turbines is beyond 5 times diameter).
Wind data prediction model
Continuous Weibull distribution model
Most wind conditions in the reported wind farm optimization studies are ideal, which are characterized by the discrete wind description including the constant/variable wind speed(s)/direction(s). Realistically, both wind speed and wind direction are continuously changing which can be approximated by certain kinds of distribution form, e.g., the Rayleigh or normal distribution (Safari and Gasore, 2010). In this paper, the Weibull distribution which has been most widely applied in reference study (Soulouknga et al., 2018), will be applied for approximating the wind speed variation as an example. Note that it is used as an example of demonstration and can be replaced by other forms of distribution so long as it matches the characteristics of the local wind scenario. The mathematical expression of Weibull distribution is given by (Seguro J and Lambert, 2000):

Parameters of wind speed Weibull distribution under different wind direction sectors.
Discrete wind data generation over short-, medium- and long-terms
Due to a lack of the meteorological observation wind condition data for the real wind farm, the wind data can only be obtained by the Monte Carlo simulation based on the continuous wind distribution model.
According to reference (Wang et al., 2015; Xue et al., 2020), the intention of forecasting wind power is to estimate the average power production of wind farm in the near future. The estimation can be categorized into short-term, medium-term and long-term. The short-term are considered for power system management or energy trading. The medium-term are considered for planning maintenance of wind farms, while the long-term are considered for the optimal design of wind farms. As the name suggests, the wind condition data extracted for different estimation purposes are correspondingly performed over short, medium and long time period, respectively. For an optimal wind farm design, long-term wind condition data are preferred to reduce the discrepancy between the measured wind data and the predicted future wind data. Even so, the error of the wind condition prediction can still be huge due to the unpredictability of the wind condition(Kang et al., 2014; Wang et al., 2018). The time period of the wind measurement is always restricted which bring about the problem of the selection of the wind sampling time. In this paper, Monte Carlo (MC) simulation is performed to acquire the random discrete data obeying the continuous Weibull distribution model(Chen et al., 2015; Hu et al., 2020). Sample numbers with three magnitudes, i.e., 1000, 10,000 and 100,000, are adopted for the MC simulation to mimic the wind data measured under various time periods. With the commonly used 5 min frequency of wind condition measurement, the simulated short-, medium- and long-term durations are approximately 3 days, 1 month, and 1 year.
The Root Mean Square Error (RMSE) is calculated to obtain the discrepancy of the probability of occurrence between the predicted and the actual values, which is given by:
Comparison of RMSE values of wind speed approximation with monte carlo method for the 12 wind direction sectors.
After acquiring the discrete dataset, the average speed 
Predicted average wind speed with margin of error for the 12 wind direction sectors by monte carlo method.
The probability of different wind direction sectors has been extracted from reference (Wang et al., 2017) for the real wind farm optimization. Figure 8 shows the probability density of occurrence for different wind direction sectors. In the similar manner as wind speed, Monte Carlo simulation over different time span of wind data measurement has been performed for the wind direction prediction. Corresponding to the wind speed representation, the MoE of wind direction prediction are
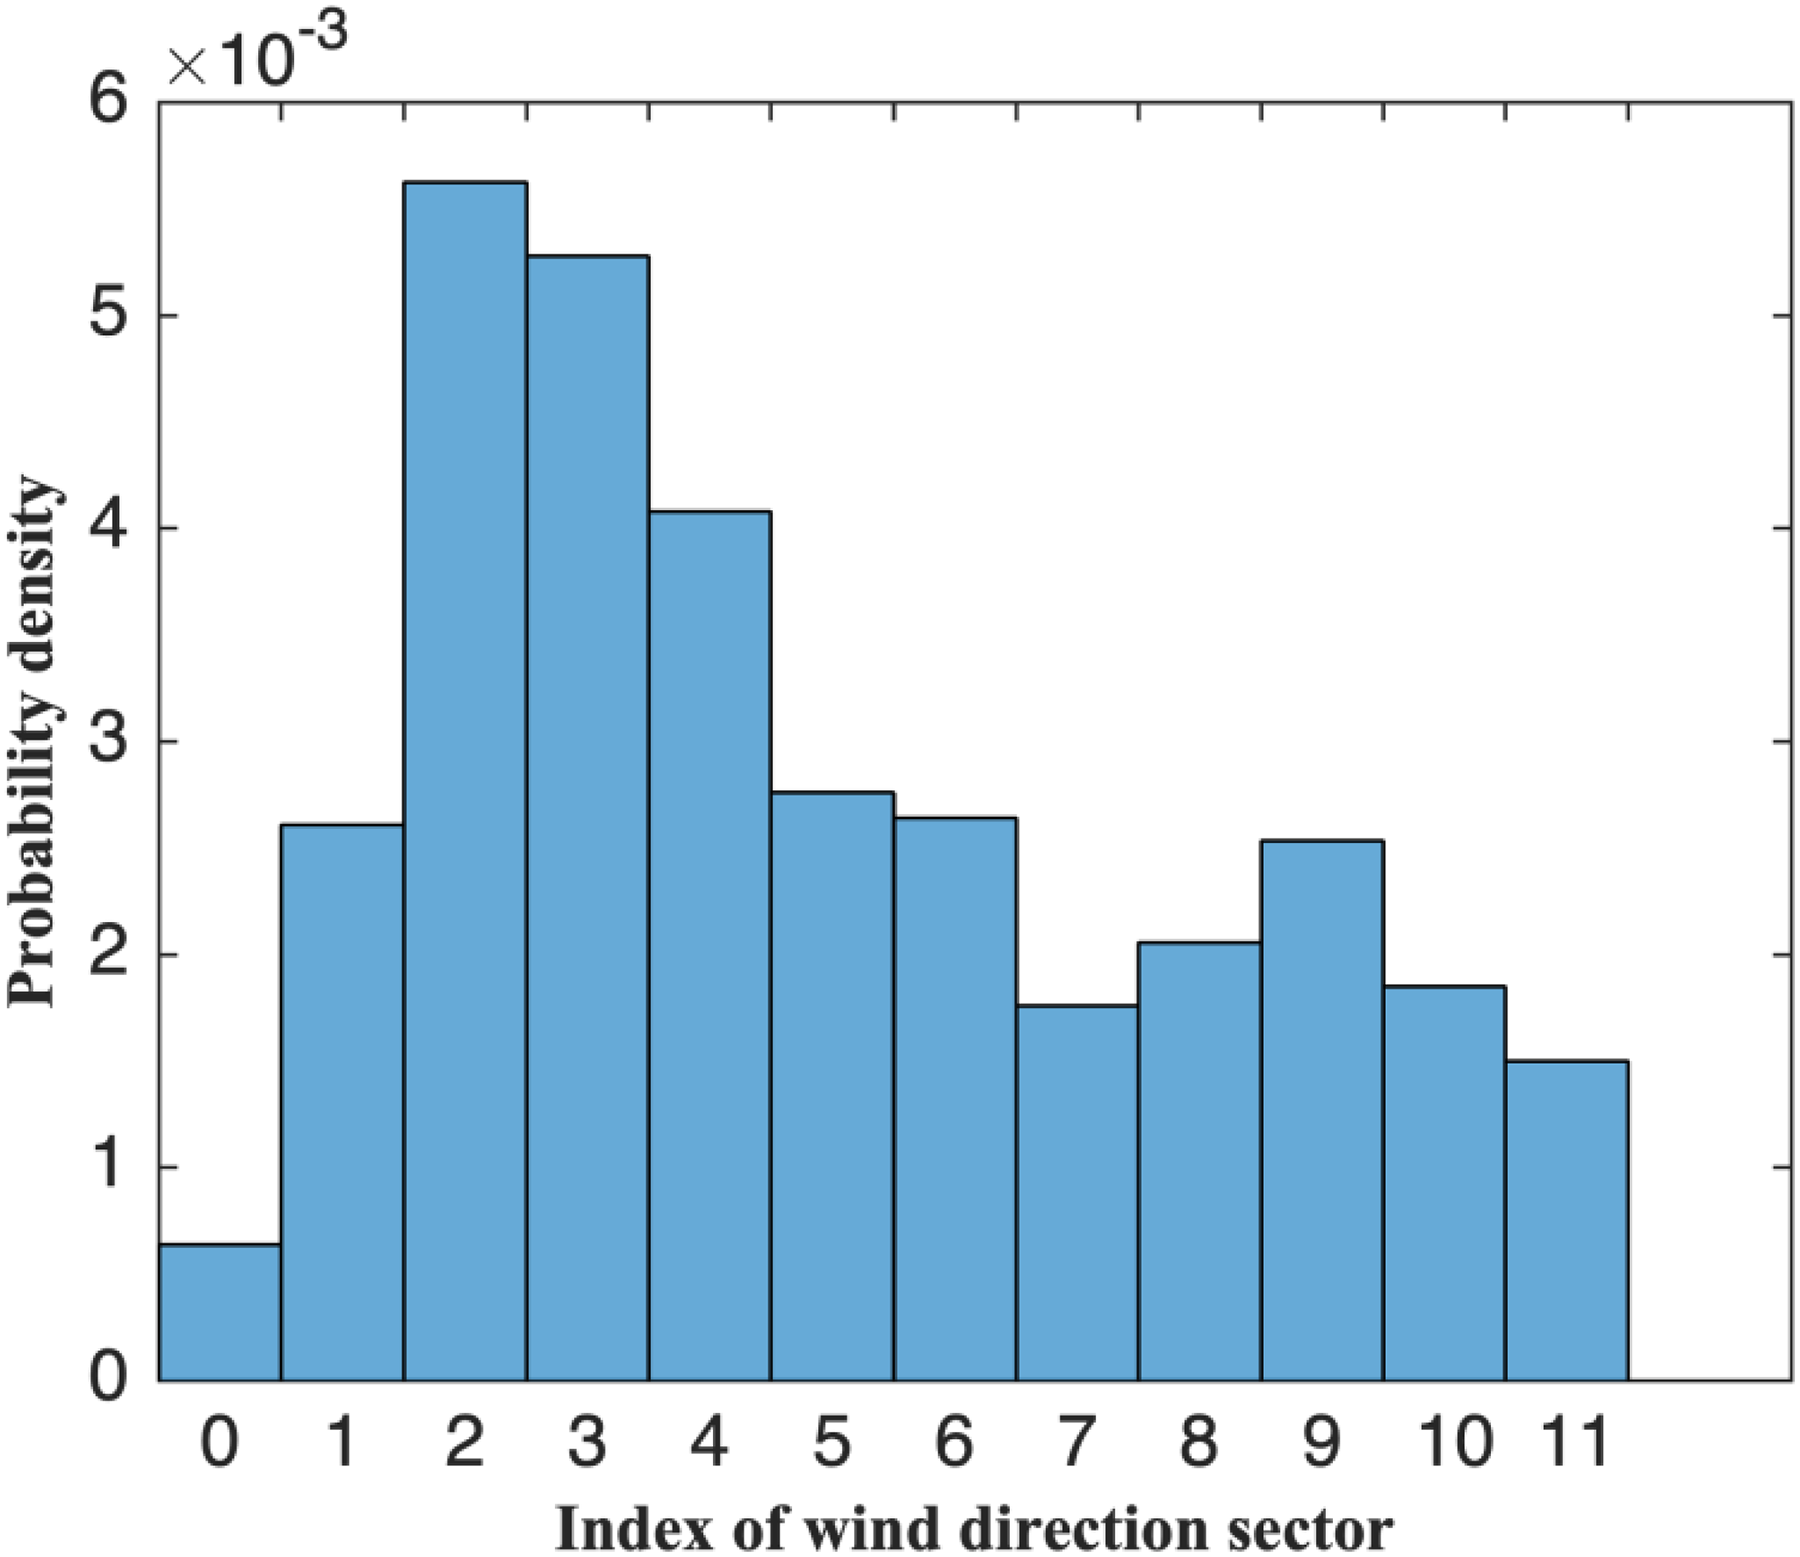
Probability density of occurrence for different wind directions.
Mathematical optimization formulation
For the wind farm layout optimization, the objective function is the confidence interval (CI) of the mean total power output. In order to increase the likelihood of achieving the most power output under different scenarios of wind data time span, we aim to simultaneously maximize the total wind farm power average and minimize the width of its CI. Hence, the lower end of CI (with 95% confidence) is maximized. The two options of the objection function for wind farm layout optimization can be mathematically formulated as:


In the objective function, the mean total power output 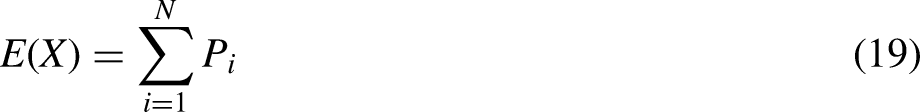
Results and discussion
In this section, the comparison of the wind farm output performance with the existing and optimized wind turbine locations is made to verify the effectiveness of our wind farm layout optimization scheme in the first place. Subsequently, the optimization results under different scenarios of time span of wind data measurement are presented.
Effectiveness of wind farm layout optimization
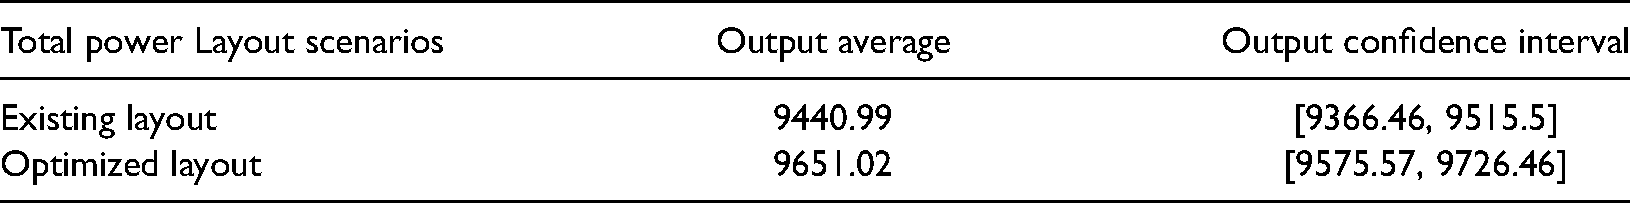
The wind farm performance with the existing real wind turbine locations and the optimized wind turbine locations are compared in Figure 9 with a total of 18 wind turbines installed, and the results are presented based on the long-term wind data
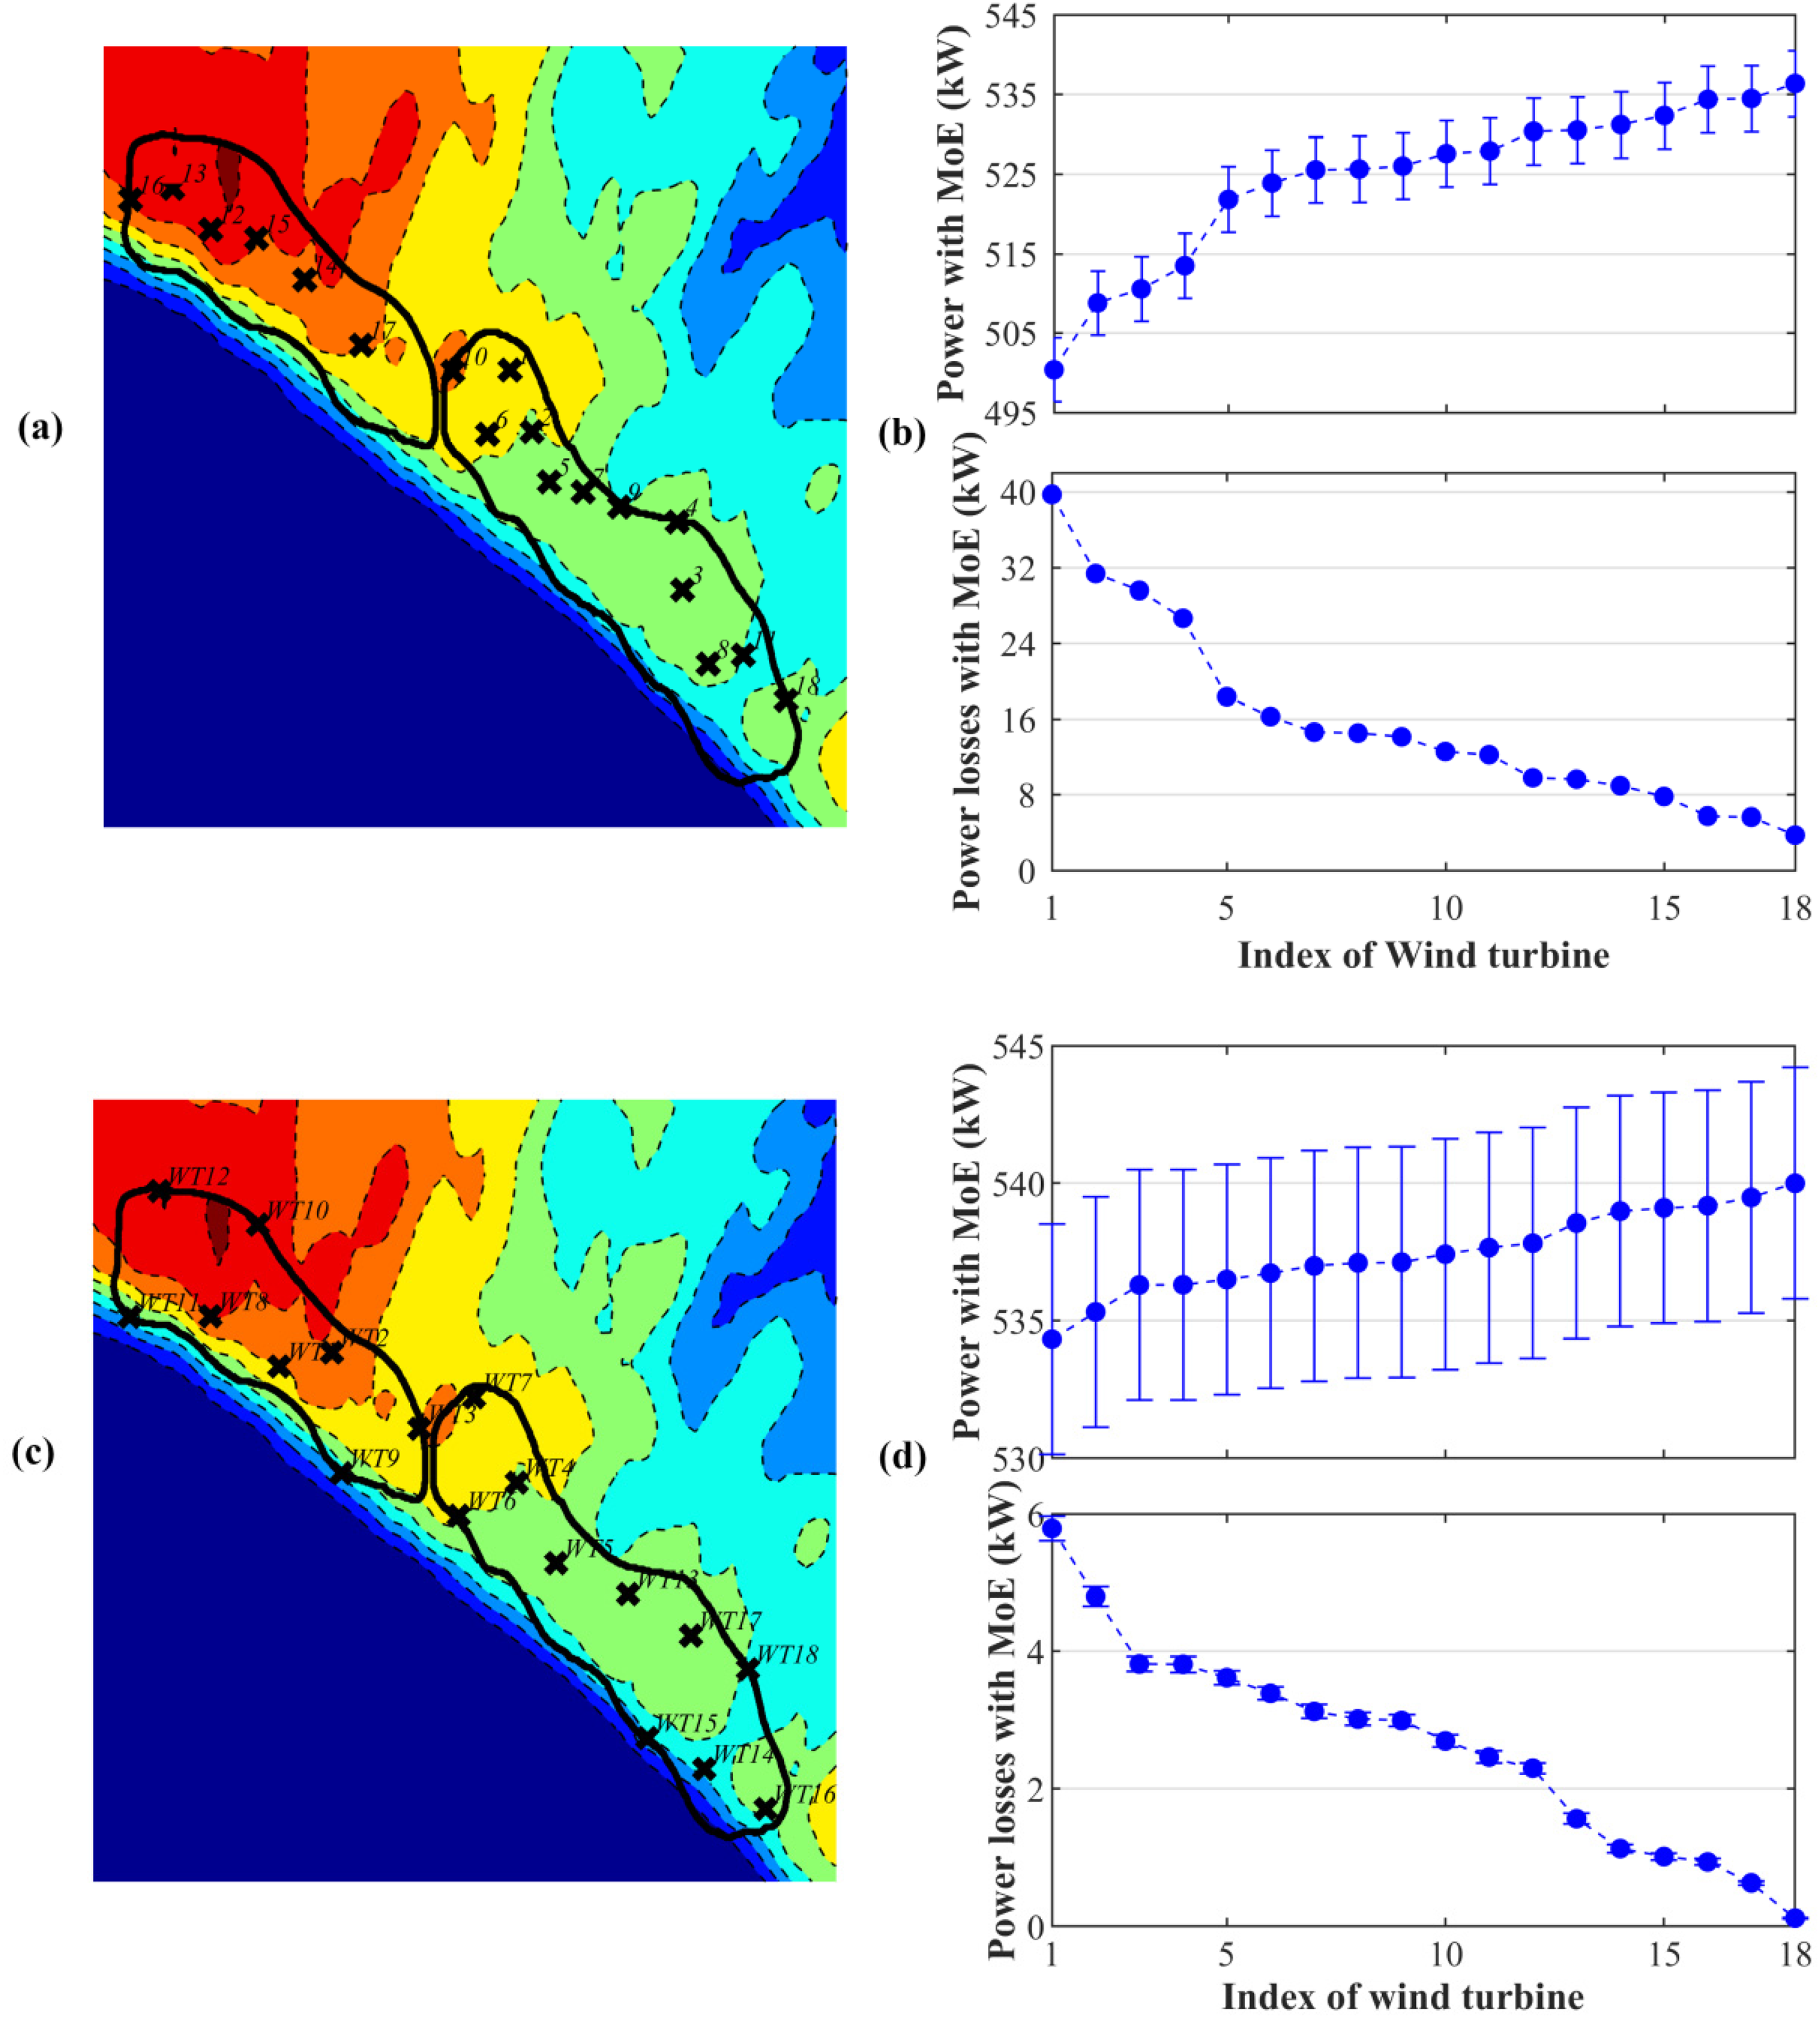
Comparison of existed and optimized wind farm layouts: (a) existed wind turbine locations, (b) existing wind turbine power output average and losses including confidence interval, (c) optimized wind turbine locations and (d) optimized wind turbine power output average and losses including confidence interval.
Comparison of total power output average and confidence interval (in kW) for the existed and the optimized wind farm layouts.
Comparison of optimized wind farm with wind data of different time-spans
Figure 10 shows the power average and its margin of error (MoE) for overall wind farm power output based on different scenarios of wind data. As the wind turbine number increases, both the power and its MoE increase in general. It is observed that it yields a least wind farm power output average with a largest MoE under the scenario of short-term wind
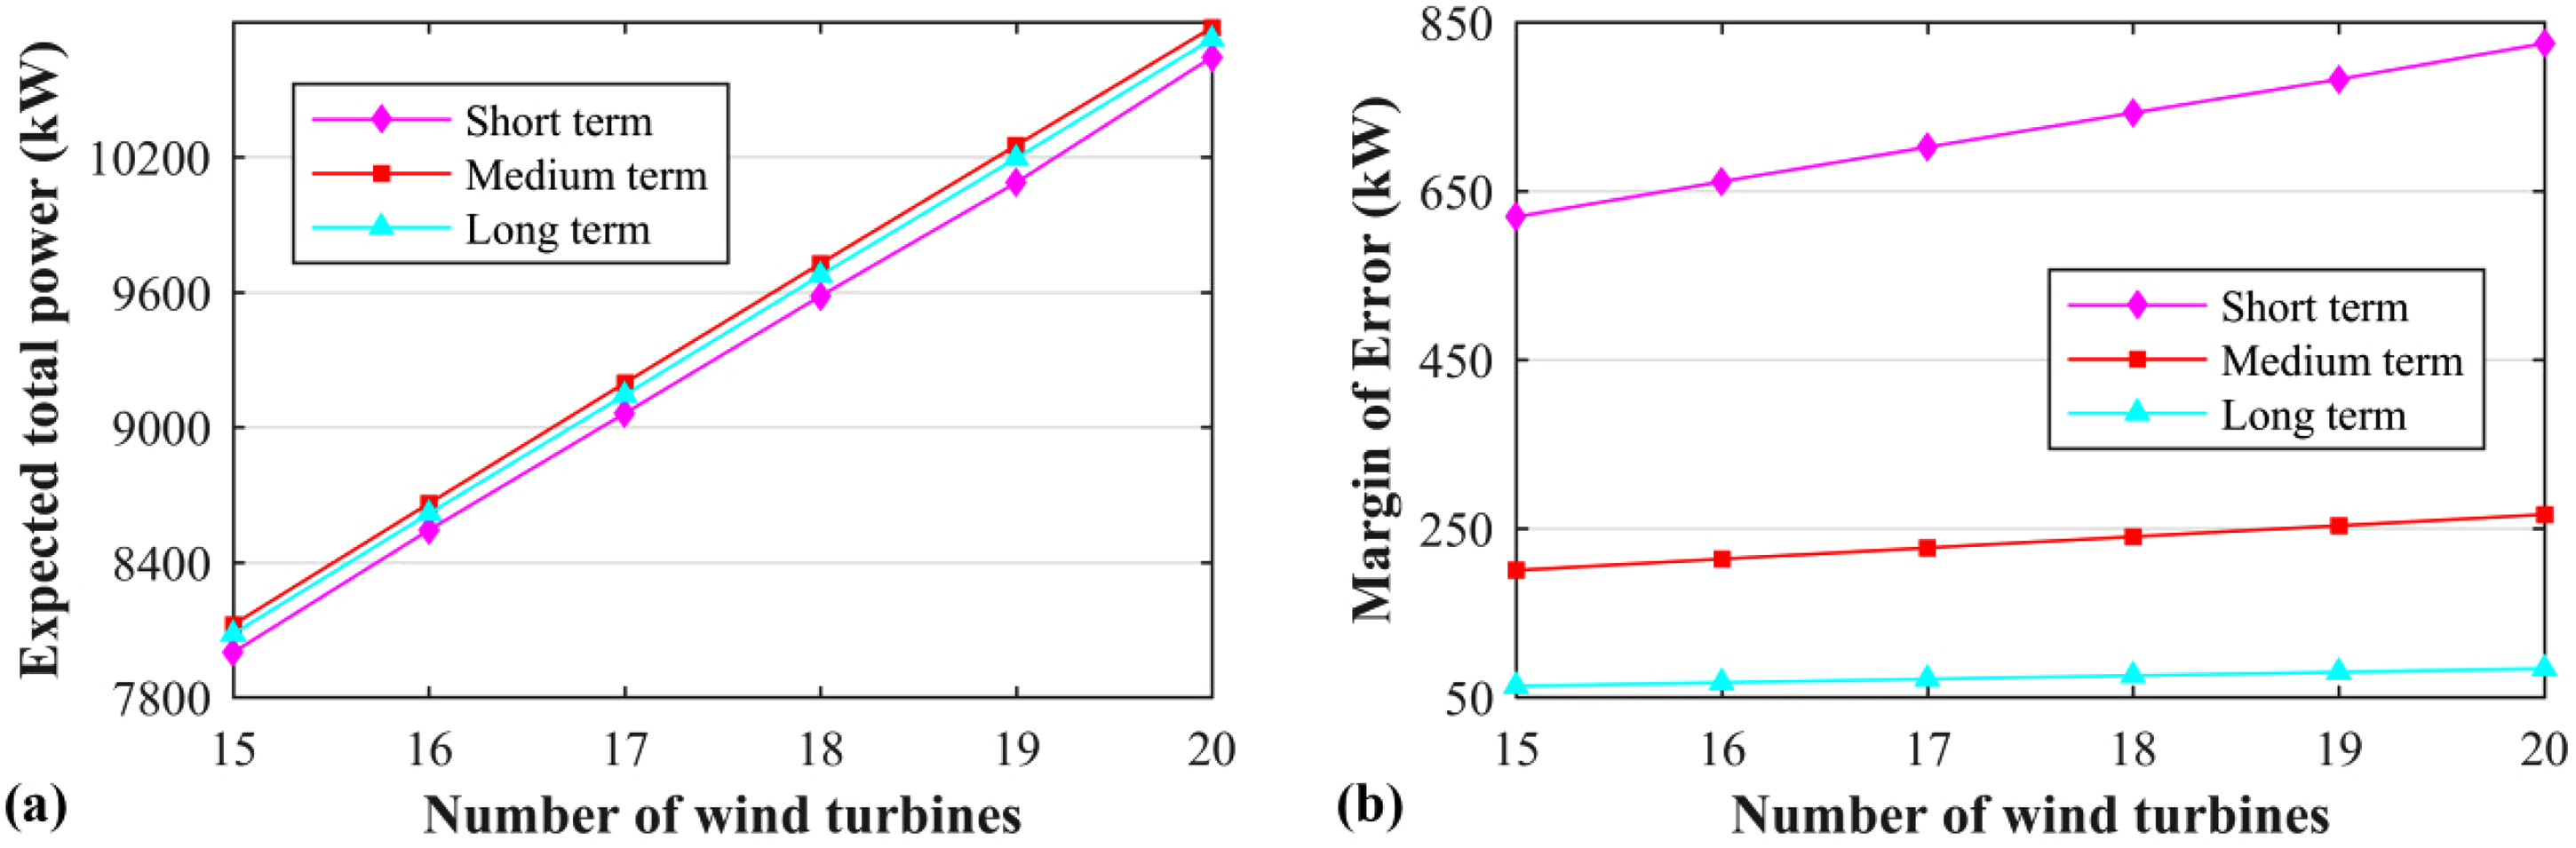
Optimized total wind farm power production and margin of error under different scenarios of time span: (a) total wind farm power production and (b) margin of error for the total power production.
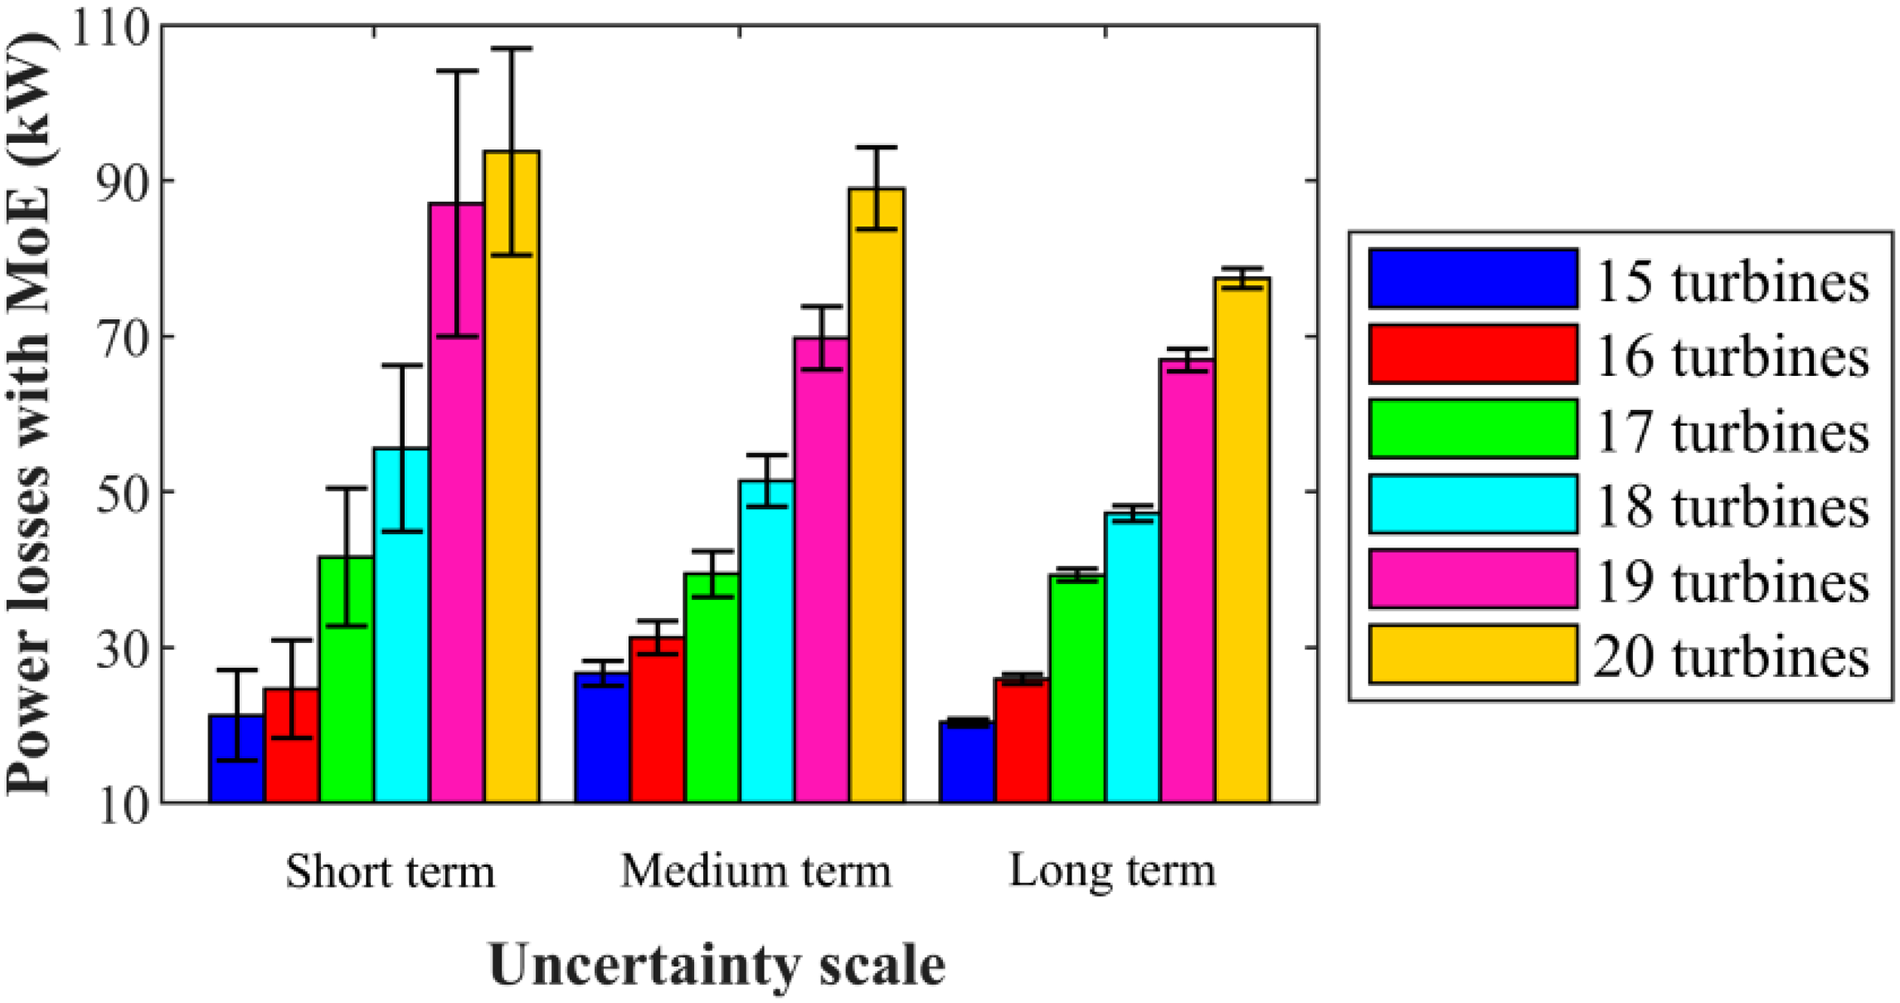
Optimized wind farm power losses with margin of error under different scenarios of time span.
To compare the wind farm layout optimization results under different wind condition scenarios more comprehensively, the individual power and loss with their optimal placements inside the wind farm are presented. Figure 12 shows the results under the short-term wind scenario
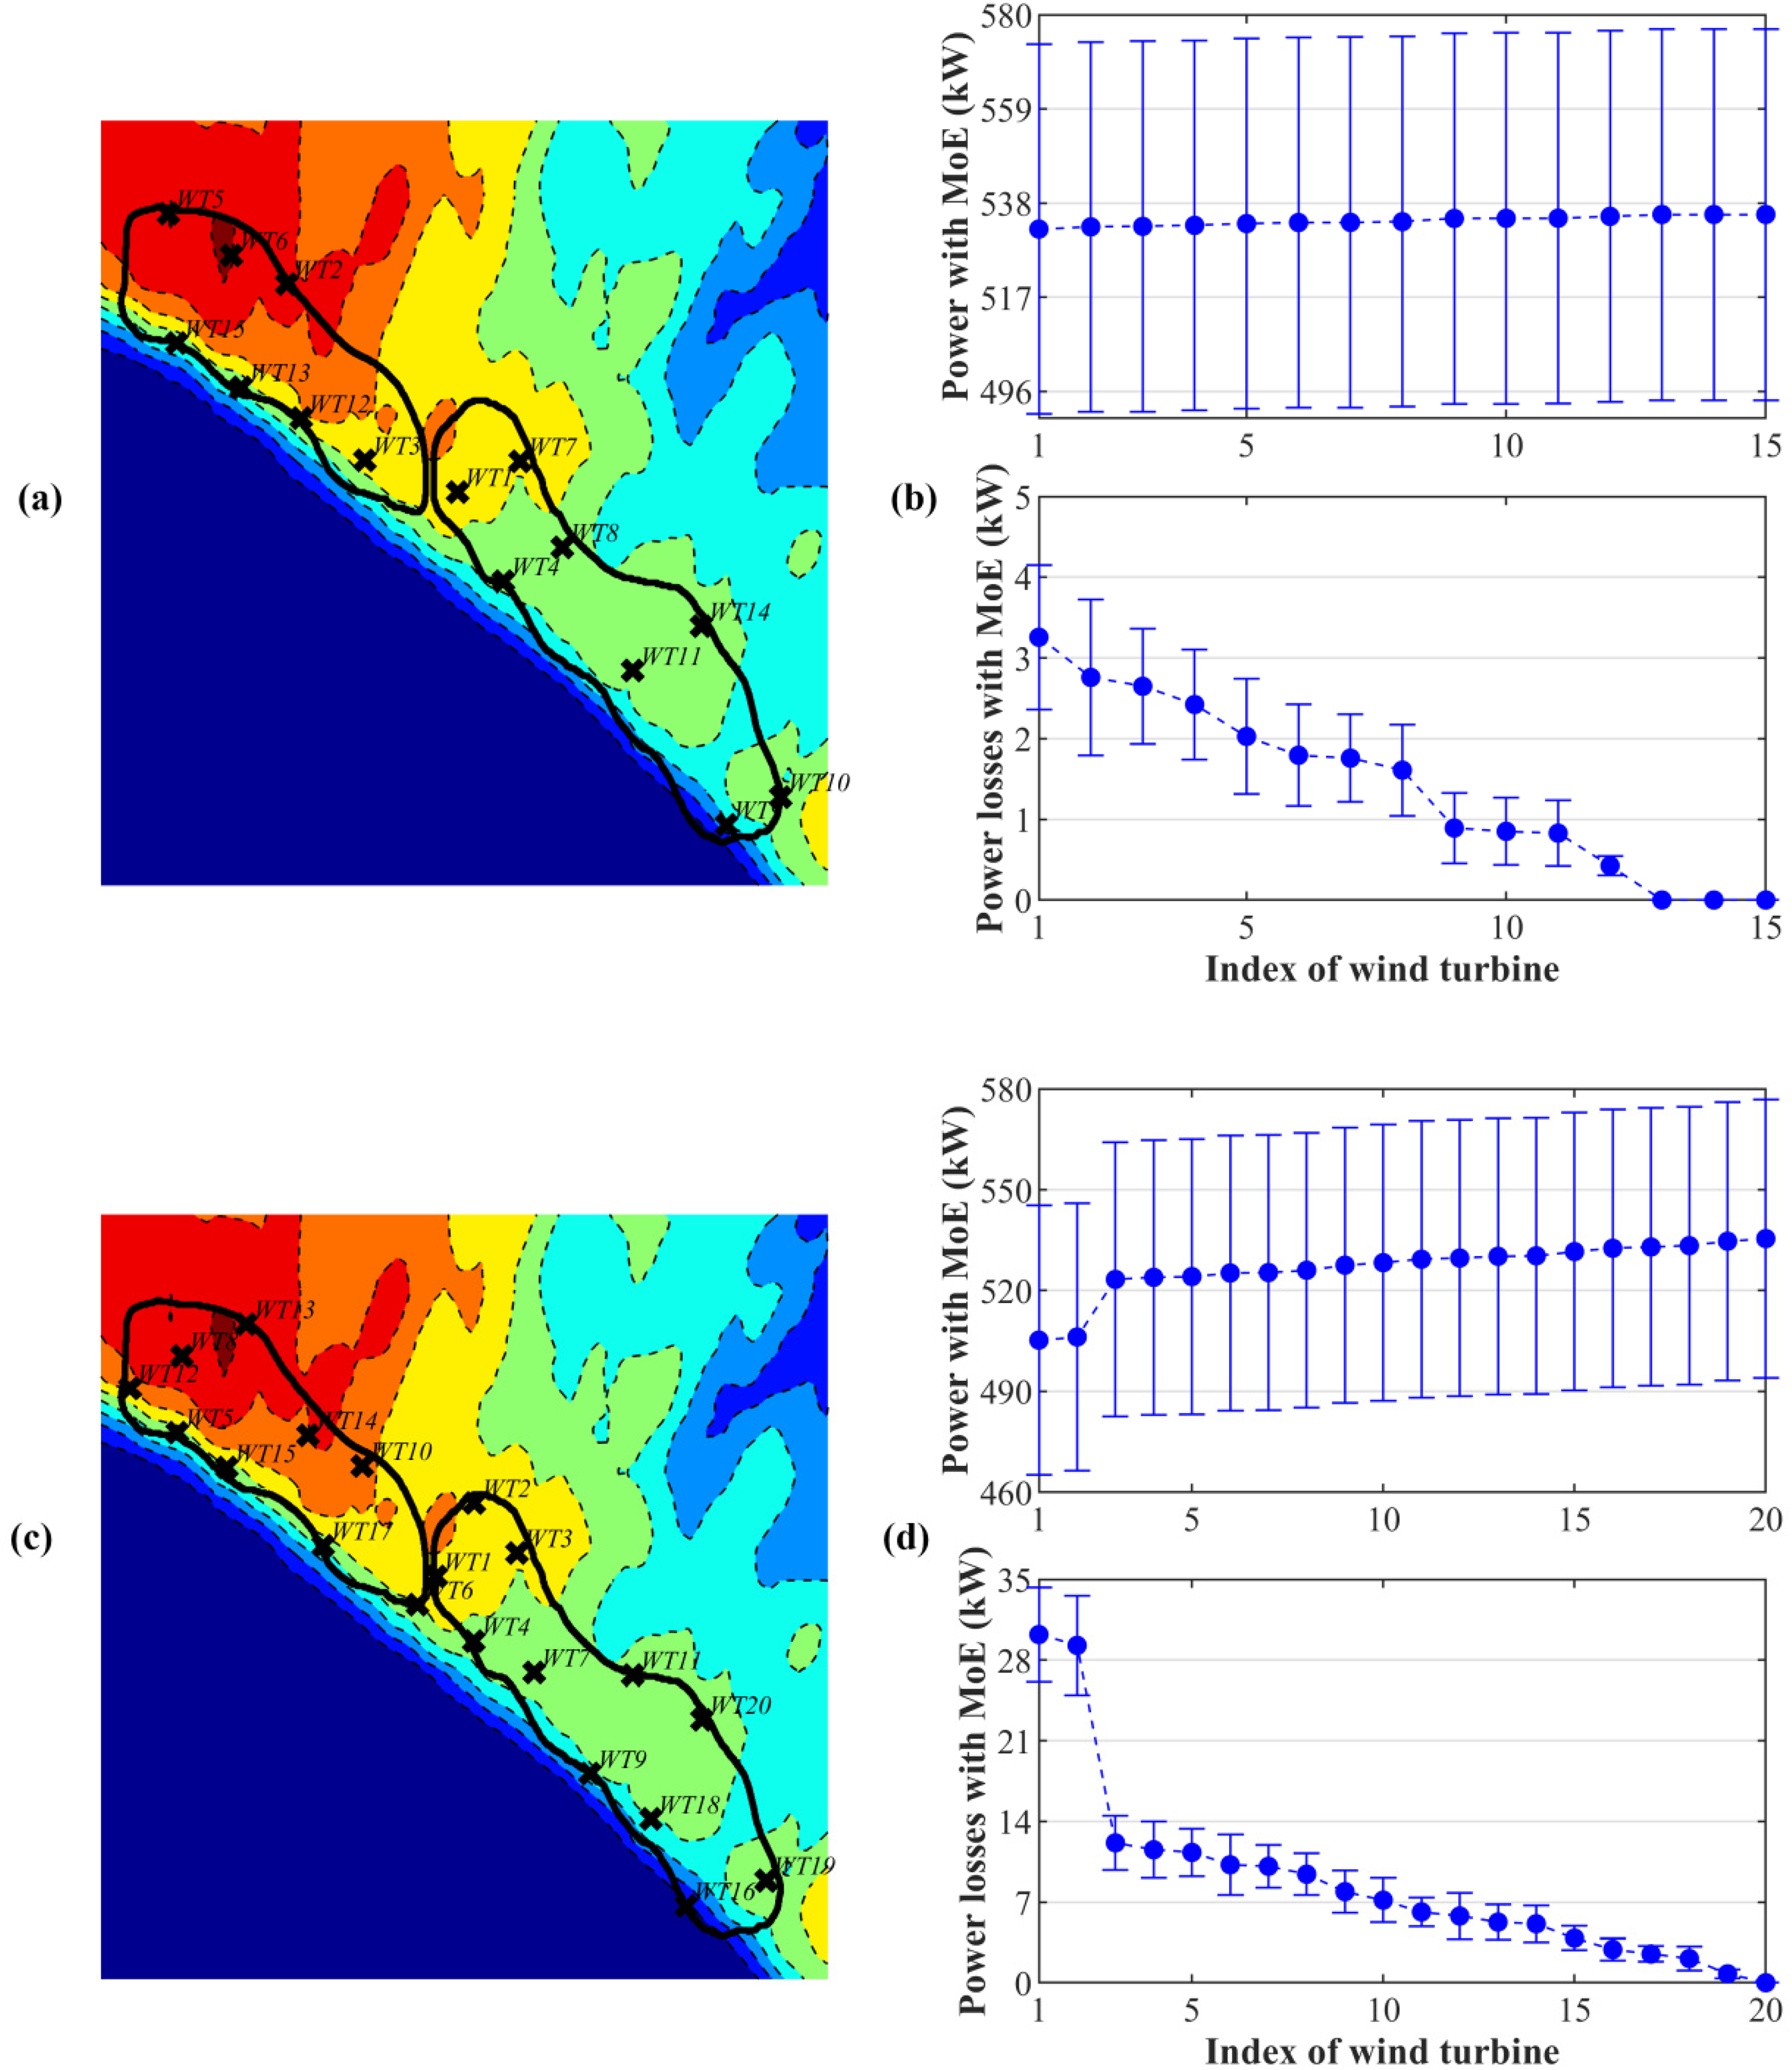
Optimal wind turbine placement and individual wind turbine results under wind data error of
Last, the individual wind turbine results under the long-term wind scenarios
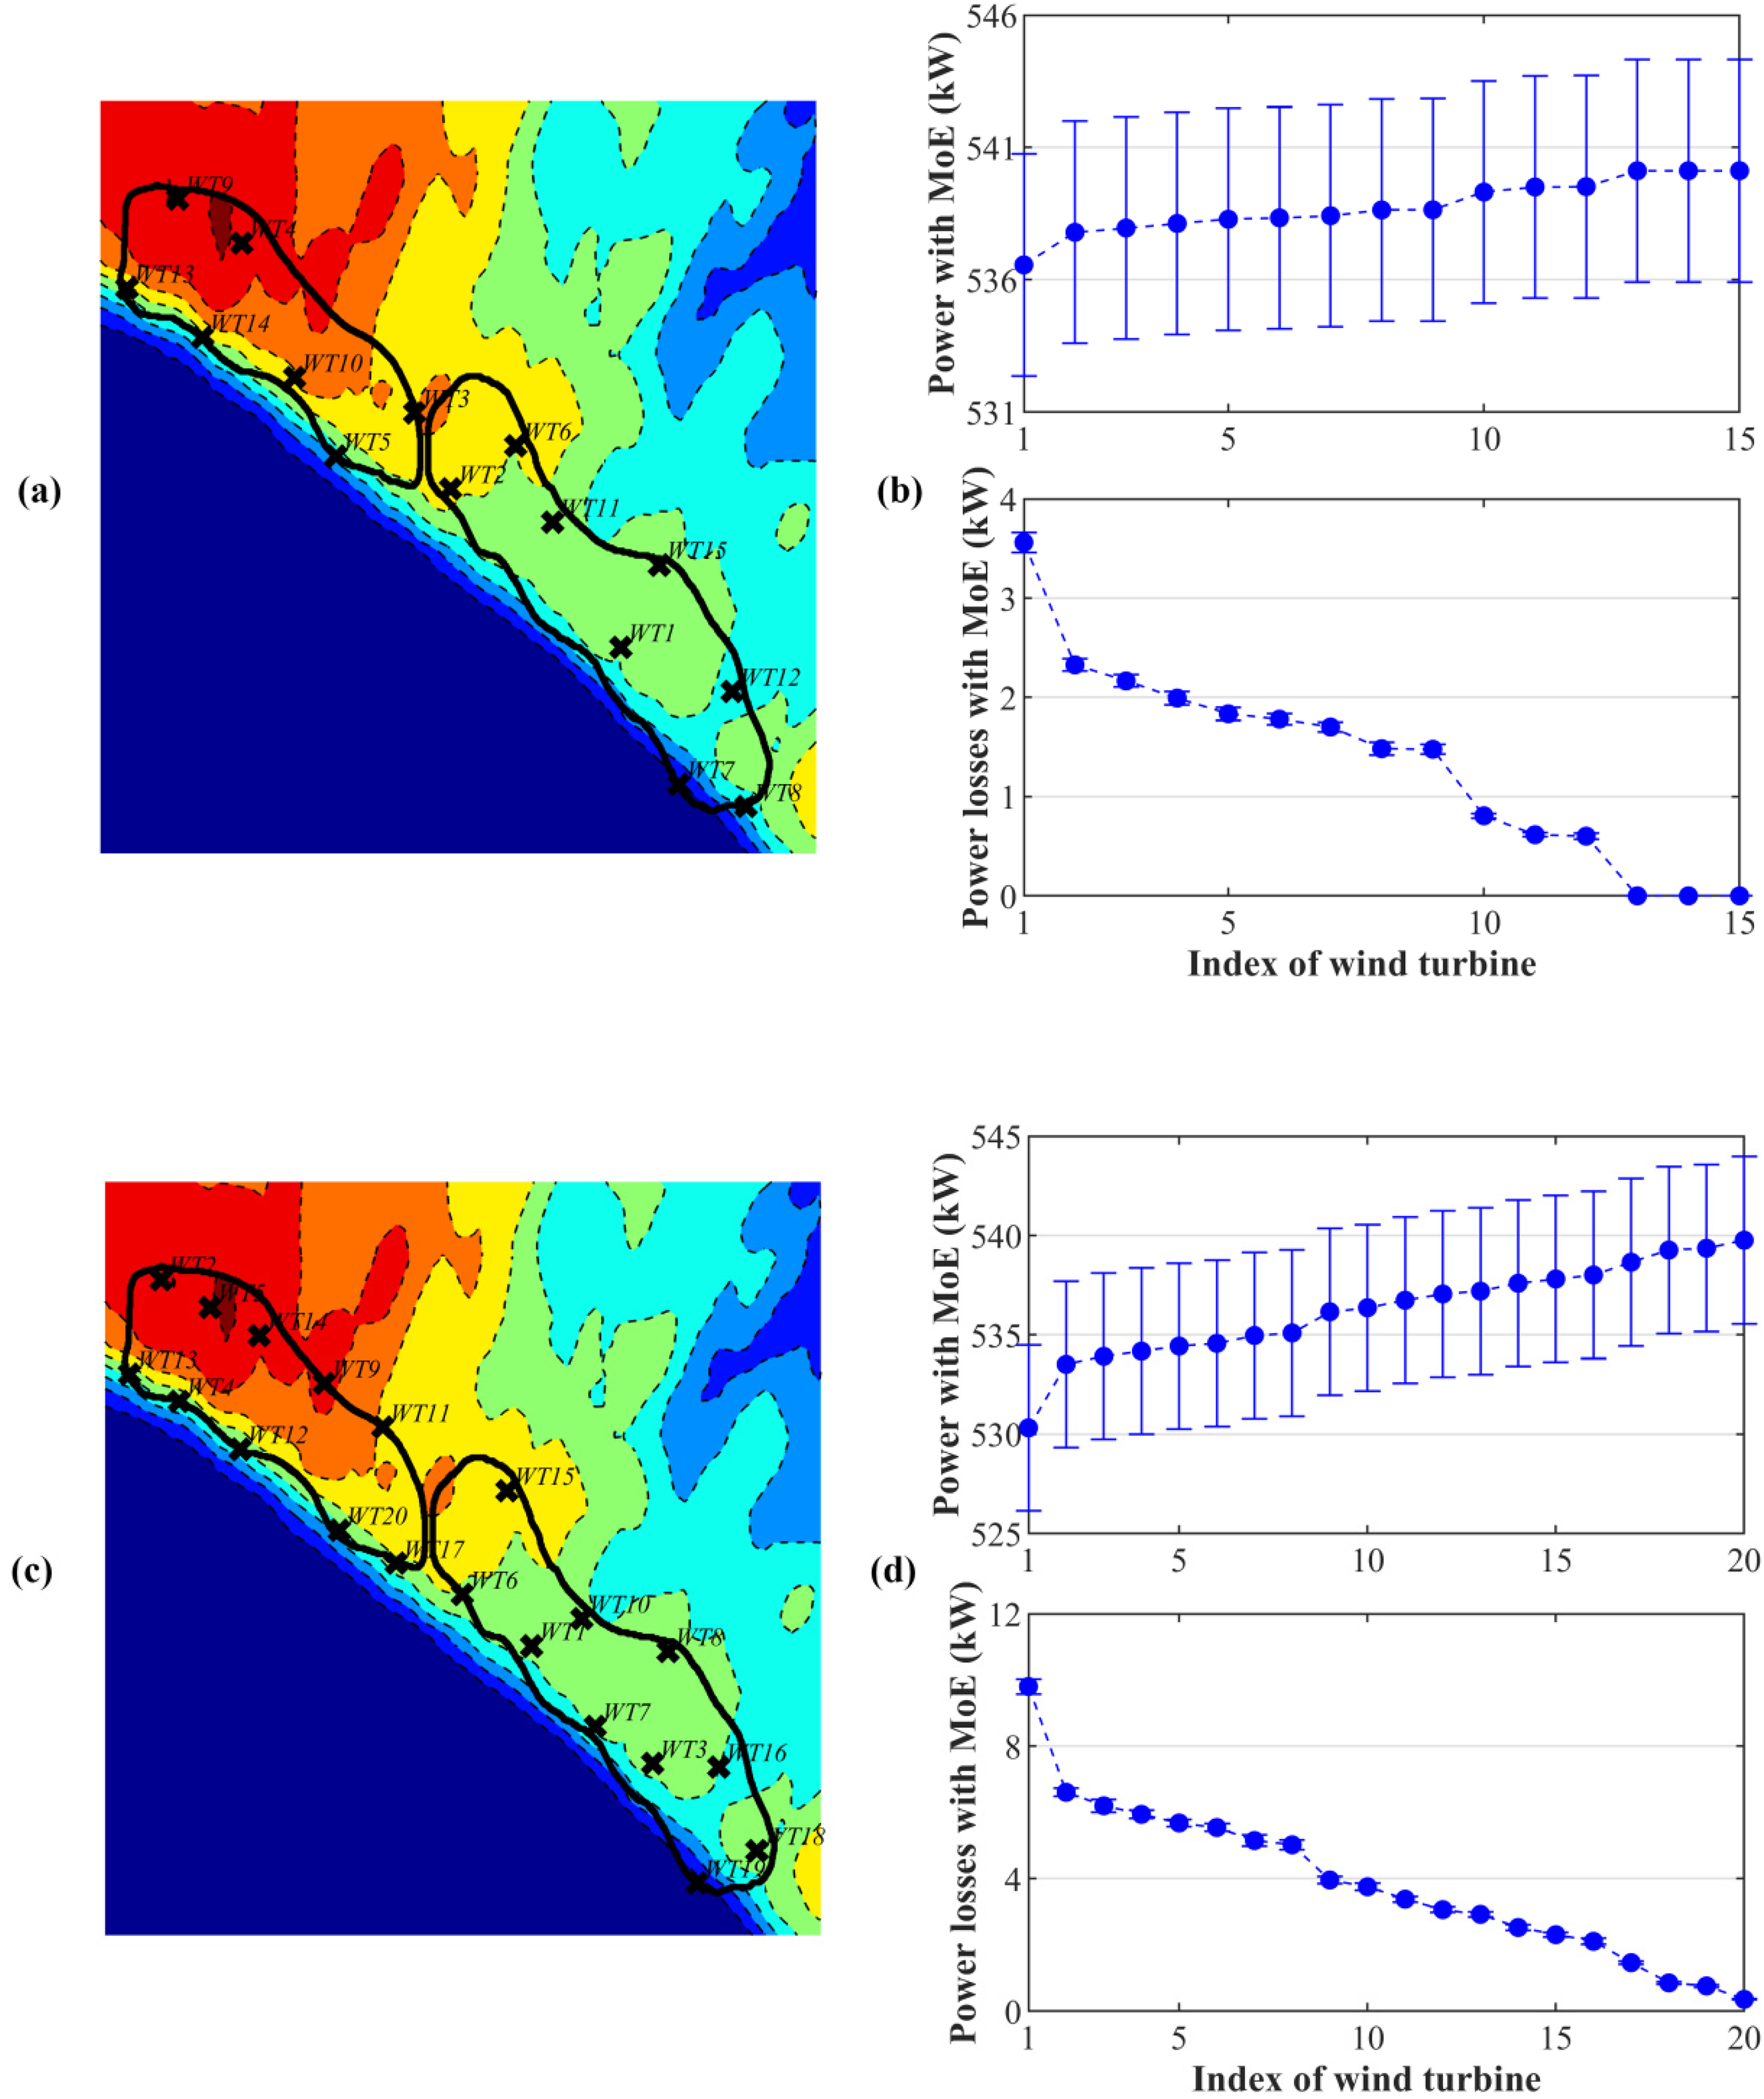
Optimal wind turbine placement and individual wind turbine results under wind data error of
Summary and conclusion
In this research, a novel three-dimensional wake model accounting for both wind turbine interaction and the topographic effect of non-flat terrain is proposed for a real wind farm layout optimization by means of machine learning algorithm. Moreover, the optimization study is carried out by considering the wind data prediction error over the short-term (days), medium-term (months) and long-term (years) time spans. By conducting the Monte Carlo simulation for the Weibull distribution wind speed and wind direction with a predefined number of samples, the margin of error for average wind speed/direction are calculated to quantify the wind prediction errors of the different scenarios of time span. Specifically, the errors for the short-, medium-, and long-term wind data are
The optimization results show that the total wind farm power output average after optimizing the wind farm layout increases by 210 kW, and its confidence interval also entirely shifts towards the increasing power output direction compared to the existing wind farm layout which justifies the effectiveness of the layout optimization work. As the time span of wind data measurement increases, the total power output average increases while the margin of error (MoE) decreases. In contrast, both the total power loss and its error decrease with the increasing time span. In general, the individual power output and its loss have the same pattern of change as the total power output under different wind data scenarios. With 20 wind turbines installed, the individual wind turbines yield a power output above 500 kW with a MoE around 90 kW, and the maximum power loss and MoE are approximately 30 kW and 8 kW for the short-term wind
Footnotes
Declaration of conflicting interests
The author(s) declared no potential conflicts of interest with respect to the research, authorship, and/or publication of this article.
Funding
The author(s) disclosed receipt of the following financial support for the research, authorship, and/or publication of this article: This work was supported by the National Natural Science Foundation of China (12002137), Natural Science Foundation of Jiangsu Province (Grant No. BK20180879), Postdoctoral Science Foundation of Jiangsu Province (2021K110B), High-level Talent Research Foundation of Jiangsu University (Grant No. 20JDG065), Australia Endeavour Scholarships and Fellowships, and Canada Future Energy Systems Program (FES-T14-P02).