
Abstract
Handan is one of the most polluted coal mining cities in the North China Plain (NCP). There is a lack of research on the pollution characteristics and sources of carbonaceous components in PM2.5 in Handan city. Atmospheric PM2.5 samples were collected from Handan City during 2018 and the organic carbon (OC) and elemental carbon (EC) in PM2.5 were analyzed with a carbon analyzer. The annual average mass concentrations of PM2.5 and total carbon (TC = OC + EC) in Handan were (101.88 ± 79.01) μg/m3 and (28.03 ± 23.28) μg/m3, respectively. The annual average ratio of TC/PM2.5 was (28.29% ± 7.95%), indicating that carbonaceous components made a major contribution to PM2.5. The seasonal variations of OC and EC concentrations in PM2.5 were consistent with PM2.5, which was higher in winter and lower in summer. The annual average OC/EC ratio was (10.33 ± 5.83), and the (OC/EC)min ratio for each season was greater than 2, suggesting that there was probably secondary organic carbon (SOC) formation all around the year. The correlations between OC and EC during spring and winter were much more significant than during summer and autumn, which indicated that the sources of OC and EC in summer and autumn were more complex. Principal component analysis (PCA) displayed that the main sources of carbonaceous components in PM2.5 were coal combustion emission, road dust and vehicle exhaust, which may be related to coal-fired power generation and steelmaking, and coal transportation in Handan city. The potential source contribution function (PSCF) analysis demonstrated that PM2.5 and carbonaceous components in Handan city were significantly influenced by both local emissions and regional transport during the observation period.
Keywords
Introduction
Atmospheric aerosol pollution in the North China Plain (NCP) occurs throughout the year and is characterized by high concentrations of fine particulate matter (PM2.5) (Huang et al., 2014; Niu et al., 2021). Carbonaceous aerosol is one of the important chemical components of PM2.5, contributing about 10 to 70% to PM2.5 in the NCP (Huang et al., 2014, 2018; Li et al., 2019; Meng et al., 2016; Niu et al., 2021; Xue et al., 2020; Zhao et al., 2019). Carbonaceous aerosols are composed of organic carbon (OC) and elemental carbon (EC). OC can be divided into primary OC (POC) directly emitted from pollution sources and secondary OC (SOC) mainly generated by photochemical reaction of gaseous precursors (Jones and Harrison, 2005). EC is mainly derived from incomplete combustion of biomass or fossil fuels, and only exists in primary aerosols directly emitted by pollution sources (Jacobson, 2001). EC is usually used as a tracer for anthropogenic components because of its chemical stability (Castro et al., 1999; Lim and Turpin, 2002).
Carbonaceous aerosols cause more concern due to their complex impact on human health (Tshehla and Wright, 2019) and environment (Peng et al., 2019; Wu et al., 2019). EC has strong absorptivity of solar radiation and is considered to be the most important particulate component related to global warming, whereas OC is mainly a scattering medium and exerts a negative relation forcing effect (Ramirez et al., 2018). OC consists of a mixture of hundreds of organic compounds, such as polycyclic aromatic hydrocarbons (PAHs) (Zhao et al., 2021) and polychlorinated biphenyls, which are known for their potential carcinogenic and mutagenic effects (Feng et al., 2006).
Carbonaceous aerosols can be divided into eight fractions (OC1, OC2, OC3, OC4, EC1, EC2, EC3, OPC) by thermal optical reflection (TOR) analysis method, so the sources can be determined qualitatively according to the carbon spectrum characteristics of different emission sources (Wu et al., 2019; Zhang et al., 2014). Previous studies have shown that OC2, OC3, OC4 and OPC were influenced by coal combustion emissions. Gasoline vehicle emissions also contributed to OC1, OC2, OC3, OC4 and EC1. OC3 was partly from catering industry emissions, and OPC was partly from biomass combustion emissions (Zhang et al., 2014). The road dust sources mainly contributed to OC3 and OC4 (Xu et al., 2018); OC2, OC3, OC4, OPC, EC1 and EC2 were from the emission sources of motor vehicle exhaust, among which EC1 and OPC were the characteristic components of gasoline vehicle exhaust, EC2 and EC3 were the components of diesel vehicle exhaust (Turpin and Lim, 2001). Xue et al. (2020) also showed that road dust, coal combustion emissions and vehicle exhaust were the main contributors to OC and EC in PM2.5 in Handan city.
Air pollution can be influenced by local emission, short-distance transport from surrounding areas and long-distance transport. Hybrid Single-Particle Lagrangian Integrated Trajectory (HYSPLIT) model and potential source contribution function (PSCF) analysis are commonly used to study the trans-regional transport of atmospheric particles and identify potential source areas (Kang et al., 2020; Li et al., 2020; Wang et al., 2009). By applying HYSPLIT and PSCF analyses, it is found that PM2.5 were mainly transported form the northern and northwestern directions of Weifang, Shandong province in winter, spring and autumn, but it is mainly from the southeastern direction in summer (Li et al., 2020). Recent studies have found that the main source areas of airborne particle pollution in winter Handan include southern Hebei, southeastern Shanxi, northern Henan and western Shandong (Kang et al., 2020; Zhao et al., 2019).
Handan is known as the modern “coal city” and “steel city”, and the proved mineral reserves in Handan was 7184 million tons in 2019, including 5355 million tons of coal and 489 million tons of iron ore. Handan city plays an important role in air pollution transmission channel of Beijing-Tianjin-Hebei, and is one of the cities that suffered from the most serious particulate pollution in the NCP (Wang et al., 2014b). Handan's main industries include coal production, steel production and cement production, etc., which are all high energy consumption and high emission industries (Meng et al., 2016; Pian et al., 2016; Wang et al., 2014b). Coal mining, iron and steel industry, motor vehicle exhaust and other primary emission sources in Handan city produce a large number of pollutants, which is an important reason for the increasing frequency of haze weather in recent years (Niu et al., 2015; Pian et al., 2016; Prachiti et al., 2011; Singh et al., 2015; Wang et al., 2014b).
In December 2016 and January 2017, serious pollution events occurred in many areas of the NCP (Li et al., 2019), and PM2.5 reached up to 834.5 μg/m3 (Zhao et al., 2019). Large amount of air pollutant emissions, unfavorable terrain and meteorology conditions led to frequent and severe air pollution during wintertime in Handan (Rajak et al., 2020; Zhao et al., 2019). Gaseous pollutants, meteorological factors and energy structure have important influences on the concentration of carbonaceous components (Xue et al., 2020). Previous studies reported that OC and NOx have a positive correlation with EC, indicating that vehicle emission is an important source of EC. OC and SOC have a correlation with O3, indicating that photochemical reaction can significantly promote SOC formation from gas precursors (Yu et al., 2009). The concentration of carbonaceous components in summer is significantly lower than in winter in the Pearl River Delta Region because of the influence of East Asian monsoon from marine area in summer and high intensity of pollutant emission in winter (Cao et al., 2004). Whereas, the seasonal variations in pollution characteristics and sources of carbonaceous components in PM2.5 in the coal mining city Handan remain unclear.
This study aims to explore the seasonal variations and source apportionment of carbonaceous components in PM2.5 in Handan city, which is a coal mining city also. PM2.5 samples in Handan city during 2018 were analyzed to explore seasonal variation in concentration and sources of carbonaceous components. The sources of OC and EC were analyzed by PCA and the sources areas were analyzed by backward trajectory and PSCF, to provide data basis for the prevention and control of atmospheric carbonaceous pollution in Handan city.
Materials and methods
Sampling and analysis
The sampling site is set up at the monitoring station of Handan (36.57°N, 114.50°E), about 16 m (a.g.l). As shown in Figure 1, it is a national observation site surrounded by residential areas, without industrial plants or tall buildings. Handan city is located in the NCP and adjacent to Taihang Mountains to the west The high-intensity emission of air pollutants and the terrain that is adverse to the dispersal of pollutants may be the main causes of air pollution in Handan. Meteorological parameters such as temperature, wind speed, relative humidity and gaseous pollutants (SO2, NO2, O3) during the sampling period were downloaded from Zhenqi net (https://www.aqistudy.cn). PM2.5 samples were collected on Quartz filters by a multi-channel air particulate sampler (UnrayZR-3930D) with a flow rate of 16.7 L/min for carbon component analysis. Samples were collected from 6 to 29 January (winter), 9 to 20 April (spring), 30 June to 9 July (summer), and 8 to 23 October (autumn) to represent four seasons. The sampling duration of each sample was 11.5 h, 8:00 to 19:30 for daytime sampling and 20:00 to 7:30 for nighttime sampling. In total 118 samples were obtained.
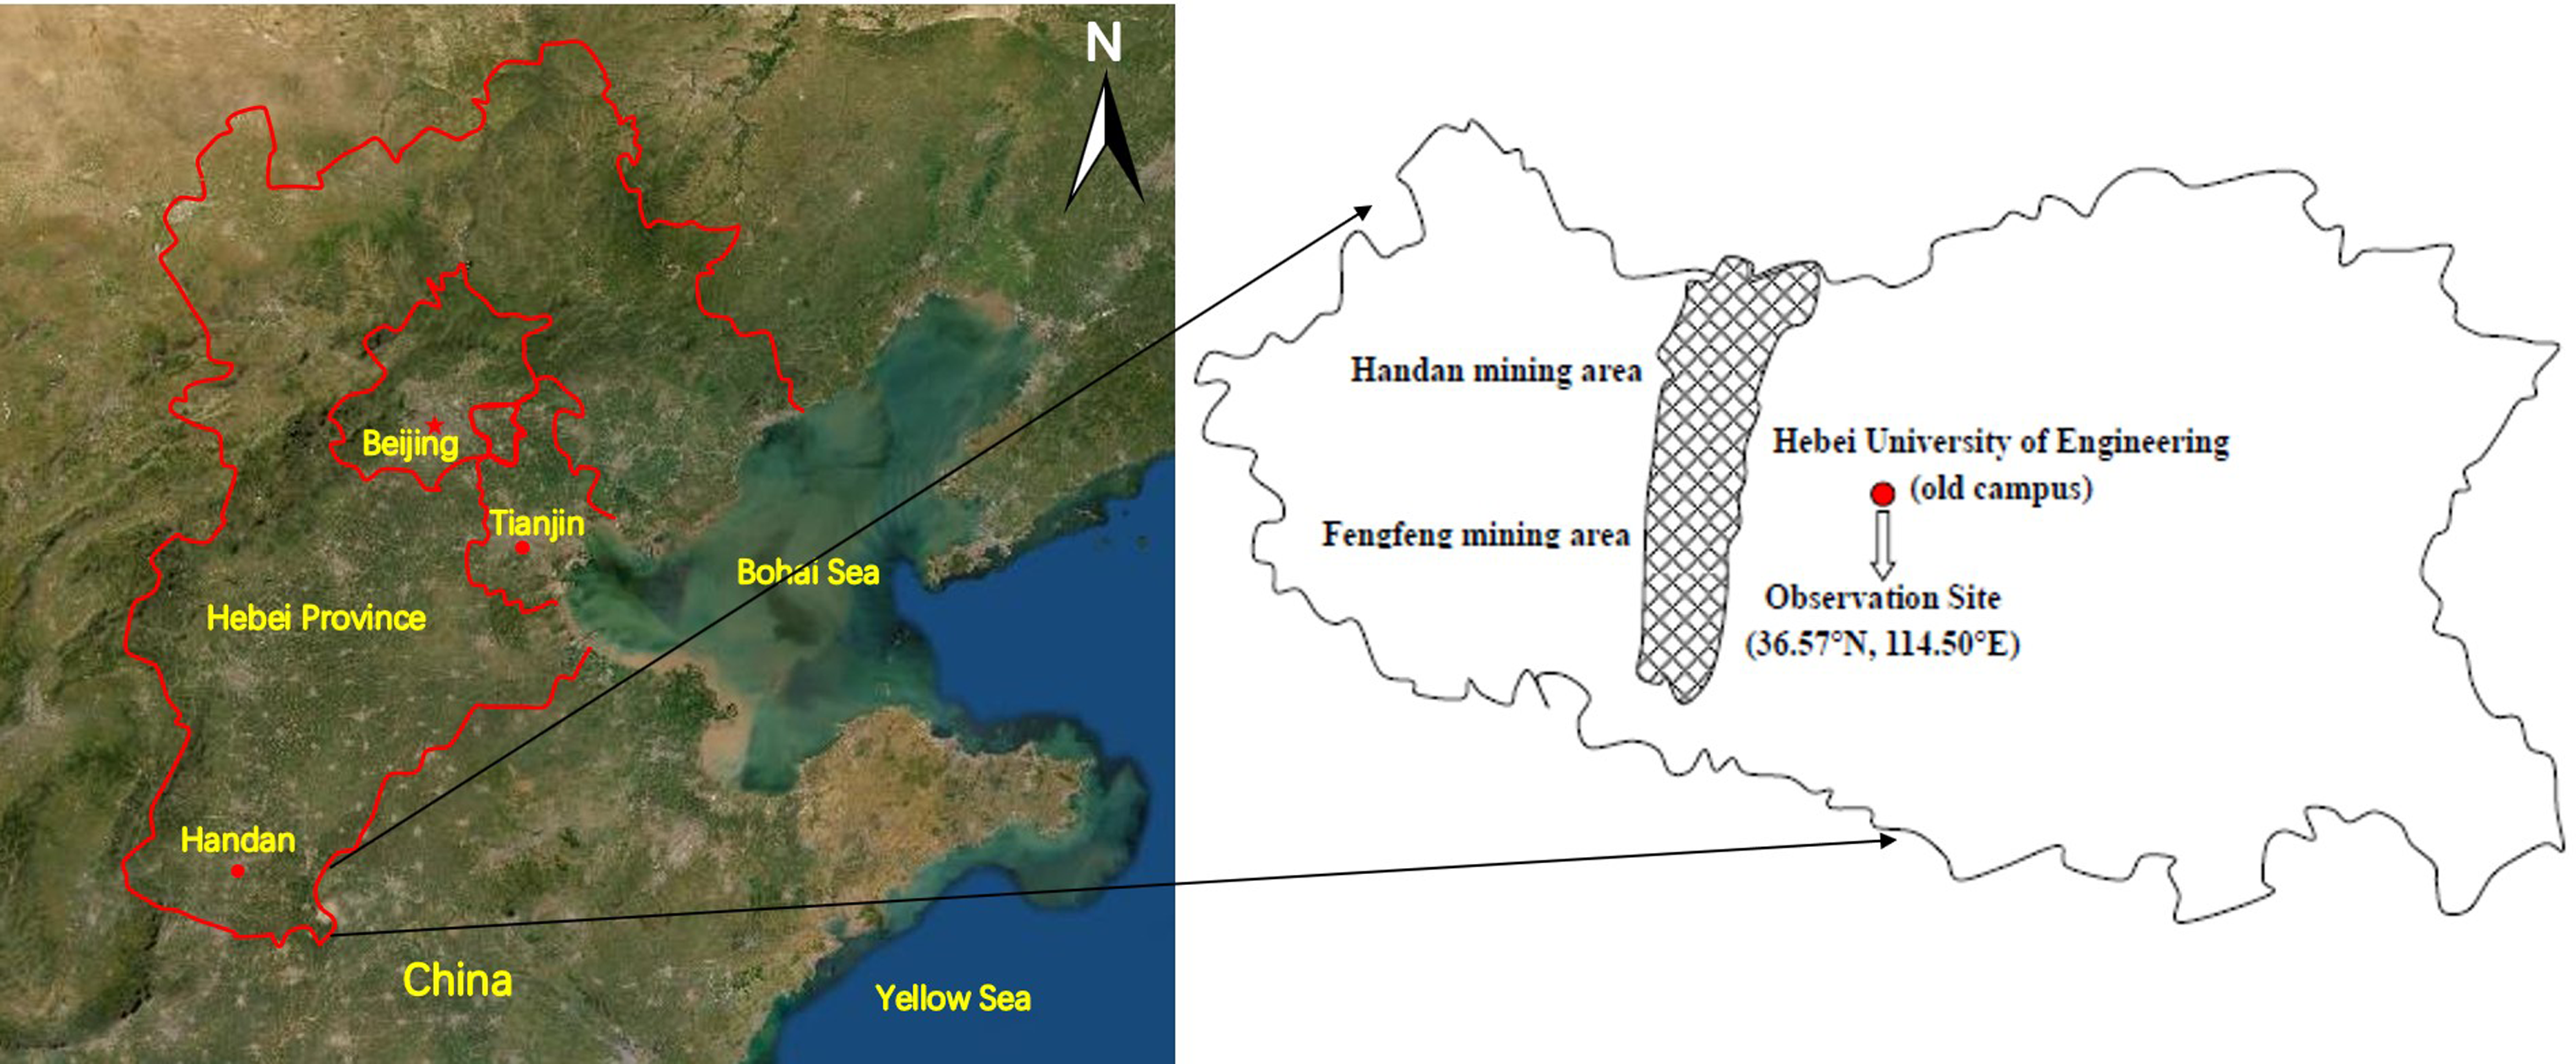
The location of the observation site.
The thermal/optical carbon analyzer (DRI model 2001A, US) was used to analyze the carbonaceous components in PM2.5 according to the IMPROVE protocol (Cao, 2014). The level of SOC pollution can be represented by some indicators such as OC/EC and SOC/OC. The higher the ratios are, the more serious the secondary pollution is (Turpin and Lim, 2001).
SOC was estimated according to the EC tracer method proposed by Turpin and Huntzicker (1995) and the minimum OC/EC ratio method proposed by Castro et al. (1999). That is, assuming that EC and POC are from the same combustion source and the initially emission ration between POC and EC is (OC/EC)pri. SOC is estimated as follows:

The concentration of total carbonaceous component (TCA) in airborne particulate matter is the sum of organic matter (OM) and elemental carbon. The concentration of OM is generally converted from OC. Turpin and Lim (2001) reported that OM is 1.6 times of OC in urban areas. Therefore, TCA is calculated as follows:

Quality assurance (QA) and quality control (QC)
Before sampling, the quartz filters were baked in a muffle furnace at 550°C for 5.5 h. Before weighing, the quartz filters were balanced in the incubator (temperature ± 25°C and humidity ± 30%) for more than 24 h. The weight of the filters was determined with an electronic balance (XS205 dual-range, Switzerland; precision 0.01 mg) before and after sampling, and the filters were weighted twice to ensure that the error was within ± 20 μg. Blank samples were collected as control before and after the observation. After sampling, the filters were stored in a refrigerator below −18°C. When analyzing the OC and EC, at least two blank samples were analyzed in each batch, and the relative deviation of the measured values of two blank parallel samples should be less than 20%. One out of every 10 samples was tested twice, and the deviation of TCA should be less than 5%, and the deviation of OC and EC should be less than 10% (Xue et al., 2020).
Backward trajectory and potential source analysis
HYSPLIT model is widely used to analyze the transport, source and diffusion trajectory of atmospheric pollutants (Wang et al., 2016). This study is based on the Global Data Management System released by the National Oceanic and Atmospheric Administration of the United States (ftp://arlftp.arlhq.noaa.gov/pub/archives/gdas1). HYSPLIT model was used to calculate the backward trajectories of air masses during sampling. Trajstat software was applied to calculate the 48-h backward trajectory, starting at 8:00 and 20:00 Beijing standard time every day (Wang et al., 2009). The space resolution is 1 ° × 1 ° grid cell, and the starting height of the trajectory is 500 m above the ground level. The trajectories are clustered into three categories to speculate the possible transport path and source of carbon components in PM2.5.
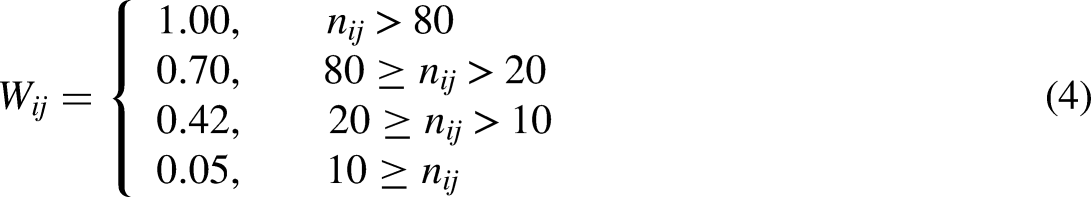
The geographical origin of PSCF is a grid-based statistical analysis method based on backward trajectory model (Wang et al., 2009). It can obtain the distribution of pollution sources semi-quantitatively, the transport paths and source of atmospheric components at the observation station (Zhao et al., 2019). The PSCF value is the ratio of the number of pollution trajectories (mij) passing through the i, j grid to the number of all trajectories (nij) passing through the grid in the selected study area. The definition of PSCF is as follows:


Results and discussion
The concentrations and seasonal variations of PM2.5, OC and EC
The annual mean PM2.5 and total carbon (TC = OC + EC) mass concentrations in Handan city were (101.88 ± 79.01) μg/m3 and (28.03 ± 23.28) μg/m3, respectively (Table 1). During the observation period, the days with PM2.5 mass concentration exceeding the Chinese National Standard II (75 μg/m3) (GB3095-2012, 2012) accounted for 49.15%. The mean mass concentration of PM2.5 showed a seasonal variation: winter > autumn > spring > summer. The average mass concentrations of PM2.5 in winter (156.28 ± 97.27) μg/m3 and autumn (70.69 ± 27.77) μg/m3 were higher than those in spring (66.76 ± 37.88) μg/m3 and summer (57.72 ± 16.45) μg/m3. The mean mass concentrations of TC in winter, spring, summer and autumn were (45.21 ± 28.66) μg/m3, (15.21 ± 5.43) μg/m3, (13.44 ± 3.30) μg/m3 and (19.81 ± 5.38) μg/m3, respectively, which were higher than those in Guangxi with the values of 21.61 μg/m3 (winter), 12.66 μg/m3 (spring), 9.72 μg/m3 (summer) and 10.52 μg/m3 (autumn), respectively (Huang et al., 2018).
Daily average concentrations of PM2.5, OC, EC, TC and TCA, and mass ratios in different seasons.
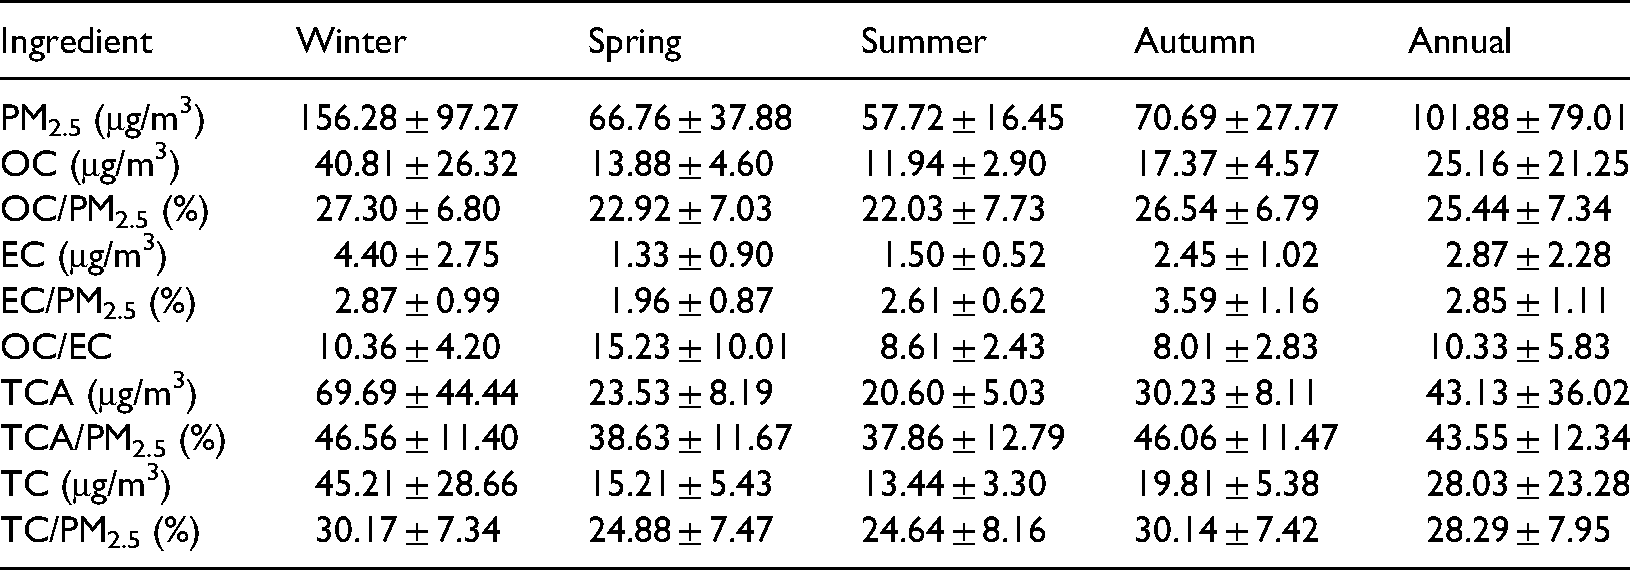
The annual mean ratio of TC/PM2.5 was (28.29% ± 7.95%). The average annual concentration of TC was higher than those in southern cities (15.00 ± 2.60 μg/m3, 14.30 ± 4.10 μg/m3) (Niu et al., 2013; Xu et al., 2018), lower than that of Beijing (32.70 μg/m3) (Yang et al., 2011). It was also slightly higher than that (21.19 ± 15.74) μg/m3 in Handan city in 2017 (Xue et al., 2020). The average values of TC/PM2.5 in winter, spring, summer and autumn in Handan city were (30.17% ± 7.34%), (24.88% ± 7.47%), (24.64% ± 8.16%) and (30.14% ± 7.42%), respectively, indicating that the carbon components made a major contribution to PM2.5.
Emission sources and meteorological factors are the internal and external causes of air pollution, respectively (Xue et al., 2020). A reduction of atmospheric convection due to low wind speed and low solar radiation deduces atmospheric boundary layer height and worsens air quality, since air pollutants can accumulate near the ground level (Zhang et al., 2009). The variations in the wind speed impact the near surface aerosol levels (Zhang et al., 2009). Relative humidity (RH) plays an important role in the evolution and transformation of atmospheric aerosol, and aerosol water content is generally dependent on atmospheric RH and aerosol chemical composition (Xu et al., 2017).
Figure 2 shows the temporal changes of PM2.5 concentration and main meteorological parameters (wind speed, wind direction, temperature, RH) from January to October 2018. The seasonal variations of gaseous pollutants were consistent with PM2.5. The increase in particulate mass concentration in winter was due to the increase of pollutants from intense residential heating in the winter of north China, coupled with the lowered atmospheric boundary layer and the stabilization of atmospheric structure with frequent temperature inversion. The mass concentration of PM2.5 in winter was 2.7 times of that in summer. Among the 118 samples, 20.33% of the samples had a TC concentration higher than 35 μg/m3 (the national average daily air quality standard, 35 μg/m3), and were mainly in winter, which was similar to the results of Nanjing (Bao, 2017) and Beijing (Zhao et al., 2013). It is probably caused by the increase of coal combustion emissions in the heating season and stable meteorological conditions.
The annual mean mass concentrations of OC and EC in PM2.5 in Handan City were (25.16 ± 21.25) μg/m3 and (2.87 ± 2.28) μg/m3, respectively (Table 1). The concentration of OC in PM2.5 was similar to that in Zhengzhou (27 μg/m3) (Wang et al., 2017), lower than that in Tianjin (30.7 μg/m3) (Gu et al., 2009), higher than those in Hefei (12.1 μg/m3) (Shi et al., 2015) and Handan (20.8 μg/m3) in 2017 (Xue et al., 2020). The annual mean concentration of EC in PM2.5 was lower than those in Zhengzhou (11 μg/m3) (Wang et al., 2017), Tianjin (3.5 μg/m3) (Gu et al., 2009), Hefei (5.5 μg/m3) (Shi et al., 2015) and Handan (6.6 μg/m3) in 2017 (Xue et al., 2020). The results demonstrated that the atmospheric carbonaceous pollutants in Handan was very serious, and the primary pollution was largely reduced.
OC and EC accounted for (25.44% ± 7.34%) and (2.85% ± 1.11%) of the PM2.5 mass concentration in Handan city, respectively. The fraction of OC in PM2.5 was similar to that in Tianjin (24.7%) (Gu et al., 2009) and Handan (24.0%) in 2017 (Xue et al., 2020), and much higher than in Hefei (12.7%) (Shi et al., 2015), Nanjing (12.7%) (Bao, 2017). The seasonal changes of OC and EC concentrations in PM2.5 (winter > autumn > spring > summer) were consistent with that of PM2.5. EC was mainly derived from pollutants of combustion sources (such as vehicle emission and coal combustion), and the thermal inversion in winter slowed down the dispersion of air pollutants. Thus the concentrations of air pollutants in winter are higher (Harrison and Yin, 2008). The concentrations of EC, OC and PM2.5 were higher in winter. On one hand, the high concentration of pollutants is related to the increase of coal-fired emissions of residential heating in winter. Furthermore, power plant, steel plant and automobile exhaust emissions are intense in Handan city. On the other hand, it is related to the low atmospheric boundary layer and the low temperature. The condensation of semi-volatile gas precursors is enhanced by low temperature, while the temperature inversion limits the diffusion of air pollutants, which led to the adsorption of semi-volatile gas precursors onto existing PM2.5, resulting in heterogeneous reaction and promoting the formation of SOC (Odum et al., 1996; Pandis et al., 1992).
The proportion of TCA in PM2.5 was (43.55% ± 12.34%), which was higher than Zhengzhou (32%) (Wang et al., 2017) and Handan (38.23% ± 14.61%) in 2017 (Xue et al., 2020). The concentration of TCA is relatively high and accounts for a relatively high proportion of PM2.5 in autumn and winter (Table 1), which may be due to the increase of pollution emissions caused by straw and other biomass burning in autumn and residential heating in winter.
Characteristics of OC/EC ratio and the correlation of OC and EC
OC/EC ratio is usually used to trace carbonaceous aerosol emission sources and characterize aging (Castro et al., 1999; Turpin and Huntzicker, 1995). OC/EC is often used to estimate SOC and trace carbonaceous aerosol emission sources. When OC/EC ratio is greater than 2, it is considered that there is SOC pollution (Pio et al., 2011). OC/EC ratio in different areas can identify different pollution sources, so the source of carbon components can be determined qualitatively.
The annual average ratio of OC/EC in PM2.5 was (10.33 ± 5.83), and the average ratio of OC/EC in each season was greater than 2, indicating that there was SOC pollution in Handan all year round. The increase of OC/EC ratios is not only related to contributions of various POC, but also the long-term existence of aerosols containing SOC in suburban areas (Castro et al., 1999). The condensation of volatile organic compounds (VOCs) in PM2.5 and the transformation of gaseous precursors probably led to the increase of OC/EC ratios, which is generally consistent with the results among many cities (Pio et al., 2011). The OC/EC ratios 1.0–4.2, 2.5–10 and 16.8–40.0 may indicate the exhaust source of motor vehicles, coal source and biomass combustion source, respectively (Ye et al., 2017). The ground dust and household emission source have an OC/EC ratios of 13.1 and 12.7, respectively (Wang et al., 2014b). The OC/EC ratio ranged from 4.97 to 43.45 in Handan, indicating that the air pollution is more related to vehicles exhaust, coal combustion, biomass combustion, etc. The mean ratio of OC/EC in Handan was significantly close to the corresponding value of coal combustion emissions, which revealed that Handan was greatly affected by coal combustion.
The correlation between OC and EC can also preliminarily reflect the source of OC and EC in PM2.5 (Guo et al., 2019). OC and EC showed different correlationships in four seasons (Figure 3). The correlation coefficient of OC and EC showed a seasonal variation: spring (0.82) > winter (0.70) > autumn (0.56) > summer (0.53). The results indicated that the sources of OC and EC were more complex in summer and autumn than in spring and winter when coal-burning sources may be the main source. The types of emission sources was less in summer, and strong solar radiation and high temperature are benefit to form more SOC, which may lead to the lowest correlation coefficient between OC and EC. Zhou et al. (2009) also demonstrated that the correlation between OC and EC was the lowest in summer in Beijing, which may be related to the high generation of SOC in summer.
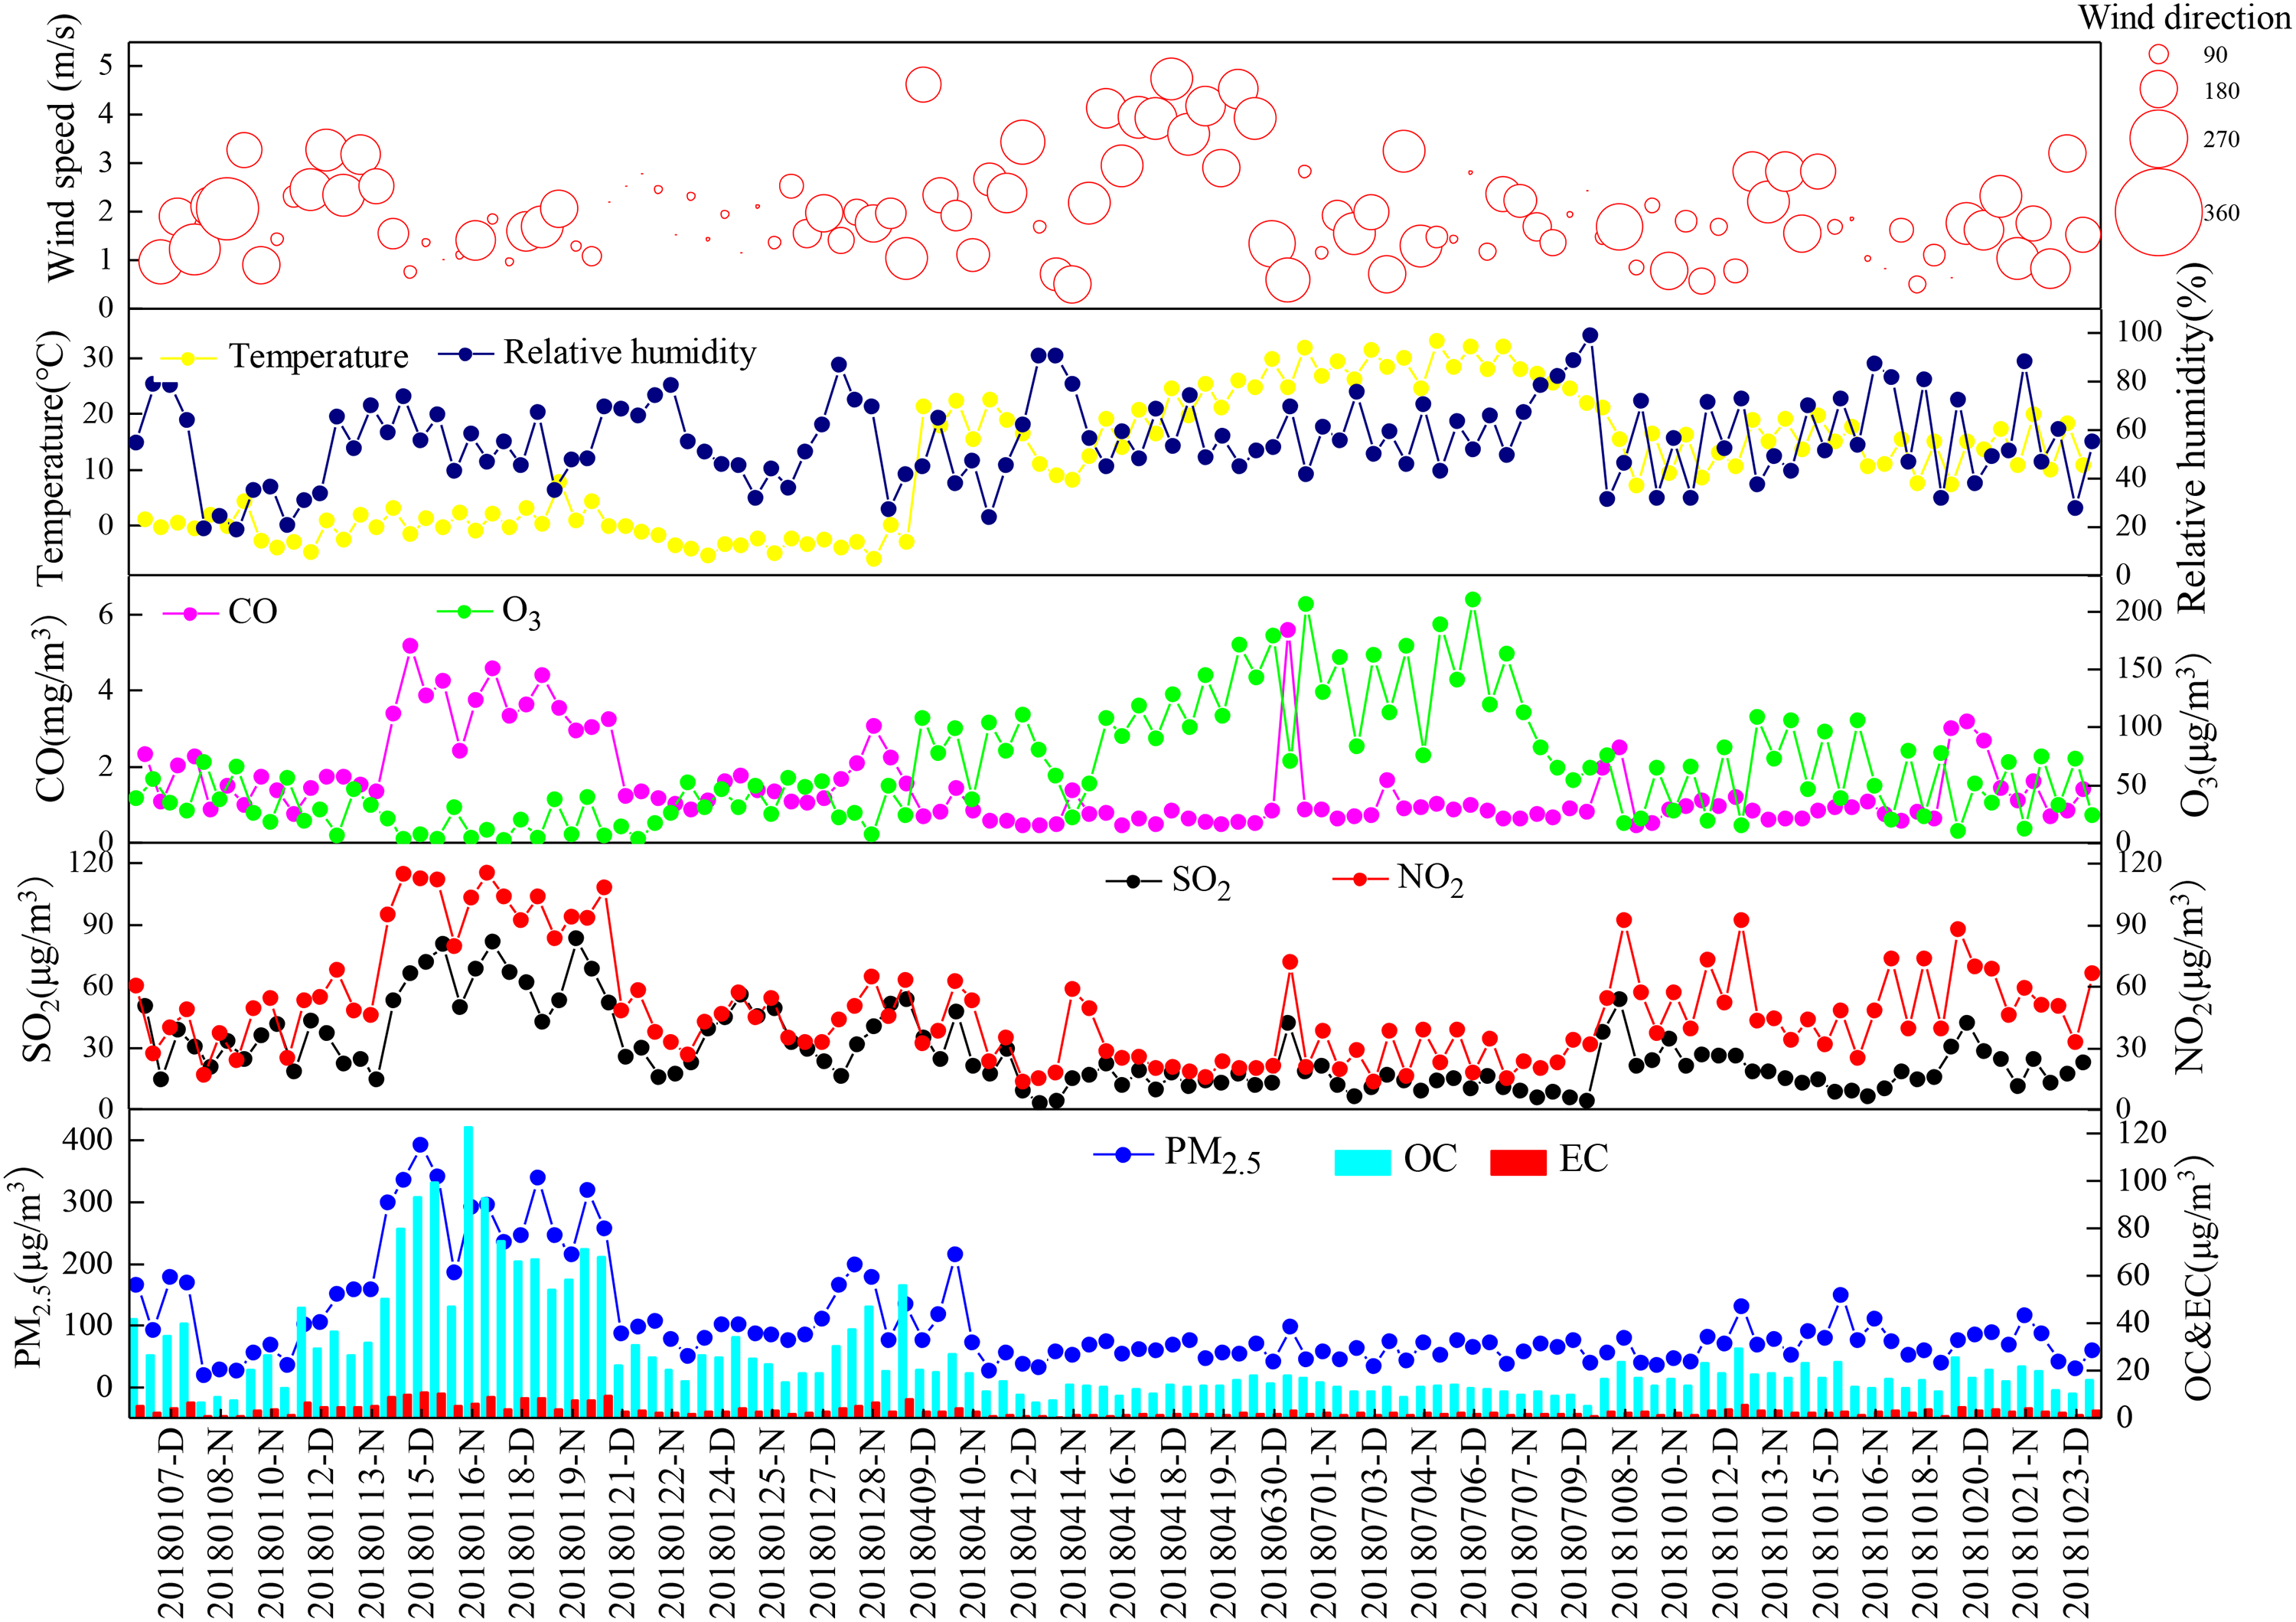
Time series of the meteorological factors, average concentrations of PM2.5 and carbonaceous components in Handan in 2018. D-Day, N-Night.
SOC estimation
As a coal mining city, Handan is greatly affected by the primary emission sources (Pian et al., 2016; Wang et al., 2014b), so the content of POC is very high. The average annual ratio of POC/PM2.5 is (16.21% ± 5.77%) (Table 2), which is an important component of PM2.5. The ratio of POC/OC is (64.74% ± 19.87%) in 2018, which further verifies that the primary emission source has a great impact on PM2.5 in Handan city (Xue et al., 2020).
POC and SOC concentrations and ratios of OC and PM2.5.
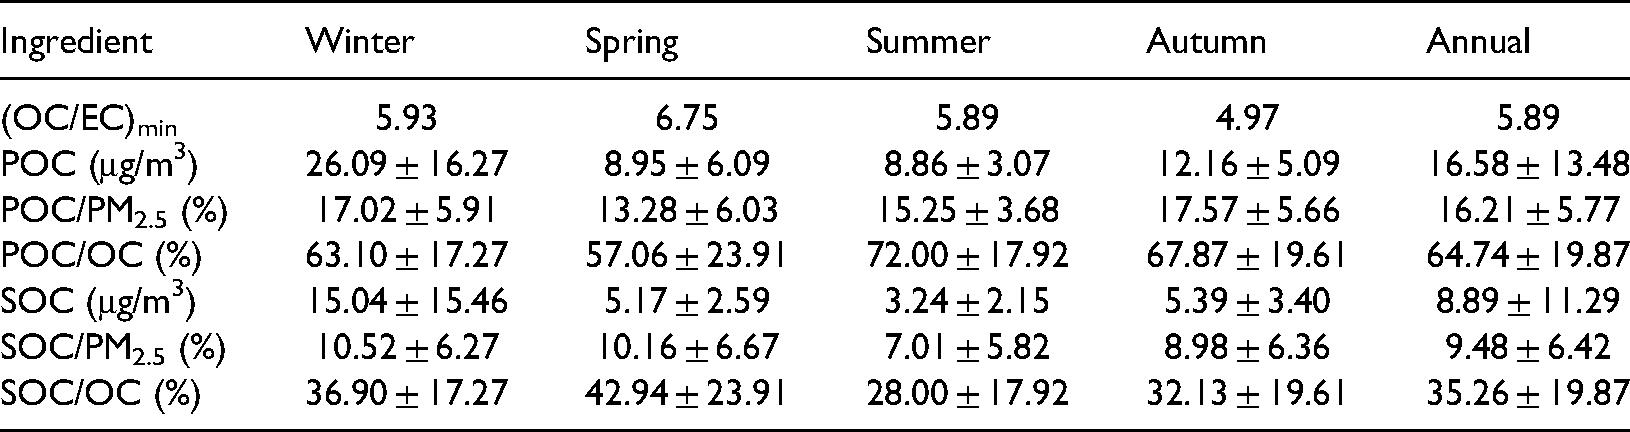
The annual (OC/EC)min ratio was greater than 2 (Table 2), which suggested that there was secondary organic aerosol pollution in Handan city. The cause of the high (OC/EC)min ratio is due to the great changes of the energy structure since the comprehensive implementation of “Coal Replacing Project” measures in Hebei Province. The primary emissions of EC and POC were significantly reduced, while SOC/PM2.5 ratio increased. The mean concentrations of SOC in winter and autumn were (15.04 ± 15.46) μg/m3 and (5.39 ± 3.40) μg/m3, which were much higher than those in spring and summer (5.17 ± 2.59) μg/m3, (3.24 ± 2.15) μg/m3. More precipitation in summer has a greater effect on pollution removal (Xue et al., 2020), resulting in lower SOC concentration in the atmosphere. While, the lower temperature, more windy weather and lower RH in spring resulted in lower SOC concentration. The higher SOC concentrations were resulted from residential heating in winter, increasing emissions from coal combustion, and motor vehicle exhaust emissions (Xue et al., 2020). The lower atmospheric boundary layer and more frequency of temperature inversion led to the formation and accumulation of SOC, which was higher than other seasons. Previous studies reported that biomass burning would enhance SOC, which was one of the significant reasons for the higher SOC concentration in autumn (Pio et al., 2011).
The average annual ratio of SOC/PM2.5 was (9.48% ± 6.42%). SOC/OC ratios in PM2.5 were higher in winter (36.90%) and spring (42.94%) than those in autumn (32.13%) and summer (28.00%). The seasonal changes of SOC mass concentration and SOC/OC ratio in winter were similar to the observations in Zhengzhou (Wang et al., 2017). The higher SOC concentrations and SOC/OC ratios may be due to the increase in coal-fired heating in winter and spring, which led to the increase of SOC concentrations. In addition, the temperature inversion and low atmospheric boundary layer often occurred in winter and spring. These phenomena were conducive to the accumulation of pollutants. The low temperature accelerated the condensation of VOCs of PM2.5 in winter, which was responsible for the highest SOC/OC ratio of PM2.5 in winter (Xue et al., 2020). Photochemical reaction and temperature play important roles in the formation of SOC. Studies reported that when temperature increased by 10°C, the concentration of SOC decreased by 18% (Odum et al., 1996; Pandis et al., 1992). The low temperature was conducive to the adsorption and condensation of VOCs on the particles. High temperature, high RH and strong solar radiation provide favorable atmospheric conditions for photochemical reaction in summer, which makes OC more easily oxidized to SOC, so the SOC/OC ratio was the highest in summer. It had been found that the highest SOC production was related to the increase in photochemical activity in summer (Castro et al., 1999).
Source apportionment of carbonaceous aerosol
Principal component analysis
The content of eight carbonaceous components (OC1, OC2, OC3, OC4, EC1, EC2, EC3 and OPC) can show certain source spectrum characteristics, which can be used to qualitatively identify the sources of carbonaceous aerosol pollution. The EC3 value is 0, so seven fractions of carbonaceous components were analyzed by PCA in spring. The factors with cumulative variance >70% and each characteristic value greater than 1 were extracted (Table 3). According to the characteristic carbonaceous components extracted and the load of each factor in different seasons, the main sources of OC and EC in PM2.5 in Handan city can be obtained.
Principal component analysis of carbon components in PM2.5 in different seasons in Handan city.
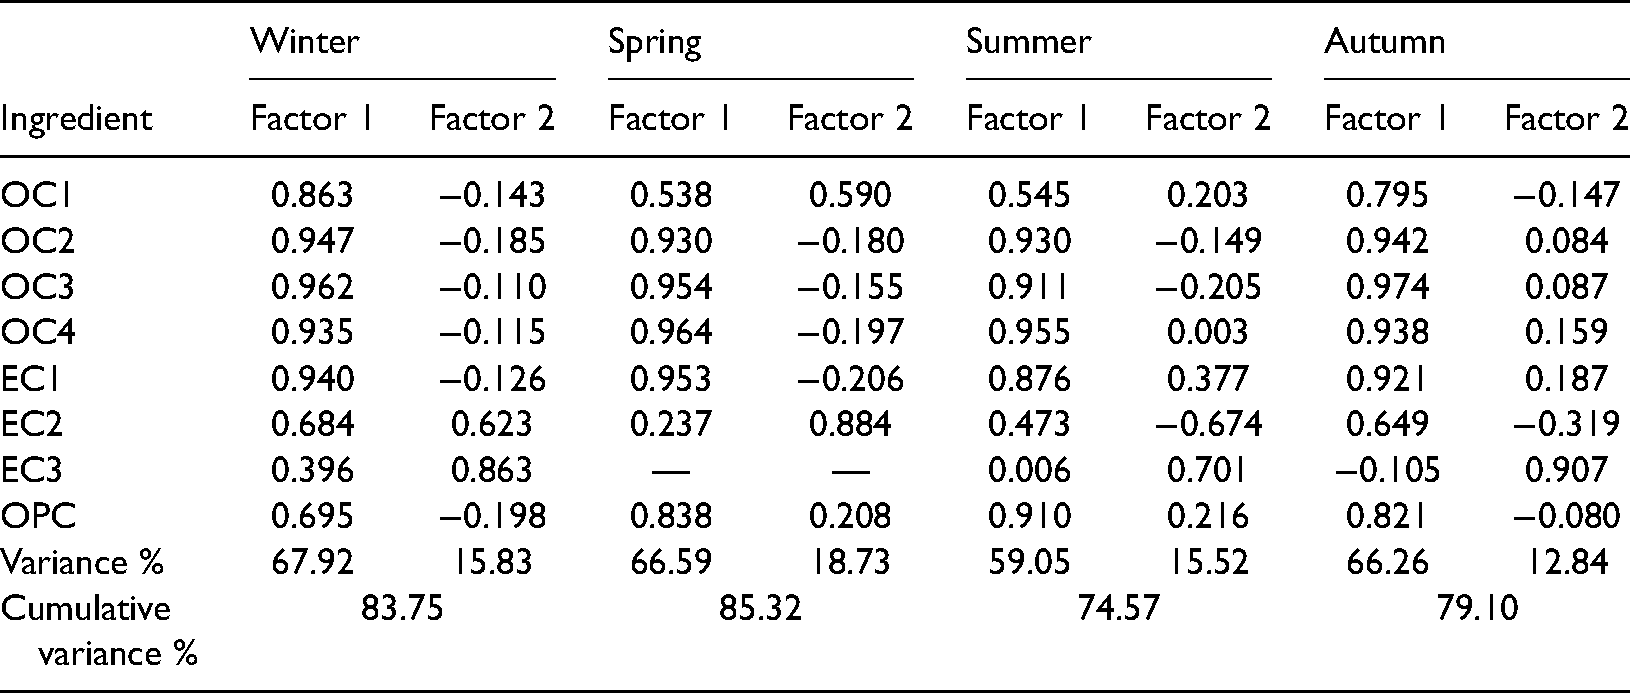
The high load components of factor 1 were OC1, OC2, OC3, OC4 and EC1 in winter, and factor 1 may represent coal combustion, biomass combustion, road dust and vehicle exhaust emissions (Turpin and Lim, 2001; Zhang et al., 2014). In spring, the high load components of factor 1 were OC2, OC3, OC4, EC1 and OPC, which were characterized by coal combustion, road dust and mixed vehicle exhaust (Turpin and Lim, 2001; Zhang et al., 2014). The high load components of factor 1 are OC2, OC3, OC4 and EC1 in summer, which were similar to the main components in spring. The complex pollution of coal combustion emissions, road dust sources and motor vehicle emissions are the main emission sources. In autumn, the load components of factor 1 in OC1, OC2, OC3, OC4 and EC1 were higher, and their pollution characteristics were similar to those in spring and summer. In conclusion, the correlation of OC2, OC3, OC4 and EC1 in each season of Handan city was high. Handan is a coal mining city, and the main sources of OC and EC in PM2.5 are coal combustion emission, road dust and vehicle exhaust This may be related to coal mining, coal power generation, steelmaking, and coal transportation in Handan city.
Backward trajectory and potential source analysis
The possibility of large-scale or regional origin of carbonaceous aerosols was analyzed by 48-h backward trajectory and PSCF (Figure 4). Meteoinfo software was used for cluster analysis of the 48-h backward air mass trajectories during the sampling period (Wang et al., 2009). The air mass trajectories were divided into three clusters for each season, and the possible transmission paths and sources of carbonaceous components in PM2.5 were speculated.
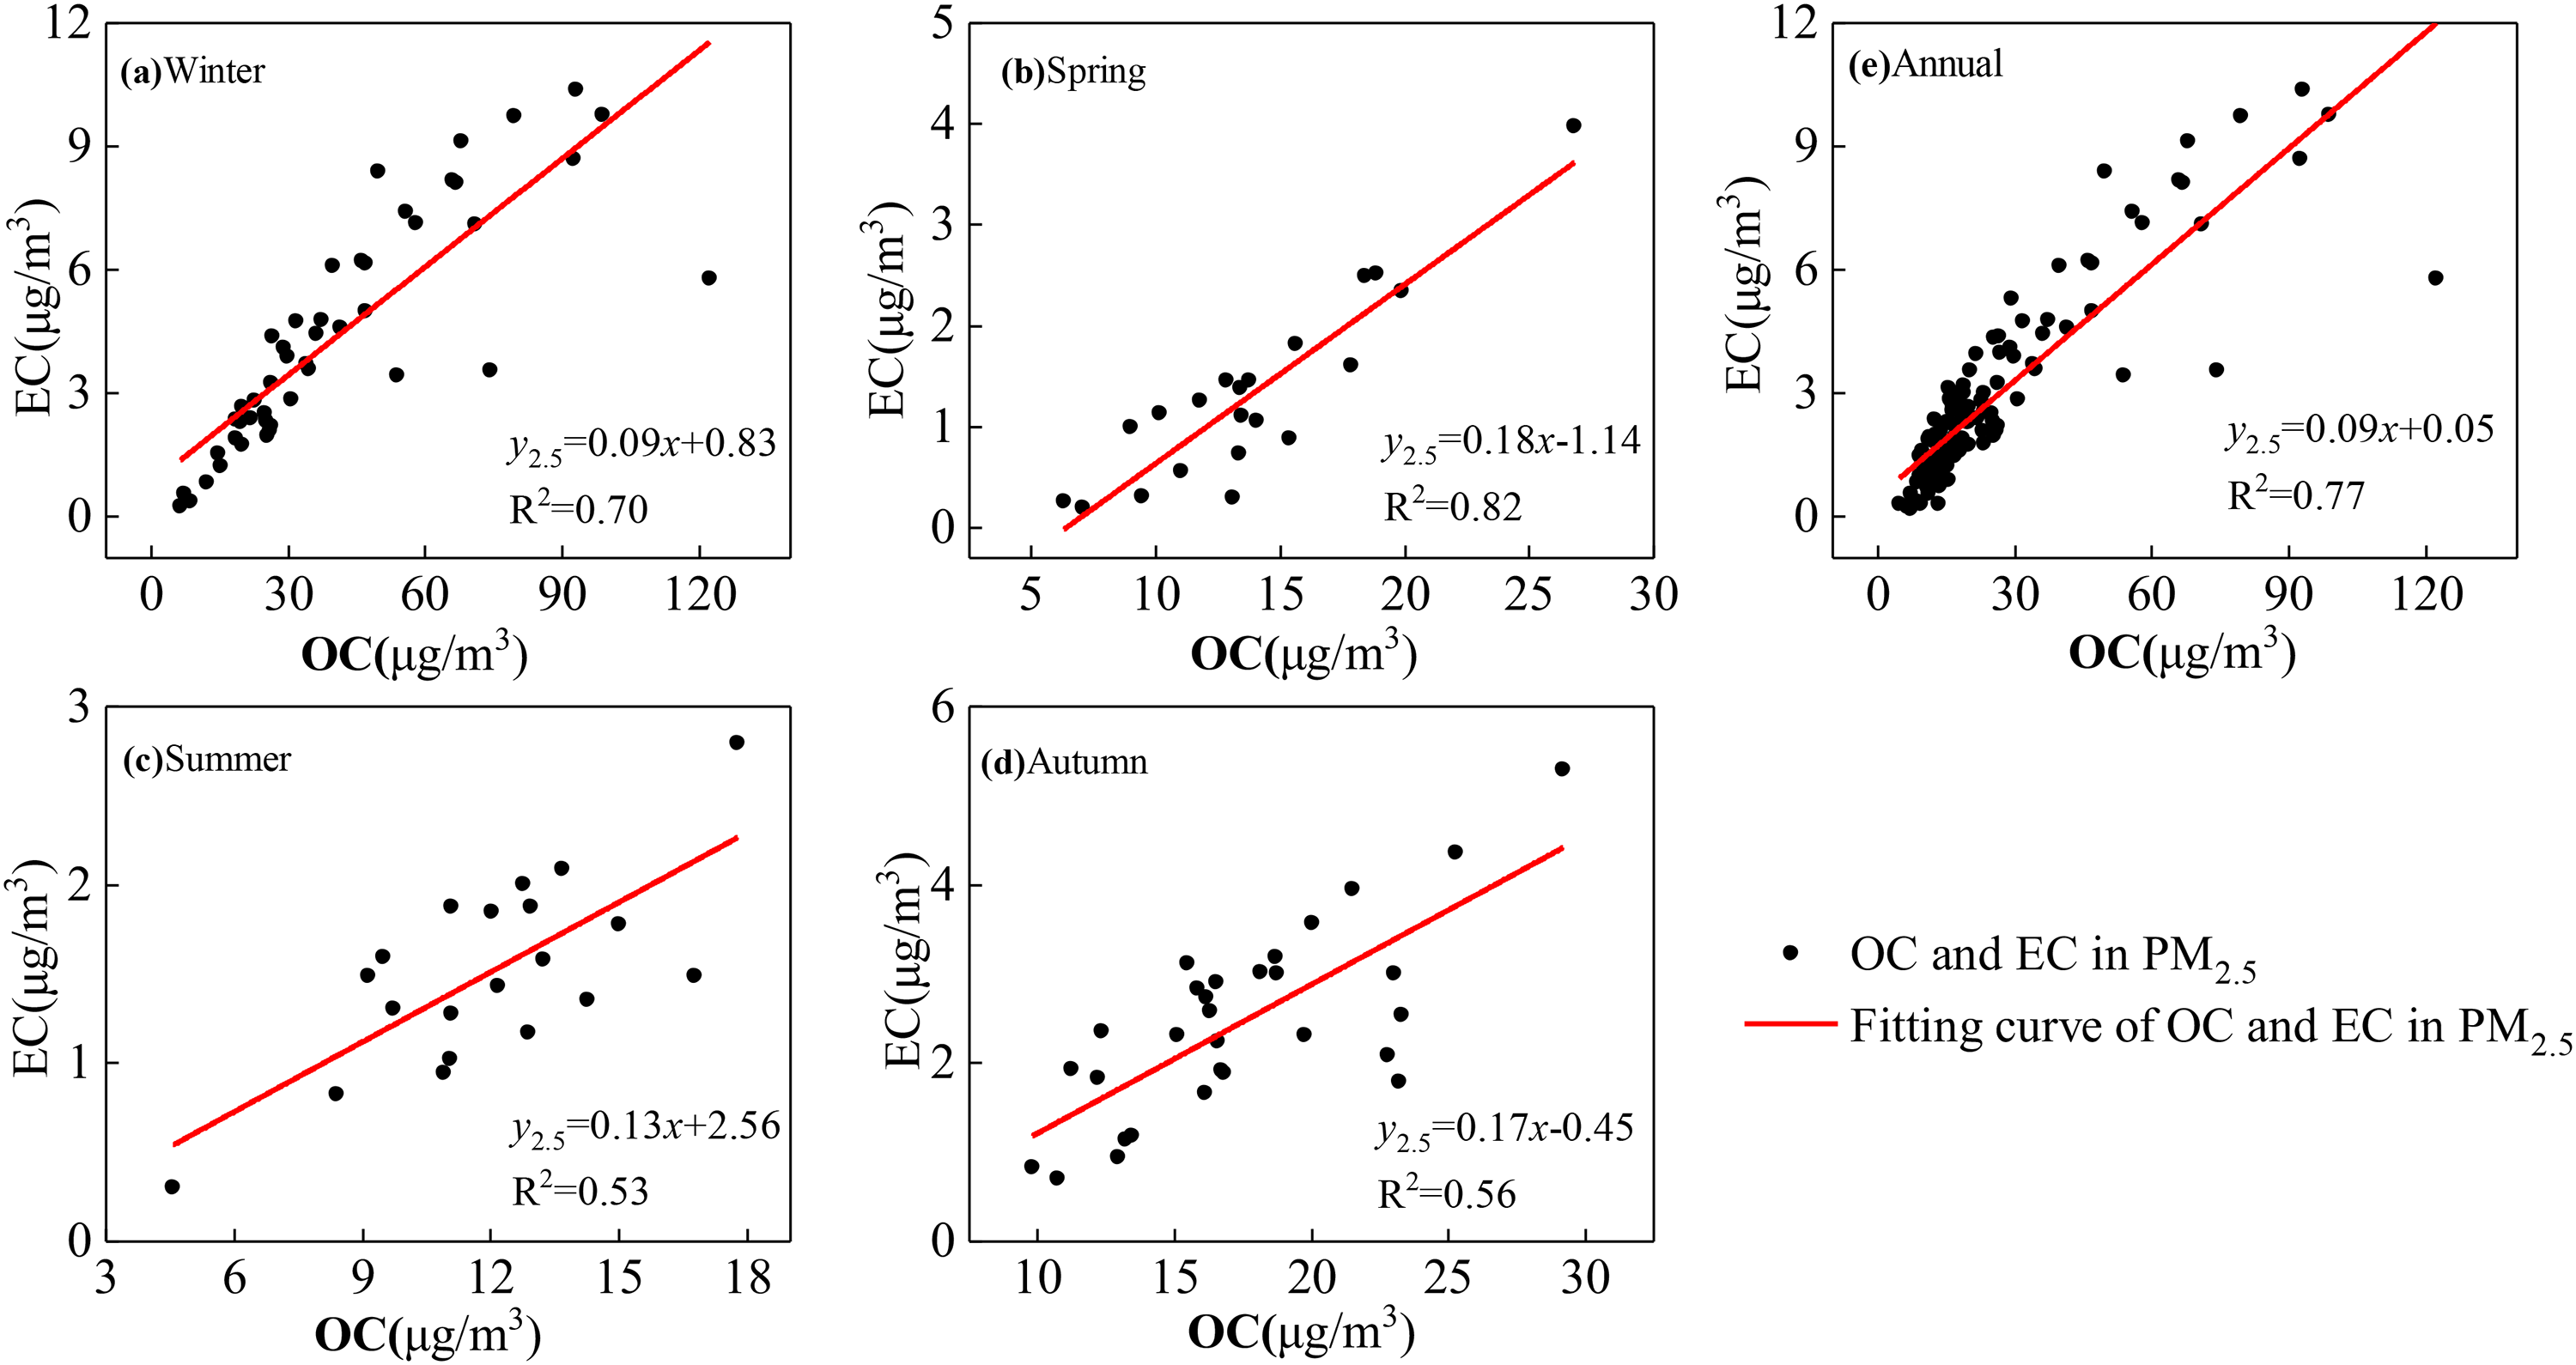
Correlation between OC and EC in PM2.5 during four seasons in Handan in 2018.
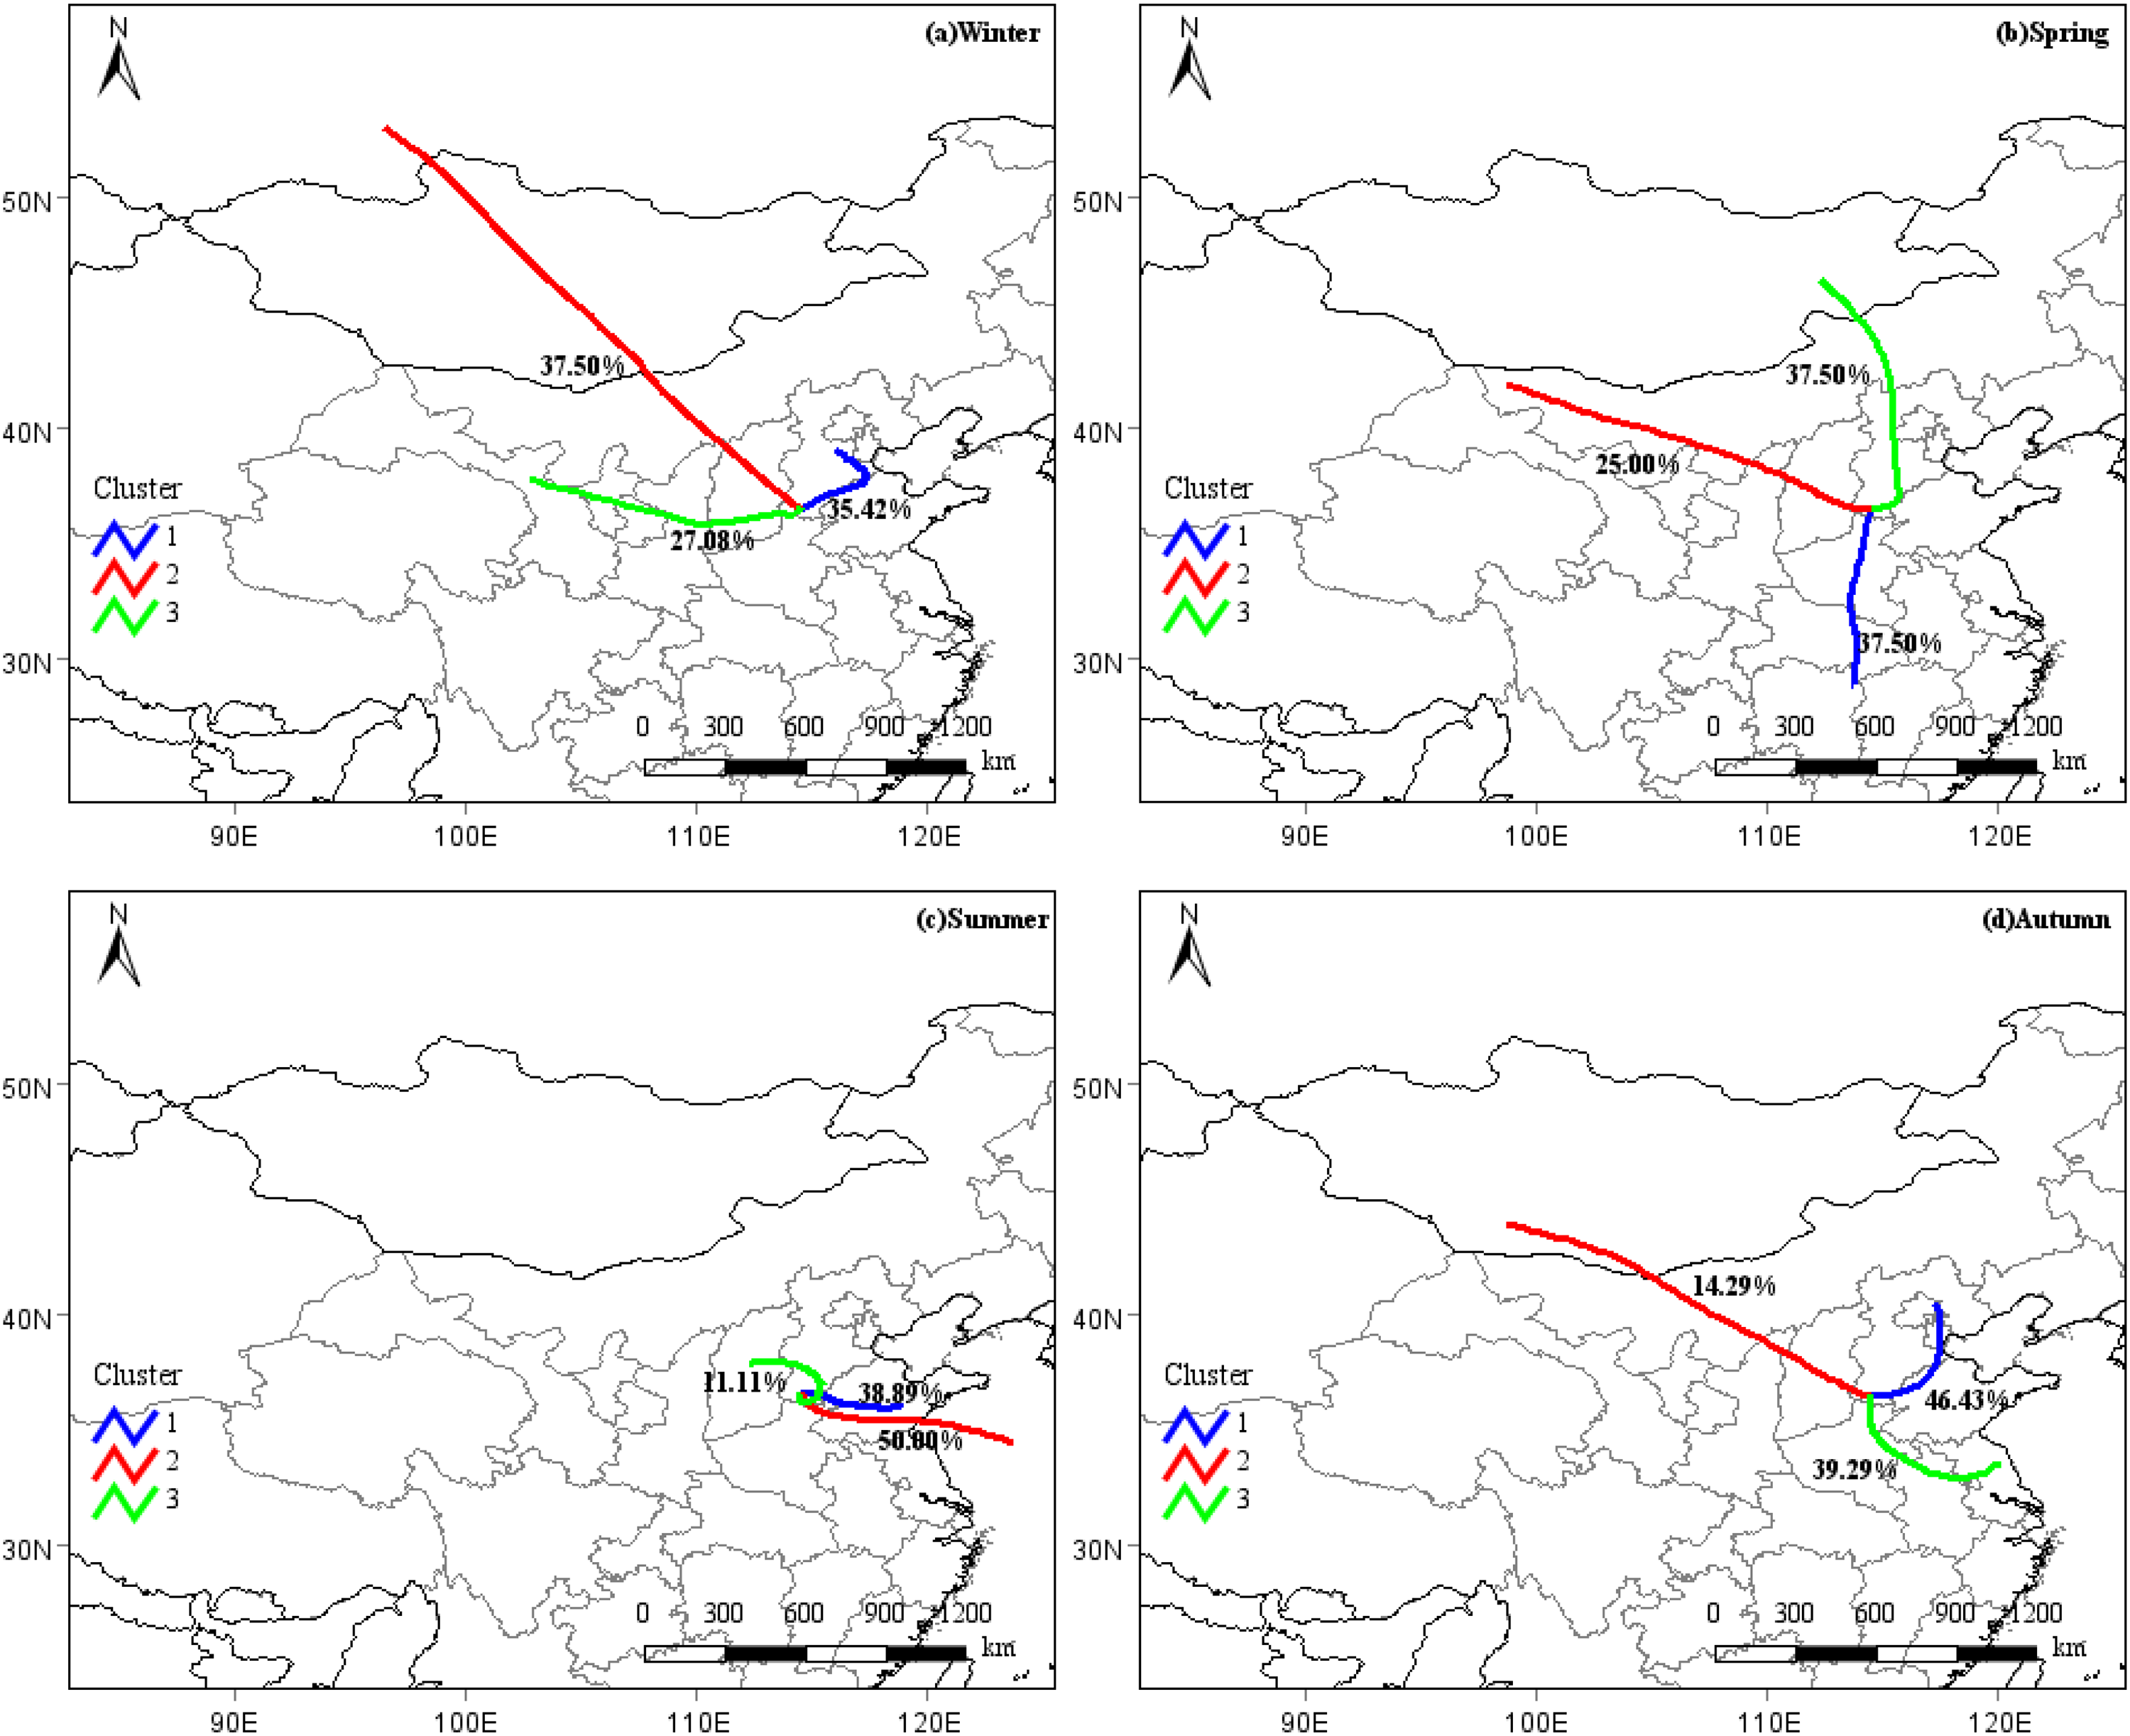
Forty-eight-hour backward trajectory of air masses during four seasons of 2018 in Handan.
In winter, cluster 2 accounted for the largest proportion (37.5%). It was a long-distance transport path from the northwest (west Siberian cold air mass), through Mongolia, Inner Mongolia and Shanxi. In spring, both cluster 1 and cluster 3 accounted for 37.5%. They came from the north and south directions with long-distance transport. In summer, cluster 1 and cluster 2 were from the southeast. Cluster 2 transported from the East China Sea and the air mass was from marine areas with lower PM2.5 concentration. In autumn, the dominant wind direction was northeast, so the proportion of cluster 1 from northeast was the highest (46.43%), which originated from Beijing and Tianjin. The proportion of cluster 3 from southeast was 39.29%, and the air mass reached the sampling site across the provinces of Jiangsu, Anhui and Henan. Backward trajectory analysis demonstrated that PM2.5 and carbonaceous components were largely affected by long-distance transportation, especially in winter.
Although the cluster analysis of backward trajectory can clearly explain the transport path and direction in each season, it can not identify the potential source areas and the carbonaceous components of PM2.5. The potential source areas of PM2.5, OC and EC during four seasons of Handan city were evaluated by PSCF (Figure 5). It can be found that PM2.5, OC and EC have similar spatial patterns of potential pollution sources. Generally, all the main source areas are distributed in the northern part of Shaanxi province, the central and southern part of Shanxi province and the junction of Hebei and Henan provinces in winter.
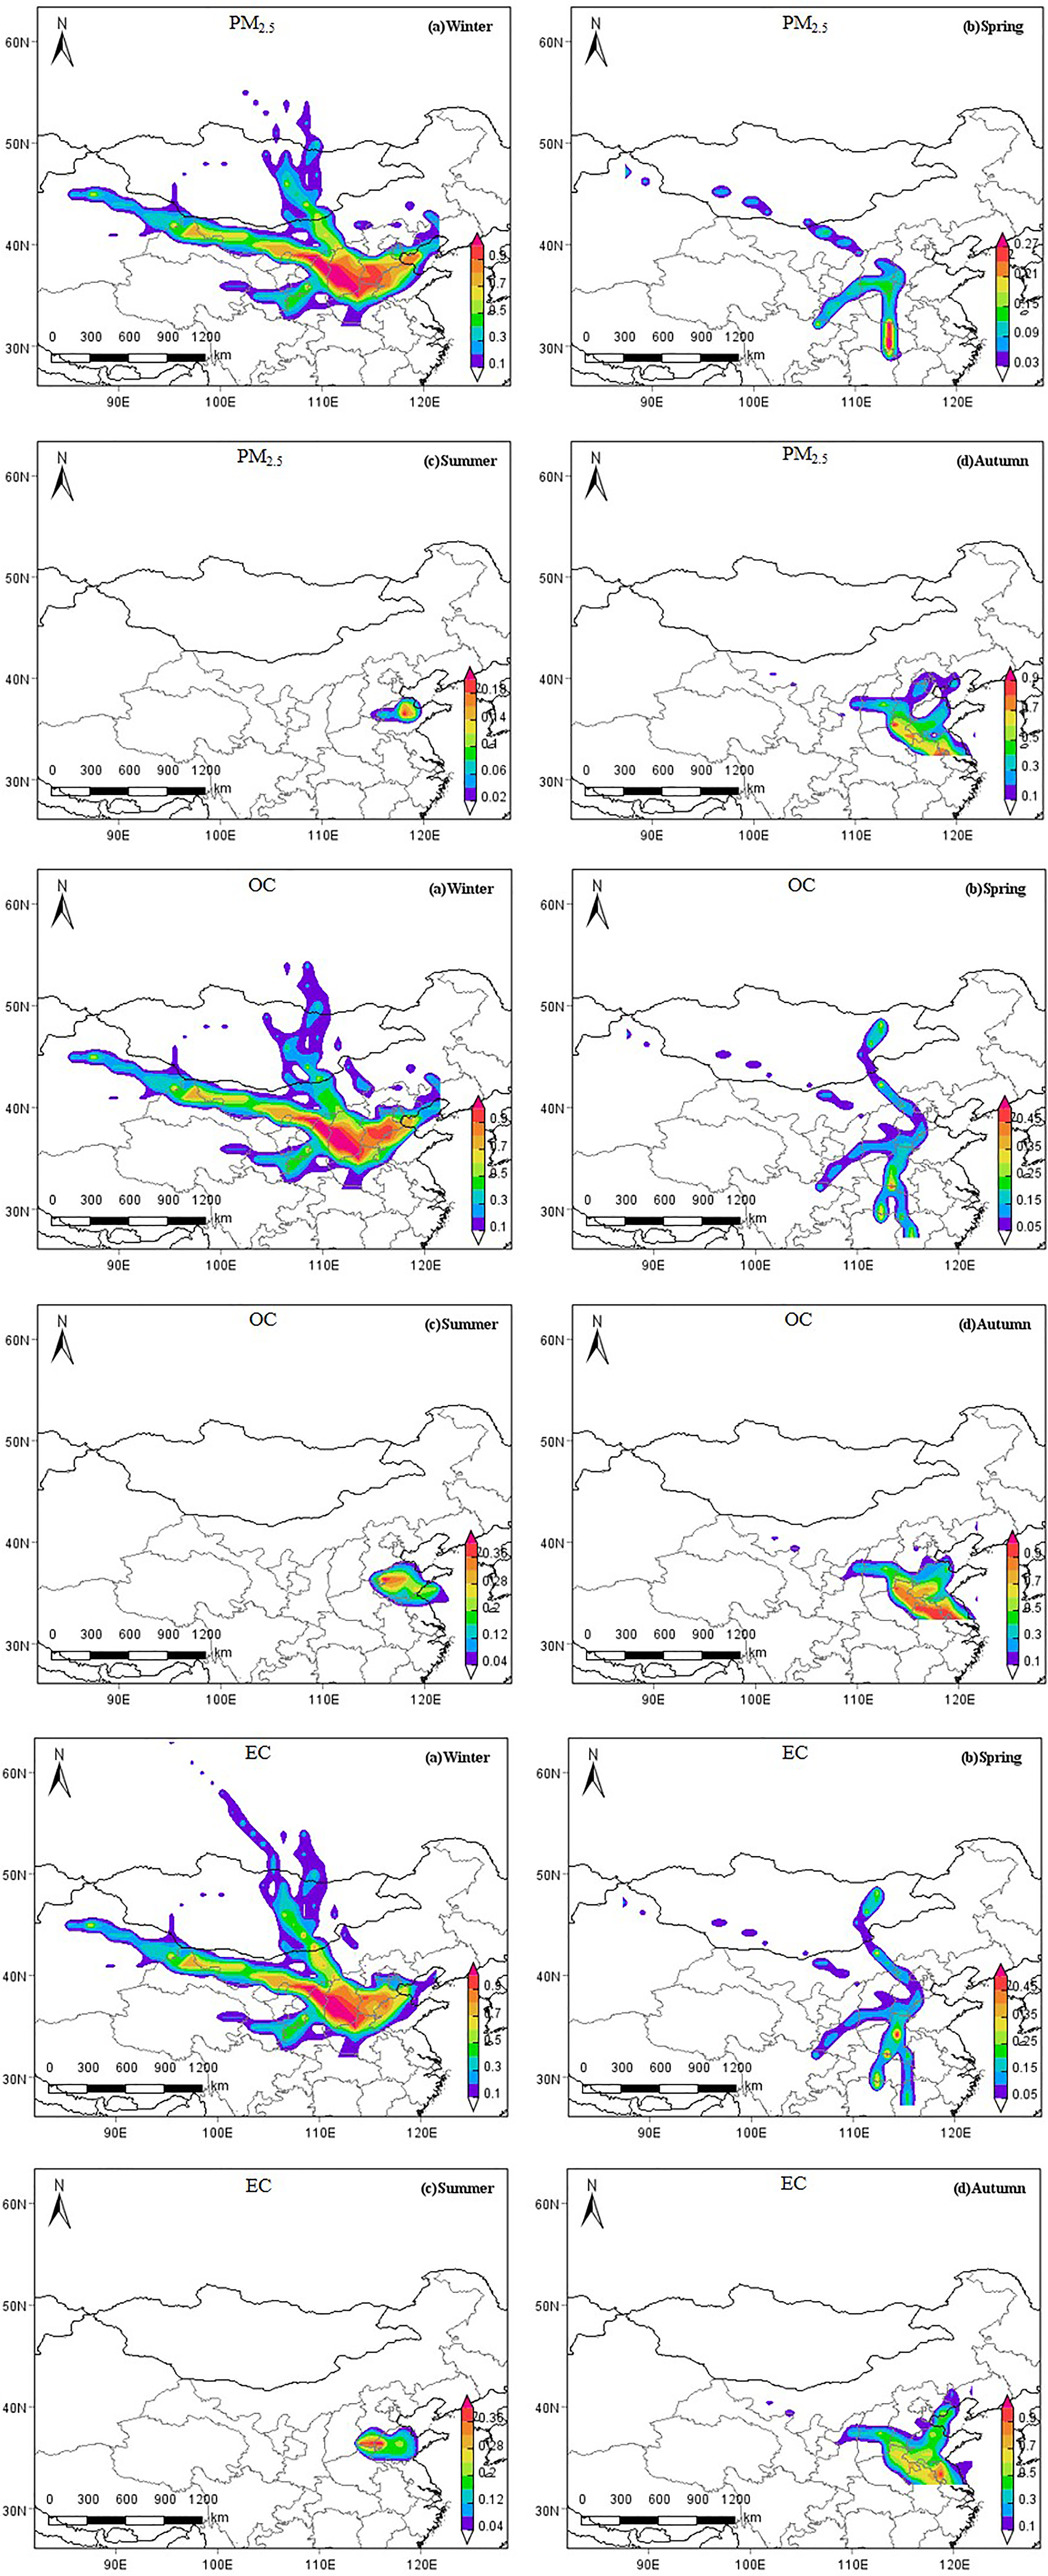
PSCF distribution of PM2.5, OC and EC during different seasons of 2018 in Handan City. The warmer color indicates bigger contribution in this region.
The WPSCF of Handan city was above 0.9. It was speculated that in addition to the impact of regional transport, the local pollution source emissions would make a greater contribution in winter 2018. Because the terrain of Handan city is with higher altitude in the west and lower altitude in the east, and many basins and mountainous landforms, which is adverse to air circulation and diffusion, making air pollutants easy to accumulate. In spring, WPSCF high value areas were mainly distributed in the boundary area of Henan and Hubei, mainly regional transport. In summer, WPSCF high value areas were mainly distributed in the boundary area of Hebei, Shandong and He'nan. In autumn, the pollution transport in Handan city was mainly from the southeast direction, and is controlled by the anticyclone system, with high atmospheric boundary layer and prevailing downdraft, which is conducive to the diffusion of pollutants. The potential source areas are mainly in Jiangsu and Anhui, where the WPSCF values were higher than 0.7. Previous studies also found a similar spatial distribution of potential sources of PM2.5 (Zhao et al., 2019). In general, PM2.5 and its carbonaceous components in Handan city during the sampling period showed a significant combination of local contribution and regional transportation.
Conclusions
Handan is one of the most polluted coal mining cities in the NCP. This study collected and analyzed the atmospheric PM2.5 samples in Handan City in 2018. The results showed that the average concentrations of PM2.5 and TC were (101.88 ± 79.01) μg/m3 and (28.03 ± 23.28) μg/m3, respectively. The average annual ratio of TC/PM2.5 was (28.29% ± 7.95%), indicating that the pollution of carbonaceous components in PM2.5 was serious. The seasonal variations of OC and EC concentrations in PM2.5 are consistent with that of PM2.5, which was higher in winter and lower in summer. The higher concentration of TCA in PM2.5 in autumn and winter may be caused by the increase of straw and other biomass combustion and concentrated residential heating, respectively.
The annual average ratio of OC/EC in PM2.5 was (10.33 ± 5.83), and the (OC/EC)min ratio of each season was greater than 2, indicating that there was SOC pollution in Handan throughout the year. The OC/EC ratio in PM2.5 in Handan city ranges from 4.97 to 43.45, indicating that the pollution during this period may be related to automobile exhaust, coal combustion and biomass burning. The correlation OC and EC was the highest in spring and winter and the lowest in summer, which indicates that the sources of carbonaceous aerosol in spring and winter were less, and coal combustion may be the main pollution source. The sources of OC and EC are relatively complex due to the influence of meteorological factors in summer and autumn. SOC concentration is lower in spring and summer, and higher in autumn and winter. The SOC/OC ratios of PM2.5 in winter (36.90%) and spring (42.94%) are higher than those in autumn (32.13%) and summer (28.00%).
Principal component analysis (PCA) displayed that the main sources of carbonaceous components in PM2.5 were coal combustion emission, road dust and vehicle exhaust, which may be related to coal mining, coal power generation, steelmaking, and coal transport in Handan city. Backward trajectory analysis demonstrated that PM2.5 and carbonaceous components were mainly affected by long-distance transportation. PSCF analysis exhibited that both local contribution and regional transport significantly contributed to PM2.5 and carbonaceous components during the observation period.
Footnotes
Acknowledgements
This work was supported by the National Natural Science Foundation of China (41807305 and 41805118), Hebei Provincial Natural Science Foundation (D2021402004 and D2018402149) and Key Projects (19273705D), Supporting Plan for 100 Excellent Innovative Talents of Hebei Province (SLRC2019021), and Tianjin Natural Science Foundation green channel project (No. 18JCYBJC42200).
Declaration of conflicting interests
The author(s) declared no potential conflicts of interest with respect to the research, authorship, and/or publication of this article.
Funding
The author(s) disclosed receipt of the following financial support for the research, authorship, and/or publication of this article: This work was supported by the National Natural Science Foundation of China (41807305 and 41805118), Hebei Provincial Natural Science Foundation (D2021402004 and D2018402149) and Key Projects (19273705D), Supporting Plan for 100 Excellent Innovative Talents of Hebei Province (SLRC2019021), and Tianjin Natural Science Foundation green channel project (No. 18JCYBJC42200).