
Abstract
During a freezing method for rock crosscut coal uncovering (RCCU), the mechanical properties of the frozen coal–rock interface have a significant impact on coal-body stability. To investigate characteristic and development mechanism of freezing strength of frozen coal–rock interface, a series of direct shear tests were conducted on frozen coal–rock interface under various testing temperatures, moisture contents in coal and normal stresses. The test results showed that the strength of the frozen coal–rock interface was affected by the moisture content in coal. The larger the moisture content was, the greater strength of the interface was. When the testing temperature was −10°C, the freezing strength increased from 75.46 to 267.42 kPa with the moisture content increasing from 3% to 9%. The ice cementing strength at the interface also increased with testing temperature decreasing. It increased from 6.44 to 73.34 kPa with the testing temperature decreasing from −2°C to −10°C when the moisture content was 5% and the normal stress was 200 kPa. With the increase of normal stress, the residual strength of the frozen coal–rock interface increased. When the moisture content in coal was 9% and the testing temperature was −10°C, the residual strength of the interface increased from 40.68 to 132.28 kPa with the normal stress increasing from 100 to 400 kPa. The testing temperature had no obvious influence on the friction coefficient and the cohesion of residual strength. When the moisture content in coal was 5%, the cohesion of residual strength increased from 23.39 to 98.7 kPa and the friction coefficient of residual strength fluctuated between 0.49 and 0.63 with the testing temperature decreasing from −2°C to −10°C. The relationship between the shear strength and the normal stress followed the Mohr–Coulomb law.
Keywords
Introduction
Coal-gas outburst is one of the most serious disasters in coal mining. It will not only cause a serious malignant accident of mass casualties, but also result in huge property losses (Pan et al., 2020; Wang et al., 2019). Especially, for rock crosscut coal uncovering (RCCU), although the times of coal-gas outbursts is less, the outburst intensity is larger, and more than 80% of the super large coal-gas outbursts occur in the process of RCCU (Yang et al., 2021; Yue et al., 2019a, 2019b). Moreover, with the increase of coal-mining depth, the in-situ stress, temperature and gas pressure gradually increase, which increases the risk of RCCU and seriously threatens safe and efficient mining (Wang et al., 2013; Yu et al., 2015).
At present, a large number of engineering practices have been carried out on the technical measures for the prevention of coal-gas outburst during RCCU, which mainly includes gas pre-drainage, water conservancy measures, metal skeleton, deep-hole pre-splitting blasting, coal solidification, etc. These measures play a certain role in eliminating the risk of coal-gas outburst (Wei, 2011; Yue et al., 2019a, 2019b; Zhou et al., 2017). However, these technologies lay particular emphasis on the safety of RCCU, which causes it to spend a long time. Based on the application of the freezing method in engineering practice, the technology of RCCU by a freezing method can not only improve the speed of uncovering coal and shorten the construction period, but also save the cost and relieve the pressure of the safety investment (Yue et al., 2019a, 2019b). One of the purposes of RCCU by the freezing method is to improve the mechanical properties of coal and rock mass. The mechanical properties of coal determine whether it can be destroyed under the action of in-situ stress and gas pressure, which affects the occurrence and development of coal-gas outburst There are three main steps for RCCU by the freezing method: drilling, water injection (wetting the coal body) and injecting liquid nitrogen (freezing the coal body). After the wetting coal body is frozen, the mechanical properties will be greatly improved, and the ability to resist crushing will be also enhanced (Jin et al., 2019; Manju, 1980).
Feng and Xie (2009) tested the mechanical properties of frozen wet coal briquettes, and found that its mechanical properties were greatly improved. When the temperature decreased from −5°C to −20°C, the uniaxial compressive strength of frozen wet coal briquette increased by 180%, and the uniaxial compressive strength increased linearly with the decrease of temperature (Feng and Xie, 2009). The test results of Yue et al. (2019a, 2019b) show that the mechanical properties of frozen wet coal briquettes are greatly improved. Below 0°C, with the moisture content of coal increasing, the mechanical properties are improved obviously; especially the compressive strength and tensile strength increase several times (Yue et al., 2019a, 2019b). Although the mechanical properties of frozen wet coal briquette are greatly improved, there is little research on the mechanical properties of the interface between frozen coal–rock, which makes the frozen coal–rock technique become integrated and more safe and reliable.
Therefore, in this paper, the direct shear apparatus is used to carry out the shear tests of the frozen coal–rock interface. The shear stress and shear displacement of frozen coal–rock interface at each time are collected, and the freezing strength is analyzed with the influence of different pressure and test temperature.
Materials and methods
Test device
In the low-temperature laboratory (Figure 1(a)), the quadruple strain controlled direct shear apparatus (ZJ type) is used to carry out the shear tests. The indoor temperature can be automatically controlled, and the temperature control accuracy is ±0.5°C. During the test, the ambient temperature is measured in real time to make it as close as possible to the set temperature. Figure 1(b) and (c) show the overall diagram of direct shear apparatus and the shear box, respectively. The shear box is composed of upper and lower parts. The upper shear box is 20 mm in height and connected with the dynamometer; the lower shear box is also 20 mm in height and connected with the loading motor. The interface between the upper and lower boxes is the shear plane, and the interface between coal and rock sample coincides with the shear plane. The horizontal displacement and interfacial shear force of the shear box can be recorded automatically by the direct shear instrument.
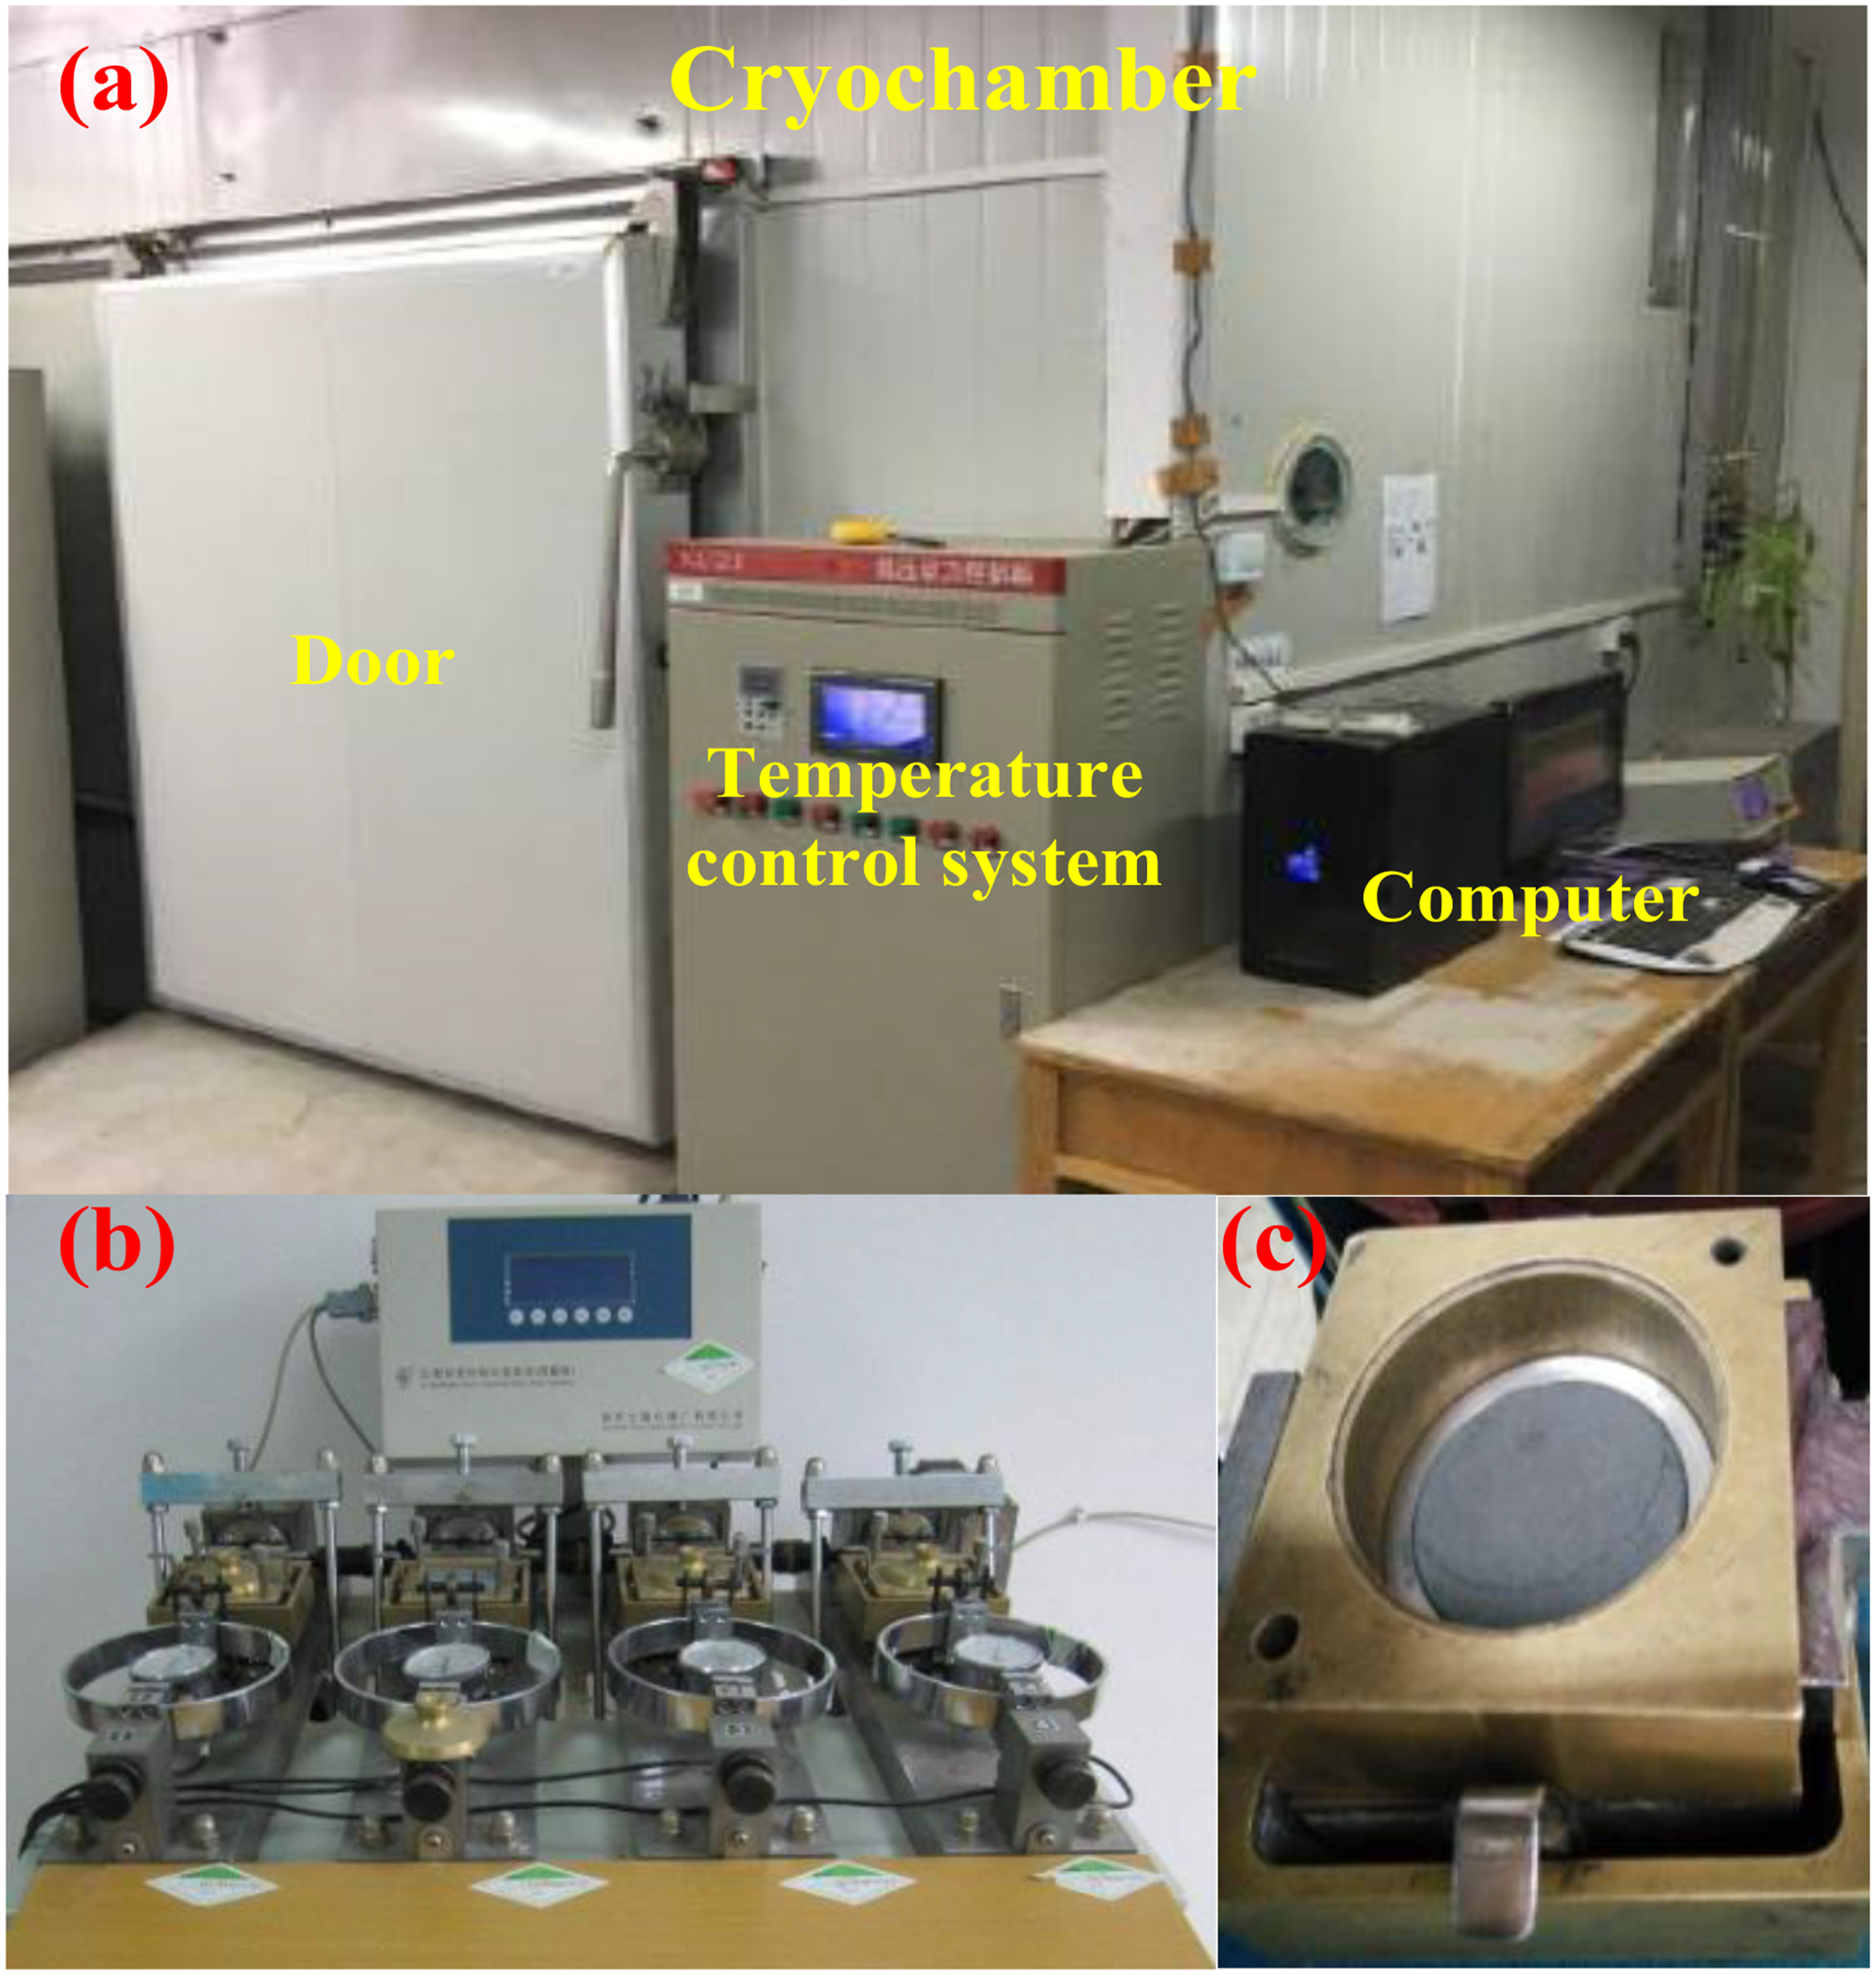
Experimental equipment: (a) cryochamber, (b) shear test apparatus, (c) shear boxes.
Sample preparation
The coal and rock samples used in the test are taken from Jiahe mines in Hunan Province; the firmness coefficient of coal is less than 0.48, and it is difficult to core.
Rock sample preparation: A coring drill is used to core the rock mass at the coal–rock joint (as shown in Figure 2(a)). The diameter of the coring pipe is 62 mm, and then it is polished to the diameter of 61.6–61.8 mm and is cut into a short column of 20 mm by a TCHR-II type cutting mill. Coal sample preparation: The coal samples of 60–80 mesh was obtained after the coal was crushed (as shown in Figure 2(b)); According to the predetermined moisture content (3%, 5%, 7% and 9%), the coal sample is evenly mixed with given amount of water; then the wet coal sample is put into the sealed bag for 12 h to make the moisture content evenly distributed. The moisture content of coal sample is measured by an oven-drying method as the actual moisture content (the temperature is 108°C and the drying time is 24 h). Preparation of frozen coal–rock sample: The frozen coal–rock sample is 40 mm in height, which is put into the ring cutter with the inner diameter of 61.8 mm as the sample chamber. The fabrication process of frozen coal–rock sample is as follows: (1) One end of the sample chamber is sealed with plastic tape, and the rock sample is placed in the sample chamber near the side of the plastic tape. (2) The prepared wet coal is weighed and evenly put into the upper part of the rock mass of the sample chamber. (3) The standard press machine is used to load slowly and uniformly on the coal until the coal sample reaches 20 mm height. (4) The whole sample chamber is wrapped with the plastic film to prevent water loss, then put it into the refrigerator at −20°C for 24 h. After the coal–rock sample is completely frozen, the frozen coal–rock sample is pushed out from the sample chamber with a jack to obtain the test sample (as shown in Figure 2(c)). (5) The coal–rock sample is wrapped with the plastic film and put it in the refrigerator for 24 h at the test temperature.
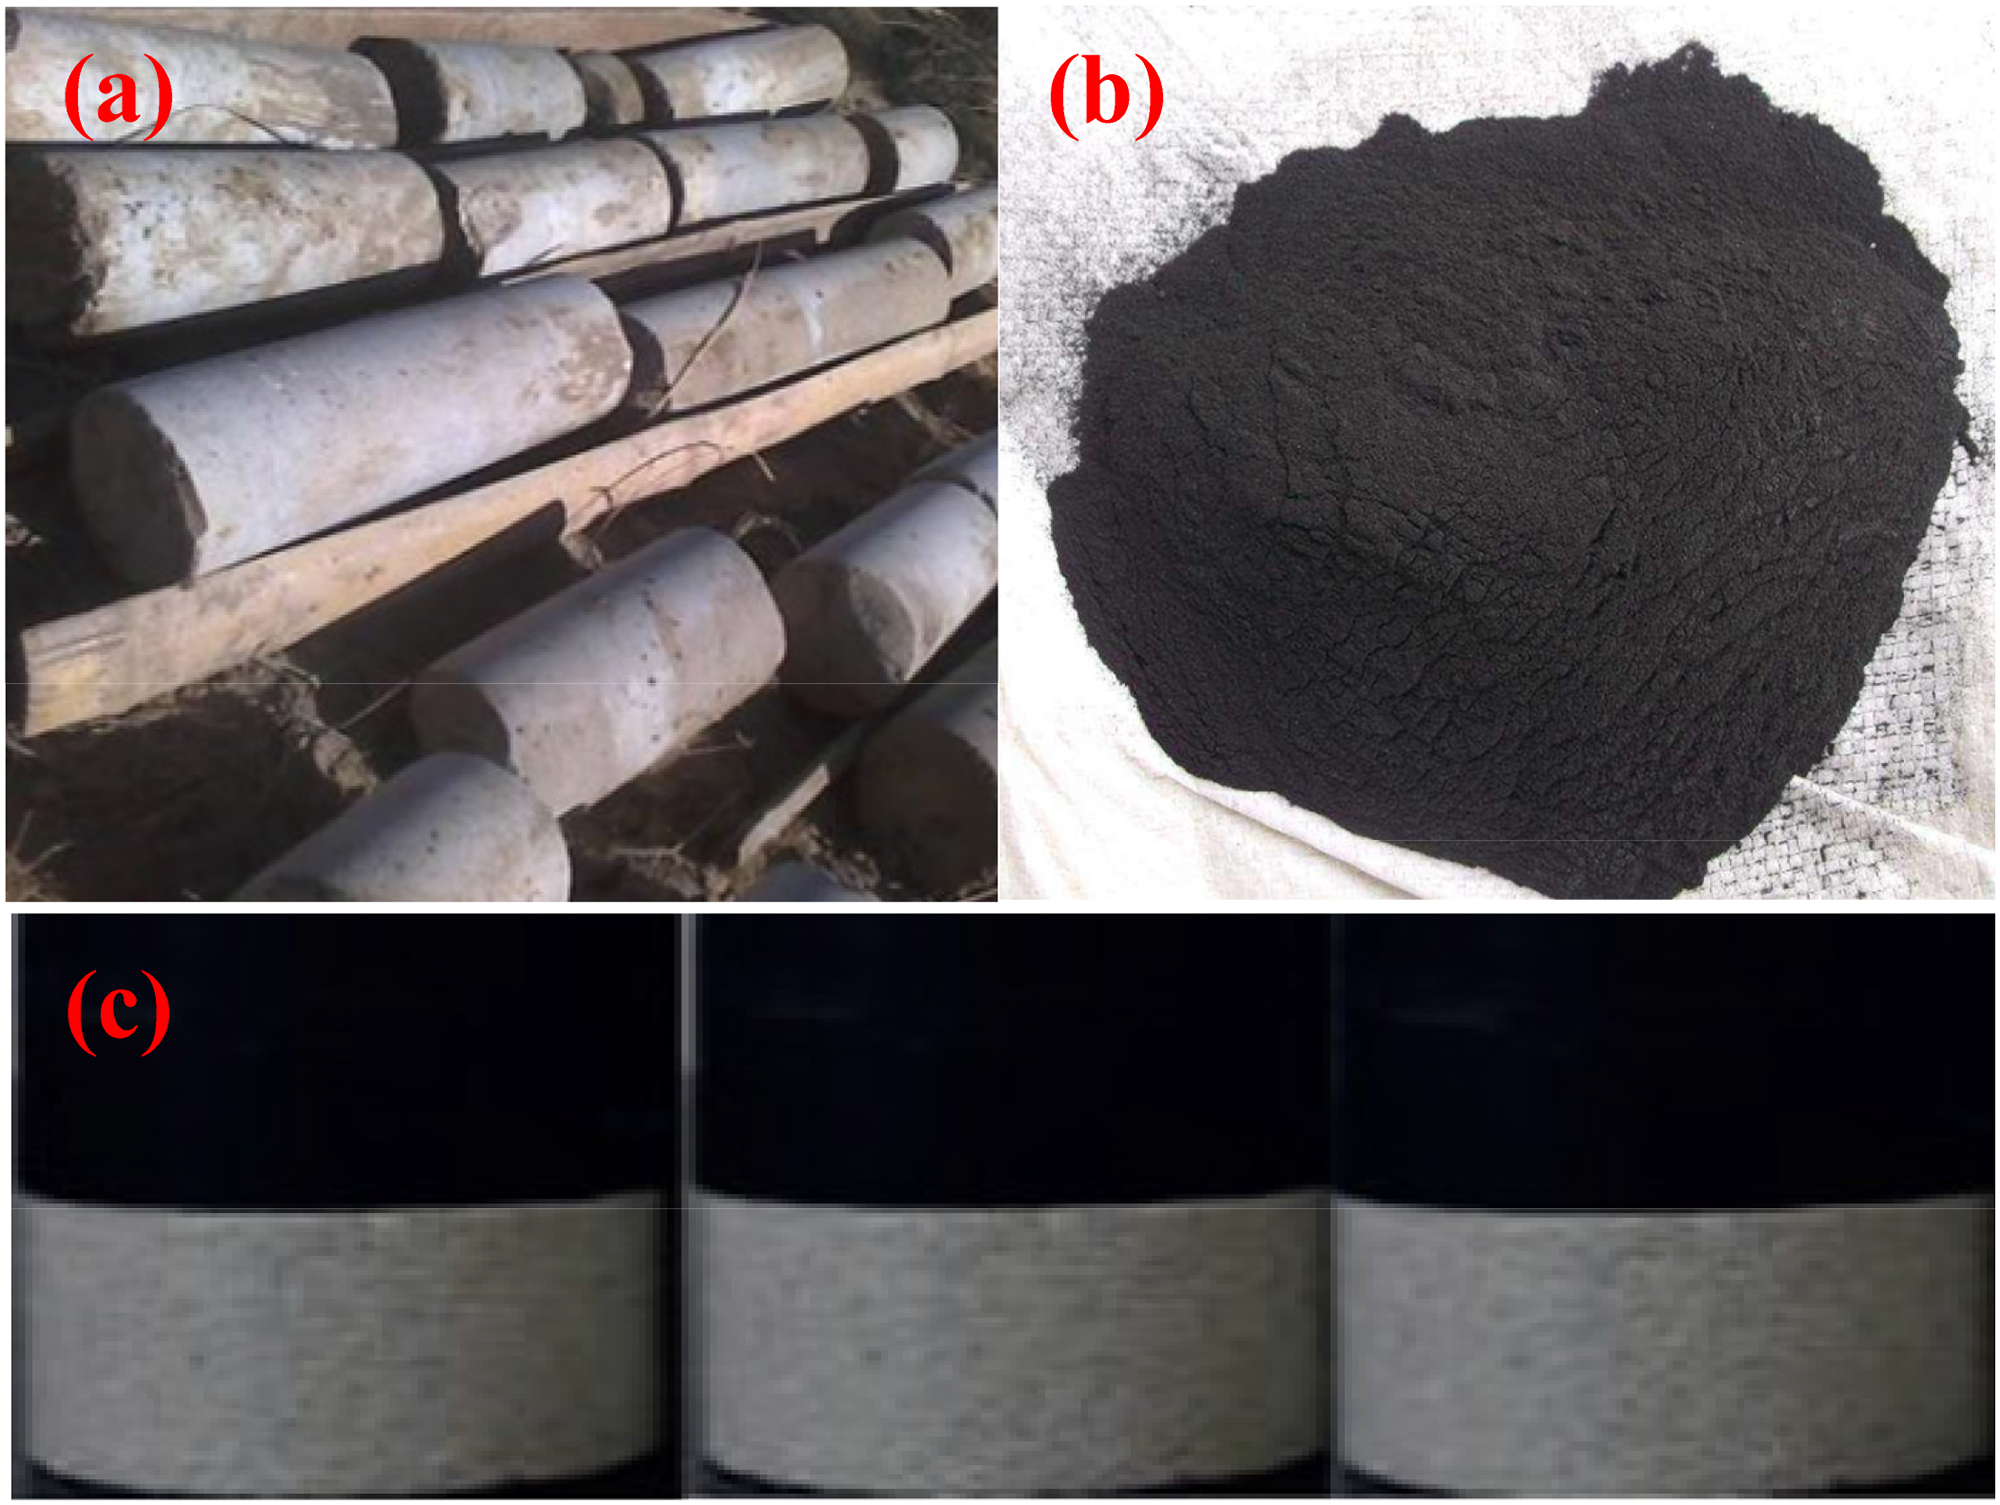
Sample preparation: (a) rock cores, (b) pulverized coal, (c) coal–rock samples.
Test process
Referring to the test method used by Wen et al. (2016), the test process in this paper mainly includes the following steps: (1) The connection status between the test instrument and the control computer is checked to make sure that the control software runs normally. (2) The frozen coal–rock sample, which is kept at the set temperature in the refrigerator for 24 h, is put into the shear box of the direct shear apparatus. After adjusting the dynamometer ring and adding the lid, normal stress is applied. The displacement and shear stress are cleared in the control system, and the shear starts. (3) During the shearing process, the control system can automatically record the shear displacement and shear stress, which can be plotted as a curve to facilitate the monitoring of the test process.
Figure 2(c) shows the frozen coal–rock mass sample before the test, and the contact surface of coal and rock is just in the middle of the coal–rock sample. Figure 3 is the stress diagram of the test sample. The upper surface of the test sample is subjected to the normal stress evenly distributed, and the left side of the upper part of the test sample is subjected to the horizontal thrust, which makes the frozen coal move to the right. Therefore, shear deformation occurs at the contact surface until it reaches the ultimate shear failure. The control variables in the test process include as following: The shear mode is the displacement control mode, the shear rate is 0.5 mm/min, the normal stress is set at 100, 200, 300, 400 kPa, and the moisture content in coal is set at 3%, 5%, 7% and 9%, and the test temperature is controlled at 5°C, −2°C, −5°C and −10°C.
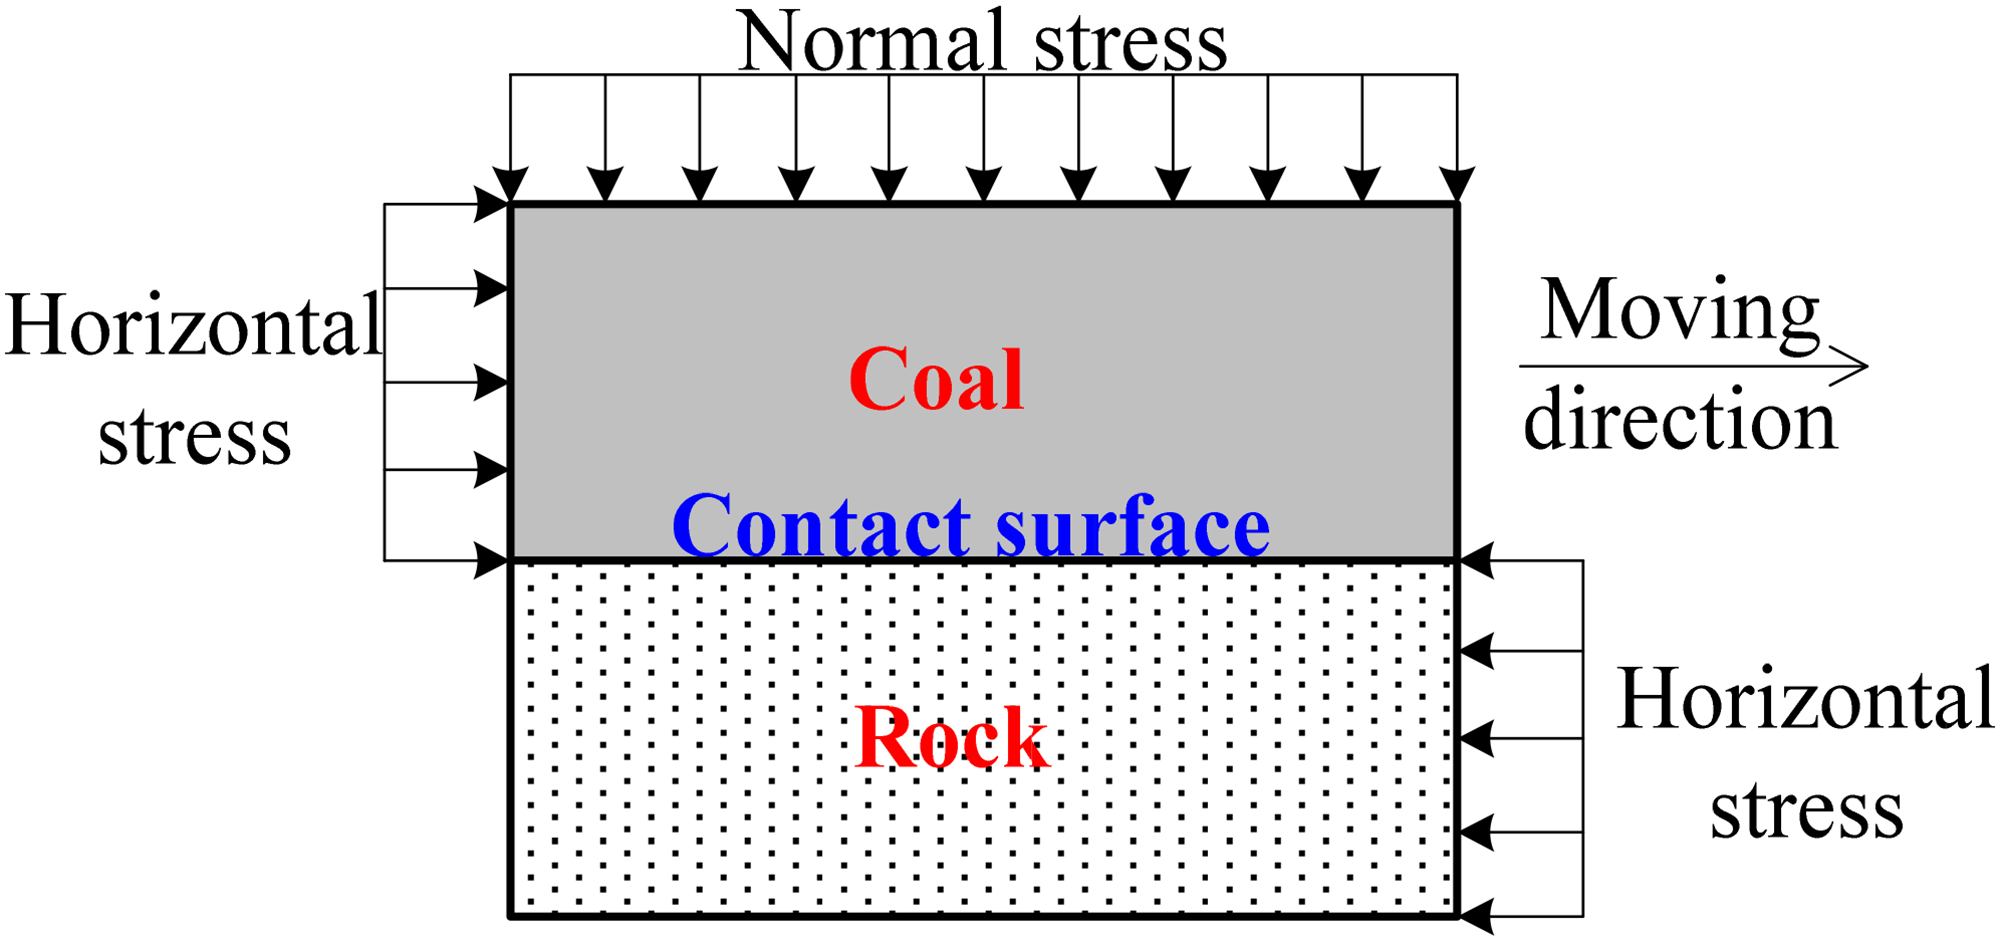
Stress state of coal–rock sample.
Test results and analysis
Characteristics of shear stress and shear displacement of frozen interface
Figure 4 shows the curve of shear stress and shear displacement of frozen coal–rock interface under different normal stresses and test temperatures (the moisture content in coal is 5%). It can be seen from Figure 4(a) that when the test temperature is −10°C, the shear stress increases sharply within a very short displacement and reaches the peak value, then it decreases significantly and tends to a certain value with the increase of displacement, which indicates obvious strain-softening behavior after peak strength. This is because the cemented ice at the interface of frozen coal and rock is cutoff after the peak strength, and the cemented ice is a brittle material, therefore, the shear stress drops suddenly. With the increase of displacement, the shear stress reaches the residual strength stage, which is basically unchanged, and the shear strength is provided by the friction force of the contact surface. Figure 4(b) shows the shear stress and shear displacement of the frozen coal–rock interface at −2°C. It can be seen that there is no obvious strain softening behaviour, which is different at −10°C. When the shear stress reaches the peak strength, it enters the residual strength stage. This is because the test temperature at −2 °C is close to the freezing temperature of coal sample (freezing point) (Ma and Wang, 2014), and there is little cemented ice at the coal–rock interface, which has little effect on the interface strength. The interface strength is mainly controlled by friction force and cohesion of coal particles; therefore, the shear stress will not decrease rapidly.
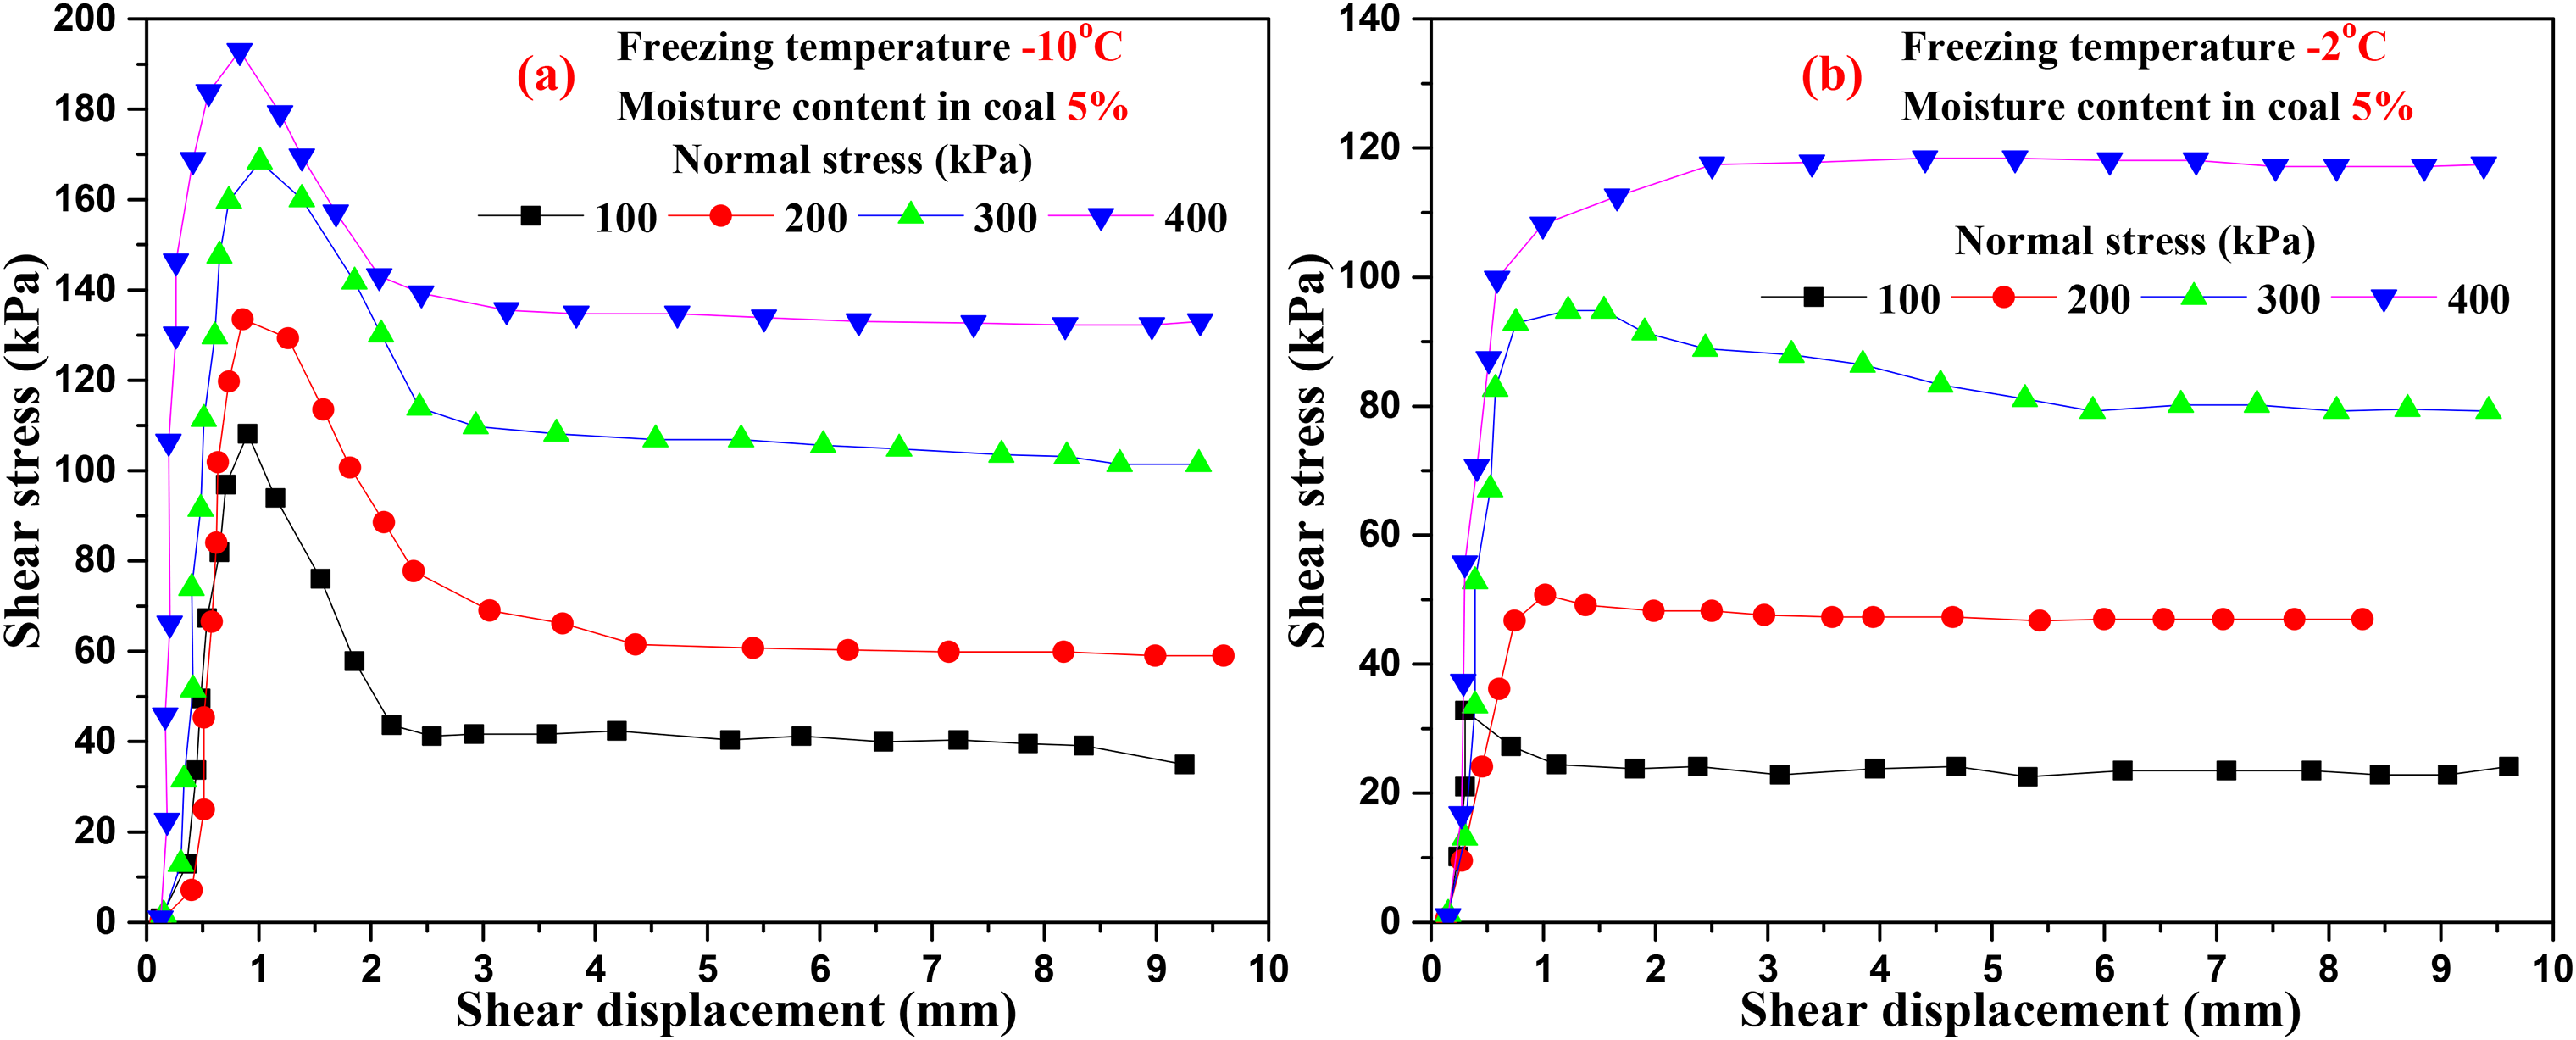
Shear stress–shear displacement curve of contact interface under different normal stress and test temperature of frozen coal–rock interface: (a) test temperature is −10°C and (b) test temperature is −2°C.
Figure 5 shows the shear stress and shear displacement curve of the frozen coal–rock interface under different test temperatures and moisture contents. It can be seen from Figure 5 that with the decrease of the test temperature, the shear stress and shear displacement curves show that the failure phenomenon of frozen coal–rock interface gradually transits from plastic failure to brittle failure. When the test temperature is 5°C, there is no ice crystal at the interface, and the curve shows a weak softening phenomenon, because there is a certain structure of coal at the interface when the moisture content is lower (Morgenstern et al., 1976). When the test temperature is −2°C, only a small amount of ice crystals exist at the coal-rock interface with the low moisture content in coal, which has little effect on the interfacial shear strength; therefore, the curves still show a weak softening phenomenon. When the temperature drops to −5°C and −10°C, the content of ice crystal in the coal–rock interface will increase obviously, and the bonding force of ice crystal makes the interface shear strength increase significantly. Therefore, the shear stress decreases rapidly after the peak strength. This is due to the brittle fracture of a large number of ice crystals at the coal–rock interface. With the temperature decreasing from −2°C to −10°C (as shown in Figure 5(a)), the peak strength of the coal–rock sample with a moisture content of 5% increases from 53.54 to 132.72 kPa, which is increased by 147.89%. The residual strength is increased by 26.07% from 47.1 to 59.38 kPa, and the ice cementing strength (the difference between peak strength and residual strength) is increased from 6.44 to 73.34 kPa. When the moisture content is 9% (as shown in Figure 5(b)) and the test temperature decreases from −2°C to −10°C, the peak strength increases by 457.4% and the residual strength increases by 56.25%. Compared with the shear strength of 5% moisture content, the increase is more obvious. It can be seen from Figure 5(a) and (b) that the test temperature has a great influence on the peak strength of the frozen coal–rock interface, this is because the unfrozen water in coal is related to the test temperature. When the temperature of the coal body decreases to the freezing temperature, the moisture in coal begins to freeze, which increases the ice crystal content at the freezing interface and improves the interfacial shear strength (Ma and Wang, 2014).
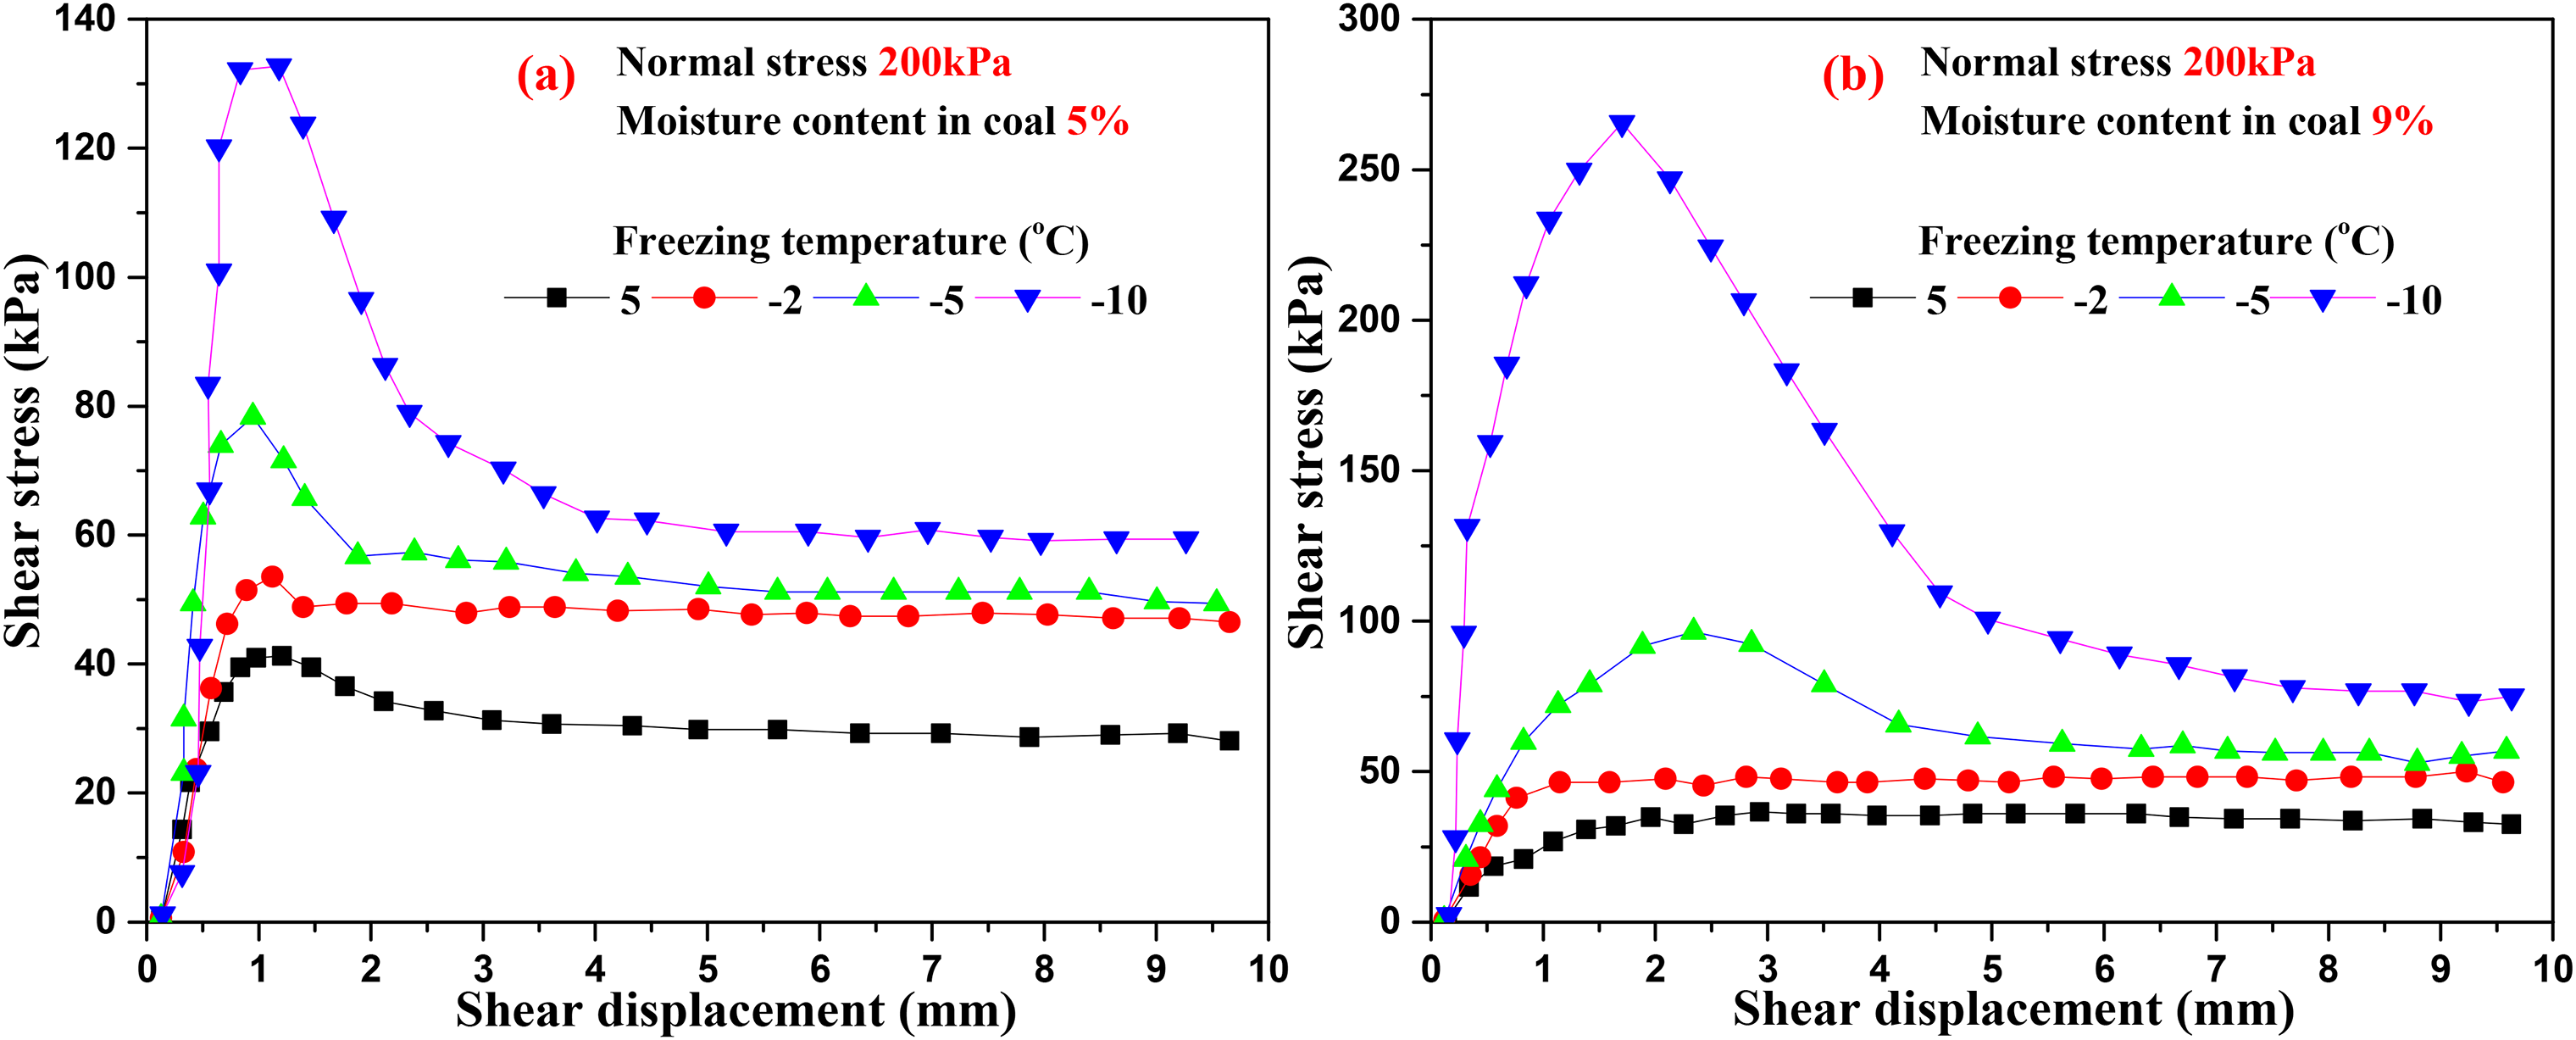
Shear stress–shear displacement curve of contact interface under different temperatures and normal stress: (a) moisture content is 5% and (b) moisture content is 9%.
Figure 6 shows the shear stress and shear displacement curves with different moisture contents and test temperatures. It can be seen from Figure 6(a) that when the temperature is −2°C, the change characteristics of the curves are similar with different moisture contents, and there is no obvious post peak strength decrease, and the peak strength slightly decreases with the increase of moisture content.
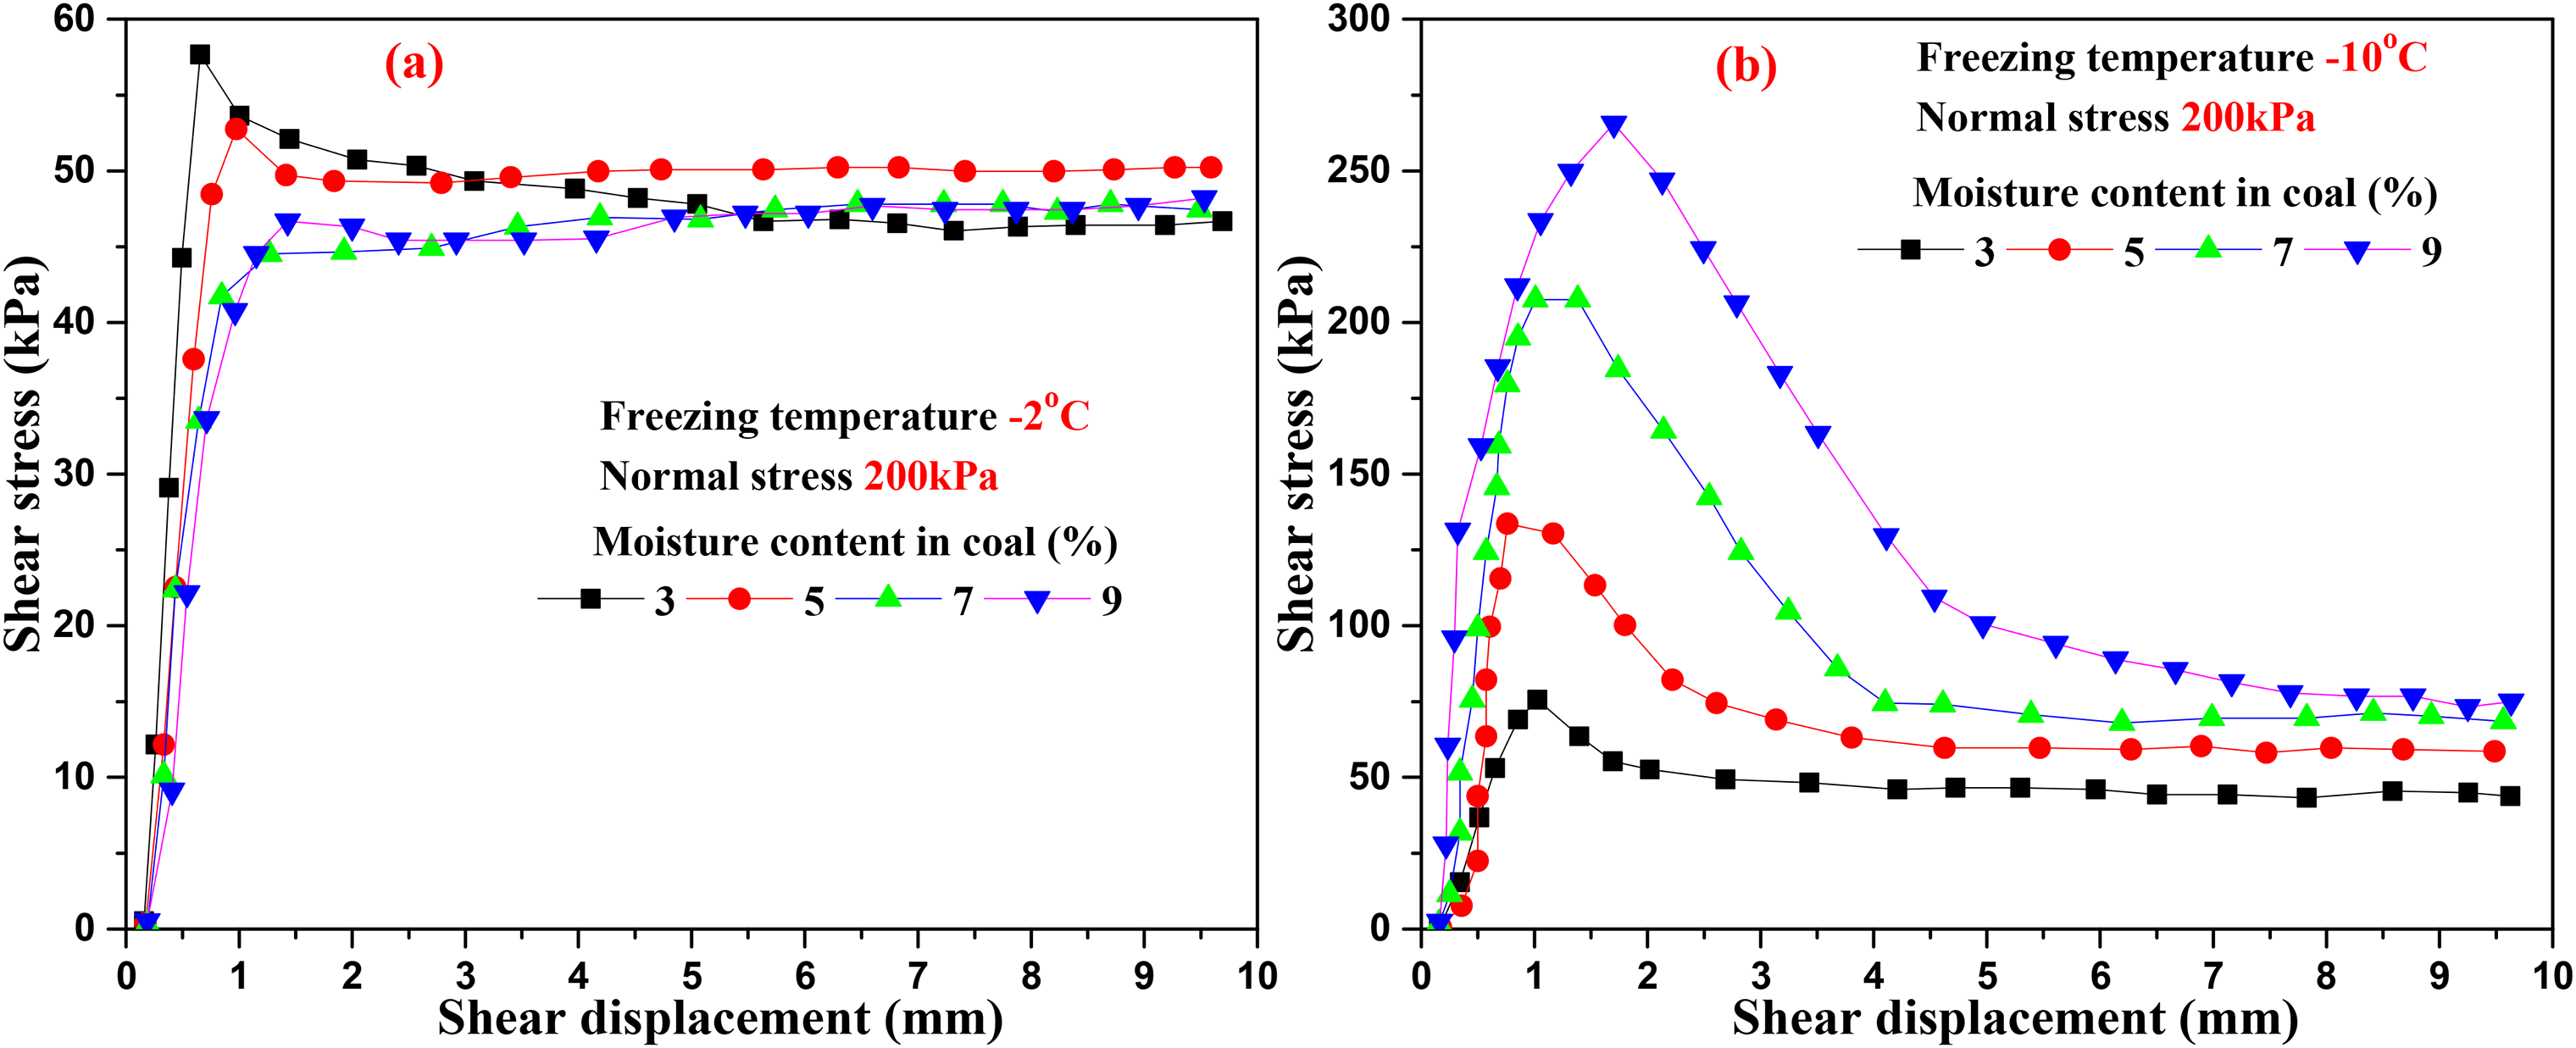
Shear stress–shear displacement curve of contact interface under different moisture contents and temperatures: (a) test temperature is −2°C, (b) test temperature is −10°C.
It can be seen from Figure 6(b) that when the test temperature is −10°C, the peak strength of the interface increases significantly with the increase of moisture content. As the moisture content increases from 3% to 9%, the peak strength is increased by 251.46% from 75.54 to 265.49kPa. This is because a large amount of free water and some weakly bound water in the coal body have been frozen at −10°C, and a large amount of cementing ice at the coal–rock interface provides freezing force (Ma and Wang, 2014; Shakir and Zhu, 2009).
Characteristic analysis of interface freezing strength
The peak strength of the frozen coal–rock interface is composed of ice cementing strength, the cohesion and friction at the coal and rock interface.
The residual strength is composed of cohesion, friction and a small amount of refrozen cemented ice (Liu et al., 2014). Since there is little refrozen cemented-ice, it can be ignored for its contribution to the residual strength. Therefore, it can be approximately considered that ice cementing strength is expressed by the difference of the peak strength and the residual strength, which can be described by equation (1).

The law of freezing strength of coal–rock can be described by the Mohr-Coulomb strength theory (Bondarenko and Sadovskii, 1975; Ladanyi, 1995), as shown in equation (2):

Corresponding to equation (1), if the residual strength is introduced into the Mohr–Coulomb equation, the Mohr– Coulomb equation of the residual strength can be obtained, as shown in equation (3).

Substituting equations (2) and (3) into equation (1), and assuming

Figure 7(a) shows the variation of peak strength, residual strength and ice cementing strength with increasing normal pressure at −10°C test temperature and with 9% moisture content. With the increase of normal pressure from 100 to 400 kPa, the peak strength increases from 109.36 to 193.7 kPa, and the residual strength increases from 40.68 to 132.28 kPa, while the interfacial ice cementing strength changes very little, which indicates that the normal pressure has a great influence on the friction between coal particles and rock, but has little effect on the cementing strength of ice crystals at the interface. Figure 7(b) shows the variation of peak strength, residual strength and ice cementing strength with deceasing test temperature under 200 kPa normal pressure and with 9% moisture content. With the decrease of test temperature, the peak shear strength increases obviously, while the residual strength increases slightly, which is due to the change of peak strength caused by the freezing force of cemented ice, and the increase of residual strength is caused by the recementation of a small amount of ice crystals. When the test temperature decreases from −2°C to −10°C, the peak strength increases from 61.11 to 269.39 kPa, the residual strength increases from 61.75 to 84.12 kPa, and the ice cementing strength increases from 15.95 to 199.39 kPa, which indicates that the decrease of test temperature has great freezing force, but has little effect on the interfacial friction between coal particles and rock. Figure 7(c) shows the variation of peak strength, residual strength and ice cementing strength with increasing moisture content in coal under 200 kPa normal pressure and at −10°C test temperature. With the moisture content increasing from 3% to 9%, the peak strength increases from 75.46 to 267.42 kPa, the residual strength increases from 45.57 to 79.85 kPa, and the ice cementing strength increases from 30.63 to 185.94 kPa. At this test temperature, a large number of ice crystals will be formed at the coal–rock interface. And with the increase of moisture content, the content of ice crystals at the interface increases correspondingly. Therefore, the increase of moisture content leads to the increase of peak strength and ice cementing strength. However, the slight increase of residual strength is due to the recementation of a small part of ice crystals at the interface after sliding failure.
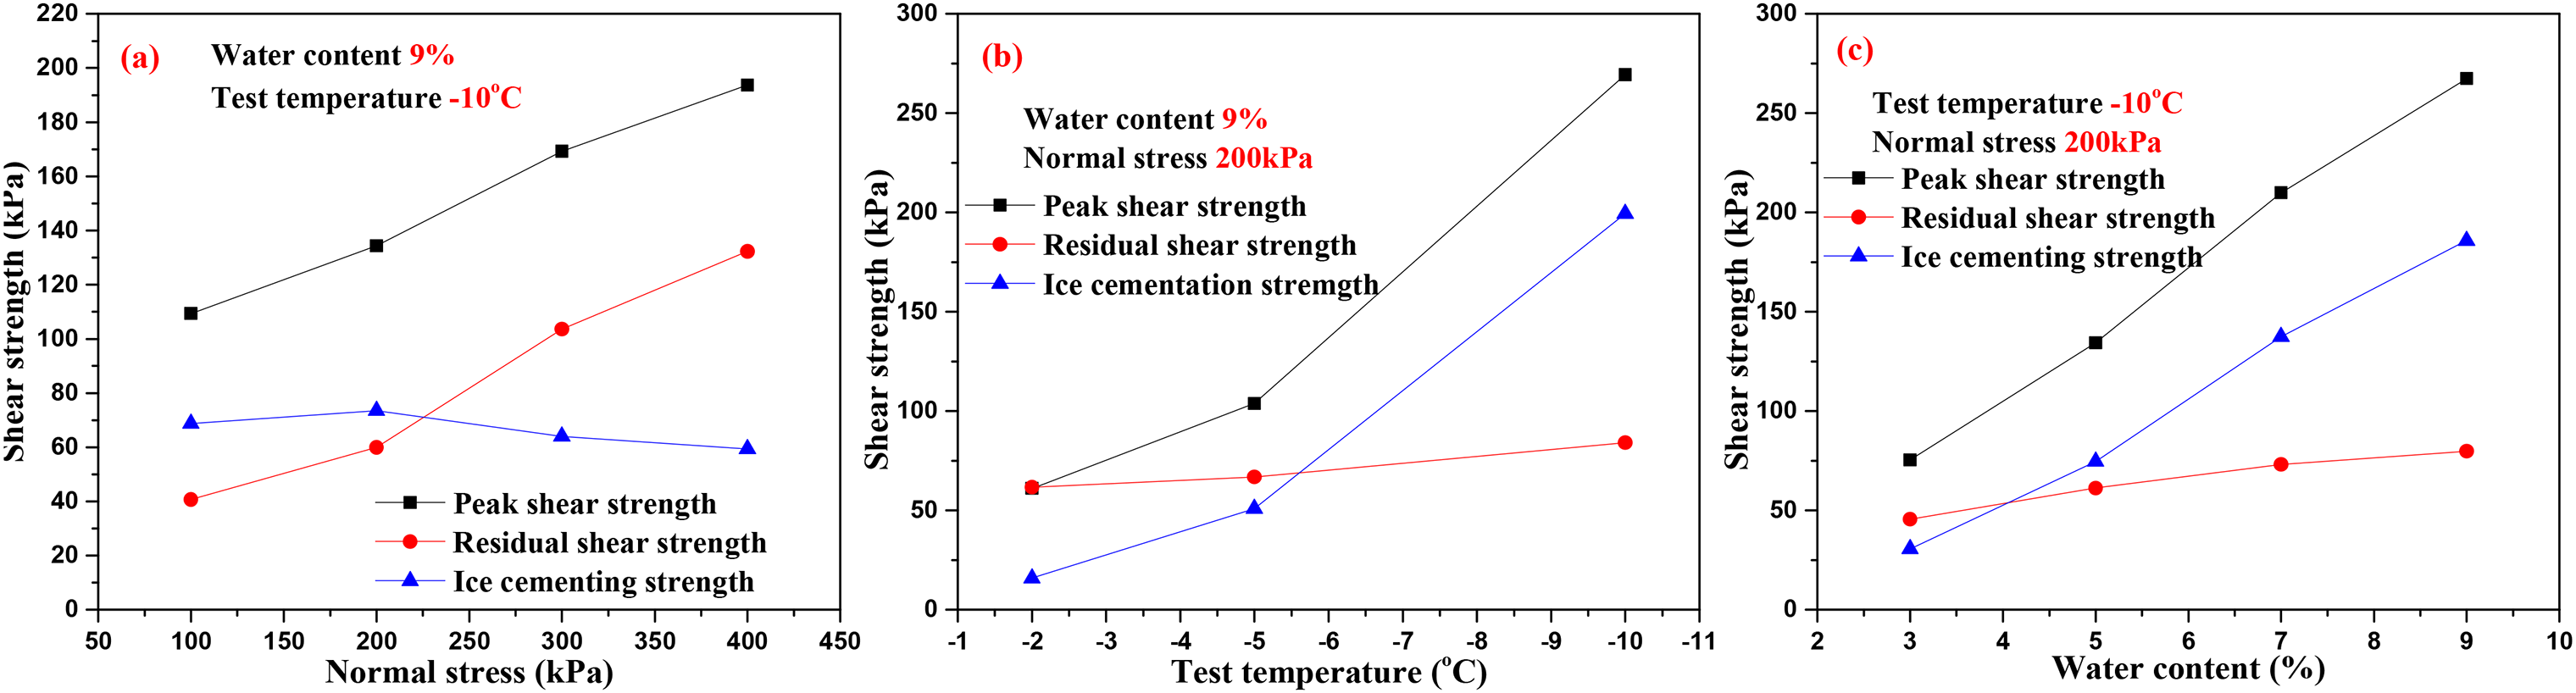
Variation of peak shear strength, residual shear strength and ice cementing strength under different normal stress, test temperature and moisture content: (a) −10°C test temperature and 9% moisture content, (b) 200 kPa normal pressure and 9% moisture content, and (c) 200 kPa normal pressure and −10°C test temperature.
Based on the above analysis, the interfacial peak strength is affected by the normal pressure through the friction and cohesion between coal particles and rock, and the normal pressure has little effect on the ice cementing strength. The decrease of test temperature makes the ice crystal increase, which makes the ice cementing strength increase obviously, and has little effect on the residual strength. When the test temperature is higher, the increase of moisture content in coal has little effect on the residual strength and ice cementing strength. However, when the test temperature is lower, the increase of moisture content in coal leads to the obvious increase of ice cementing strength and a slight increase of residual strength.
Mechanism analysis of interface freezing strength
In the frozen state, the influence of ice cementing strength on the interface strength increases gradually with the decrease of temperature, and the temperature is the key factor in the mechanism of interface freezing strength. Therefore, the Mohr–Coulomb strength theory is used to describe the mechanism of interface freezing strength, and to analyze the influence of temperature on the interfacial cohesion and friction coefficient.
According to the Mohr–Coulomb equation, the interfacial shear strength index of frozen coal–rock can be calculated under different moisture contents and test temperatures, which is shown in Table 1. It can be seen that at the same moisture content, with the decrease of test temperature, the peak cohesion increases sharply, and the residual cohesion increases slightly, while the peak friction coefficient and residual friction coefficient have no obvious change in trend. The peak cohesion is divided into ice cementing force and coal–rock interface cohesion, while the residual cohesion is mainly the coal particle and rock interface cohesion. Therefore, it can be judged that the temperature affects the peak cohesion by affecting the interfacial ice cementation; however, the temperature has little effect on the residual strength cohesion, peak friction coefficient and residual friction coefficient.
Shear strength index of frozen coal–rock interface.
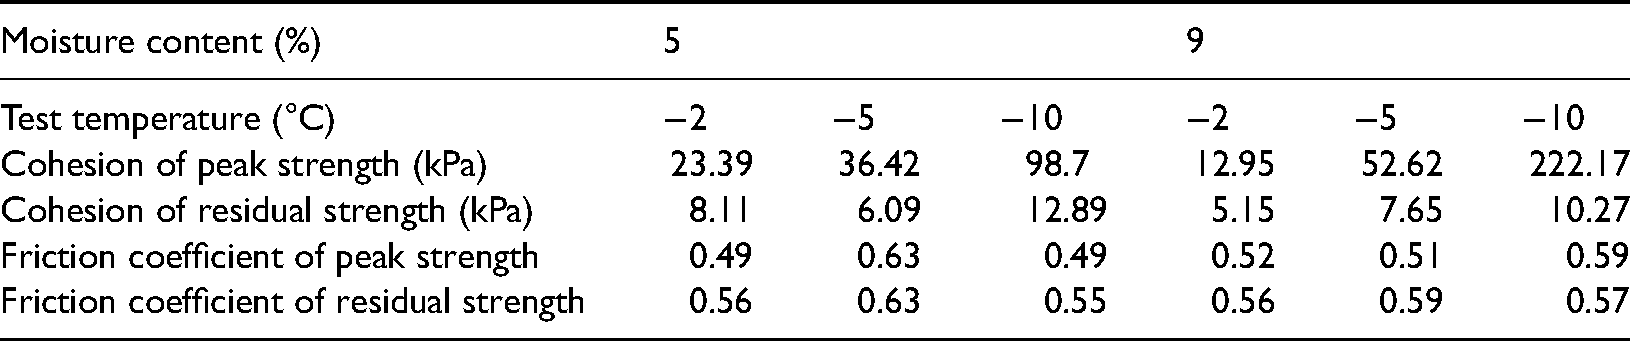
The relationship between the peak cohesion and the test temperature can be fitted exponentially. For example, as the moisture contents in coal is 5%, the relational formulas of peak cohesion (cf) and temperature (t) can be expressed as cf = 14.74e−0.19t, the correlation coefficients are >0.99. As the moisture content in coal is 9%, the relational formulas of peak cohesion (cf) and temperature (t) can be expressed as cf = 10.56e−0.31t; the correlation coefficients are above 0.99. However, the residual strength cohesion, peak friction coefficient and residual friction coefficient change little with the test temperature, which can be approximately considered that they do not change with temperature and their average values can be taken for calculation and analysis (Ladanyi, 1995). By substituting the above parameters into the Mohr–Coulomb equation and combining the data in Table 1, the interfacial peak strength equation (equation (5)) and the residual strength equation (equation (6)) with the temperature change can be obtained when the temperature range is −2°C to −10°C and the moisture content is 5%.

According to the above analysis, the ice cementing strength at the coal–rock interface is the difference of the peak strength and the residual strength. By substituting equations (5) and (6) into equation (1), the variation law of ice cementing strength at the coal–rock interface with temperature can be obtained.


Discussion
In the above analysis, the mechanism of freezing strength of the coal–rock interface is only explained from the macroscopic changes of shear stress and shear displacement curves. However, at the microlevel, the deformation process of interface, ice, coal–rock and the deformation superposition mode among them are not clear. Moreover, the cohesion and friction coefficient are analyzed only through the data of three test temperature. Although few parameters can still reflect the variation law, the applicability of the fitting equations will be affected (Wen et al., 2016). In addition, due to the limitation of test conditions, there is no test on the interface strength characteristics between ice and rock. However, it can be inferred that it is similar to the compressive strength of frozen coal; there will be a critical value of interface freezing strength with increasing moisture content, which is related to saturated moisture content. When the moisture content exceeds the critical value, the interface freezing strength will decrease and gradually approach the strength of ice (Ma and Wang, 2014; Parameswaran, 1981); this work will continue.
Conclusion
To study the freezing strength of the frozen coal–rock interface during rock crosscut coal uncovering (RCCU) by the freezing method, coal and rock samples are taken from Jiahe mines in Hunan Province as test materials. The direct shear tests of the frozen coal–rock interface are carried out to obtain the interfacial shear strength under different conditions. The peak strength is decomposed into ice cementing strength and residual strength; then the mechanism of interface freezing strength is analyzed based on the Mohr–Coulomb strength theory. The main conclusions are as follows:
The test temperature and moisture content in coal have obvious influence on the shape of interface shear stress and shear displacement curves. When the test temperature is −10°C, the shear stress shear displacement curves show the strain softening type, and shear stress decreases obviously after the post peak strength. However, When the test temperature is −2°C (freezing temperature), the shear stress and shear displacement curves show a weak softening type with lower moisture content (3%, 5%) and hardening type with higher moisture content (7%, 9%). The ice cementing strength is less affected by normal pressure, but is significantly affected by temperature and moisture content. When the water content of coal is 5% and the normal pressure is 100 kPa, the temperature decreases from −2°C to −10°C, and the ice cementing strength increases from 6.44 to 73.34 kPa. The residual strength is greatly affected by normal pressure, but less affected by temperature and moisture content. When the moisture content is 9% and the temperature is −10°C, the normal pressure increases from 100 to 400 kPa, and the residual strength increases from 40.68 to 132.28 kPa. The strength of the frozen coal–rock interface can be described by the Mohr–Coulomb strength theory. The peak interfacial cohesion is obviously affected by temperature and water content, which relationship between the peak cohesion and temperature can be expressed by an exponential function. When the moisture content is 5%, the test temperature decreases from −2°C to −10°C, and the peak cohesion increases from 23.39 to 98.7 kPa. The temperature has little effect on the interfacial friction coefficient and residual cohesion.
Footnotes
Acknowledgements
We appreciate the support of Jiahe coal mine, and the help of the workers in coal and rock samples collection. We are also grateful to laboratory staff of Henan Polytechnic University, who provided instrument and equipment to accomplish the tests. We are also indebted to the anonymous reviewers for their comments that have helped to improve the manuscript.
Declaration of conflicting interests
The authors declared no potential conflicts of interest with respect to the research, authorship and/or publication of this article.
Funding
The authors disclosed receipt of the following financial support for the research, authorship and/or publication of this article: This study was supported by the scientific research start-up fund for high-level talent introduction of Anhui University of Science and Technology. This research is sponsored by the funding from the National Natural Science Foundation of China (No. 41772163).