
Abstract
It is crucial to obtain the representative relative permeability curves for related numerical simulation and oilfield development. The influence of temperature on the relative permeability curve remains unclear. An unsteady method was adopted to investigate the influence of temperature (range from 25–130 °C) on the oil–water relative permeability curve of sandstone reservoirs in different blocks. Then, the experimental data was analyzed by using an improved Johnson–Bossler–Naumann method. Results reveal that with the increase in temperature within a certain temperature range: (1) the relative permeability of the oil and water phases increases; (2) the irreducible water saturation increases linearly, whereas the residual oil saturation decreases nonlinearly, and the oil recovery factor increases; and (3) the saturation of two equal permeability points moves to the right, and hydrophilicity becomes stronger. The findings will aid future numerical simulation studies, thus leading to the improvement of oil displacement efficiency.
Keywords
Introduction
Elucidation of the influence of temperature on the relative permeability of oil and water is important for studying the processes of percolation and displacement in petroleum reservoirs. Recently, many experts have conducted experimental studies on the high-temperature phase permeability of oil–water in reservoirs. However, the effect of temperature on the relative permeability and end-point saturation of the reservoir is still disputed. At present, the question of whether temperature influences the oil–water infiltration curve of a reservoir is simply answered by a yes or no statement. Shilolwd (1965) conducted a thorough research on this topic based on the experimental data of Edmondson (1965) and was the first to propose that the infiltration curve was unaffected by temperature. Subsequently, Sufi et al. (1982), Kumar and Inouye (1995), Akin et al. (1998), and Esmaeili S et al. (2020a) conducted displacement experiments using the steady-state and unsteady-state methods and reached the same conclusion as Shilolwd.
The influence of temperature rise on the relative permeability curve can be classified into the following scenarios: the oil–water two-phase relative permeability (a) increases (Maini and Okazawa, 1987; Schembre et al., 2006; Wang et al., 2013; Zhang et al., 2013; Ma, 2018; Qin et al., 2018; Esmaeili S et al., 2020b); (b) decreases (Watson and Ertekin, 1988; Sedaee et al., 2007); (c) increases in the single phase or has no obvious regularity (Sinnokrot, 1969; Torabzadeh and Handy, 1984; Maini and Batycky, 1985; Wang et al., 2017). Recently, Bennion et al. (2006) adopted the unsteady-state method to study the law of change of the sandstone heavy oil–water two-phase permeability curve in the experimental temperature range of 10–275°C. The results indicated that the oil–water two-phase relative permeability increased with the increase in temperature only within a certain range.
However, Akhlaghinia et al. (2013, 2014) further pointed out that the relative permeability of the oil phase increased with the increase in temperature but decreased after having increased to a certain extent. Therefore, there exists an optimal temperature at which the relative permeability of the oil phase maximizes. Tong et al. (2016) and Zhang et al. (2017) tested and studied the change characteristics of the oil–water percolation curve under different temperatures by using the unsteady-state method. They argued that temperature had a significant influence on the curve. Li et al. (2014) studied the law of change of the characteristic parameters of the phase permeability curve under different displacement experimental temperature conditions in a high pour-point oilfield. When the temperature decreased, the porosity and permeability decreased, the oil–water phase permeability displacement efficiency decreased, and the residual oil saturation increased. Through the review and analysis of previous studies, Esmaeili S et al. (2019a, 2019b) found that the influence of temperature on all rock-fluid systems is not exactly the same, and it depends on how wettability, interfacial tension and pore geometry changes with temperature. Therefore, there has been no consensus on the influence of temperature on the relative permeability of oil and water, which is also related to the physical characteristics of reservoir rocks and the interaction mechanism between rock fluids.
In this study, we performed an experimental analysis to investigate the influence of temperature on the oil–water permeability curve of sandstone in different blocks at temperatures of 25, 50, 75, 100, and 130 °C, to simulate the real reservoir temperature. The influence of temperature on the water production law of a sandstone reservoir was studied from the perspective of rock mineral composition and pore structure. Studies have found that within a certain temperature range, temperature will affect the relative permeability curve of oil and water. A comprehensive interpolation relative permeability data processing method is established by using Johnson–Bossler–Naumann (JBN) method and graphic method, which provides a new method for the data processing of permeability experiment and for enhanced oil recovery (EOR). The findings can aid numerical simulation studies of the blocks, thus leading to the improvement of oil displacement efficiency.
Experiment scheme and procedure
Experimental setup and instrumentation
The experimental setup to emulate unsteady displacement mainly consists of four parts: a driving system, simulation reaction system, metering system, and data acquisition and processing system. The driving system includes a high-pressure electric pump, constant-pressure and constant-speed pump. The simulation reaction system includes the core holder, a confining pressure pump, a back pressure pump, an intermediate vessel, a constant temperature box, and other pipe valves. The main components of the metering system are a calibration tube, an electronic balance, and an oil–water separator. The main components of the data acquisition and processing system are a high-precision pressure sensor and seepage software compiled on a computer. Figure 1 depicts the piping and instrumentation diagram of the setup.
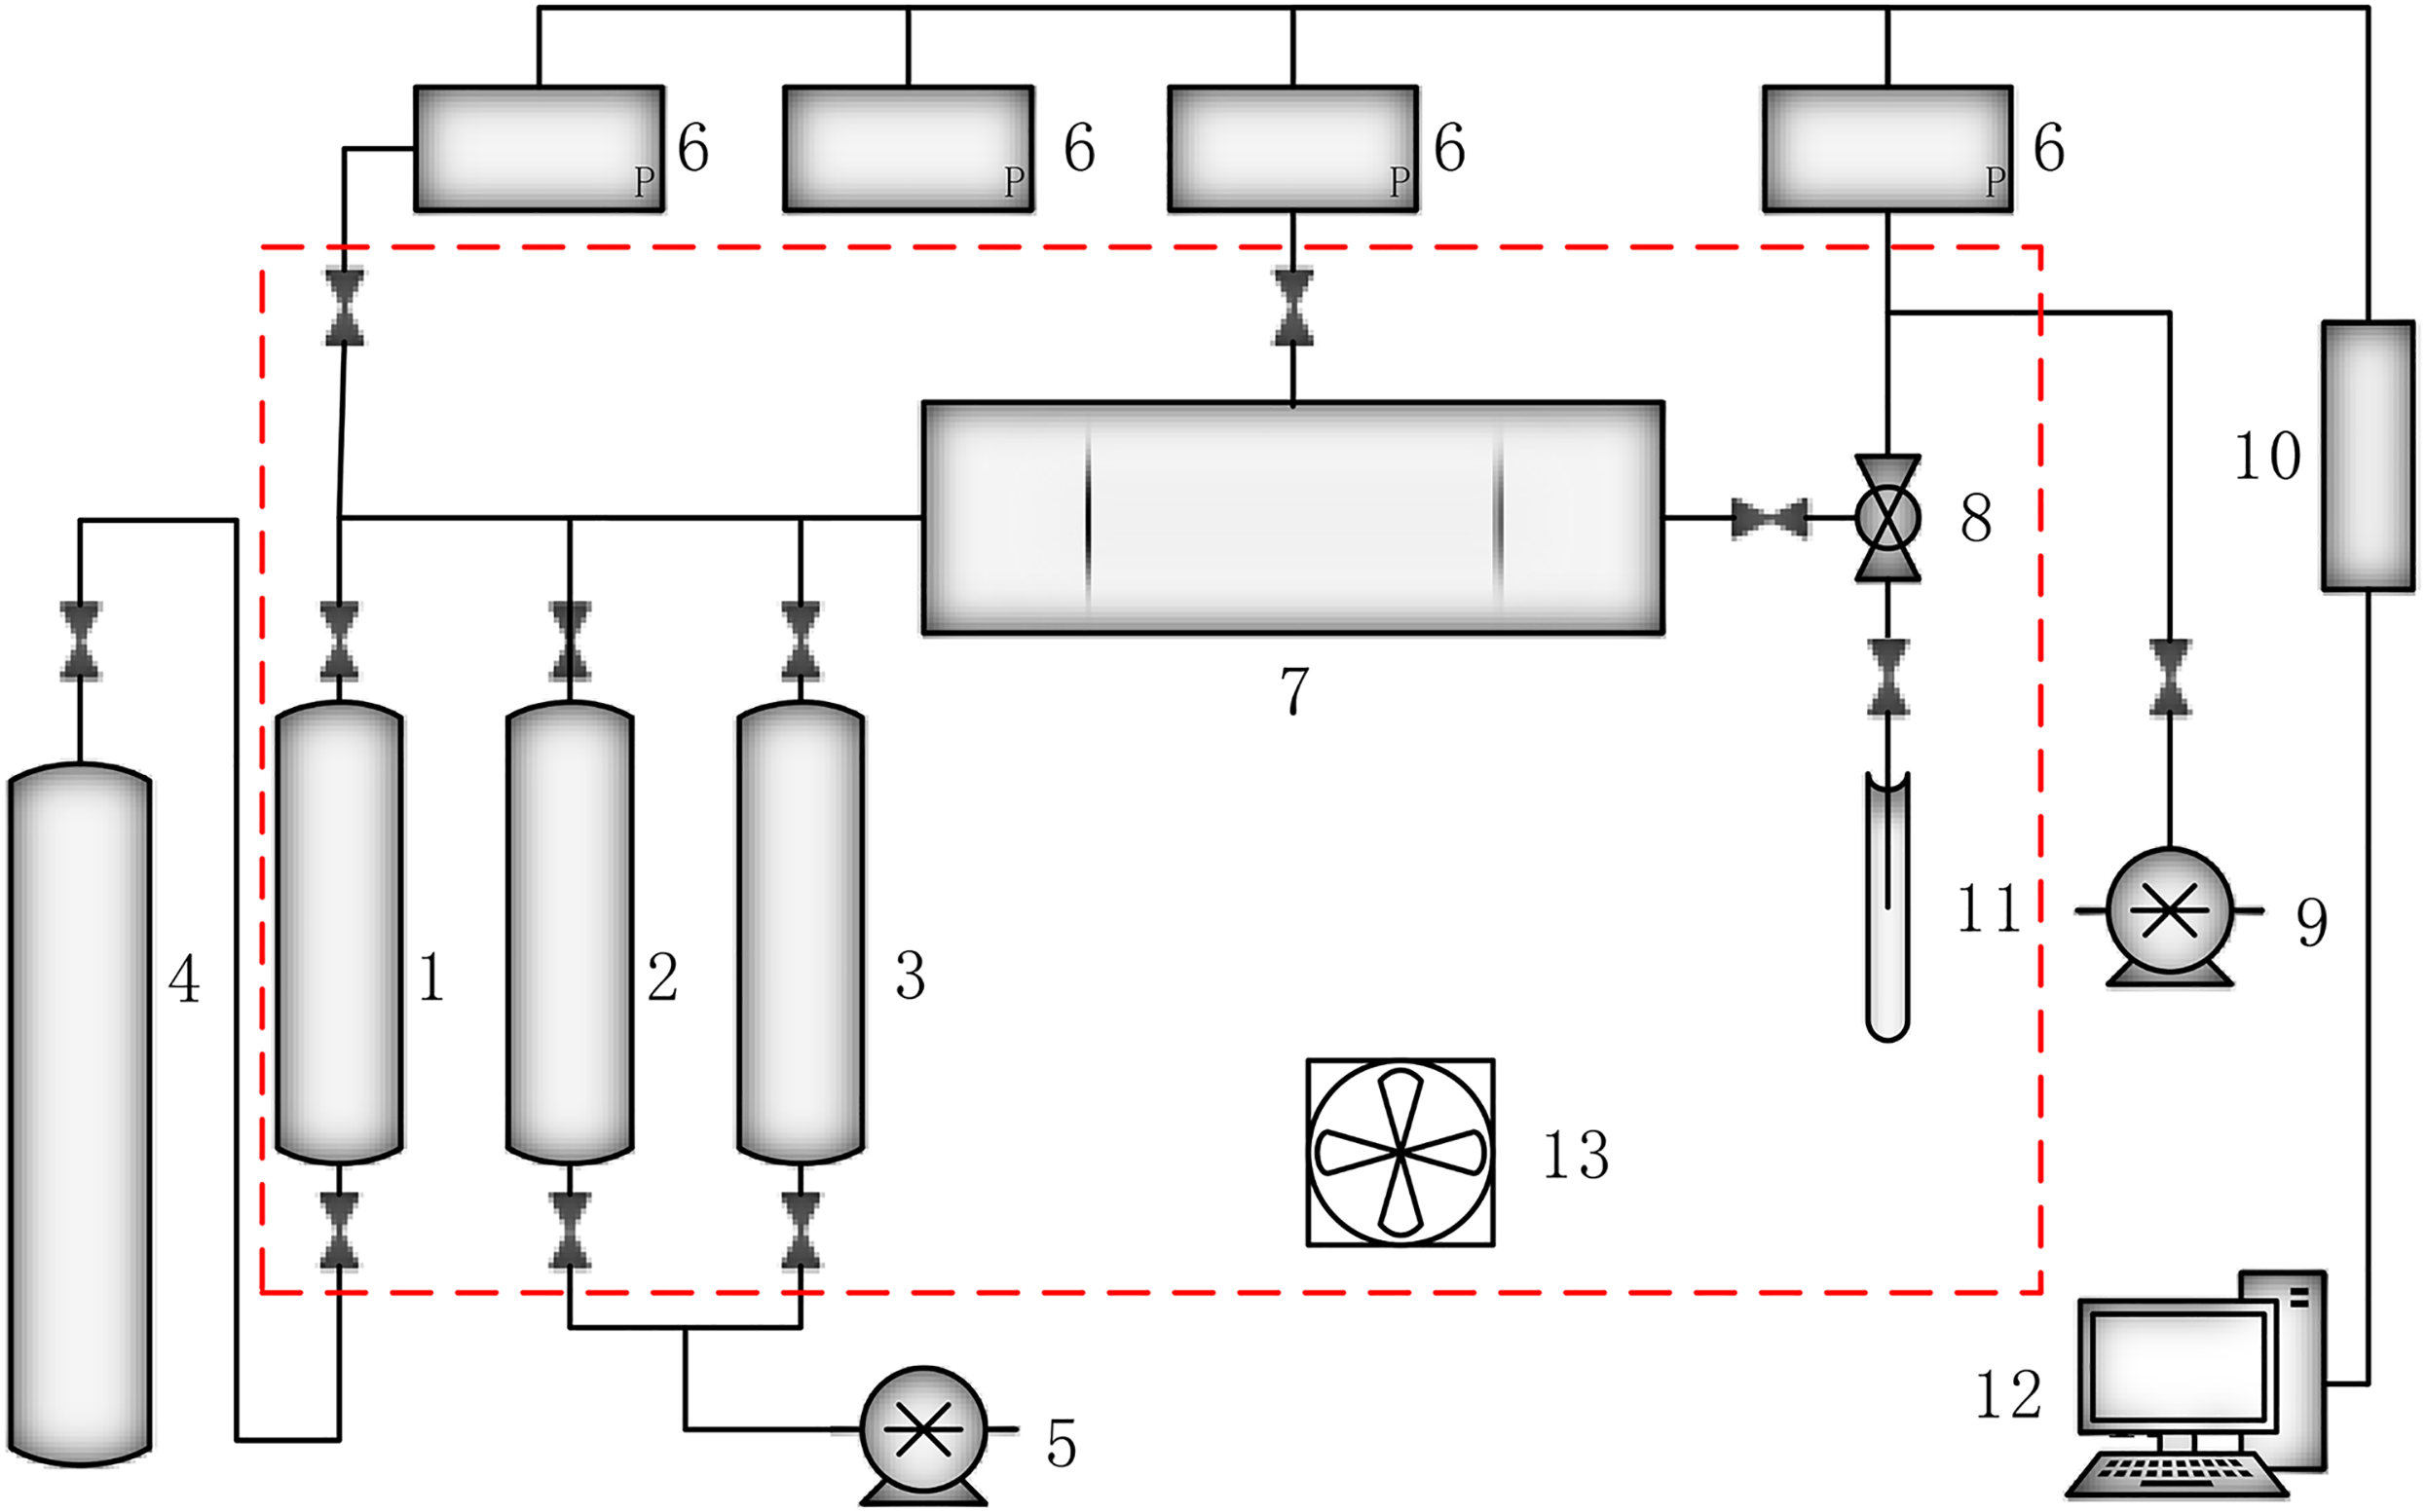
Piping and instrumentation diagram of experimental setup for generation of unsteady-state displacement. 1: Loading nitrogen intermediate vessel; 2: Loading formation water intermediate vessel; 3: Loading simulated oil intermediate vessel; 4: Nitrogen cylinder; 5: Constant-pressure and constant-speed pump; 6: Pressure sensor; 7: Core holder; 8: Back pressure valve; 9: Gyrus pressure pump; 10: Converter; 11: Calibration tube; 12: Computer; 13: Bellows.
Experimental materials
Reservoir rock characteristics
The rock samples used in the experiment were collected from Jurassic sandstone reservoirs in three different blocks at a depth of 4,230–4,650 m. Table 1 lists the basic data of the samples. A whole-rock analysis of the samples across different blocks by X-ray diffraction revealed kaolinite and chlorite as the main constituents. Furthermore, according to the D value of the S/I main peak in the directional X-ray diffraction pattern, the rock sample X-1 montmorillonite was identified as Na type and Z-1 montmorillonite as Ca type.
Basic data of rock sample.
Figure 2 depicts a scanning electron microscopy scanning image of the occurrence of main clay minerals in the reservoir rocks of the three blocks, and the specific content values are listed in Table 2. The pore throat radius distribution characteristics of the rock samples in different blocks were analyzed using nuclear magnetic resonance (NMR), as depicted in Figure 3, according to the NMR relaxation theory, there is a corresponding relationship between the relaxation time T2 and the pore radius r, and the conversion coefficient of T2 and r can be found to obtain r (Li H et al., 2008). According to the inversion method, the fluid volume fraction in different size pores can be calculated by T2 time spectrum attenuation curve, that is porosity component. The area under the envelope of the curve represents the total porosity of the rock sample. By contrast, the porosity of block Z > block X > block Y, and the proportion of the small pore throat in block X is the largest, whereas in block Y, most of the pore throat radii are large. The pore throat distribution in block Z is more uniform and is mostly concentrated in the radii range of 1–10 μm. Figure 4 illustrates the pore throat distribution under the saturated state of the rock samples in the three blocks. In the figure, the warm (red) area indicates that the signal of the hydrogen atom is relatively strong, and the pore throat of the rock sample is large, which represents the dominant channel of the rock sample.
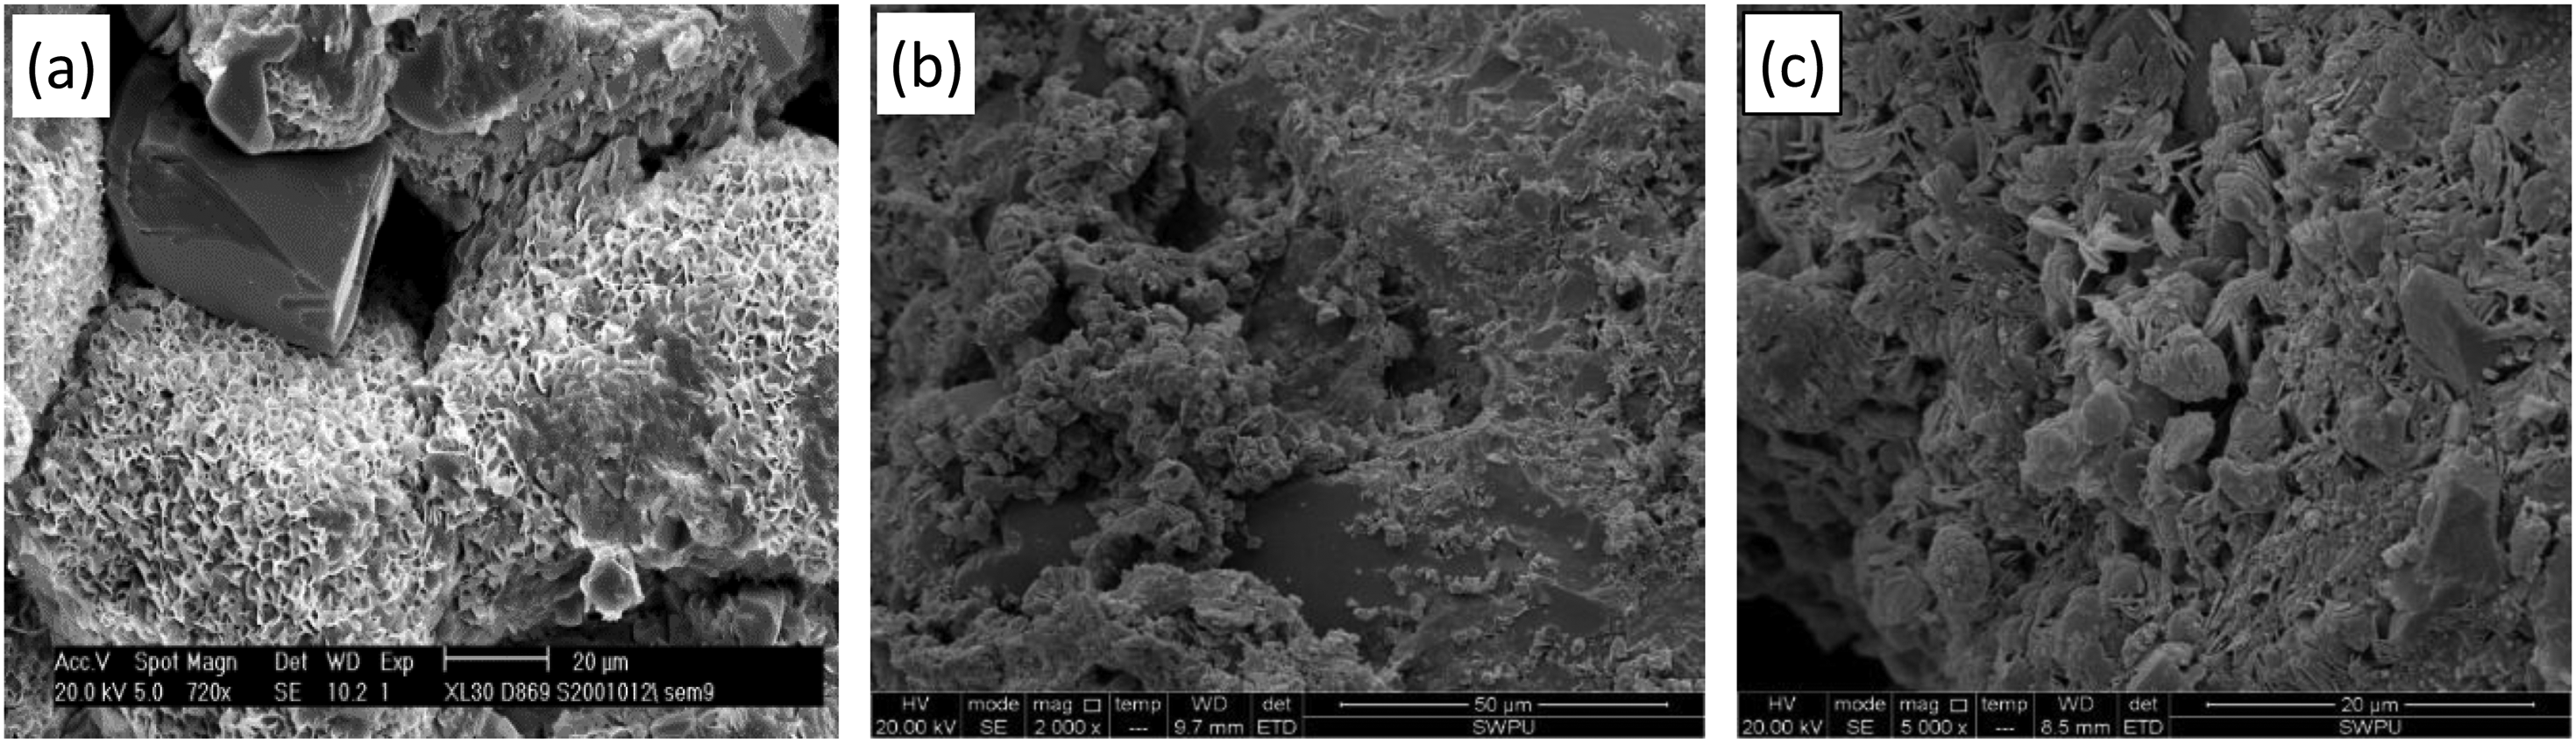
Scanning electron microscopy photographs of clay minerals in reservoir rocks (a) block X-1 comprises cellular and filmy montmorillonite; (b) block Y-1 is filled with book-like kaolinite aggregate; (c) block Z-1 comprises coniferous chlorite.
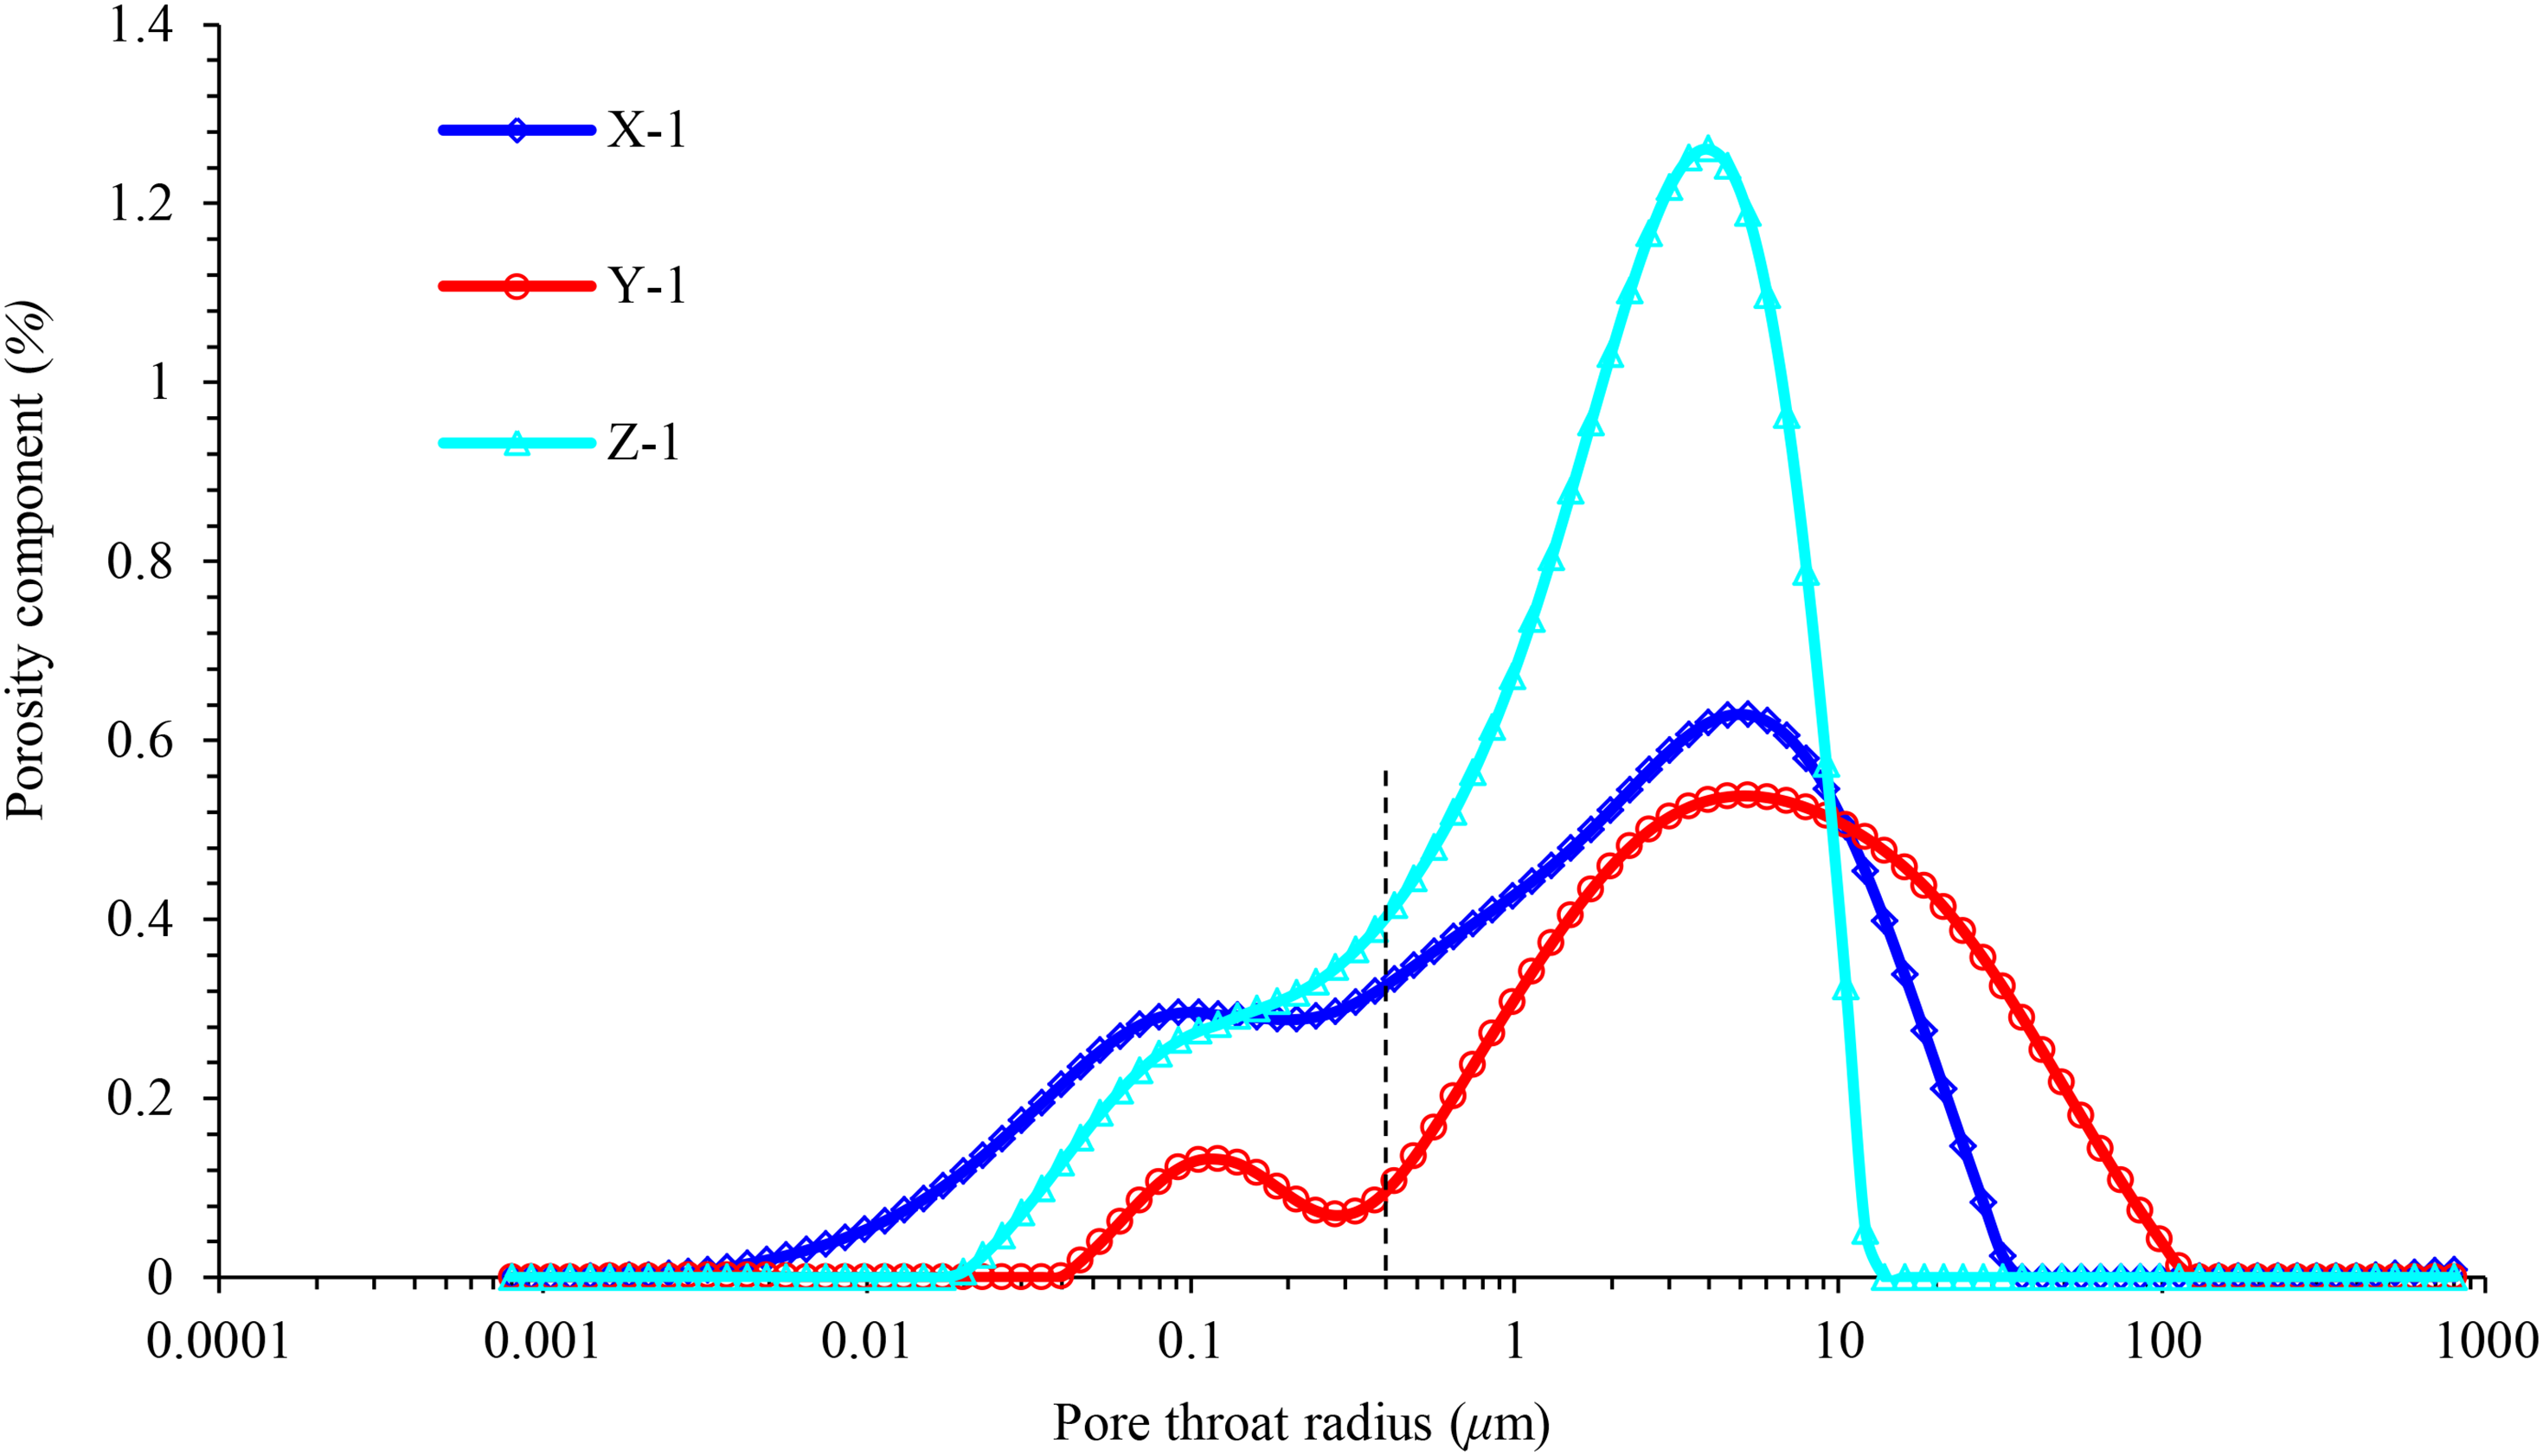
Throat radius distribution analysis by NMR test.
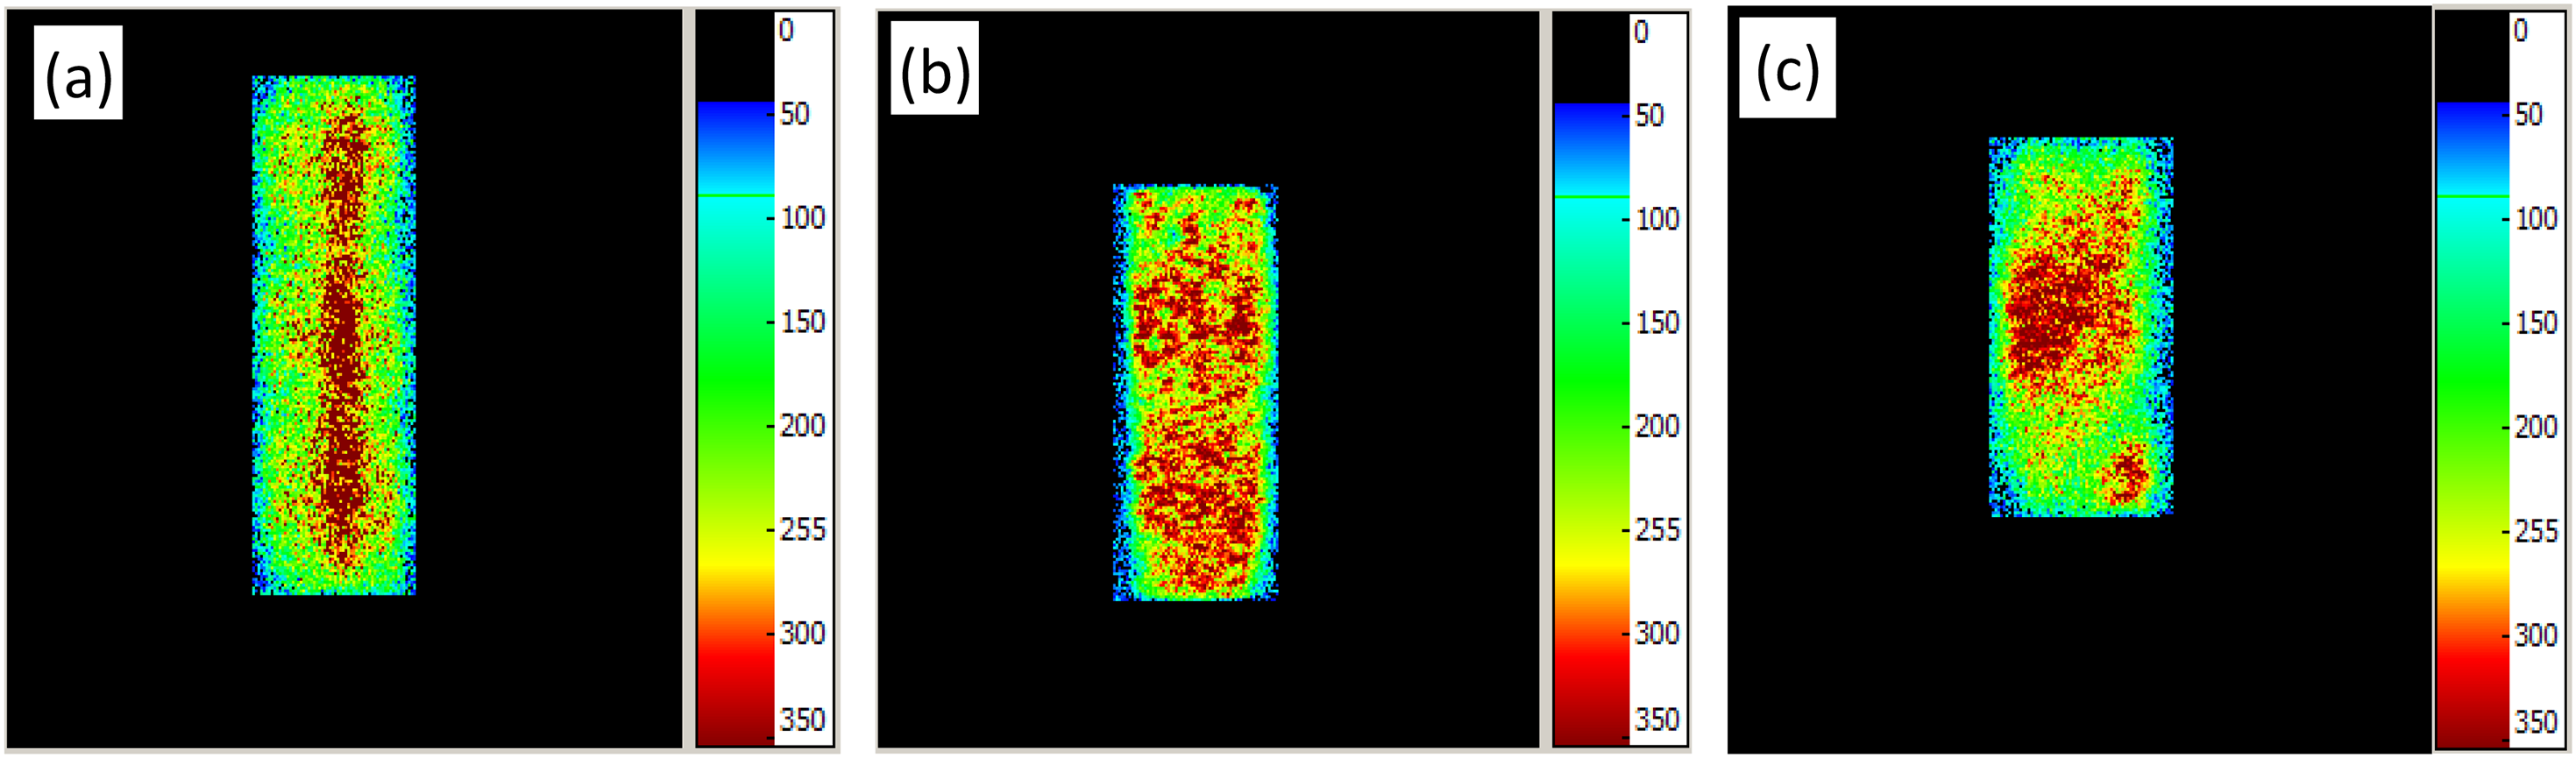
Distribution map of pore throat under saturated state of rock sample. (a) X-1 coronal rock sample; (b) Y-1 coronal rock sample; (c) Z-1 coronal rock sample.
High-precision X-ray diffraction analysis data of whole-rock mineral components of experimental samples.
Chl + Kln: Chlorite + Kaolinite; Qtz: Quartz; Kfs: K-feldspar; Pla: Plagioclase; Cal: Calcite; Ms: muscovite; Ank: Ankerite.
Reservoir fluid characteristics
Oil simulated in the experiment was composed of degassed crude oil and kerosene. Water for the experiment was composed of distilled water and KCl, with a mineralization degree of 21,000 mg/L. The viscosities of the simulated oil and formation water were 88.6 mPa • s and 1.118 mPa • s at 15°C, respectively. The variation of viscosity with temperature is plotted in Figure 5. With the increase in temperature, the viscosities of the simulated oil and formation water decrease. By comparison, the viscosity of the oil phase decreases considerably greater than that of the water phase. Figure 6 depicts the change curve of the viscosity ratio of water and oil at different temperatures. It reveals an increase in the ratio of the viscosities of water and oil and the flow capacity of the water phase with temperature.
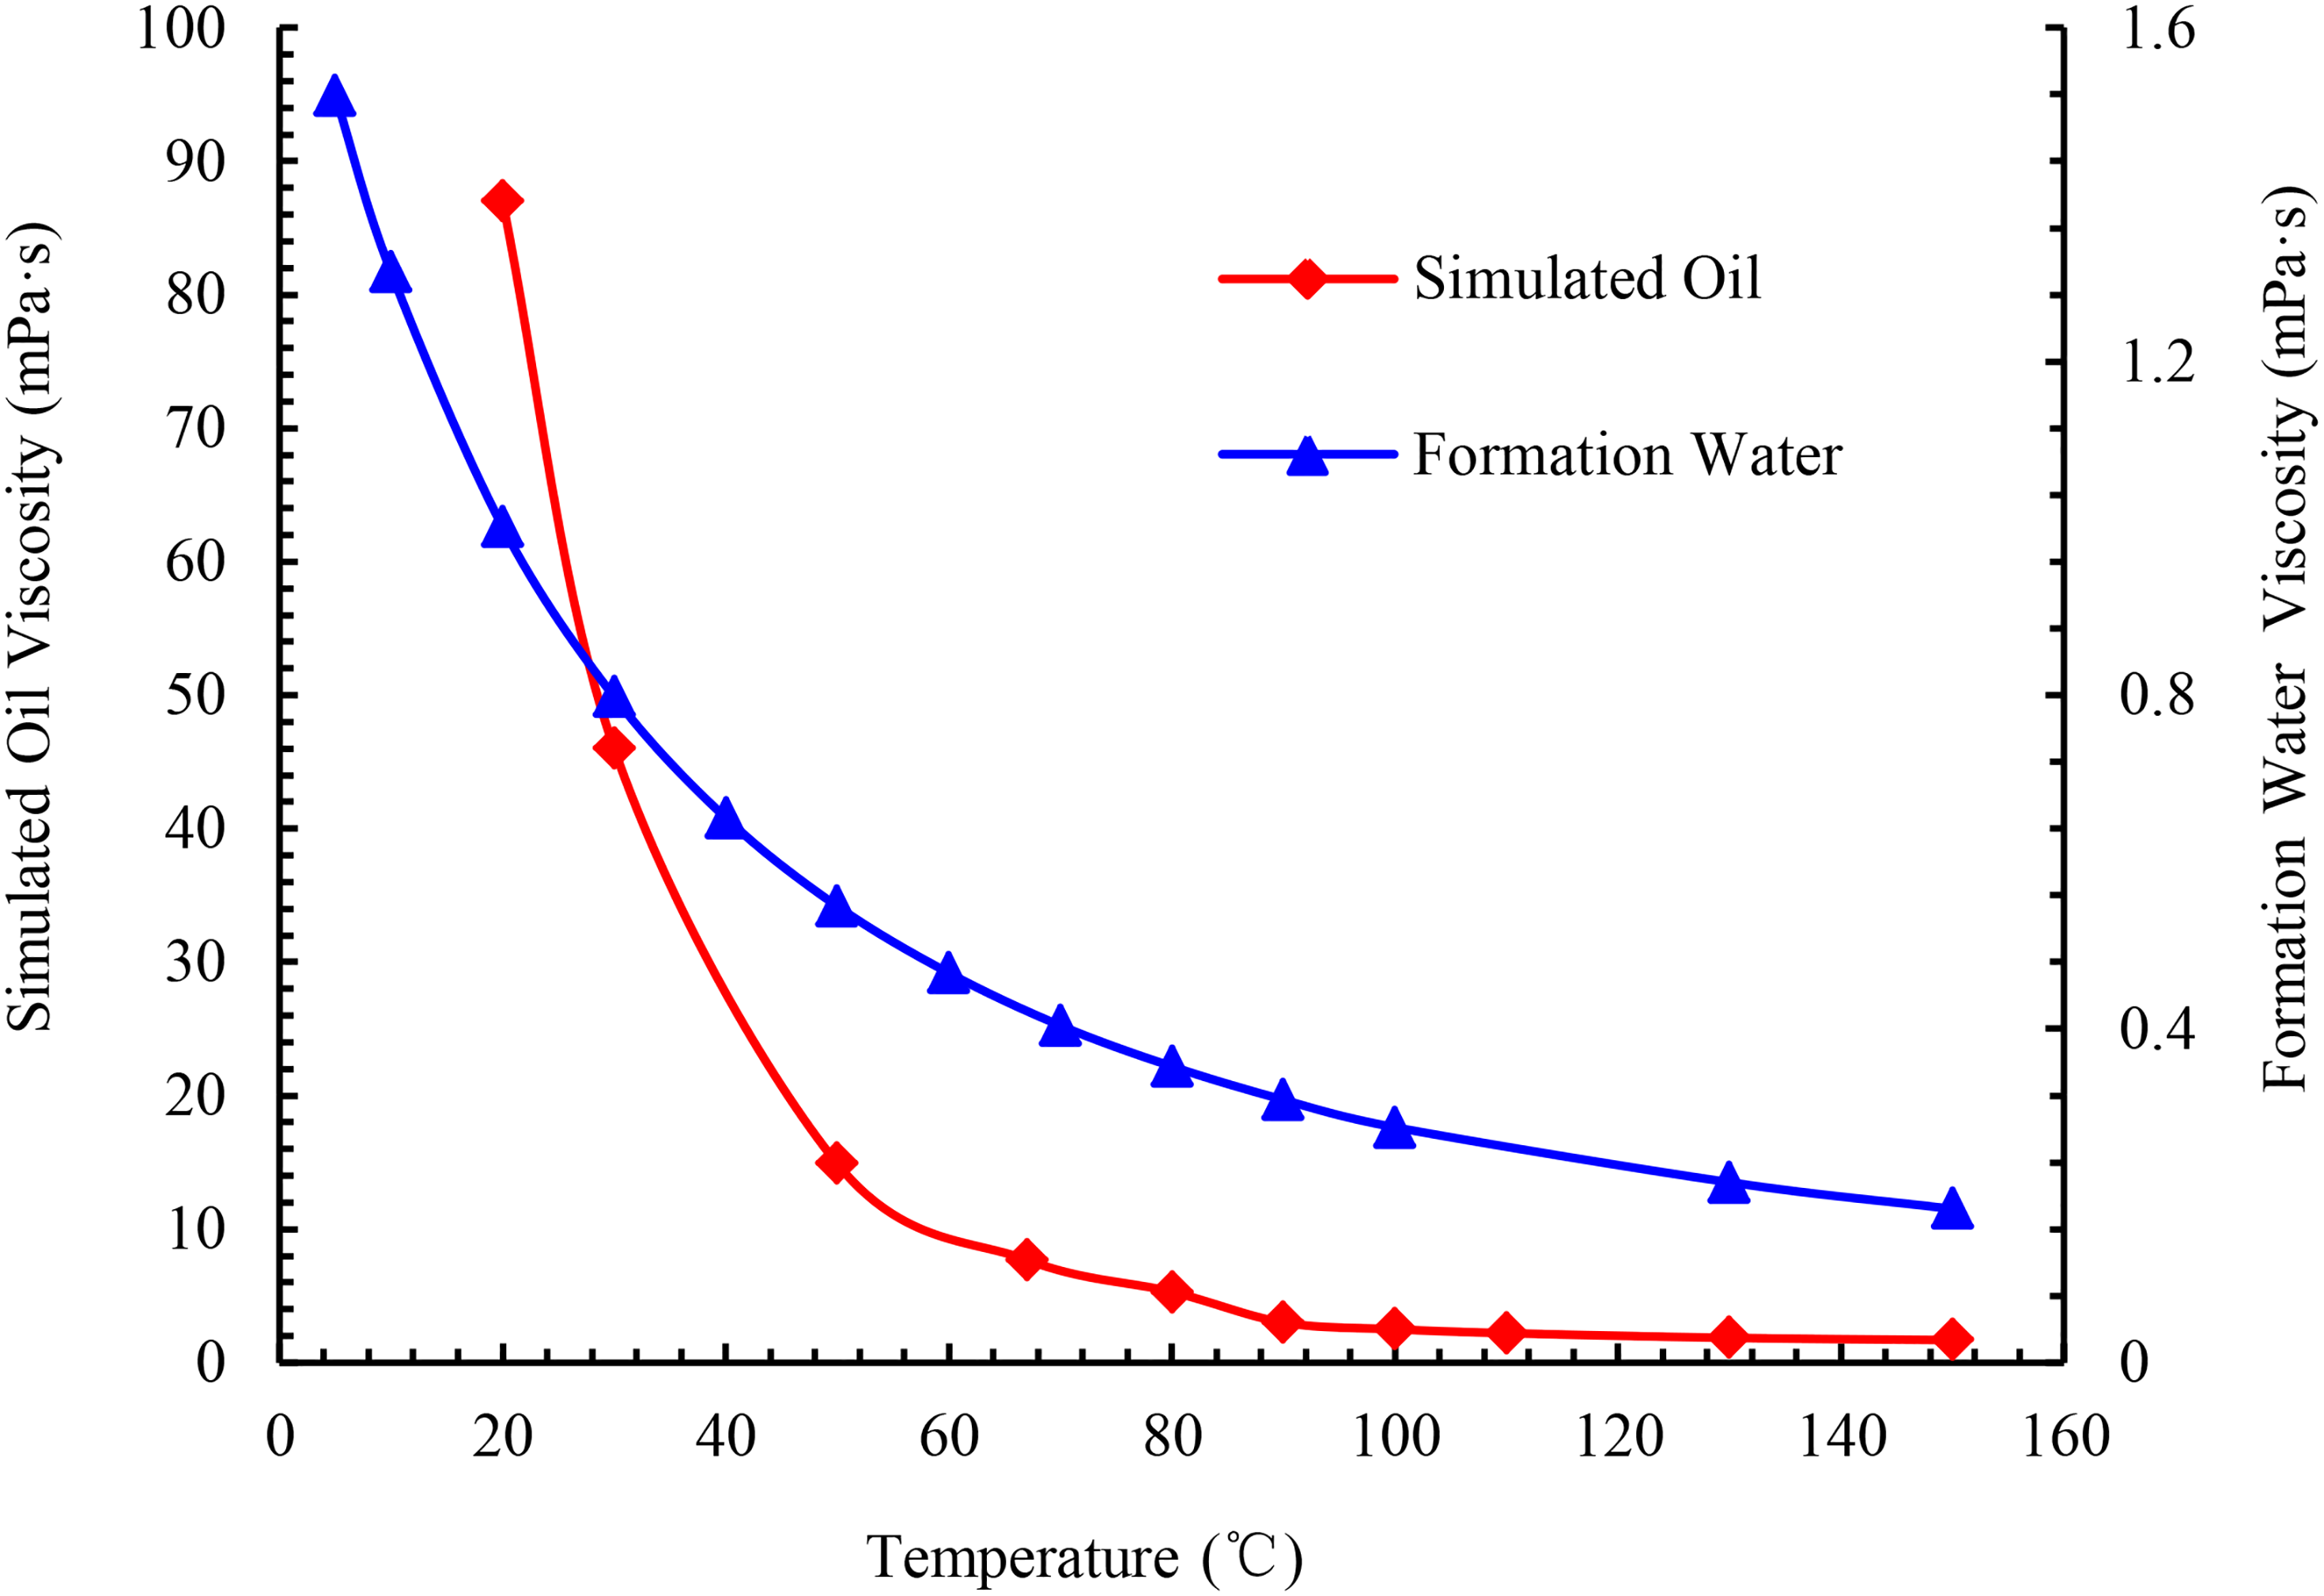
Viscosity vs. temperature.
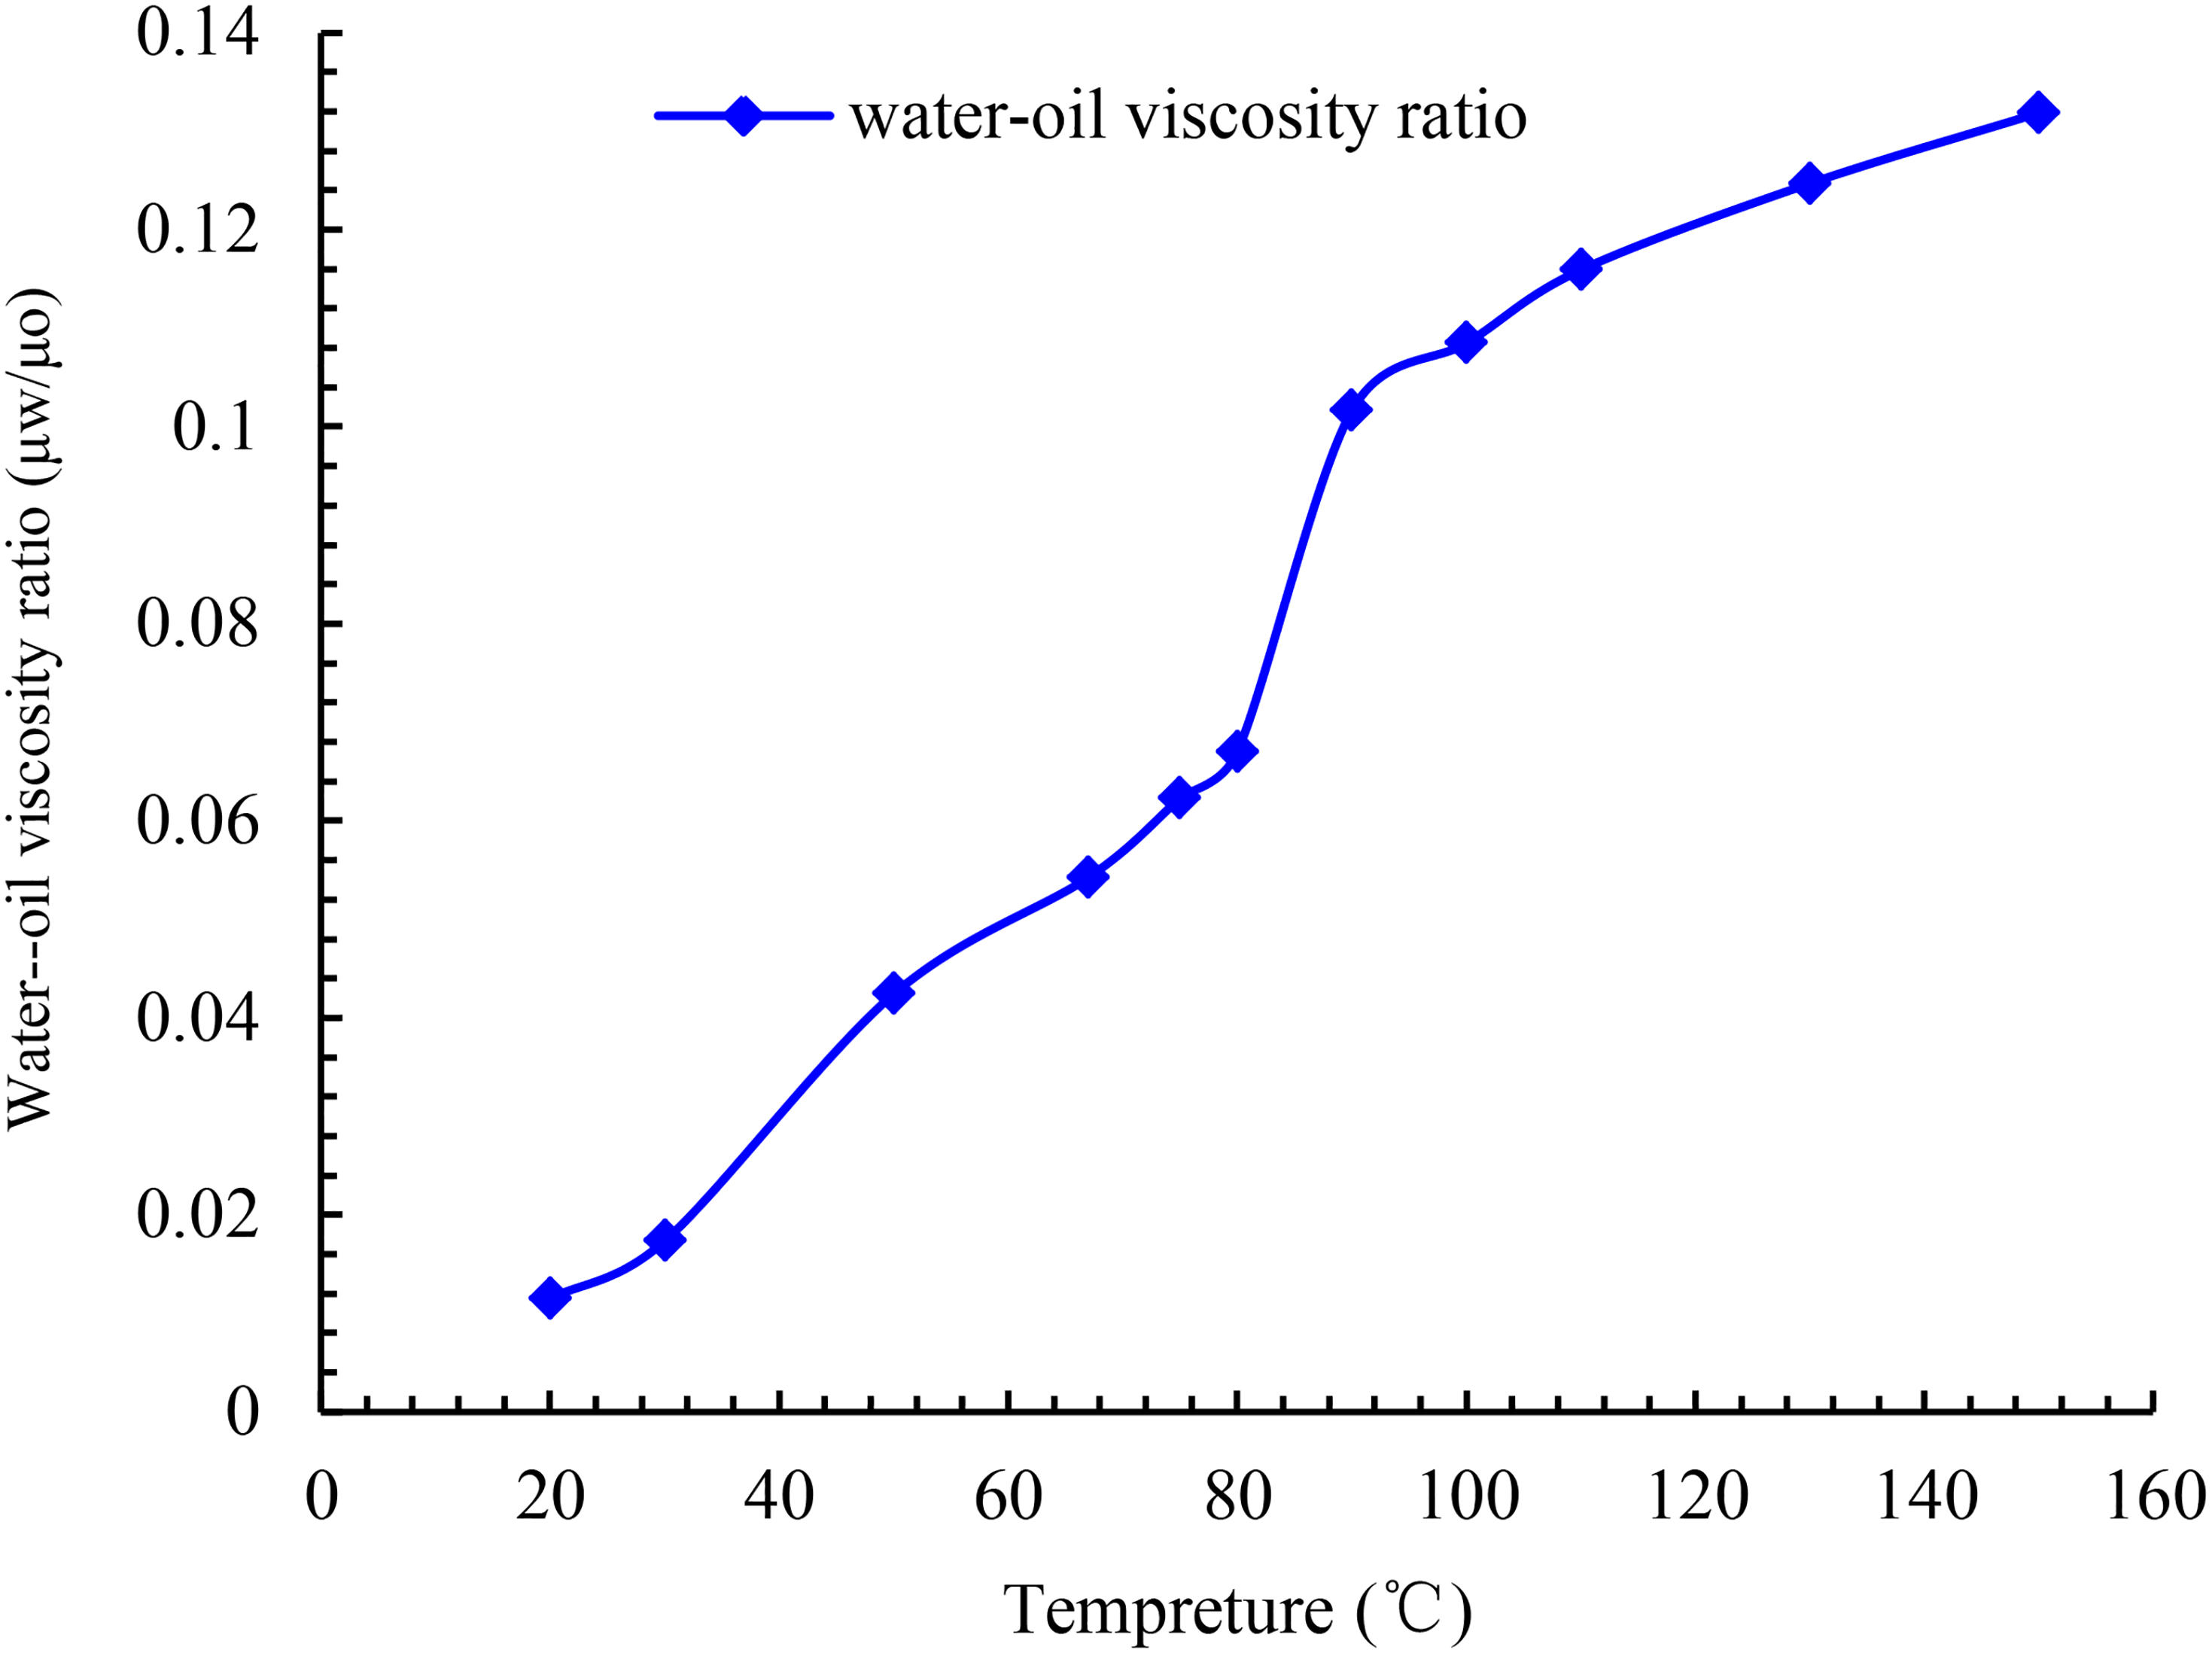
Oil–water viscosity ratio vs. temperature.
Experimental procedure
The unsteady-state method was used to conduct the oil–water displacement experiment. The main steps in the experimental procedure were as follows:
The rock samples were cleaned, dried, weighed (dry weight), vacuumized, pressurized, saturated with formation water, and weighed (wet weight) again. The porosity and pore volume of the rock samples were determined using the weighing method. The rock samples with the saturated formation water were loaded into the core holder. The simulated oil and formation water were loaded into the intermediate containers, which were kept at a constant temperature that being the experimental temperature for 24 h. The effective permeability of the oil phase under irreducible water saturation was measured by injecting the simulated oil into the rock samples at a constant speed, until the outlet end no longer produced water or the volume of the injected simulated oil was more than 20 times the pore volume. Under the conditions of experimental temperature and pressure, the rock samples were aged for three days to make the fluid fully contact the pore throat of the rock samples, simulating the original wettability of the core. The formation water was injected into the rock samples at a constant displacement rate. The displacement conditions were satisfied following The experimental core was cleaned and dried and its wettability was restored. The specific operation steps were in accordance with the standards SY/t5336–2006 and SY/t5153–2007.
The aforementioned steps were repeated for each increment of temperature.
Experimental data-processing method
Calculation method of relative permeability
The Johnson–Bossler–Naumann (JBN) method and its improved method are typically used in unsteady data processing, including constant-speed conditional differential calculation, approximate constant-speed conditional differential calculation, and nonconstant speed and nonconstant pressure conditional calculation (Peng et al., 2018). In the high-temperature and high-pressure water drive experiment, only a few test data points could be recorded owing to the complexity of the experiment operation and instability of the system. If the nonconstant speed and nonconstant pressure method were used directly, a large experimental error would occur. In addition, function fitting needed to be conducted according to the results, following which data needed to be processed (Chen, 2017; Li et al., 2019a). In conclusion, the JBN method and graphic method were combined to process the experimental data. The JBN method requires the derivatives to be obtained twice, which are
In this study, the logarithmic function, exponential function, power-law function, linear function, and polynomial function were used to fit the experimental data 


Calculation method of water content
Water content fw is the percentage of water in the total liquid production when oil and water are generated simultaneously. By studying the law of change in water cut with water saturation, the law of formation water production can be analyzed (Li et al., 2019b). When the influence of capillary pressure and gravity is ignored, the water content can be expressed as follows:


Experimental results
Analysis of the influence of temperature on permeability curves of different blocks
Influence of temperature on permeability curve of rock sample in block X
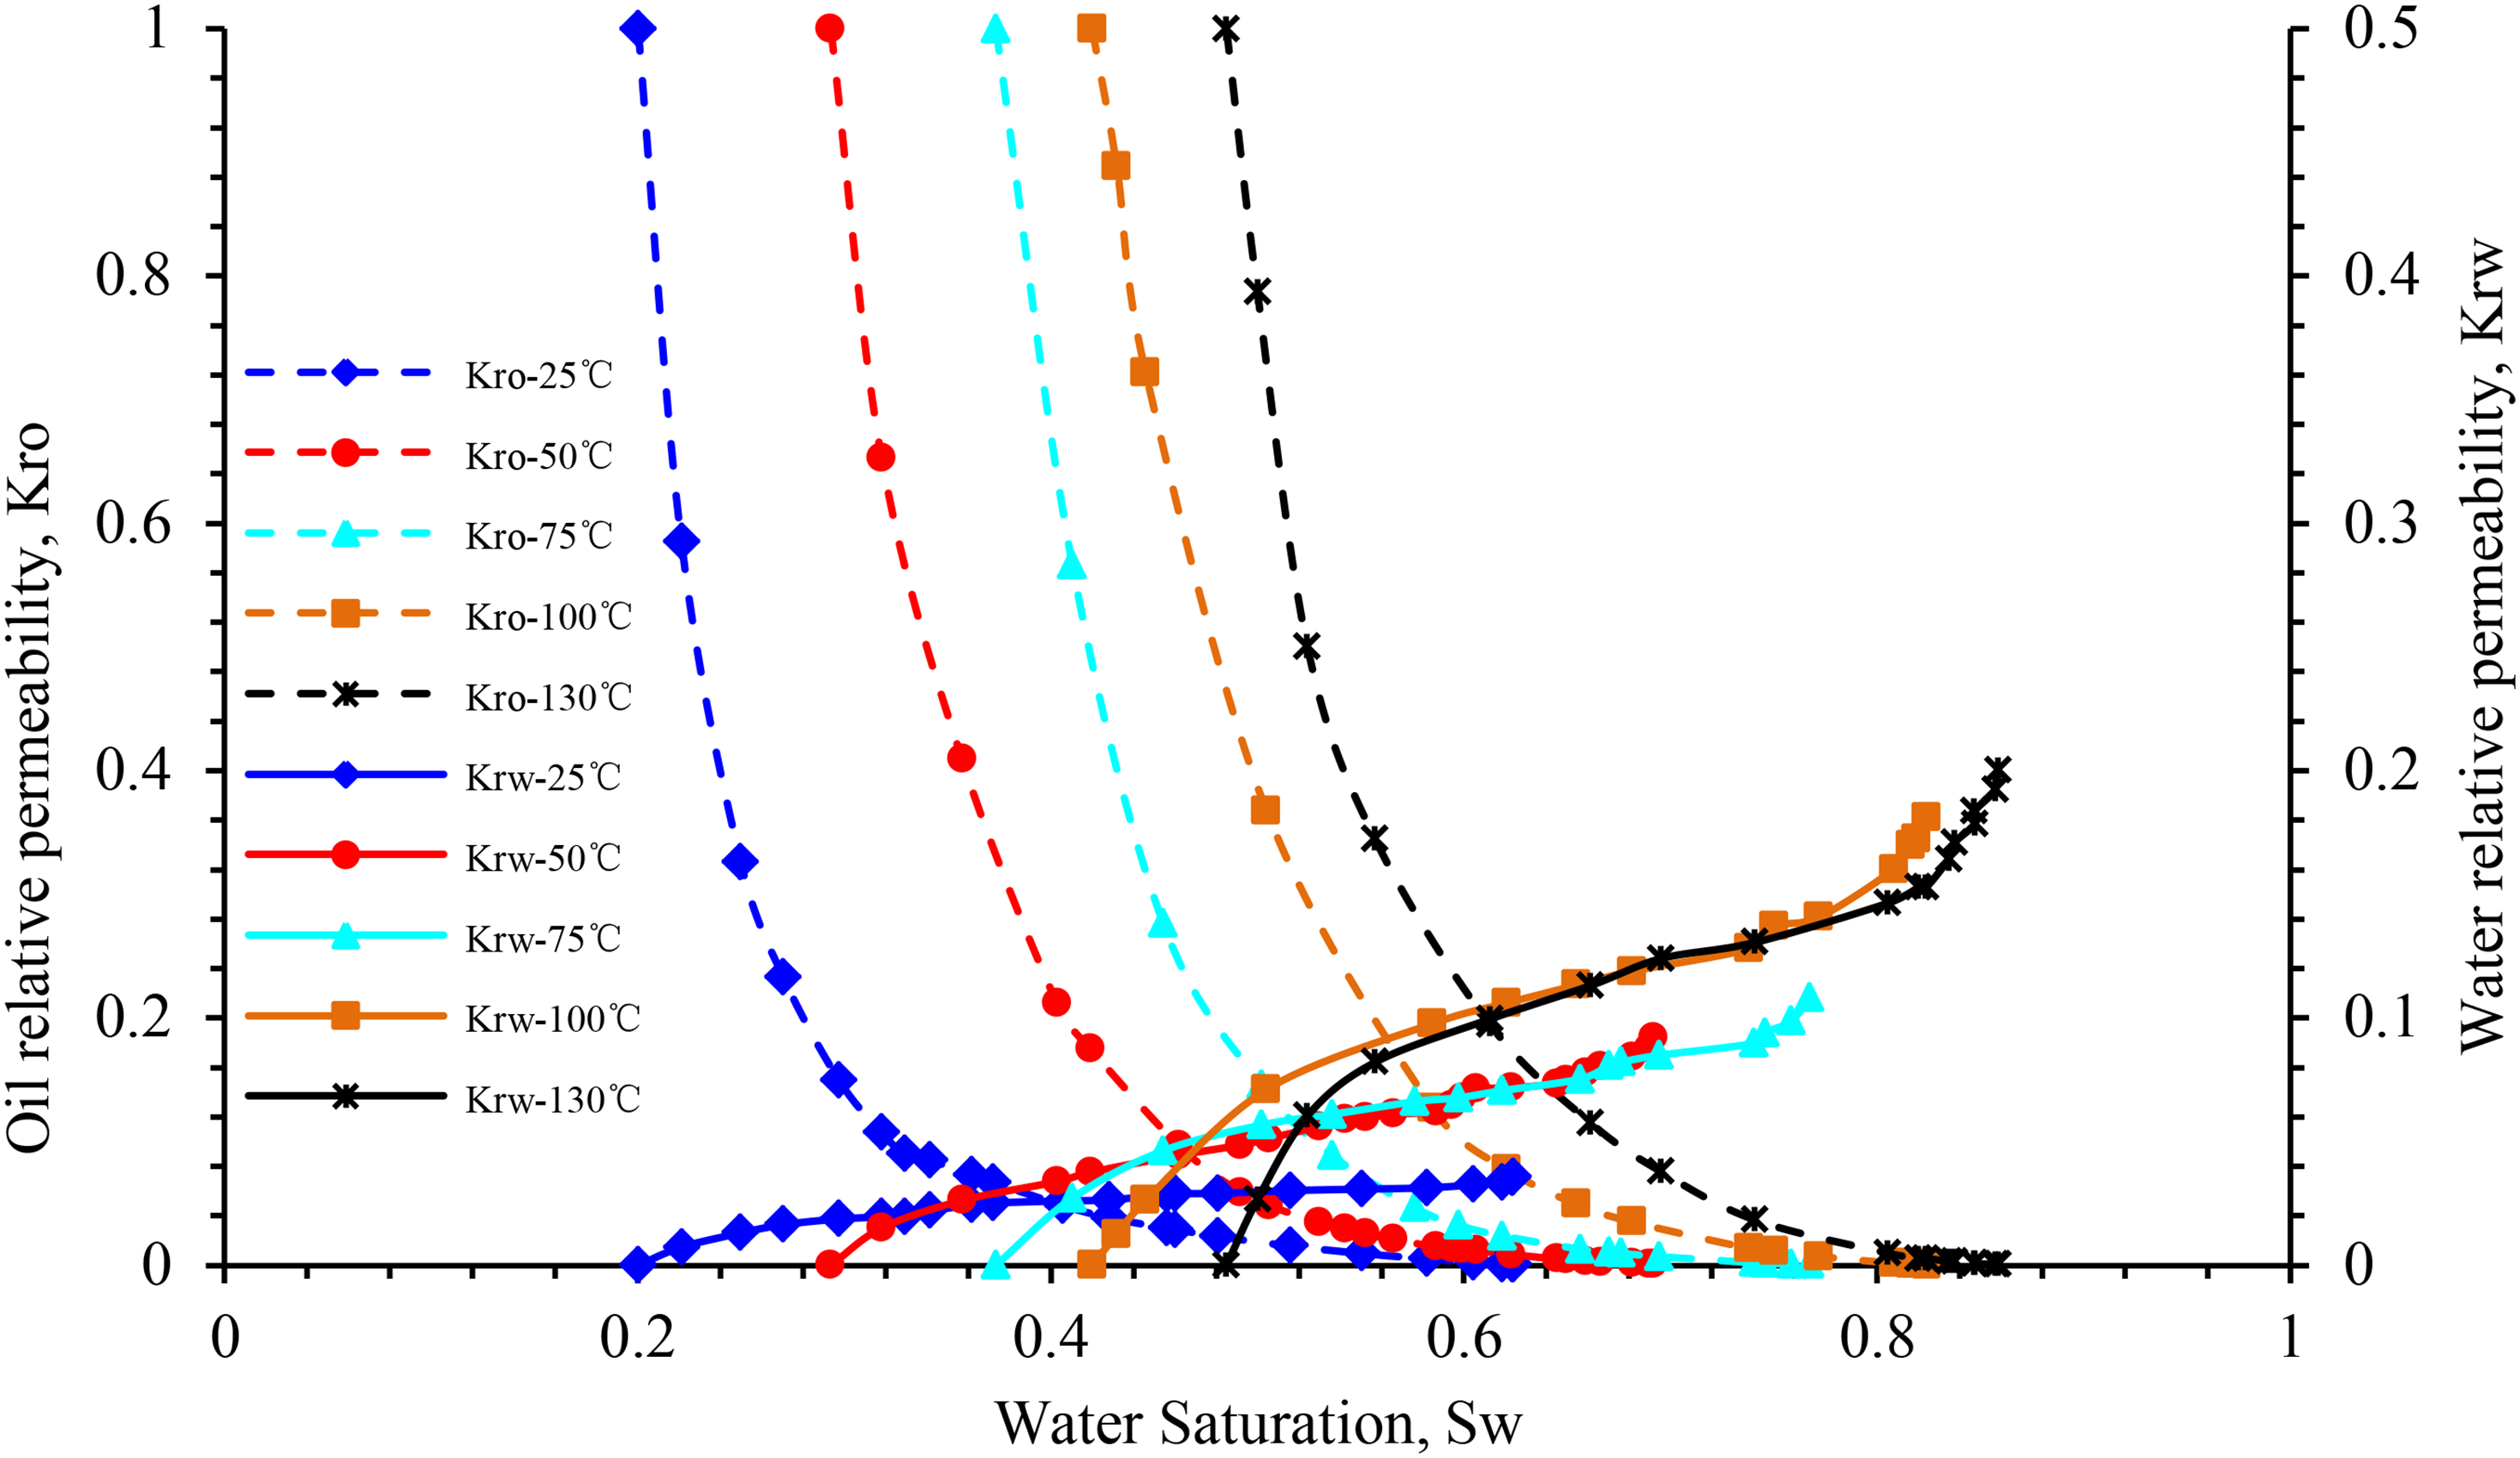
Figure 7 highlights the influence of temperature on the relative permeability of oil and water in block X. When the temperature increases from 25 to 100°C, the relative permeability of oil and water increases at the same water saturation, and that of water at the residual oil saturation at 50, 75, and 100°C increase by 197.5, 43.5, and 23.3%, respectively. In this process, the irreducible water saturation increases linearly, whereas the residual oil saturation decreases nonlinearly (Figure 15). The isosmotic point moves to the right, and the hydrophilicity of the rock becomes stronger. Moreover, the entire two-phase relative permeability curve moves to the right.

Influence of temperature for relative permeability curve of sample X-1.
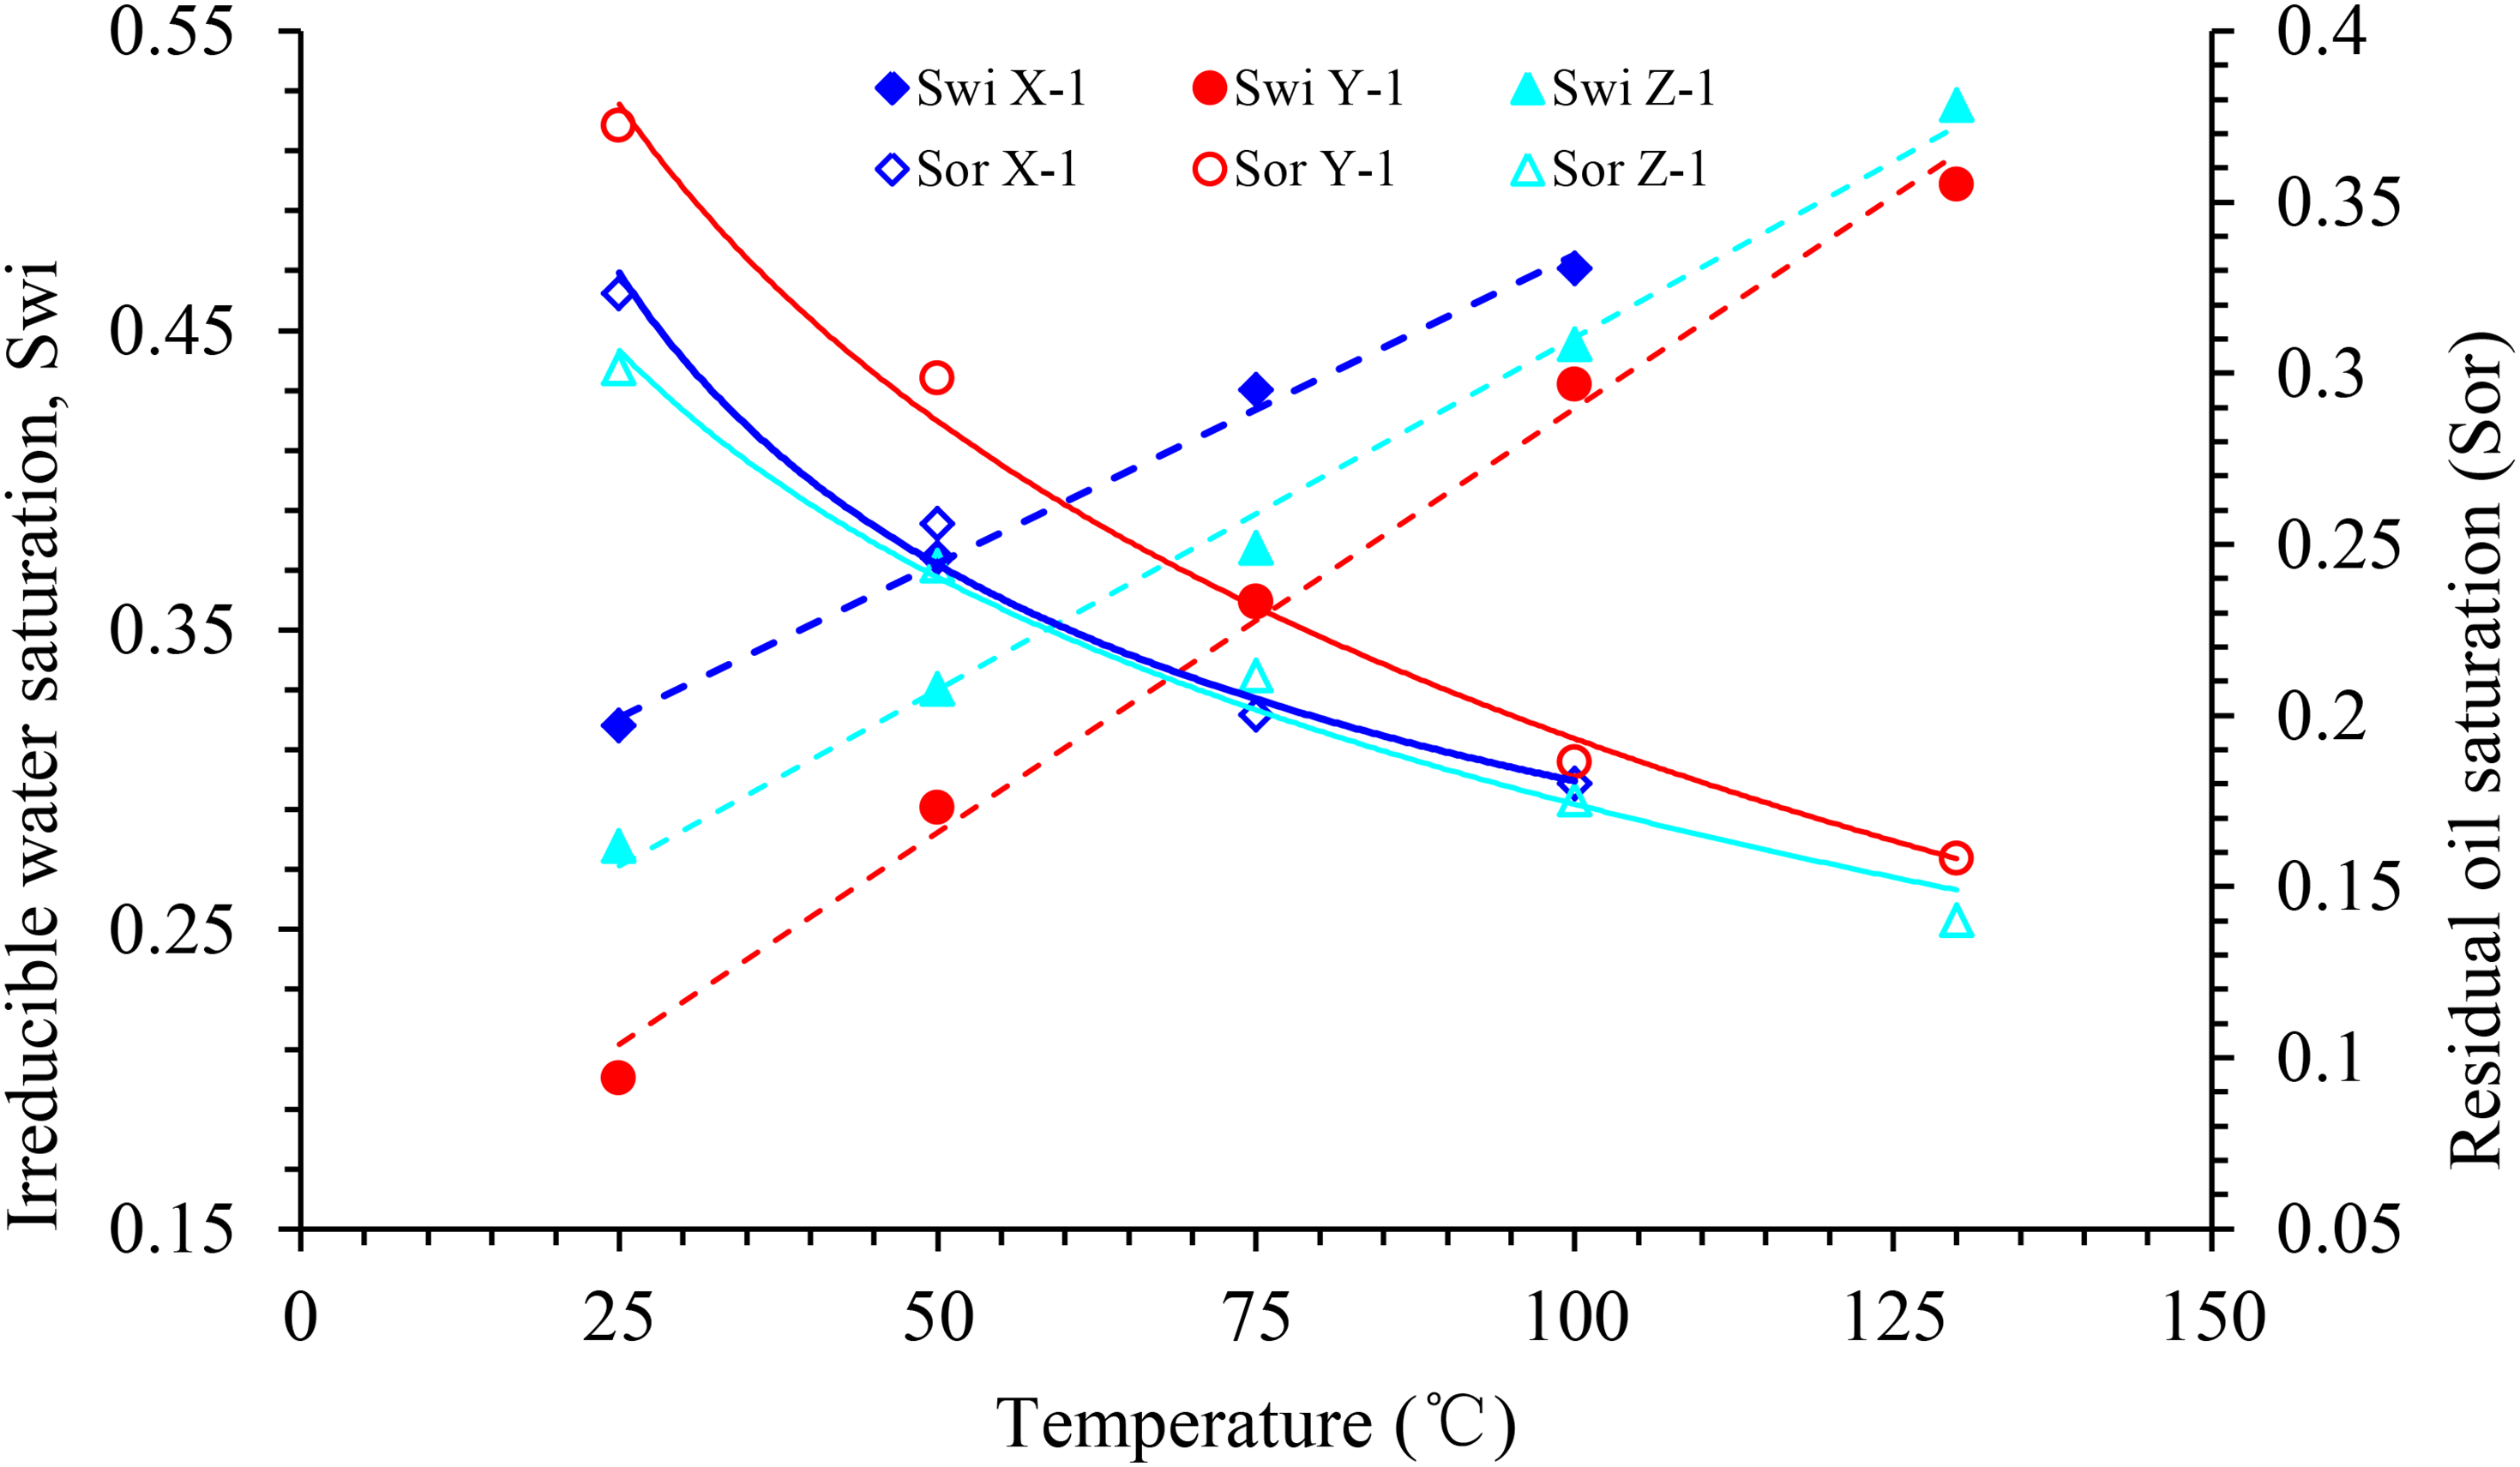
End-point saturation value of experimental samples at different temperatures.
However, when the temperature continues to increase up to 130°C, the irreducible water saturation and relative permeability of the oil phase decrease significantly, and the wettability of the rock changes from weakly hydrophilic to neutral. At this temperature, the oil-phase permeability curve is similar to that at 75 °C, and the relative permeability of the water phase is slightly higher than that at 100°C. This phenomenon underlines the difference between the influence of temperature rise on the relative permeability curve of the oil–water two-phase system of the rock samples in the X block and that in the Y and Z blocks.
Influence of temperature on permeability curve of rock sample in block Y
The experimental results reveal that the oil–water infiltration curve was significantly affected by temperature. Figure 8 depicts that the relative permeability of the oil phase increases with the increase in temperature under the same water saturation, and that the increasing trends the temperature sections are not significantly different. By contrast, the change in the relative permeability of the water phase is slightly more complex. When the temperature increases from 25 °C to 50°C and 75°C, the relative permeability of the water phase at the residual oil saturation increases by approximately twice the original value. As the temperature approaches 100 °C, the relative permeability of the water phase at the residual oil saturation increases by approximately 80%, which is significantly higher in comparison with that at 75°C. When the temperature exceeds 100°C, the variation trend of the relative permeability curve of the water phase tends to stabilize.
Influence of temperature on relative permeability curve of sample Y-1.
During the entire process of temperature increase, irreducible water saturation increases linearly, whereas residual oil saturation decreases nonlinearly (Figure 15). The two-phase equal permeability points of oil and water gradually move to the right, while the hydrophilicity of the rock gradually becomes stronger.
Influence of temperature on permeability curve of rock sample in block Z
Overall, the influence of temperature increase on the phase permeability curve in block Z was consistent with that in block Y. With the increase in temperature, the relative permeability of the oil–water phase increases under the same water saturation, the entire oil–water phase permeability curve moves to the right, and the wettability of the rock changes from neutral to weak.
Analysis of water production law
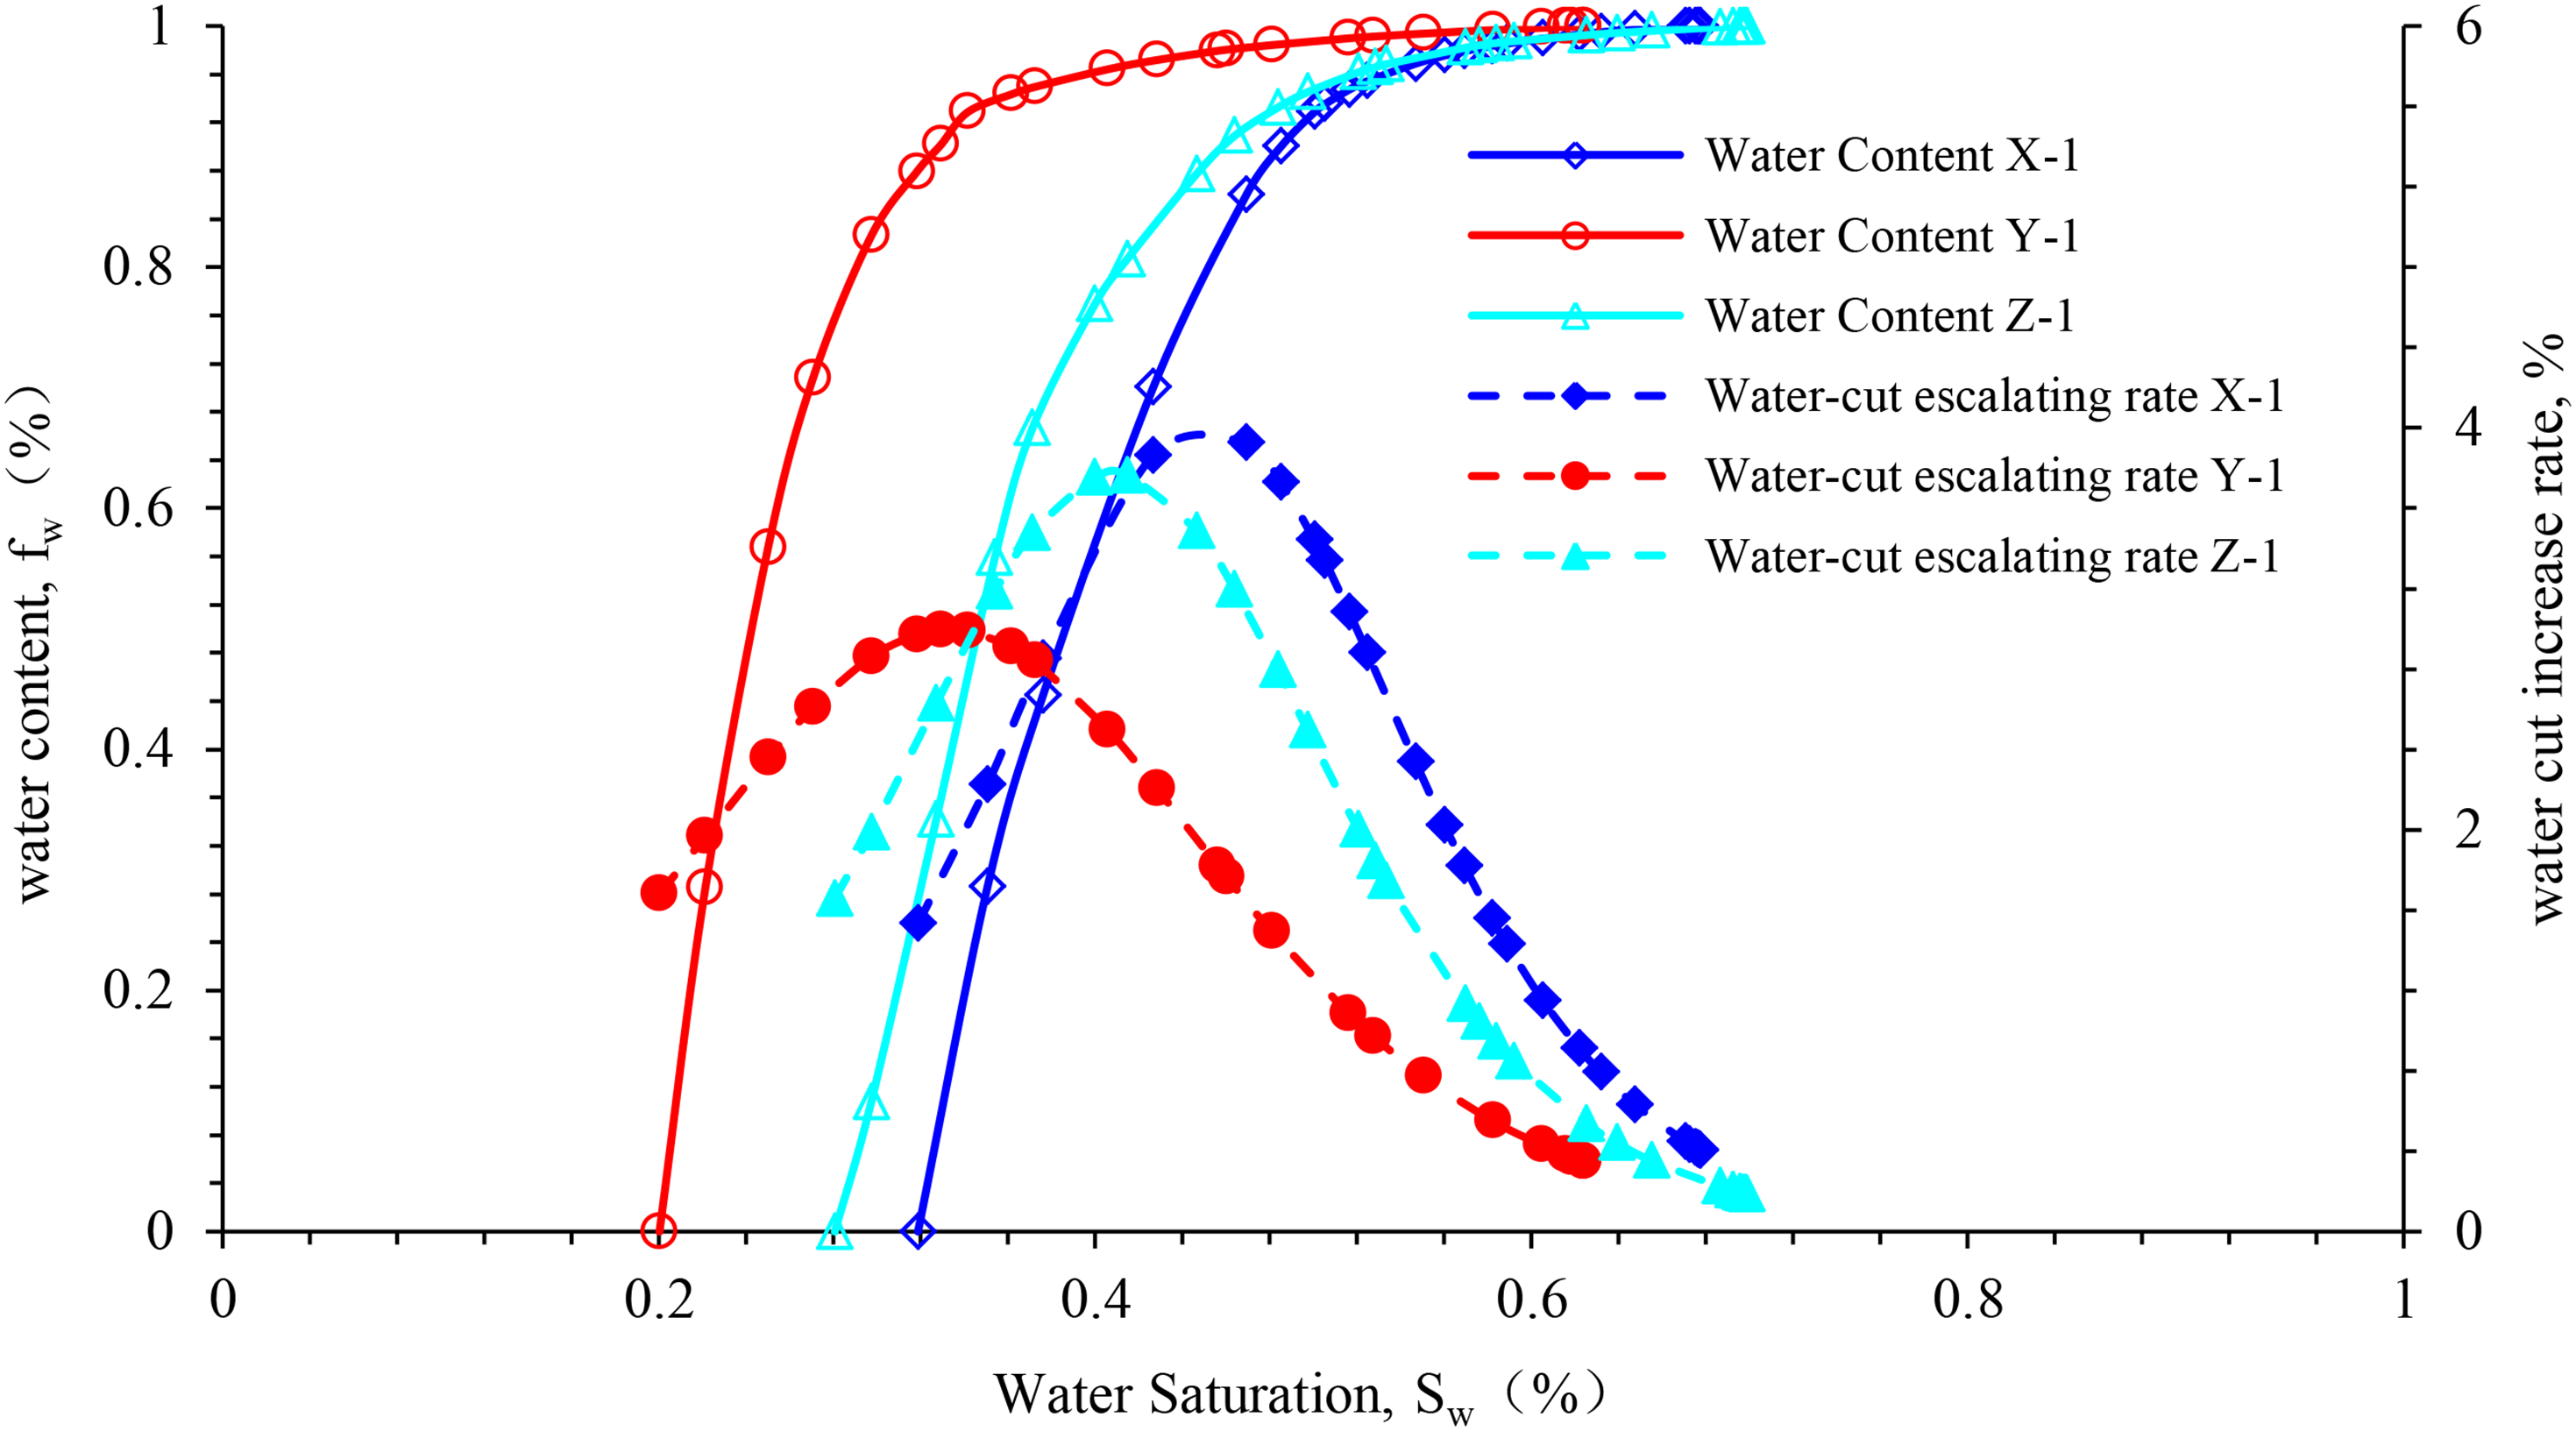
The law of water production observed in the rock samples from different blocks during the water drive experiment is as follows: the early stage of displacement marks a short period of low anhydrous oil recovery. The experimental rock samples in different blocks differ from one another in some aspects. In the middle and low water-cut stages, the recovery is low, and the water-cut rise speed is high. However, the speed in the experimental rock samples in different blocks is different. Furthermore, the maximum water-cut rise speed in block X is approximately twice that in block Y. Generally, in the high water-cut stage, the increase of water cut decelerates. With the increase in the water drive spread, the decrease in the relative permeability of oil and the increase in the relative permeability of water decelerate gradually. At this stage, the water drive oil recovery is relatively high, and the water-cut rise curve is convex (Figure 10). As observed in the figure, a high water-cut stage is an important stage in oilfield production.
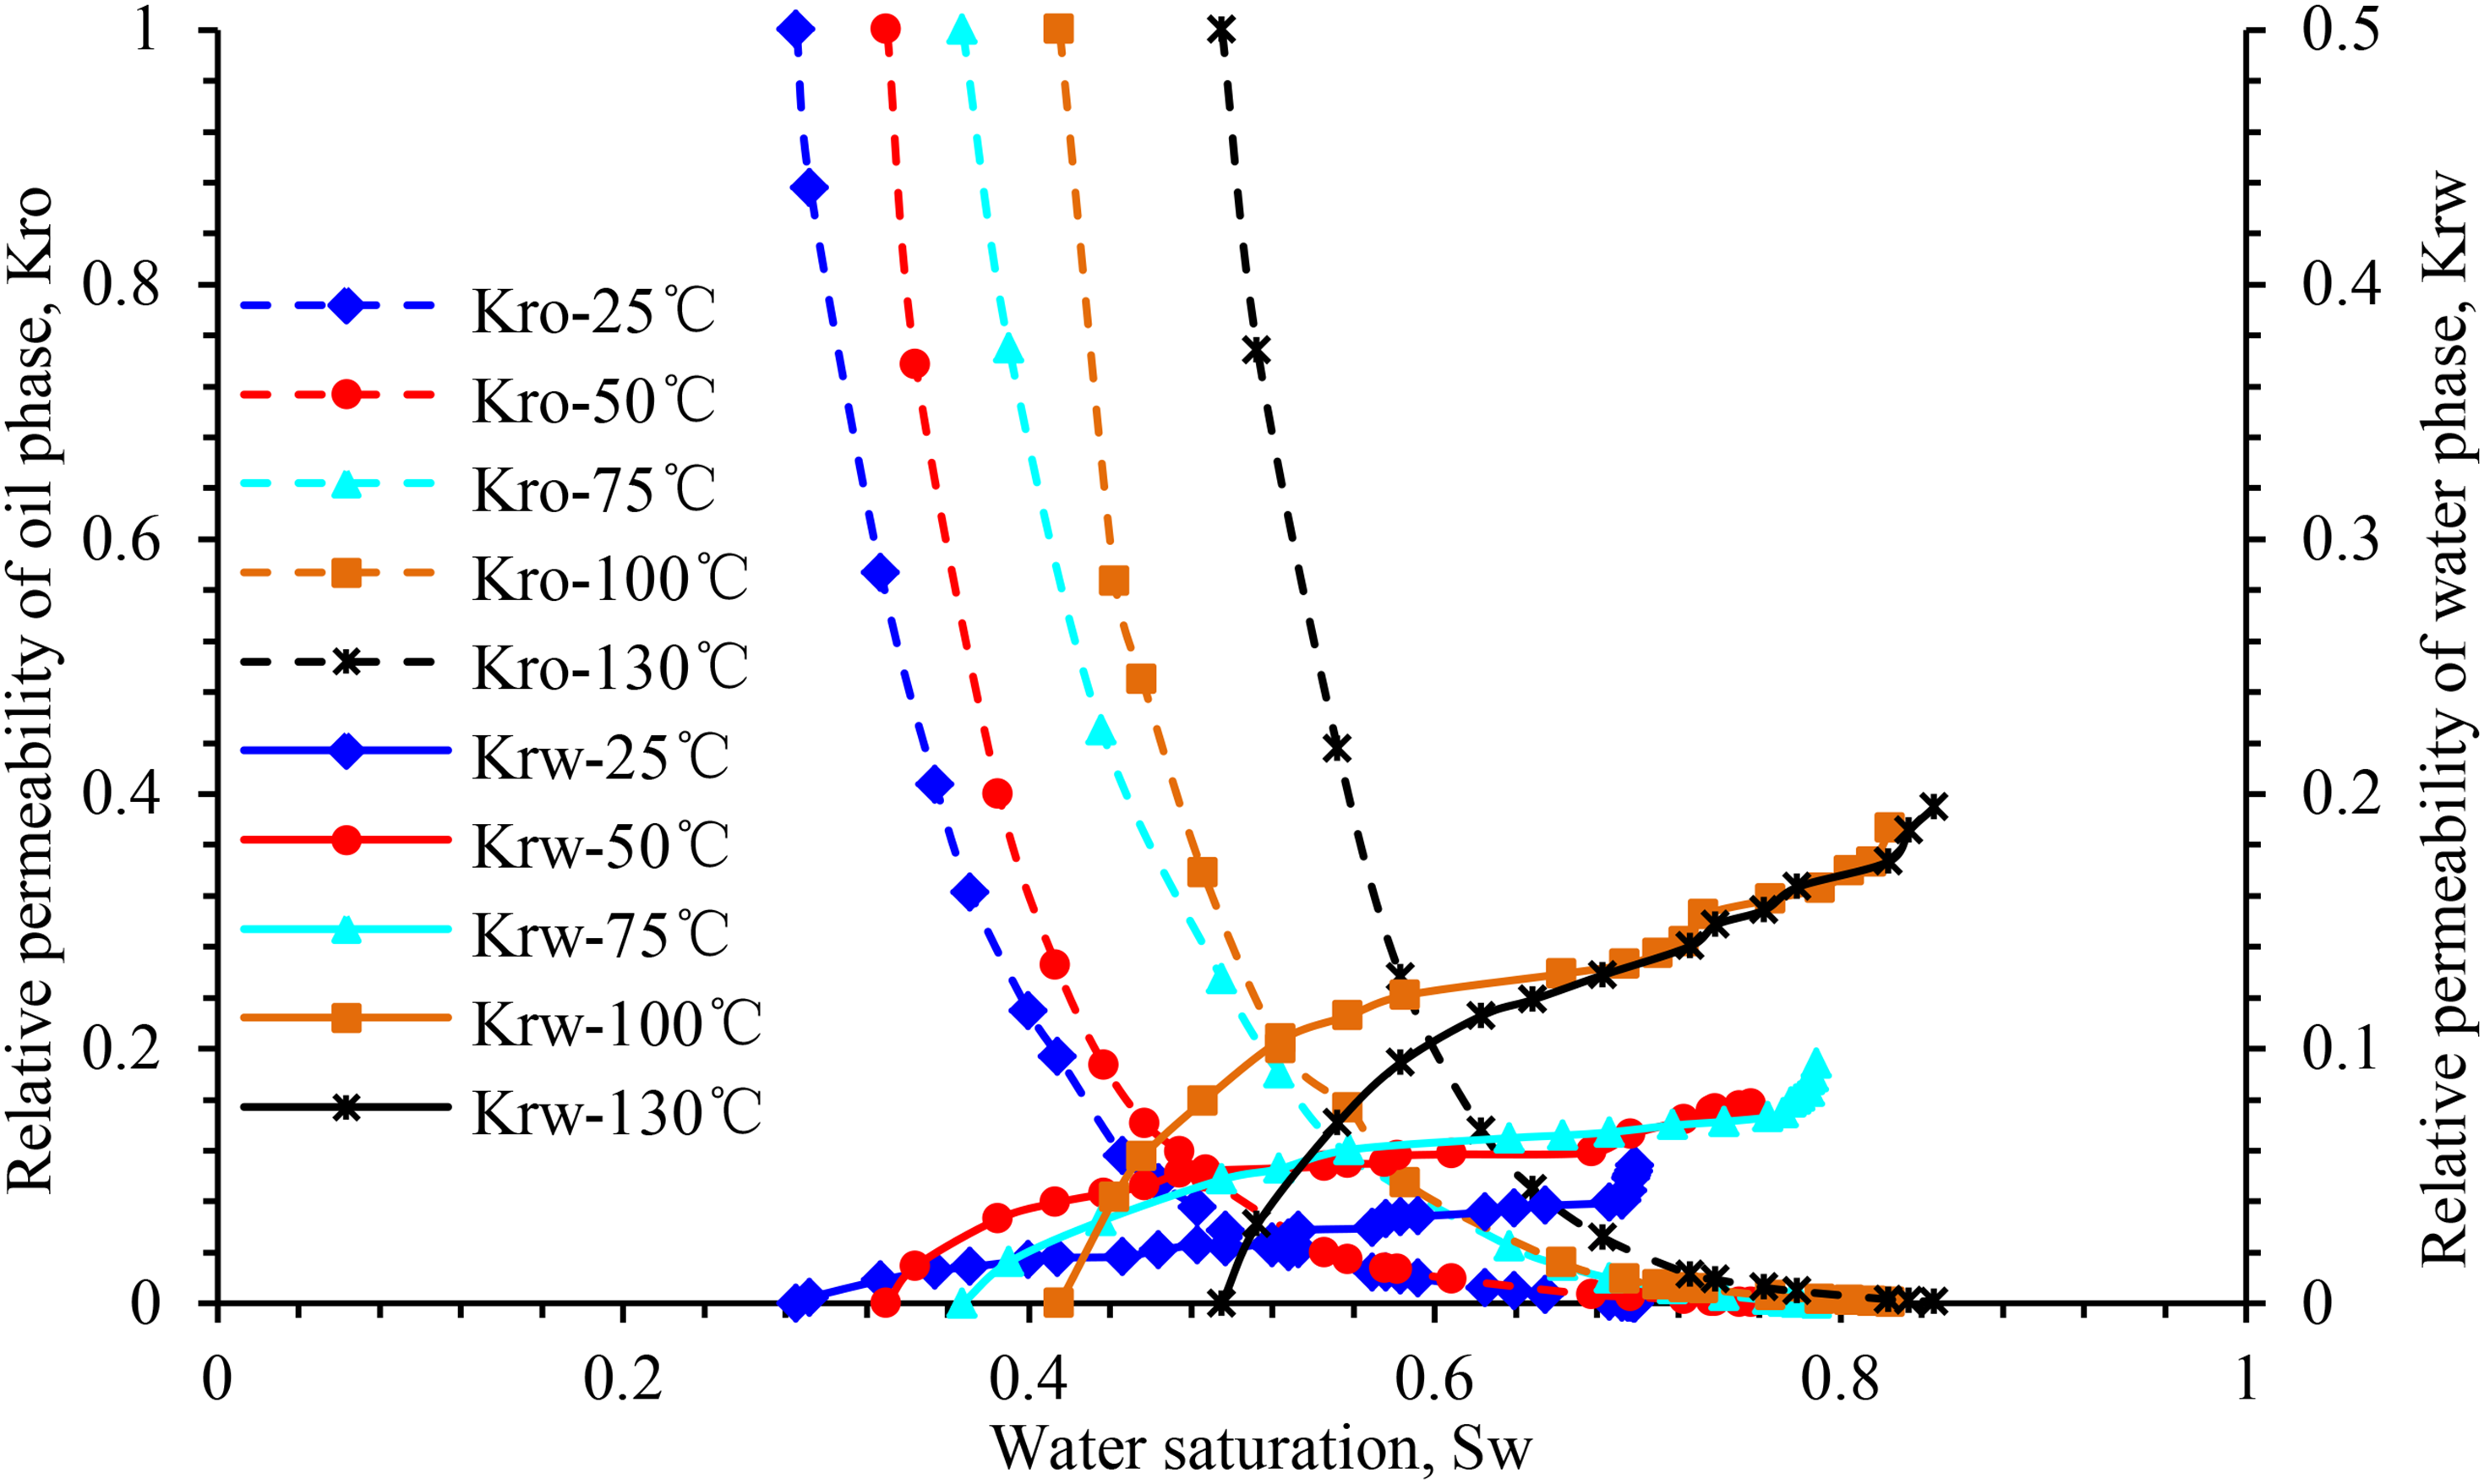
Influence of temperature on the relative permeability curve of sample Z-1.
Rate curves of water content and water cut increase for different samples at 25°C.
Figures 11 to 13 illustrate the curves of the water-cut rise rate and water cut in the experimental rock samples from different blocks under different experimental temperatures. According to the analysis chart in the figure, the effect of temperature rise on the water-cut rise rate of the experimental rock samples in the same well area is approximately the same, and the overall water-cut rise rate curve is of the “convex type,” which is characterized as “slow at both ends and fast in the middle.” Within a certain temperature range, as the temperature increases, the water content curve of the experimental rock samples in different blocks moves in the direction of higher water saturation. In comparison with those at 25°C, the water content increases faster and the curve's increasing trend is steeper at higher temperatures.
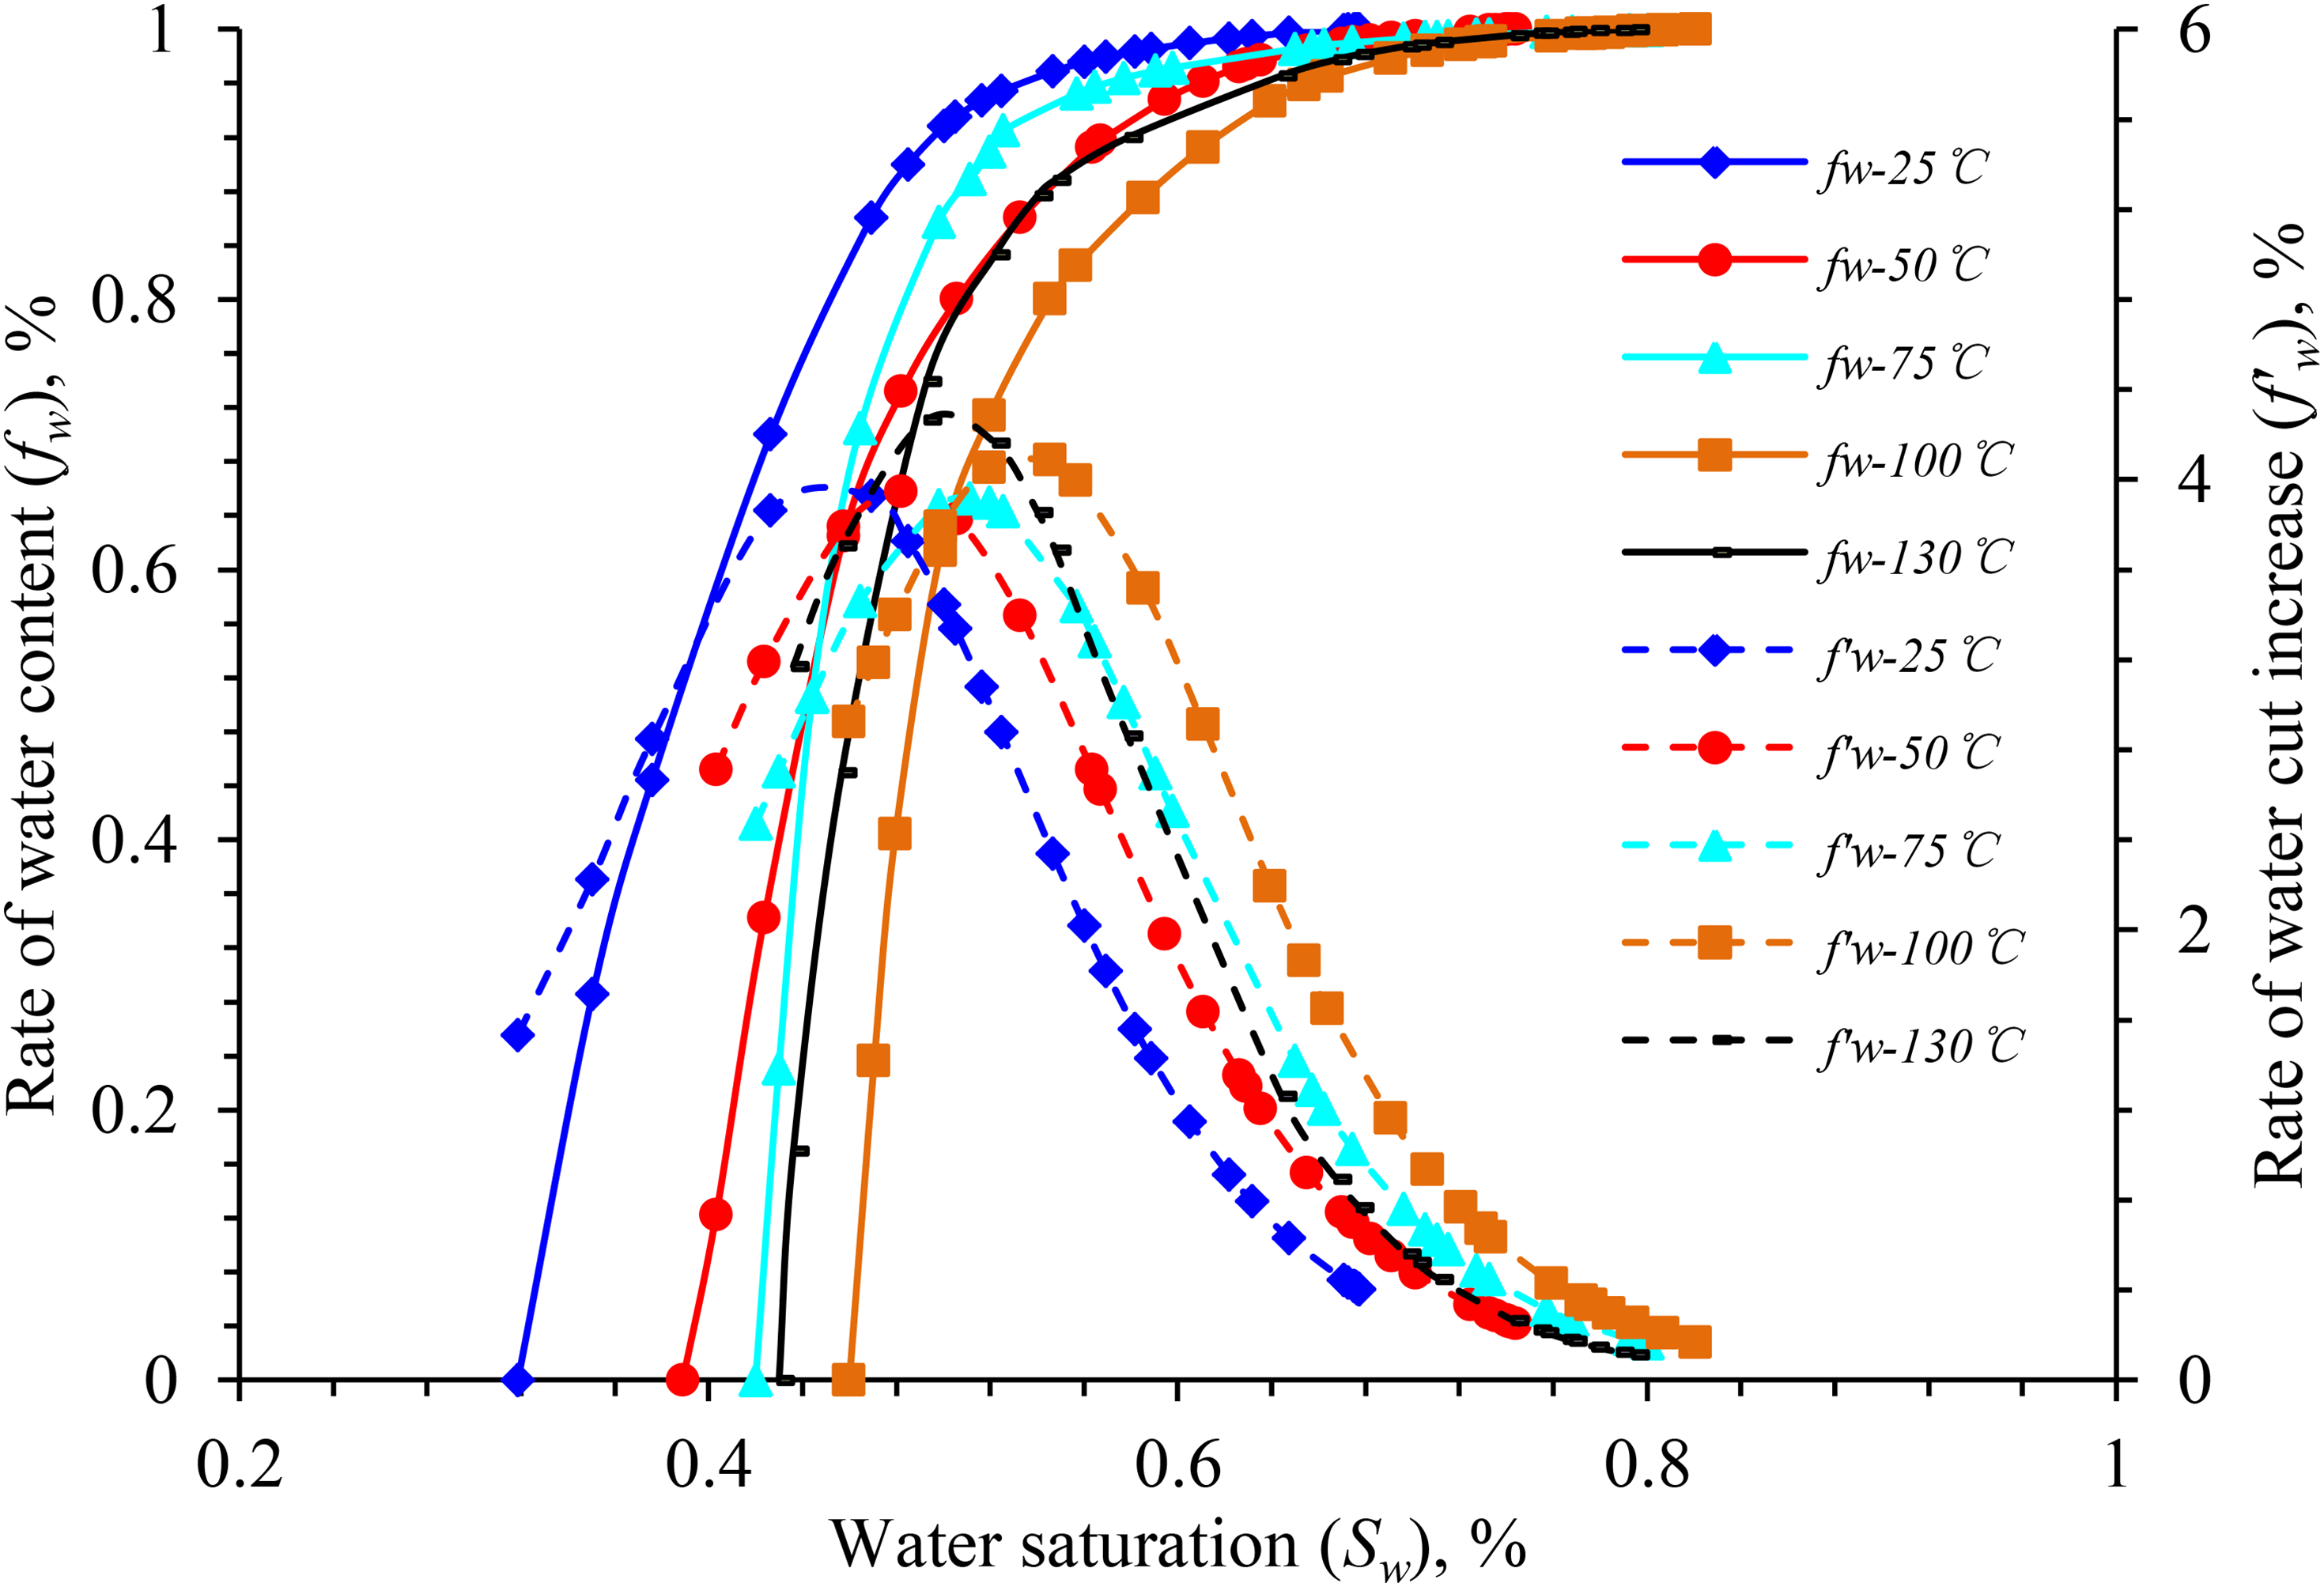
Water content vs. the rate of water-cut rise vs. water saturation for sample X-1.
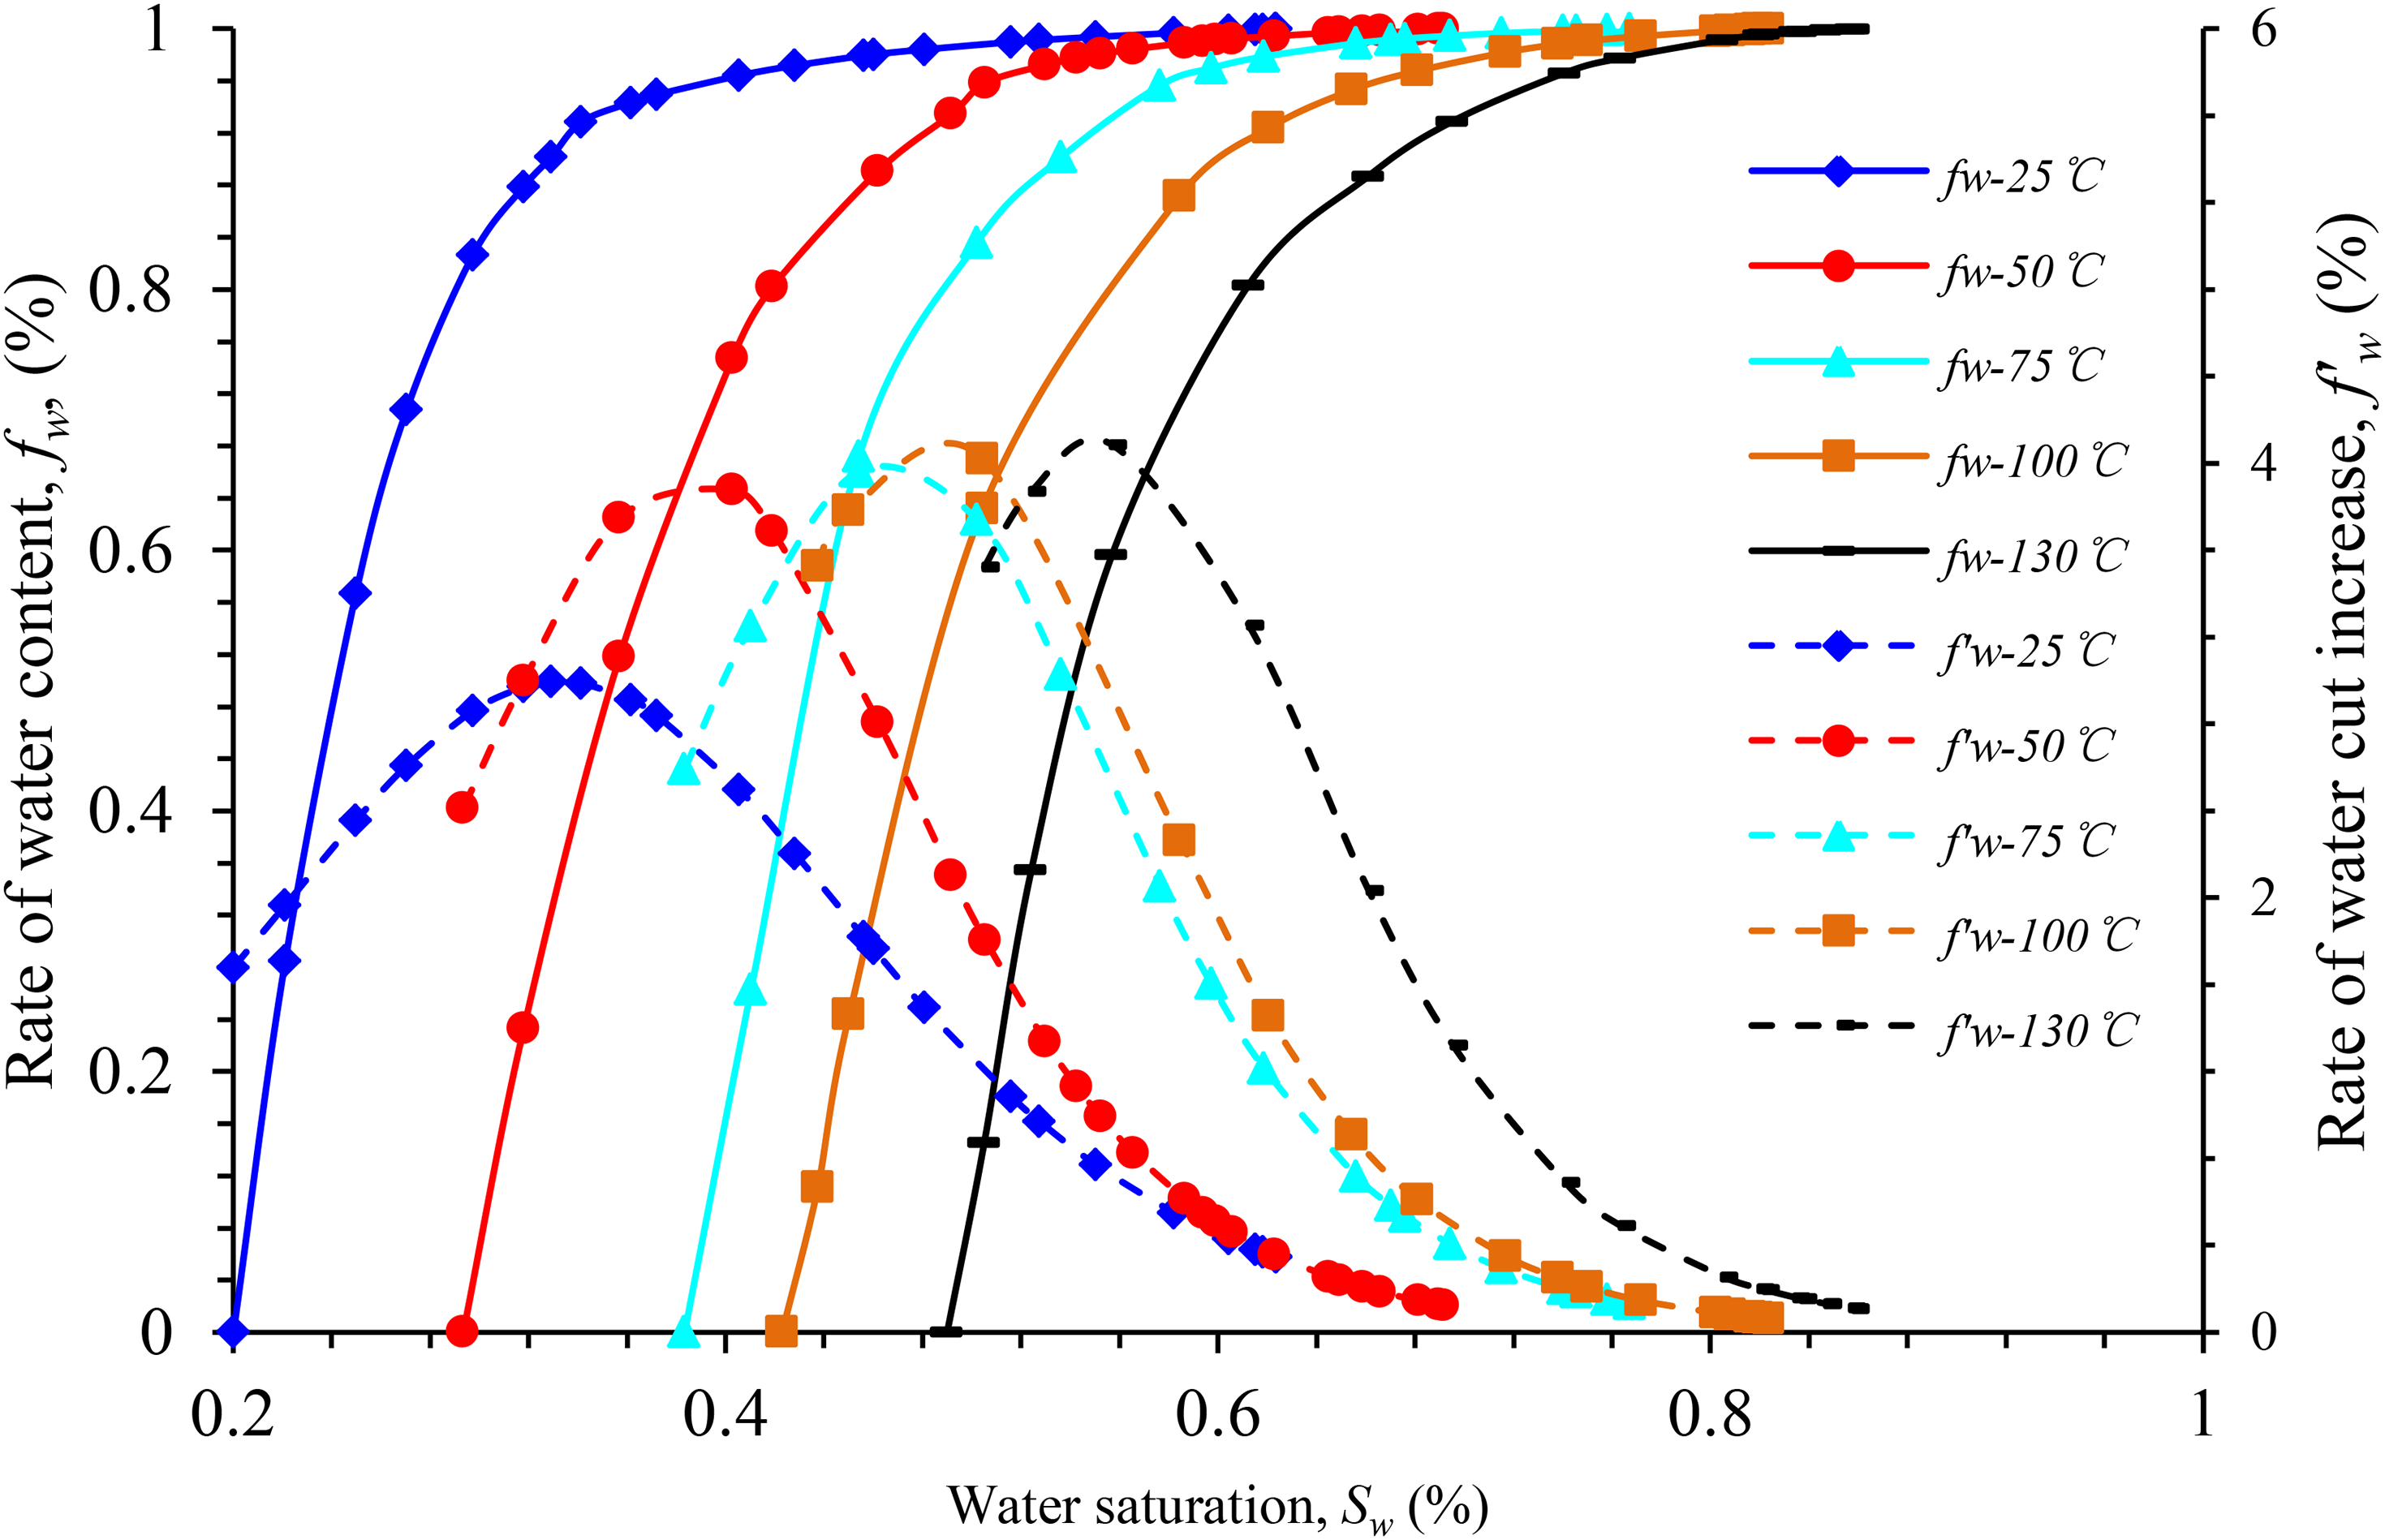
Water content vs. the rate of water-cut rise vs. water saturation for sample Y-1.
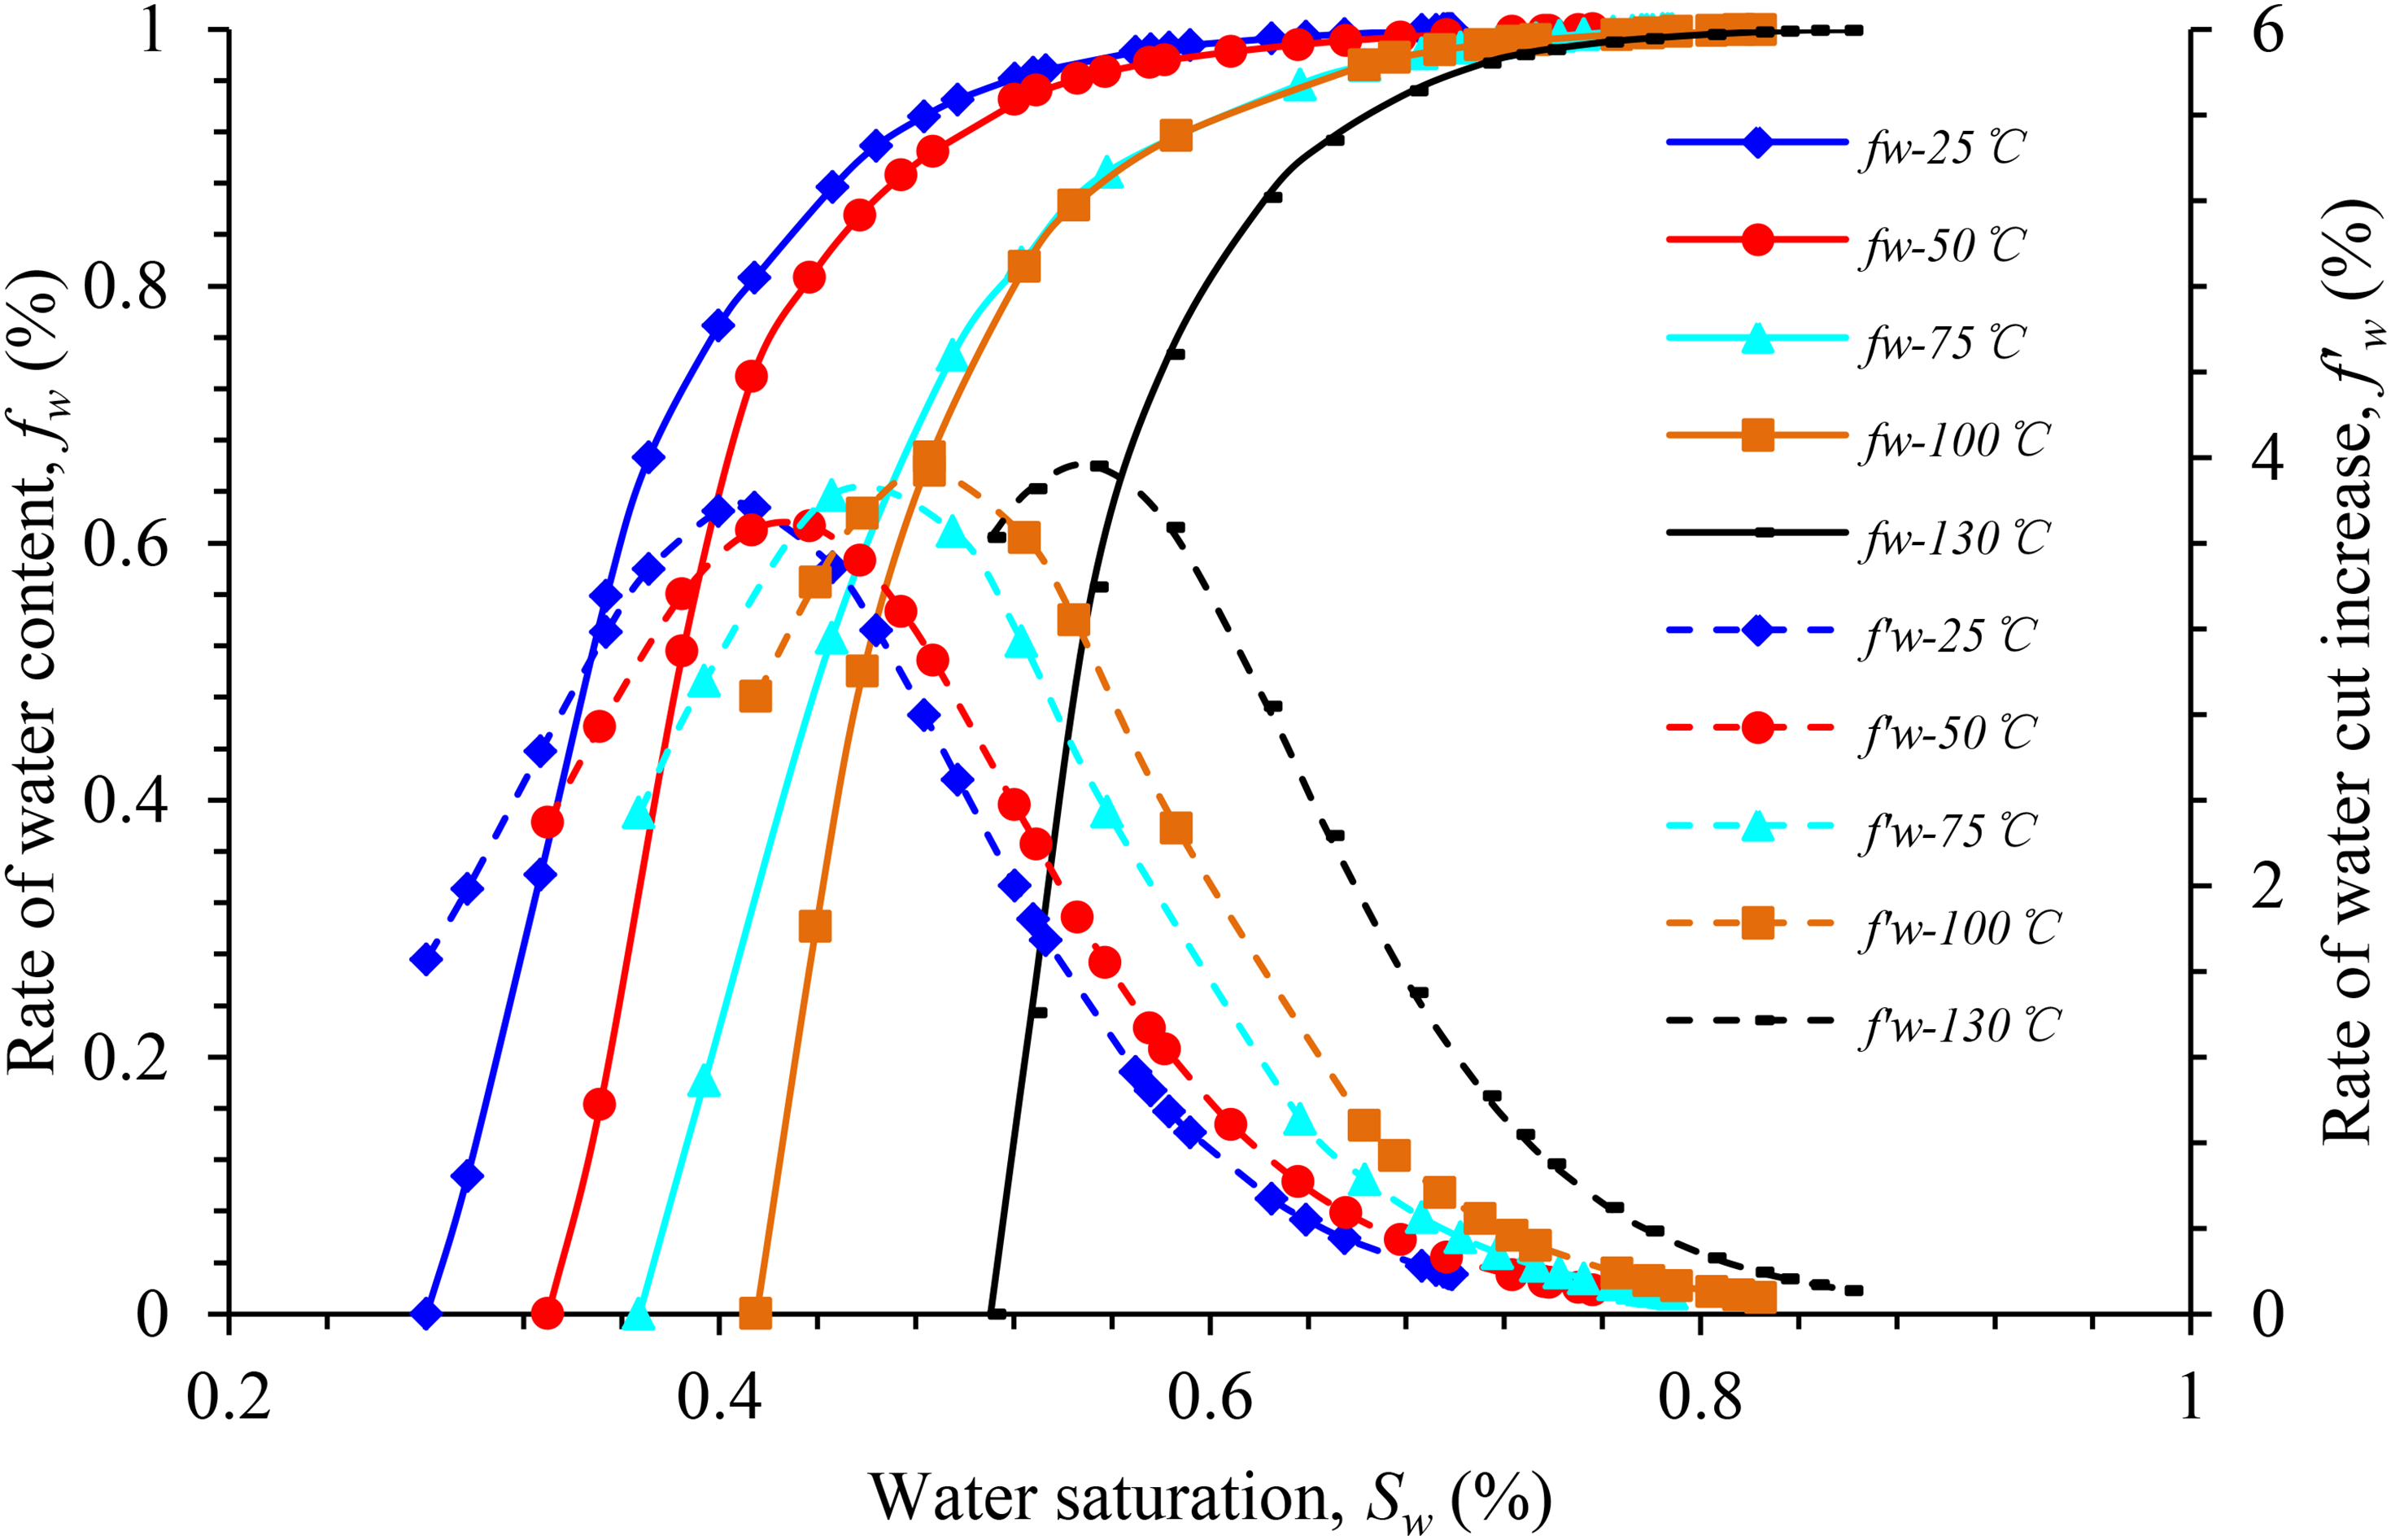
Water content vs. the rate of water-cut rise vs. water saturation for sample Z-1.
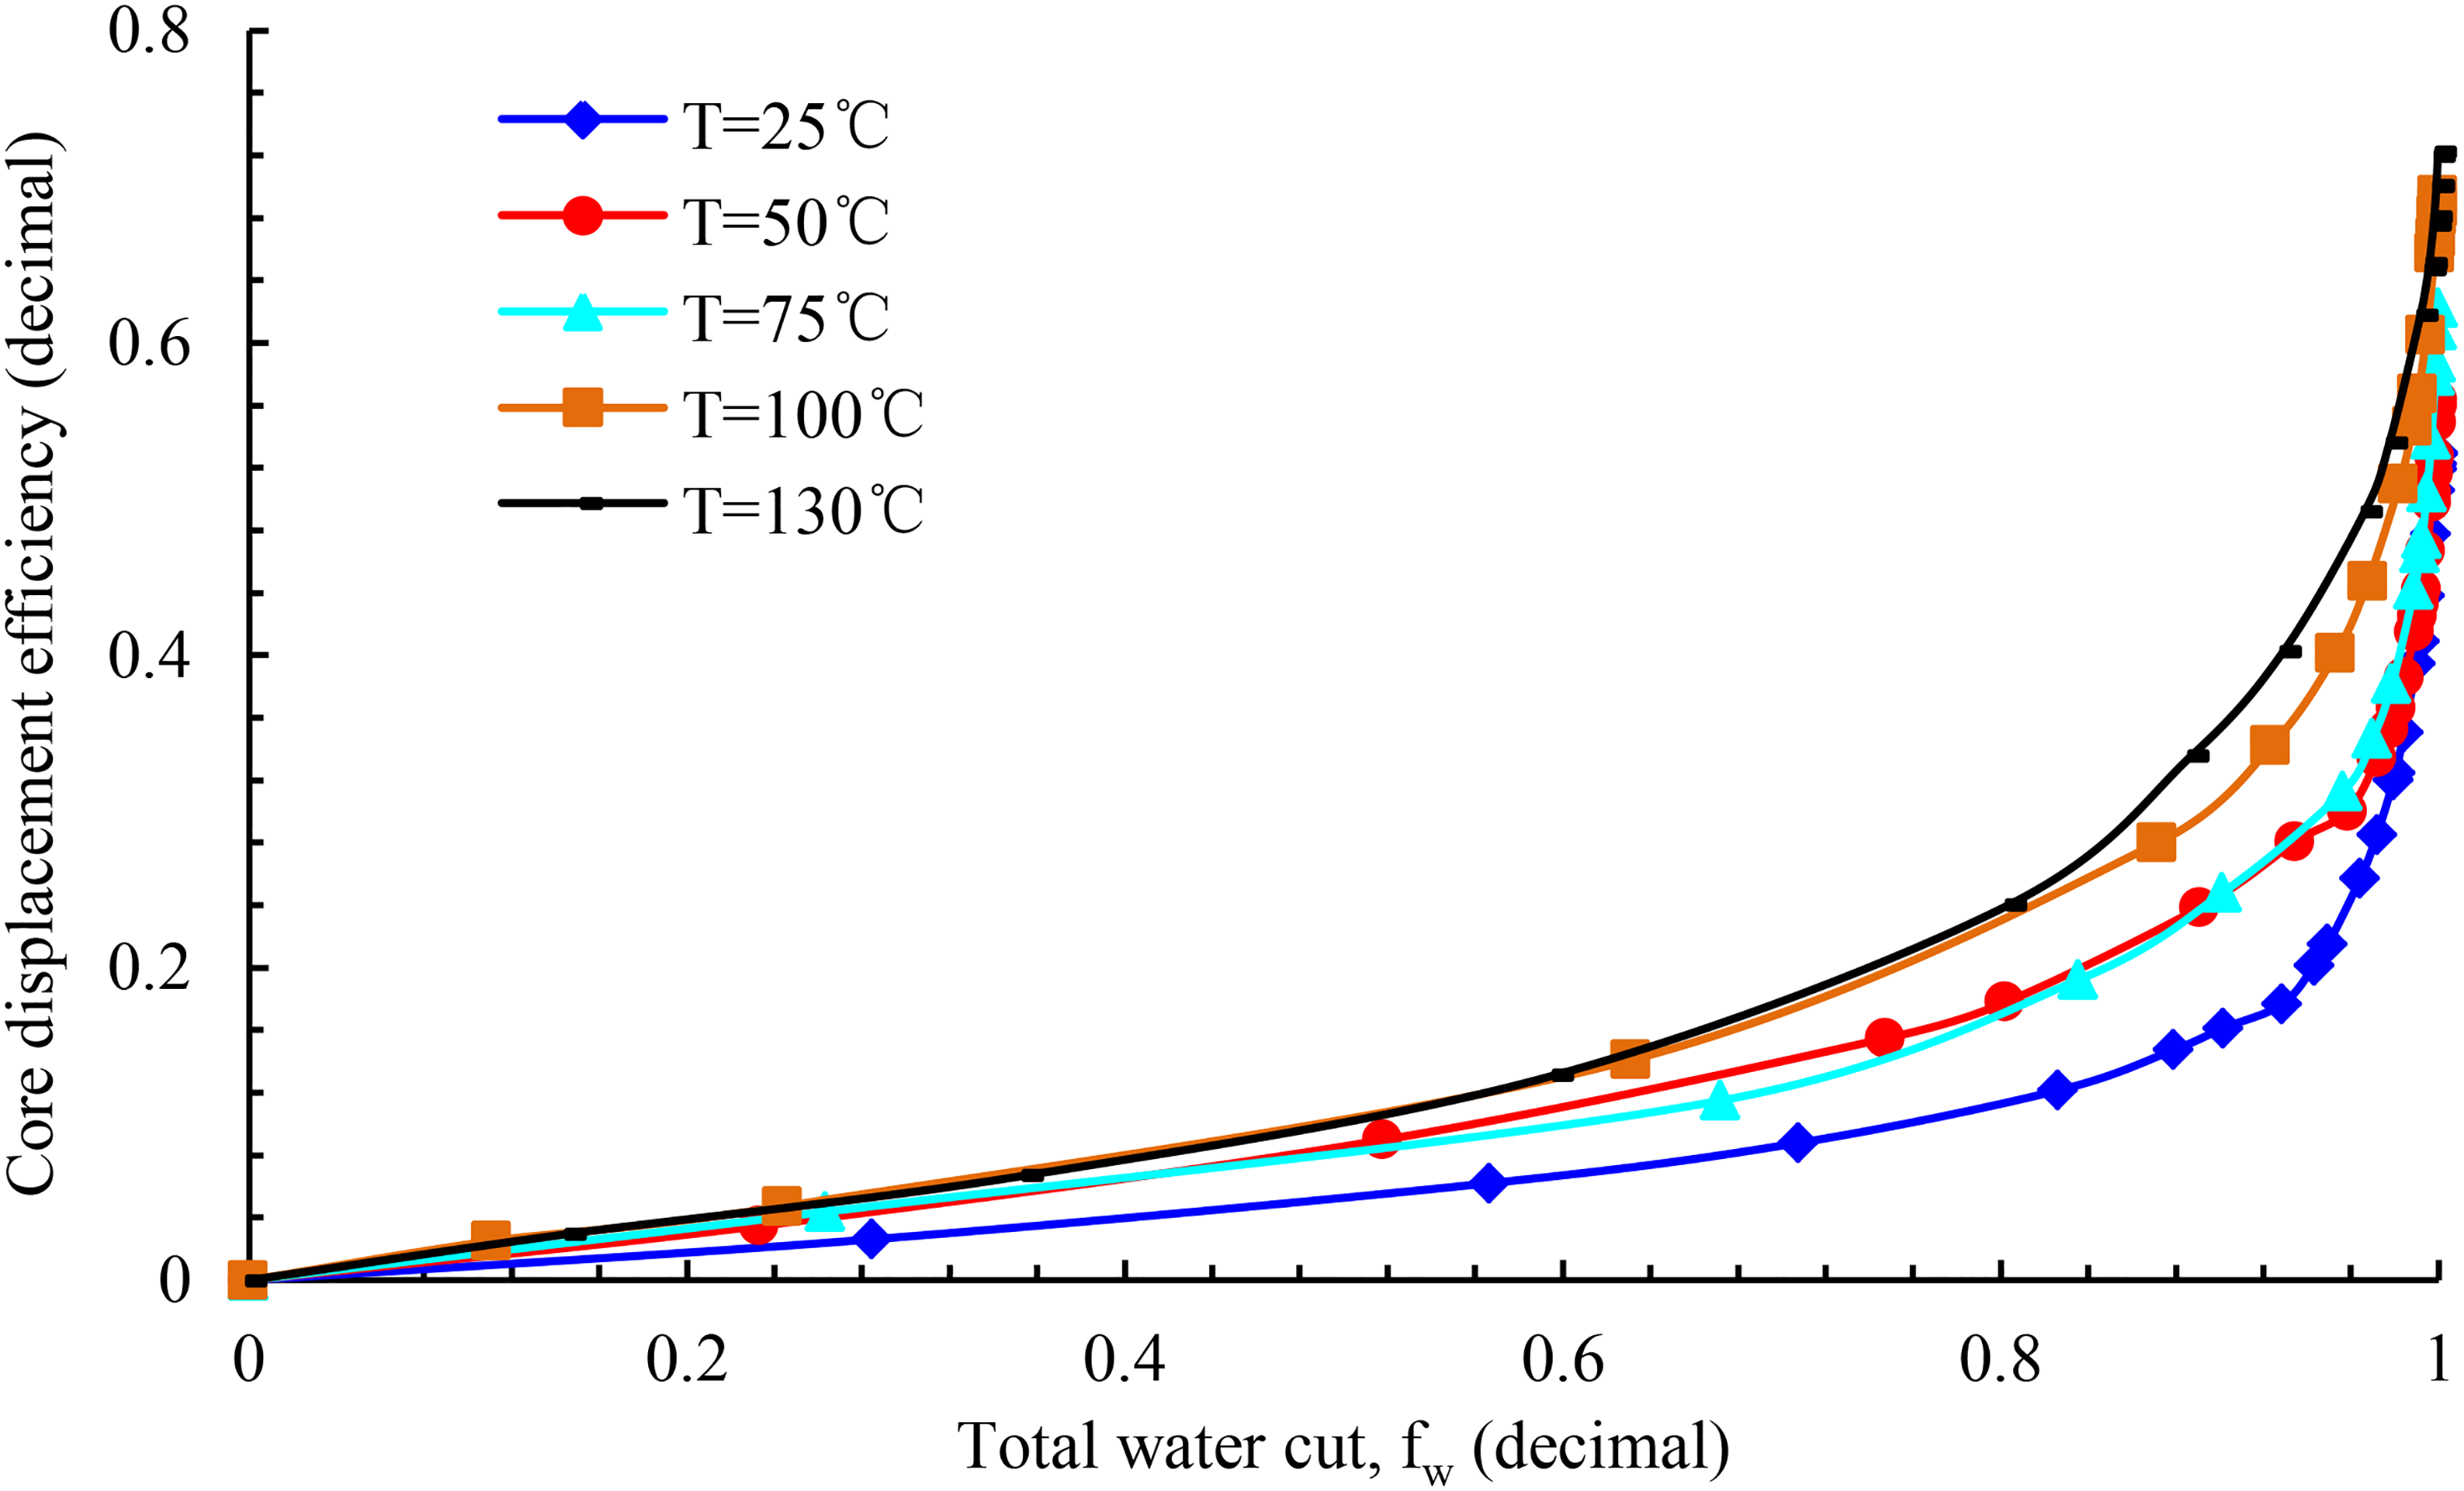
Figure 14 depicts the water washing oil efficiency curve of rock sample Y-1 at different experimental temperatures. With an increase in the experimental temperature from 25 to 130°C, the oil washing efficiency of the experimental rock sample improves evidently. For a constant water content, there is an increase in the water washing oil efficiency as an increase in the experimental temperature.
Water-flushed efficiency at different temperatures for sample Y-1.
Discussion
The experimental results reveal that the influence of temperature rise on the oil–water phase permeability curve of sandstone in different blocks is different. The set of results that leads to this conclusion is as follows: 1) at a certain temperature range (T < 100°C), with the increase in temperature, the irreducible water saturation of the rock sample increases linearly, whereas the saturation degree of the residual oil decreases nonlinearly (Figure 15). Equal permeability points of the oil–water two-phase system shift to the right, and the hydrophilicity of the rock changes. The relative permeability of the oil–water two-phase system at the same water saturation increases with the increase in temperature, while the whole relative permeability curve shifts to the right. The increase in temperature expands the oil–water two-phase common flow area and improves the efficiency of water drive recovery. 2) When the experimental temperature is 100°C < T ≤ 130°C, the relative permeability of the oil phase in blocks Y and Z increases with the increase in temperature, whereas that of the water phase does not increase significantly. In contrast, the experimental rock samples in block X demonstrate the opposite trend, at 130°C, the irreducible water saturation of the rock samples in block X is significantly lower than that at 100°C, and the variation trend of the relative permeability of the oil phase at 130°C remains the same.
We discovered that the reasons for the influence of the rise in temperature on the phase permeability curve of the experimental rock samples were different in different well areas, under uniform experimental conditions.
The irreducible water saturation of the rock sample decreased gradually with an increase in the porosity and permeability, under uniform experimental conditions. A comparison of the porosity and permeability parameters of X-1, Y-1, and Z-1 revealed that the permeability of X-1 was the highest (KX > KY > KZ). Meanwhile, its irreducible water saturation was also the highest (SwiX > SwiZ > SwiY), which contradicts the aforementioned results. This contradiction can be explained in two ways: a. the composition of the clay mineral constituents and b. the pore throat structure characteristics of the rock samples. First, according to the mineral composition analysis experiment (Table 2), kaolinite and illite smectite mixed layer clay minerals of the X-rock sample reservoir was relatively high (47%), which are water-sensitive minerals and are easy to expand in the presence of water, increasing the irreducible water saturation of the rock sample. Furthermore, according to the distribution diagram of the pore throat radius of the rock samples (Figures 3 and 4), although X-1 has a higher porosity than Y-1, Y-1 has a higher proportion of the small pore throat. The water in the small pore throat is not easily displaced during the displacement process; thus, Y-1 has a higher irreducible water saturation. Unlike blocks X and Z, the irreducible water saturation of block Y increases first and then decreases as the temperature increases, which can be analyzed from the structural characteristics of Y-1 Na montmorillonite. Montmorillonite is a t-o-t-type layered structure composed of two layers of Si–O tetrahedron sandwiched with a layer of Al–O octahedron. It exhibits the structural characteristics of water absorption resulting in expansion and dehydration leading to contraction, which are reversible under certain conditions (T < 300 °C). With an increase in temperature, the rates of hydration and expansion of montmorillonite increase gradually, and the irreducible water saturation of the rock sample increases continuously. However, when the temperature continues to increase above 100 °C, Na montmorillonite begins to dehydrate and contract, and the irreducible water saturation of the rock sample begins to decrease gradually. The remaining volume after dehydration at 130 °C is similar to that of the saturated water at 75 °C; thus, the curves of the irreducible water saturation and relative permeability of the oil phase under these two temperatures are consistent. In the clay mineral of the block X reservoir, the content of illite smectite mixed layer is less (6%), most of the montmorillonite are Ca montmorillonite, and the temperature of the desorbed water and interlayer water is in the range of 130–210°C; thus, the irreducible water at 130 °C is still significantly higher than that at 100°C.
Conclusions
We adopted an unsteady method to investigate the influence of temperature on the oil–water relative permeability curve of sandstone reservoirs in different blocks. The following conclusions are drawn:
The influence of temperature increase on the oil–water two-phase relative permeability curve is significant. With an increase in temperature within a certain temperature range, the relative permeability of the oil and water phases increases; the irreducible water saturation increases linearly, whereas the residual oil saturation decreases nonlinearly; and the hydrophilicity of the rock in the oil–water system becomes stronger. Owing to the differences in the physical properties of rocks, when the temperature is more than 100 °C, there is a small increase in the relative permeability of the water phase of the rock samples in the Y and Z blocks. Owing to the high content of water-sensitive clay minerals (Na montmorillonite) in the rocks in block X, Na montmorillonite dehydrates and contracts at the high-temperature condition (130 °C), resulting in a significant decrease in the irreducible water saturation and the relative permeability of the oil phase at this particular temperature. When the unsteady method is used for water driving, the law of water-cut rise in different blocks exhibits a “convex” trend. In the middle and low water-cut stages, the recovery rate is low and the water-cut rise rate is high. The water-cut rise rate generally slows down in the high water-cut stage. With high water driving oil efficiency, the high water-cut stage is an important oilfield production stage. The effect of the water drive significantly improves with an increase in temperature.
The results reported herein can aid numerical simulation studies of the blocks and consequent improvement in the oil displacement efficiency. However, there are certain limitations in using the unsteady method to study the displacement experiment. When the water saturation is low, there are few data measurement points, which cannot reflect the variation rule of the water yield correctly. The experimental method can be improved to increase the data measurement points when the water saturation is low to verify the accuracy of the experimental conclusions.
Footnotes
Acknowledgements
Declaration of conflicting interests
The author(s) declared no potential conflicts of interest with respect to the research, authorship, and/or publication of this article.
Funding
The author(s) disclosed receipt of the following financial support for the research, authorship, and/or publication of this article: This work was supported by (1) Science and Technology Key Research Plan (Industry) of Jinzhong (grant number Y201026); (2) Science and Technology Major Project of Shanxi (grant number 20191102002); (3) Scientific and Technologial Innovation Programs of Higher Education Institutions in Shanxi (grant number 201802112).