
Abstract
Emergency power system refers to a system that is composed of self-generating equipment in the building. By providing power support for emergency events such as power outages, it can keep the energy safety assurance. Usually, emergency power systems are independent and redundant. As a backup, their utilization rates are extremely low, resulting in excessive redundancy causing a lot of waste of resources and equipment. In this paper, a model integrating stand-alone emergency power systems with micro-network was proposed to improve power supply reliability in a more economic manner. Integrated emergency power system with the dispatch strategy of self-priority was established based on reliability and power demand of buildings simulated through Monte Carlo method. To evaluate the impact of integration, the total cost of integrated emergency power system was calculated including economic loss during power outages and system costs. Finally, genetic algorithm was used to obtain the optimal capacity and dispatch strategy of the integrated emergency power system by minimizing the total cost. Results showed that the reliability was improved, and the total cost was reduced to 80.05% by integrated emergency power system in the illustrated case.
Keywords
Introduction
The improvement of power supply reliability is a principal issue for modern society (Krupenev et al., 2020). Power systems should guarantee reasonable quality and continuity under optimal operating costs (Kumar, 2020). Since the 21st century, the safety and reliability of power system operations have greatly improved. However, power outages still occur occasionally as a result of extreme weather or even equipment and man-made faults (Chen et al., 2021; Marqusee and Jenket, 2020), such as India power shortage in 2010 and the New York blackout in 2019 (Meier et al., 2019; Xiao et al., 2021). The power grid is fragile, and various unexpected events can lead to unexpected results and serious losses. In addition to its power loss, it will also cause a large number of factory products to be scrapped and power blackouts in important places such as conference rooms and TV stations, which will lead to bad economic and political impacts. Even airport aircraft positioning systems will fail, threatening flight safety and so on. Power outages not only cause huge economic losses, but also threaten lives. Therefore, improving the reliability and safety of the power system is critical for developing the power grid. For a user, the utilization of emergency power system (EPS) is an effective means to ensure the power supply reliability and safety by installing some small and localized power generators to supply emergency power on the demand side, which are used to avoid an unacceptable impact during power outages (Marqusee and Jenket, 2020). Hospitals, airports, industries, transportation centers, commercial facilities, and others rely on EPSs to provide electricity for their critical loads during power outages. The diesel generator with the characteristic of power generation stability and fast start is the conventional configuration of EPSs. And in the design stage, the EPS is stand-alone in the buildings as it serves without connecting to other power systems, and its installed capacity is usually equal to or larger than the critical load.
Because the emergency power system is a standby power supply. It can only be used in case of power failure in the building. Therefore, its utilization is very low. During the 2003 blackout in North America's power system grid, over half of the standby generators in about 58 hospitals in New York failed to start and had to transfer patients to other hospitals (Zhang et al., 2013). Lessons learned from power outages around the world indicate that the situation of the EPS failure will increase as a result of inadequate management and maintenance, operational errors, equipment failures, etc. (Ahn et al., 2019; Xue et al., 2019). Therefore, research on the design and management of EPSs to improve safety as well as to reduce cost is necessary.
Literature review
The main purpose of emergency energy design and management research is to improve the reliability of power supply. Power system reliability refers to the ability of power system to resist the risk of outages in case of an emergency event, which has always been the research focus of scholars and technicians in the field of electric power around the world.
Generally, there are two methods of reliability calculation, namely analytical method and simulation method (Ahn et al., 2019; Kumar and Saxena, 2020; Teh et al., 2018; Xue et al., 2019). The analytical method is suitable for systems with a clear physical structure. A. C. G. Melo et al. (Zhu and Zhang, 2019) proposed a simple method for evaluating the frequency and duration (F&D) of generation and transmission systems. This method uses conditional probability to represent the frequency of each component, calculates the frequency and duration of system. Due to the gradual development of power grid and the complexity of power system, Monte Carlo simulation (MCS) method is used more and more in reliability research, which can greatly reduce the calculation time of reliability evaluation (Ali Kadhem et al., 2017; Krupenev et al., 2020). In Ref. (Yu et al., 2019), a MCS-based framework is proposed to calculate the loss of load expectation (LOLE), which is used as a risk measure to study how the available power capacity of Taiwan can fail to meet the customer load. It can evaluate the reliability of the power system with high penetration of renewable energy under the impact of energy policy by 2025. Fan Chen et al. (2019) established a nonsequential MCS-based method for the reliability assessment of composite power systems with wind farms to evaluate the capacity credit of wind farms considering both wind power correlation and transmission network constraints.
With the development of recent years, more analytical methods are used. In (Hua et al., 2019), the short-term aggregation algorithm based on the semi-Markov process (SMP) is modified which can improve the accuracy of the short-term reliability indices. This novelty method can quickly calculate the combined transfer rates by matrices combination and deleting the nonexistent states and transitions. Hidden Markov models were used to investigate the power output of the renewable energy sources in Bhaumik et al. (2019). Adefarati and Bansal (2017a) use expected energy not supplied (EENS), loss of load expectation (LOLE), and loss of load probability (LOLP) to obtain the reliability performance indicators such as, in addition to utilizing an optimization tool in the MATLAB environment to investigate the environmental and economic effects of renewable energy resources in a power system.
Nowadays, seeking a balance between reliability and economy is an important issue that power systems need to address today. The economics and reliability of power systems are mutually constrained. In the process of power reliability assessment, the severity of accidents is determined by economic evaluation, rather than simply using electrical quantities such as load shedding and power outage duration (Bhattacharyya et al., 2021; Chao et al., 2007). The economics of sacrificing system operation to ensure the reliability of the system operation will be reconsidered. At present, many studies have proposed the customer damage function (CDF) (Kim et al., 2020), loss of load value (VOLL) (Swinand et al., 2019), expected unserved power (EUP) (Ma et al., 2021), EENS (Prajapati and Mahajan, 2021), and other indicators, combining reliability with economic for analysis. A bidding segment being marginal is computed via the probabilistic production simulation approach (Ma et al., 2021) while considering uncertainties of both demand and supply sides. At the same time, the additional cost of meeting the supply reliability requirements of each user was also studied. The cost of energy not supplied (CENS) represents the average cost within the interruption interval. According to the EENS, the power outage loss is estimated by modeling the outage cost as a function of the unprovided energy, regardless of the interruption duration and frequency (Adefarati and Bansal, 2017b). In addition to the direct economic loss caused by power outages, it is also necessary to calculate the social indirect costs caused by power outages. During a sustained power outage, industries that are dependent upon the utility sector also get affected. Also, other industries which are downstream in their supply chain will be influenced (Bhattacharyya et al., 2021).
EPS is one of the important means to improve and optimize the reliability of the distribution system in a regional area. In the study of the reliability of power systems and the interruption of economic losses, EPSs are always mentioned. In previous studies, they will only participate in the study as independent systems when calculating the reliability of a single building (Kroposki, 2017). Marqusee and Jenket (Marqusee and Jenket, 2020) only analyzed the continuous run time reliability of single emergency diesel generators during a grid outage through additional metrics. At the regional level, most of the EPSs are still considered as a component of the grid, only calculating its capacity into the formula (Marqusee, et al., 2021b; Xiang, 2017).
However, there is less research on the contribution of the EPS itself to reliability improvement of the power supply system (Marqusee, et al., 2021b). As the only power supply facility in case of power outages, EPS is specialized. But in fact, during power outages, the power supply system composed of the EPS and users can be regarded as a small-scale microgrid. How to optimize and maximize the role of EPS? Previous studies have paid little attention to this issue.
Contribution
Integration of the stand-alone emergency power systems (SEPS) in a building complex is a way to improve the reliability and reduce the total costs based on the concept of energy network (Cortés et al., 2020; Marqusee, et al., 2021a). By connecting stand-alone emergency power subsystems with a micro-network, the integrated emergency power system (IEPS) can cooperate and be backup for each other in the building complex. It can not only make full use of resources and avoid idle equipment, but also increase the guarantee of power supply availability. However, the reliability and economics of power supply have always been conflicting parameters (Jiang et al., 2019). With the increase of the installed capacity, the system cost will grow but the power outage loss is in the opposite. Therefore, this paper is focused on improving the reliability and minimizing the cost of the IEPS.
In this paper, an IEPS model was proposed to improve the reliability of the building complex and reduce the system cost at the same time. First, a power outage probabilistic model of the building complex was established by MCS to calculate the Average Service Availability Index (ASAI), System Average Interruption Duration Index (SAIDI), and EENS, which were used as the power supply reliability evaluation indices. After that, taking self-priority as the basic dispatch strategy, the IEPS model was simulated in MATLAB. The EPSs supply the power to their own buildings preferentially according to the reliability requirement and the emergency power demand of the buildings, and the excess power is dispatched to other insufficient buildings through the micro-network. Third, taking the total cost model including economic loss during power outages and system costs as the objective function, genetic algorithm was used to obtain the optimal configuration and dispatch strategy. Comparing the ASAI, SAIDI, and EENS as well as the total cost of the SEPS and the IEPS, the superiority on improving reliability and economic performance of the proposed model was proven. Finally, a sensitivity analysis of some factors influencing the total cost of the building complex was carried out in this paper. The research flow of this paper is shown in Figure 1.
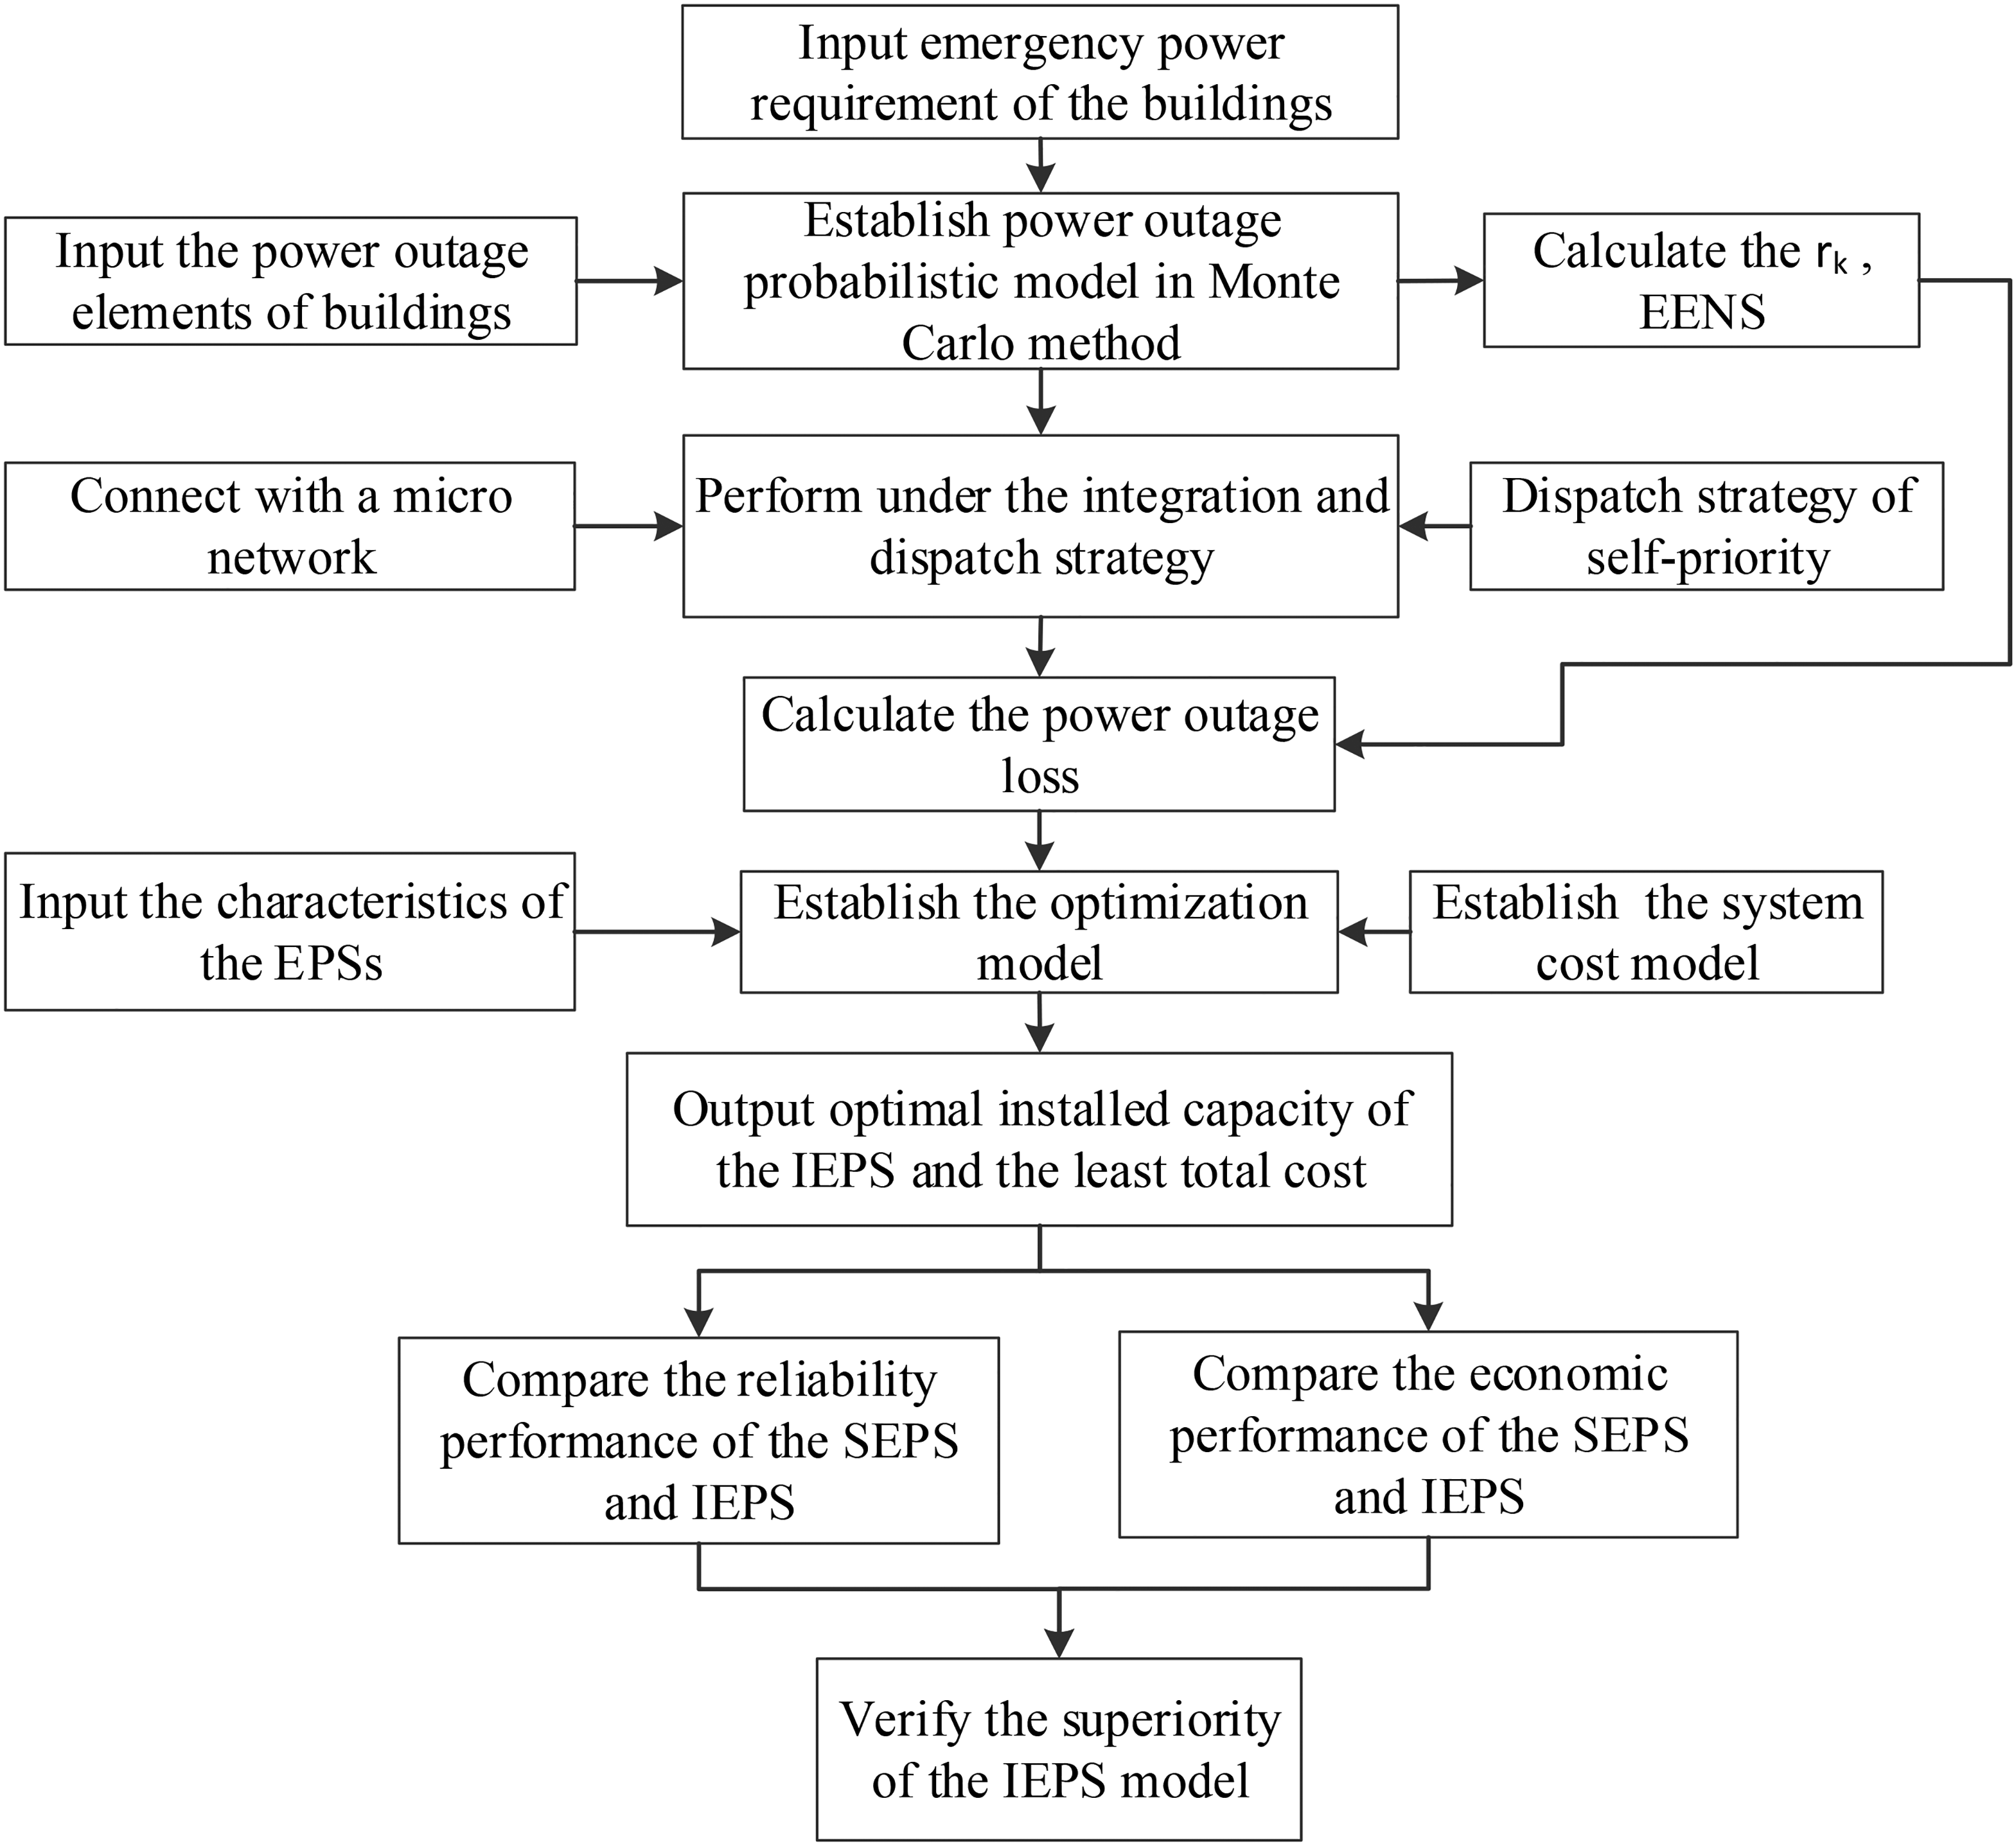
The research flow diagram.
Therefore, this paper is organized as follows. Section 2 presents the methodology of the IEPS model in the building complex. Section 3 develops the application of the model by a case study in Shanghai and the results simulated by the model are compared and discussed. Sensitivity analysis is performed in Section 4, and the conclusions are given in Section 5.
Methodology
The power outage probabilistic model of a building complex
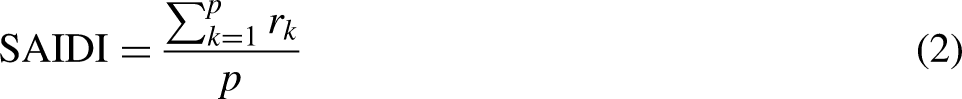
The RIA of power system
A reliability index that scales to compare the appearance of a distribution system is assigned to determine the reliability of a service system or an electrical feeder (Jafar et al., 2019; Jiang et al., 2018). The method that uses indices to evaluate the power supply reliability is called as the Reliability Index Assessment (RIA) (Sucita et al., 2018). There are indices of reliability that is often used in assessing the power supply reliability is ASAI (Bai et al., 2015), SAIDI (Meier et al., 2019), EENS (Groissböck and Gusmão, 2020). ASAI is the customer hours of available service divided by total customer hours demanded, representing the proportion of the time that the system can supply power; SAIDI is the average power outage duration of all users in 1 year, representing the average time of power outage per user caused by the system; EENS is the expected energy load that is not delivered at the load point in the demand side because of unexpected power outages, representing the amount of power that the system cannot supply (Afzali et al., 2019; Eryilmaz et al., 2021; Koh et al., 2015; Prajapati and Mahajan, 2021). These three indicators can reflect the power supply reliability from different points of views and dimensions, which can more clearly and directly reflect the power supply reliability.
ASAI, SAIDI, and EENS can be expressed mathematically as equations (1) to (3).


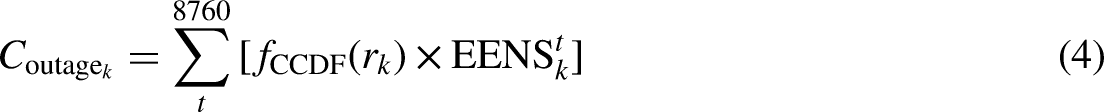
Power outage loss calculation
The power outage loss is divided into direct economic loss and indirect economic loss. The former refers to losses incurred during and after the actual outage; the latter refers to additional costs incurred by users to reduce the outage, adjust their activities, or adopt standby energy sources (Shuai et al., 2018). The direct economic loss increased sharply at the instant of power outages and increased with the duration of power outage. However, the growth rate decreases with the duration of outage (Adefarati and Bansal, 2017a). The indirect economic loss increases with the duration of the outage, and the growth rate of different types of building losses is different. The composite customer damage function (CCDF) is used to express the relationship between outage loss and outage duration, considering the loss characteristics of different types of users (Ericson and Lisell, 2020). The CCDF is obtained as follows:

According to Swinand et al. (2019), the composite customer damage function can be estimated as equation (3).

The power outage probabilistic model based on MCS
The MCS method is based on the principle of mathematical statistics, which is also known as the stochastic simulation method. This method uses large-scale stochastic number sequences to simulate complex systems. As the number of simulations increases, a stable conclusion can be obtained by averaging the estimates of each statistic or parameter, thereby receiving certain parameters or important indexes. Its advantage is that it considers the probability of all situations in which an event may occur. Power outages are unpredictable, but a probabilistic model based on MCS can be established according to the failure rate, failure duration, and repair rate of the load point to obtain AISI, SAIDI, and EENS of the buildings. The MCS process for this research is as follows:
Enter the setting parameters Simulated the power outage start time and the power outage duration of each load point
Input basic data of the region, building, and each load point including the failure rate
To ensure the fineness of the analog data, combined with the power emergency device startup characteristics, select the appropriate time interval and split the year into N time segments. Based on the reliability parameters of the load point, the time point at which the power outage occurs will be randomly obtained.
The power outage duration is conformed to the standard normal distribution, and the corresponding average power outage duration is taken as the expected value of the standard normal distribution. The power outage duration is randomly selected in this distribution.
[0,1] is used to record whether there is power outage in this time interval. 0 means power outage has not happened and 1 is power outage occurrence, as shown in equation (5). The power outage state matrix of each load point divided by the time interval in a year is obtained. Figure 2 shows the power outage state matrix of a load point. As the matrix reveals, the power outage occurred at the 2Nth moment, and the duration of the outage is Calculation of power loss load and the power outage duration of the building

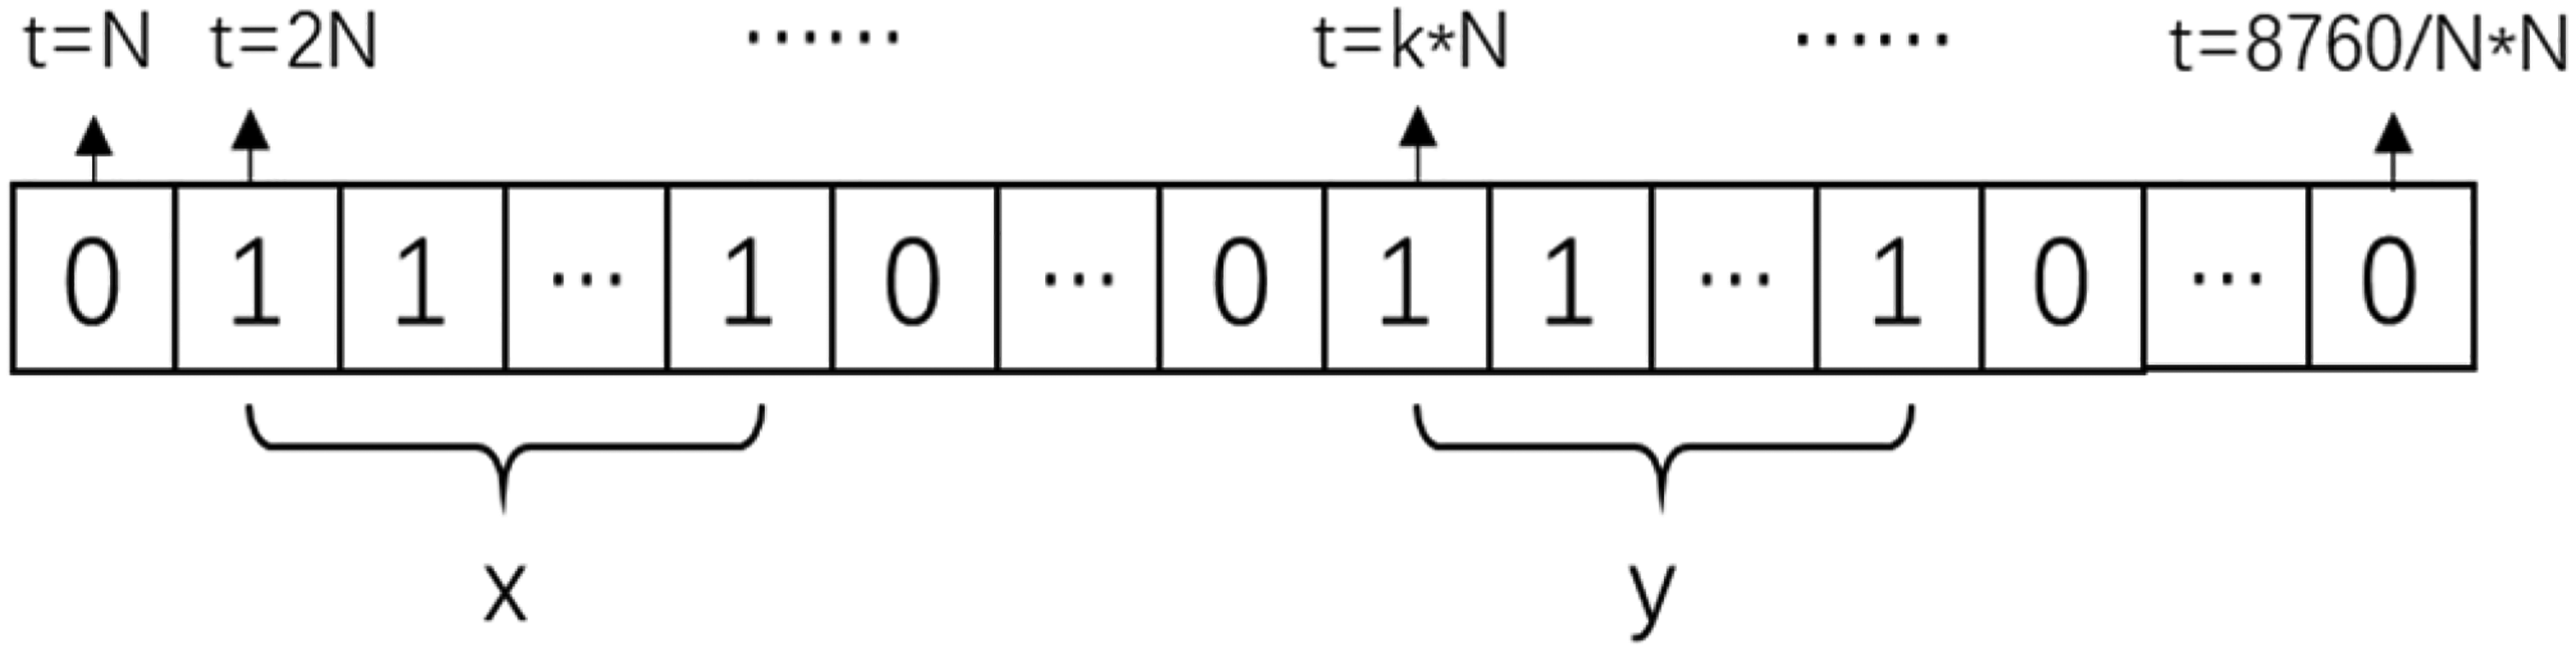
The example of power outage state matrix.
According to the last step, the power outage state matrix of each load point is obtained. The matrix is multiplied by the critical load of each load point to obtain the outage load loss of each time interval. The load point outage loss of each time interval is accumulated. When there is outage loss, the power outage status of the building is recorded as “1”. Therefore, we can obtain the power outage status and power outage load loss of the building, as shown in Figure 3.
Calculation of EENS and annual outage duration (
The accumulation of power outage state matrix.
In the same way, the building outage loss of each time interval is accumulated. When there is outage loss, the power outage status of the building complex is recorded as “1”. Therefore, we can obtain the power outage status and power outage load loss of the building complex. Then, the EENS for each time interval is obtained. And the cumulative time interval is the power outage duration
MCS can simulate all cases of power outage occurred in the building complex and obtain the EENS every simulation interval. Therefore, we can calculate the reliability assessment indices (e.g. AISI, SAIDI, and EENS) of the building complex.
The IEPS model
In a building complex, the possibilities of the power outage in each building are different. Once the power outage occurred in the building, the EPS in the outage building will be able to support the critical load of its own building. Usually, the EPS is installed independently in each building for ensuring its own building. It is found that poor management and maintenance of the separate EPSs will reduce the reliability of the system as well as increase the operating cost. Thus, the IEPS model was established by connecting SEPS of adjacent buildings with micro-network to form mutual standby system and help each other. By following the dispatch strategy of self-priority, each emergency power subsystem supplies the power to their own buildings preferentially according to the reliability requirement and the emergency power demand of the buildings, and the excess power is dispatched to other insufficient buildings through the micro-network.
Emergency power demand after adopting EPS
The EPSs in the buildings are expressed as EPS1, EPS2, …, EPS
i
, …, EPS
k
, …, EPS
p
.

The costs of EPS
The costs of the EPS (


Integration and dispatch model
Generally speaking, EPSs are installed independently in every building. If one of them is broken, the others cannot provide help, as shown in Figure 4(a).
The schematic diagram of stand-alone emergency power system (SEPS) and integrated emergency power system (IEPS). (a) SEPS. (b) IEPS.
In a building complex, by connecting stand-alone emergency power subsystems and being backup for each other, the IEPS can serve several buildings in a more safe and economic manner (Figure 4(b)). Therefore, a micro-network of the building complex was created to establish the integration and dispatch model of EPSs in a building complex to achieve this purpose.
First, taking self-priority as the basic dispatching strategy, EPSk should guarantee its own emergency power supply of buildingk. The reliability of EPSk is
The logic diagram of the integration and dispatch model.
And the integration and dispatch process is obtained as follows:


The optimization model
Figure 6 shows (Vásquez and Vaca, 2012) an increased level of reliability that usually involves significant investments in equipment and infrastructure. And a reduction in reliability involves financial power outage loss of users because of the increase of interruptions. For these reasons, it is essential to figure out the optimal installed capacity of the EPSs to minimize the total cost of reliability (composed by the power outage loss and the necessary cost to improve the level of reliability).
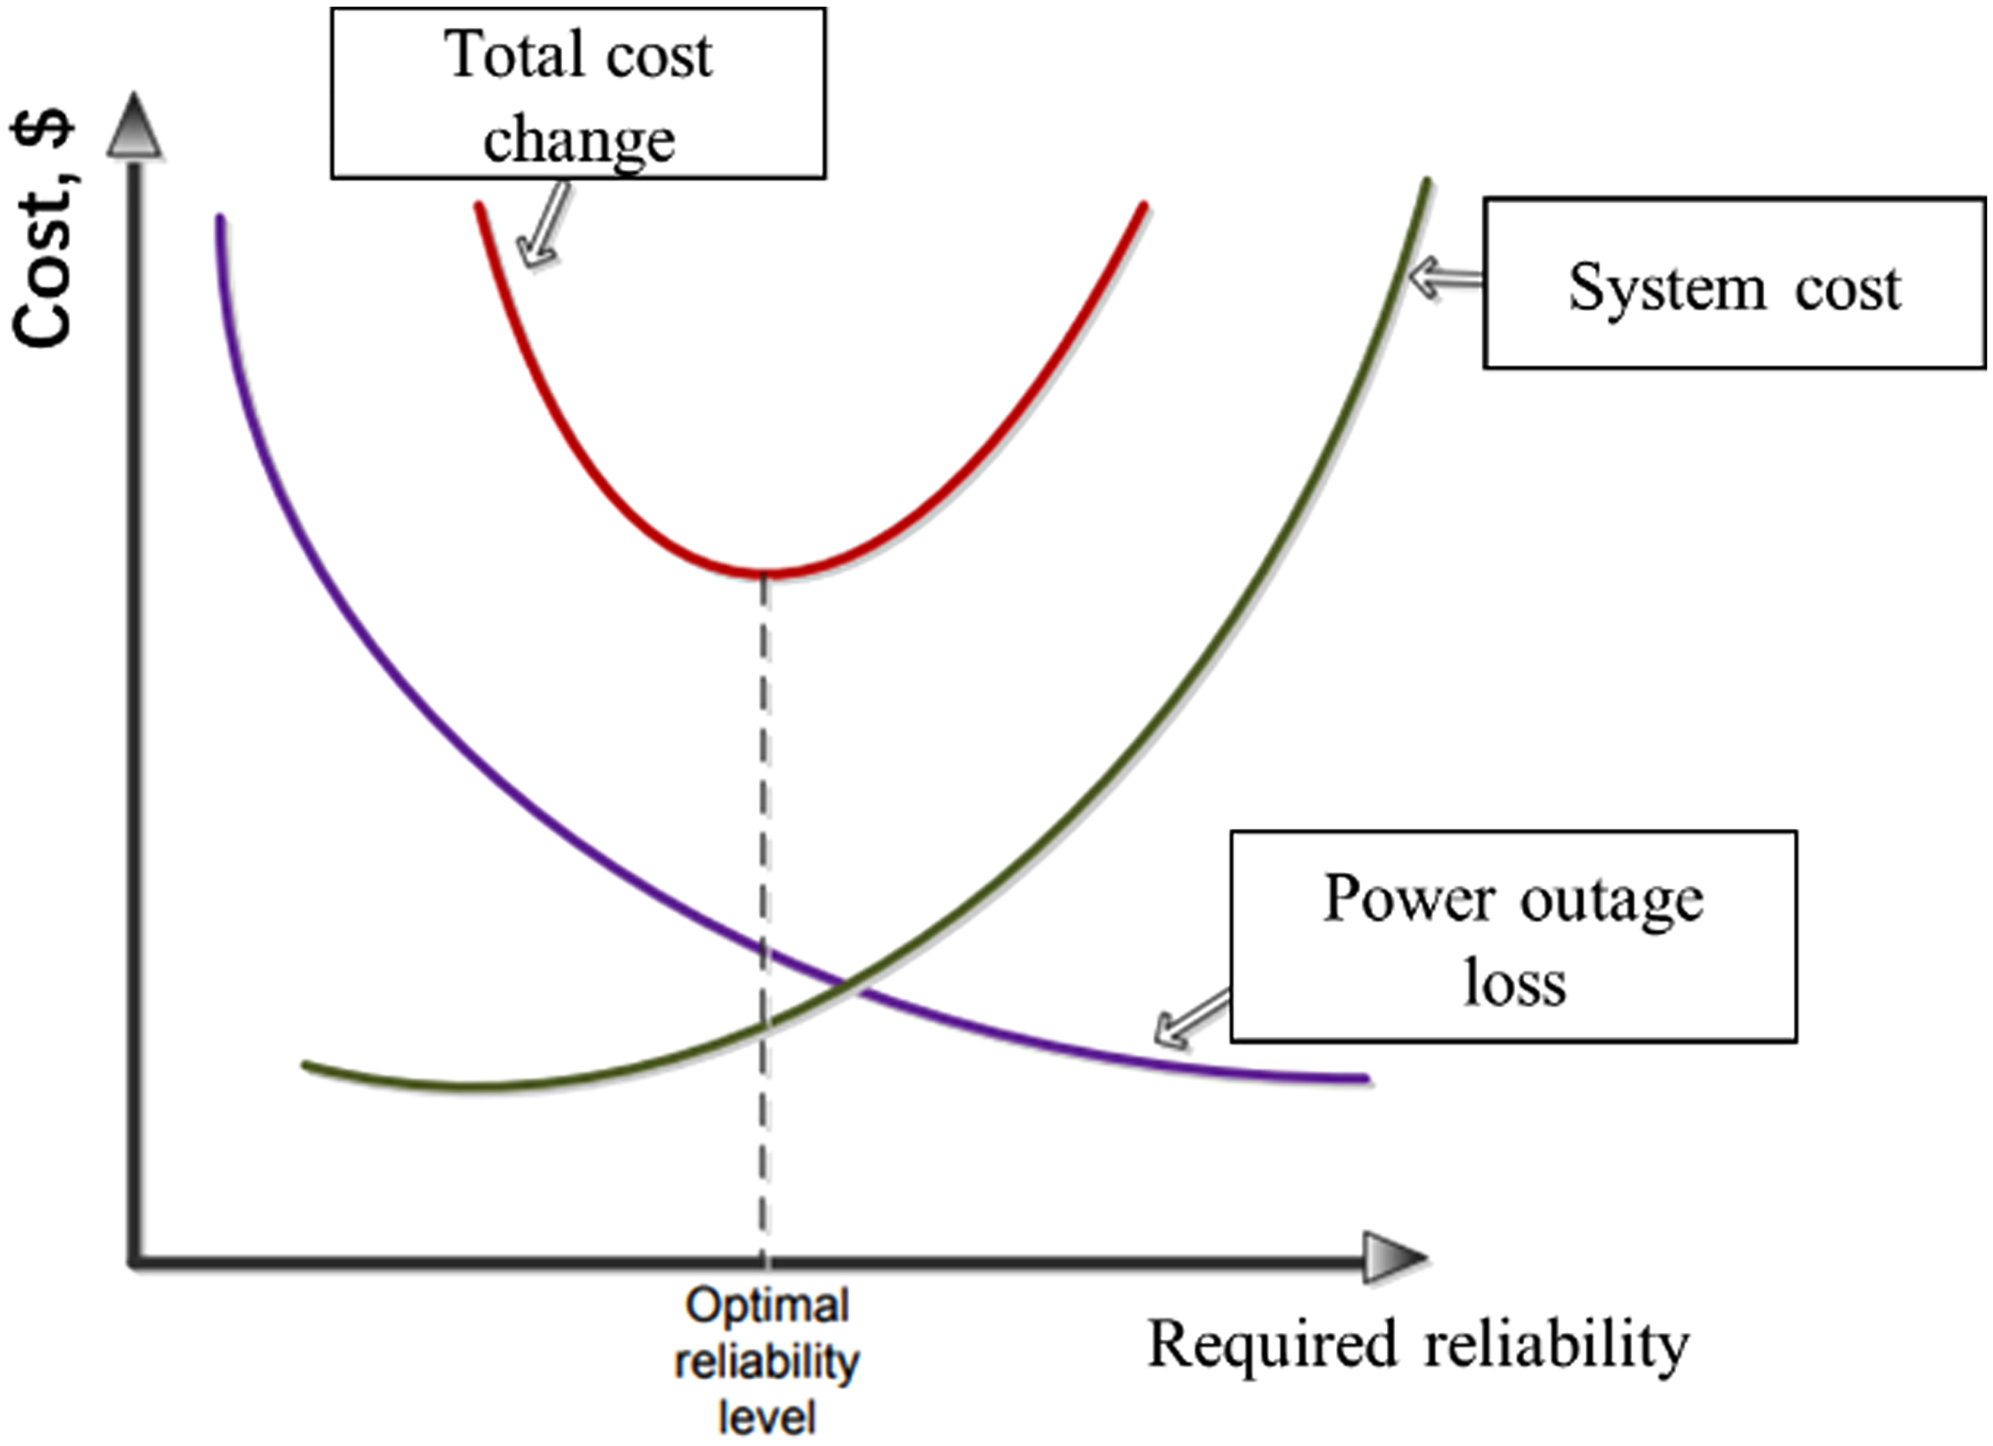
Cost changes with the increase of the reliability (Vásquez and Vaca, 2012).
The main objective function of this research work is to improve the reliability of a power system as well as to minimize the costs of IEPS while satisfying the power requirements of the demand side and the system constraints. Mathematically, the objective function model, the total cost (

The constraints are as follows:
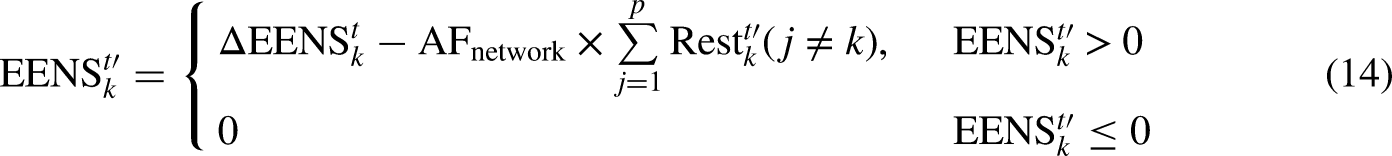
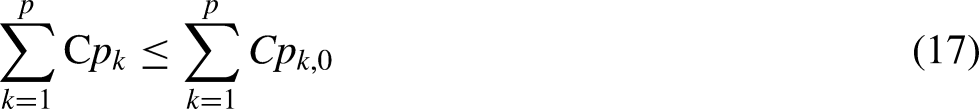
To optimize the capacity of the EPS, it is necessary to reduce excess investment. Therefore, the total installed capacity of the new scheme, that is, the sum of the installed capacity of each subsystem of the new scheme should be less than or equal to the initial installed capacity. The reliability of the building complex should be improved, which means that the EENS of the building complex should be In this paper, genetic algorithm is used to solve the optimization model. The genetic algorithm optimization logic diagram is as follows (Figure 7).

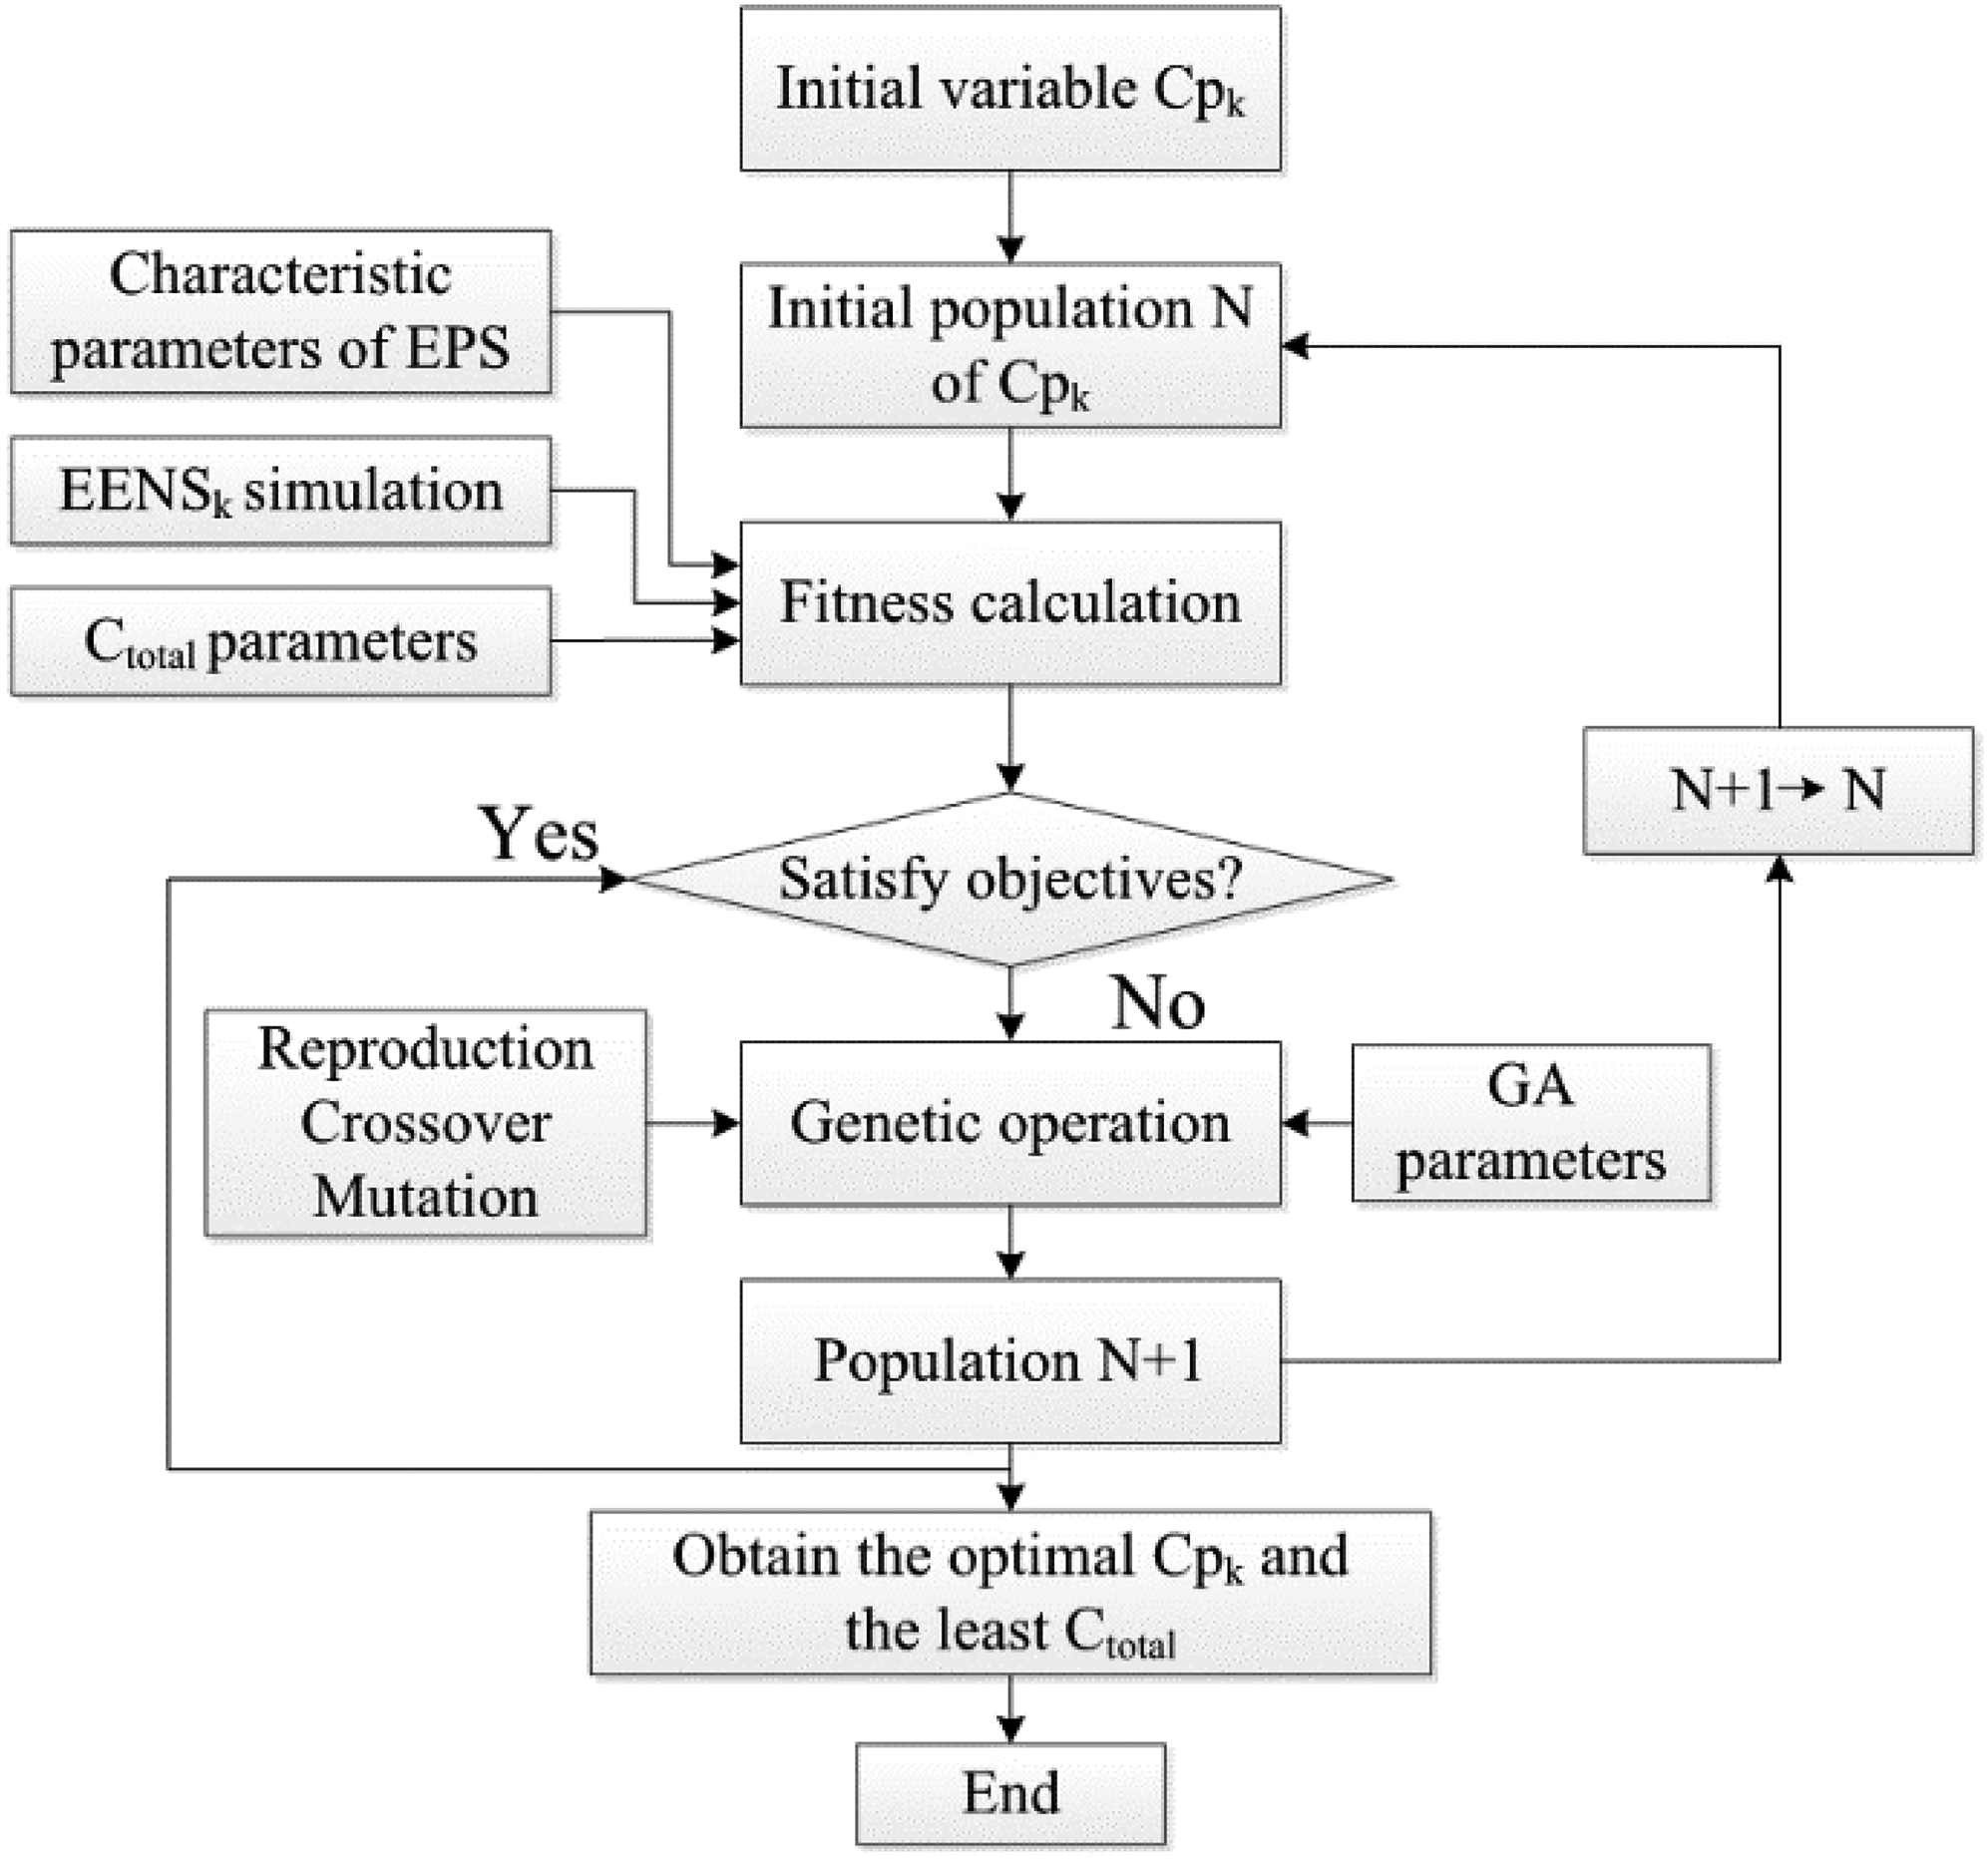
Genetic algorithm logic for the optimization model.
The application of the IEPS model
Application scenario introduction
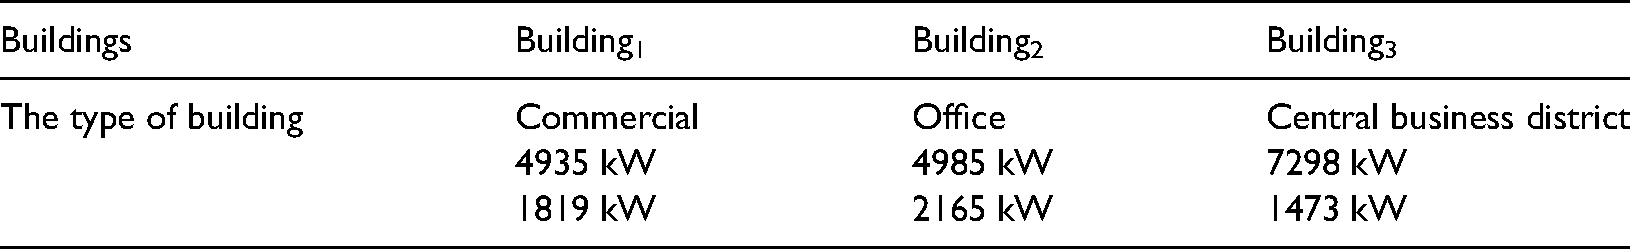
In this section, the IEPS model was verified in a building complex in a certain region of Shanghai, China. The building complex included three adjacent buildings, which were a commercial high-rise building (Building1), an office high-rise building (Building2), and a central business district building (Building3). The schematic diagram of the distribution network of the building complex and the reliability parameters are shown in Appendix. The information of the three buildings is shown in Table 1.
The load of the building complex.
The EPSs of these three buildings are adopting diesel generators, which is a common form of backup power. Because the three EPSs all adopt diesel generators, the reliability and technology parameters are the same except for capacities. The parameters are shown in Table 2.
The parameters of emergency power systems (EPSs).
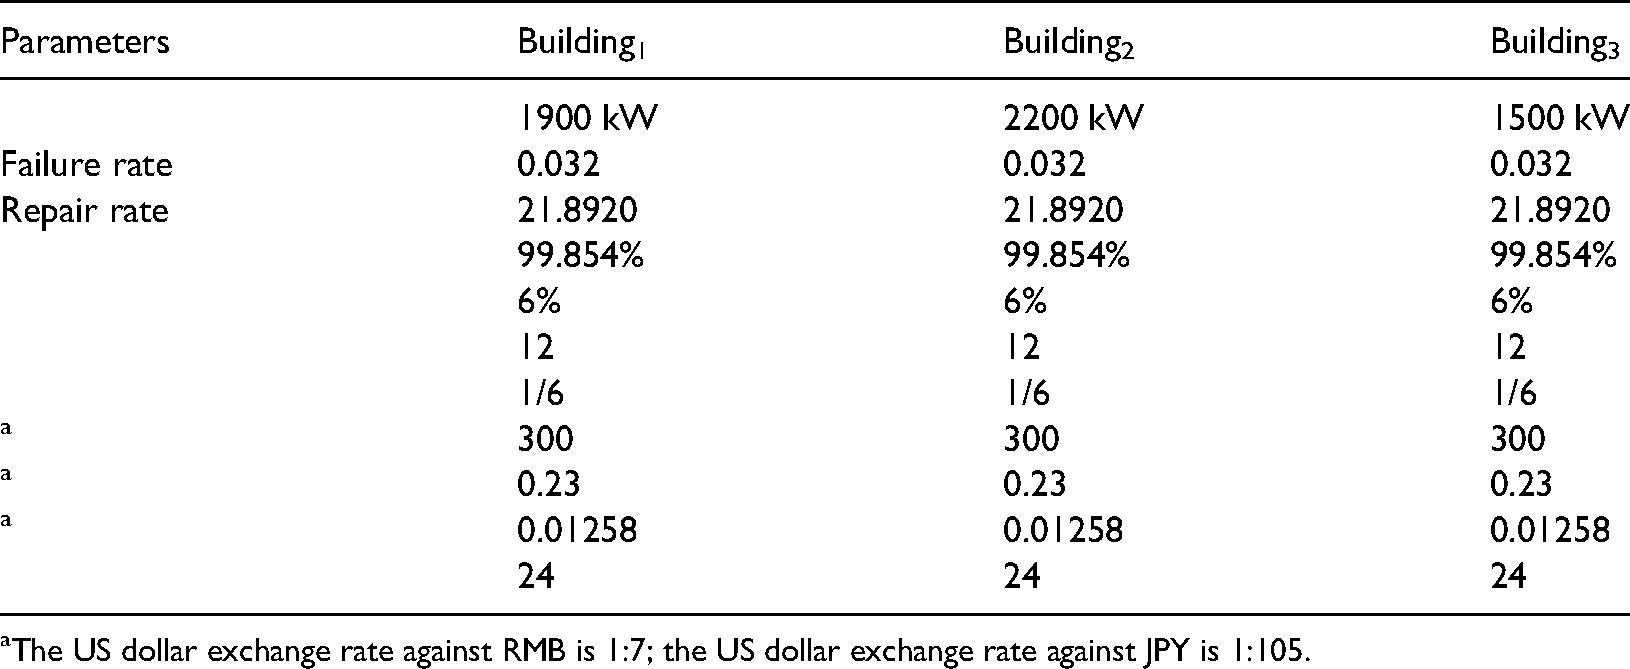
The US dollar exchange rate against RMB is 1:7; the US dollar exchange rate against JPY is 1:105.
Results of the power outage probabilistic model
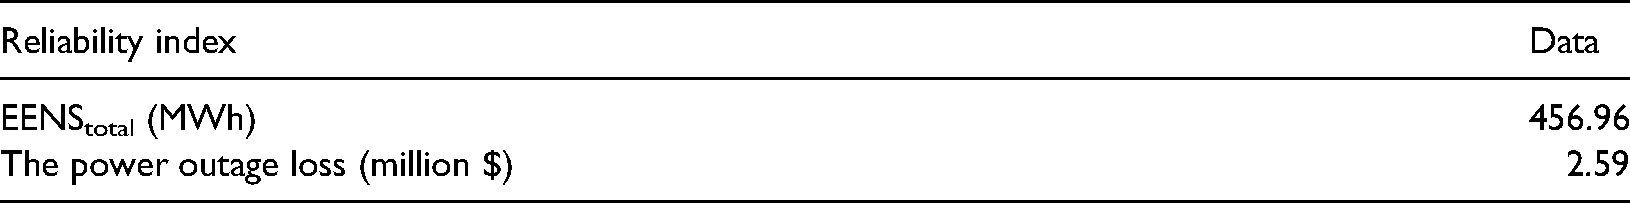
To simplify the simulation of the startup phase of the emergency system, select 10 min as the interval and split the year into 52,560 time periods. According to the power reliability parameters of load point (the information for details of the load point is shown in Appendix), the EENS of three buildings without adopting EPSs simulated in MCS is shown in Figure 8. According to the simulation results of MCS,the total EENS and power outage loss of the building complex can be calculated, as shown in Table 3.
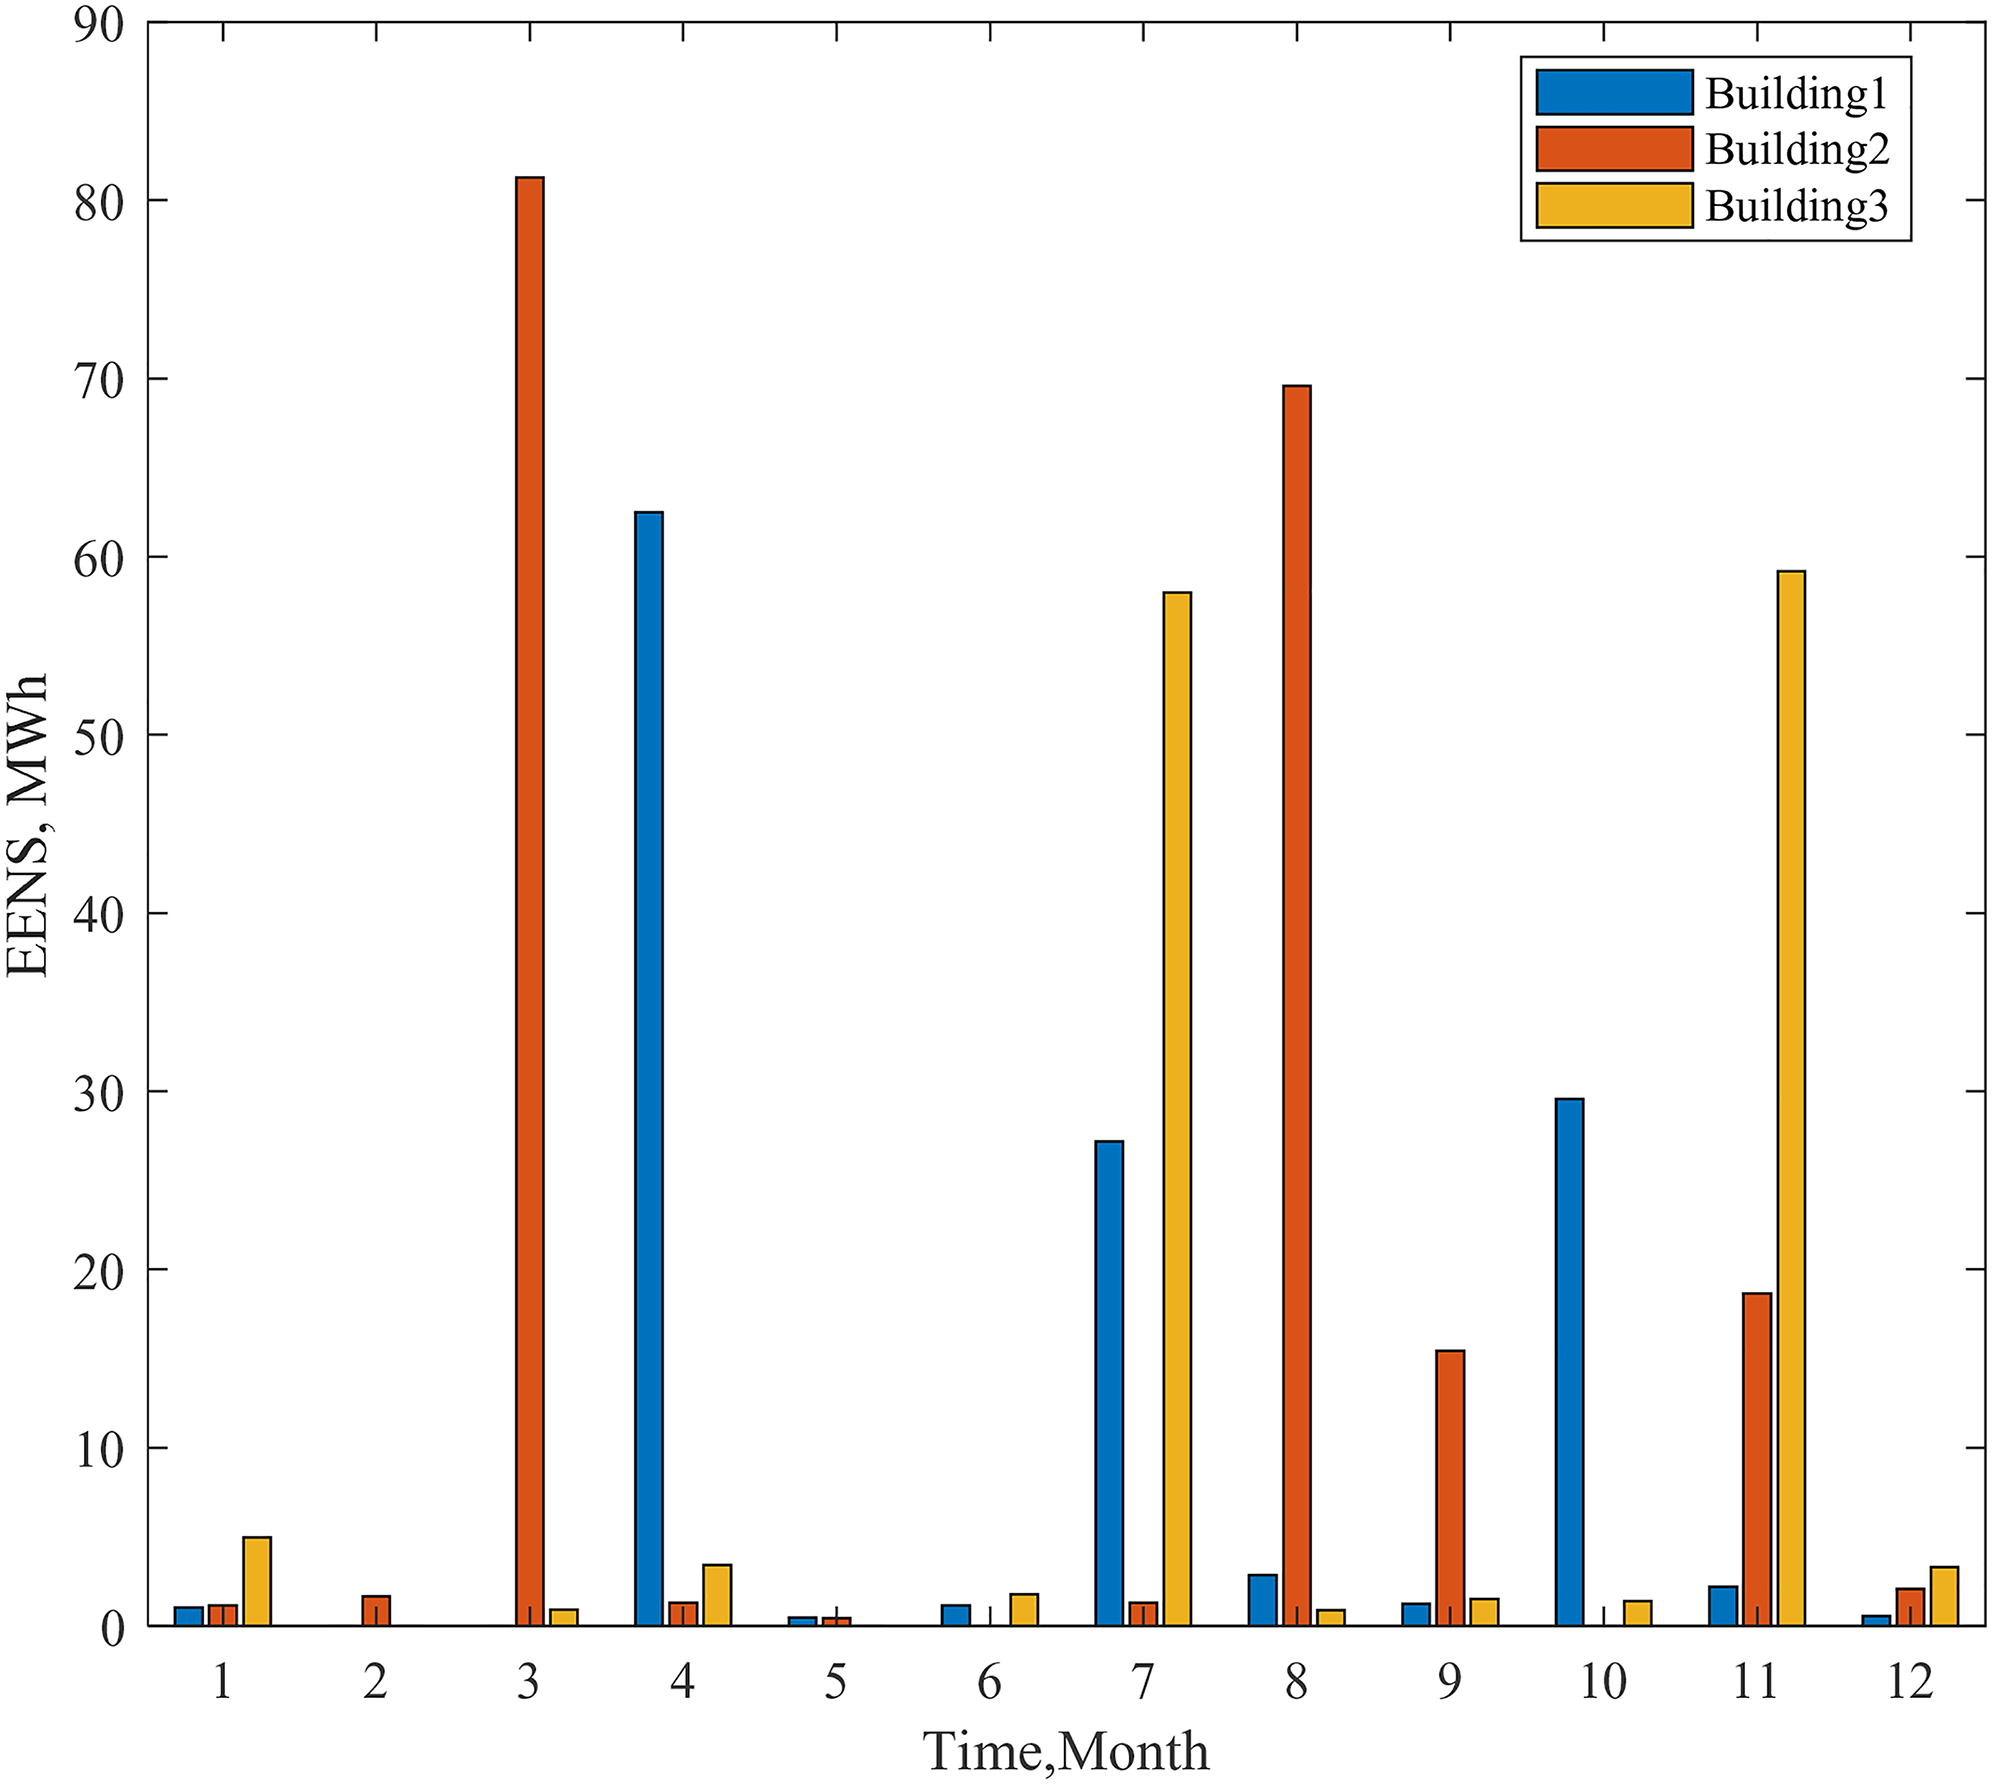
Expected energy not supplied (EENS) of three buildings simulated by Monte Carlo simulation (MCS) every month.
The expected energy not supplied (EENS) and power outage duration of the building complex.
Results of the integration and dispatch model
Two systems are compared in this section to analyze the advantage of integration and dispatch model:
SEPS: There are stand-alone EPSs in the three buildings, and they cannot be integrated and dispatched to each other. In SEPS, the rest
k
is 0. IEPS: The EPSs are integrated and dispatched through the micro-network in IEPS.
First, we compared the reliability and economic performance when the building complex with the SPES and IEPS are under the same capacity. Figure 9 and Table 4 were obtained after comparing the simulation results of the SEPS and IEPS (Table 5).
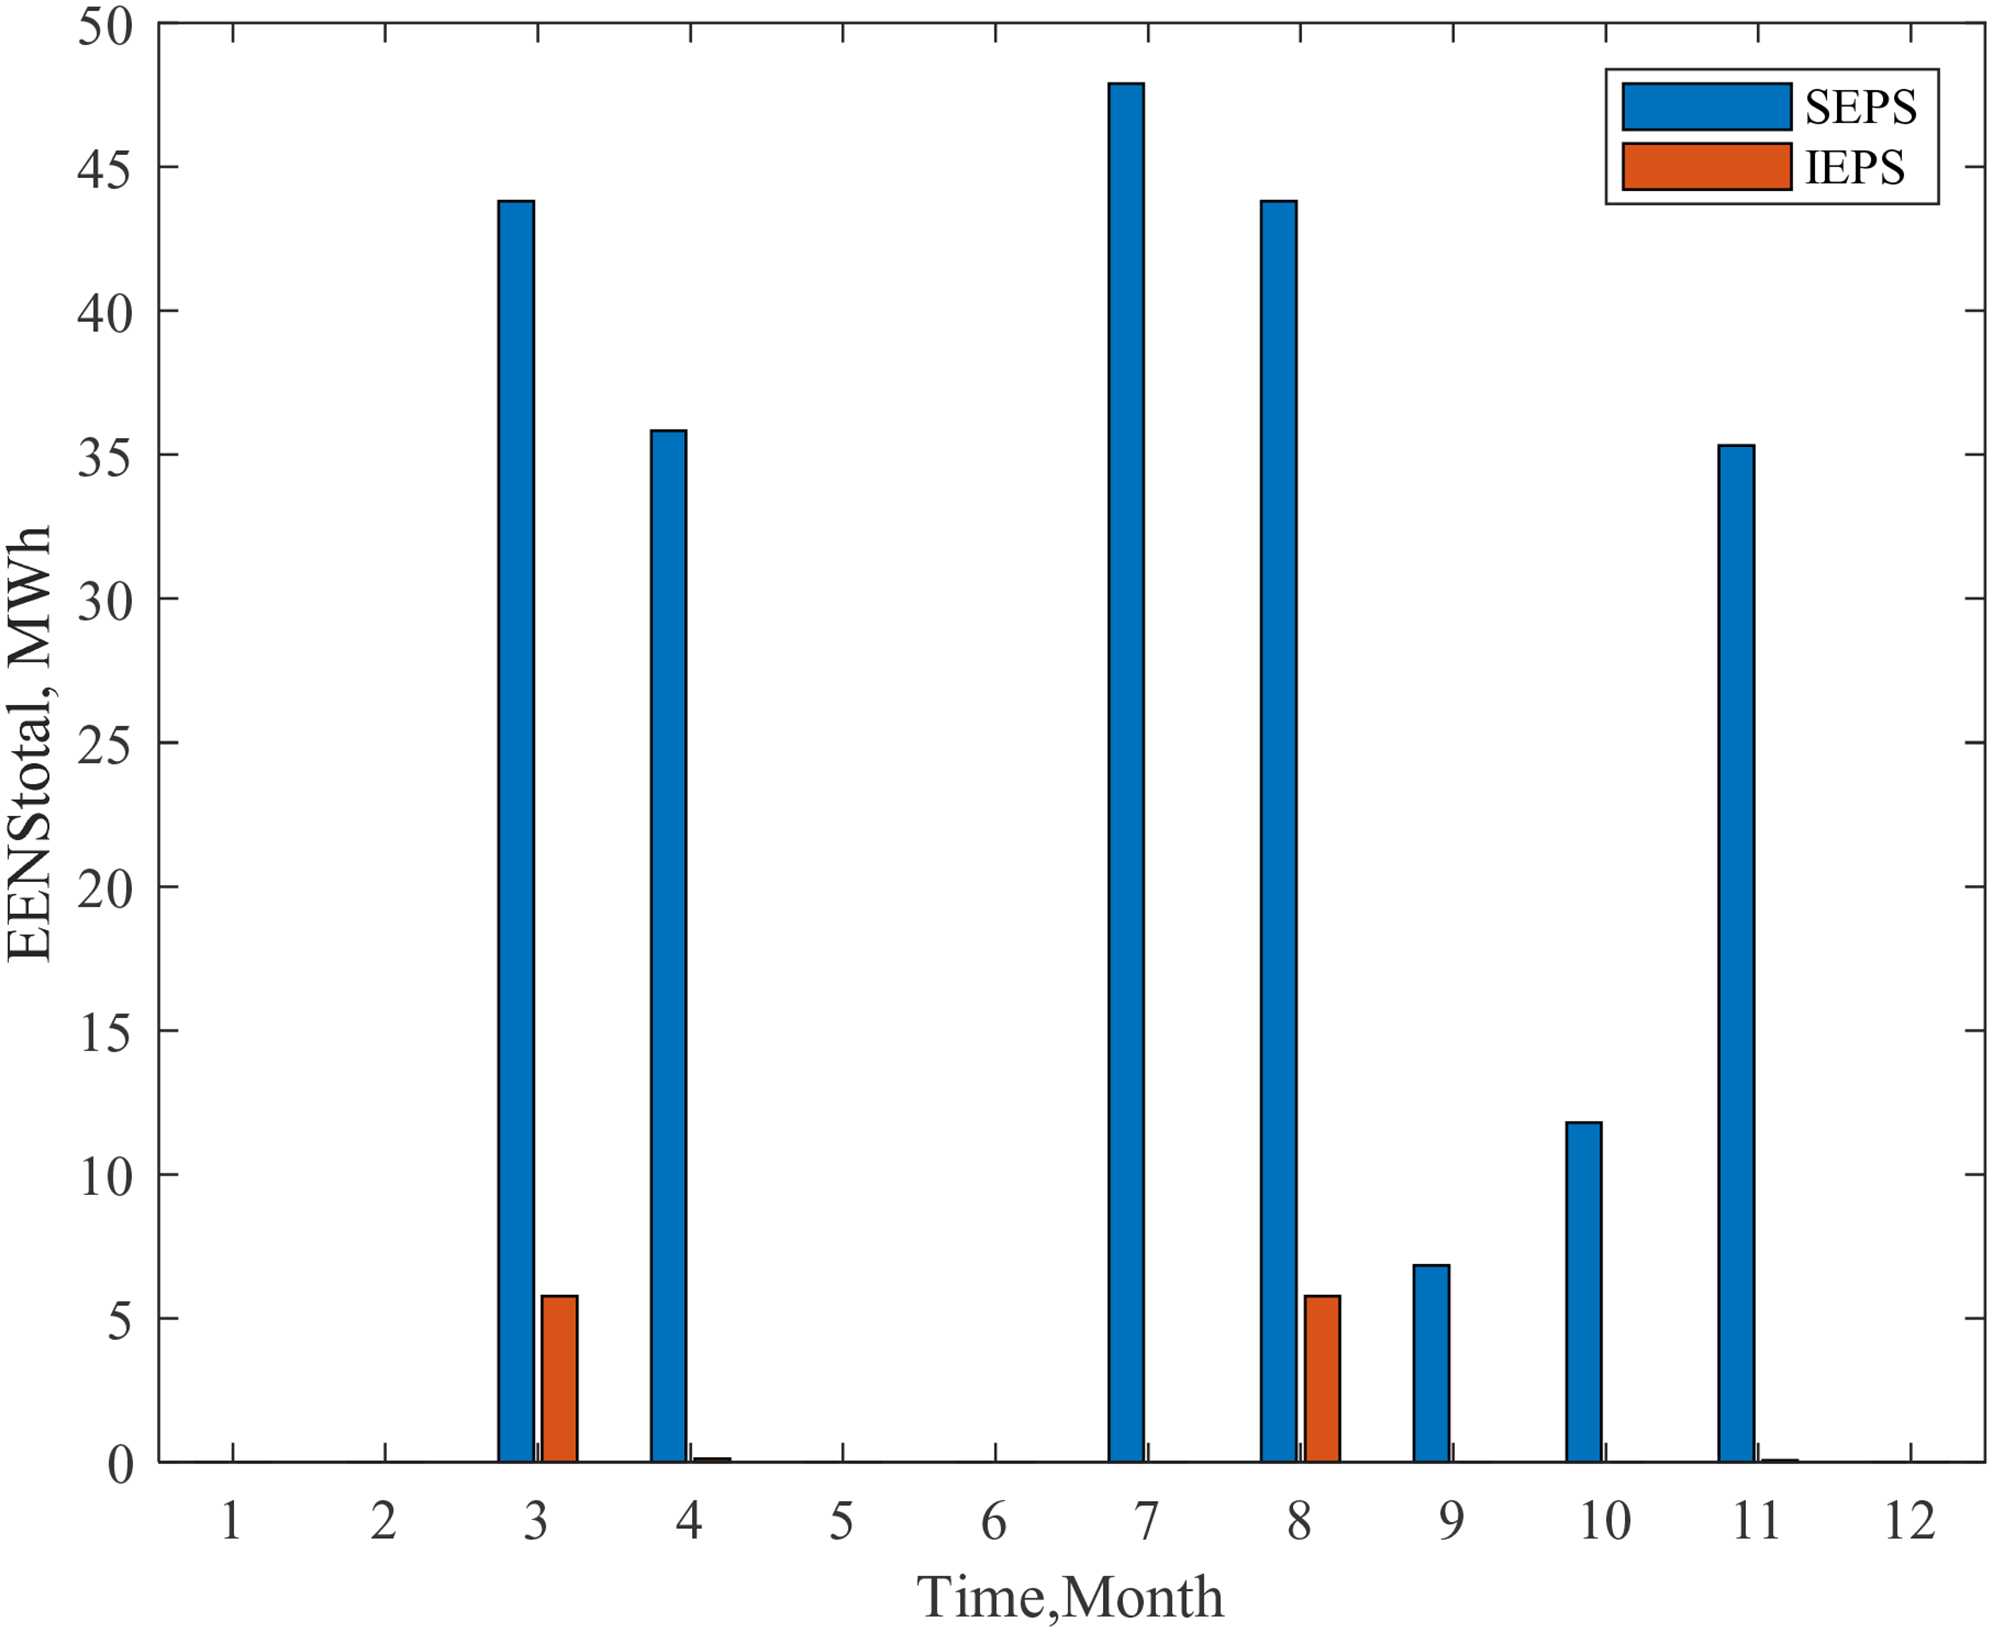
The EENStotal of the building complex with stand-alone emergency power system (SEPS) and integrated emergency power system (IEPS) under the same capacity.
The comparison on reliability performance of the stand-alone emergency power system (SEPS) and integrated emergency power system (IEPS) with the same capacity.
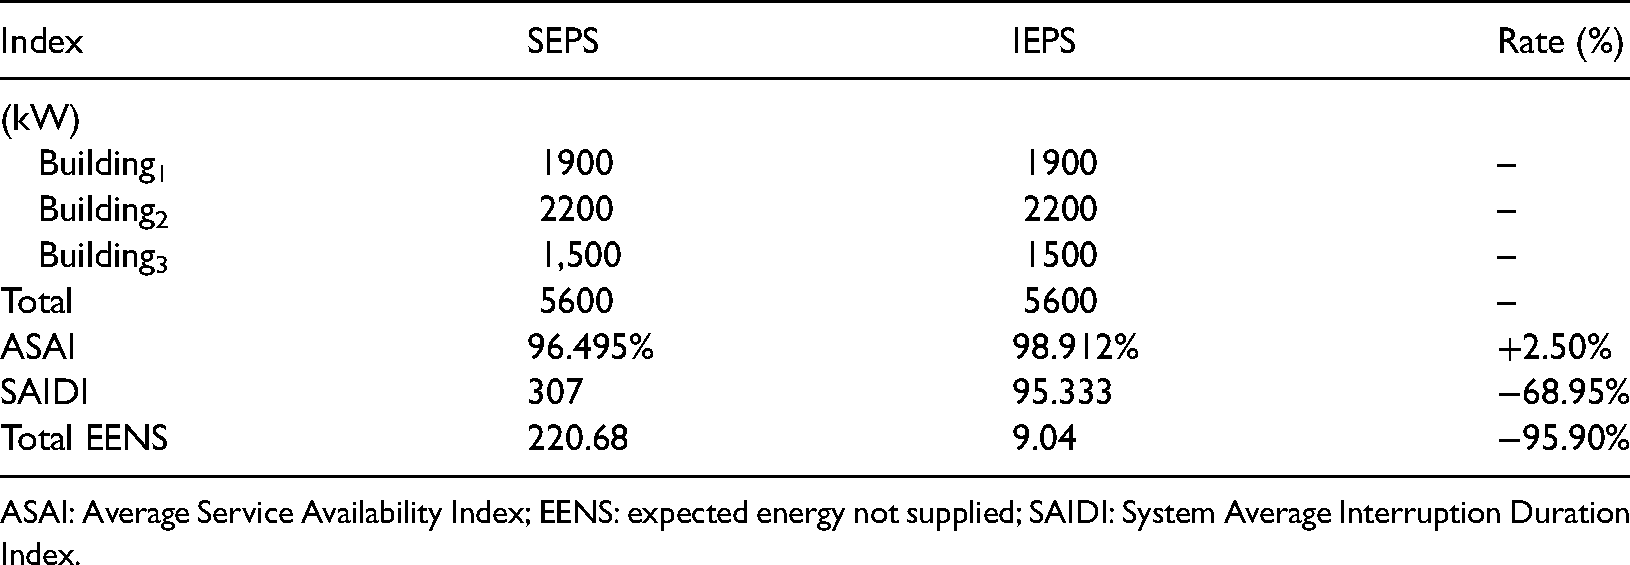
ASAI: Average Service Availability Index; EENS: expected energy not supplied; SAIDI: System Average Interruption Duration Index.
The comparison on economic performance of the stand-alone emergency power system (SEPS) and integrated emergency power system (IEPS) with the same capacity.
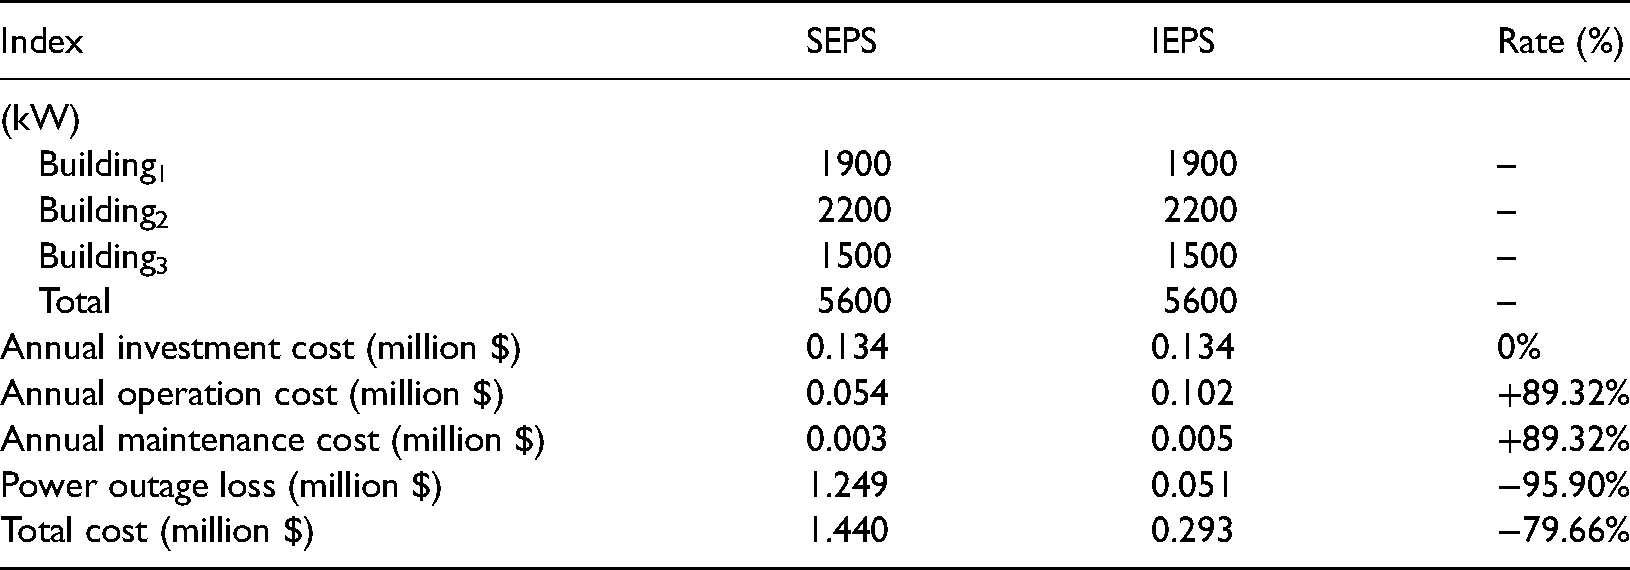
The results showed that after integrating the EPS, the power supply reliability of the building complex improved as the ASAI improved by 2.50% from 94.495% to 98.912%, SAIDI declined by 68.95% and the total EENS reduces by 95.92%. Once the EPSs can integrate with each other, when power outages occur in one of the buildings, not only its own emergency system can provide power, but also the emergency systems of the other two buildings can also be used as a supplement. In this case, the IEPS can make full use of the EPSs in the building complex, which increases the support time and capacity compared with the SEPS. Therefore, the total EENS is cut down significantly. It is indicated that the integration of EPS had a great effect on the improvement of the power supply reliability. Under the same capacity of the EPSs, the power outage loss is saved by 95.90% with the integration and dispatch model leading to a 79.66% reduction of the total cost, which proves the superiority of the IEPS on reliability and economic performance.
Solution of the optimization model
According to Table 1, the largest initial installed capacity among the three EPSs is 2165 kw. Therefore, the range of installed capacity for each EPS is appropriately enlarged to 0–2400 kw in the genetic algorithm for optimization simulation to ensure all buildings are included in all kinds of situation of power outages. So, the search range of the installed capacity IEPS is [0, 7200]. Figure 10 shows changes in the total cost of the building complex with the increase of installed capacity of IEPSs.
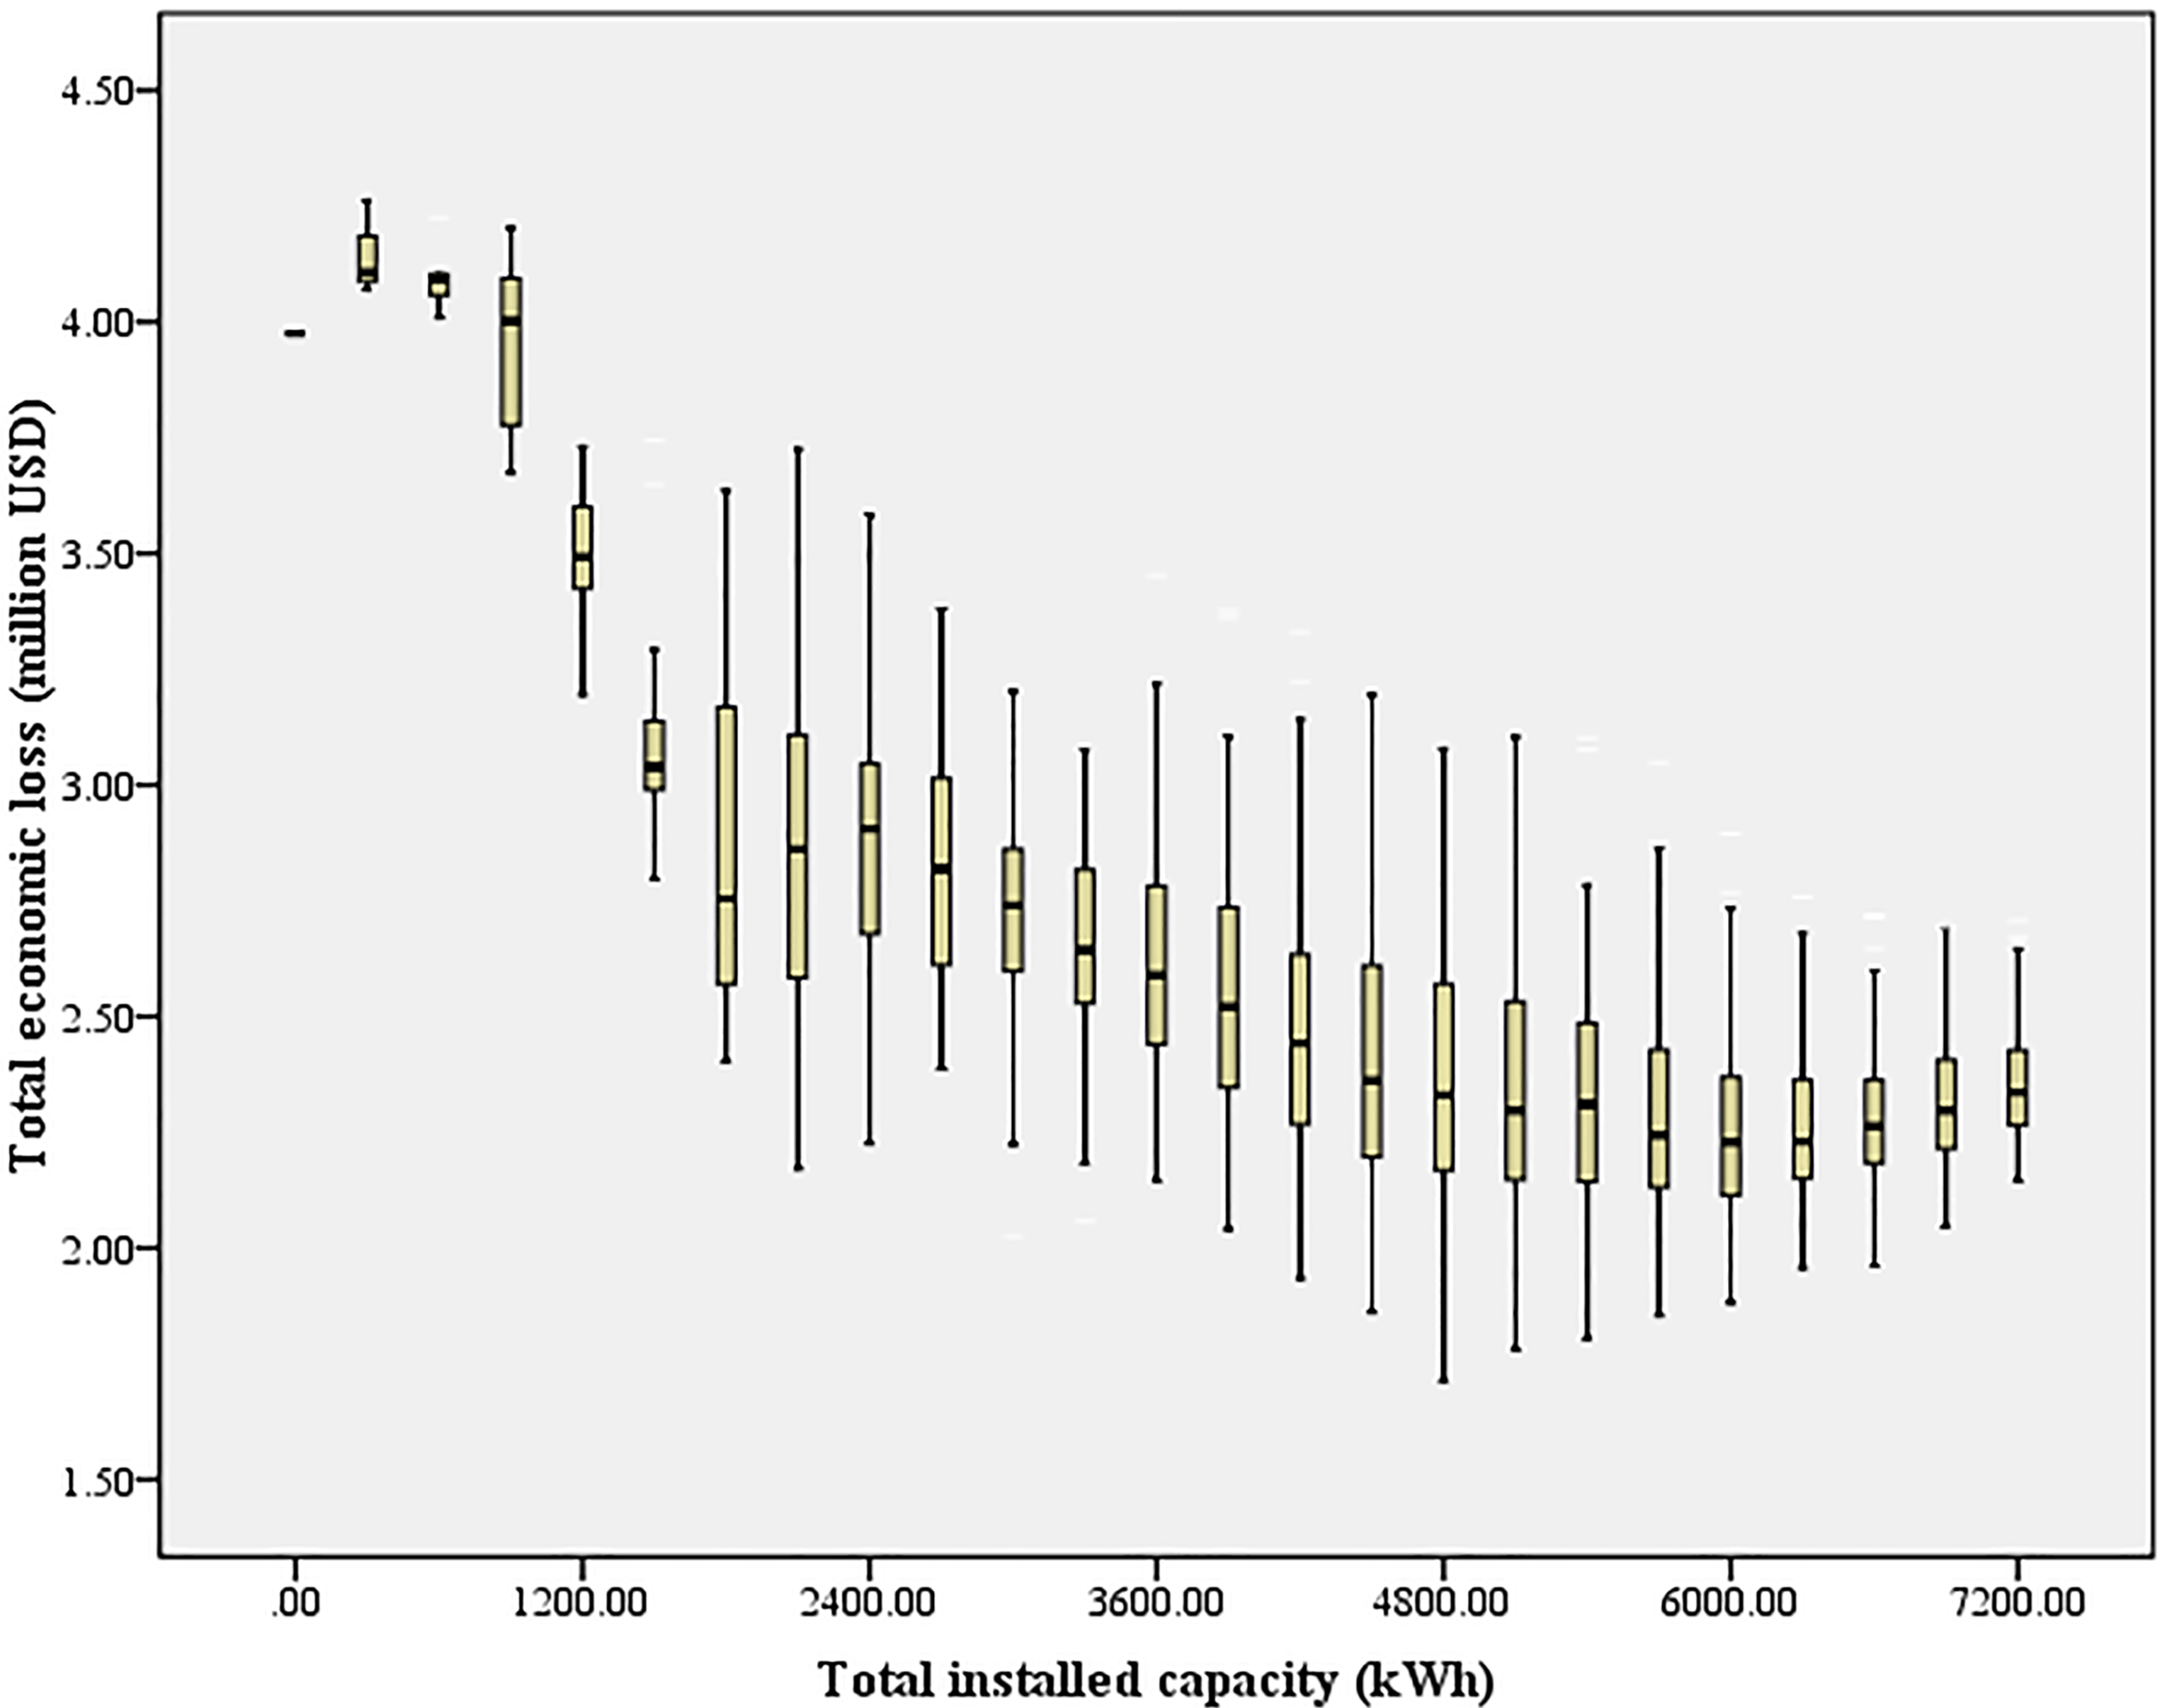
Changes in the total cost of the building complex with the installed capacity increase of integrated energy power system (IEPS).
It can be seen that the total cost of the building complex reduces at first with the increase of the installed capacity of IEPS gradually. After reaching a minimum value, it begins to rise as the installed capacity continues to increase. Therefore, there is an optimal configuration which is between 4800 and 6000 kW. Taking the minimum total cost of the building complex as the objective function, the optimal configuration of the IEPS can be obtained using the genetic algorithm. Comparing the results of the SEPS and optimal IEPS after optimization as shown in Tables 6 and 7, the superiority of the integration and dispatch model can be indicated obviously.
The comparison on reliability performance of the stand-alone emergency power system (SEPS) and integrated emergency power system (IEPS) with optimal configuration.
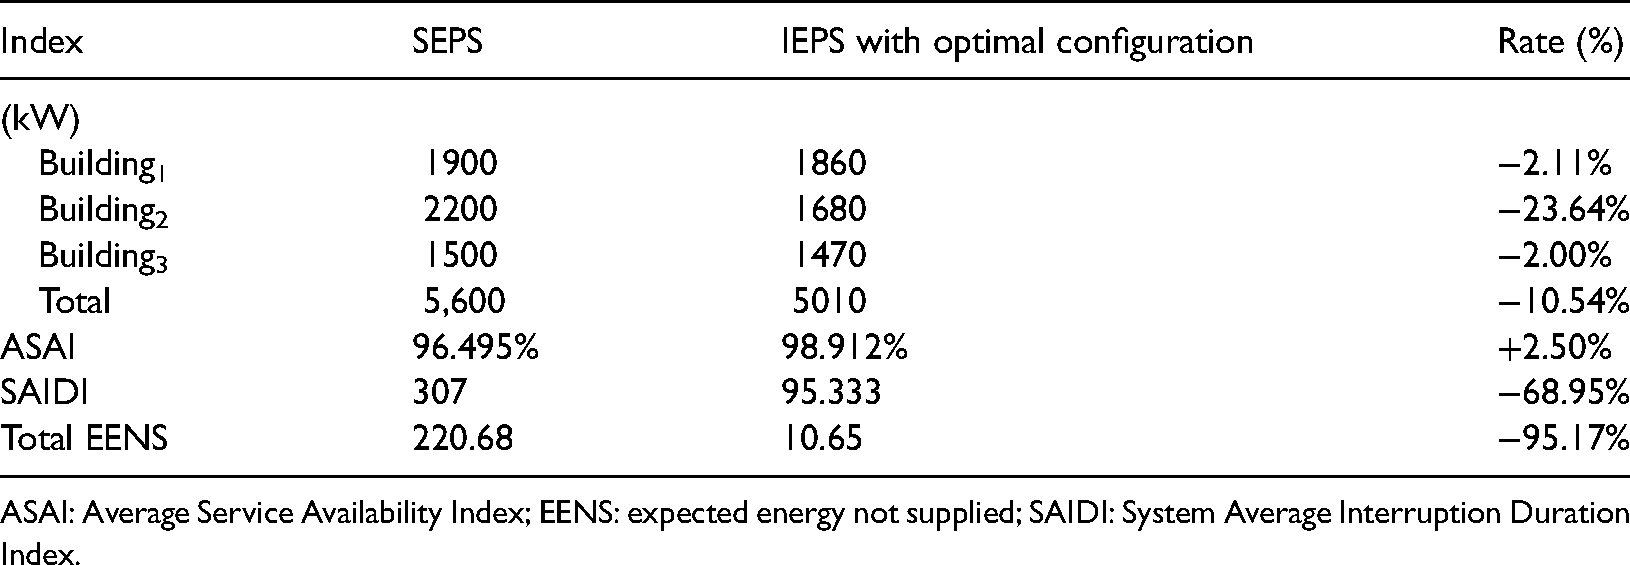
ASAI: Average Service Availability Index; EENS: expected energy not supplied; SAIDI: System Average Interruption Duration Index.
The comparison on economic performance of the stand-alone emergency power system (SEPS) and integrated emergency power system (IEPS) with optimal configuration.
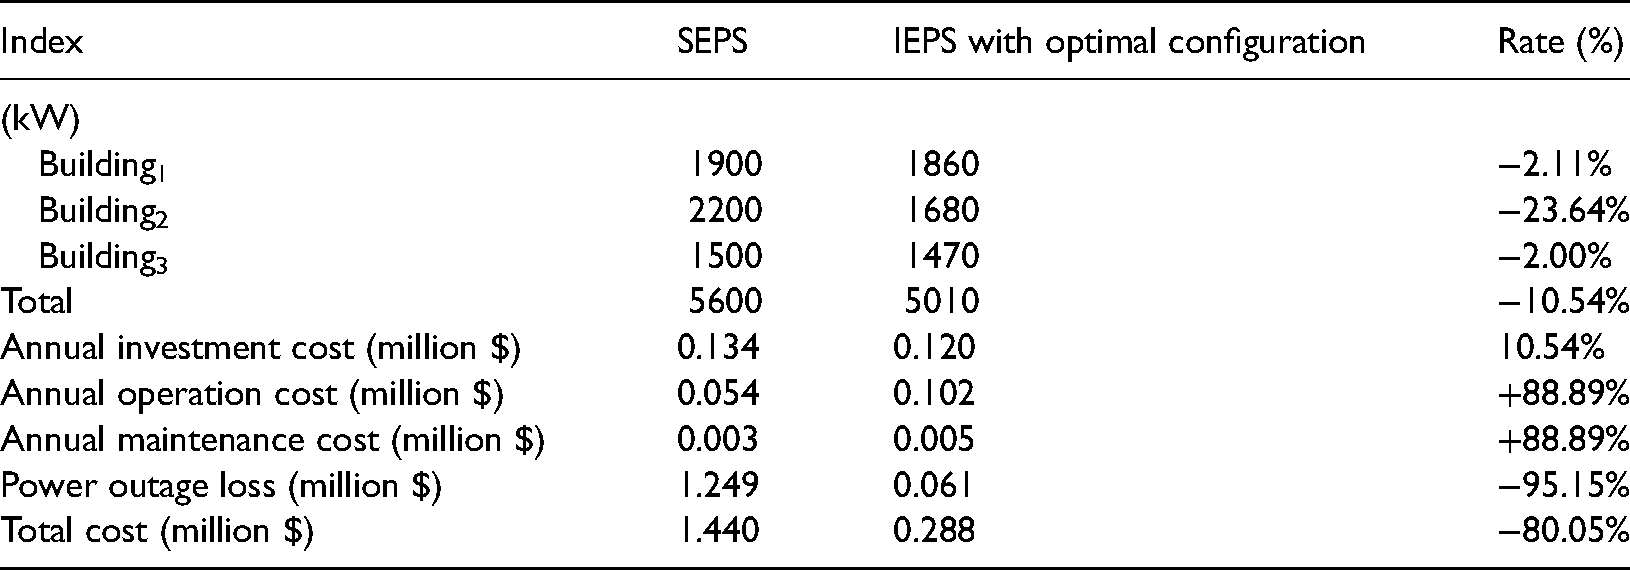
It can be seen from Tables 6 and 7 that the optimal installed capacity of the IEPS is 5010 kW, which is decreased by 10.54% compared with the initial installed capacity. Under the optimal configuration, the total cost can be cut down by 80.05% while the reliability is improved. The results evidently illustrated that the IEPS in the building complex can reduce the system investment cost by maximizing resource utilization. In this way, it can achieve investment cost savings as well as reliability improvement.
Sensitivity analysis
Characteristics parameters of EPS
It is of vital need to determine the sensitivity of the final results to the possible variations in the input data. This section mainly studied the impact of characteristics parameters of EPS on the total cost. As equations (7) and (12) to (15) demonstrated, there are many factors influencing the power outage loss, such as the startup time, maximum support time and the fuel replenishment time of the EPS. From equations (8) to (11), the system cost is influenced by the investment cost, the fuel cost, and the maintenance cost per unit capacity of the EPS. Therefore, these six impact factors are changed in multiples and their impacts on the total cost are investigated.
Results are shown in Figure 11. The reduction of startup time or fuel replenishment time can decrease the total cost. On the contrary, the increase of maximum support time will cut down the total cost. And the total cost was sharply mounting with the growth of unit investment cost, unit fuel cost, and unit maintenance cost. This is because the power outage duration and EENS of the building complex were lessened with the reduction of startup time or fuel replenishment time and the increase of maximum support time. Thereby, the power outage loss would decrease. In addition, the climbing in unit investment costs, unit fuel costs, and unit maintenance cost had led to an increase in the system costs of EPSs, so the total cost of the building complex was rising.
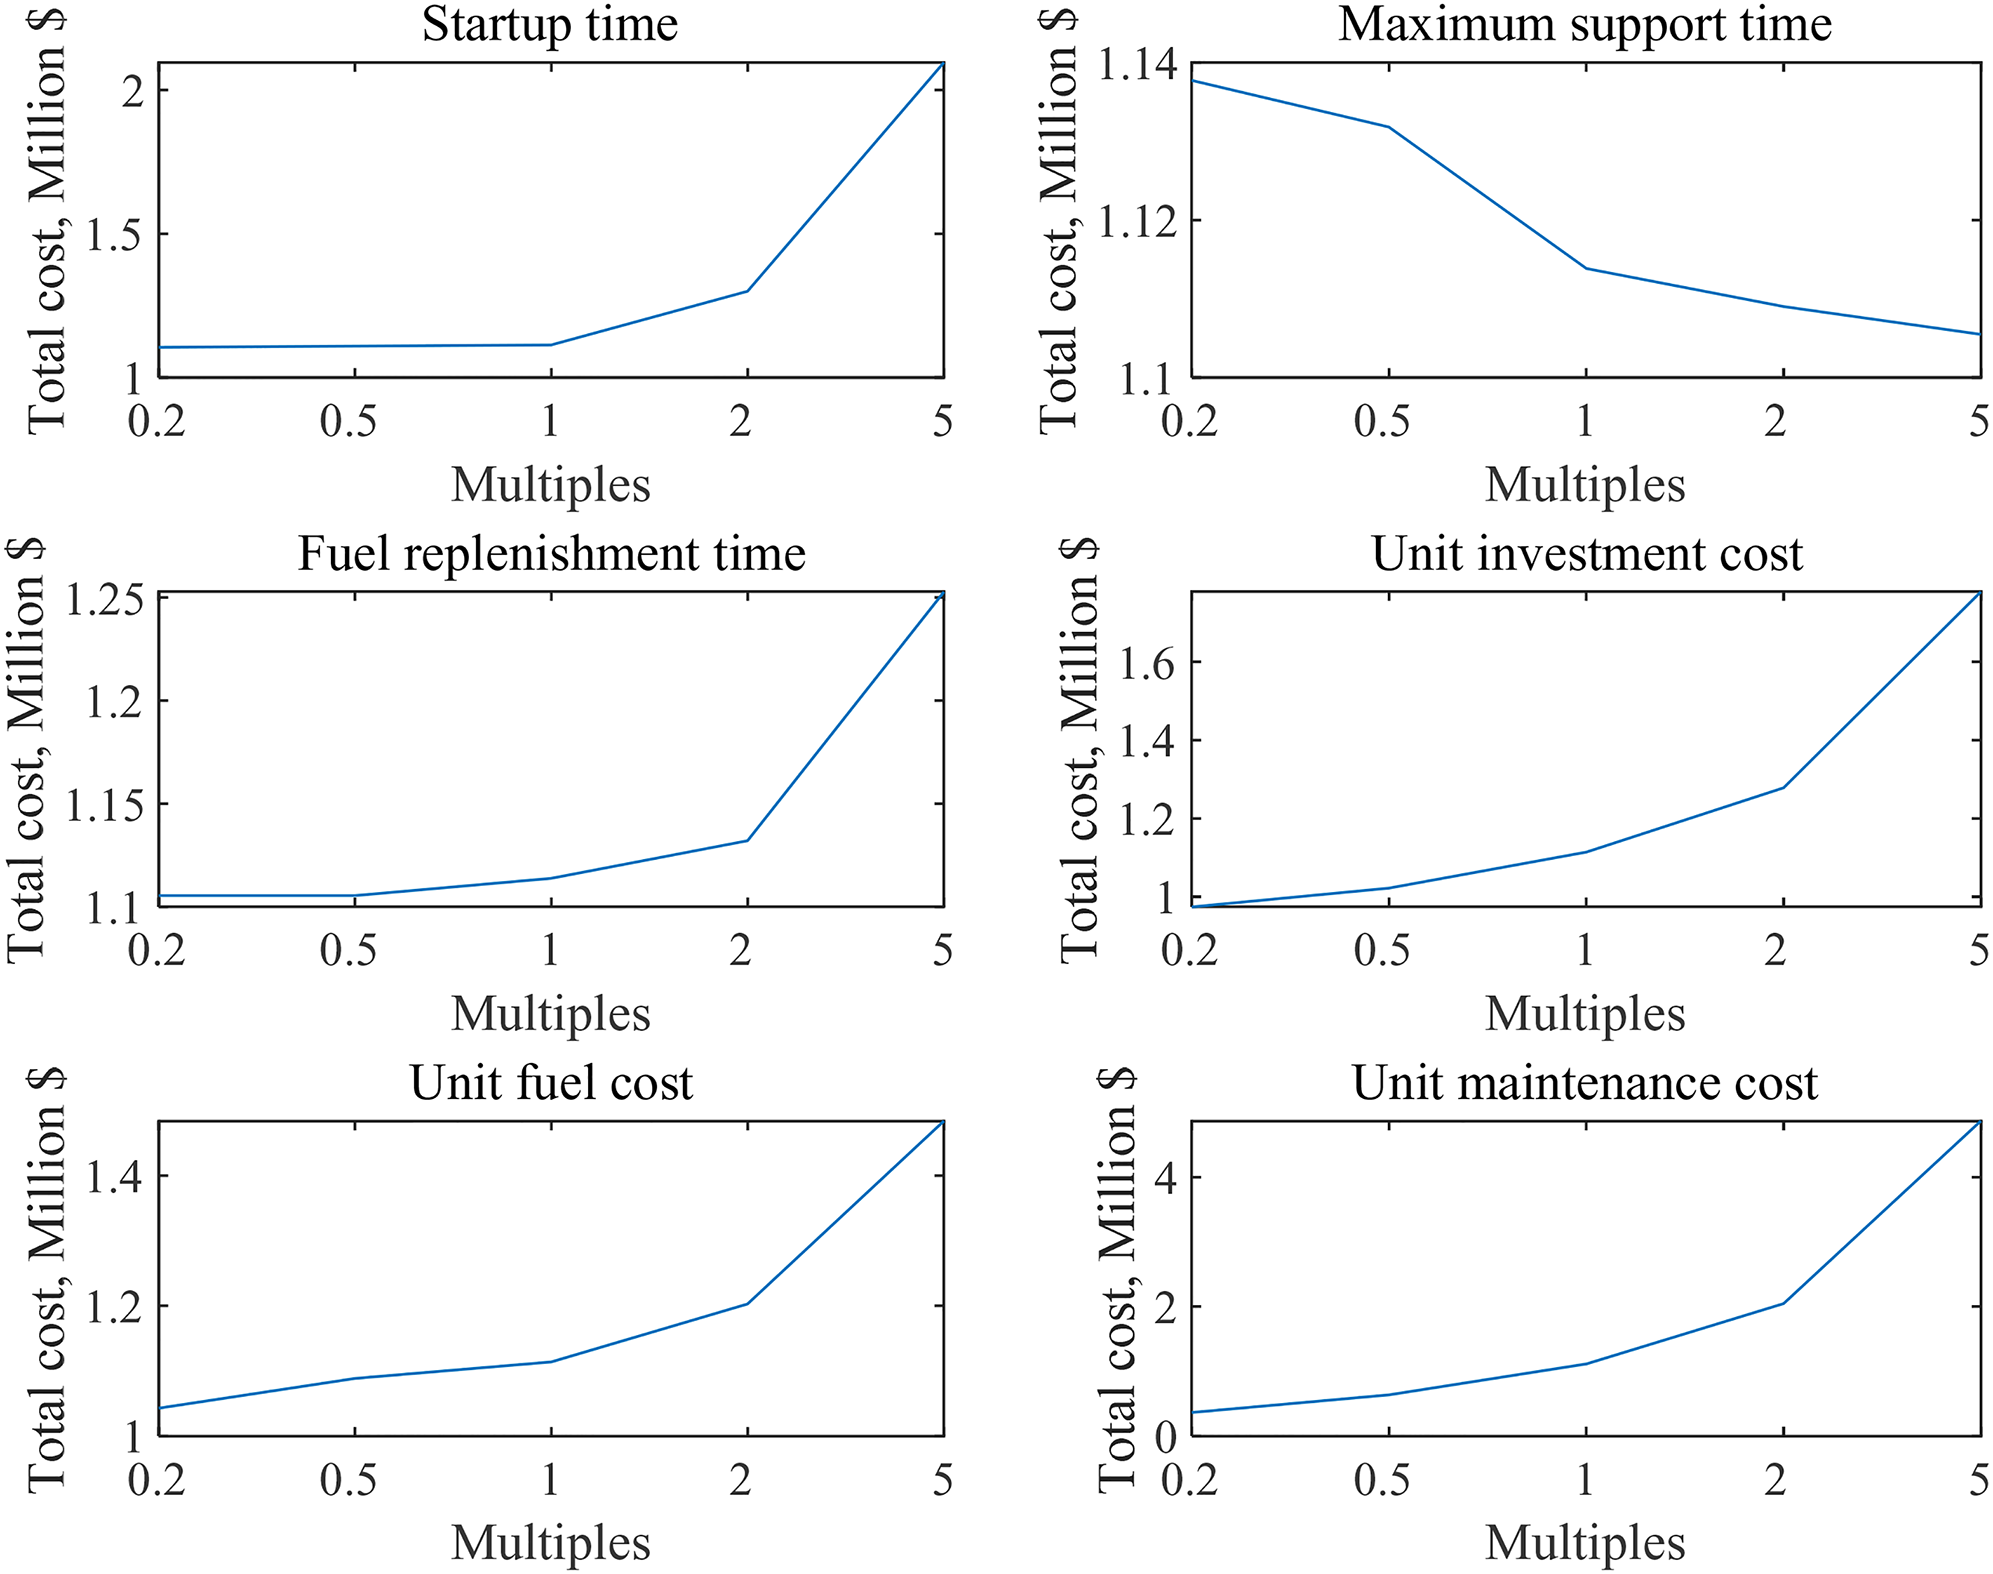
The impact of characteristics parameters on the total cost of the building complex.
The above conclusions verify the correctness and applicability of the optimization model. Therefore, to reduce the total cost, hybrid EPSs that combine diesel generators with other distributed energy resources can be considered for power supply. It provides research directions for the performance optimization of emergency systems.
Number of buildings
To prove the conclusion that the IEPS can improve the reliability of the building complex and reduce the system cost at the same time, we have chosen three scenarios to simulate and compare the effect trend of IEPS on buildings: three buildings, four buildings, and six buildings.
The reliability and economic performance results of the three scenarios are shown in Table 8. And the improvement trend of the reliability assessment indices (e.g. ASAI, SAIDI, and EENS) and economic performance are shown in Figures 12 and 13. From the comparison results, we can see that the ASAI was improved as Figure 12 (a) shown; SAIDI and EENS were decreased as Figure 12 (b) and (c) depicted. The results were demonstrated that with the increase of buildings in the building complex, the impact of the IEPS will be enhanced, the improvement effect on reliability and economic performance of the building complex is larger. The change trend of reliability index and outage loss (Figures 12 and 13(b)) presents an increase by a quadratic function form. When achieving the highest reliability performance, its growth rate slows down and will reach the platform period. Because when more stand-alone EPSs in the buildings are connected to form an integrated system, there are more standby resources to support each other. Under the integration and dispatch, the power outage duration will be reduced as much as possible, and the support time of the power supply will be maximized. In this case, when the number of buildings increases, the redundancy of EPS will increase and the capacity of the IEPS can be reduced to meet the requirement of load dispatch of the whole complex and ensure the reliability. Therefore, the annual investment cost presents an exponential form change trend. The comparison results verify that the IEPS can achieve cost saving and reliability improvement, which make the conclusion more credible.
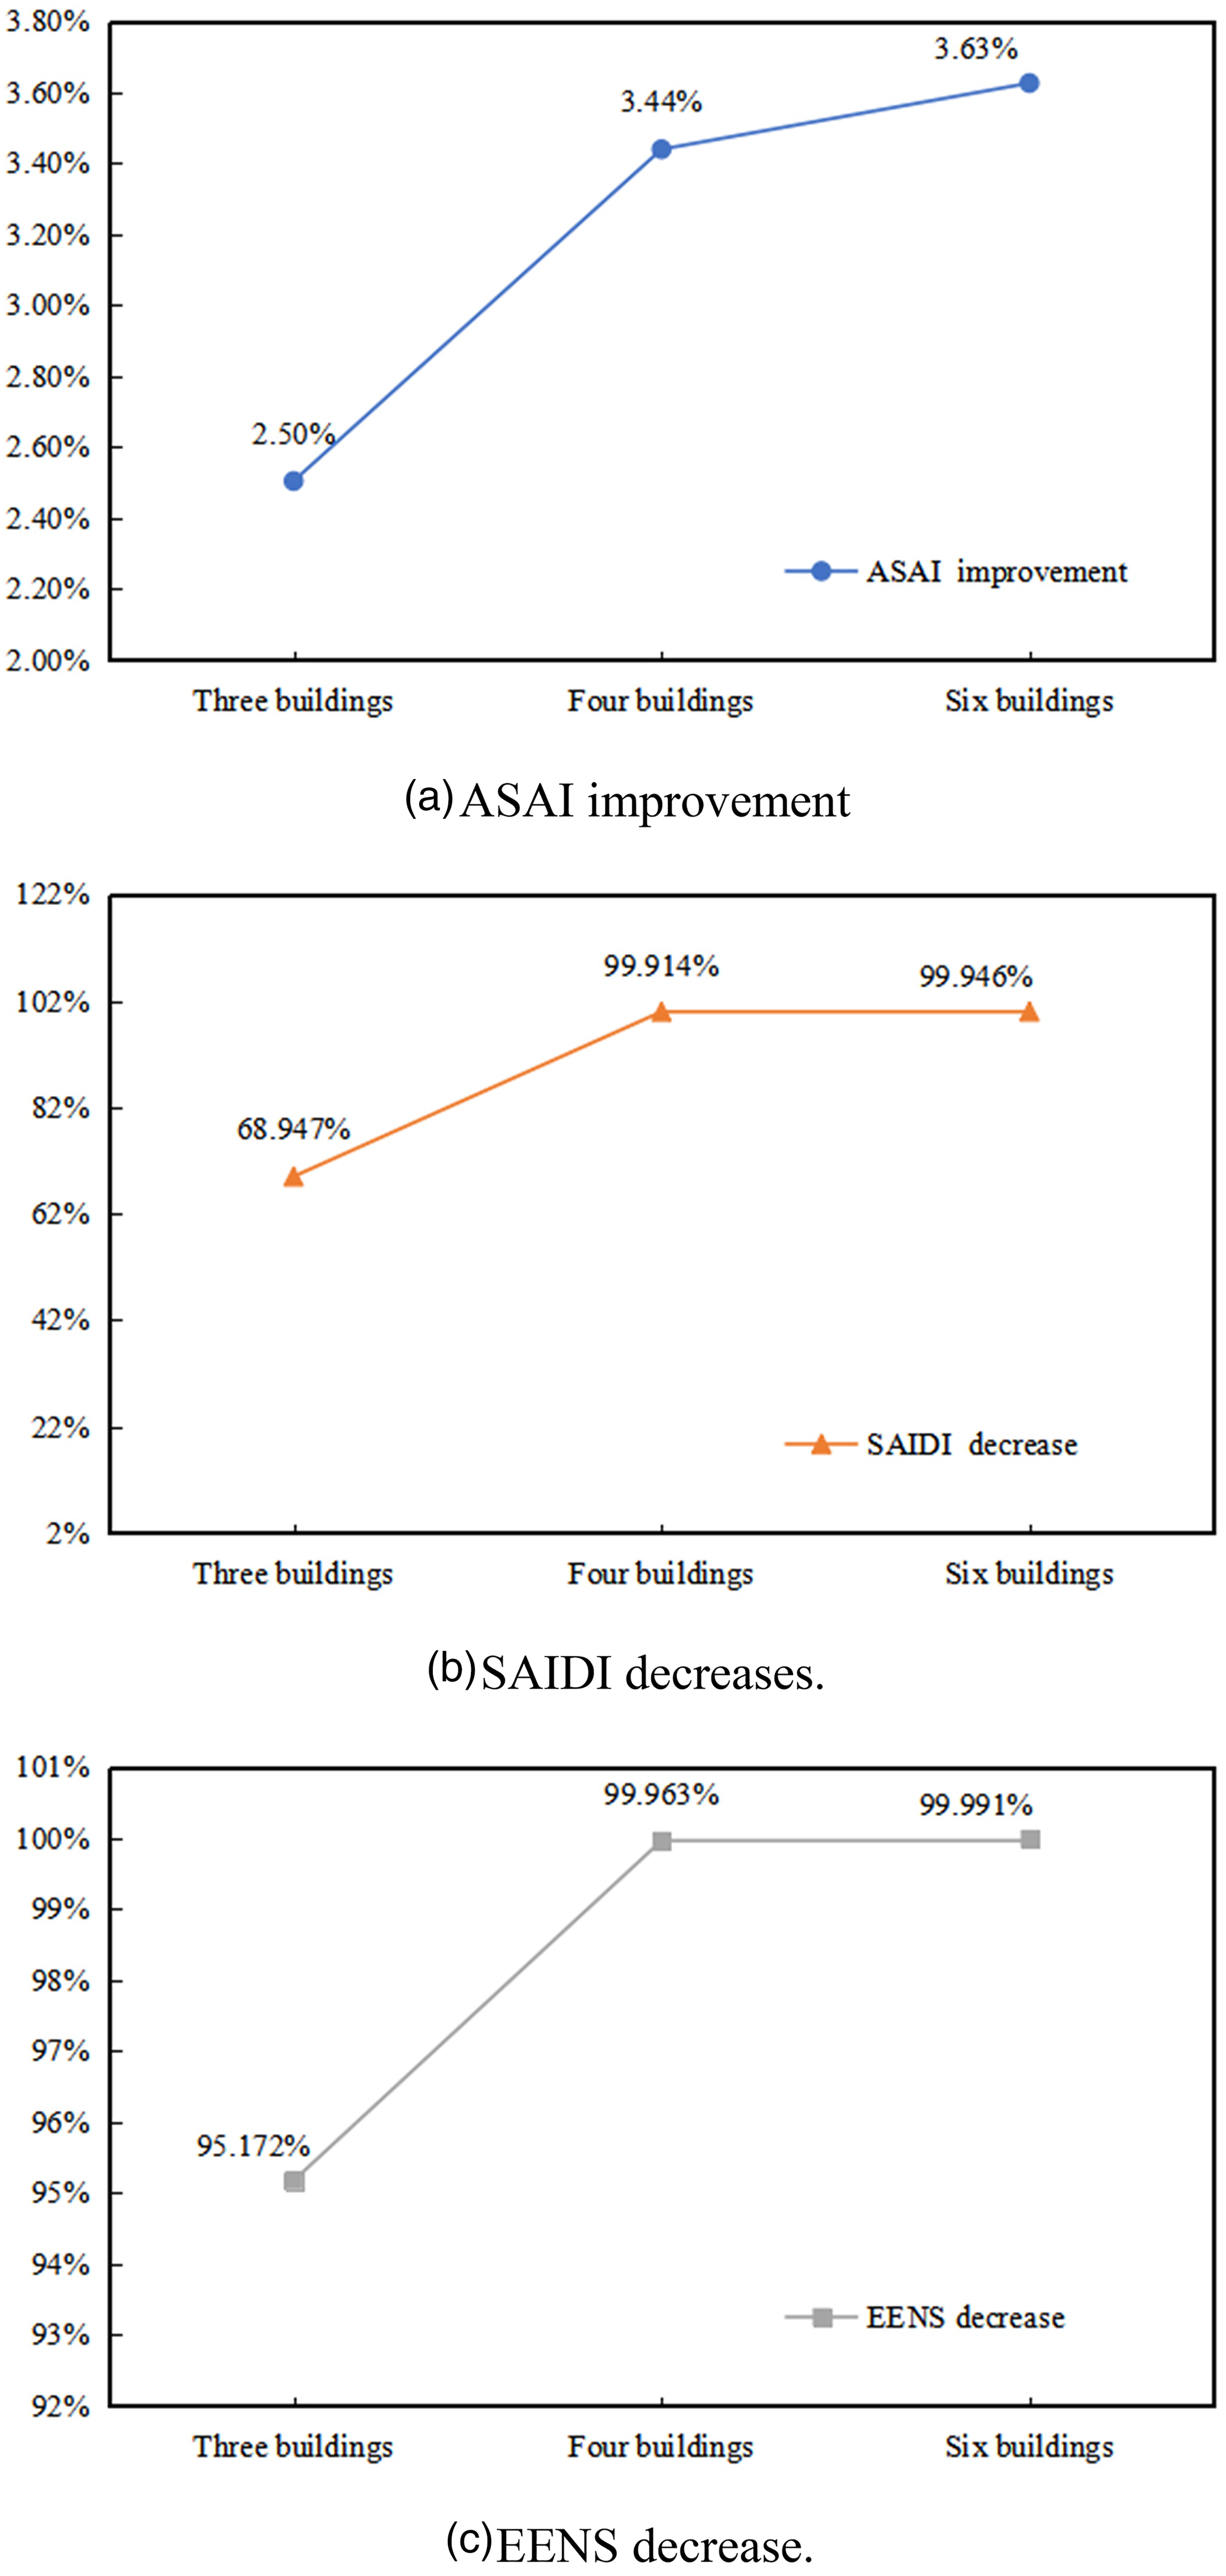
The improvement of reliability performance with the increase of buildings. (a) Average Service Availability Index (ASAI) improvement. (b) System Average Interruption Duration Index (SAIDI) decreases. (c) Expected energy not supplied (EENS) decreases.
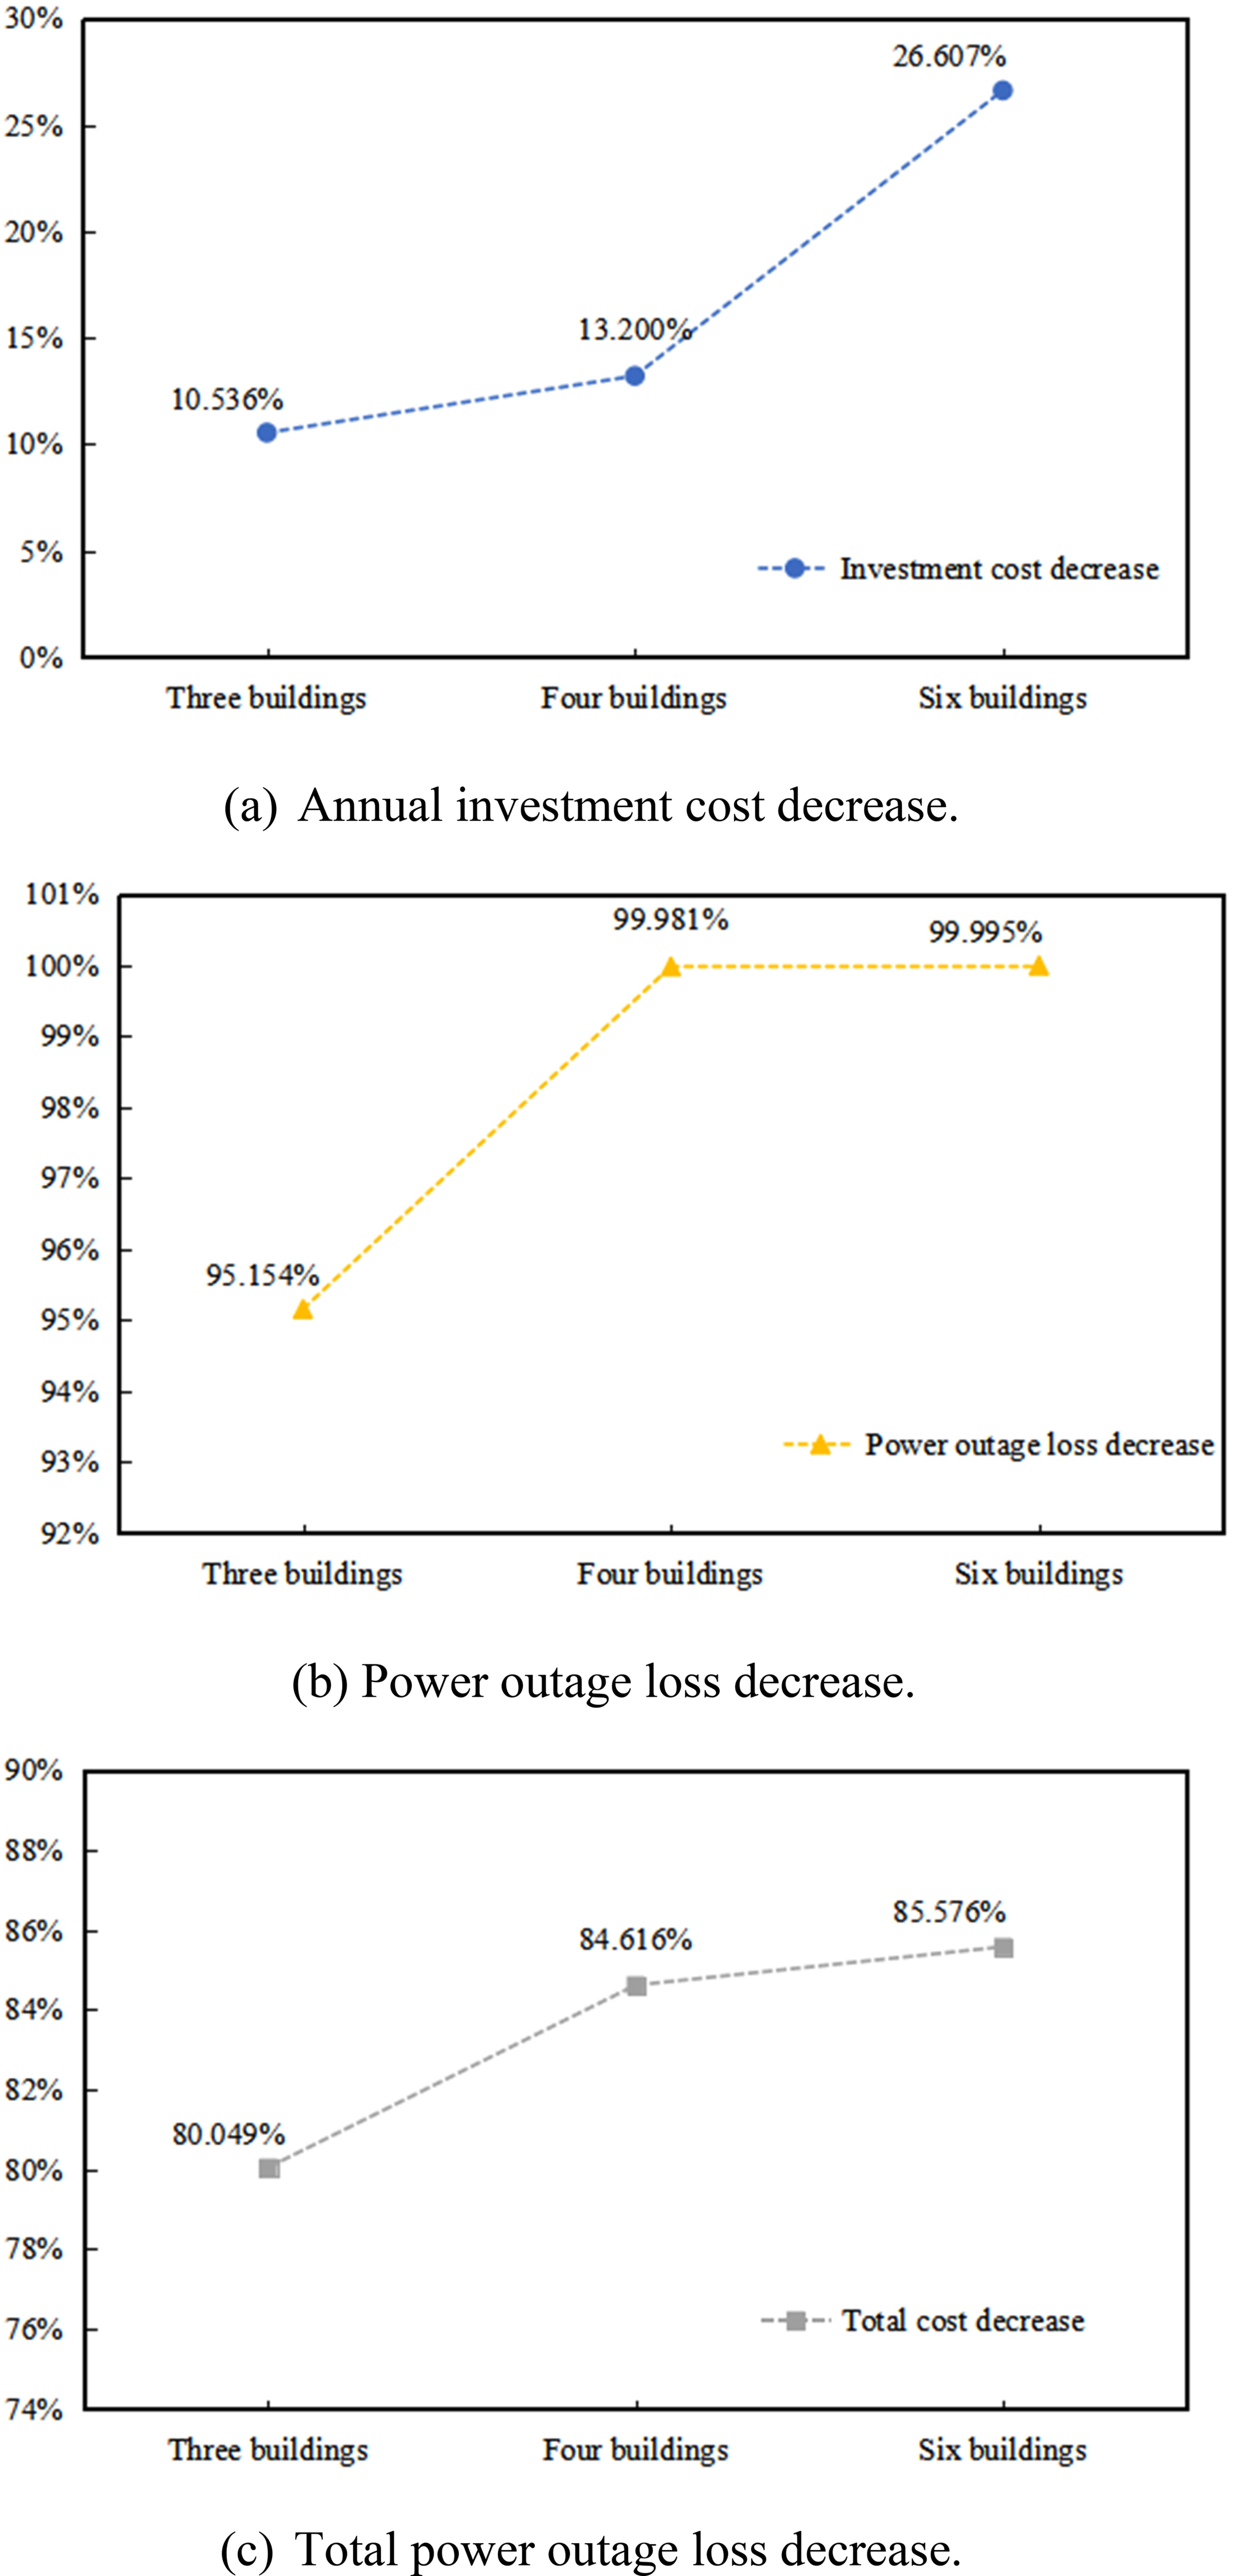
The improvement of economic performance with the increase of buildings. (a) Annual investment cost decrease. (b) Power outage loss decrease. (c) Total power outage loss decrease.
The reliability and economic performance results of three scenarios.
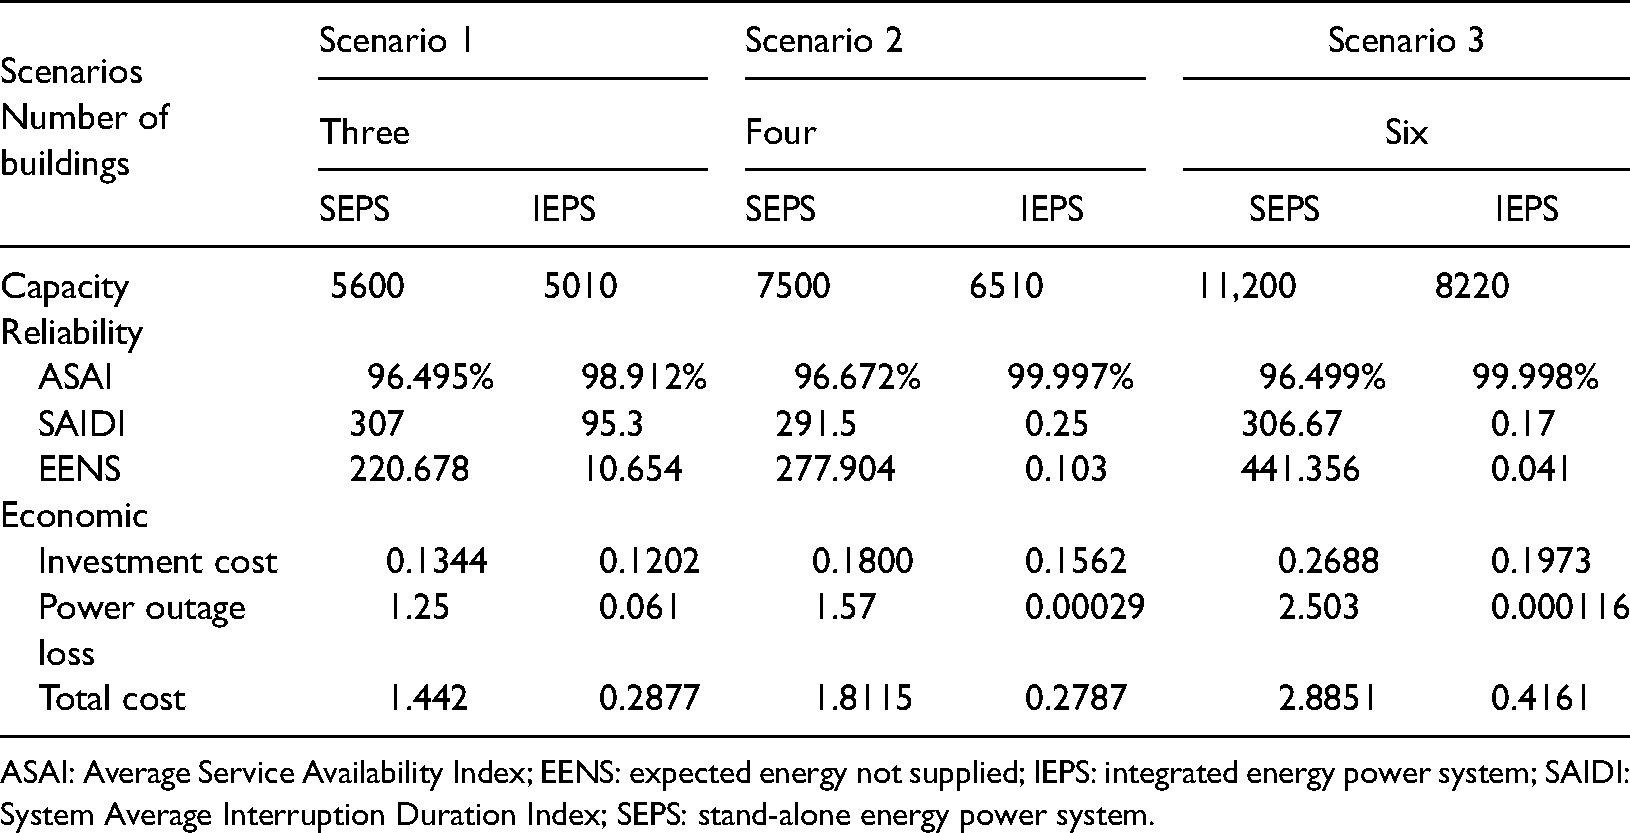
ASAI: Average Service Availability Index; EENS: expected energy not supplied; IEPS: integrated energy power system; SAIDI: System Average Interruption Duration Index; SEPS: stand-alone energy power system.
Discussion
With the rapid increase of world population and the decline of fossil fuels, the current centralized power system is in crisis that cannot support to meet the high quality of life. The shortage of power supply is a big problem in the world. A nationwide blackout occurred in Argentina on 16 June 2019. A large-scale blackout occurred in Texas on 14 February 2021. This kind of event has caused irreparable losses to the economy and life safety. The utilization of EPS is an effective means to ensure the reliability and safety of the power grid. During the power outages, the EPS can ensure the power supply of critical loads uninterrupted, which can largely reduce economic losses and personal safety threaten. For example, government departments, transportation hubs, operating rooms of hospitals, data centers, and other critical loads need continuous and high-quality power supply system support. Therefore, the design and optimization of EPS are imminent.
The proposed IEPS in this paper can solve the problem of equipment failure caused by long-term idle of EPS and ensure the continuous and high-quality power supply of users economically and reliably by forming an emergency power microgrid. It provides a reference for future power system design and optimization.
Conclusion
According to the concept of microgrid, the IEPS can serve multiple buildings more safely and economically in a building complex. Due to the different probability of distribution network failure in each building, the SEPS of each building can integrate and dispatch to maximize the utilization of resources. Therefore, this paper proposed an IEPS by connecting the stand-alone emergency power subsystems with the micro-network and backing up each other to achieve the purpose of improvement in reliability and economy. Then, taking the minimum total cost consisted of system cost and power outage loss as the objective function, the optimal capacity and dispatch strategy are obtained using the genetic algorithm. This paper takes a building complex in Shanghai as an example to verify the superiority of the IEPS model. The results show that after the application of the proposed model, the ASAI can improve by 2.5%, SAIDI can decline by 68.95%, and the total EENS can reduce by 95.17%. These indices prove that the power supply reliability can be enhanced with the IEPS in a building complex. Moreover, as the economic analysis shows, the total cost is cut down by 80.05%, of which the investment cost of EPSs is reduced by 10.54%, and the power outage loss is reduced by 95.15%. It is indicated that the proposed IEPS can reduce the cost of the emergency systems as well as improve the reliability of buildings.
This study proposed a novel method that can help optimize the design and management of the EPSs in a building complex. The results presented in this paper indicated that the IEPS can greatly improve the reliability and reduce cost. Due to the different characteristics and reliability of different types of power supply systems, the research on integration and dispatch can be carried out combined with distributed generation as an emergency system in future work to improve the power supply reliability of building complexes.
Footnotes
Acknowledgements
We gratefully acknowledge the Shanghai Science and Technology Development (ID NO. 18DZ1203403), State Grid Shanghai Electric Power Company (NO. 52090020002X) for funding this study.
Declaration of conflicting interests
The author(s) declared no potential conflicts of interest with respect to the research, authorship, and/or publication of this article.
Funding
The author(s) disclosed receipt of the following financial support for the research, authorship, and/or publication of this article: This work was supported by the Shanghai Science and Technology Development Foundation (grant number 18DZ1203403); and the foundation of State Grid Shanghai Electric Power Company (grant number 52090020002X).
Appendix
In a building complex, three different kinds of buildings: a commercial high-rise building (Building1), an office high-rise building (Building2), and a central business district building (Building3) are adjacent buildings. The upper end is led by two 35 kV transformer stations. Each building has four 10 kV transformers, and each of the two transformers is spared, as shown in Table A1. (For example, the transformer of B1 is T1-1, T1-2., T1-3, and T1-4, in which the transformers T1-1 and T1-2 are reserved for each other, and the T1-3 and T1-4 are alternate with each other). The schematic diagram of the distribution network in this region is shown in Figure A1. These three buildings are all high-rise buildings, where the load is divided into first, second, and third levels. The critical loads comprises of the first and second-level loads. The load point distribution and power reliability parameters of the three buildings are shown in Table A2 and Table A3. According to the load point distribution and power reliability parameters of the three buildings, the power outage probabilistic model of the building complex can be established in Monte Carlo simulation (MCS).