
Abstract
Low-pressure N2 adsorption (LPNA) could provide quantitative data for characterizing the pores in gas shale. However, the inconsistencies of outgas temperature have caused significant deviations in LPNA experiments. To explore the effects of outgas temperature on pore characteristics, two shale samples of Lower Cambrian Niutitang formation from Northern Guizhou, China, were collected for LPNA experiments and thermogravimetry-fourier transform infrared (TG-FTIR) spectroscopy. The samples were outgassed at six temperatures: 80°C, 100°C, 150°C, 200°C, 250°C, 300°C. Larger adsorbed volumes were presented in the isotherms at higher outgas temperatures. Similar regularity is obtained from the relationship between specific surface area, micropore volume and outgas temperature. Comprehensive analysis of TG-FTIR and LPNA at different outgas temperature indicated that at lower outgas temperatures (from 80°C to 100°C), the free water was unlikely to be removed completely, and resulted in large amounts of micropores couldn’t be accessed. An excessive outgas temperature might expulse liquid hydrocarbons or decompose organic matter (from 200°C to 300°C), and could lead to the generation of micropores. When the sample were outgassed at 150°C, TG-FTIR analysis indicated that the sample composition unchanged and a better removal of free water happened. Therefore, 150°C should be a suitable outgas temperature for shale in LPNA experiments. The findings in this research not only provide reliable evidence for the selection of outgas procedure in LPNA for shale, but clarify the important effects of free water and volatile materials on pore accessibility in shale.
Introduction
In the evaluation system of shale gas reservoirs, pore characteristics are one of the critical assessment indicators (Dong et al., 2011; Li et al., 2011). Nanoscale pores, as the main space of generation and storage of shale gas, not only play an important role in controlling occurrence and seepage of shale gas, but also have a significant influence on gas-bearing capacity of shale (Chalmers et al., 2012; Curtis et al., 2012; Loucks et al., 2009; Nelson, 2009). The characterization of nanoscale pores in gas shale would make big sense to evaluation and exploitation of shale gas resource.
Considering the complexity and particularity of nanoscale pores in gas shale, various analytical technologies and methods have been used to study the pore system of shale gas reservoirs. For instance, field emission scanning electron microscopy/transmission electron microscopy (FE-SEM/TEM) could be used to visualize pore types, shapes and sizes directly (Chalmers et al., 2012; Gu et al., 2017; Hou et al., 2015; Ma et al., 2014; Tian et al., 2015; Wang et al., 2014; Yang et al., 2016). Focused ion beam scanning electron microscopy (FIB-SEM) and nano X-ray computerized tomography (Nano-CT) have been widely applied in three-dimensional reconstruction of shale and microstructure investigation of pore system in gas shale (Curtis et al., 2012; Gu et al., 2015; Ma et al., 2014; Vergés et al., 2011). Although the methods mentioned above provide us micro morphology of shale and distribution, structure and rough size of pores, the quantized data of pore system can’t be obtained accurately, which set up obstacles to research the formation and evolution of pores. Therefore, to quantitative study pore structure in shale, small angle scattering (such as small-angle neutron scattering (SANS) and ultra-small-angle neutron scattering (USANS)), mercury injection capillary pressure (MICP) and low-pressure gas adsorption are used to obtain pore structure parameters (such as specific surface area, pore volume and pore size distribution, etc.) in gas shale (Bustin and Bustin, 2012; Chalmers et al., 2012; Chen and Xiao, 2014; Clarkson et al., 2013; Gu et al., 2017; Kuila and Prasad, 2013; Nie et al., 2015). A wide range of pore size could be investigated by small angle scattering either the pore is accessible or not. For the accessible pores in shale, MICP has better applicability in the characterization of the pores in 30 nm–200 µm, while low-pressure gas adsorption is more accurate and superior for the detection of micropore and mesopore (Bustin et al., 2008; Wang et al., 2015).
According to previous studies, low-pressure N2 adsorption (LPNA) has the potential to calculate the pore structure parameters of the pores ranging from 0.3 nm to 100 nm if sufficient N2 adsorption points are acquired within ultra-low relative pressure range of 10−7 to 10−2 (Bustin et al., 2008; Clarkson et al., 2013; Wang et al., 2015). As one of the most common techniques to characterize nanopores structure in shale gas reservoirs, the accuracy of the data from LPNA is very critical for evaluating pore system in gas shale. Although some standards (e.g., ISO 9277-1995, Chinese Oil and Gas Industry Standard SY/T 6154-1995 and GB/T 21650.2-2008, et al.) have recommended the criterion for solid materials or rocks in low pressure gas adsorption experiments, there is no standards aimed specially at shale samples. With the explosive growing of shale gas, these standards can’t meet the test requirement anymore for shale samples in LPNA.
As well know, the shale samples need to be outgassed in a certain temperature to remove free water and slight volatile components before conducting LPNA experiments. The outgas temperature could profoundly affect the removal efficiencies of free water and slight volatile components, and might make a difference in the composition of the sample, especially for organic matter, and proceed to affect the pore characteristics. Therefore, the selection of suitable outgas temperature in LPNA is a prerequisite to obtain accurate results. It is noteworthy that outgas temperature of LPNA have not been unified in previous studies. For example, a variety of outgas temperatures (70°C, 110°C, 150°C, 300°C) are selected during conducting the LPNA experiments (Chalmers et al., 2012; Chen et al., 2012; Clarkson et al., 2013; Mastalerz et al., 2012; Yang et al., 2013). The difference in outgas temperature will certainly give rise to the differences of experimental results, which could make it difficult to compare and repeat experimental data. Although few researches have recommended outgas procedures for applications in LPNA (such as Holmes et al., 2017; Wang and Ju, 2015), the evidences on the effects of outgas temperature on pore characteristics are still insufficient, and the underlying mechanics remain unclear. Based on that, two shale samples from Lower Cambrian Niutitang formation (Є1n), widely developed and considered as promising shale gas reservoirs inSouth China, are collected to investigate the effects of outgas temperature on pore characteristics by LPNA experiments and thermogravimetry-fourier transform infrared (TG-FTIR). The findings may be important for selecting suitable outgas temperature to conduct LPNA experiments, and could provide reliable information for characterizing the pores in gas shale.
Methods
Organic geochemical analyses
TOC were measured by a vario MACRO cube organic element analyzer following the Chinese Oil and Gas Industry Standard GB/T19145-2003. Before the measurement, inorganic carbon in the samples needs to be eliminated by diluted hydrochloric acid with HCl: H2O = 1:7 (V/V).
Due to the absence of vitrinite in the Lower Paleozoic marine shale, the bitumen reflectance (Rb) was measured to reflect thermal maturity of samples. According to previous research about thermal maturity, laser Raman spectroscopy has been proved to be a suitable method to calculate the bitumen reflectance (Chen et al., 2015; David, 2013; Kelemen and Fang, 2001). We used a Renishaw Invia Reflex Laser Raman Spectrometer to measure the Rb values of all samples. In this work, calculation of Rb followed the equation:


2.2 X-ray diffraction (XRD) analyses
We determined mineralogical composition of the two samples by a Panalytical Empyrean X-ray diffractometer with the testing angle ranging from 5° to 80°. The samples were crushed and ground to 200 mesh firstly, and then following the Chinese Oil and Gas Industry Standard (SY/T) 5163-2010, we analyzed quantitatively the diffraction spectrums.
LPNA experiments
LPNA experiments were conducted on a Quantachrome autosorb-iQ2 automatic gas absorption analyzer. In order to remove free water and volatile materials, the samples were outgassed before adsorption measurements. The two samples were outgassed at six temperatures (80°C, 100°C, 150°C, 200°C, 250°C, 300°C) for 4 hours to study the effects of outgas temperature on pore characteristics. N2 adsorption isotherms were obtained at 77 K (−196°C) and the relative pressure (p/p0) ranges from 10−6 to 0.99.
TG-FTIR analyses
In order to explore the mechanism underlying the changes of samples composition during outgassing, we selected the same temperature and holding time (4 hours) as outgas procedure to conduct TG-FTIR analyses. TG of the samples were determined using a simultaneous thermal analyzer (STA 449F3, NETZSCH, Germany). Each sample (20−30 mg) was heated from 40°C to target temperatures (80°C, 100°C, 150°C, 200°C, 250°C, 300°C) in a dry argon atmosphere and the heating rate was 10°C/min except for 80°C. The heating rate was set as 5°C/min for 80°C since the temperature would continue to rise after climbing to 80°C and couldn’t keep constant when the heating rate was 10°C/min. Evolved gas analyses were performed by coupling STA with FTIR (Vertex 70, Bruker, Germany). The infrared spectra of evolved gases were collected in the mid-infrared range (4000–400 cm−1) using a resolution of 4 cm−1 and an accumulation of 16 scans.
Results
Compositional analysis
TOC, Ro and mineral components of the two samples are listed in Table 1. The test results of show that the TOC content of ZY-1 (9.7%) is far more than ZY-2 (3.7%), and both the two samples are in over maturation. XRD was used to semi-quantitatively estimate the mineralogical composition of the samples, and the results, presented in Table 1, indicate the large difference of mineral contents between the two samples. The sample ZY-1 consists of extremely high content of quartz (over 90 wt.%) and minor illite, plagioclase and calcite, while ZY-2 mainly contains high content of quartz (67.2 wt.%), clay mineral (16.2 wt.%) and plagioclase (12.1 wt.%), as well as a small quantity of pyrite. The differences of material composition between the two samples may be attributed to the difference of sedimentary environment and heterogeneity of strata.
TOC, Ro and mineral components of the samples.
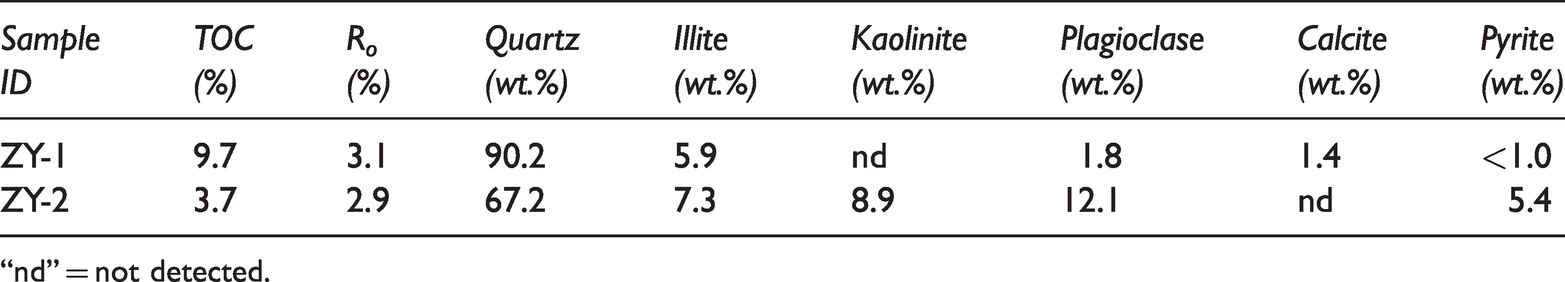
“nd” = not detected.
Low-pressure N2 adsorption-desorption isotherms
Based on static adsorption behavior of nitrogen molecules under different pressure, LPNA could provide a reliable assessment of adsorbed volume. The adsorption-desorption isotherm is the original data to analysis the pore characteristics. As presented in Figure 1, according to a refined IUPAC grouping method, the isotherms of two samples with different outgas temperature could be classified as Type IIb and exhibit an apparently similar Type H3 hysteresis loop, which indicates the presence of slit-shaped pores (Rouquerol et al., 1999; Sing et al., 1985). The sharp increase of adsorption uptake at very low relative pressure (p/p0 < 0.01) is most likely due to micropore filling. The monolayer-multilayer adsorption on the mesopore wall takes place at intermediate p/p0, which is also responsible for the hysteresis. The existence of macropores results in the absence of the plateau (like in the mesoporous Type IV isotherms) and a steep slope in p/p0 range of 0.98–1.00. Comparing Figure 1(a) and (b), the differences of the adsorption volumes between ZY-1 and ZY-2 mainly lie in the initial adsorption stage at very low pressure (p/p0 < 0.01), which should be attributed to the big difference of TOC contents between the two samples due to the significant contribution of organic matter to micropores in Niutitang shales (Yang et al., 2016). With the elevation of outgas temperature, the adsorption volume of the two samples present a slight increase, meaning the increasing of adsorption sites during the heating procedure. These facts indicate that the outgas temperature is sure to produce considerable effects on micropore structure in shale.
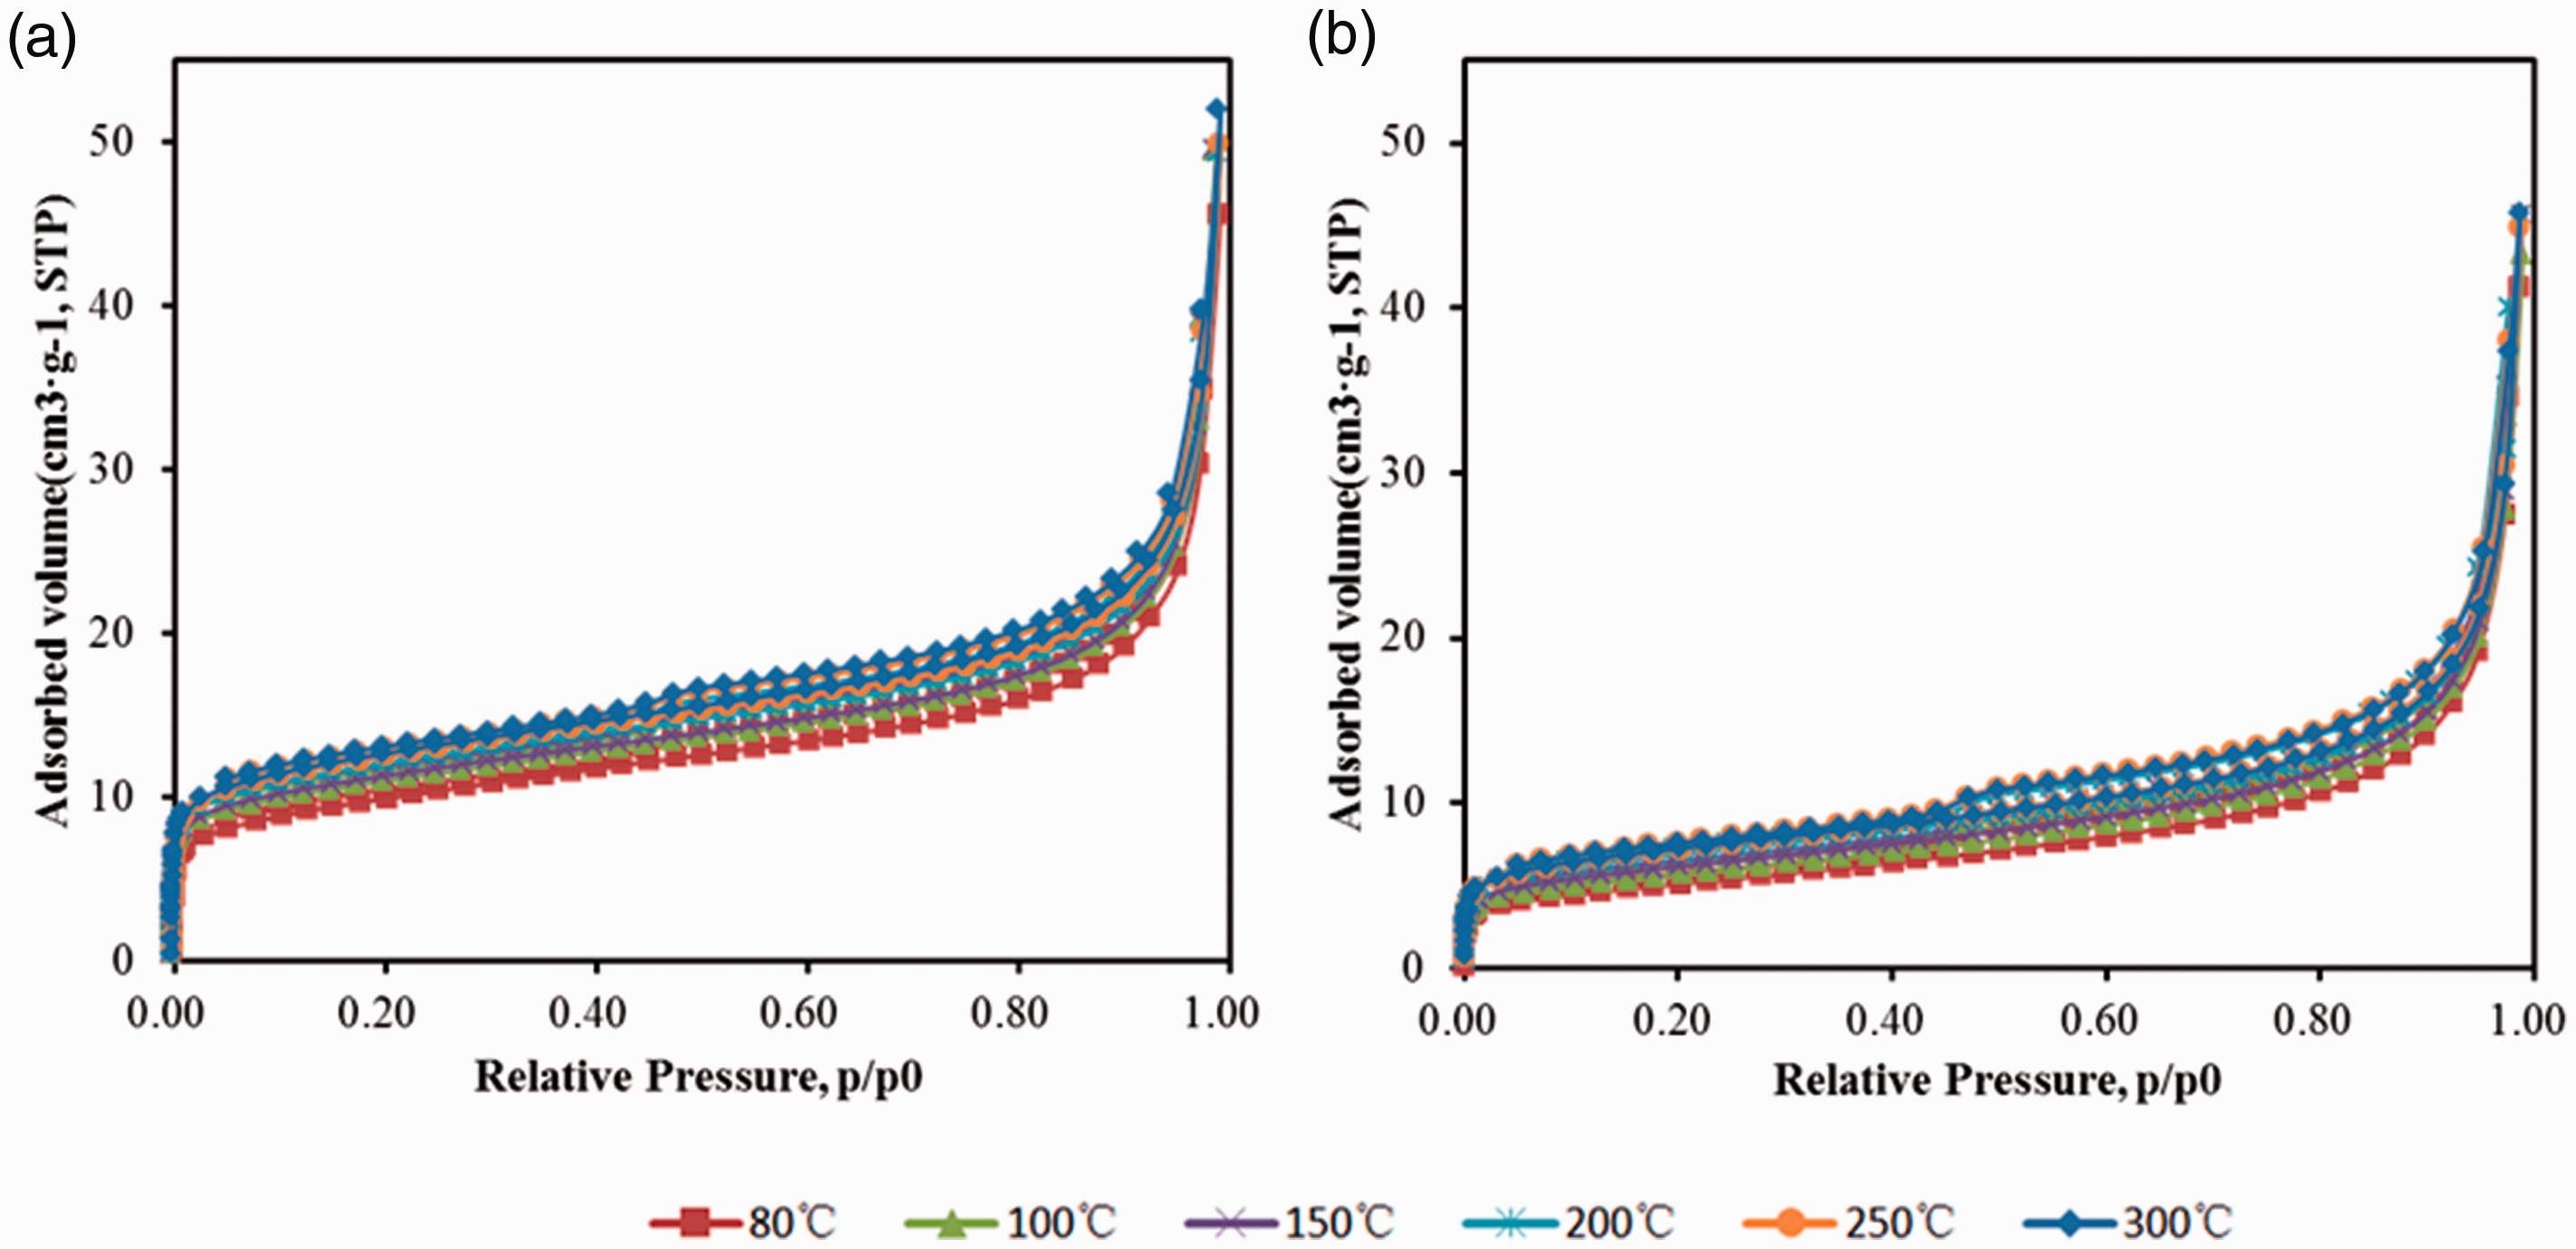
The adsorption-desorption isotherms of the two samples with different outgas temperature. (a) The isotherms of ZY-1 and (b) the isotherms of ZY-2.
The specific surface areas and micropore volume
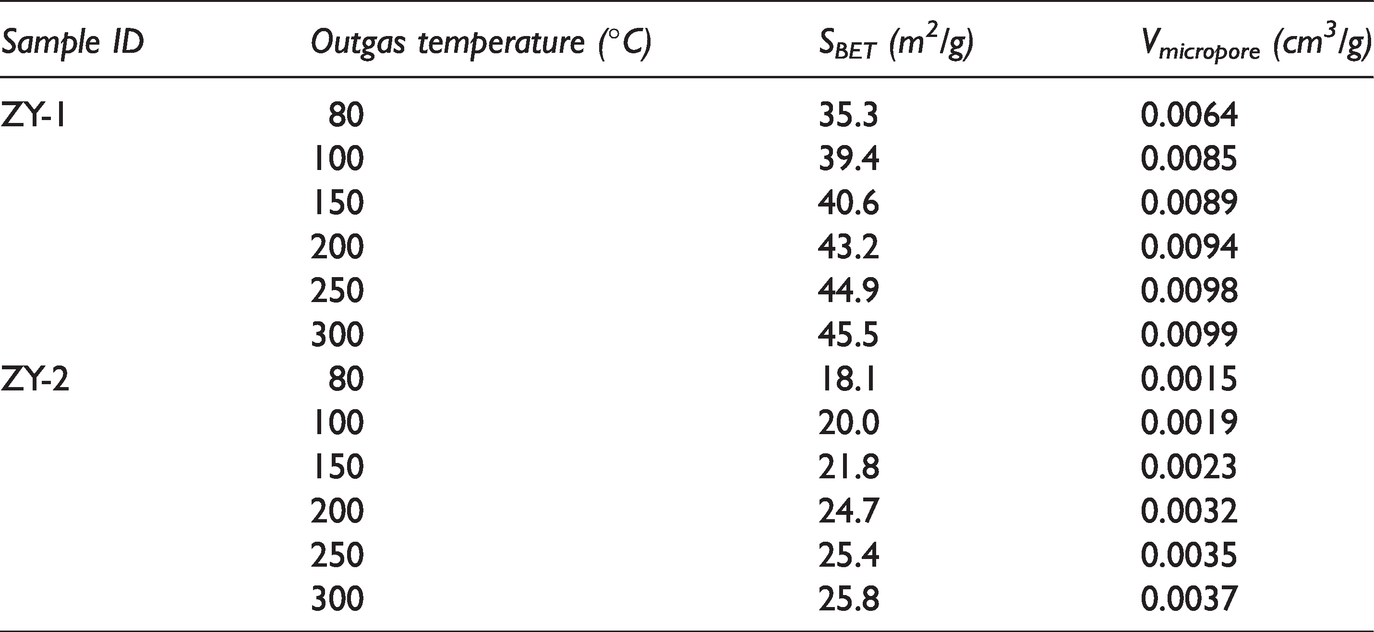
Based on the adsorption-desorption isotherms, specific surface areas (SBET) and micropore volumes (Vmicropore) were calculated by utilizing multi-point Brunauer-Emmett-Teller (BET) method and density functional theory (DFT) (Table 2). The variation trend of SBETVmicropore for the two samples with different outgas temperature can be seen in Figure 2. Obviously, both SBET and Vmicropore of ZY-1 are larger than that of ZY-2. As with the differences of adsorption volumes, the differences of SBET and Vmicropore between the two samples should also result from the big difference of TOC contents.
Pore structure parameters characteristics of the samples with different outgas temperature.
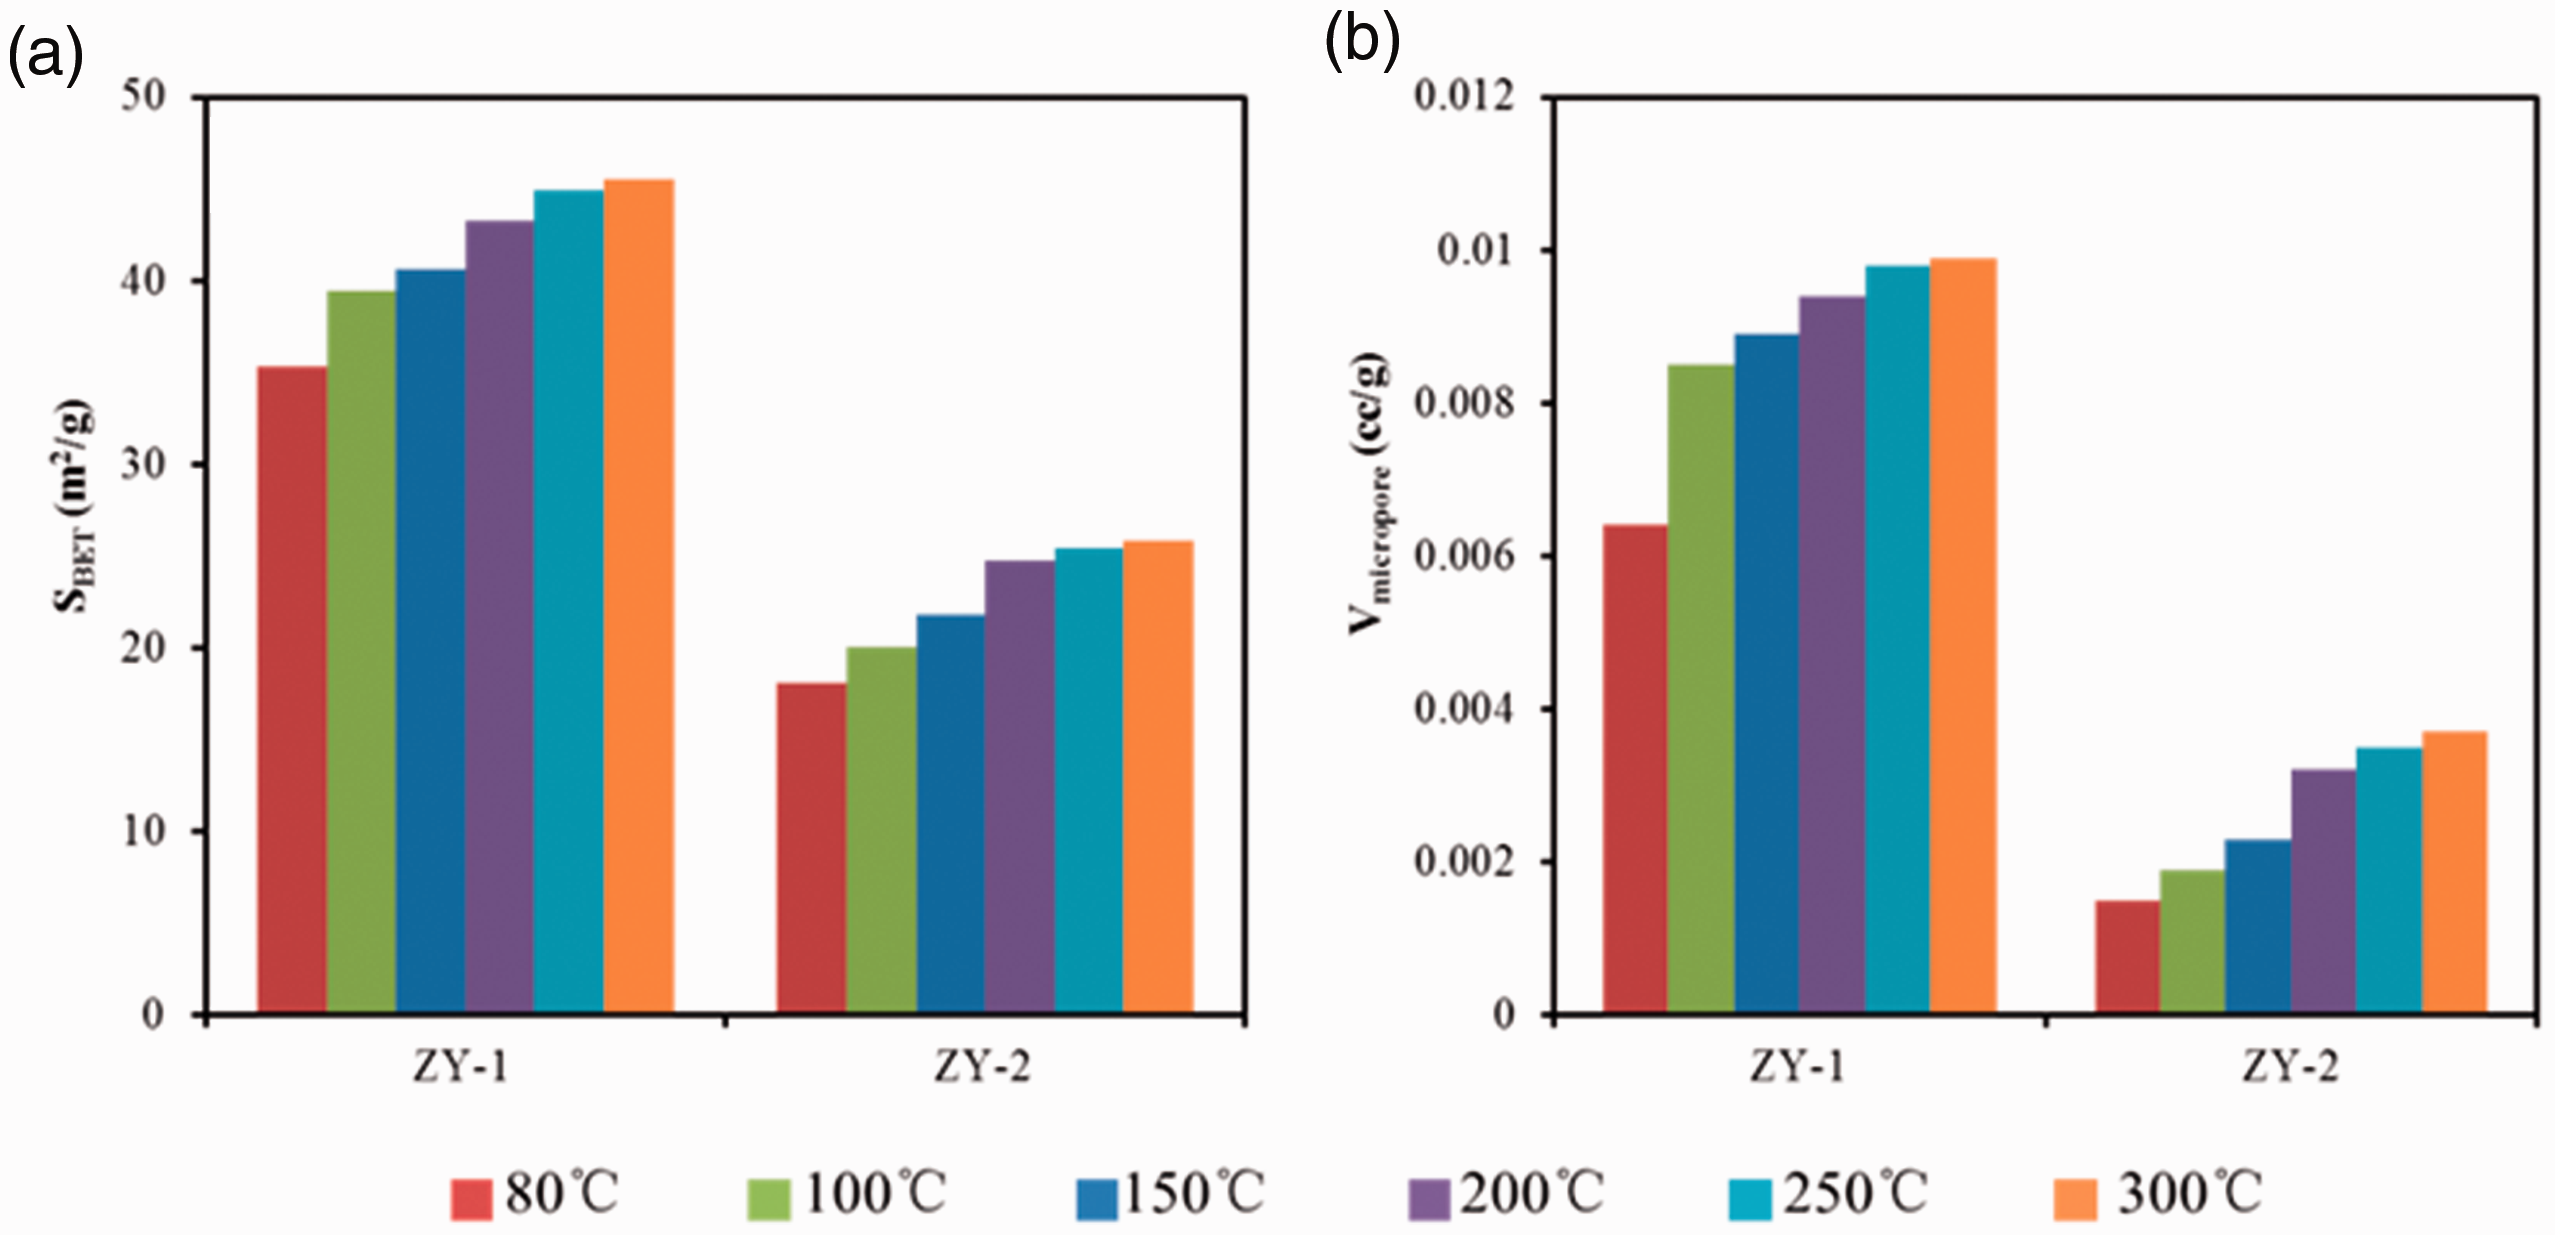
The specific surface areas and micropore volumes of the two samples with different outgas temperature. (a) Specific surface area and (b) micropore volume.
With increasing outgas temperature, both SBET and Vmicropore show similar increase trends (Figure 2(a) and (b)), suggesting that new adsorption sites in micropores are created in the process of heating. The similar variation trends of SBET and Vmicropore should be attributed to that the SBET is mainly contributed by micropores (Gu et al., 2017; Tian et al., 2015). From 80°C to 100°C and 150°C to 200°C, the SBET and Vmicropore increased relative obviously, indicating the greatly increase of adsorption sites for the two stages. However, considering the existences of free water, volatile hydrocarbons as well as organic matter, the mechanisms underlying the greatly increase of SBET and Vmicropore for the two temperature-rise periods (80°C to 100°C and 150°C to 200°C) may be quite different. The free water could be removed from the samples when the temperature climbs to approximately 100°C, while the volatile hydrocarbons (such as liquid hydrocarbon) are probably expulsed when the temperature goes above 200°C. The above analyses indicate that outgas temperature could produce important effects on sample composition, and further change the pore characteristics.
Discussion
To investigate the effects of outgas temperature on the pore structure and the composition of shale, the TG and DTG of the two samples were analyzed (Figure 3). The evolved gases produced during heating procedure were analyzed by FTIR (Figure 4) and the infrared spectra were obtained at the temperature climbing exactly to the target temperature correspondingly. The negative peaks of all the infrared spectra may be resulted from the over-high background level of H2O and CO2. The TG curves present that the weight loss increase with temperature from 80°C to 300°C. It is noteworthy that the two samples only have once weightlessness when the temperature increases from 80°C to 150°C (Figure 3(a) and (c)). In this stage, the weightlessness derives from the removal of free water in the samples, which could be identified by the vibration at 3950–3500 cm−1 and near 1500 cm−1 of FTIR (Figure 4(a) and (c)). In addition, it is easy to find that the peak intensities of free water are at its maximum when the samples are heated at 100°C (Figure 4(a) and (c)), implying that the best removal efficiency occurs at 100°C. Logically, this also signifies the free water couldn’t be removed completely if the temperature stabilizes at 100°C. The weaker peak intensities of free water and the larger weight losses at 150°C than that at 100°C indicate free water could be removed more completely at 150°C. Significantly, from 80°C to 150°C, all the weight loss of ZY-1 are larger about 0.5% than ZY-2 (Figure 3(a) and (c)), suggesting higher content of free water in ZY-1 than ZY-2. Similarly, from 80°C to 150°C, the SBET and Vmicropore of ZY-1 increased by 5.3 m2/g and 0.0025 cc/g, respectively (Table 2). While the SBET and Vmicropore of ZY-2 increased by 3.7 m2/g and 0.0008 cc/g, respectively (Table 2). Considering that moisture maybe occupy the adsorption sites or block the access of micropores (Chalmers and Bustin, 2007), the difference of free water content should be responsible for the incremental differences of SBET and Vmicropore between ZY-1 and ZY-2. Consequently, the increase of SBET and Vmicropore in this range of outgas temperature (80°C–150°C) should be attributed to the difference in removal efficiency of free water adsorbed in micropores. Therefore, because of the more complete removal efficiency, 150°C should be a more suitable temperature than 80°C and 100°C.
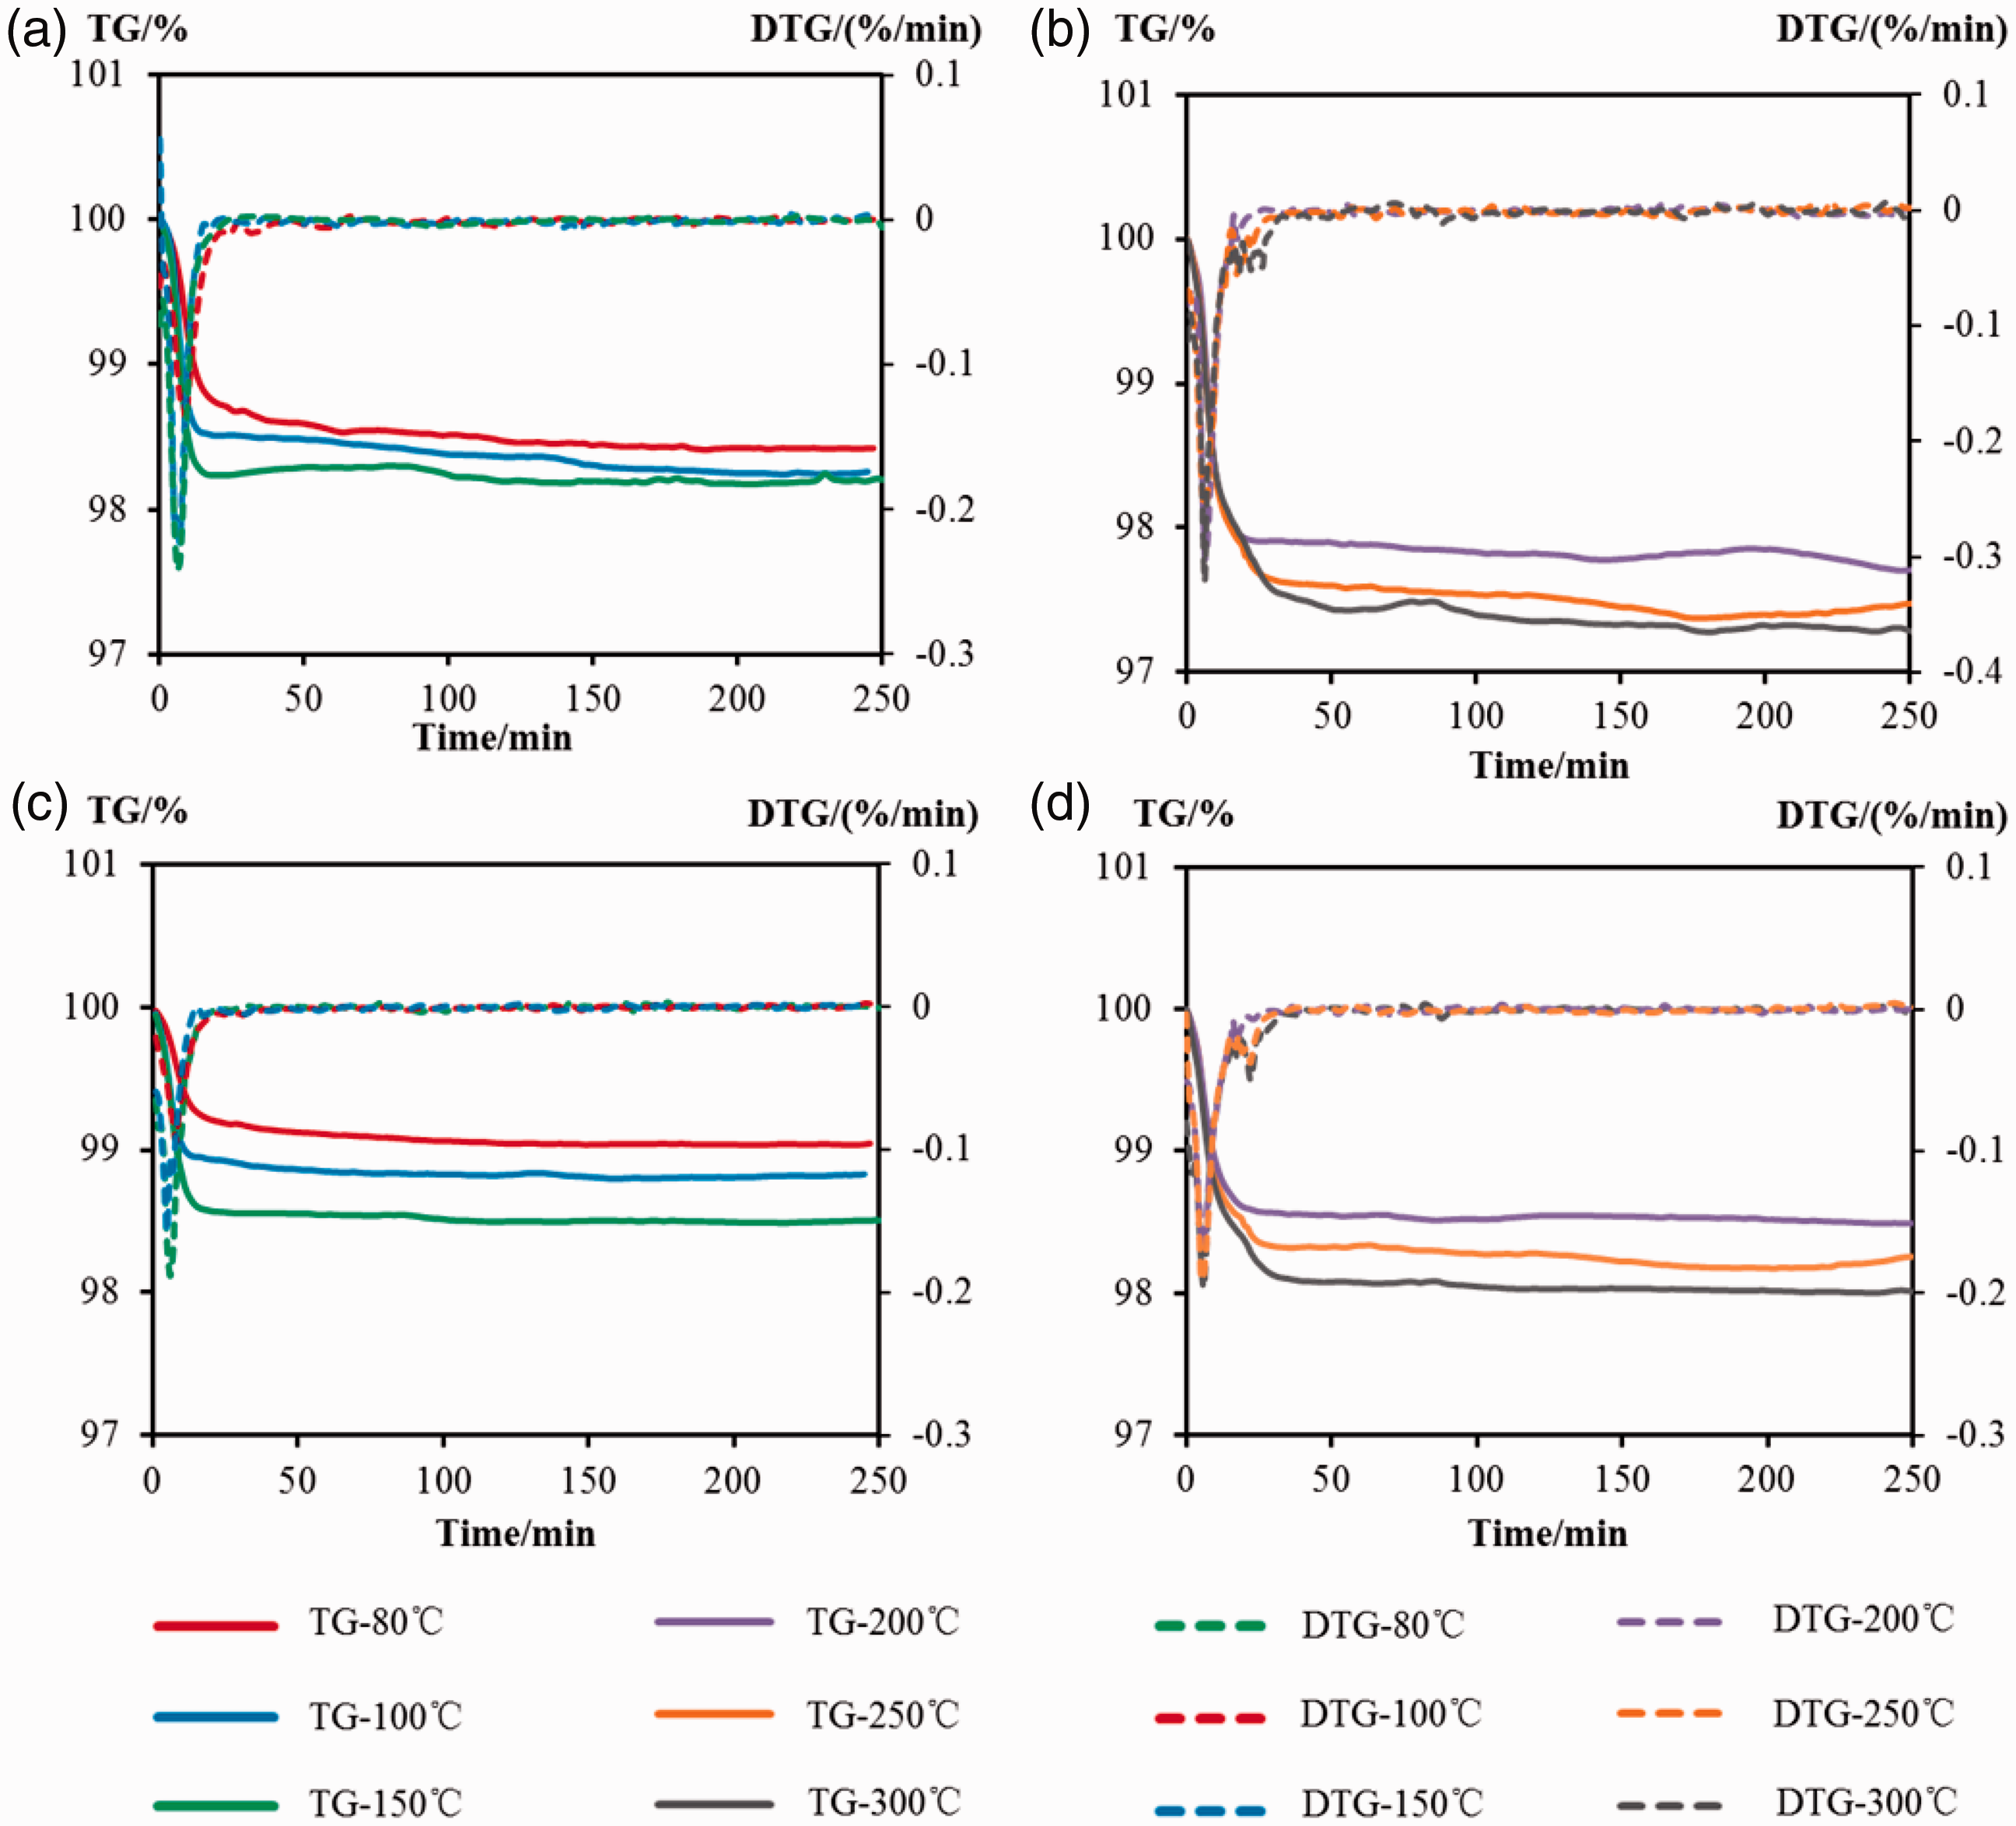
The TG and DTG of the two samples at different heating temperatures. (a and b) The TG and DTG of ZY-1 and (c and d) the TG and DTG of ZY-2.
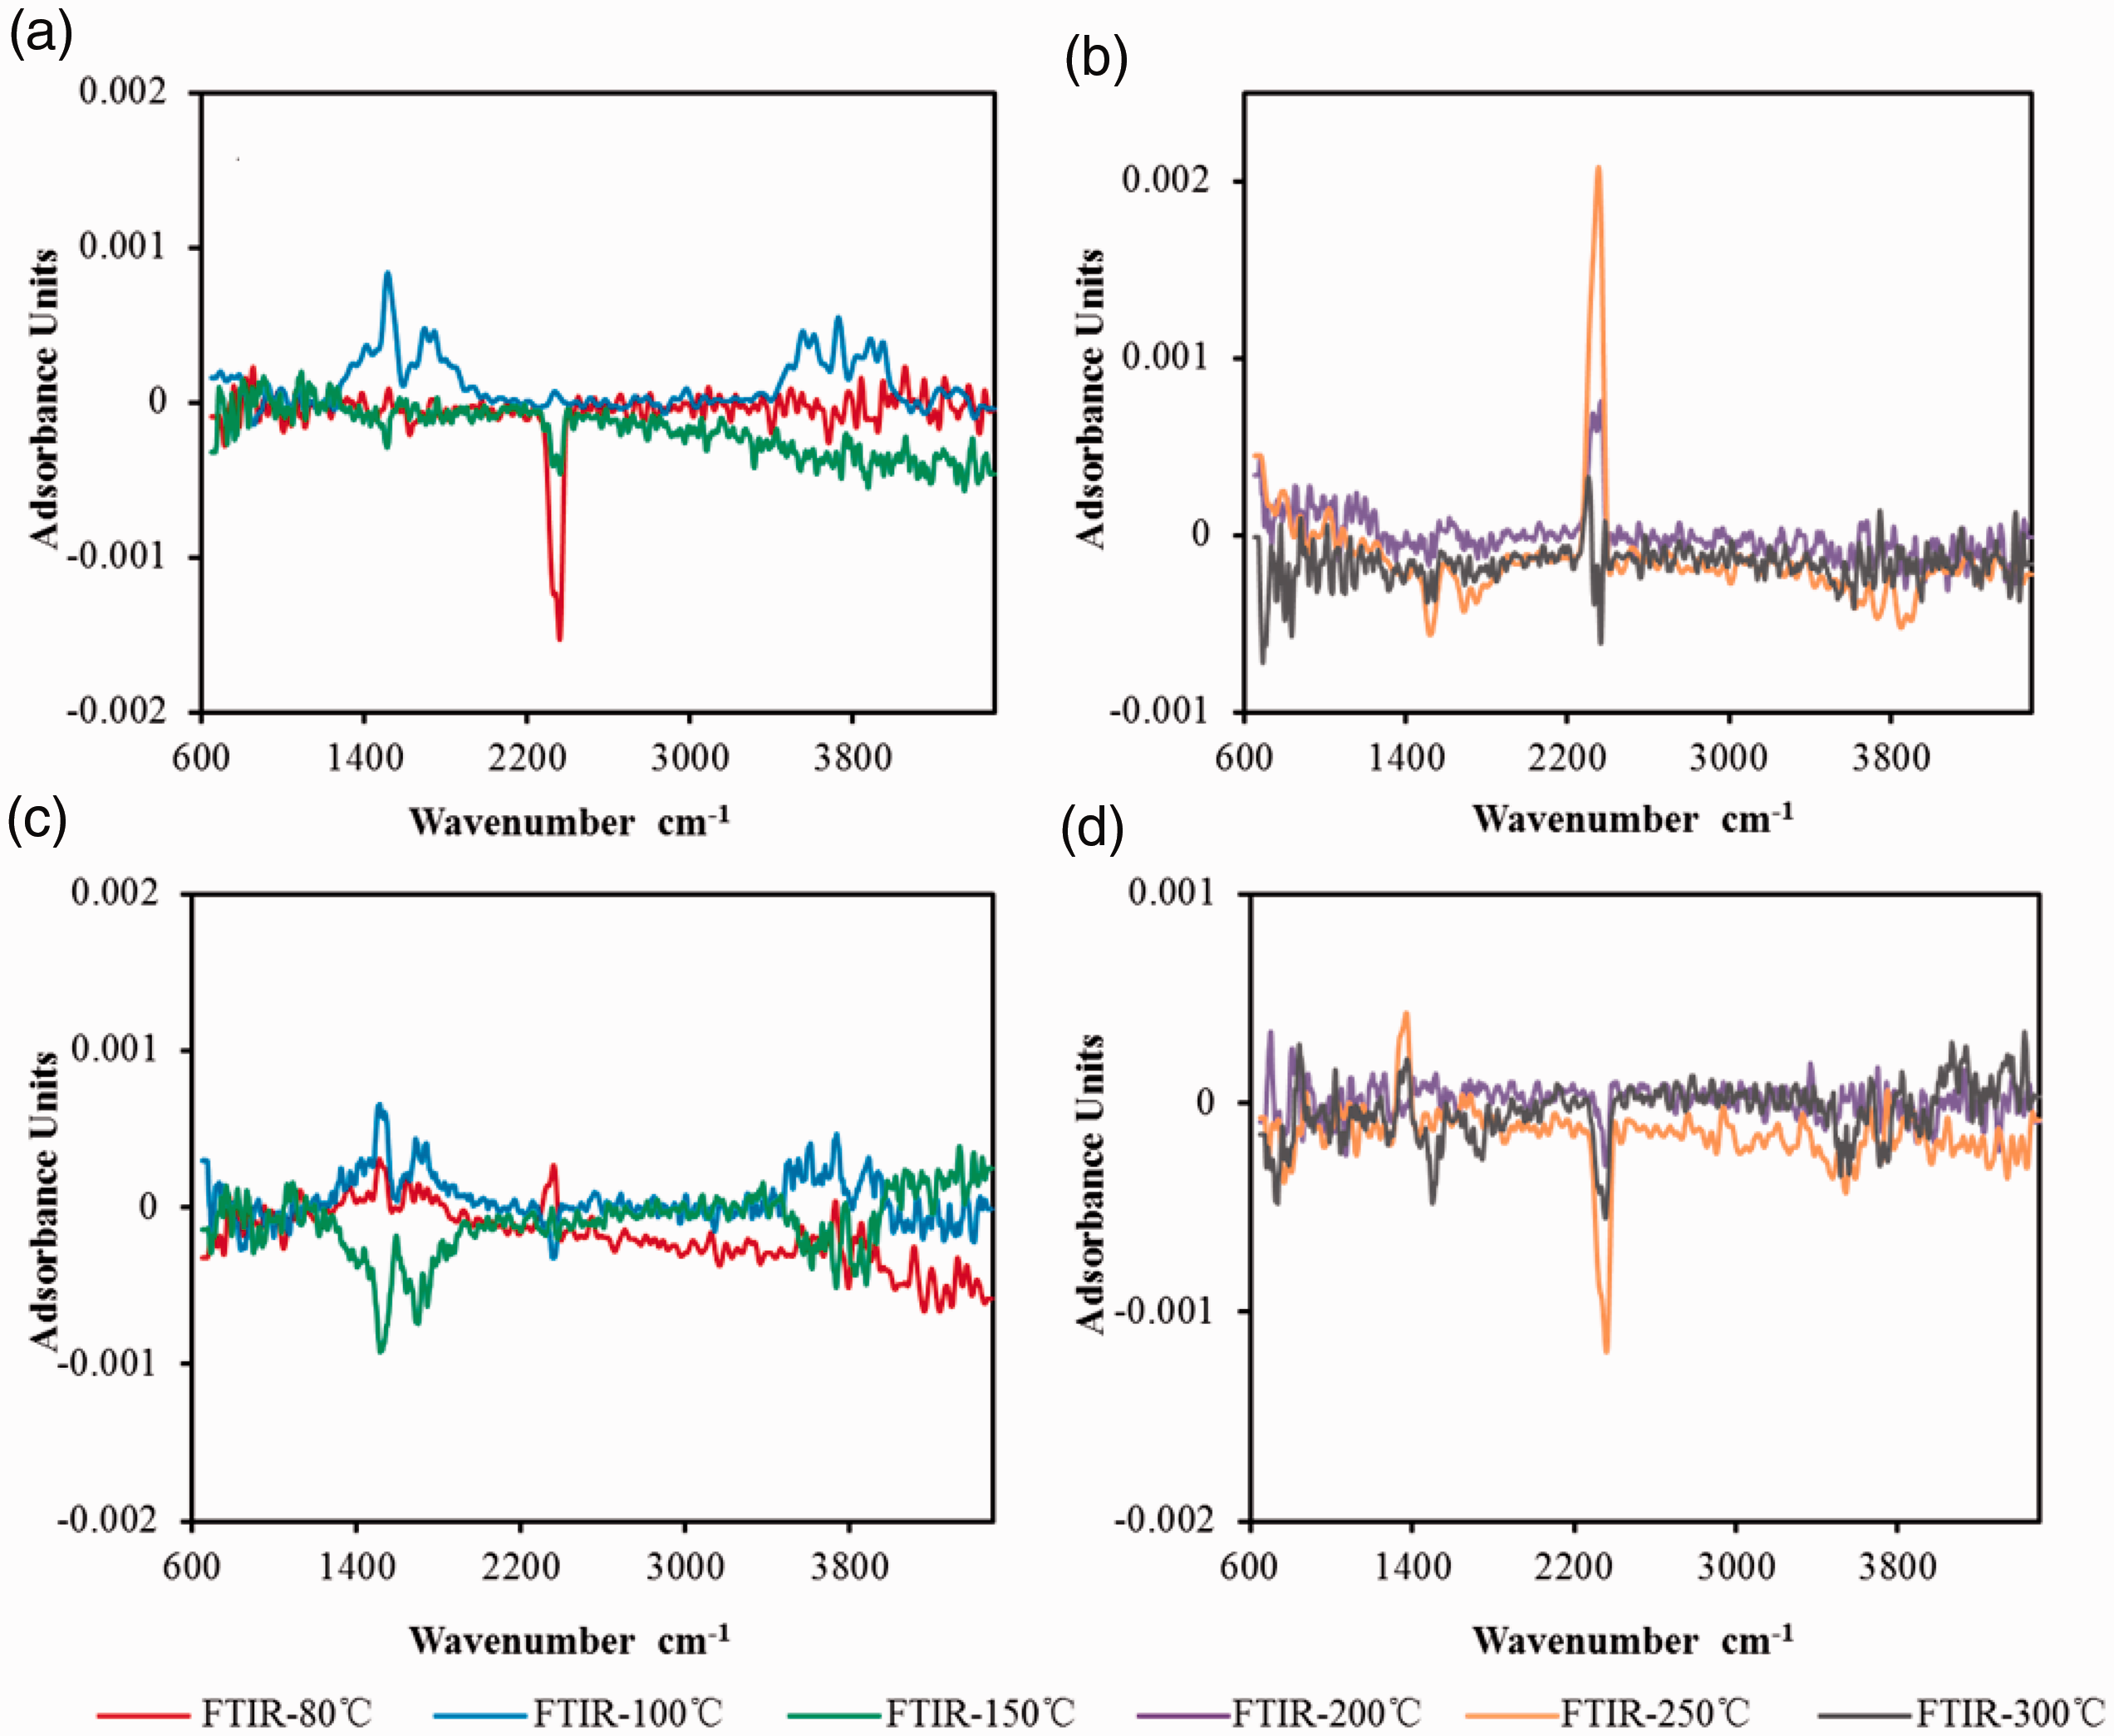
The infrared spectra of the evolved gases from the two samples at different heating temperatures. (a and b) The infrared spectra of ZY-1 and (c and d) the infrared spectra of ZY-2.
With the temperature further increasing from 200°C to 300°C, the second weight loss happens, which could be found more obviously in DTG curves (Figure 3(c) and (d)). The second weight losses of the two samples have different absorption bands in infrared spectra (Figure 4(b) and (d)). The sample ZY-1 presents an absorption band near 2350 cm−1 (Figure 4(b)), which should derive from CO2 produced by the decomposition of liquid hydrocarbon or organic matter. For the sample ZY-2, absorption bands near 1370 cm−1 possibly stemmed from SO2 are shown (Figure 4(d)), and the SO2 may be generated by the decomposition of sulfur organic matter or pyrites in the sample. Considering that the decomposing temperature of pyrites is higher than 300°C (Grovest et al., 1987), sulfur organic matter should be the only source of SO2. The above analyses indicate that the composition materials of the samples, especially for liquid hydrocarbon or organic matter, could be expulsed or decomposed if the samples are heated at a relative high temperature (Chen and Xiao, 2014). In addition, from 200°C to 300°C, the sample ZY-1 also present larger weight loss (about 0.5%) than ZY-2 (Figure 3(b) and (d)), implying more volatile hydrocarbons for ZY-1 are expulsed. Correspondingly, from 200°C to 300°C, although the increase of Vmicropore for the two samples are the same (0.0005 cc/g), the SBET of ZY-1 increased by 2.3 m2/g, which is larger than ZY-2 (1.1 m2/g) (Table 2). This is quite likely caused by the higher TOC content in ZY-1 (9.7%) than ZY-2 (3.7%) (Table 1). It suggests that the increase of SBET and Vmicropore maybe result from the adsorption sites occupied by liquid hydrocarbon or the micropores produced during decomposition of organic matter when the outgas temperature exceeds 200°C. Therefore, in the premise of unchanging the composition of samples, 150°C should be a more suitable temperature than the temperature exceeds 200°C.
To sum up, the purpose of outgassing is to remove the free water and volatile materials in the samples. Considering the potential energy overlapping of the micropore walls and the hydrophilic mineral (such as clay minerals) in shale, the free water is unlikely to be removed completely at the boiling point of water (i.e. 100°C). Therefore, the outgas temperature should exceed 100°C. But an excessive temperature maybe causes the decomposition of organic matter or hydrocarbons (200°C–300°C). Consequently, 150°C should be selected as the outgas temperature for shale in LPNA. In addition, it can be seen that the heating time have no obvious effects on the samples in four hours (Figure 3). However, as organic matter maybe evolves to more mature in the heating process, it is not recommended to outgas for too long time, especially for the low mature samples. From the above discussions, the shale samples outgassed at 150°C for four hours are recommended as suitable outgas procedure for LPNA experiments.
Conclusions
Different outgas temperature of LPNA on shales result in various estimations on pore characteristics. To obtain ideal outgas temperature for shales in LPNA experiments, two shale samples from Niutitang formation were investigated in six outgas temperatures (80°C, 100°C, 150°C, 200°C, 250°C, 300°C). Combined LPNA and TG-FTIR, this study uncovered the changes of pore characteristics and material composition during outgassing.
Outgassing is a necessary procedure to remove free water and volatile materials in the samples before conducting LPNA experiments. The results showed that adsorbed volumes in the initial adsorption stage increase with rising outgas temperature, which lead to the increase of SBET and Vmicropore, meaning that more micropores could be detected at higher outgas temperature. Based on TG-FTIR analyses, at low outgas temperatures (from 80°C to 150°C), the removal of free water caused the increase of adsorption sites in micropores. Excessive outgas temperatures (from 200°C to 300°C) could promote the decomposition of organic matter or expulse hydrocarbons and then generate a certain amount of adsorption sites. Consequently, the outgas temperature at 150°C could not only keep sample composition unchanged but also remove free water more completely. Therefore, 150°C is supposed to be a suitable outgas temperature for LPNA experiments.
Footnotes
Declaration of conflicting interests
The author(s) declared no potential conflicts of interest with respect to the research, authorship, and/or publication of this article.
Funding
The author(s) disclosed receipt of the following financial support for the research, authorship, and/or publication of this article: This work is supported by the National Natural Science Foundation of China (41802143).