
Abstract
Generating electricity through renewable energies is growing increasingly to reduce the huge demand on electricity and the impact of fossil energies on the environment, the most common sources forms used are: the wind, the sun, the photovoltaic and the thermal, without forgetting hydropower by the bays of dams. Fortunately, 70% of our planet is covered by the seas and oceans, this area constitutes a huge potential for electricity production to be exploited. The scientific advances of recent years allow a better exploitation of these resources especially the marine current due to its reliability and predictability. The marine current energy is extracted using a hydrokinetic turbine (HKT) which transform the kinetic energy of water into an electrical energy. The exploitation of this resource needs in the first step the assessment of marine currents in the study area for implementing the HKT, and the second step is designing an adequate technology. The main goal of this study is the assessment of the marine current resource on the Moroccan Mediterranean coast to evaluate the suitable area to implement the HKT, and to determine the marine current speed intensities at different depths. As well as, to estimate an average potential existing in the site. Moreover, we will conduct a study based on the results of the assessment that was made to design a horizontal axis marine current turbine (HAMCT). Two hydrofoil profile were considered to design a HAMCT using the Blade Element Theory (BEM) and calculating their performances adapted to the site conditions Naca4415 and s8052. In addition, a comparison was made between this two HAMCT hydrofoil profile for deciding the best one for implementing in the studied area.
Keywords
Introduction
The energetic issue has become the first challenge of the whole world due to demographic and economic growth. To fulfill the enormous energy demand, a great interest has been given to renewable energies, so different types and sources of energy production have been studied and are being improved. The used sources are those of wind, solar, and dams (O’Rourke et al., 2010) but all of them can't retort to the demands in the present situation.
The oceans and seas constitute a huge potential resource of production in the world. It can be reducing electricity cost production and minimizing the impact of pollution on the environment caused by the high use of polluting energy sources such as fuel. The recovery of marine energy has grown rapidly contributing more and more to meet energy needs and reduce fuel requirements. Marine Renewable Energies (MRE) becomes the interest not only to the scientific and industrial community but also to the political community. On the scientific and industrial side, interest in MRE is manifested in the organization of specific conferences.
The MRE assessment conditions are necessary to estimate the energy resource available in the area of interest and to optimize the design of the used technologies. Taking into account non-technical factors (Dalton et al., n.d.) such as the cost of investments for building, control, maintenance, and energy transportation by submarine cables; nearshore areas are the best areas due to their proximity to the coast and harbors.
Several research studies in the field of marine energy have been carried especially for the case of wave energy assessment which is an essential step to proceed further into the detailed estimation of wave energy resource in a particular location. The assessment can be made using the global wave power dataset (is the default calibrated wave database contained in the standard World Waves package) It consists of operational ECMWF WAM model data for 10 years and has been validated and calibrated using global TOPEX and JASON altimeter significant wave (Mork et al., 2010). Other research was made using some numerical wave models (Arinaga and Cheung, 2012; Cornett, 2008; Gunn and Stock-Williams, 2012; Wang et al., 2018).
The wave energy is the Marine renewable energy source having a high energy density and global potential. It is estimated at 32,000 TWh/year (Mork et al., 2010). In Europe, the maximum yearly mean wave is located on the western coast of Scotland and Ireland where 70 kW/m is achieved, in British Columbia and Alaska is about 40 kW/m to 60 kW/m, western South Africa around 50 kW/m, Pacific coasts of southern Chile around 100 kW/m (Clément et al., 2002; Thorpe, 1999) and in Mediterranean Sea is about 15 kW/m (Liberti et al., 2013; Mork et al., 2010).
In Morocco, located in the north-west of Africa of Europe, the energy demand has increased, as the result the growth of the high needs in electricity 6.9% per year (Office National de l’Electricité, 2010). To respond to this huge energy demand, the Moroccan government issued the law related to support the renewable energy sector. The recent legislation gave provides many considerations about the national energy strategy which aims to develop the renewable energy sector to meet 20% of national domestic energy demand (MEMEE, 2008).
Owing to its geographical position, Morocco has a huge potential source of marine renewable energy, it has a view on the Mediterranean Sea and Atlantic Ocean which makes it a country with several sites permitting the exploitation of Marine Renewable Energy MRE (Figure 1).
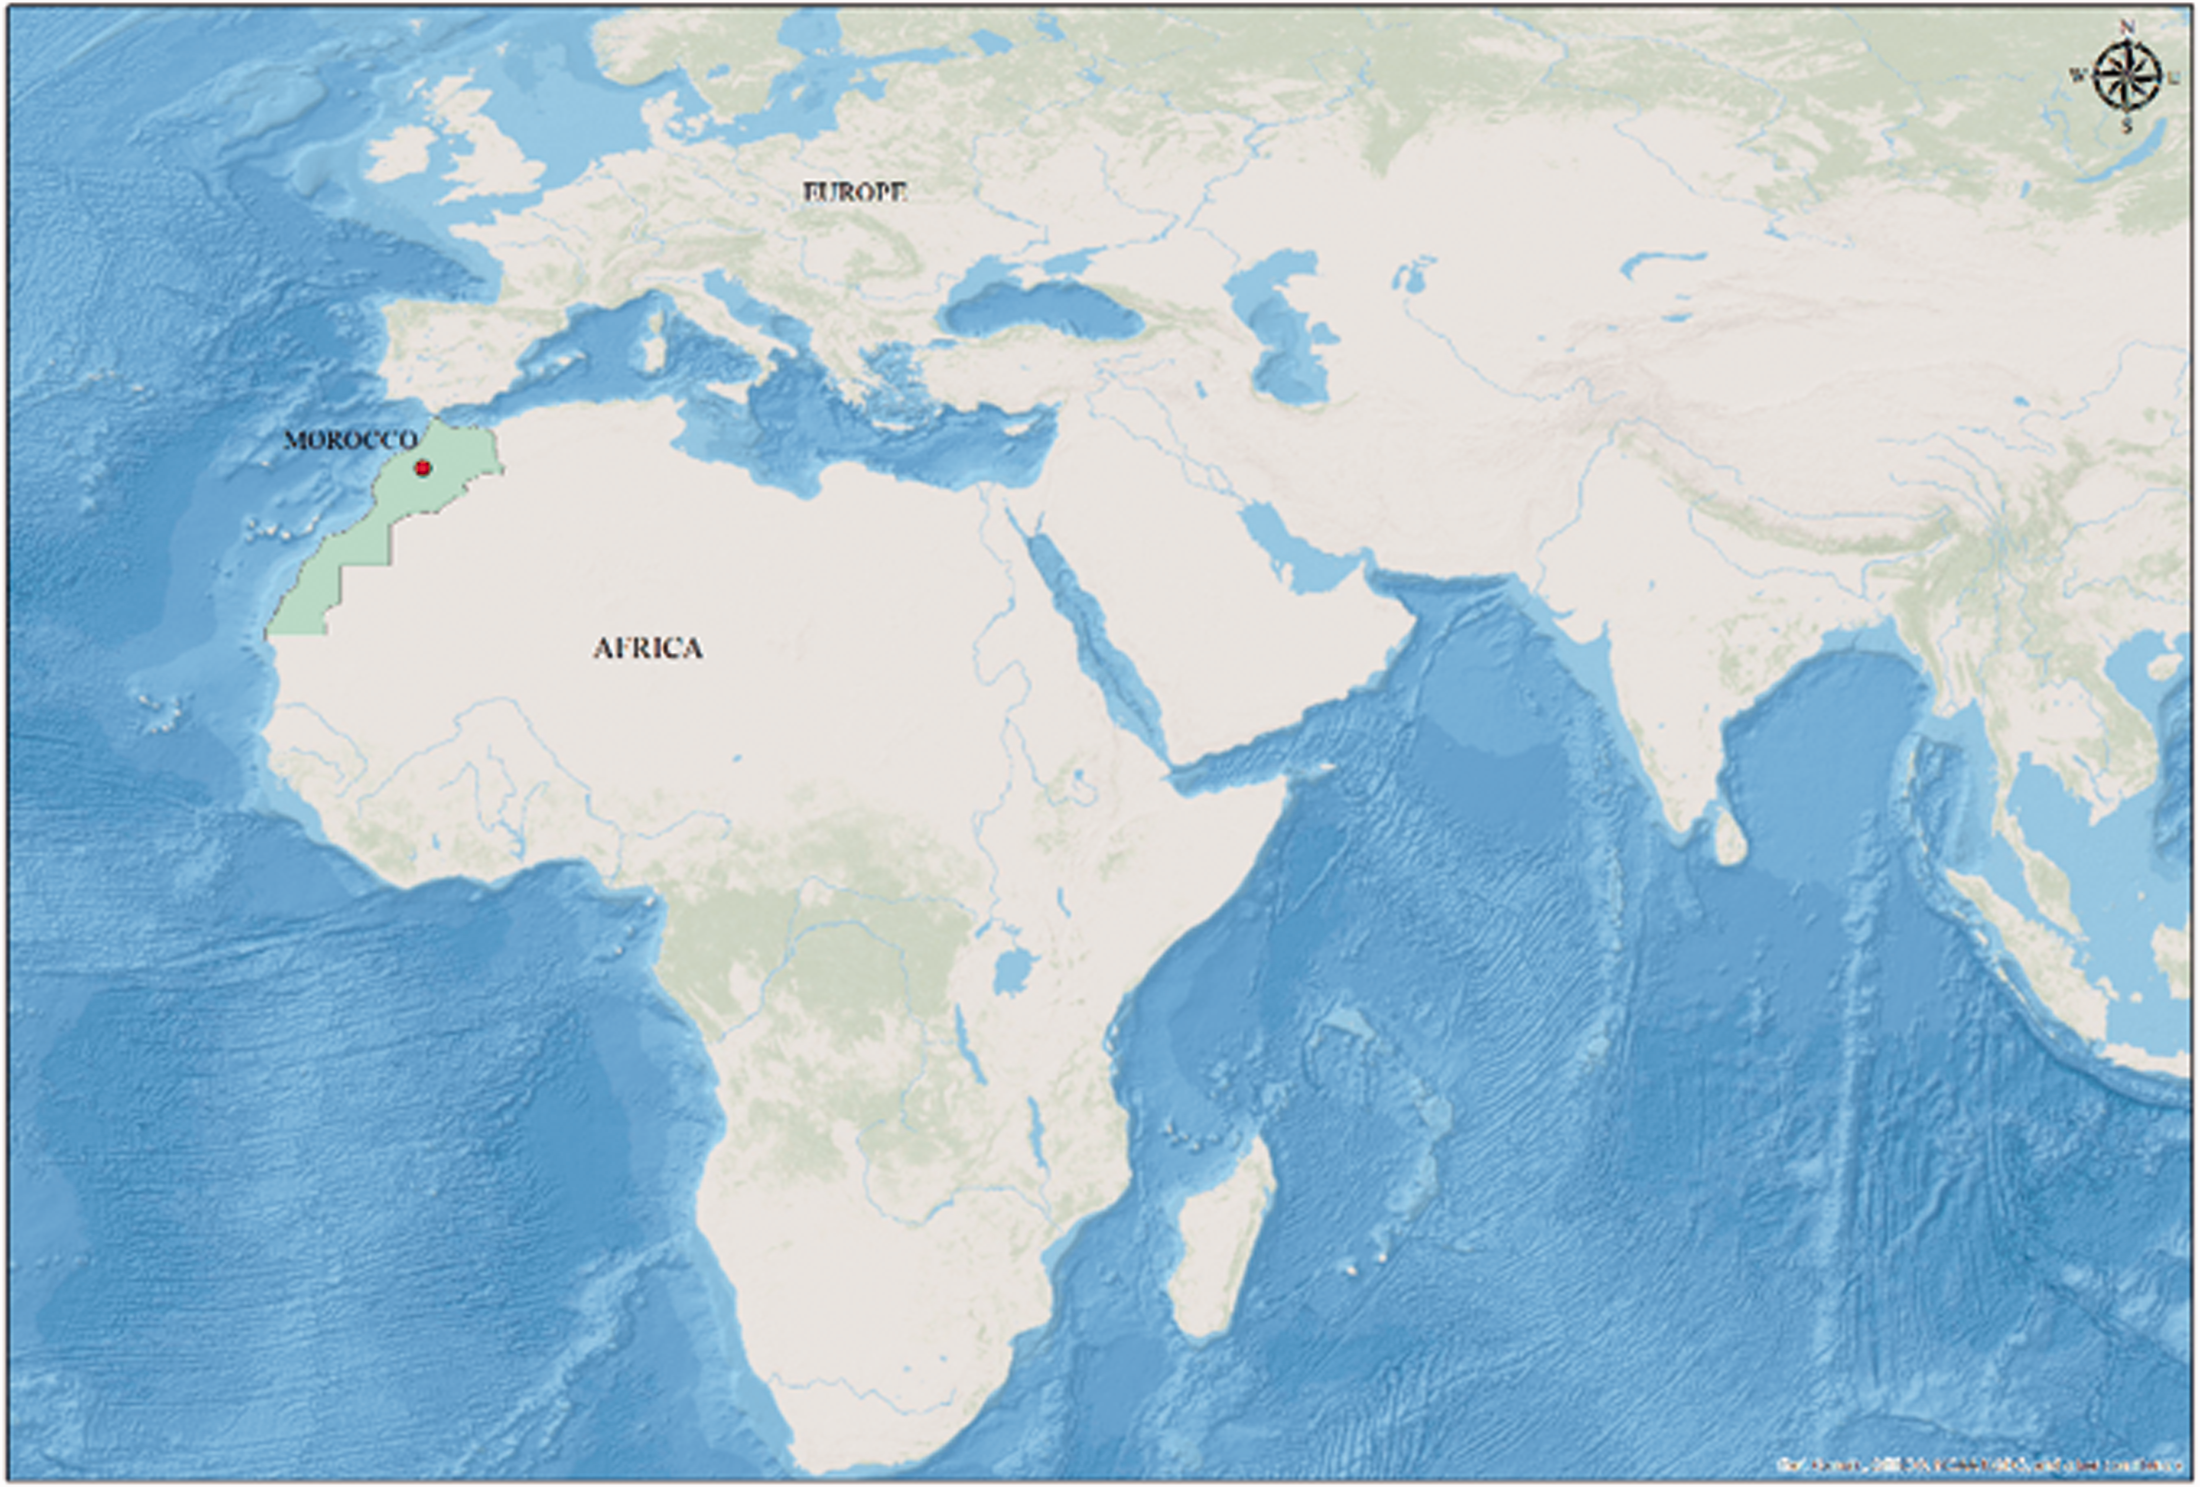
Morocco geographical position.
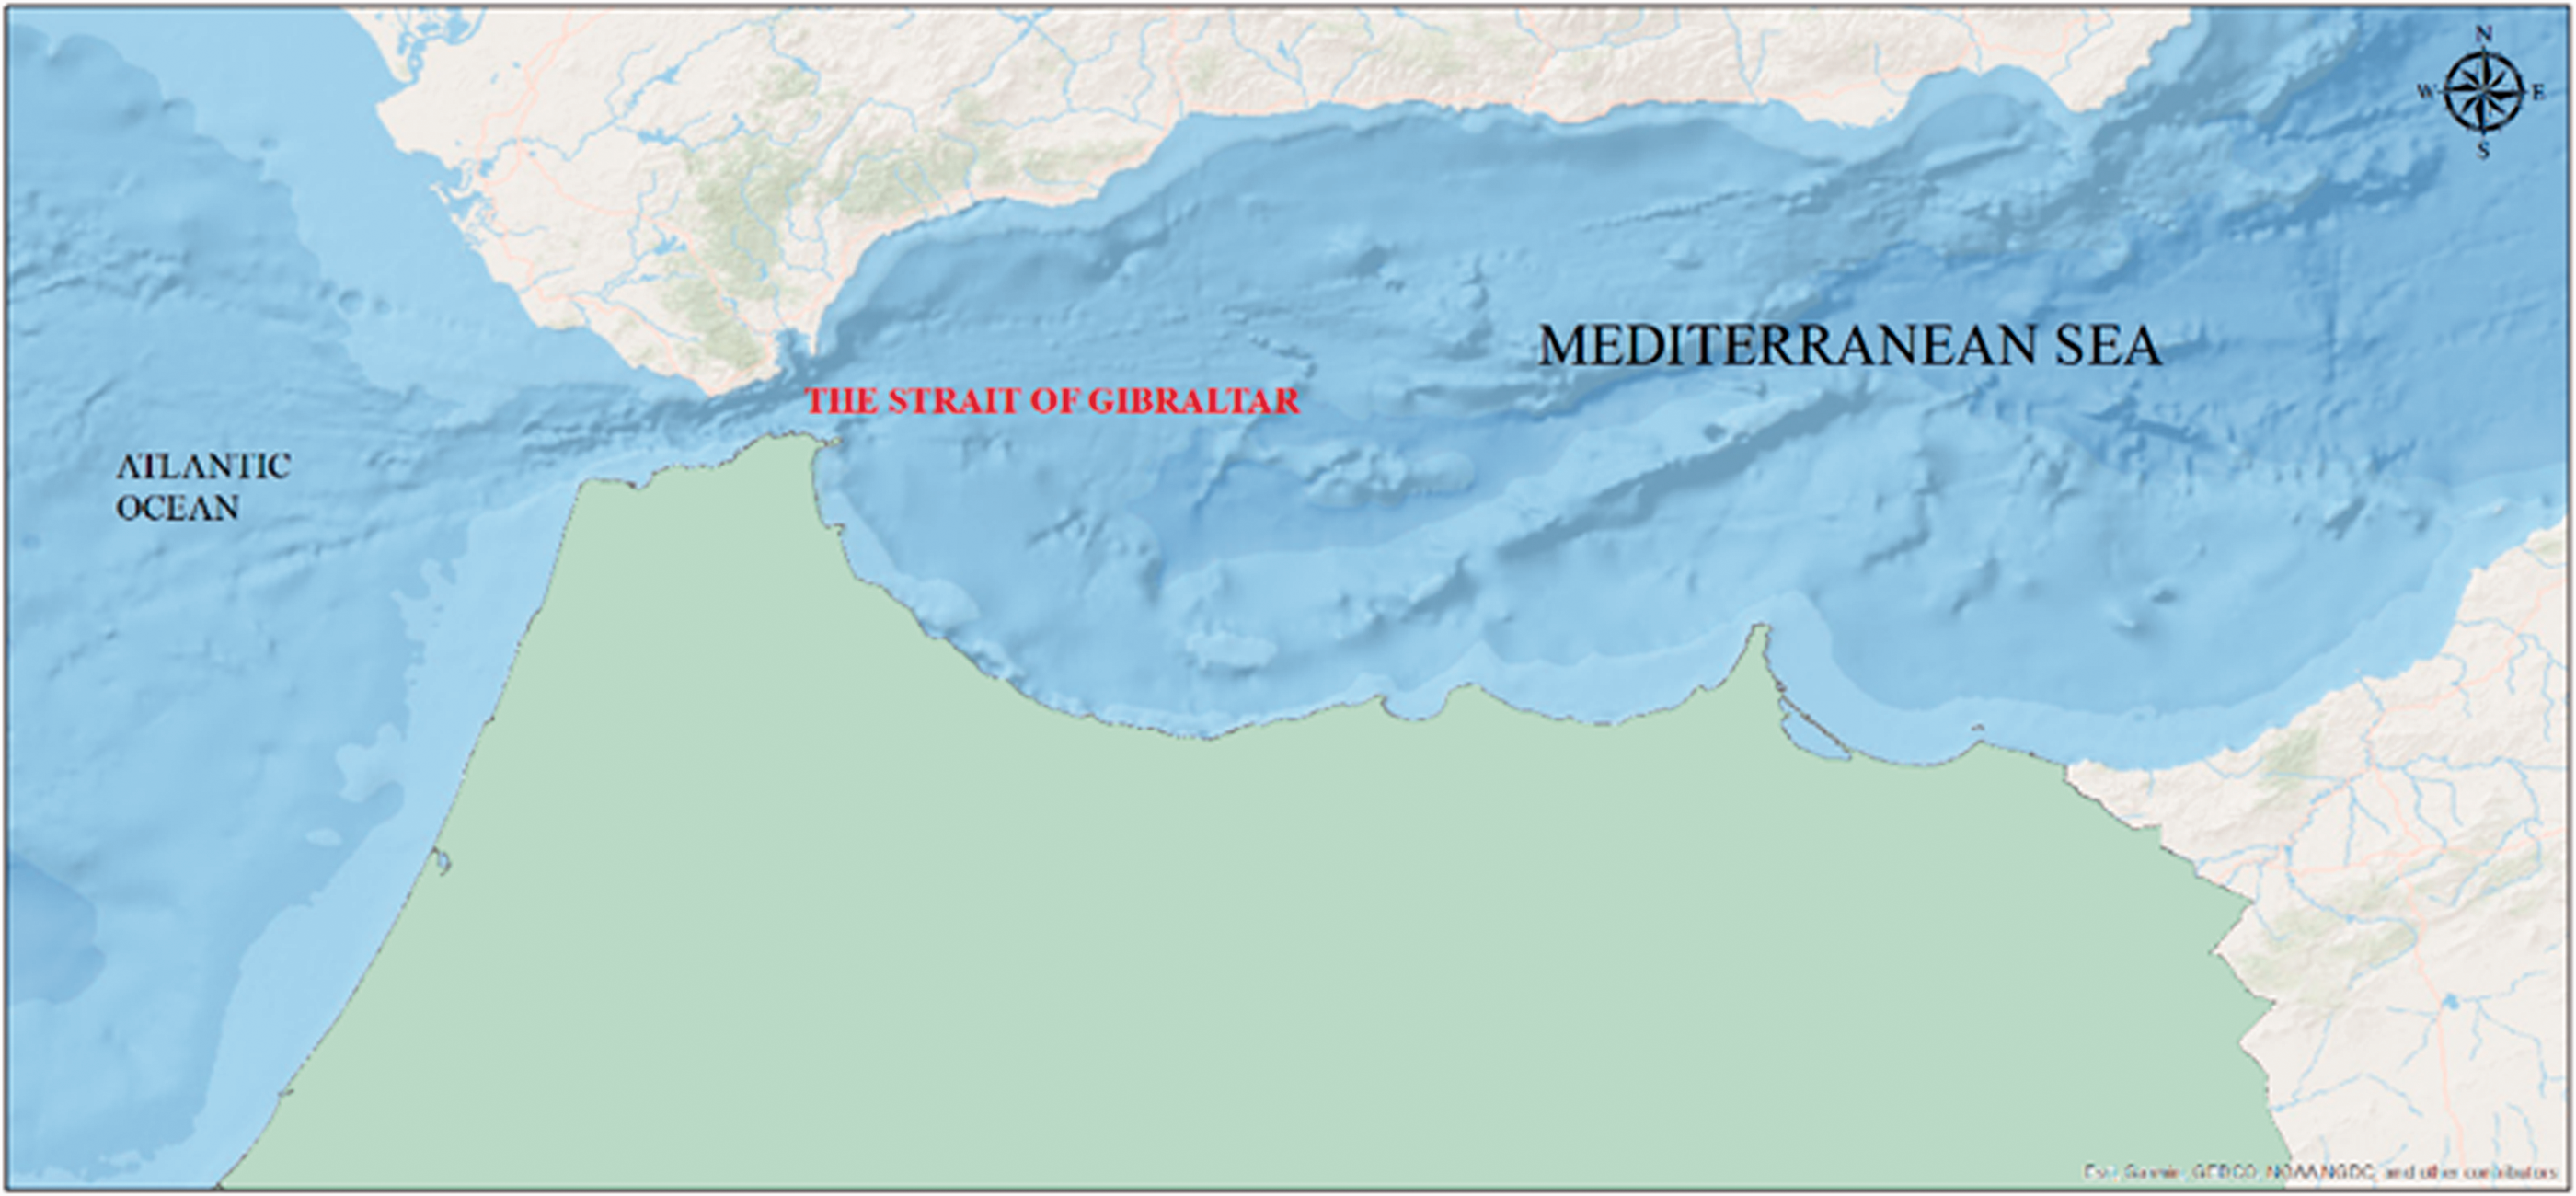
The Marine Current Energy (MCE) is one of the important MRE sources thanks to its predictability and reliability (Schnabl et al., 2019). The marine currents (MC) are the result of the interaction between gravitational forces, sun and moon (Rourke et al., 2010). It is influenced by many water parameters such as salinity, temperature and sea level. The knowledge of the MC distribution velocities is an essential step for evaluating its potential as well as for the choice of the suitable site for implementing the recovery device, a hydrokinetic turbine in the case of our study. Concerning Morocco, many studies show that there are suitable areas with currents velocities more than 1.5 m/s in the Mediterranean Sea especially in the strait of Gibraltar (Hazim et al., 2019; Sutherland et al., 2007) as in the Atlantic coast (Hazim et al., 2019; Sierra et al., 2016). However, the elaboration of an Atlas marine current is the first task for exploiting this source of energy (Mohammadian et al., 2019; Soukissian et al., 2017). The calculation of the currents characteristics and the site selection can be made using numerical models by the knowledge of the bathymetry and some wave data (Hazim et al., 2018). The choice of a numerical model depends on some criteria that are mainly the quality of the output file, output parameters, the quality of resolution of the grid of the calculation. Many models are used for harnessing MRE. As examples of these models, TOMAWAC is used for the construction of the database of marine current and waves in the Atlantic region (User_Manual_Tomawac Open TELEMAC-MASCARET, 2014), TELEMAC 2 D is operated for modeling the tidal stream and marine currents in the Raz Blanchard site(Thiébot et al., 2015). A numerical model was developed for currents in Bangka based on a semi-implicit finite difference method (Nayak and Balaji, 2016).
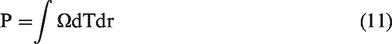
The evaluation of the MC energy resources completes by identifying the theoretical resource. It can be calculated using equation (1):

The extracted energy cannot exceed 59.26% of the energy contained in the marine current according to the Betz limit (Ranjbar et al., 2019).
This value can be changed from an HKT to another depending on many parameters, mainly the type of technology and the stream velocity. The most used technology is the HKAMCT for commercial use since it’s self-starting and highly efficient (Boyle, 2012). Its design depends on predicting the hydrodynamics performance of the rotor (blades). The turbine is controlled by the hydrodynamic forces generated by the blade rotation and marine current. However, to ensure the highest performance of the HKT, the rotor should be attentively designed. The hydrodynamic performances depend on 3 factors: tip-speed ratio, solidity, and Reynolds number. Some studies showed that there are many approaches to evaluate and predict the hydrodynamic performance of HKT: the vortex method (Urbina et al., 2019), the computational dynamics method CFD (Kolekar and Banerjee, 2015; Mannion et al., 2019; Zhou et al., 2019), and also the most used approach is Blade Element Momentum Theory BEMT for optimizing the hydrokinetic blade (Chaudhary and Prakash, 2019; Elgammi et al., 2020).
The first main aim of this work is to assess the current velocity characteristics at different depths in the Moroccan Mediterranean Coast and estimate the theoretical potential of this area. Furthermore, it evaluates the most suitable site for implementing the hydrokinetic turbine. The second objective is to design the HKT rotor adapted to studied area conditions and to determine its performances using the BEMT approach. To sum up, two different types of blade profiles are chosen to conduct this study. The present work is organized in 2 sections: the first one deals with the assessment of marine current velocity at different depths, as well as the energy potential for the case of the Mediterranean Moroccan coast. The second is dedicated to the design of a hydrokinetic rotor adapted to this potential using the BEMT method.
Marine current resources assessment
The tidal current is a predictable phenomenon produced as the result of the interaction of gravitational forces between the sun, the moon and the rotation of the earth. It is influenced by many parameters such as salinity, temperature, and sea level (Rourke et al., 2010). The theoretical potential around the world is estimated at about 800 TWh/year (Gowdy, 2013). The high potential located in Europe (the UK and France) is estimated up to 37 TWh (Soukissian et al., 2017).
Located in the middle of two important continents: Africa and Europe (Figure 2), Morocco has an interesting geographical position. Situated at 32° 00′ N 5° 00′ W (Figure 3), Morocco is bounded by both of the Mediterranean Sea and the Atlantic Ocean. The total length of the Moroccan coast is about 3500 km which gives the country a huge potential source of marine renewable energy. The study area is located in northern Morocco with a view on Europe, it’s about 512 KM from Saiidia to Capespartel. The geographical coordinate is −12°W – 0°W; 36.5°N 34.5°N. The studied area is characterized by its Mediterranean climate (very hot and sunny in the summer and very cold in the winter) especially by the high speed of the wind and high level of the waves, the fact that justifies the presence of interesting currents.
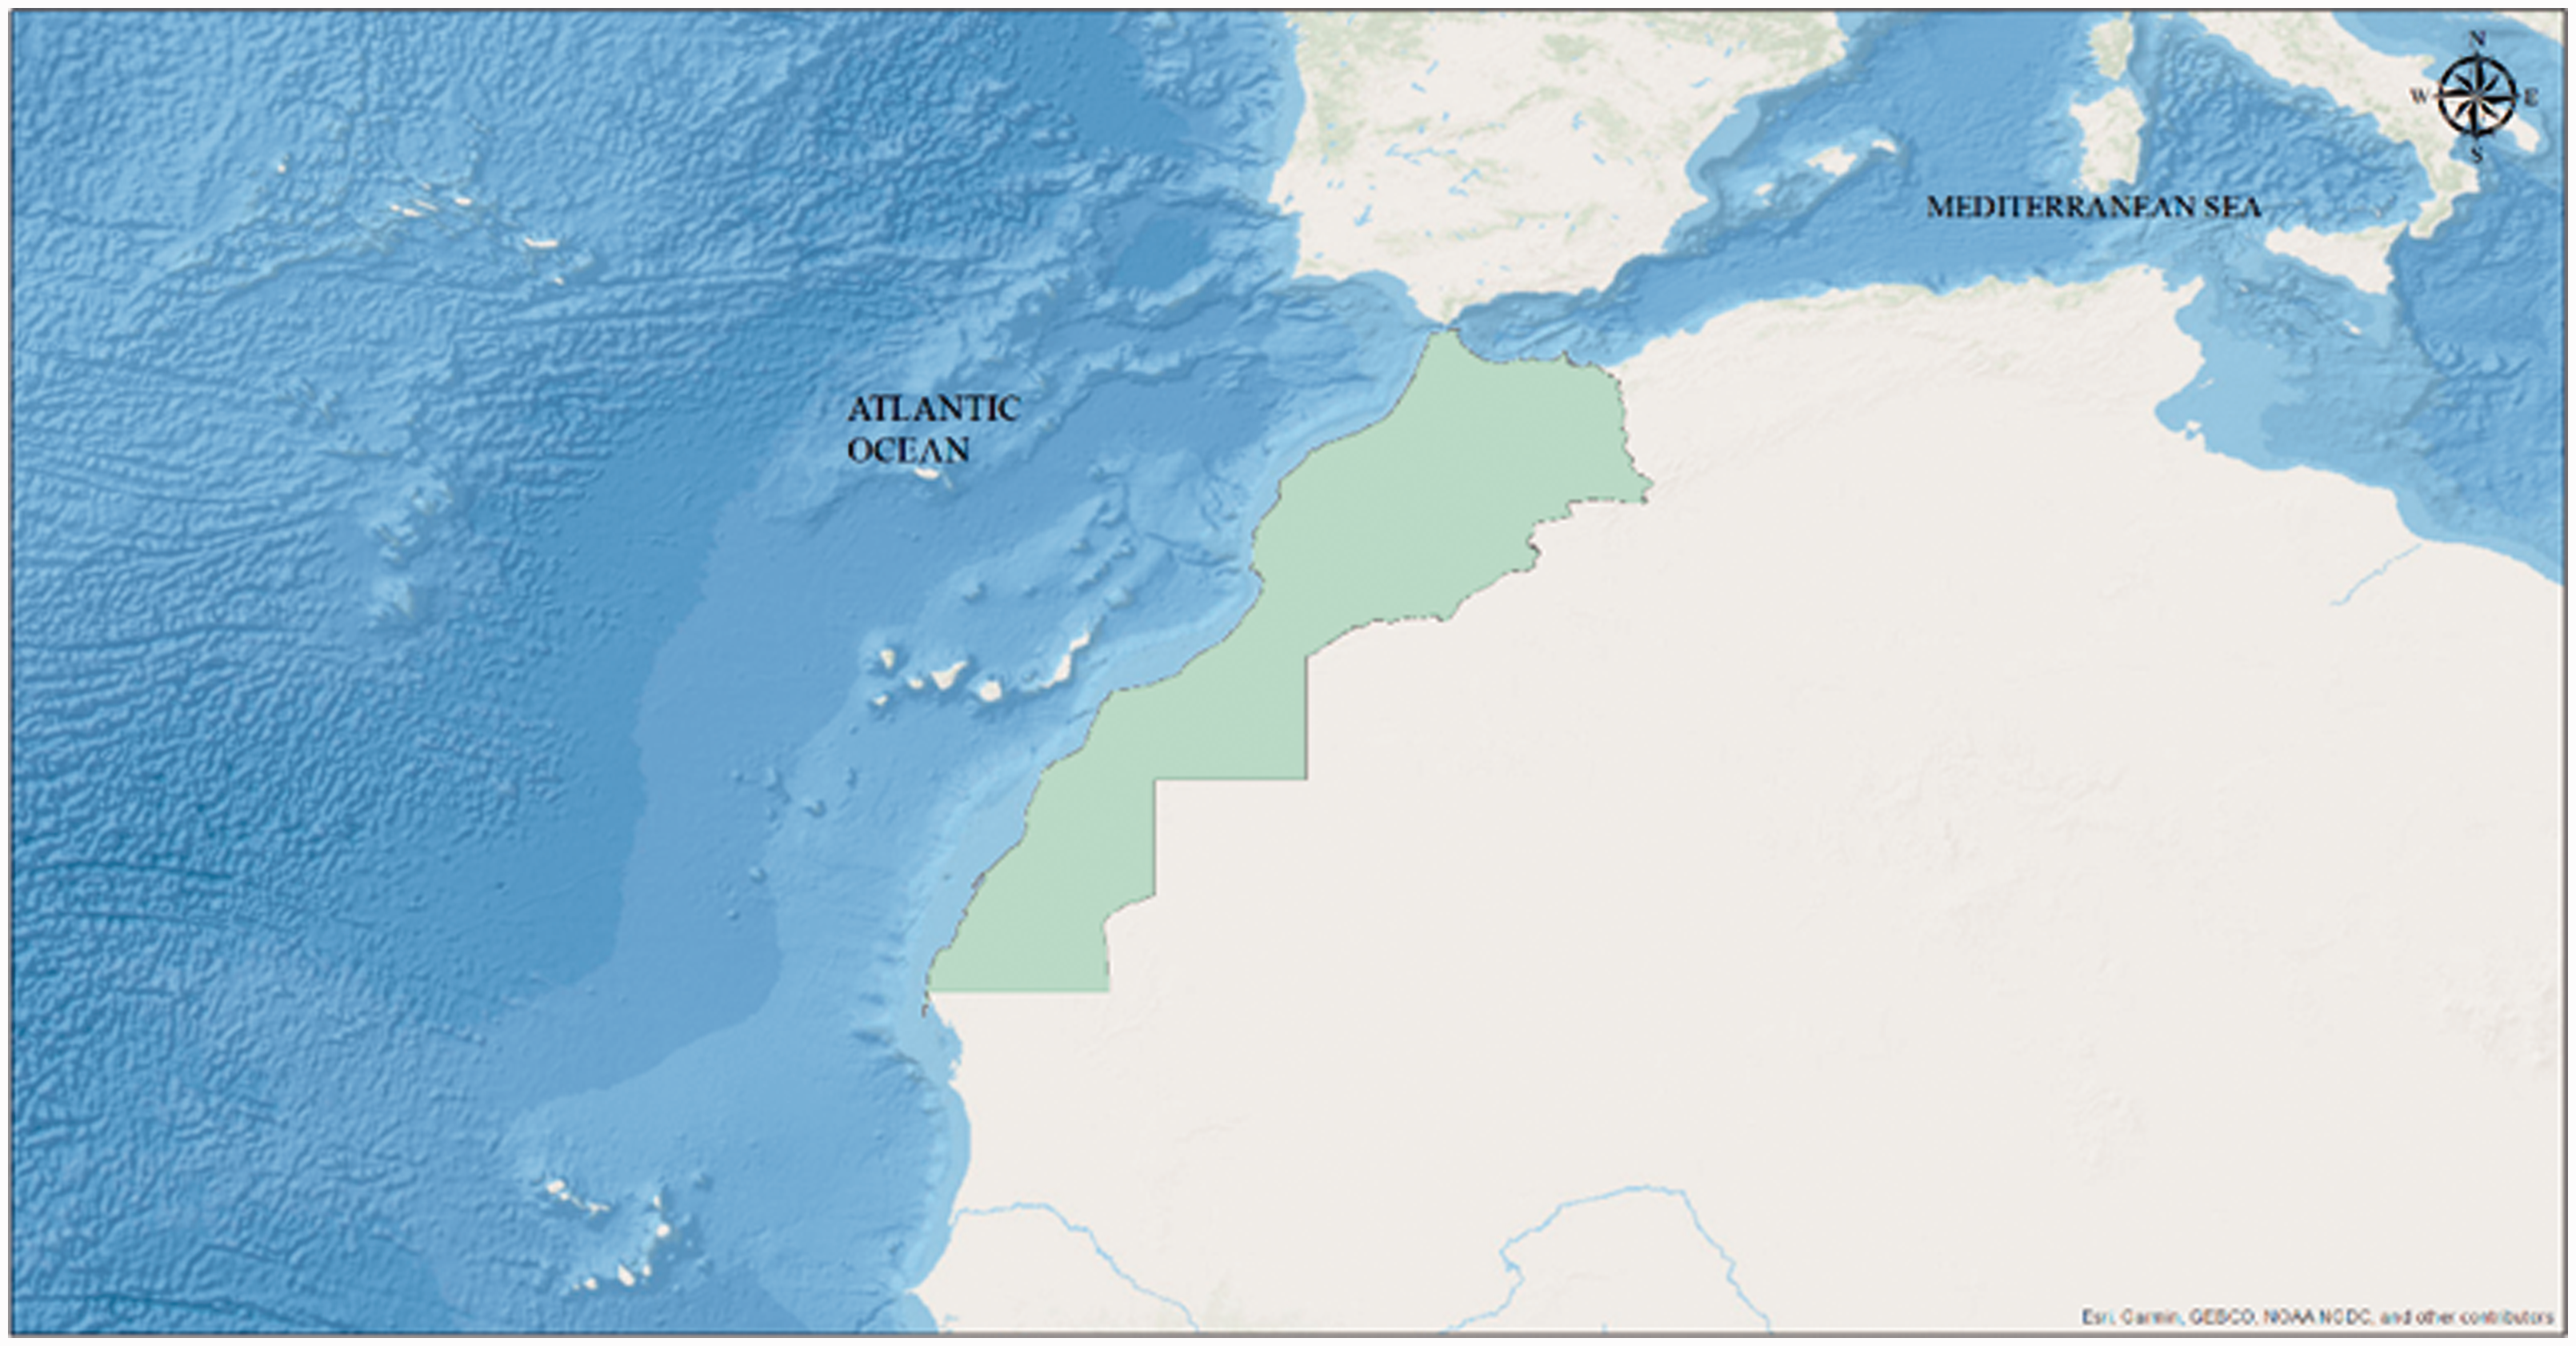
Moroccan coast.
Study area.
The evaluation of the suitable area for harnessing this energy source needs the knowledge of many parameters such as current velocities, water depth, bathymetry. However, the elaboration of an Atlas marine current is the first task for the possible exploitation of this source. The preliminary step of the marine current assessment is the knowledge of the current velocities along the Moroccan Mediterranean coast. As a consequence, the use of numerical models (waves and hydrodynamic models) could be classified the hotspot region with an interesting energetic resource, estimating the available energy, and also the energy that we can produce by the device.
The Currents velocities distribution are provided using the result of the Med-MFC-current model which is developed and used by the Copernicus Marine Environment Monitoring Service CMEMS (CMEMS, 2020). It is a hydrodynamics-wave model coupled to two models, the first one is the hydrodynamics model Nucleus and the second one is the wave model Wave Watch III (WW3) (Tolman, 2009). Also, it covers the whole the Mediterranean area between the geographical position 15°W 36.25° E;30.19°N 45.94°N with a spatial resolution of 1/24° * 1/24°.
The data used for this study correspond to one year (2018) hindcasting of currents velocities at 3 different depths with a spatial distribution from the Mediterranean Sea. The use of this simulation probably may have some failing in terms of exactly interpreting some events as cyclone events, but it generally represents mean values quite well, and this database proposes homogeneous long-term data and higher spatial coverage than that achieved with single-point observations. Furthermore, the CMEMS database was formerly used to assess tidal current (Lecornu et al., 2013).
Figure 4 shows the velocity distributions of marine currents along the Moroccan Mediterranean coastline according to several depths. It’s varying between 0 m/s and 2.8 m/s. The maximum speed is 2.8 m/s and is located on a depth of 10 m between the strait of Gibraltar and El Houceima. Nevertheless, in the deepest zones, the speeds reach 1.5 m/s at 50, 0.9 m/s at 70 m, and 0.5 m/s at 100 m of the depth. The important current velocities are located between the Tangier coast and the Gibraltar’s strait.
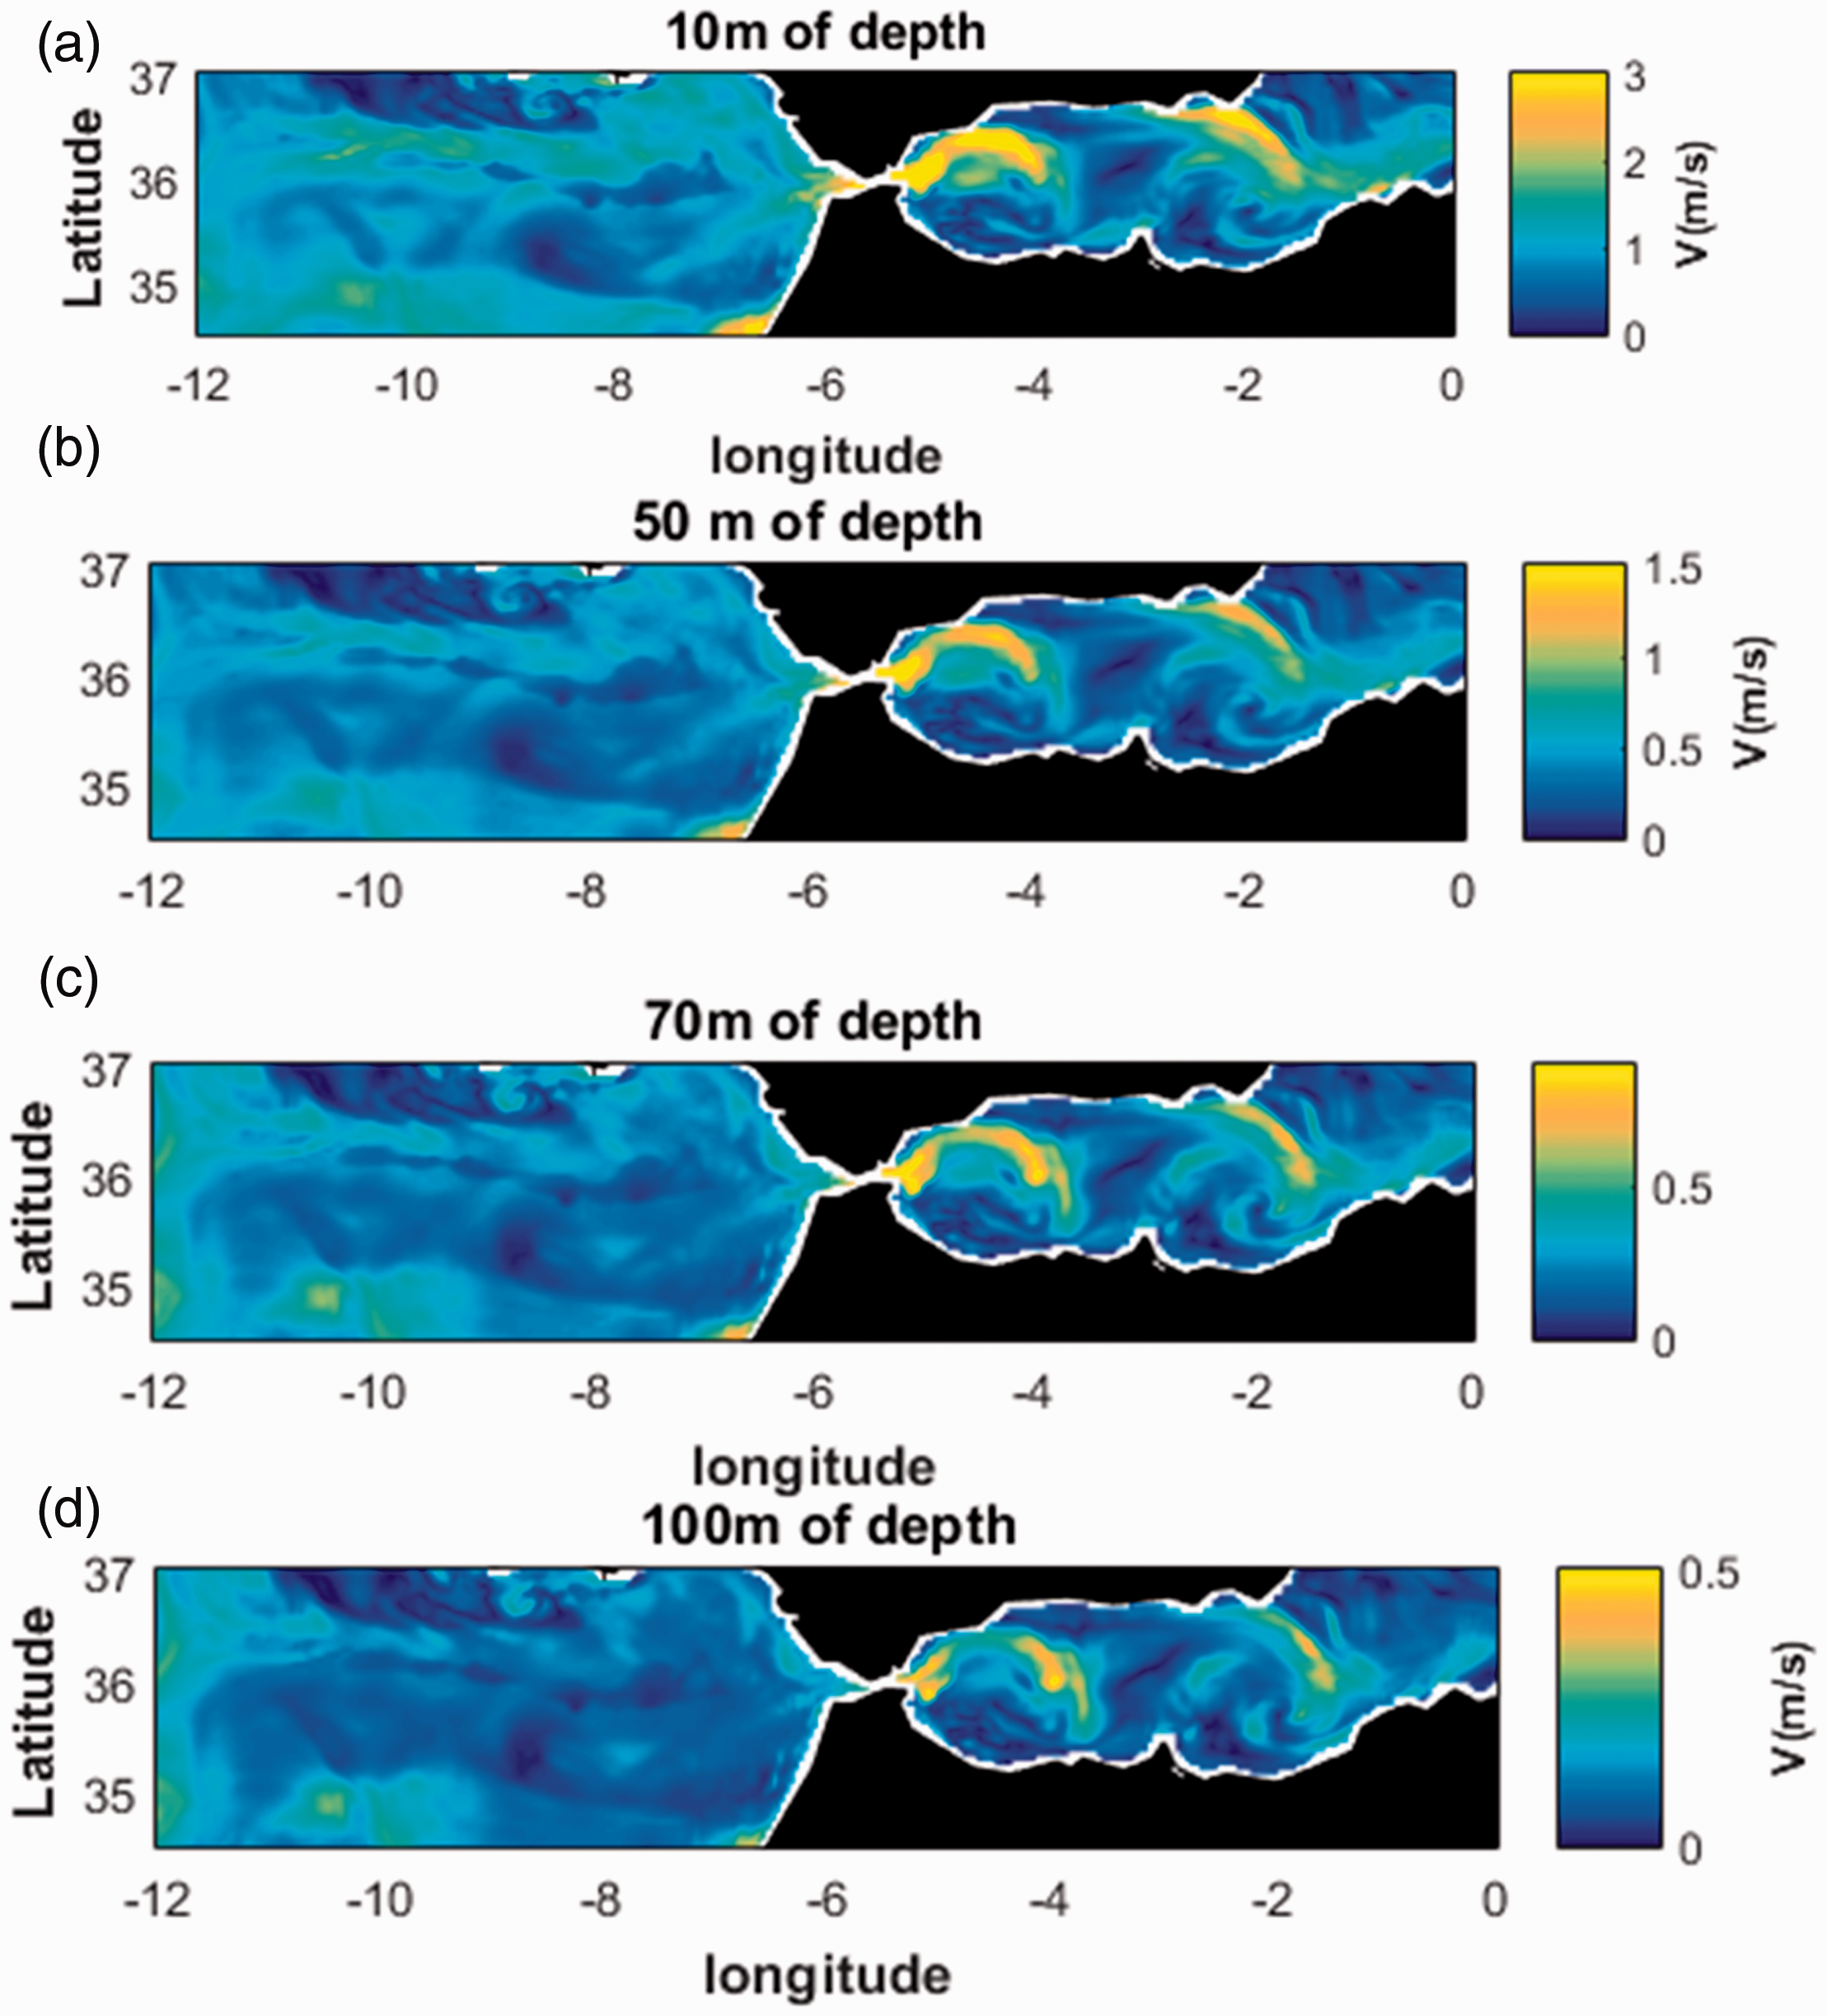
Current distribution in the Mediterranean at different depths: (a) the current velocities distribution at 10 m, (b) the current velocities distribution at 50 m, (c) the current velocities distribution at 70 m, and (d) the current velocities distribution at 100 m.
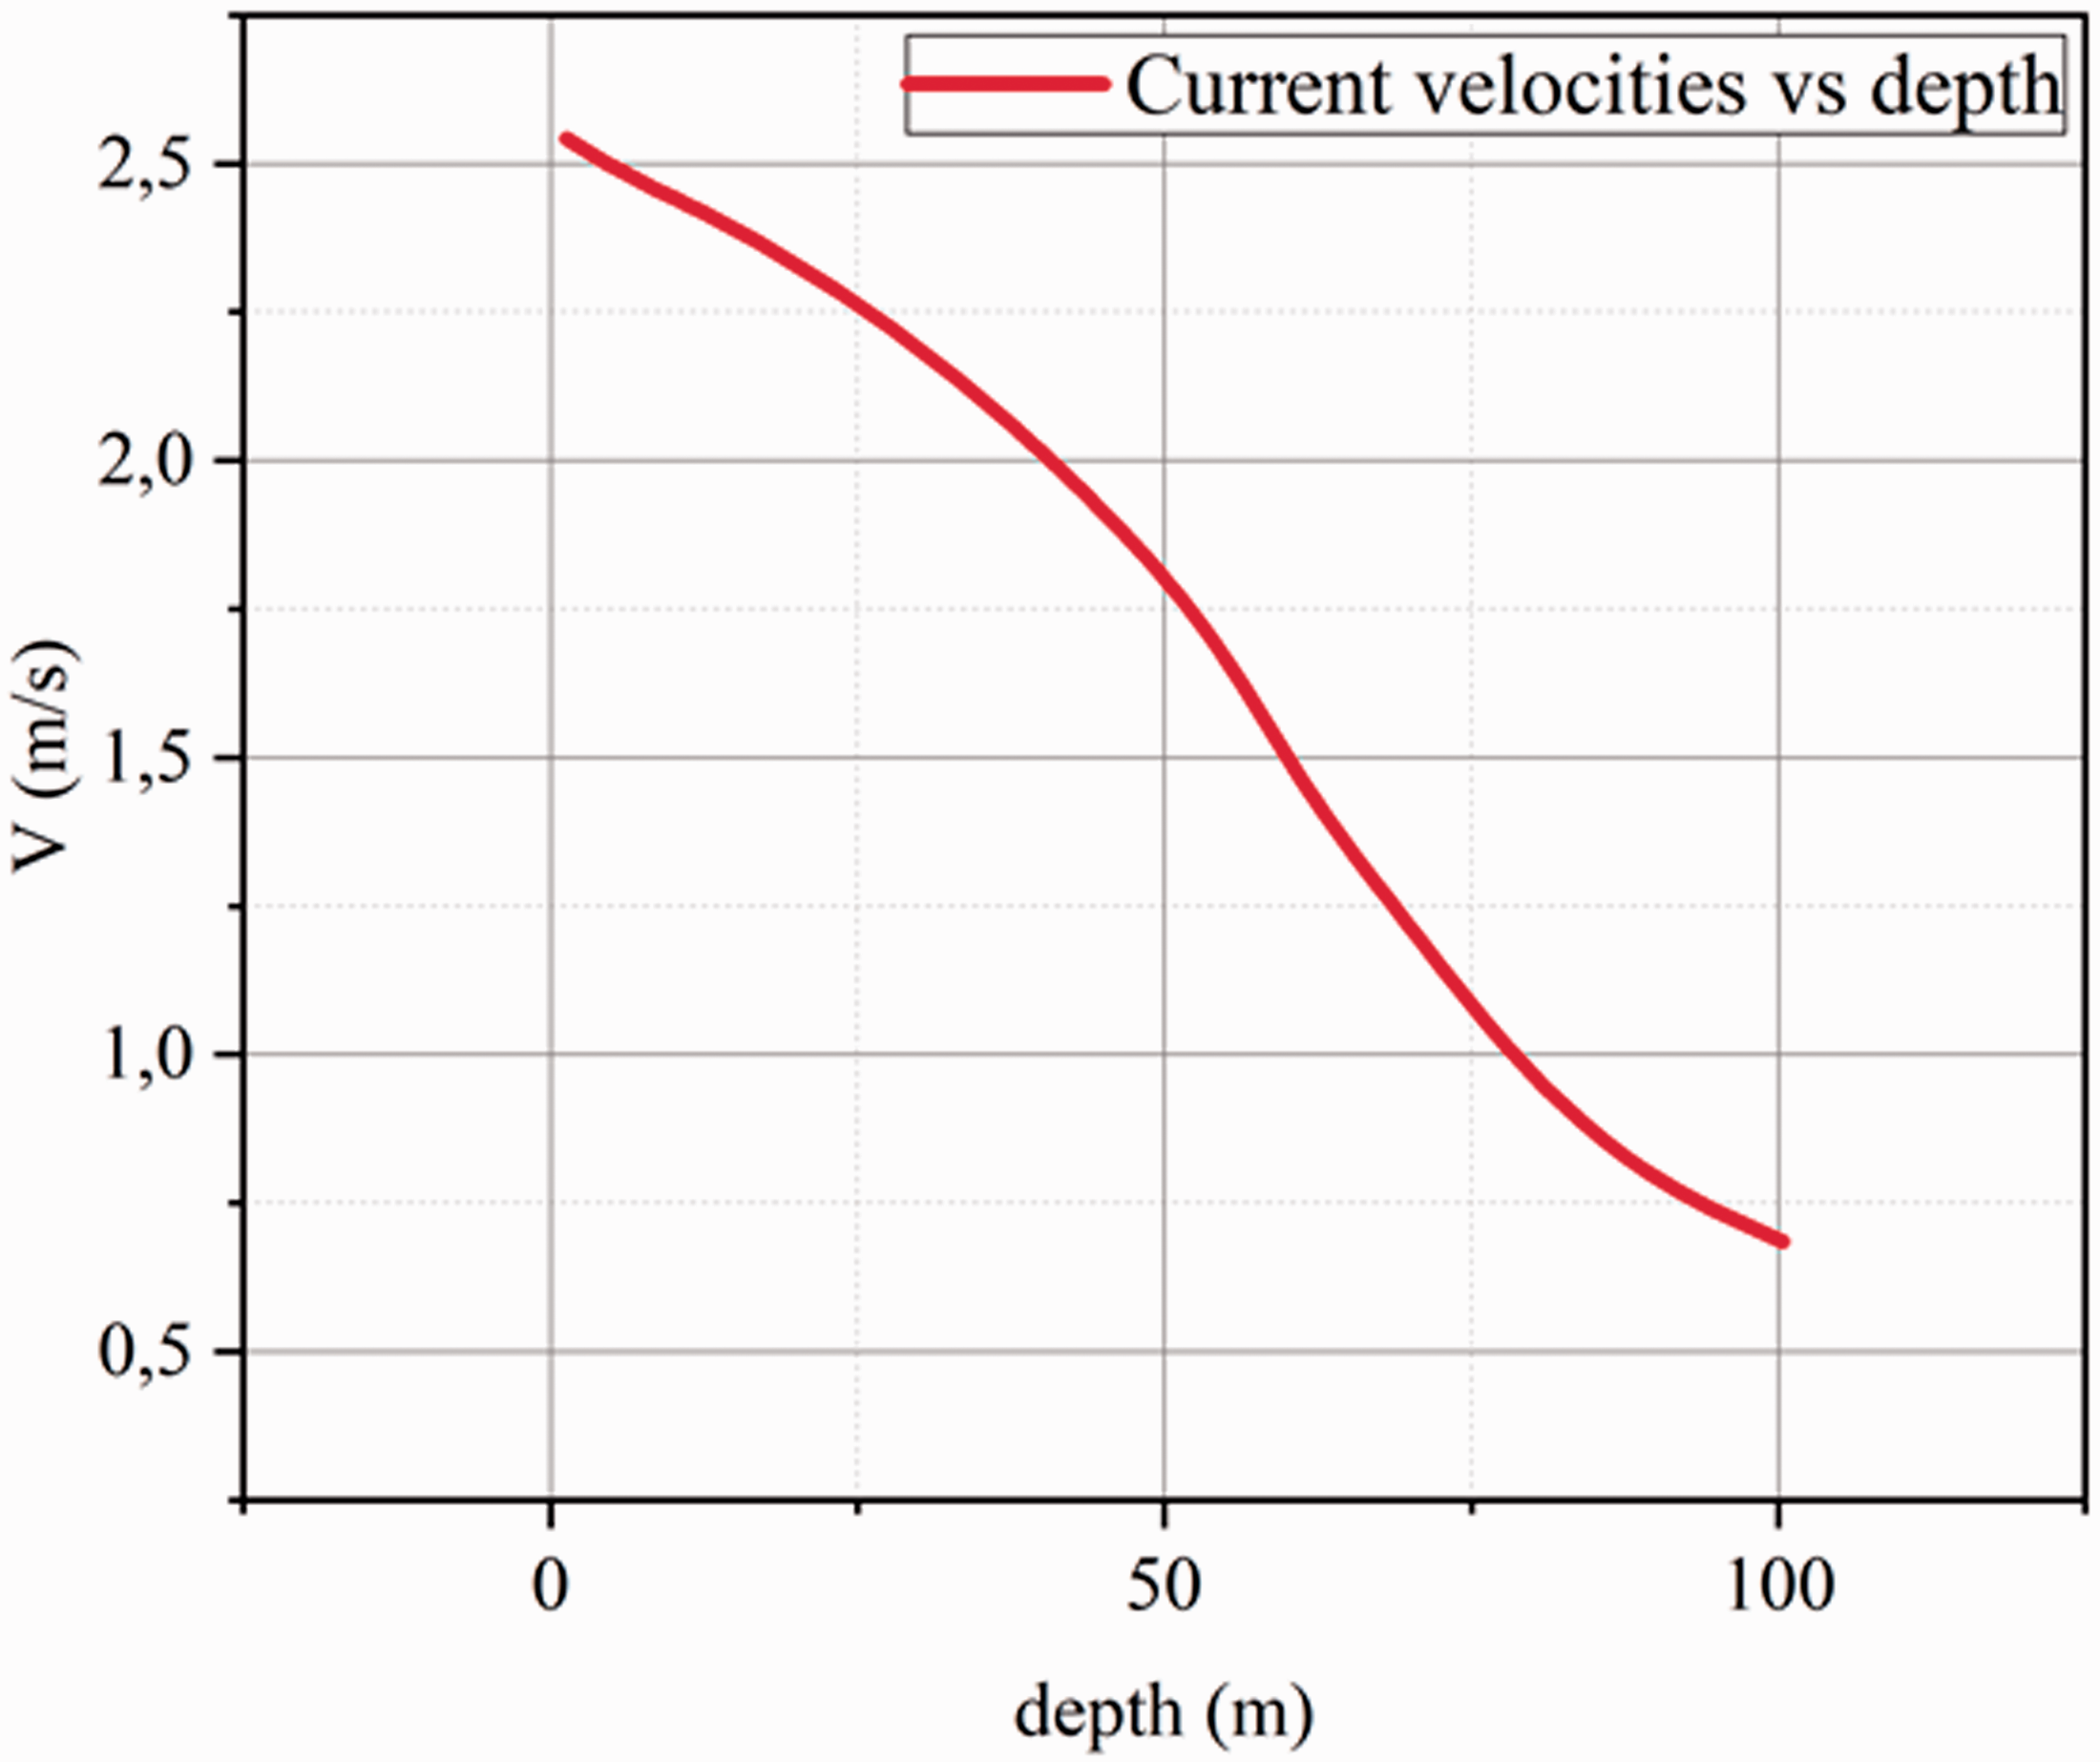
Current speed vs depth in the Mediterranean Moroccan coast.
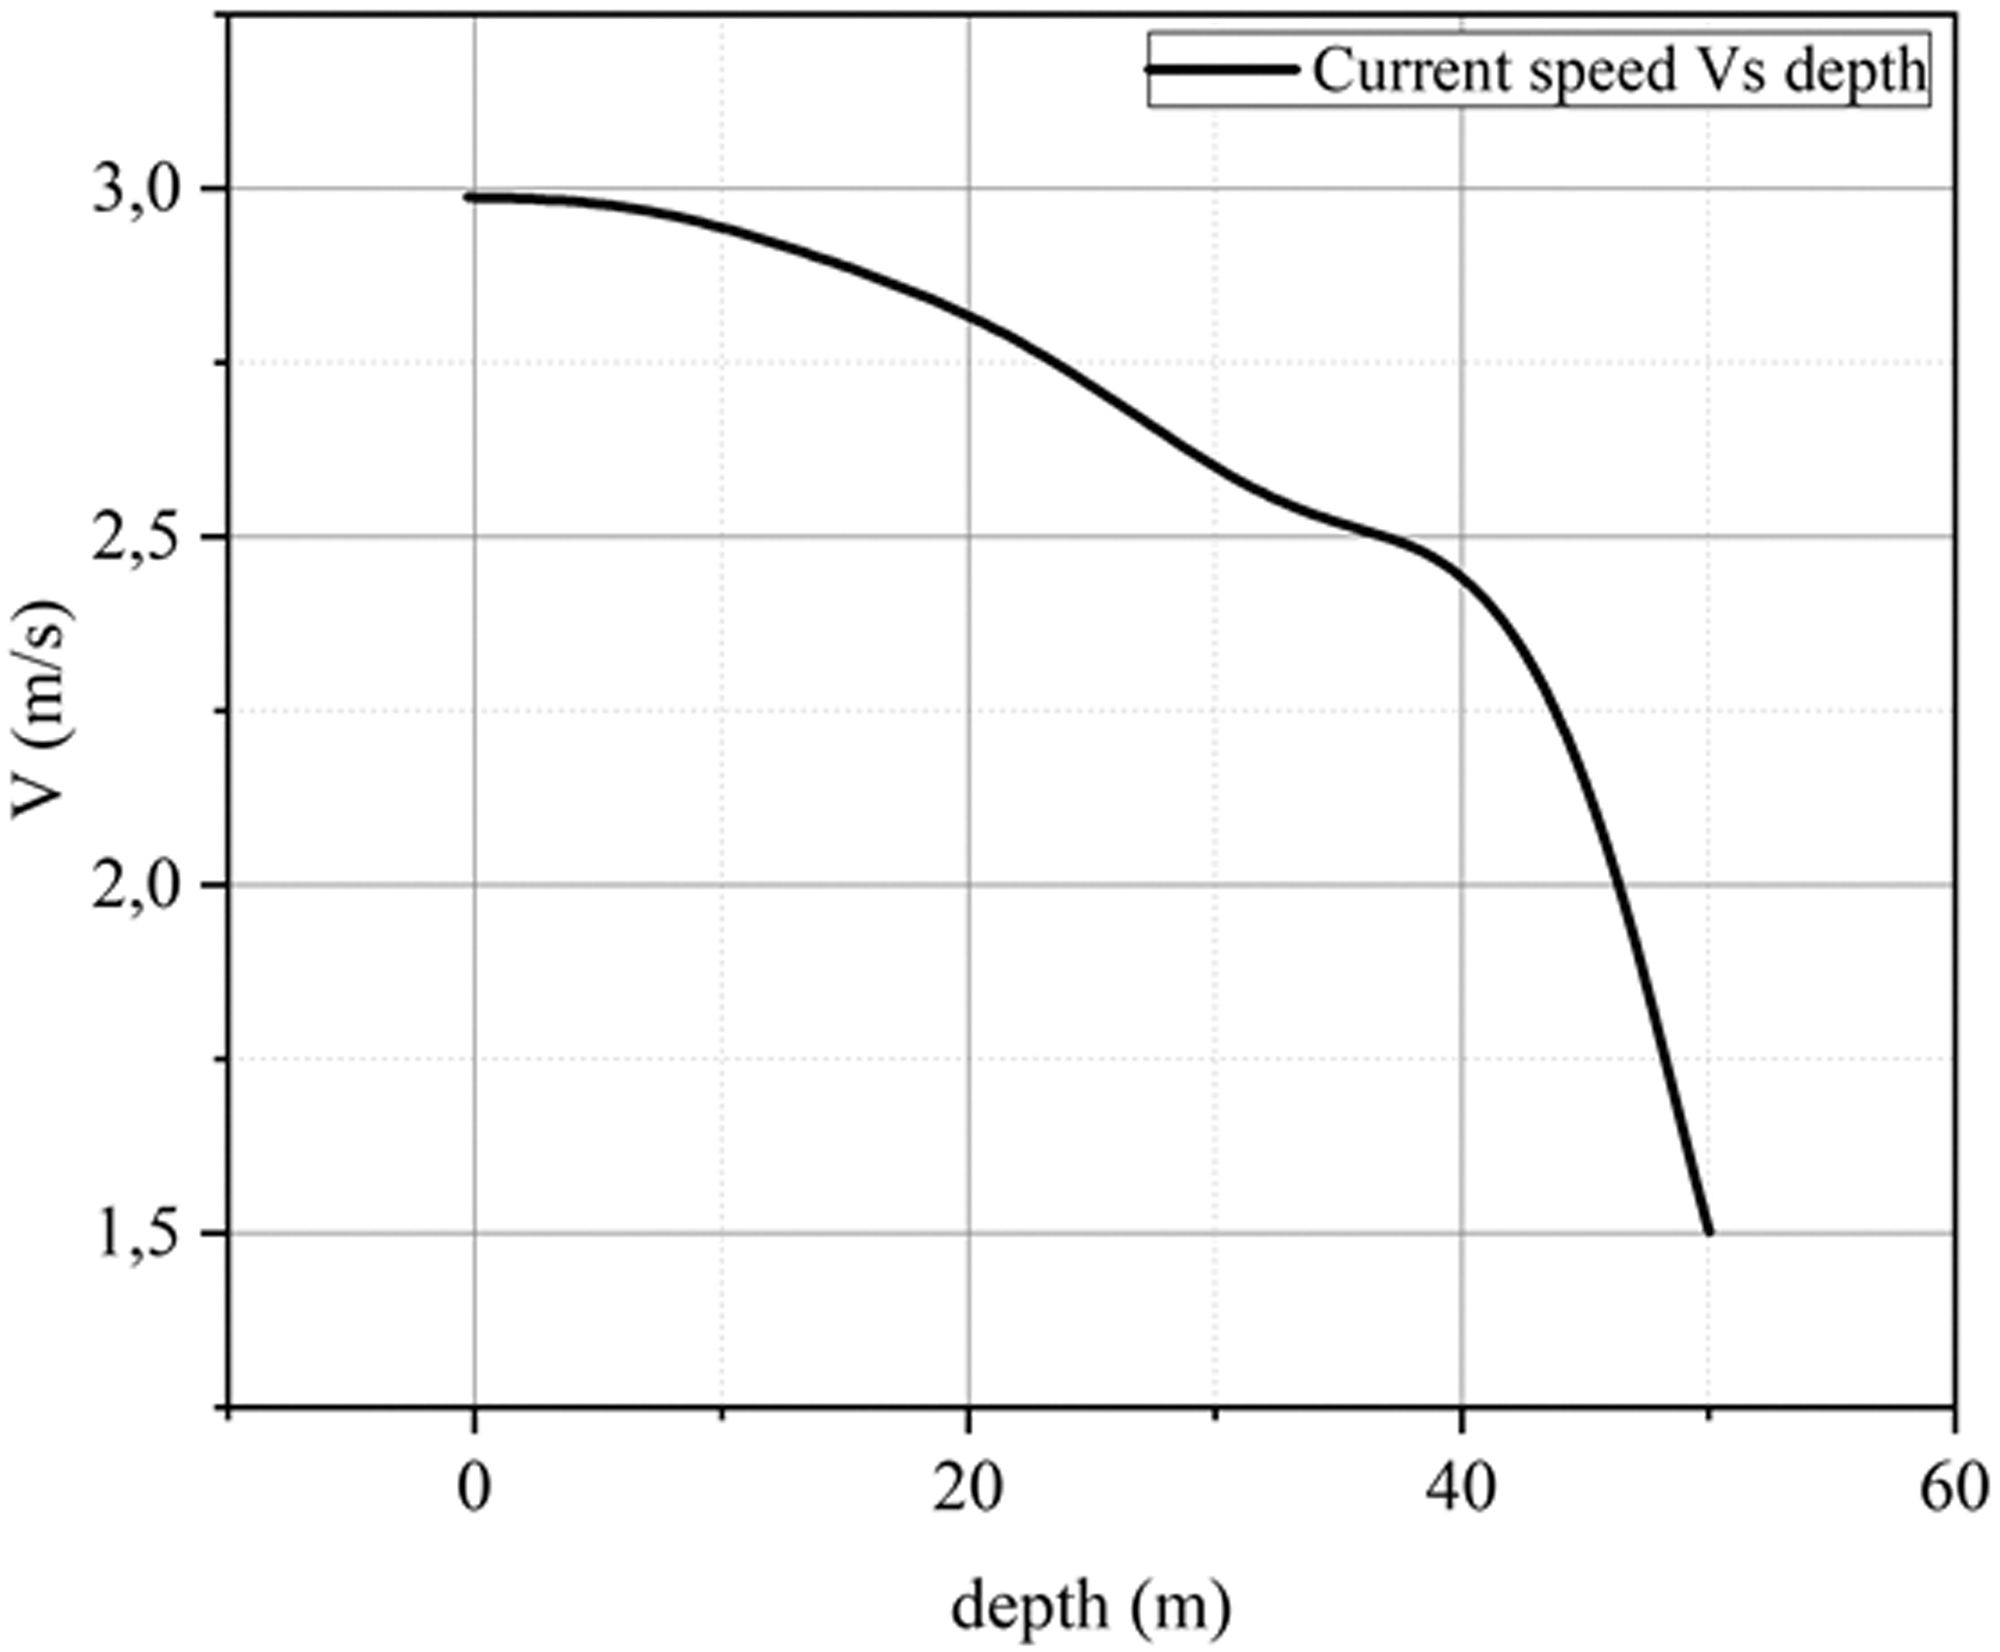
Current speed vs depth (Ben Elghali et al., 2019).
According to the result obtained in Figure 4, the most important rates are those on a depth closer to the surface of the sea (Figure 5) which is quite coherent with the change in velocities according to depths (Ben Elghali et al., 2019) in Figure 6. The depth of the site has a very important role in the installation of HKT. The installation must take into account the environmental aspect of the site such as the marine life of the fish, the flora and also the passage of the different migrating fish, the nature of the deep sea bathymetry as well as the maintenance of installed technologies.
Moreover, the most important parameter to take into consideration is the directions of the marine currents for a better orientation of our system. Figure 7 shows the directions of the marine currents at 10 m depth in the site located at −7° E 0°W35° S 37°N. During the spring tides, the currents velocities are characterized by the East guiding the Atlantic waters in the Mediterranean are responsible for resulting maximum evaporation in summer and an increase of the water salinity. Gold in the ratings of Rif, the current encounters great difficulty to keep the same direction and turns into the reverse current direction from east to west.
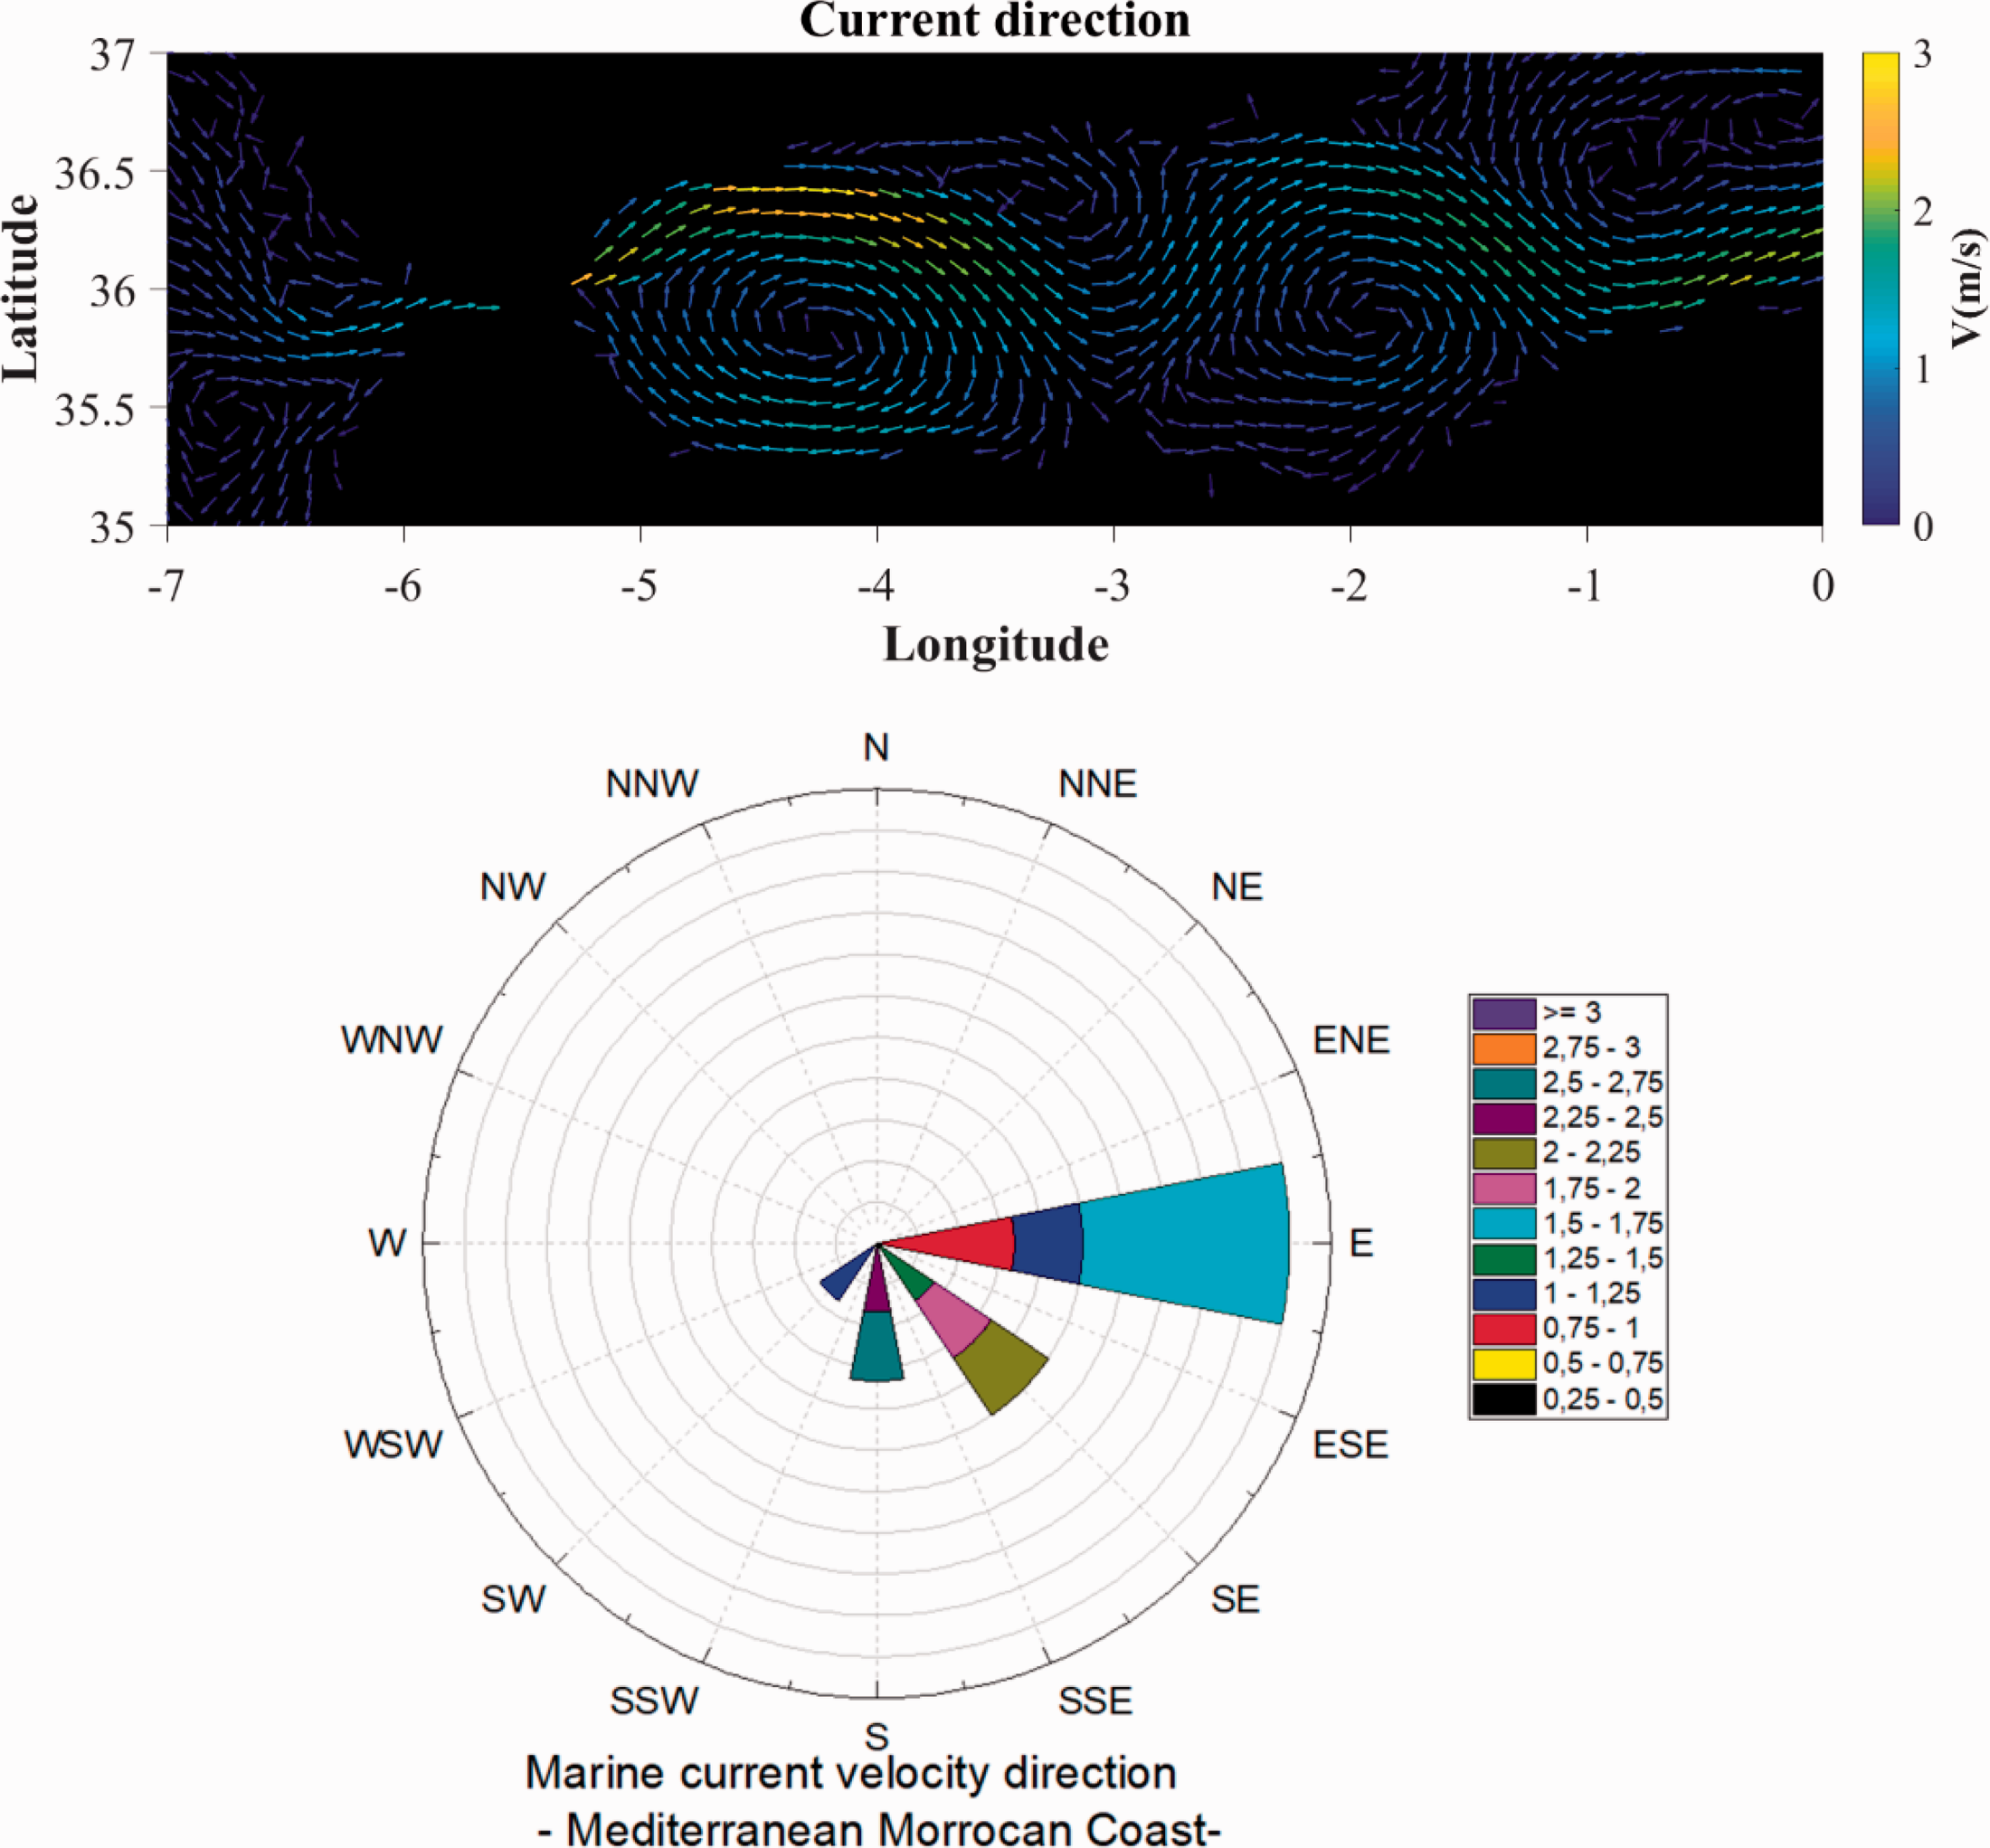
Current direction.
Once the assessment of the current velocities distribution in the Mediterranean region was made, the estimation of the available power contained in the studied region can be evaluated. The minimum velocity needed for machine operation is considered constant at the current velocity 1.5 m/s (Blunden, 2009).

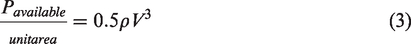
Figure 8 shows the variation of the maximum current velocities/month and the average of the available power per unit area in the Mediterranean coast. The average available power per unit area is estimated to 2.6 kW/m which is a very important value. The maximum current velocity is about 2.47 m/s mentioned in September between the Gibraltar strait and the tangier city with an average available power of 7.7 kW/m and the minimum value is about 0.7 m/s with an available power of 175 W/m. the average current intensities vary between 0.6 m/s in December and 2.8 m/s in September.
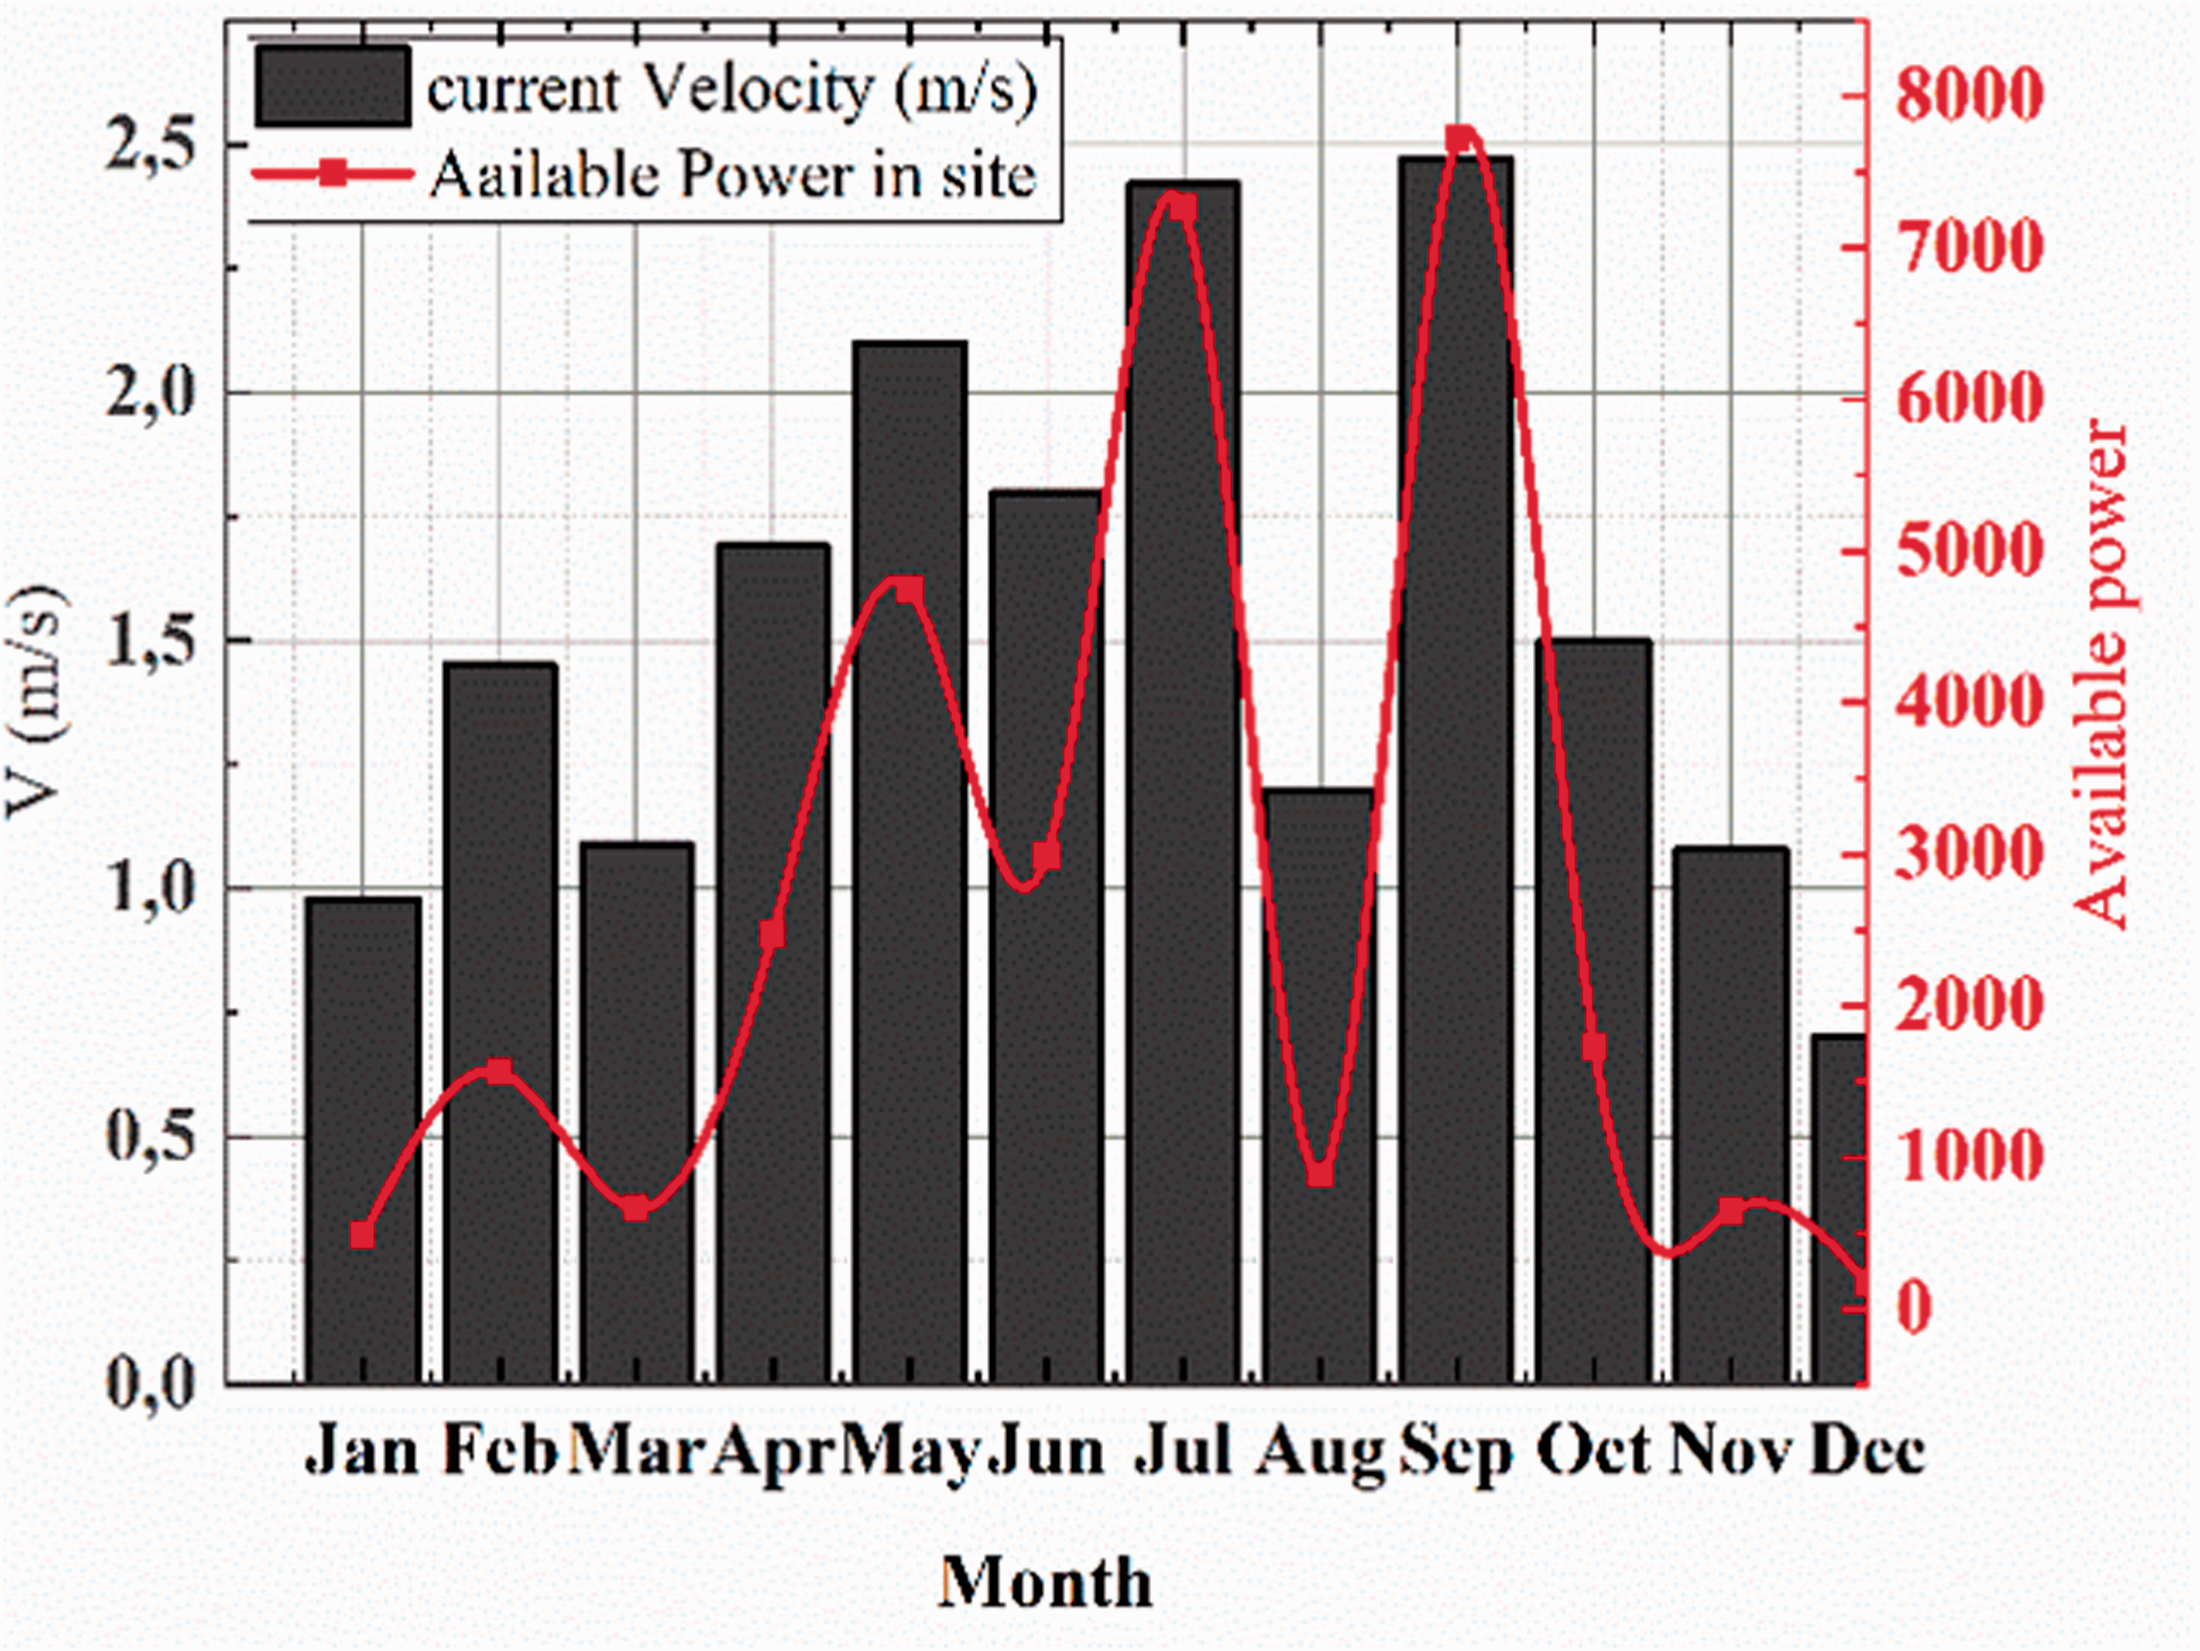
Power available vs current velocity in the Mediterranean coast.
As a result, it can be concluded that the bay between Tangier and Gibraltar strait cities is an excellent site for implementing the HKT.
Hydrodynamic design for a HKT
Recently, a great interest has been granted for the development of current turbine technology. consequently, a transaction of the progress of this technology of the R & D phase to the experimental phase has been noted by the development and testing of some prototype in several sites in the world (Li et al., 2016; Terme and Gerard, 2015). On the other hand, several countries have not been able to go beyond the R& D phase, as in the case of Morocco.
The design of an HKT is based on blade design as it is a critical element in this technology. This importance is reflected to forward the link between the blade and the rotor which is directly related to maximizing its output. It is part of the hydrofoils category, whose design involves a very special methodology to obtain the most suitable form to achieve the desired performance such as the best efficiency and the large mechanical load support.
The purpose of the hydrofoil design is to maximize the lift coefficient and minimize the drag coefficient (Nigam et al., 2017), which requires a hydrodynamic force study. Figure 9 shows the hydrodynamic forces acting on an element of the hydrofoil.
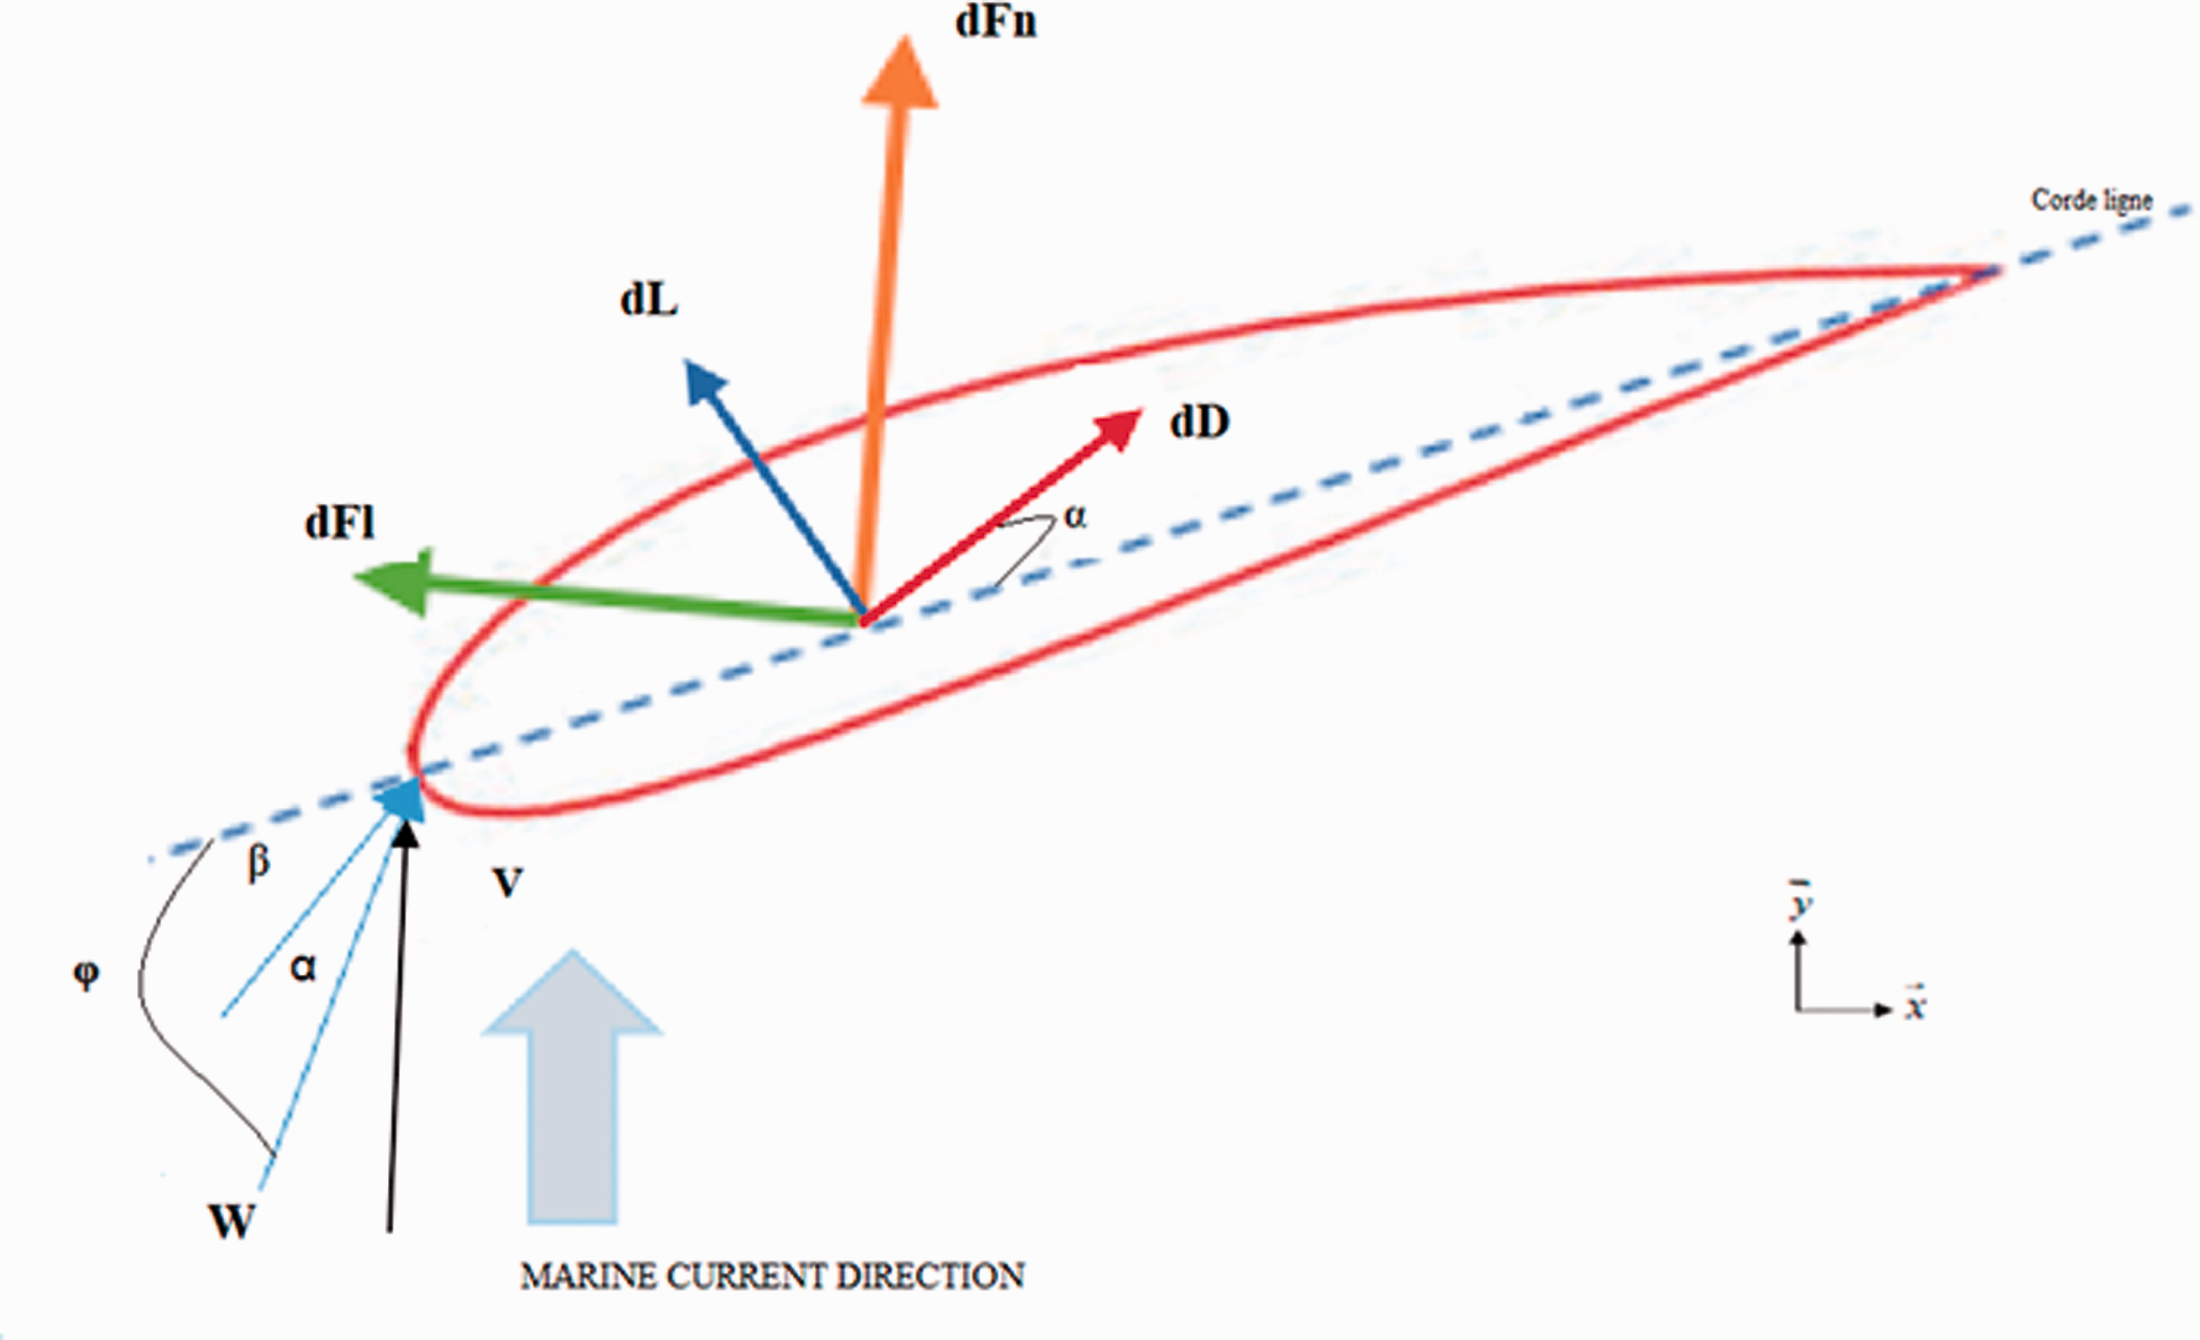
Blade forces applied on an element of a HKT blade.
Two forces contribute directly to the rotational movement of the blade: the tangential force (lift force) acting on the turbine rotor which results in a useful work that allows the rotation of the blade, and the axial force (thrust power) which is a very essential element that must be considered in the design due to the forces leading to the bending of the blade. The blade strength is considered as an important parameter in the design of the HKT because it must be stable and resistible to the huge thrust force. Consequently, hydrofoils need to be thick compared to airfoils which mean a loss in
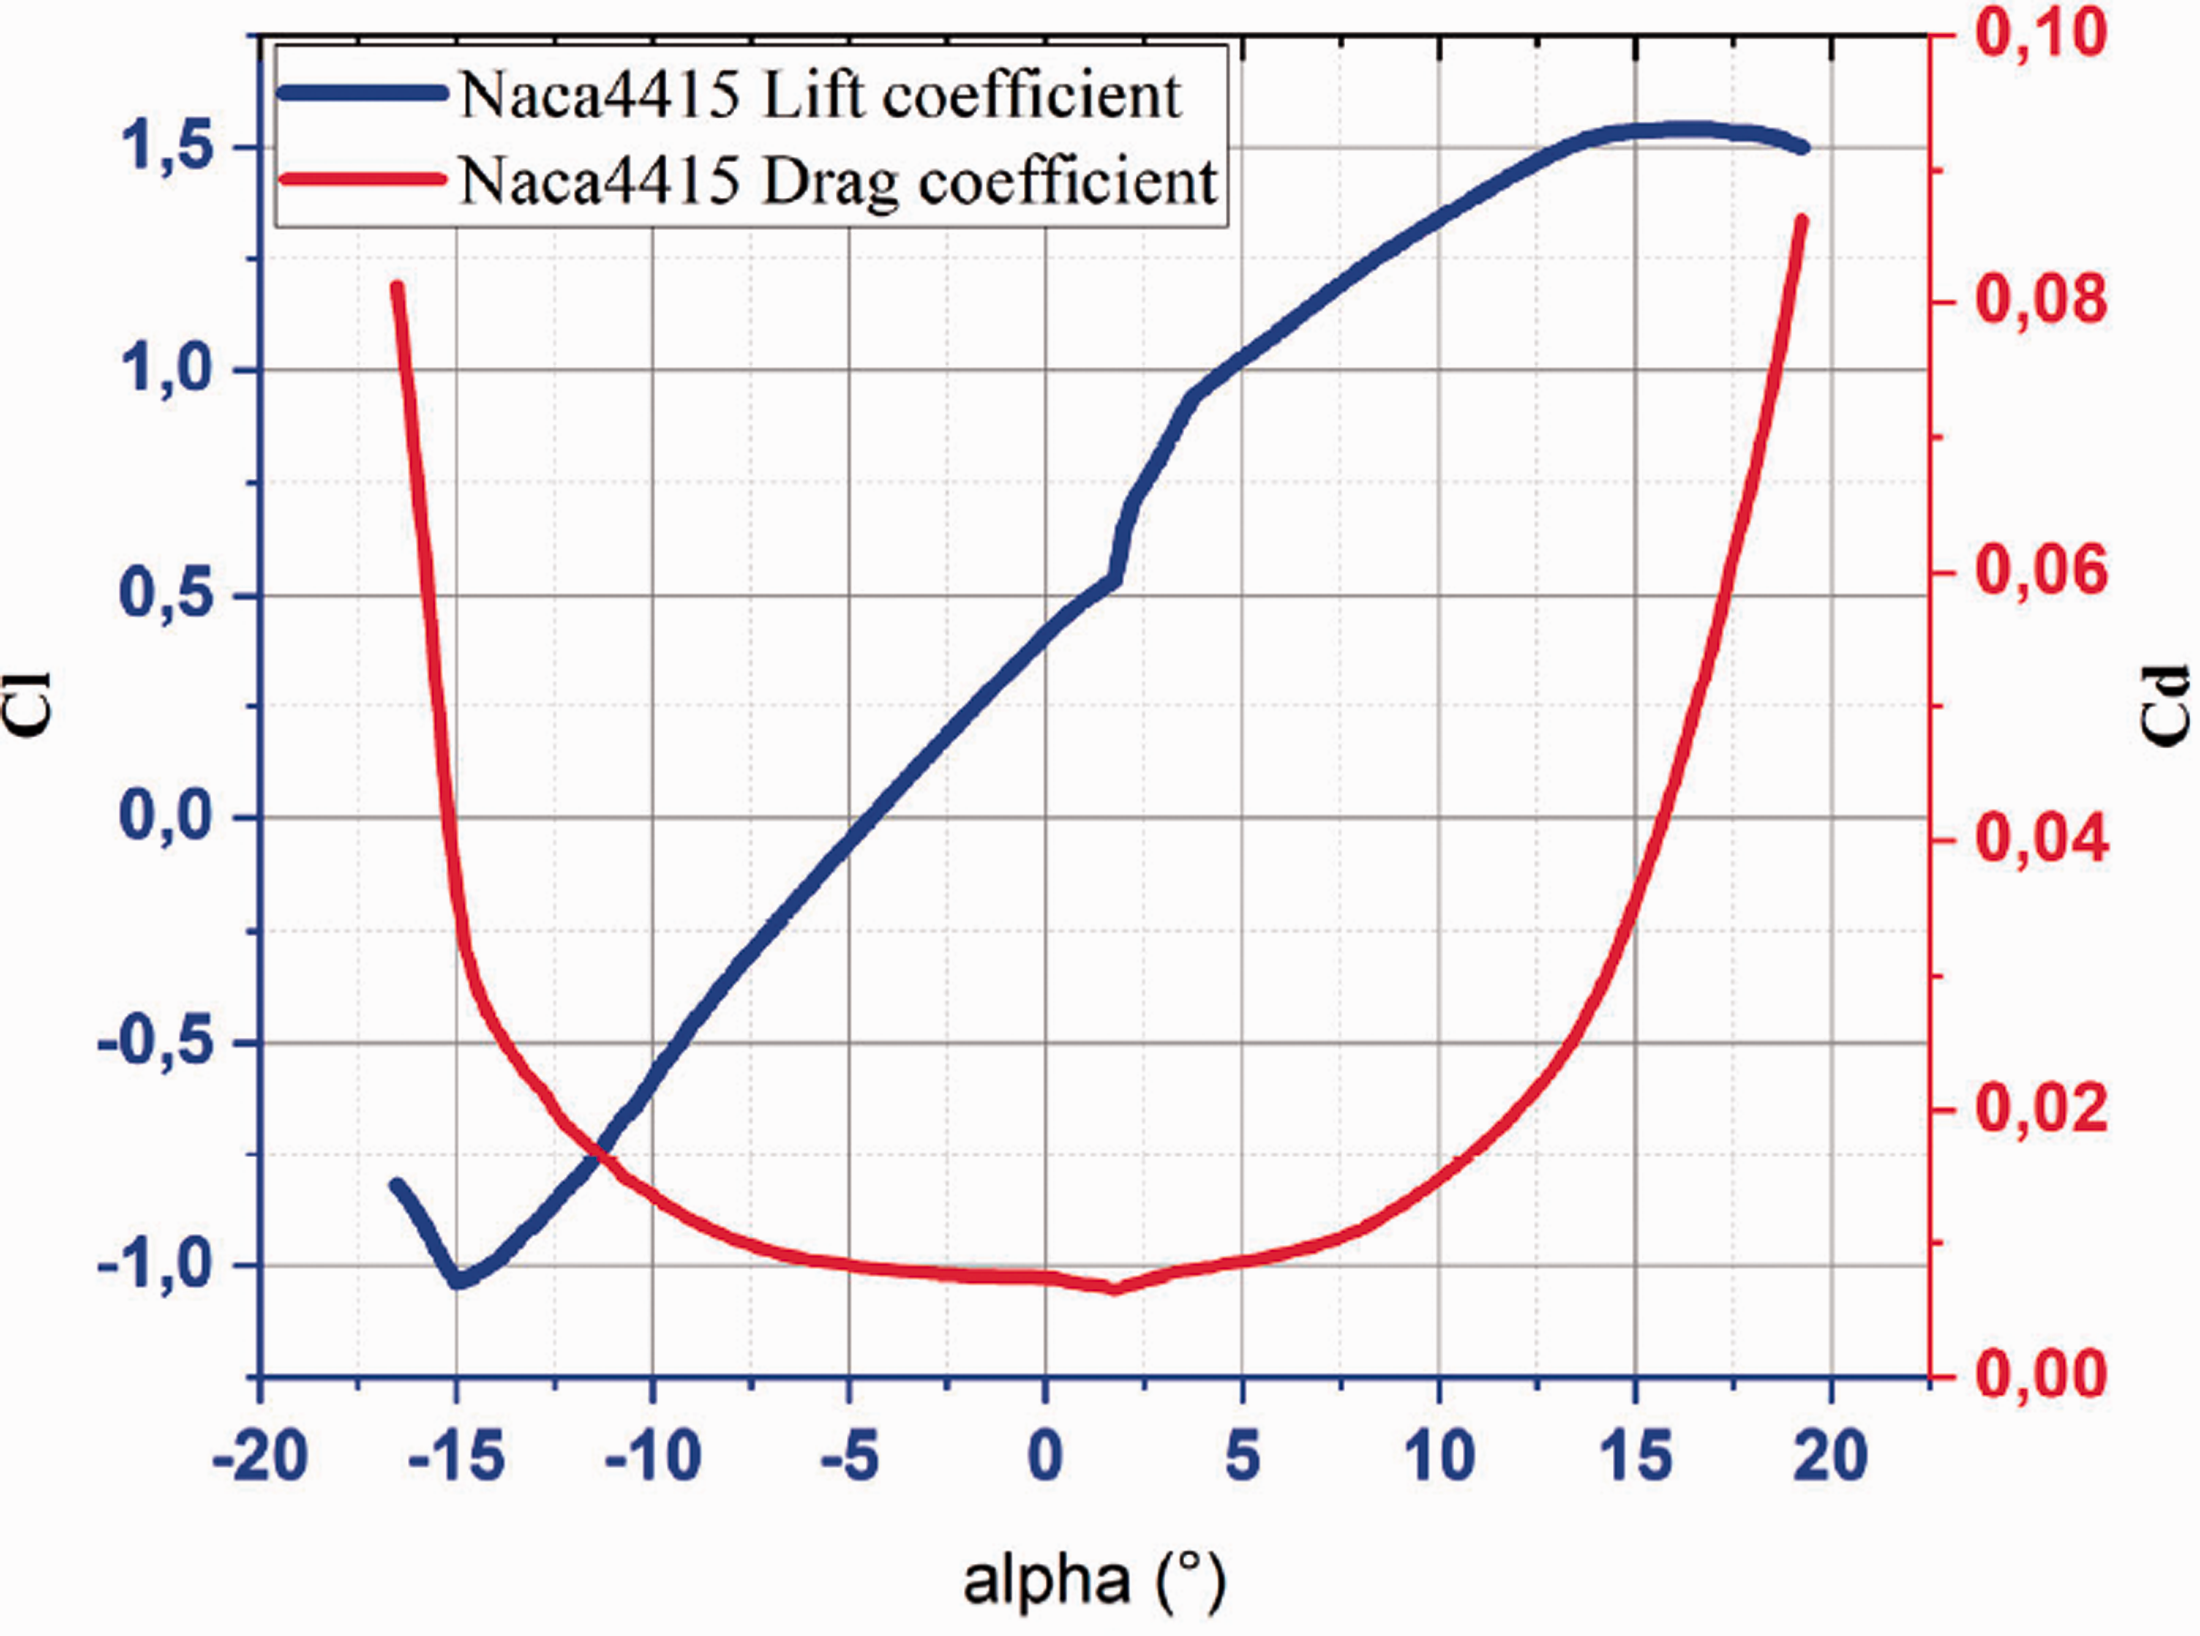
The choice of the shape of the hydrofoil is an important criterion in the design of the rotor seeing its influence on the blade performance(Singh and Choi, 2013). It’s based mainly on the lift-drag ratio. In this work, two type profiles were considered in order to develop a HKT adapted to the potential of the study area Naca4415 and s8052. To calculate the power output from a HKT, it is necessary to have data of Cl and Cd for each airfoil blade. It can be measured or computed using advanced numerical tools.
In this study, The X-foil codes were used to characterize these two profiles (Figure 10). Figures 11 and 12 represent the distribution of the lift (Cl) and the drag (Cd) coefficients. The variation of their distributions is proportional to the angle of attack alpha which varying between −20° and 20°. For the s8052 profile, the angle alpha is optimum at 13° the lift Cl is maximum and Cd is minimal, Cd is maximum when alpha is negative, and the Cl/Cd reaches its maximum 56.3.
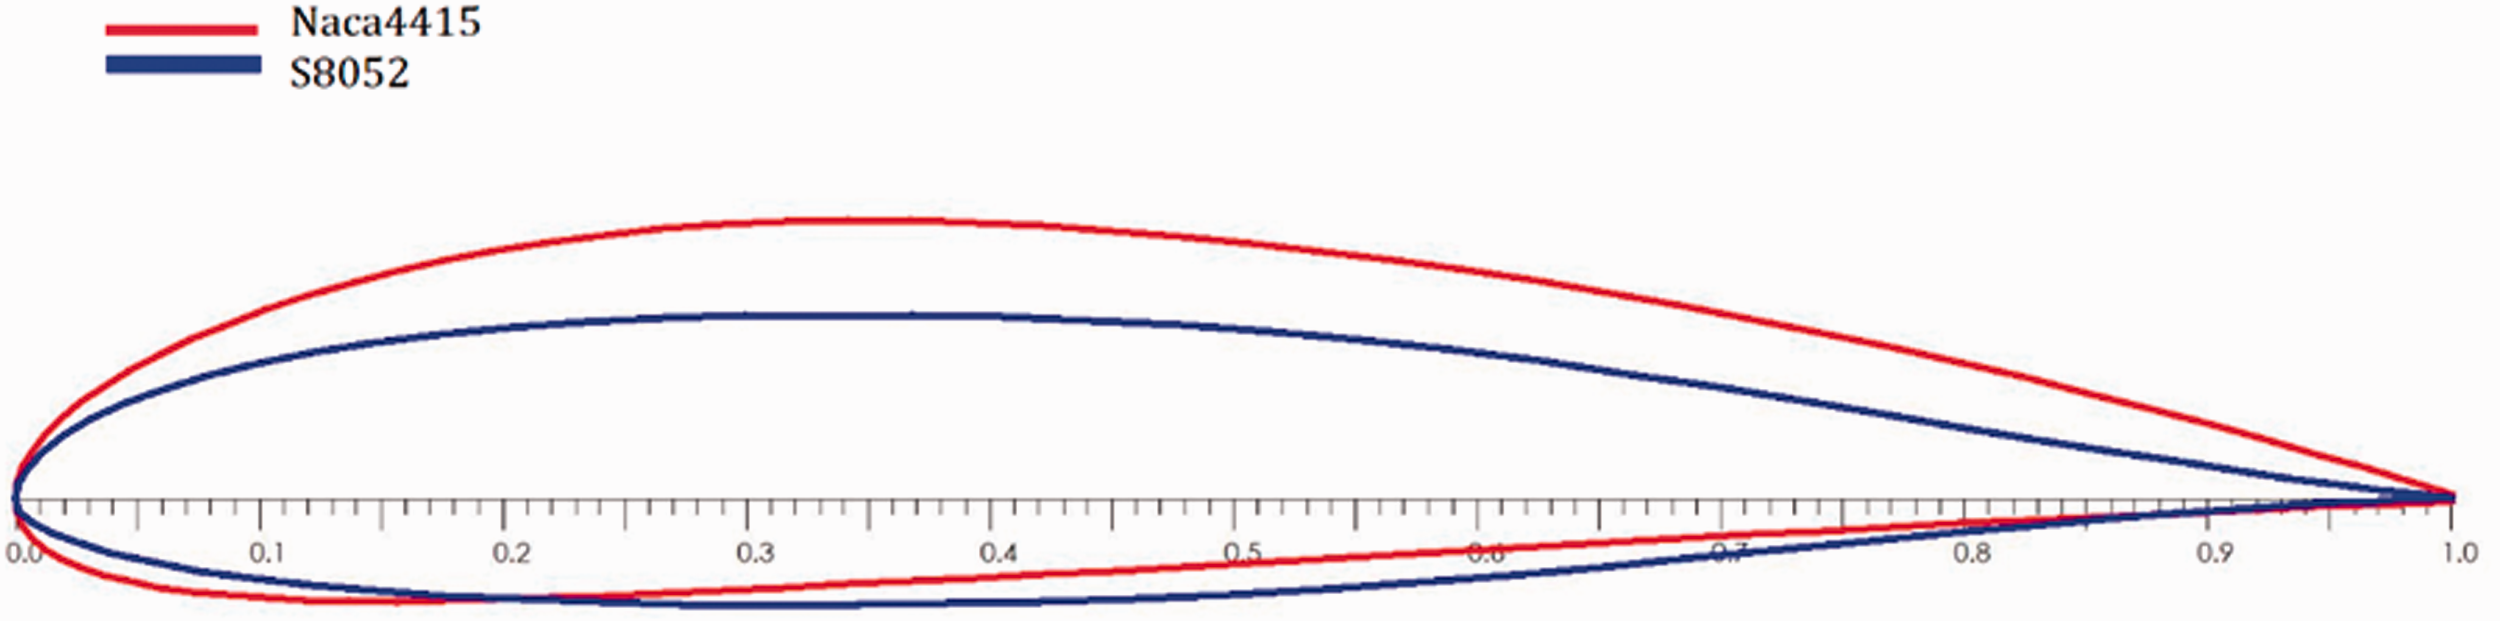
Shape of Naca4415 and s8052 profiles.
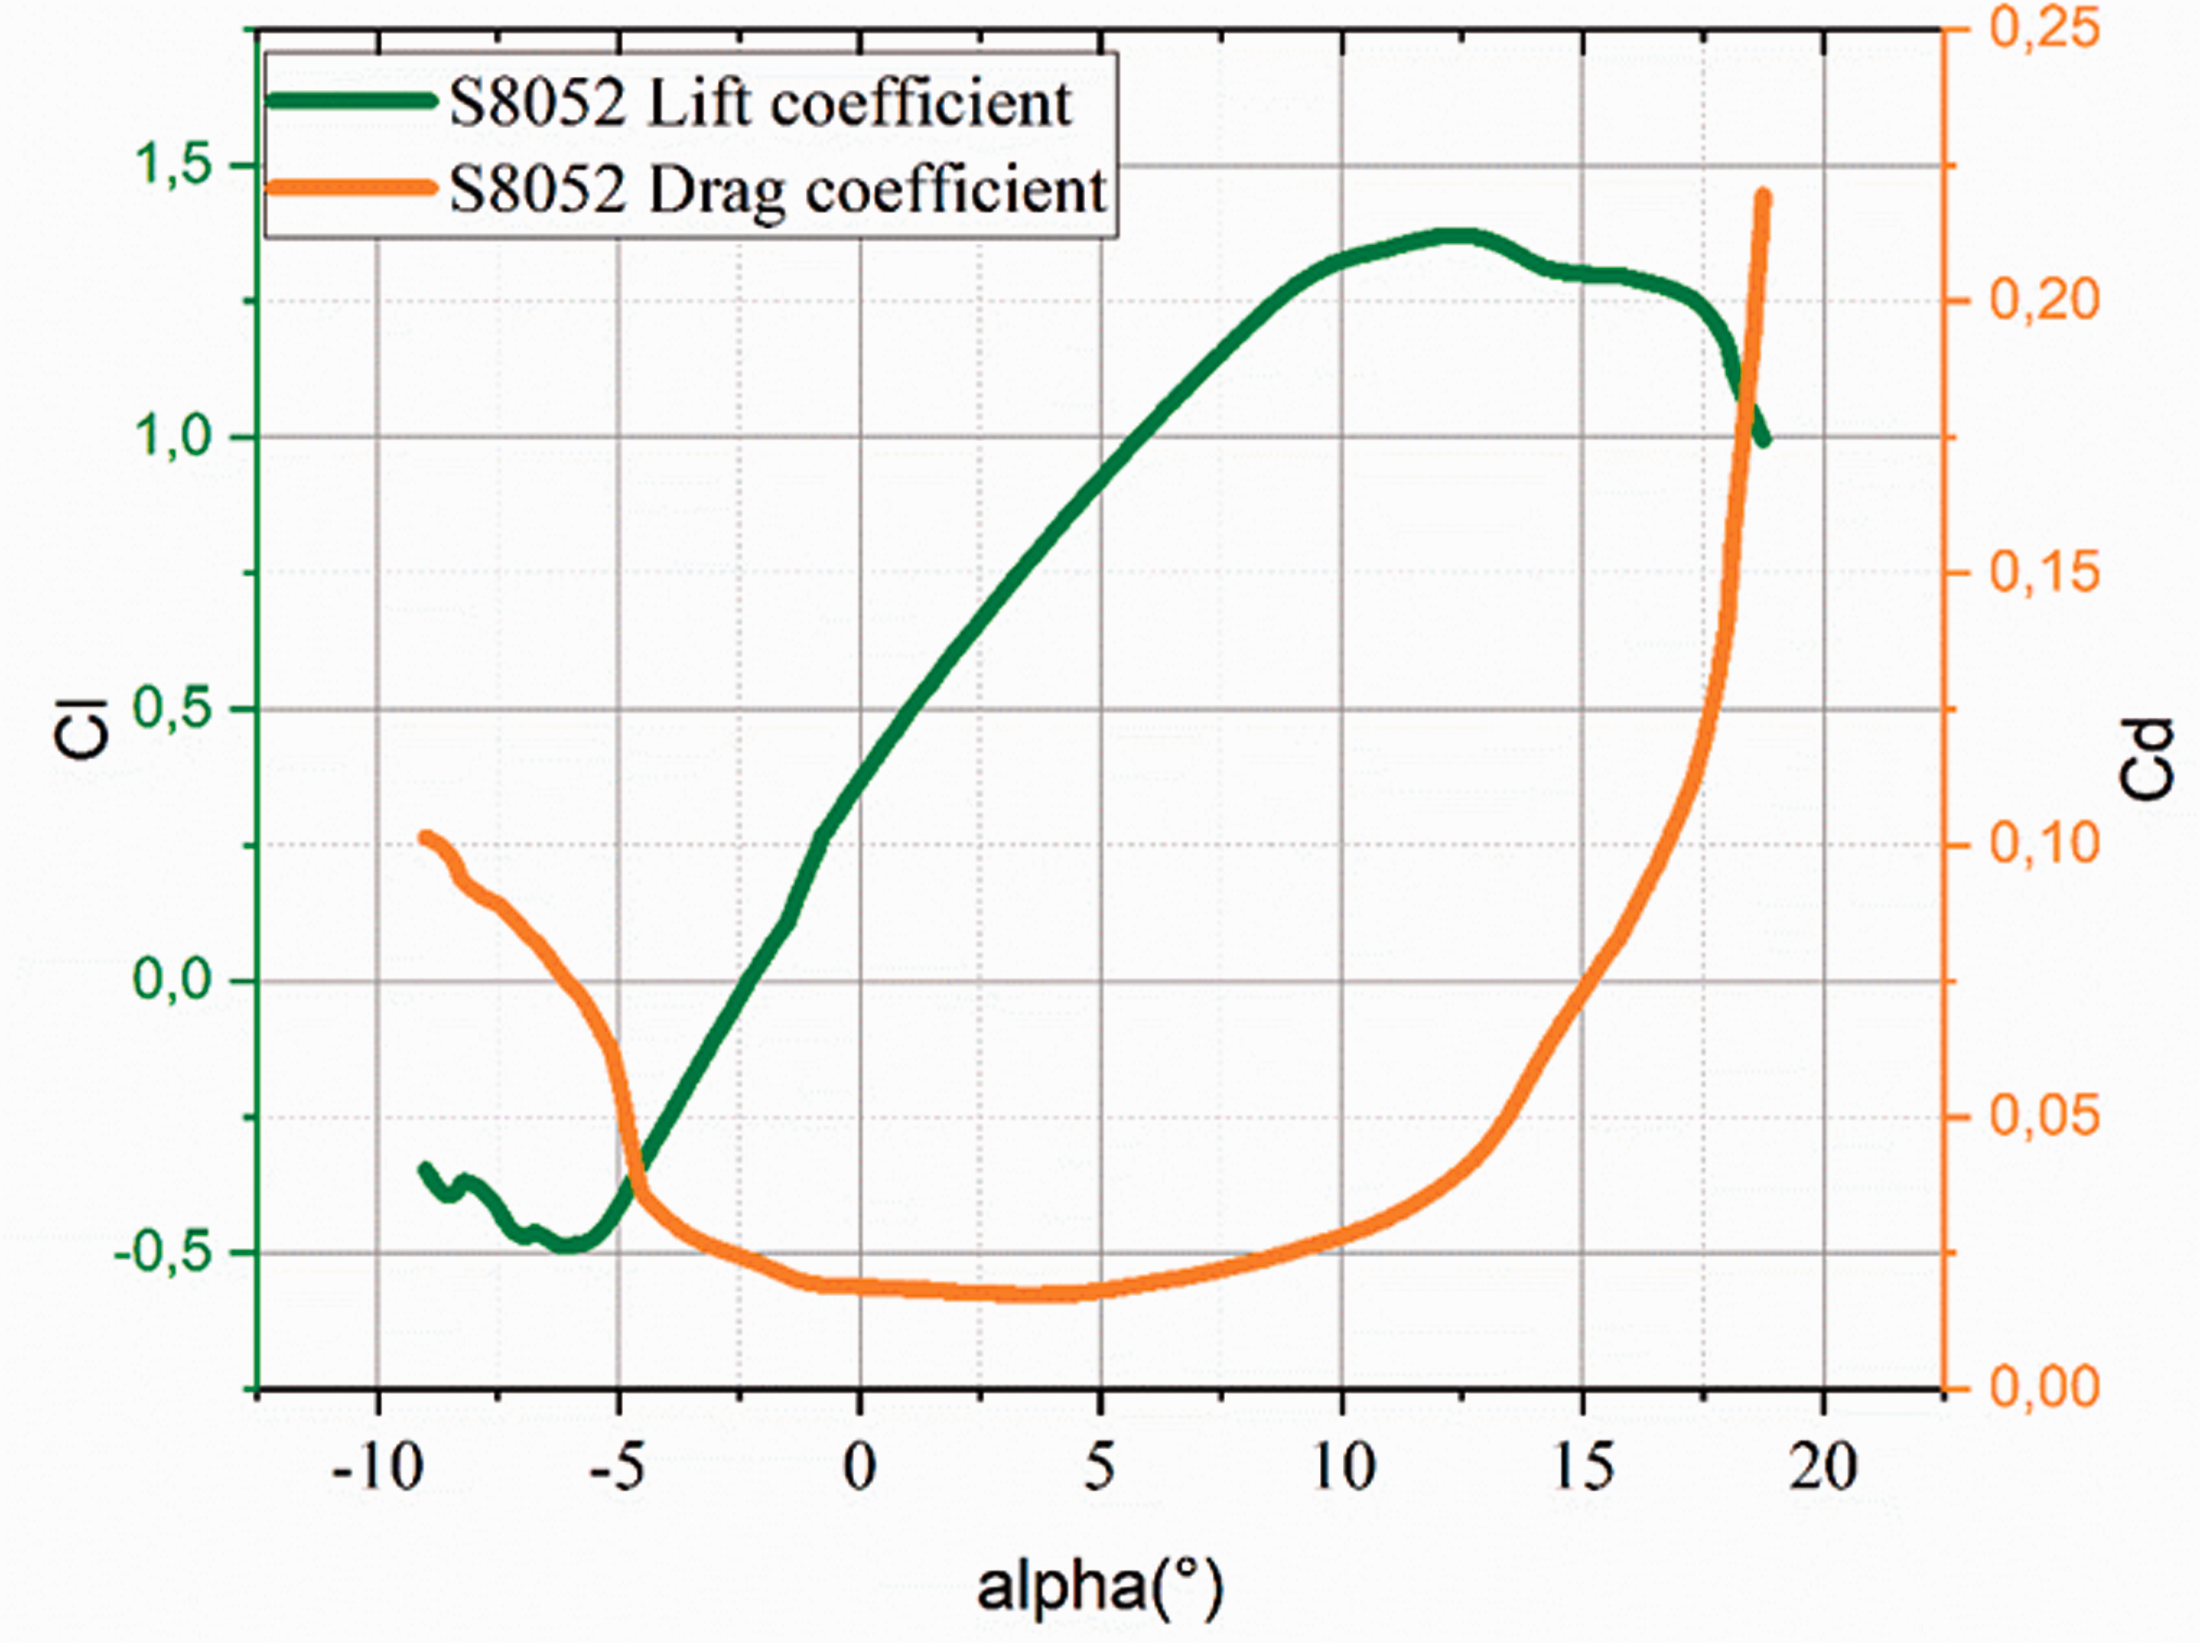
Lift and drag coefficient of s8052 blade profile.
Lift and drag coefficient of Naca4415 blade profile.
For the Naca4415 profile, the angle alpha is optimum at 14.4° the lift Cl is maximum and Cd is minimal, Cd is maximum when alpha is negative, and the Cl/Cd reach its maximum 72.
The geometry of a blade is characterized by the following parameters: the radius, the chord and the twist angle distributions, the hub radius.
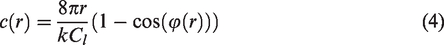
The blade dimensioning consists on determining the distribution of the chord and the twist angle over its entire length. These two geometrical characteristics can be calculated based on the blade element theory (Batten et al., 2008) using equations (2) and (3). The chord distribution is an important factor to determine blade performances. The losses at the tip of the blades are all the most significant if the elongation of the blade is low. It must respect the elongation in order to avoid the waste of energy.
The turbine rotor diameter is 10 m, and it has 3 blades, three bladed turbines are more stable and do not cause much vibration, increasing bearing life and reducing fatigue failures. Each blade is 4.25 m long and the hub radius about 0.75 m.

Figures 13 and 14 show the optimal distribution of the chord and the twist angle depending on the blades having Naca4415 and s8052 profiles. The twist angle value is higher at the foot of the blade and is lower at the end of the blade.
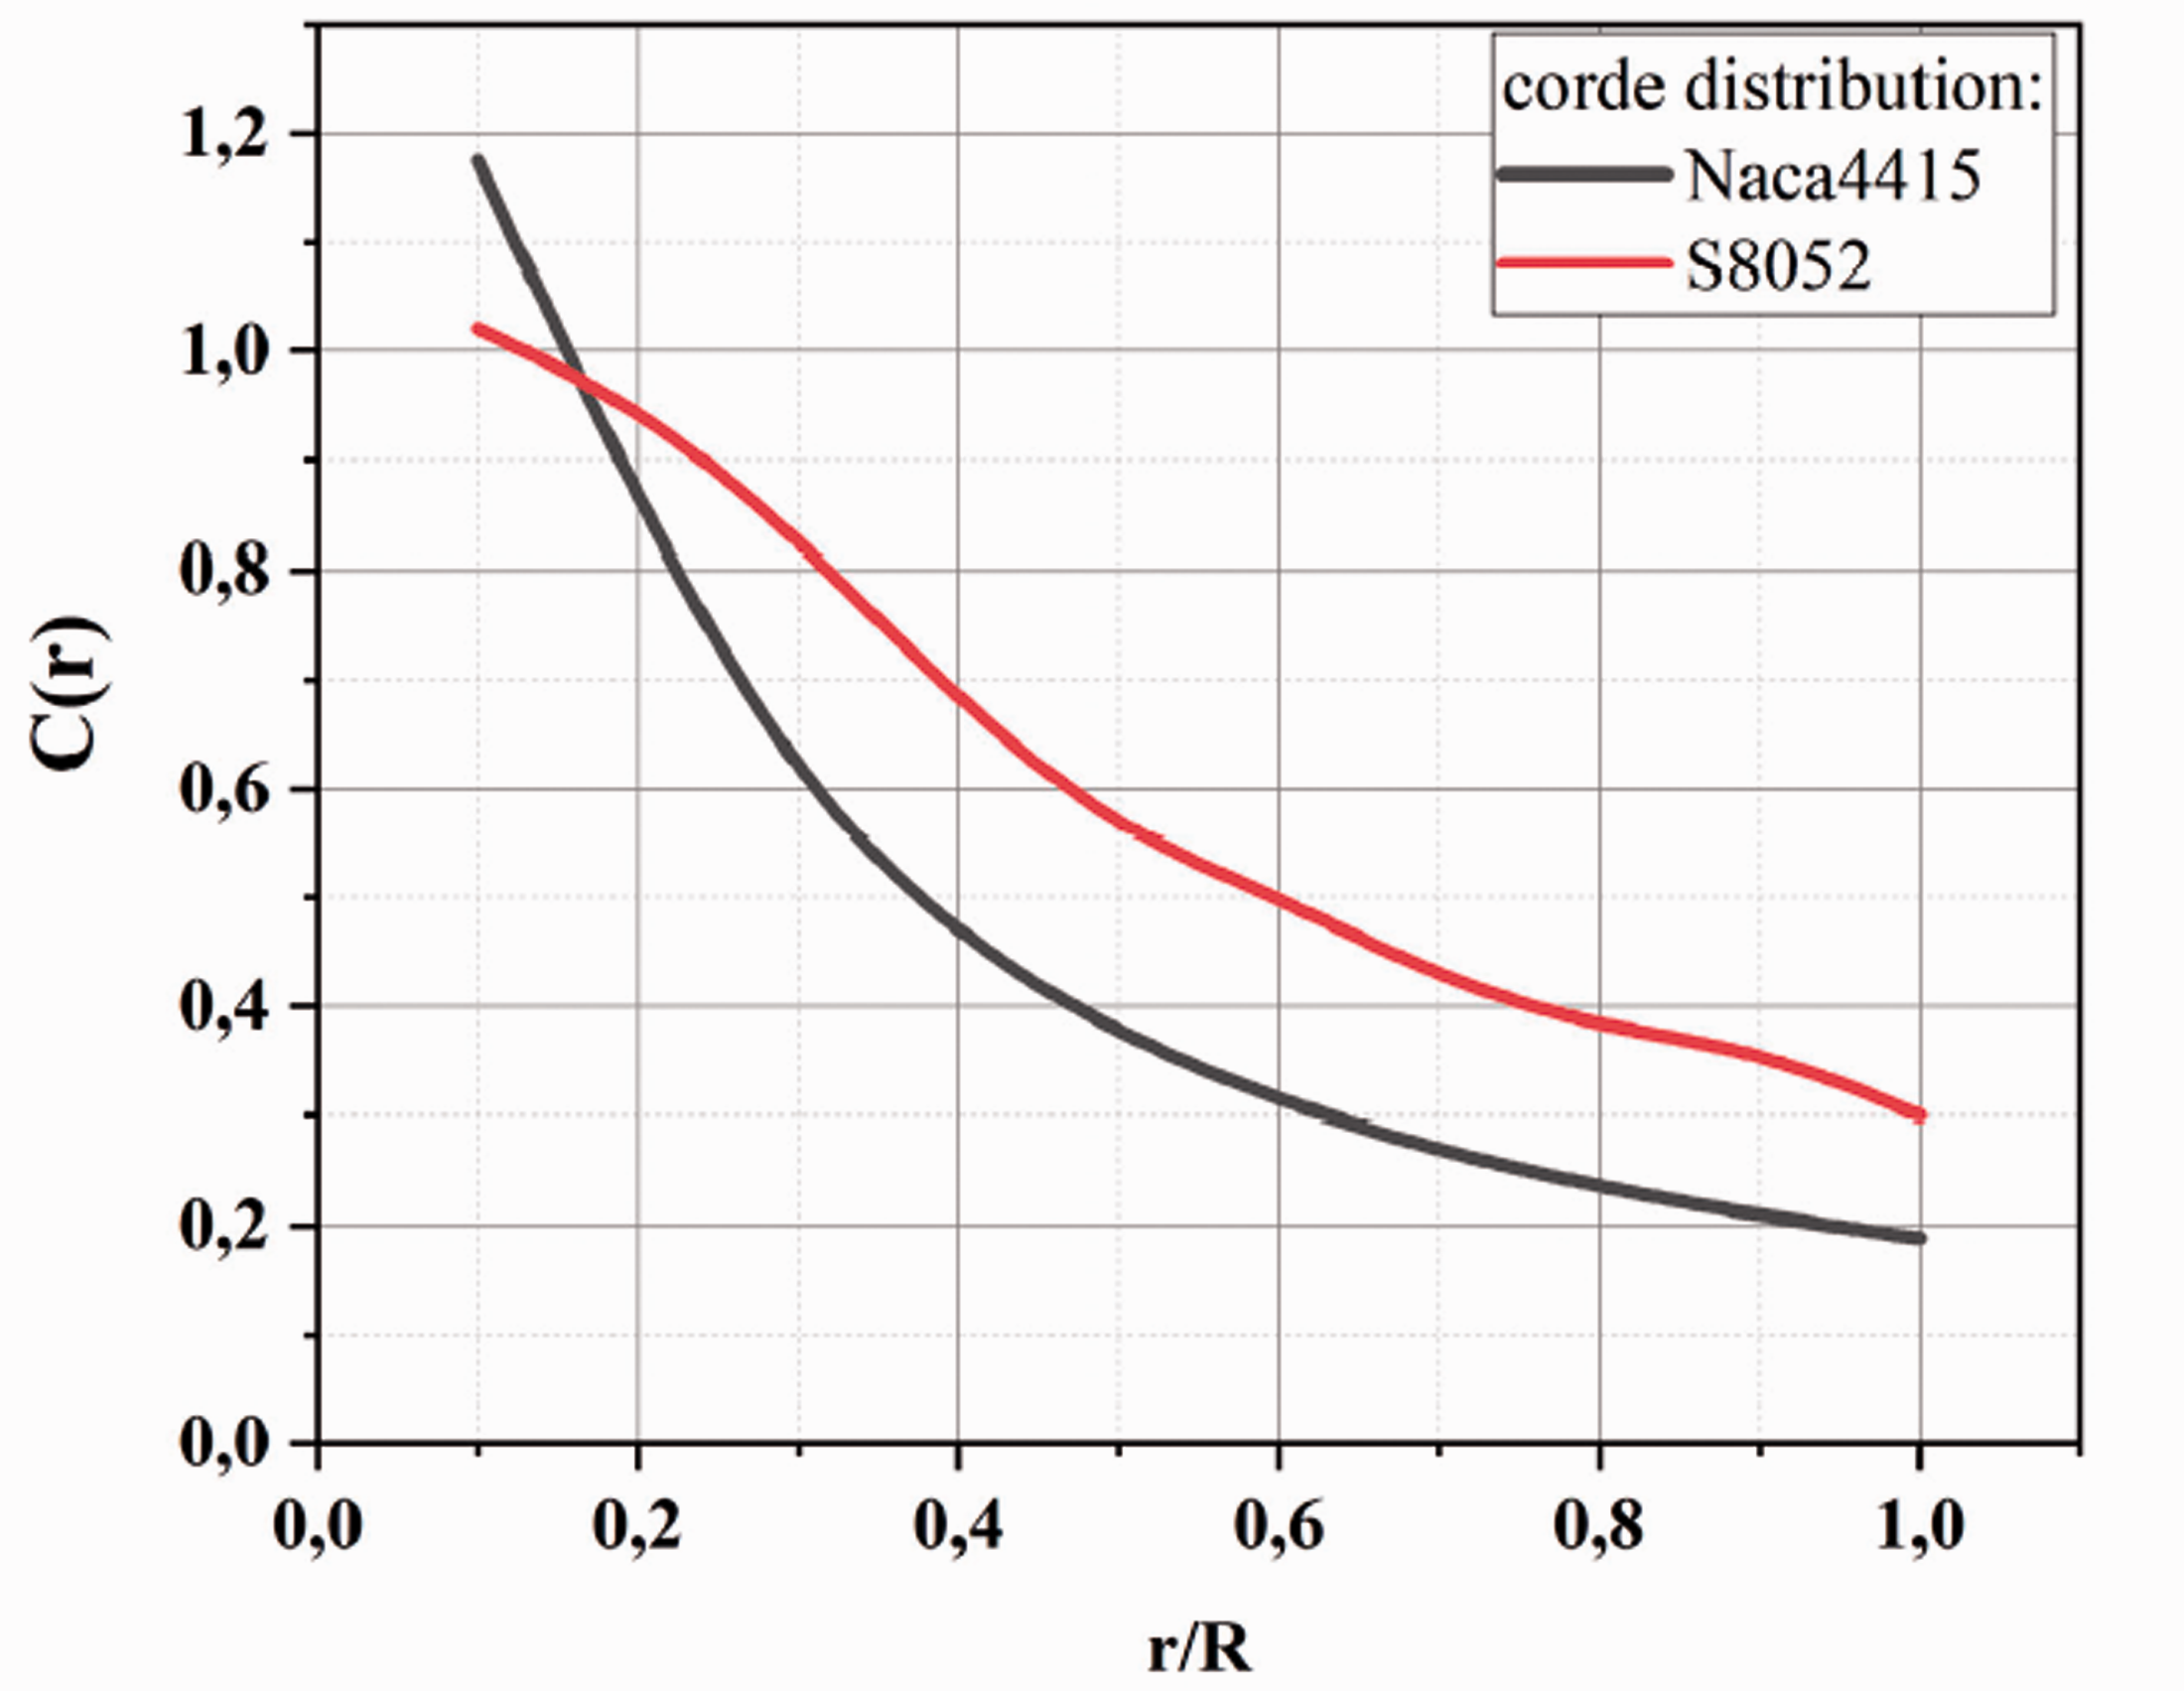
Chord distribution.
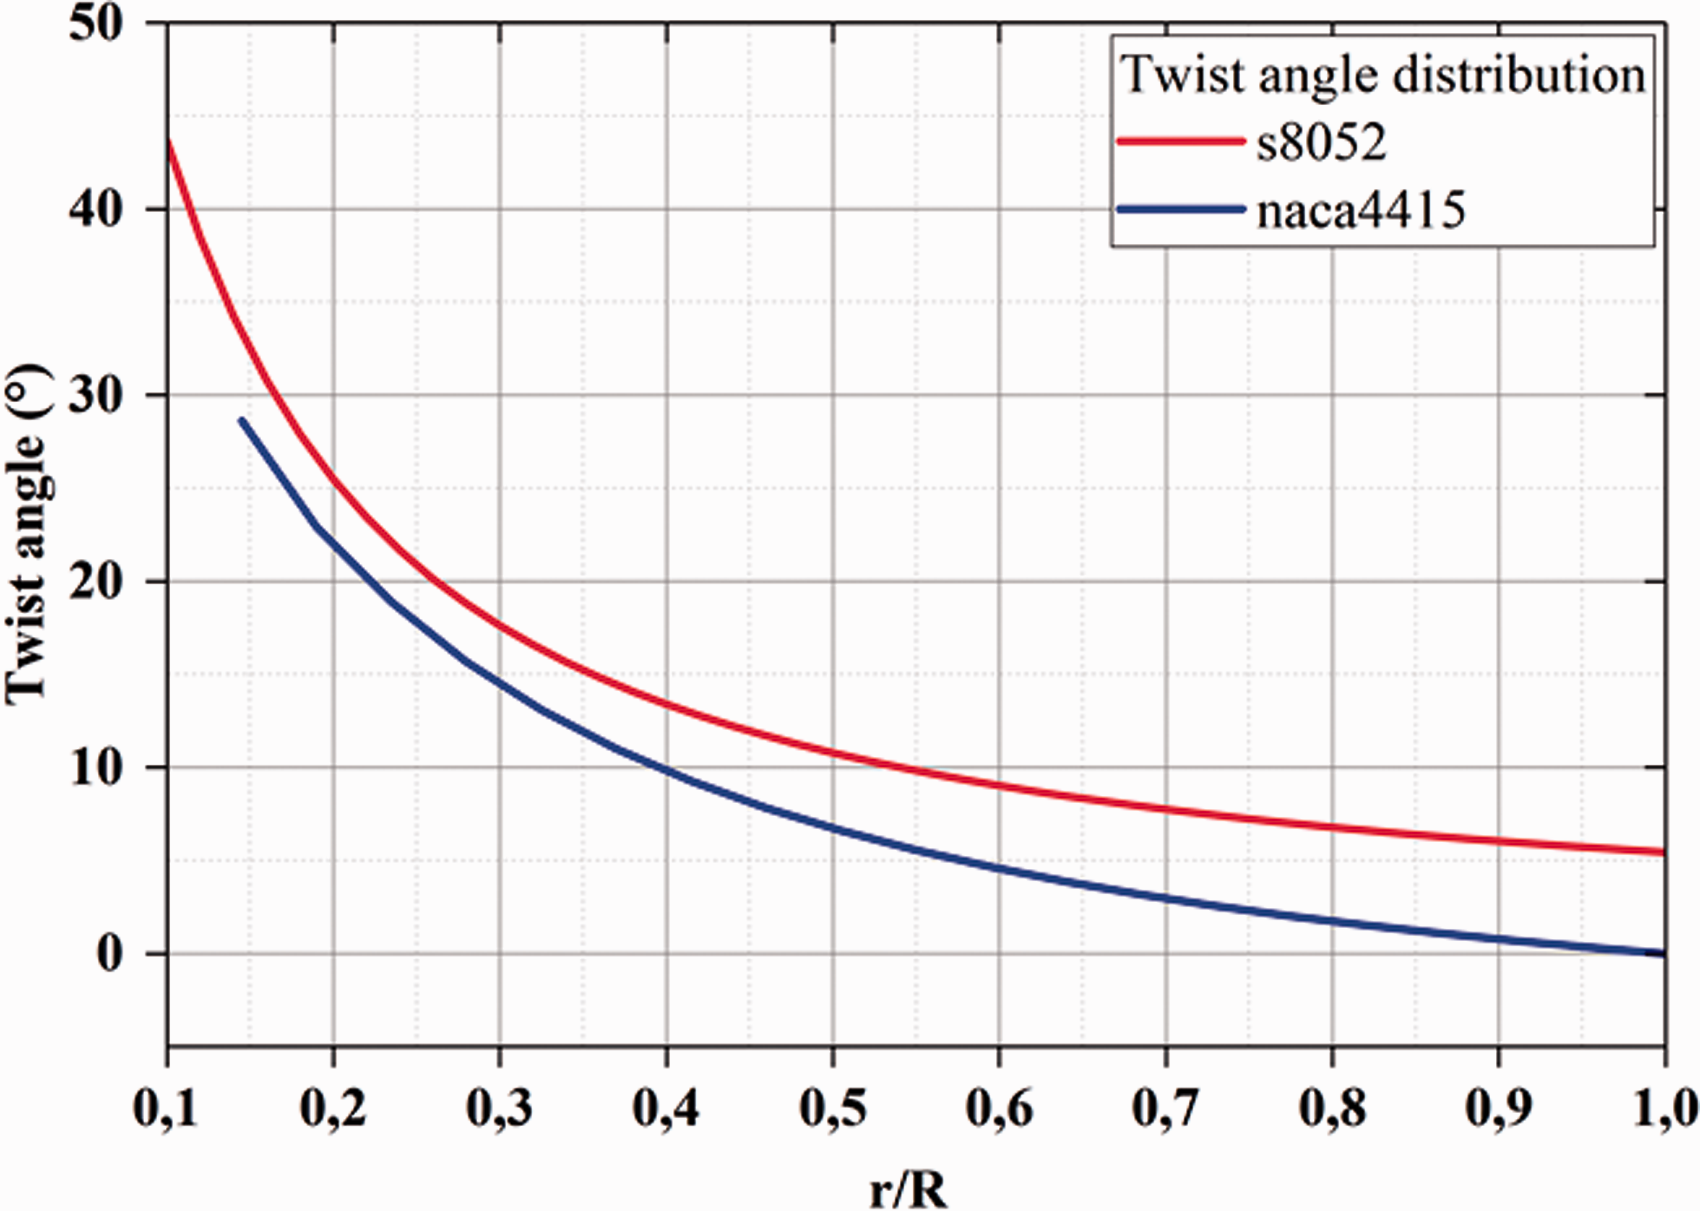
Twist angle distribution.
From the manufacturing point of view, it is preferable that the HKT has linear chord distribution. However, for better rotor performance, the chord distribution must follow the hyperbolic curve (Sathyajith and Philip, 2011).
In order to maintain the angle α and the lift uniform throughout the blade length, the blade must be twisted. The twist distribution was optimized for the two HKT s8052 and Naca4415 blade profile with R = 5 m at V = 1.5 m/s. The optimized twist distribution curve is shown in Figure 13.
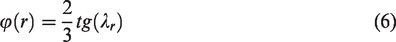
After determining the optimal shape of the blade, the forces acting on the blades as well as the power extracted by the propeller can be predicted using BEM theory. The BEM theory predicts the rotor performance analyzing and matching the blade forces generated by the blade element to the momentum changes occurring in the fluid through the rotor disc. It’s one of the most used theories to predict the hydrodynamics performances of a rotor(Batten et al., 2008), It is based on the subdivision of the blade into several elements, each isolated element is considered meaning that the change is caused by the force of this element. In this way, the actual flow which is three-dimension is changed in two dimensions makes it possible to find the equations (6) to (8). The details of the theory are presented in (Batten et al., 2008; Bavanish and Thyagarajan, 2013; Lanzafame and Messina, 2007).
The normal force:

The tangential force:

The Torque:

The theoretical rotor power:
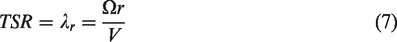
Where dr is the thickness of blade element ρ is the water density, W is the relative flow velocity, Cl and Cd are the lift and drag coefficients the hydrofoil, V is the free flow velocity, r is the radius of local blade element and Ω is the angular velocity of rotor.
Once the optimal shape of the blades is determined by the formulas of the previous section, it is now possible to calculate the forces and torques acting on blades and the power extracted by the propeller. Figures 15 and 16 show the distribution of aerodynamic loads on Naca4415 and s8052 blades profiles.
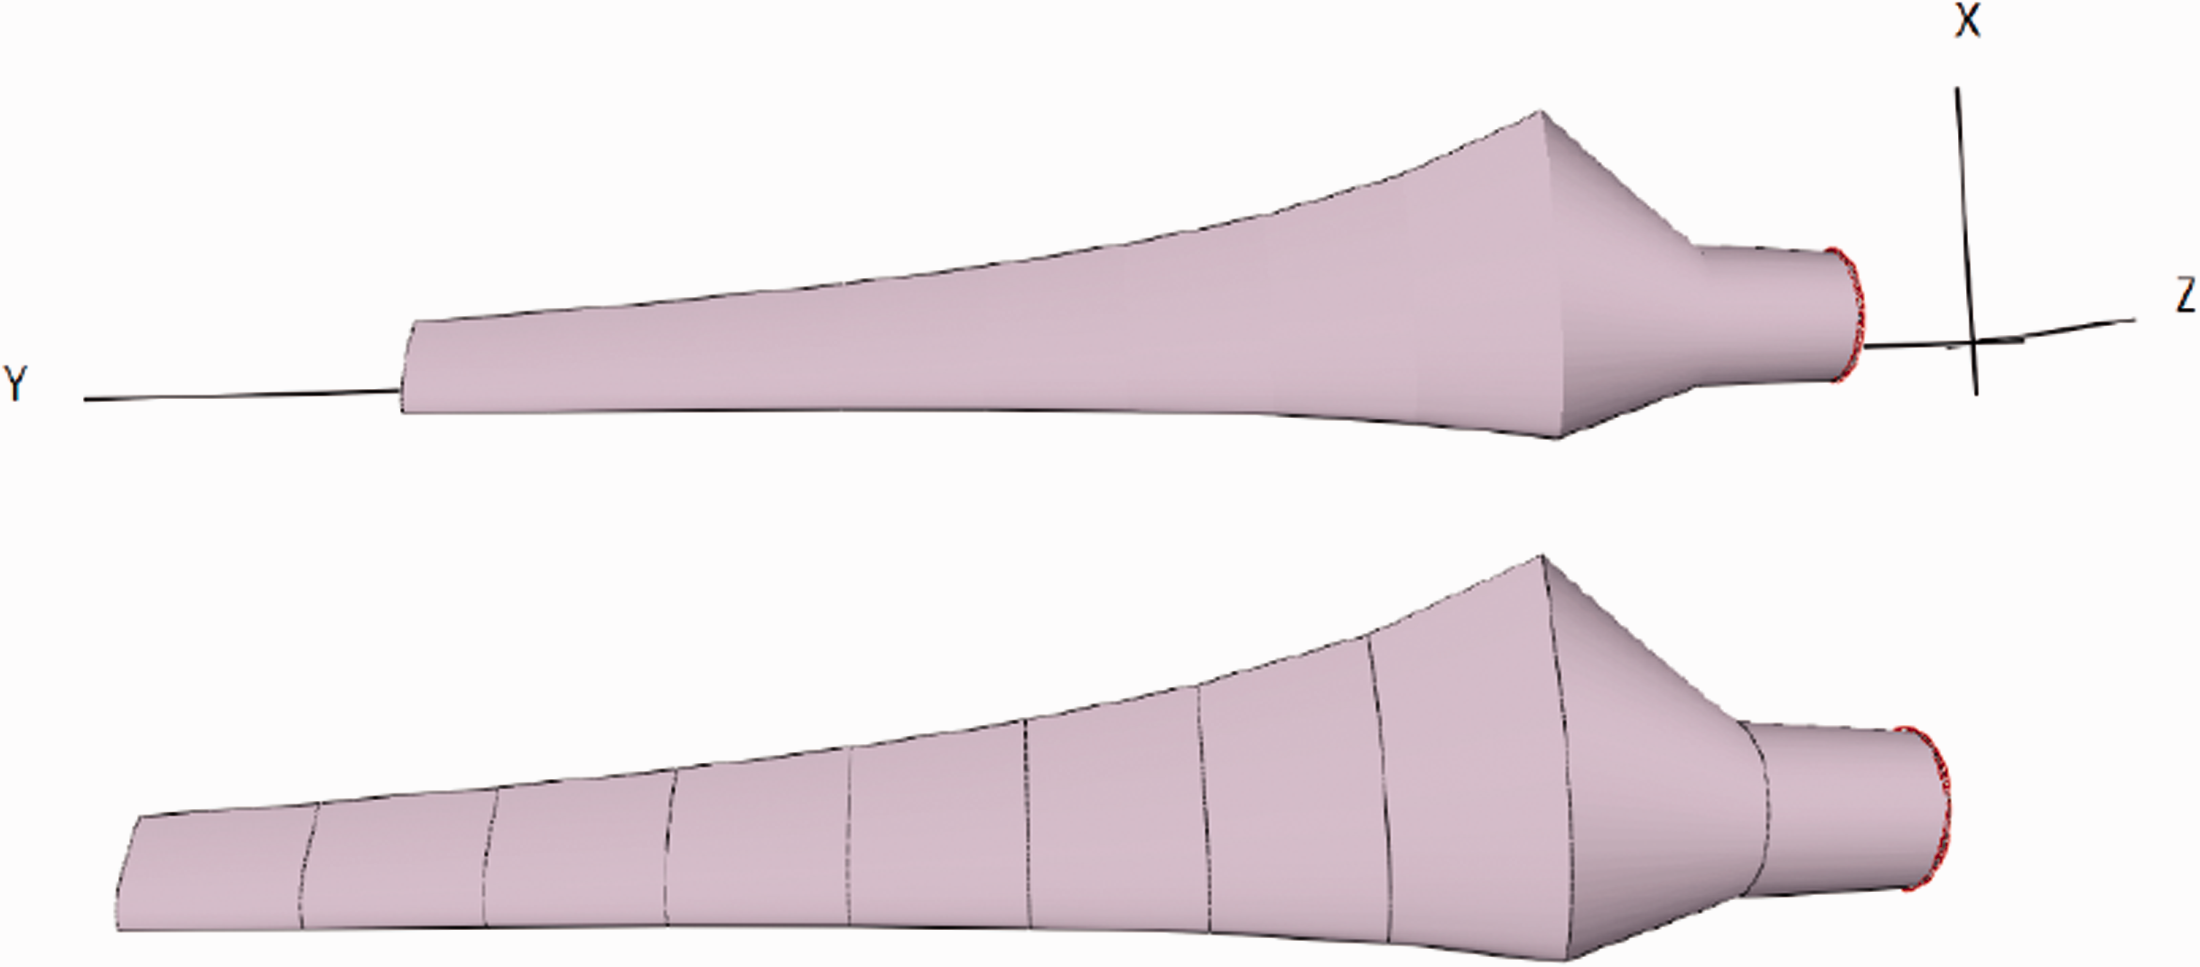
Naca4415 blade profile shape.
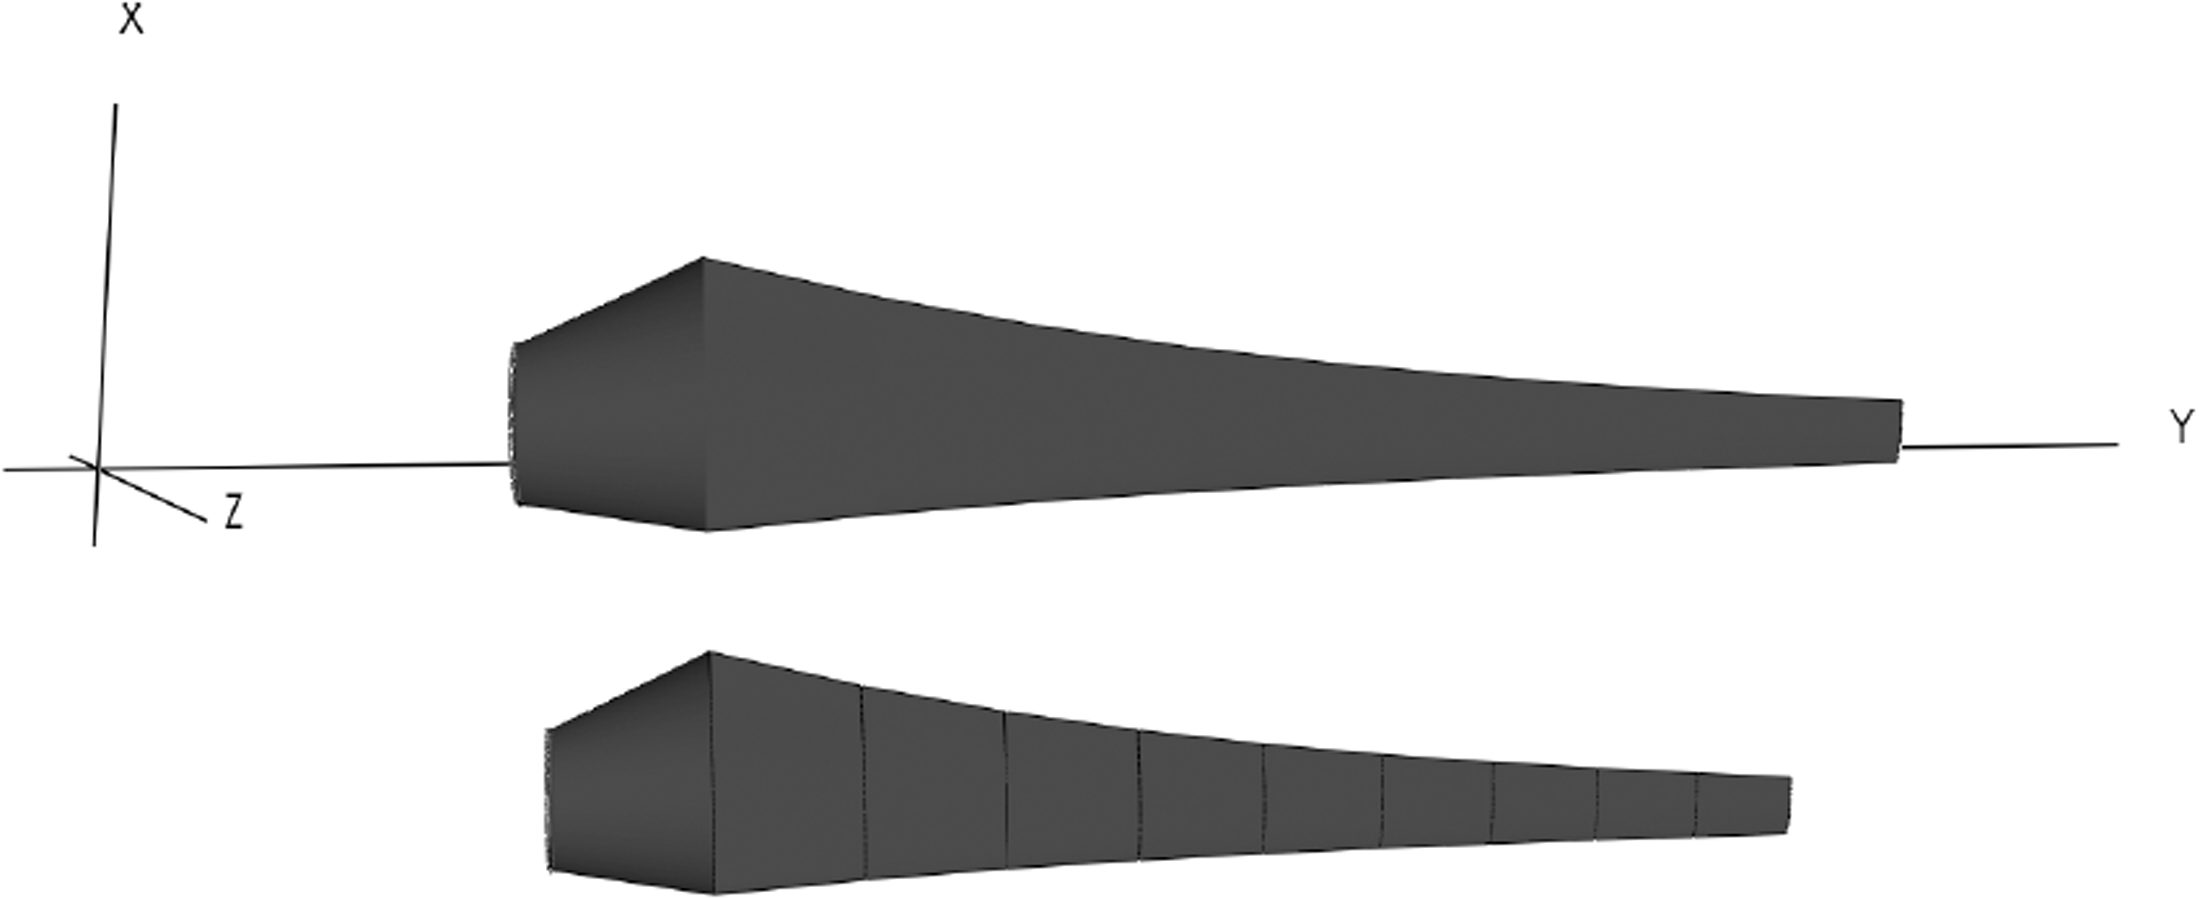
s8052 blade profile shape.
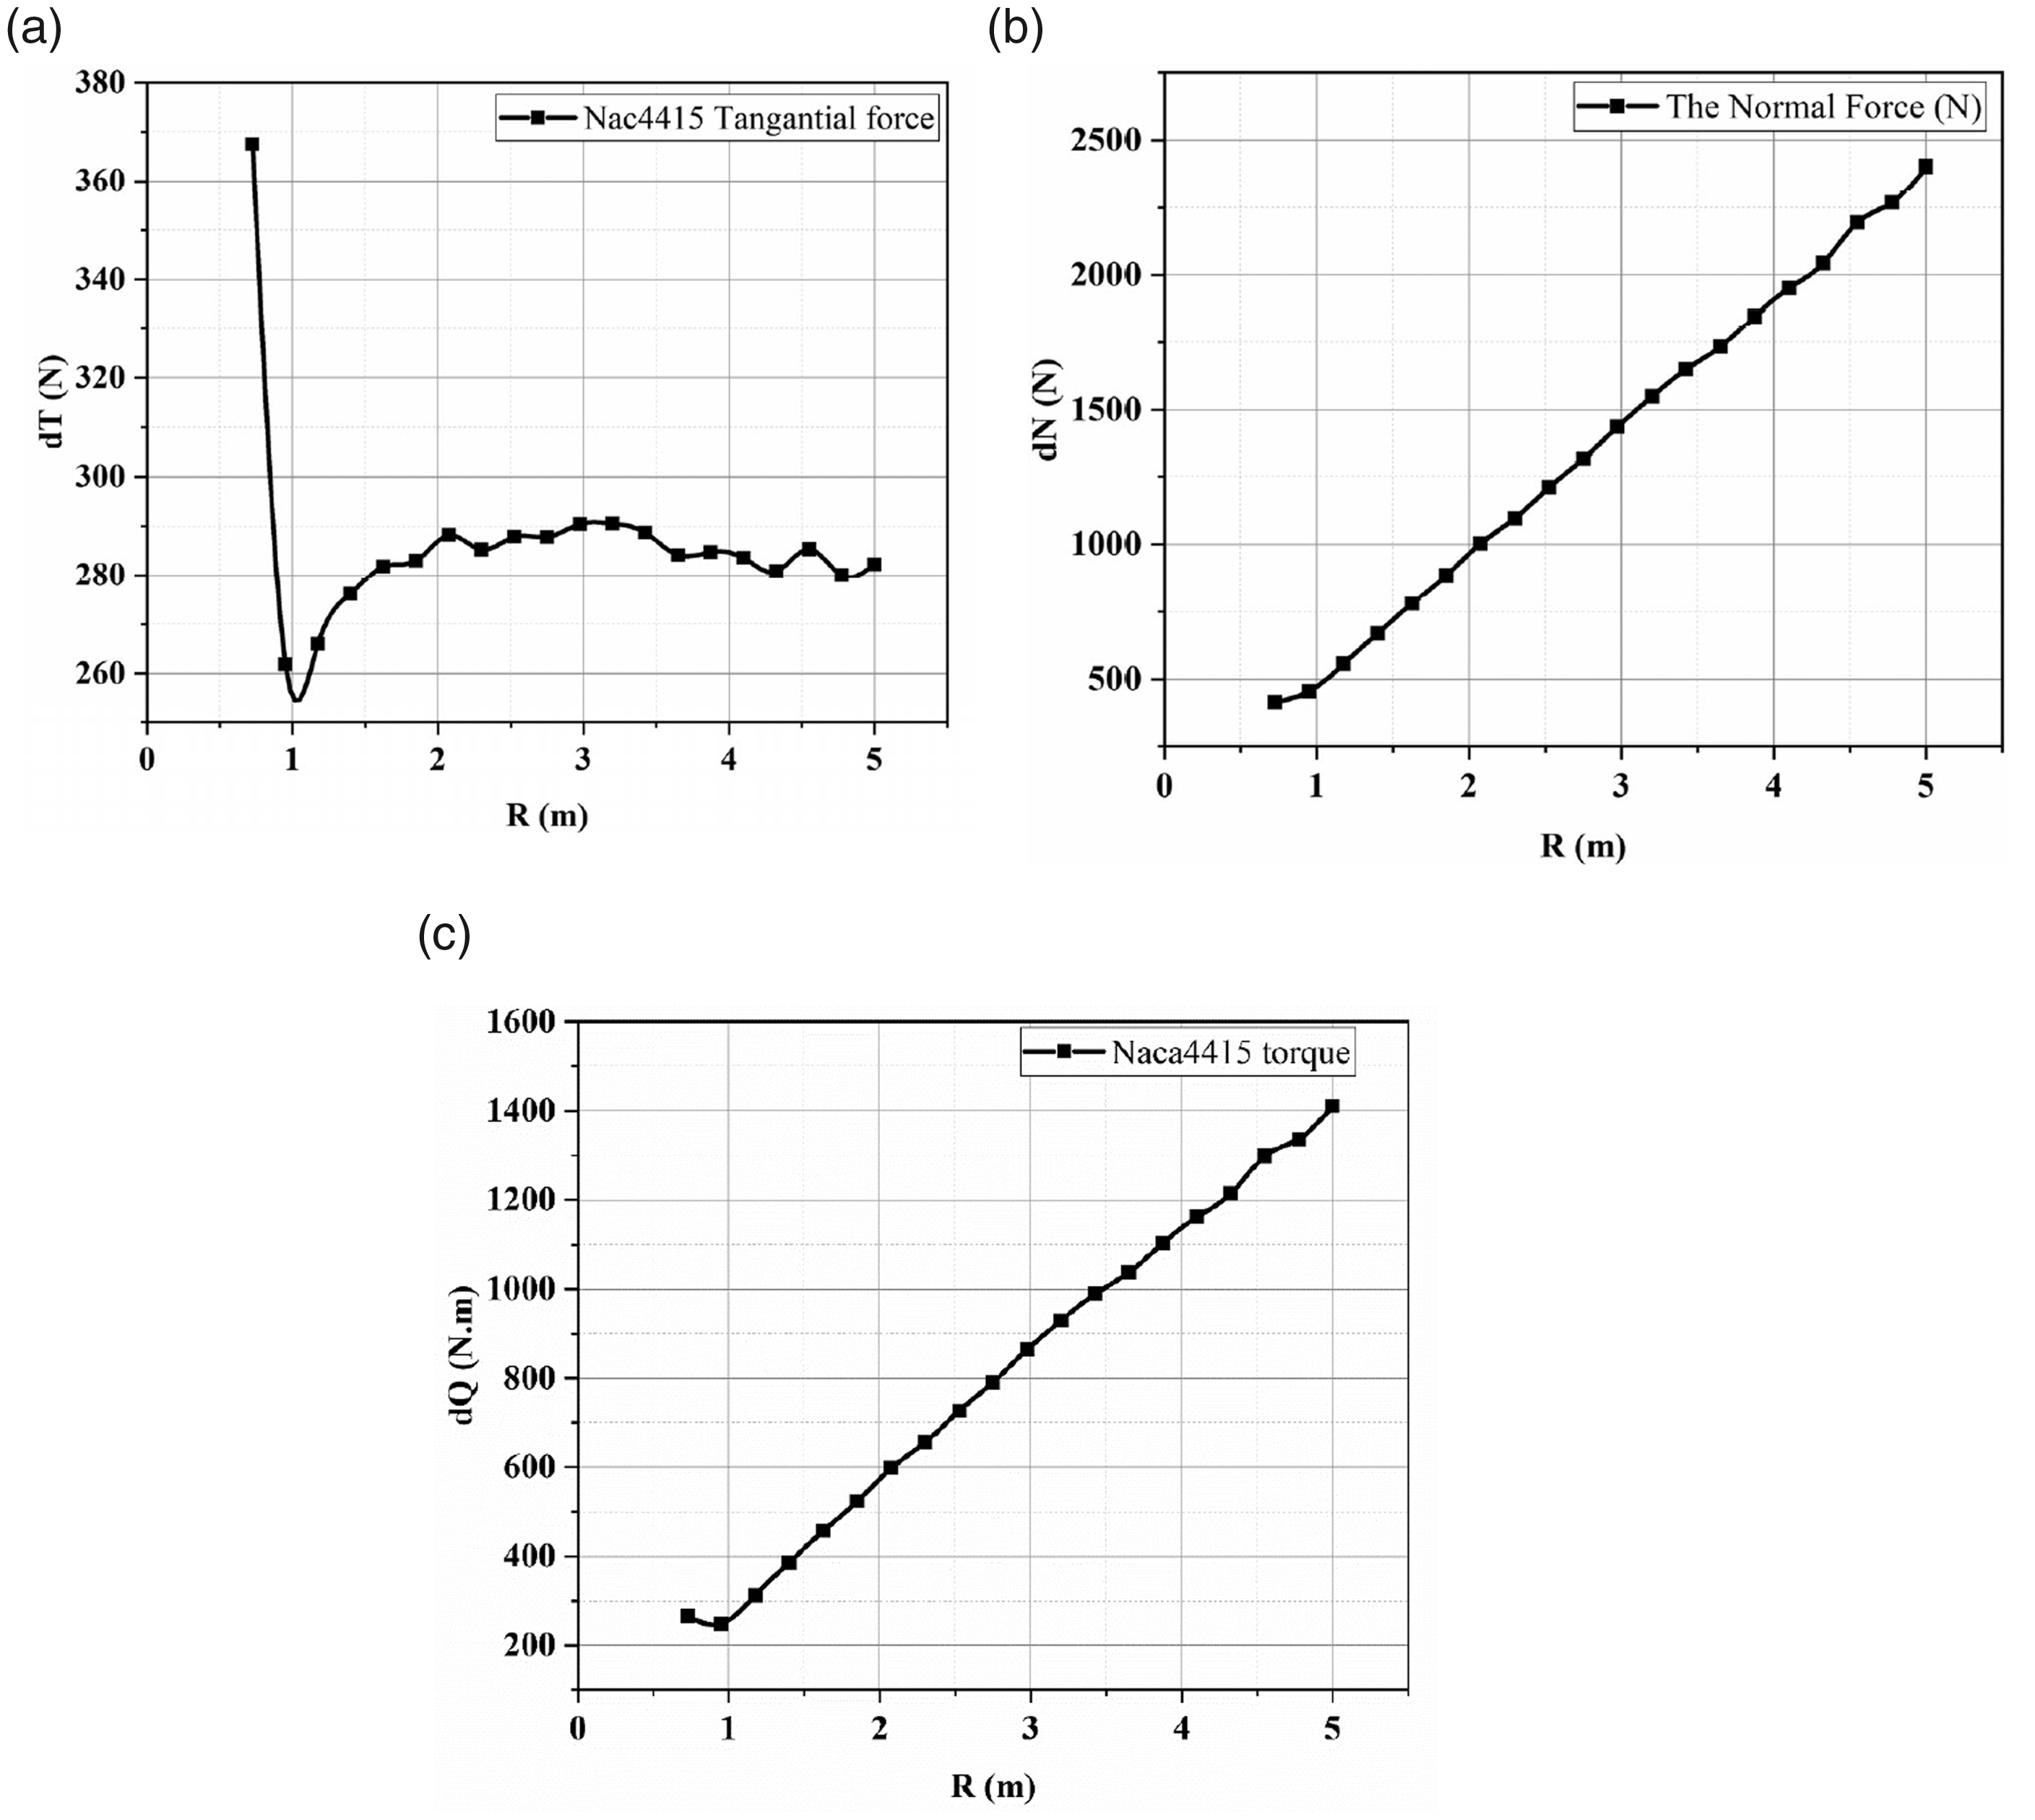
Naca4415 hydrodynamics load distribution. (a) Tangential forces acting on Naca4415 blade. (b) Normal forces acting on Naca4415 blade. (c) Torque forces acting on Naca4415 blade.
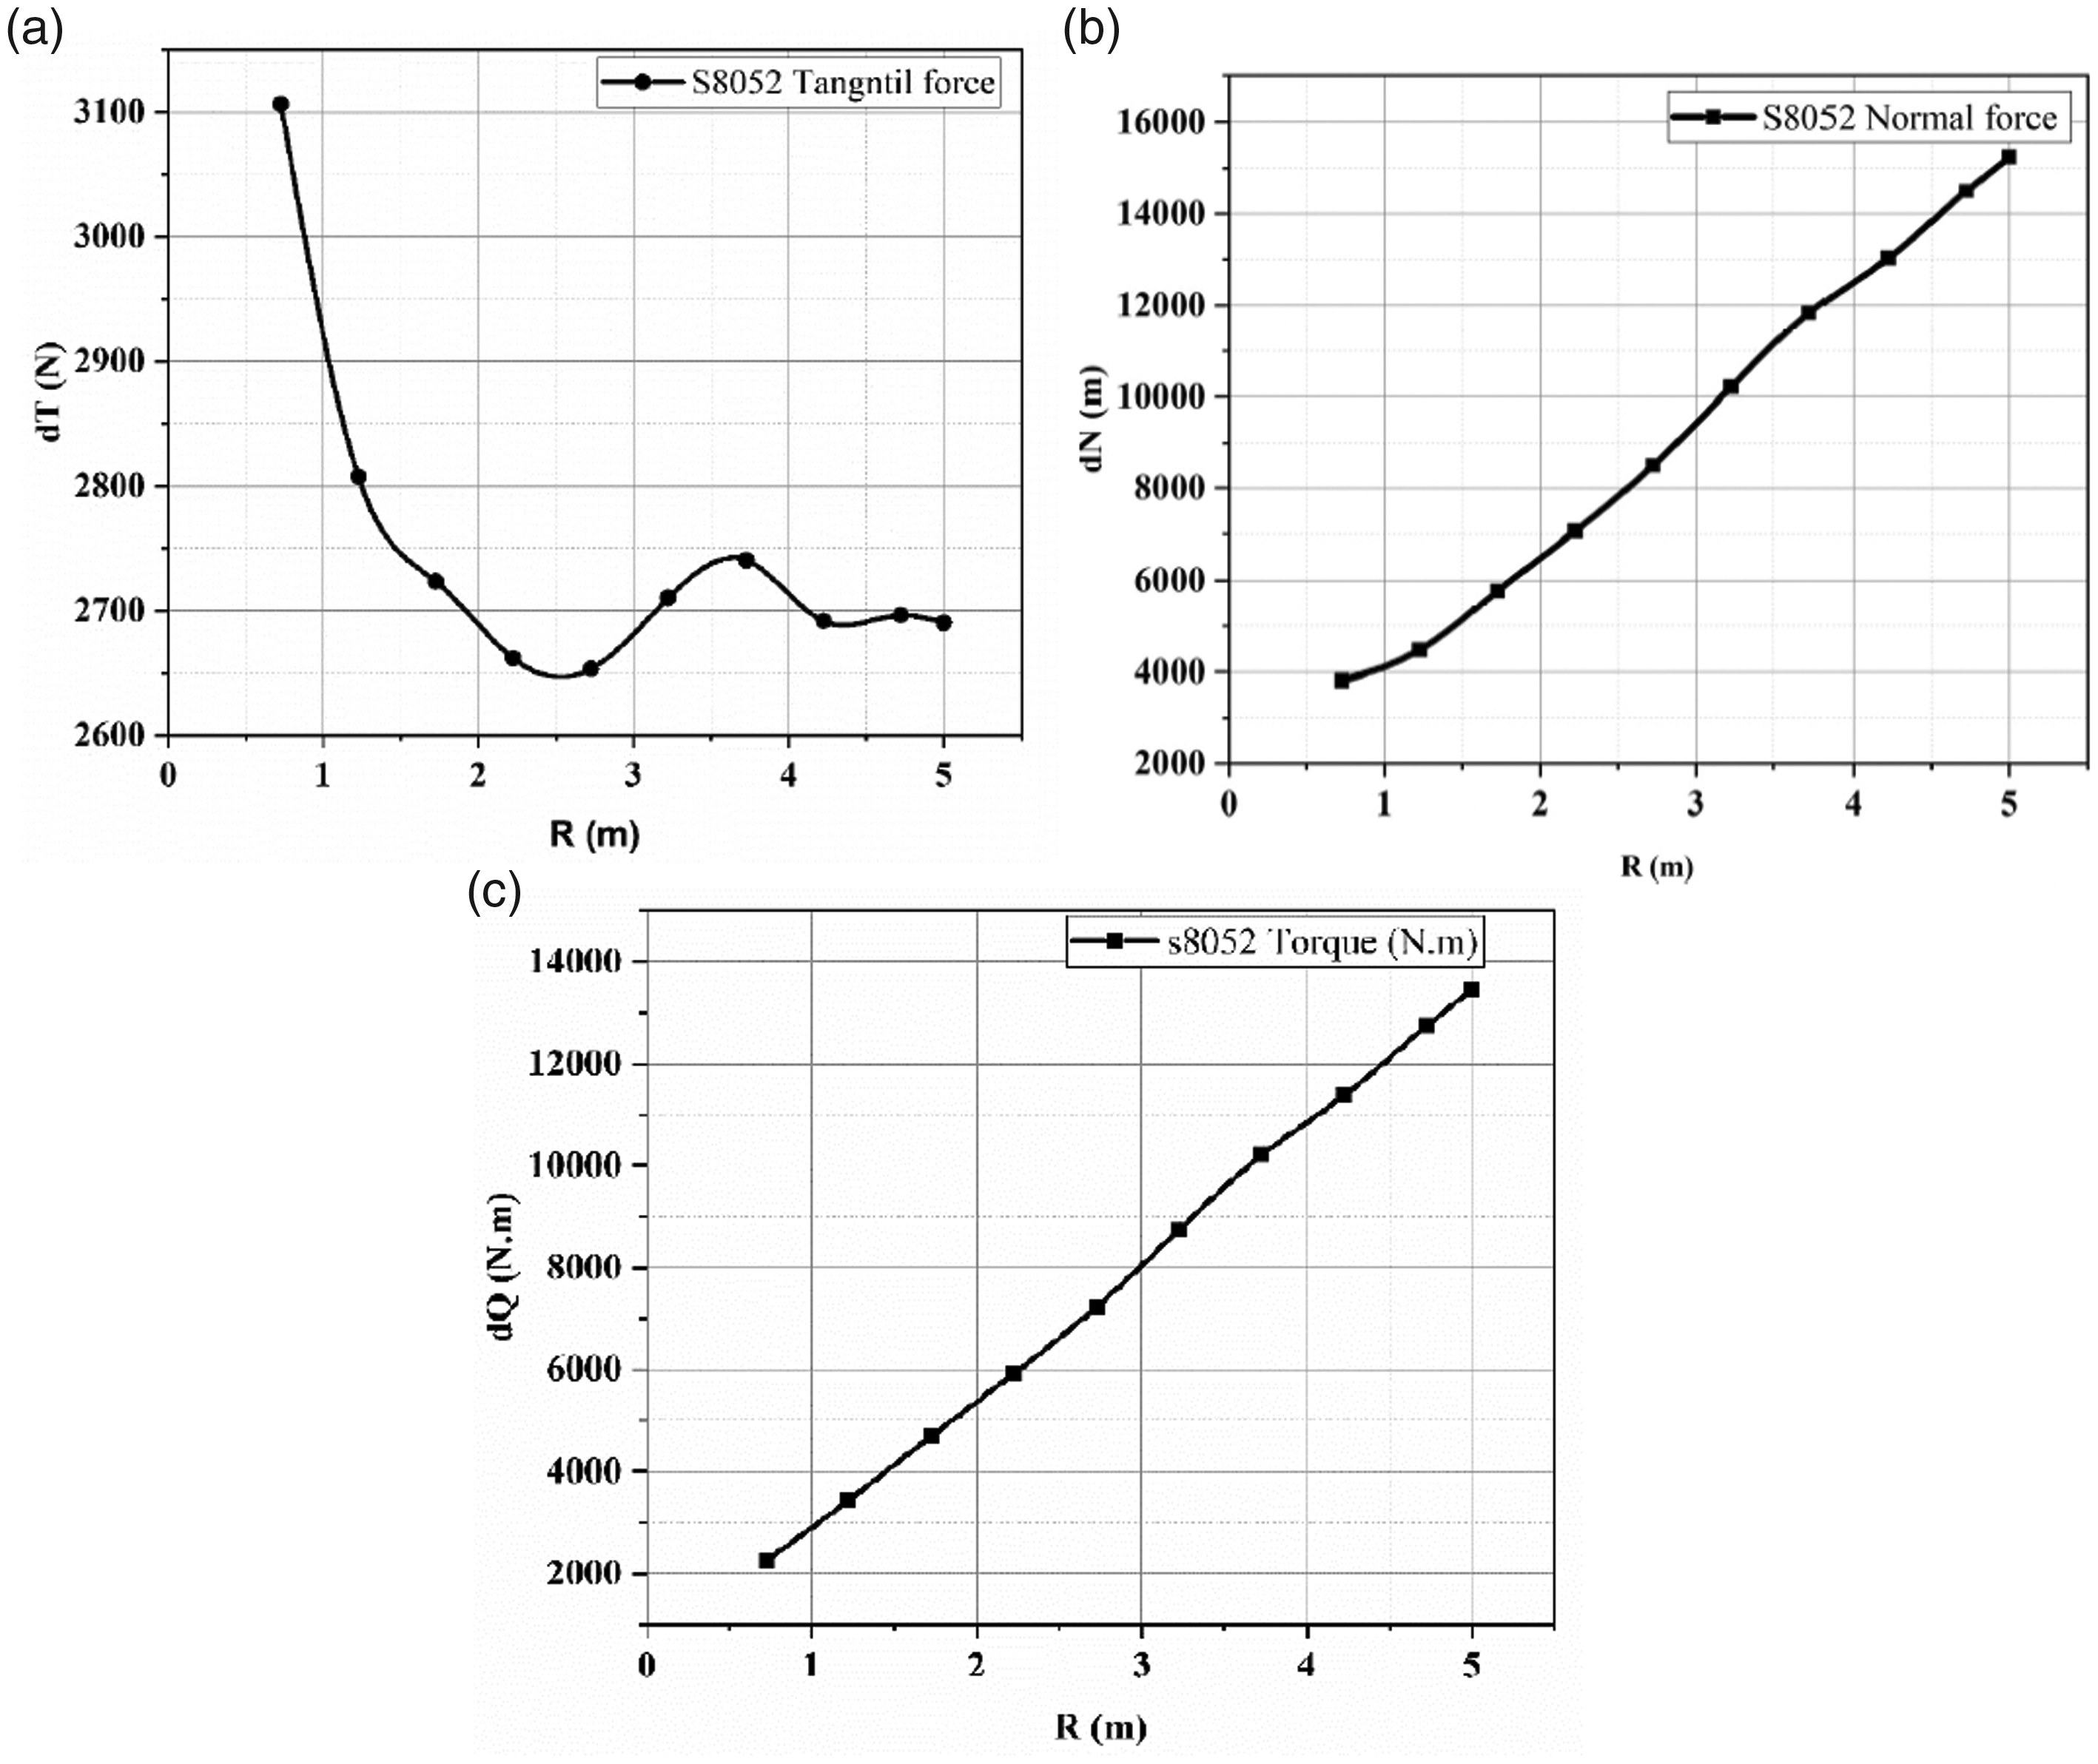
s8052 hydrodynamics load distribution. (a) Normal forces acting on S8052 blade. (b) Normal forces acting on S8052 blade. (c) The torque acting on S8052 blade.
The results of the hydrodynamic load distribution along the blades of both profiles (Figures 17 and 18) show that the tangential load is high when close to the hub. Contrary to the moment and normal loads. The most charged zone of either profile Naca4415 or s8052 is the zone nearest to the hub, which is why the blade profile is thicker at the beginning than at the tip.
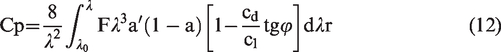
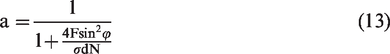
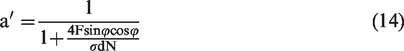
Since the power contained in marine currents is converted into energy by the turbine, the calculation of its energy efficiency is characterized by the calculation of the power coefficient Cp given by the equation (10) taking into consideration the tip losses, the diameters of the turbine and the rotational speed (TSR).
The power coefficient:
Where: the axial factor:
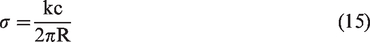
The solidity:
The Prandtl tip-losses:
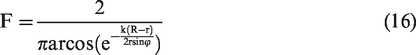
Figure 19 shows the rotor power coefficients of Naca4415 and s8052 profiles working in the same conditions. The maximum theoretical Cp is 38% for Naca4415 at 6.5 TSR and 31% for s8052 at 7 TSR. The Naca4415 and s8052 rotors have an interesting theoretical Cp reaching the margin of 5.3 up to 7.6 TSR. The Naca4415 rotor has a higher efficiency than the s8052 rotor, therefore it will perform well in the study area conditions.
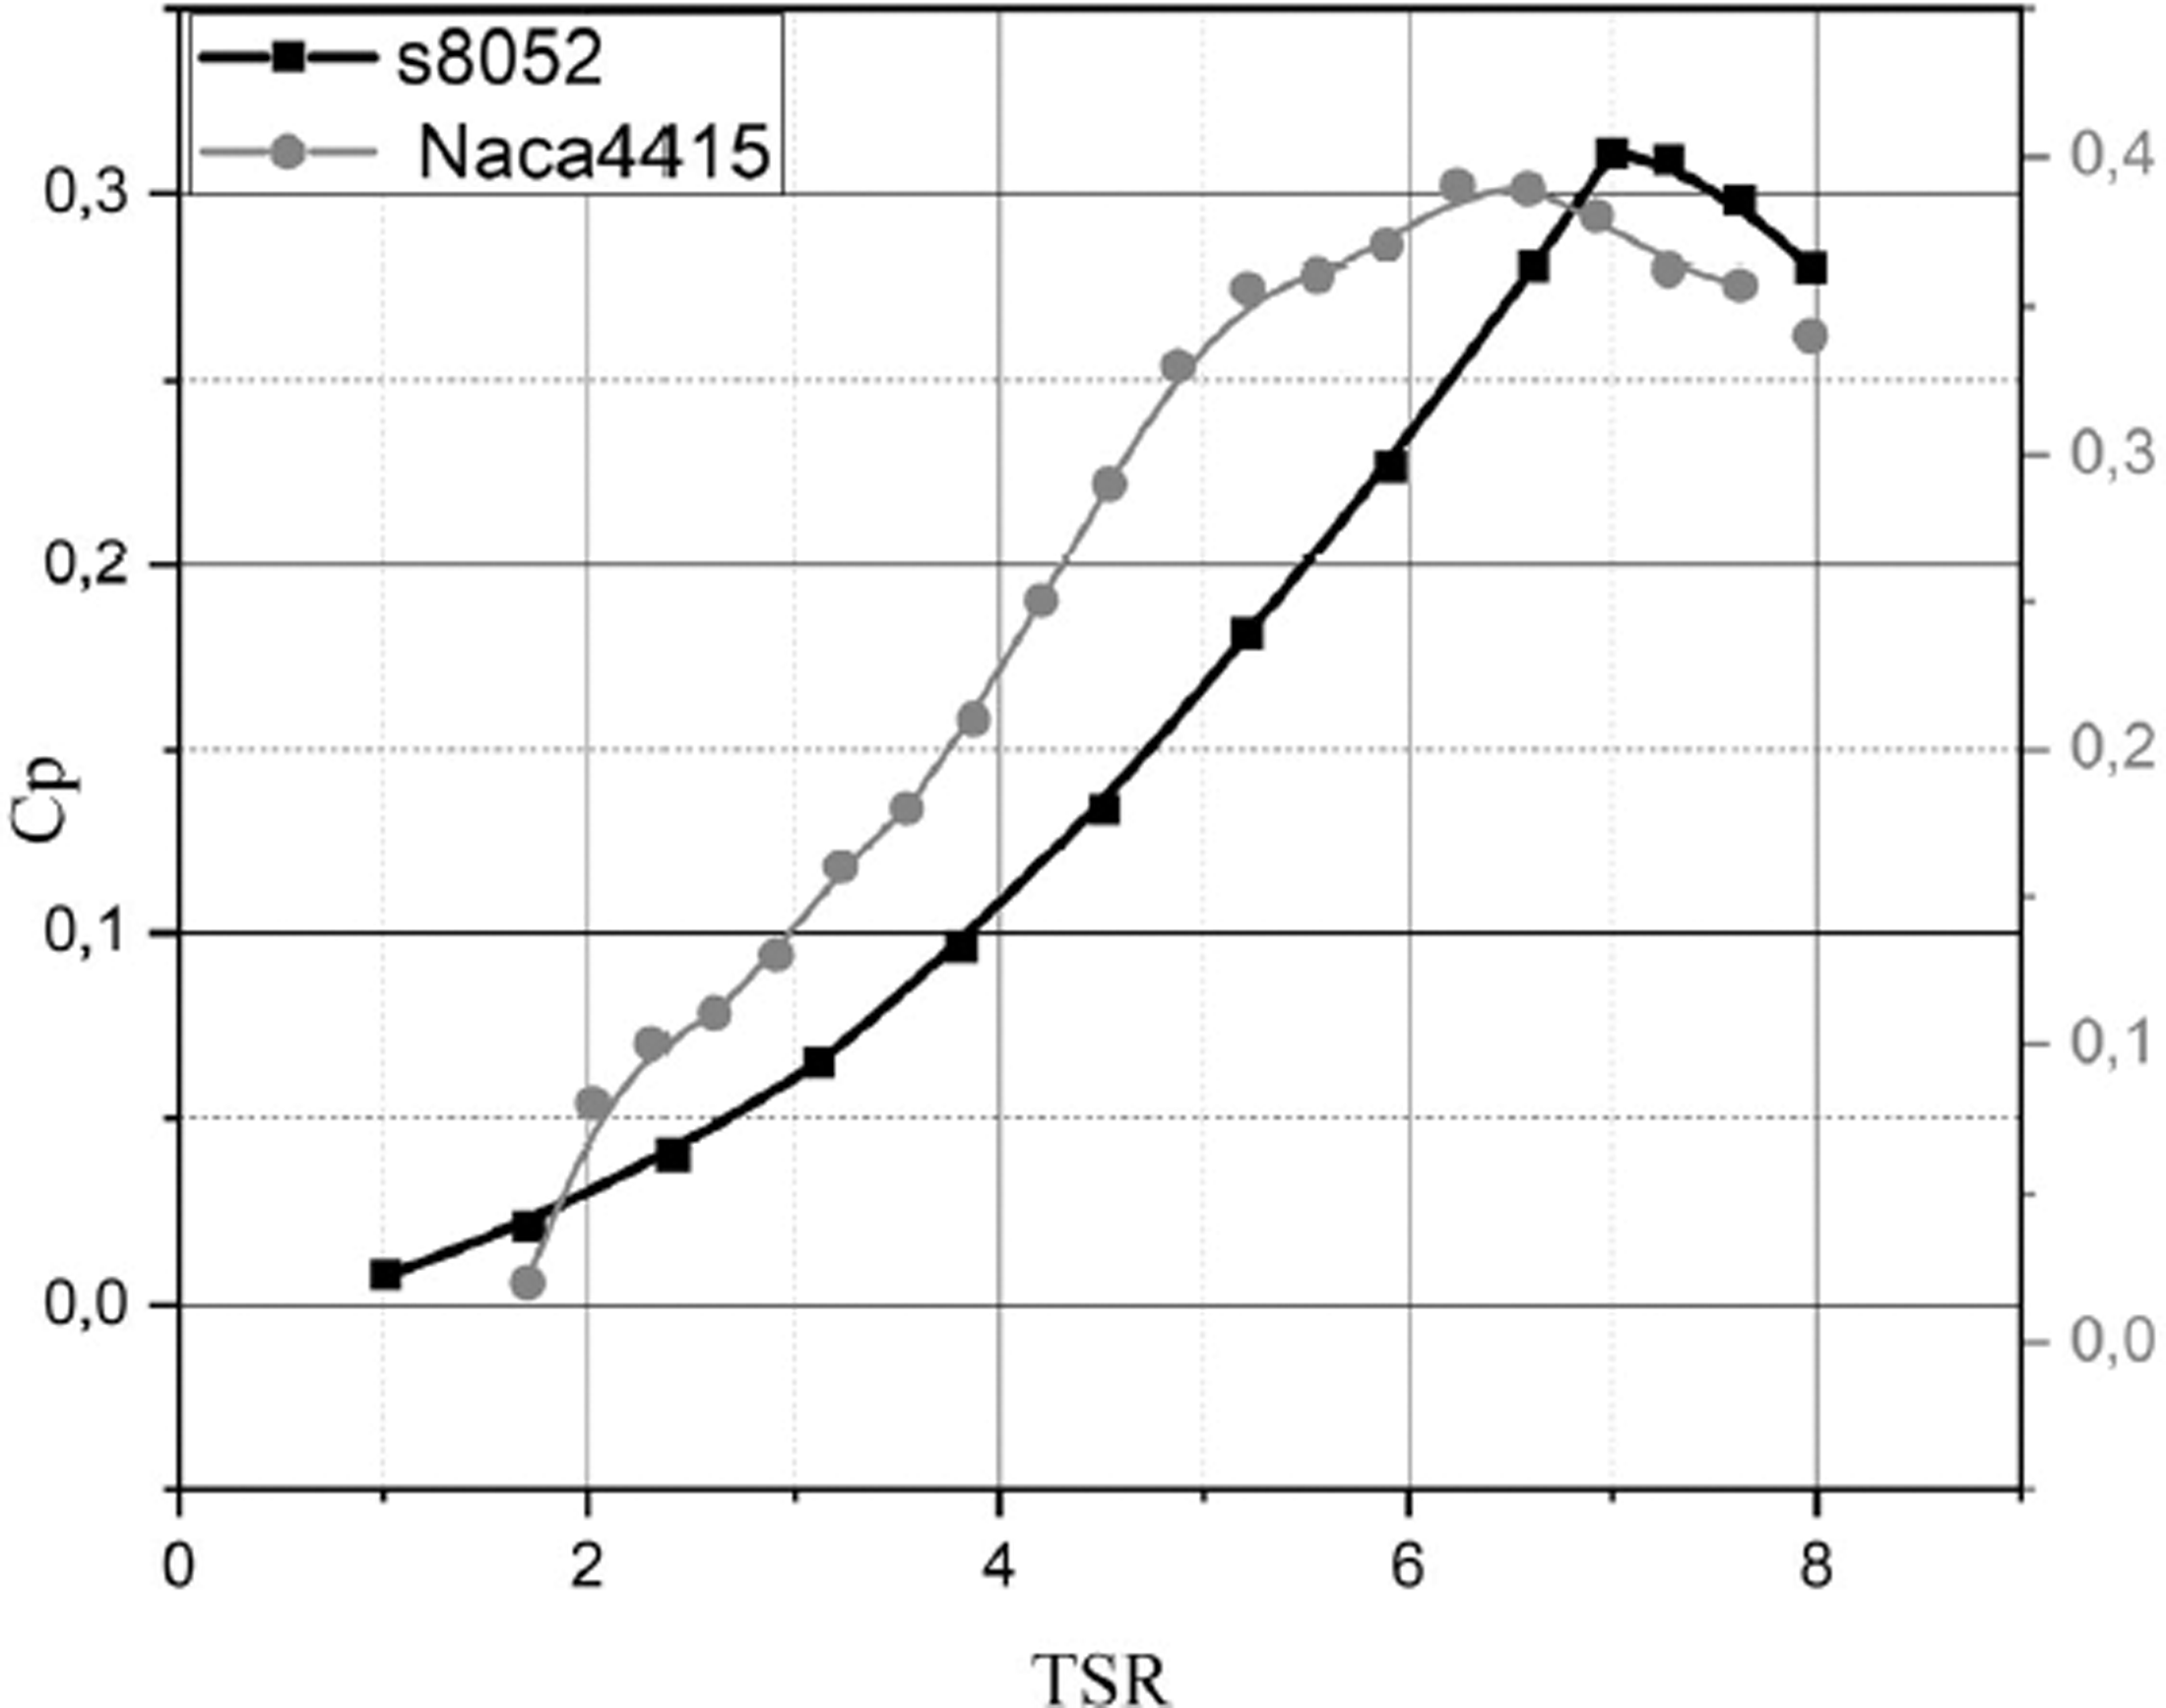
Rotor power coefficients.
Figure 20 shows the available power of the rotor based on sea current velocities. The nominal marine current speed is 56 KW for the Naca profile and 40 KW for s8052. So the two rotors have a promising output power.
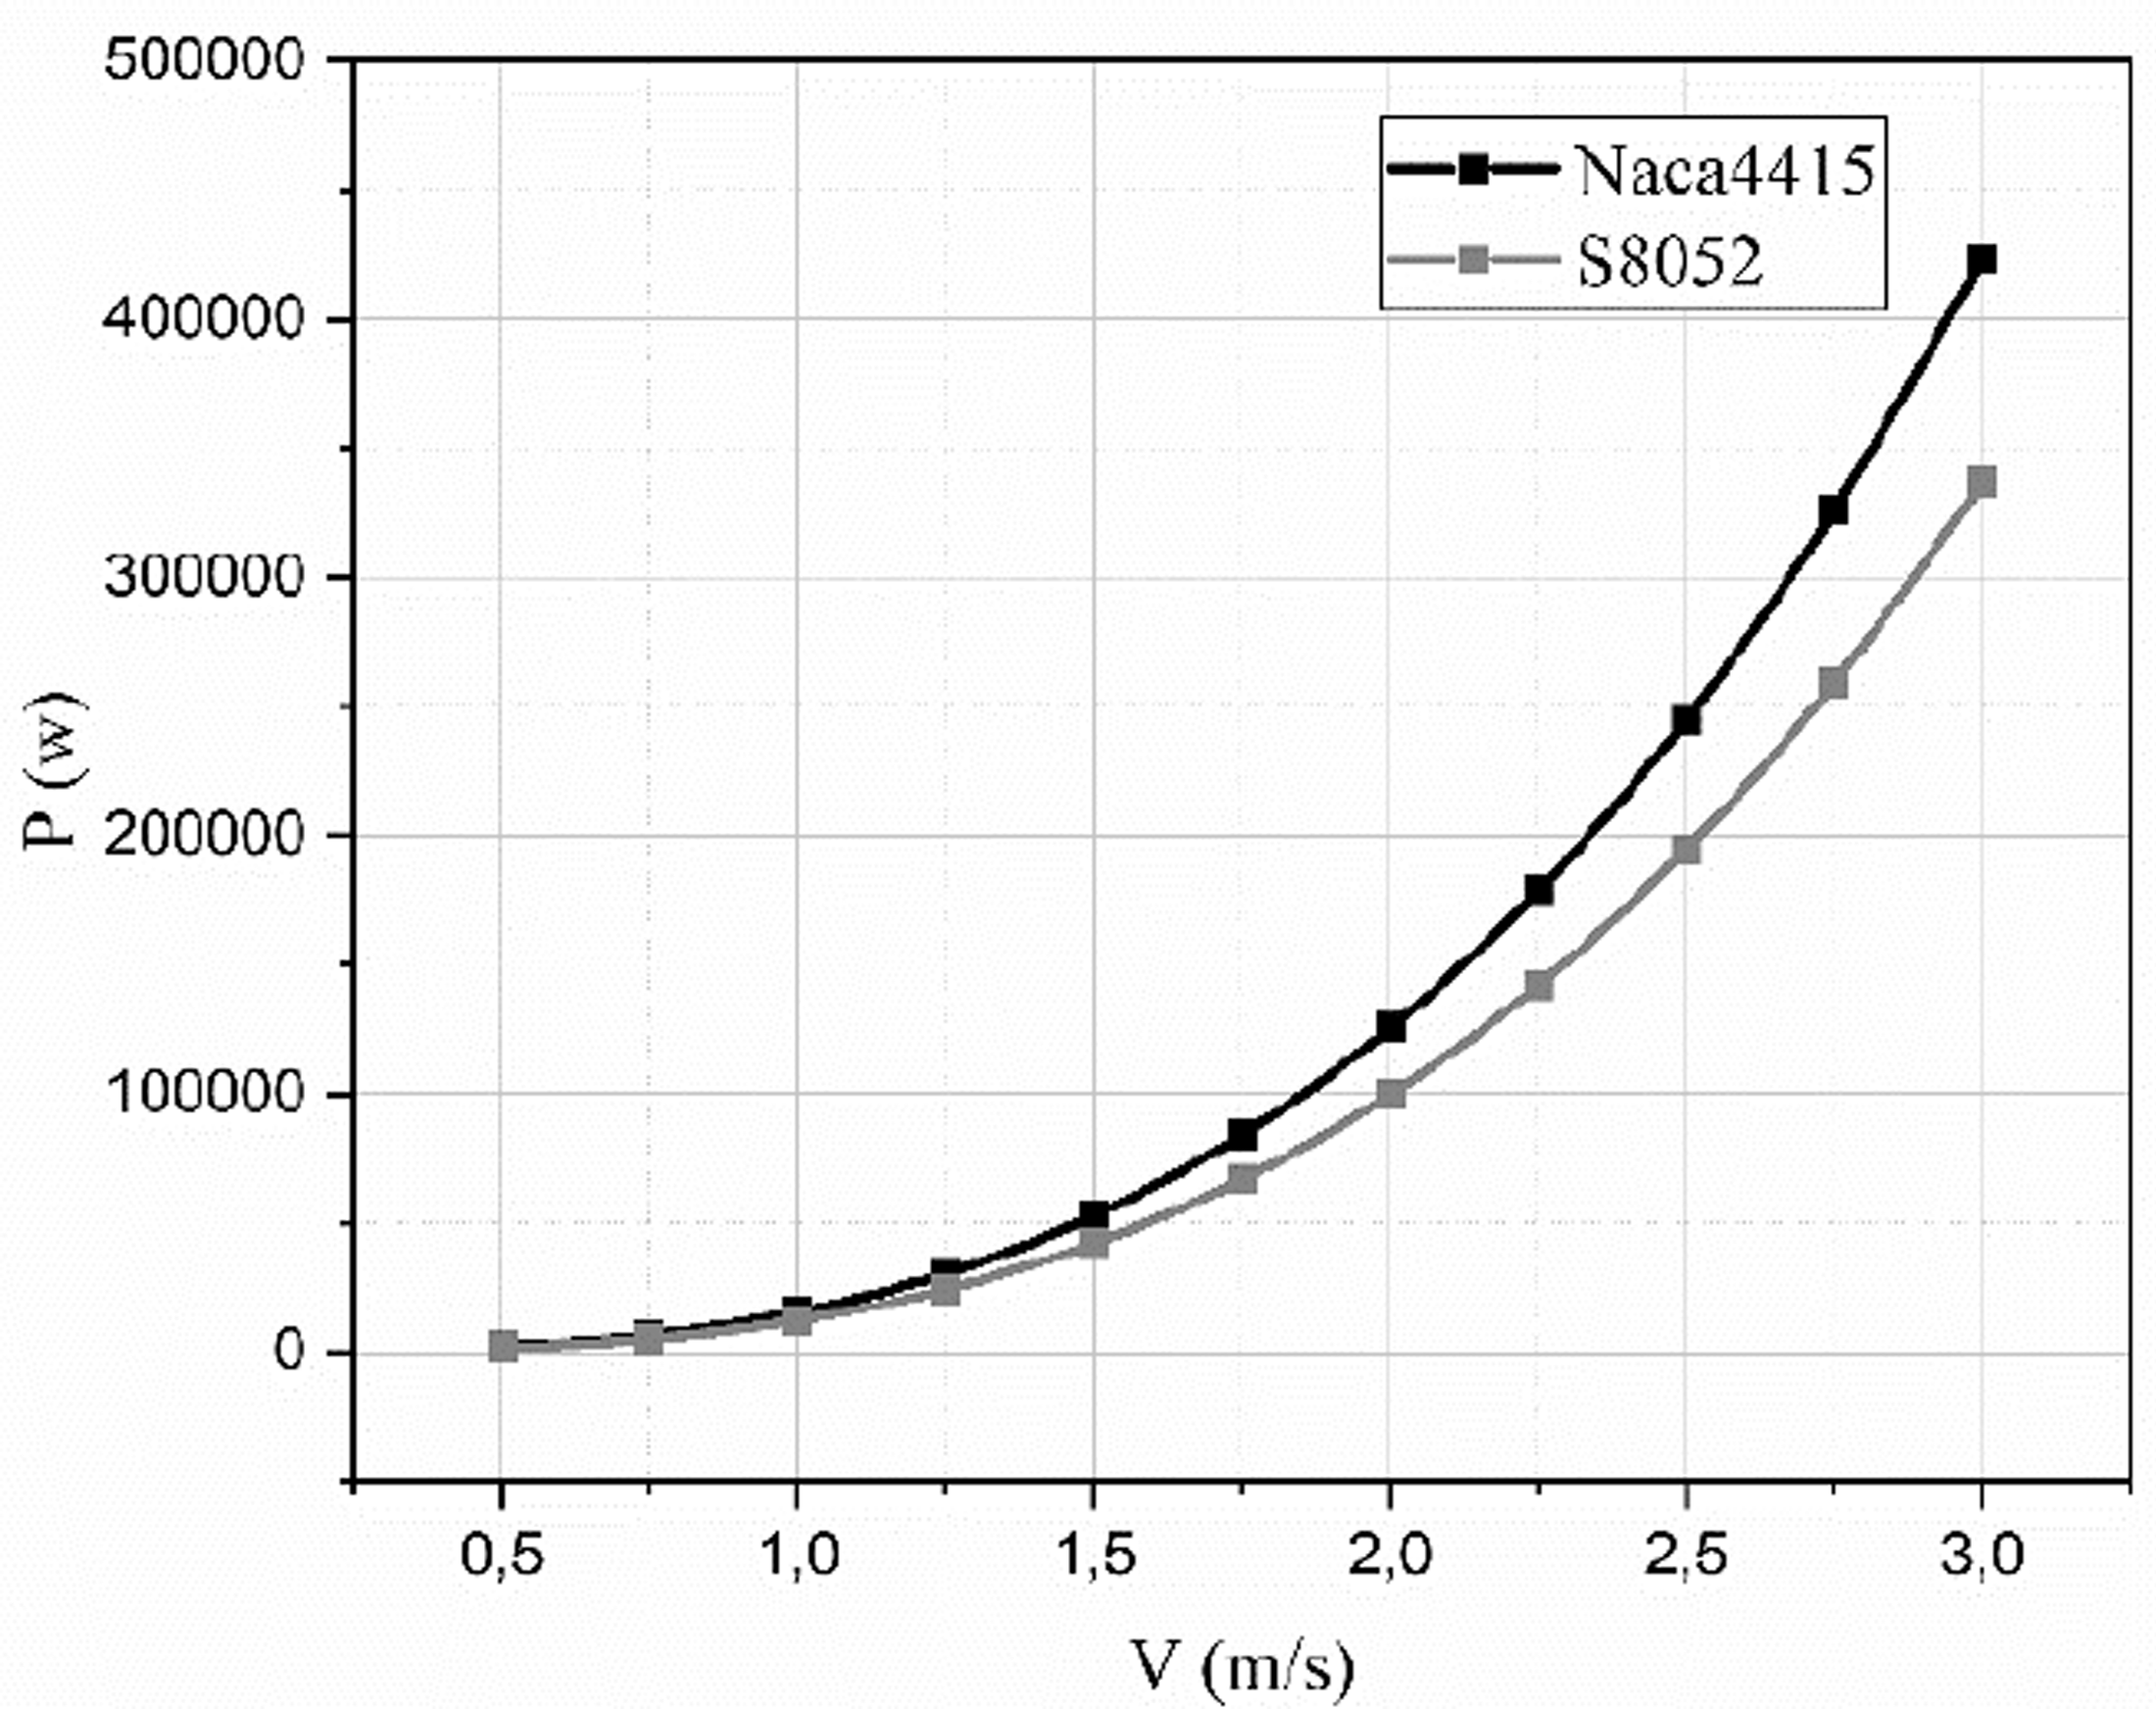
The rotor power based on current speeds.
Figure 21 shows the mean power per month. The maximum average of available power is about 250 KW for Naca4415 and 200 KW for s8052 in September 2018. It can be concluded that the power produced by the Naca4415 profile rotor is better than the s8052 profile, so the adequate rotor profile to implement in the study area is Naca4415.
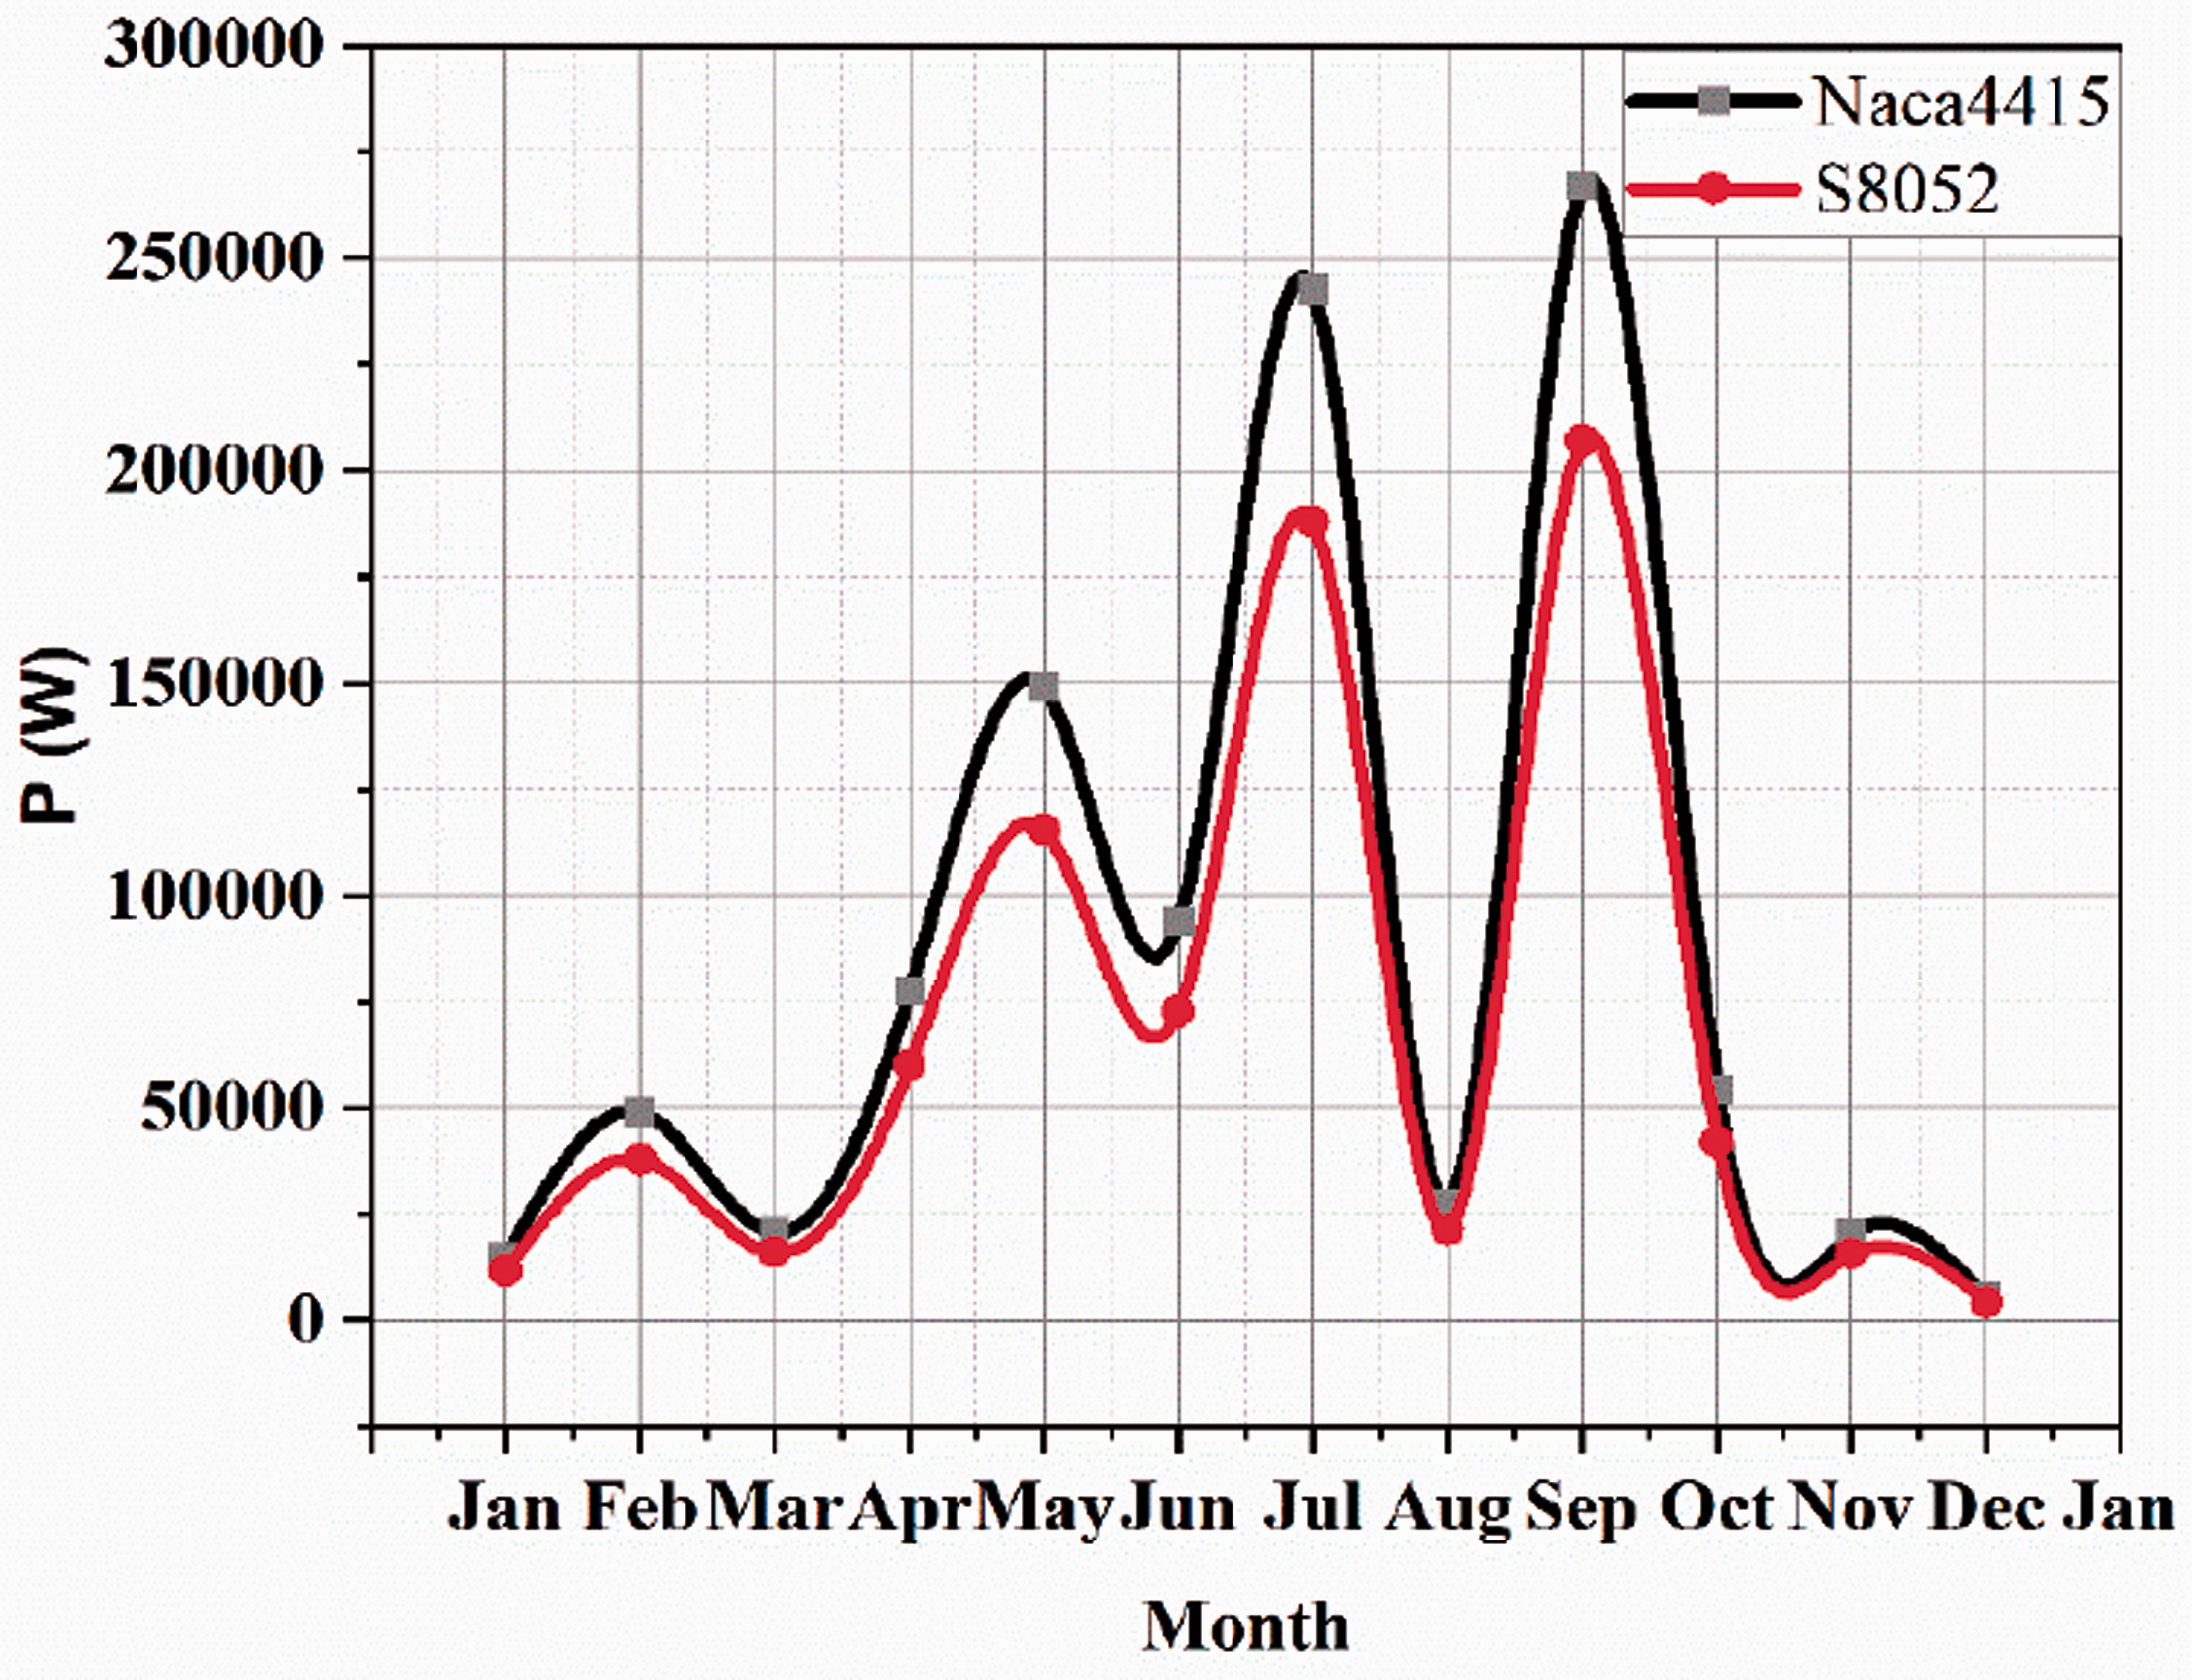
Mean available power per month for both rotor profile.
Conclusion
Morocco presents a high potential for renewable energies, especially those coming from wind and solar sources. Due to its geographical position, it could have an interesting potential of marine energy. In this work, the availability of marine current energy potential was assessed in the Moroccan Mediterranean coast using results from a numerical model of Copernicus Marine Environment Monitoring Service. A current velocity comparison is made in four different depths 10, 50, 70 and 100 m. the interested maximum velocities are those located in the depth of 10 m of (reach 2.4 m/s) and 50 m (reach 1.5 m/s). The results show that Morocco has an interesting potential of marine current in the studied area. The marine current distribution reaches 2.4 m/s at different depth but the best current distribution is located under 10 m of the depth. Two HKT was designed, with two hydrofoils profile Naca4415 and s8052 adapted to the studied area potential. The Naca4415 rotor has better efficiency (37%) more than s8052 rotor (31%). Both were carefully designed for high efficiency, including blades strength, and hydrodynamic characteristics which allow the turbine to keep the rotor efficiency at different TSR.
Footnotes
Acknowledgements
The authors would like to acknowledge the GREEN ENERGY PARKRESEARCH PLATFORM by IRESEN (Research Institute in Solar Energy and Renewable Energies). The authors would also mention the contribution of Miss. Salima SARIKH in revising this paper.
Declaration of conflicting interests
The author(s) declared no potential conflicts of interest with respect to the research, authorship, and/or publication of this article.
Funding
The author(s) received no financial support for the research, authorship, and/or publication of this article.