
Abstract
The Jurassic coal fields in western China are characterized by thick coal seams and weak overburden. The height of an interconnected fracture zone (HIFZ) is often abnormally high for fracture zones produced by coal seam mining. In this paper, HIFZ is discussed through theoretical analysis, in-situ investigation, and data fitting with regression analysis. A comparison of two calculation methods in this study indicates the applicability of calculating HIFZ by the first method, based on the mechanical relationships among fractured rock strata, i.e., (i) the flexural and breaking limit conditions of roof rock mass, (ii) influence of rock fragmentation and bulking, and (iii) thickness of excavated coal seam. In the second method, an analytical formula of HIFZ is obtained by a fitting regression analysis on the measured data of coal mines under similar geo-mining conditions. For the HIFZ in working face 103 of the Zhuanlongwan coal mine, the two calculation methods yield values of 109.74 m and 92.91 ∼ 114.57 m, respectively. The measured value is 107.67 m, obtained using the method of drilling double-end sealing and water leakage measurement. The results of both theoretical calculations are mostly consistent with the measured value, which verifies the effectiveness of the two prediction methods.
Keywords
Introduction
Recently, the developing characteristics of an interconnected fracture zone have been extensively investigated (Duboeuf et al., 2017; Huang et al., 2018; Ma et al., 2020; Ning et al., 2019; Raziperchikolaee and Miller, 2015). The property and combination type of overburden, coal seam-mining thickness, width of extraction, and advancing speed are known to substantially impact the height of an interconnected fracture zone (HIFZ). Theoretical research has indicated that the technical parameters of an interconnected fracture zone play a significant role in water-conservation coal mining (Jiao et al., 2018; Wang et al., 2017; Yin et al., 2019). In addition, various new techniques have been proposed for predicting the overburden failure zone, such as similar-material physical simulation and computer-based numerical simulation (Djamel et al., 2019; Huang and Wu, 2018; Yogendra and Gaurang, 2019), microseismic monitoring (Hill and Mauger, 2016; Tan et al., 2013; Yu et al., 2017), electromagnetic wave and resistivity chromatography (Li et al., 2019; Onyebueke et al., 2018), and the key stratum theory (Hu et al., 2019; Ju and Xu, 2013; Wu et al., 2014). All these methods have been analyzed qualitatively or quantitatively based on the simulation data and in-situ studies (Du and Gao, 2017; Guo et al., 2012; Liu et al., 2015; Miao et al., 2011).
HIFZ is a key factor in preventing water inrush from the roof of a mine, and its maximum value is commonly determined using an empirical formula, a simulation analysis, or a field measurement (Weng et al., 2016; Zhang et al., 2013). Currently, direct monitoring is the most effective method for this purpose. However, this method cannot be used as a conventional means because it requires designing several boreholes due to the interconnected fracture zone exhibits different forms (Liu et al., 2018; Wei et al., 2017); moreover, it is difficult to predict the fracture initiation, expansion, and penetration due to the large differences in geological conditions among sites (Erarslan, 2016; Wen et al., 2014; Yang et al., 2014). Thus, the results obtained from theoretical formula prediction and numerical simulation analysis are generally quite different from those obtained through in-situ investigations.
The unique characteristics of coal seams in Jurassic coal fields in western China indicate that the overburden rocks have often collapsed into the gob space (Wang, 2013). However, few systematic studies have been conducted on the developing characteristics of the fractured zone under such particular circumstances, and no consensus has yet been reached on HIFZ prediction. Hence, quantitative research on HIFZ has practical significance.
The Jurassic coal mines in western China occur under suitable conditions. The width of the coal mining face is generally large. Owing to the different extraction heights of coal seams, there are obvious differences in HIFZ among mines. Therefore, this paper first discusses HIFZ on the basis of the following three factors: extraction height, coefficient of rock fragmentation and bulking, and flexural and breaking limit conditions of rock mass. Then, an analytical formula for HIFZ under similar geological and mining conditions is derived by conducting a fitting regression analysis. Finally, the two prediction methods are validated through in-situ investigation.
Geo-mining conditions of the study area
The study area is located at the Zhuanlongwan coal mine in Ordos, Inner Mongolia, western China (Figure 1). The structure and stratigraphy of the mining area are simple and stable. The coal seam in the study area belongs to the Middle Jurassic Yanan Formation, and yields an average thickness of 8.75 m and depth of 197.34 ∼ 246.97 m. The lithology is mainly composed of sandstone, siltstone, and small particles of mudstone (Figure 2). Such rocks are characterized by loose cementation, low strength (generally below 30 MPa), suitable brittleness, and easy disintegration in contact with water. The Quaternary and bedrock aquifers are rich in water with a complex hydrogeological structure.
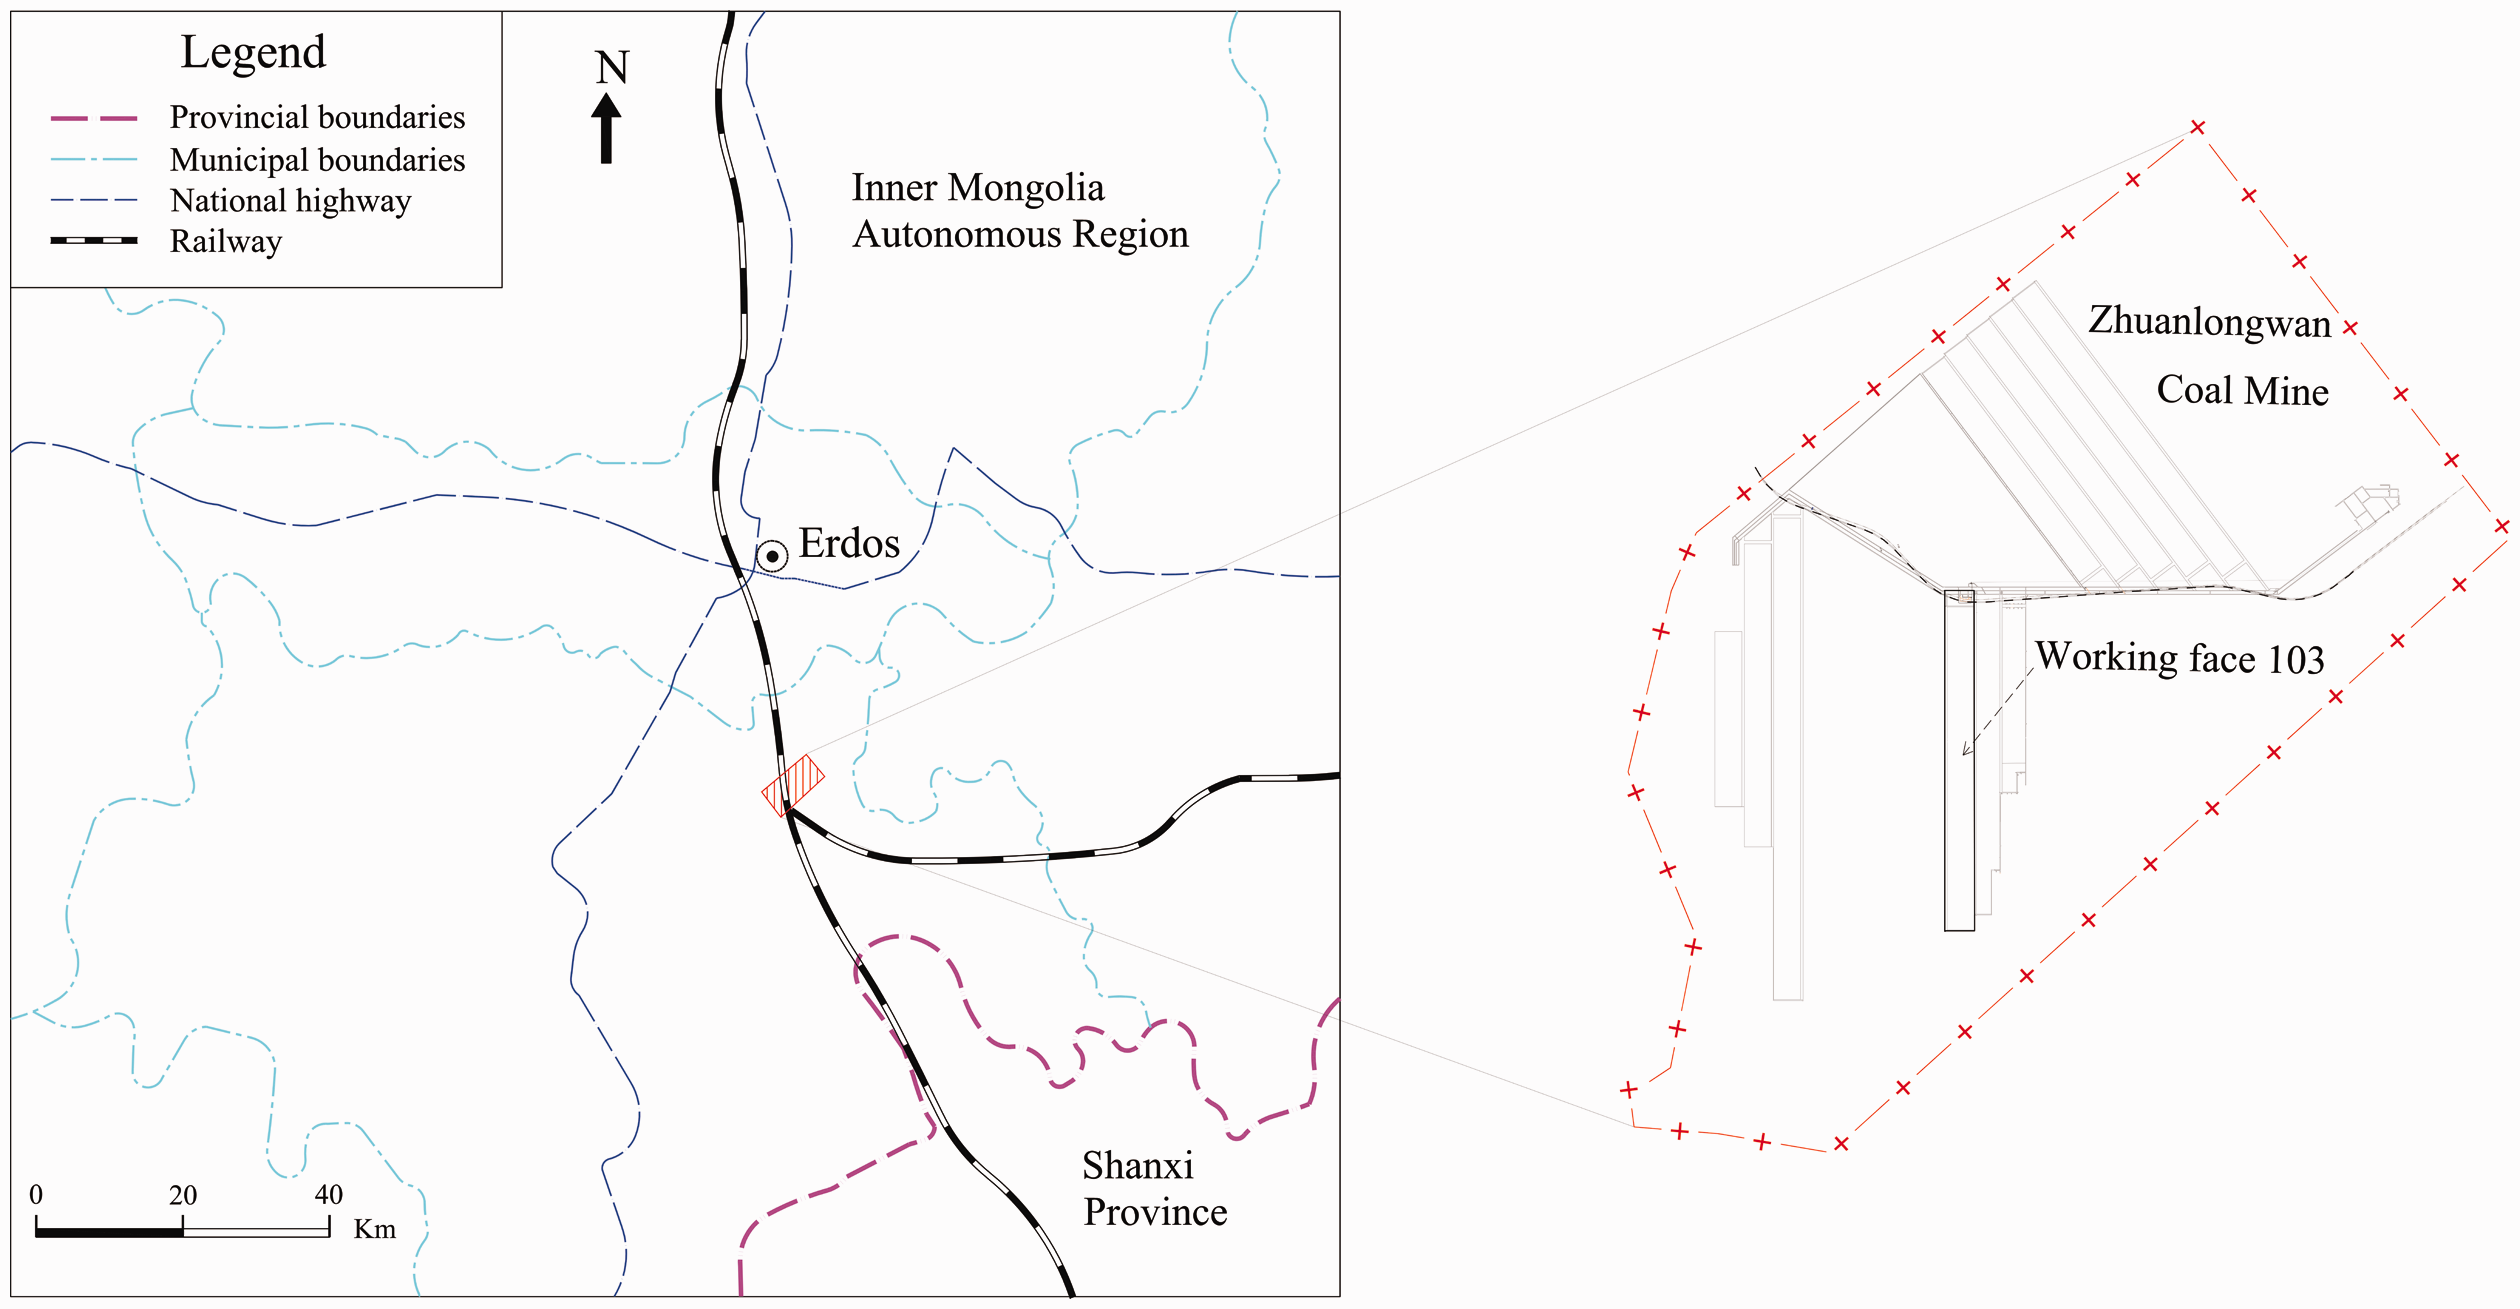
Plan view of the study area.
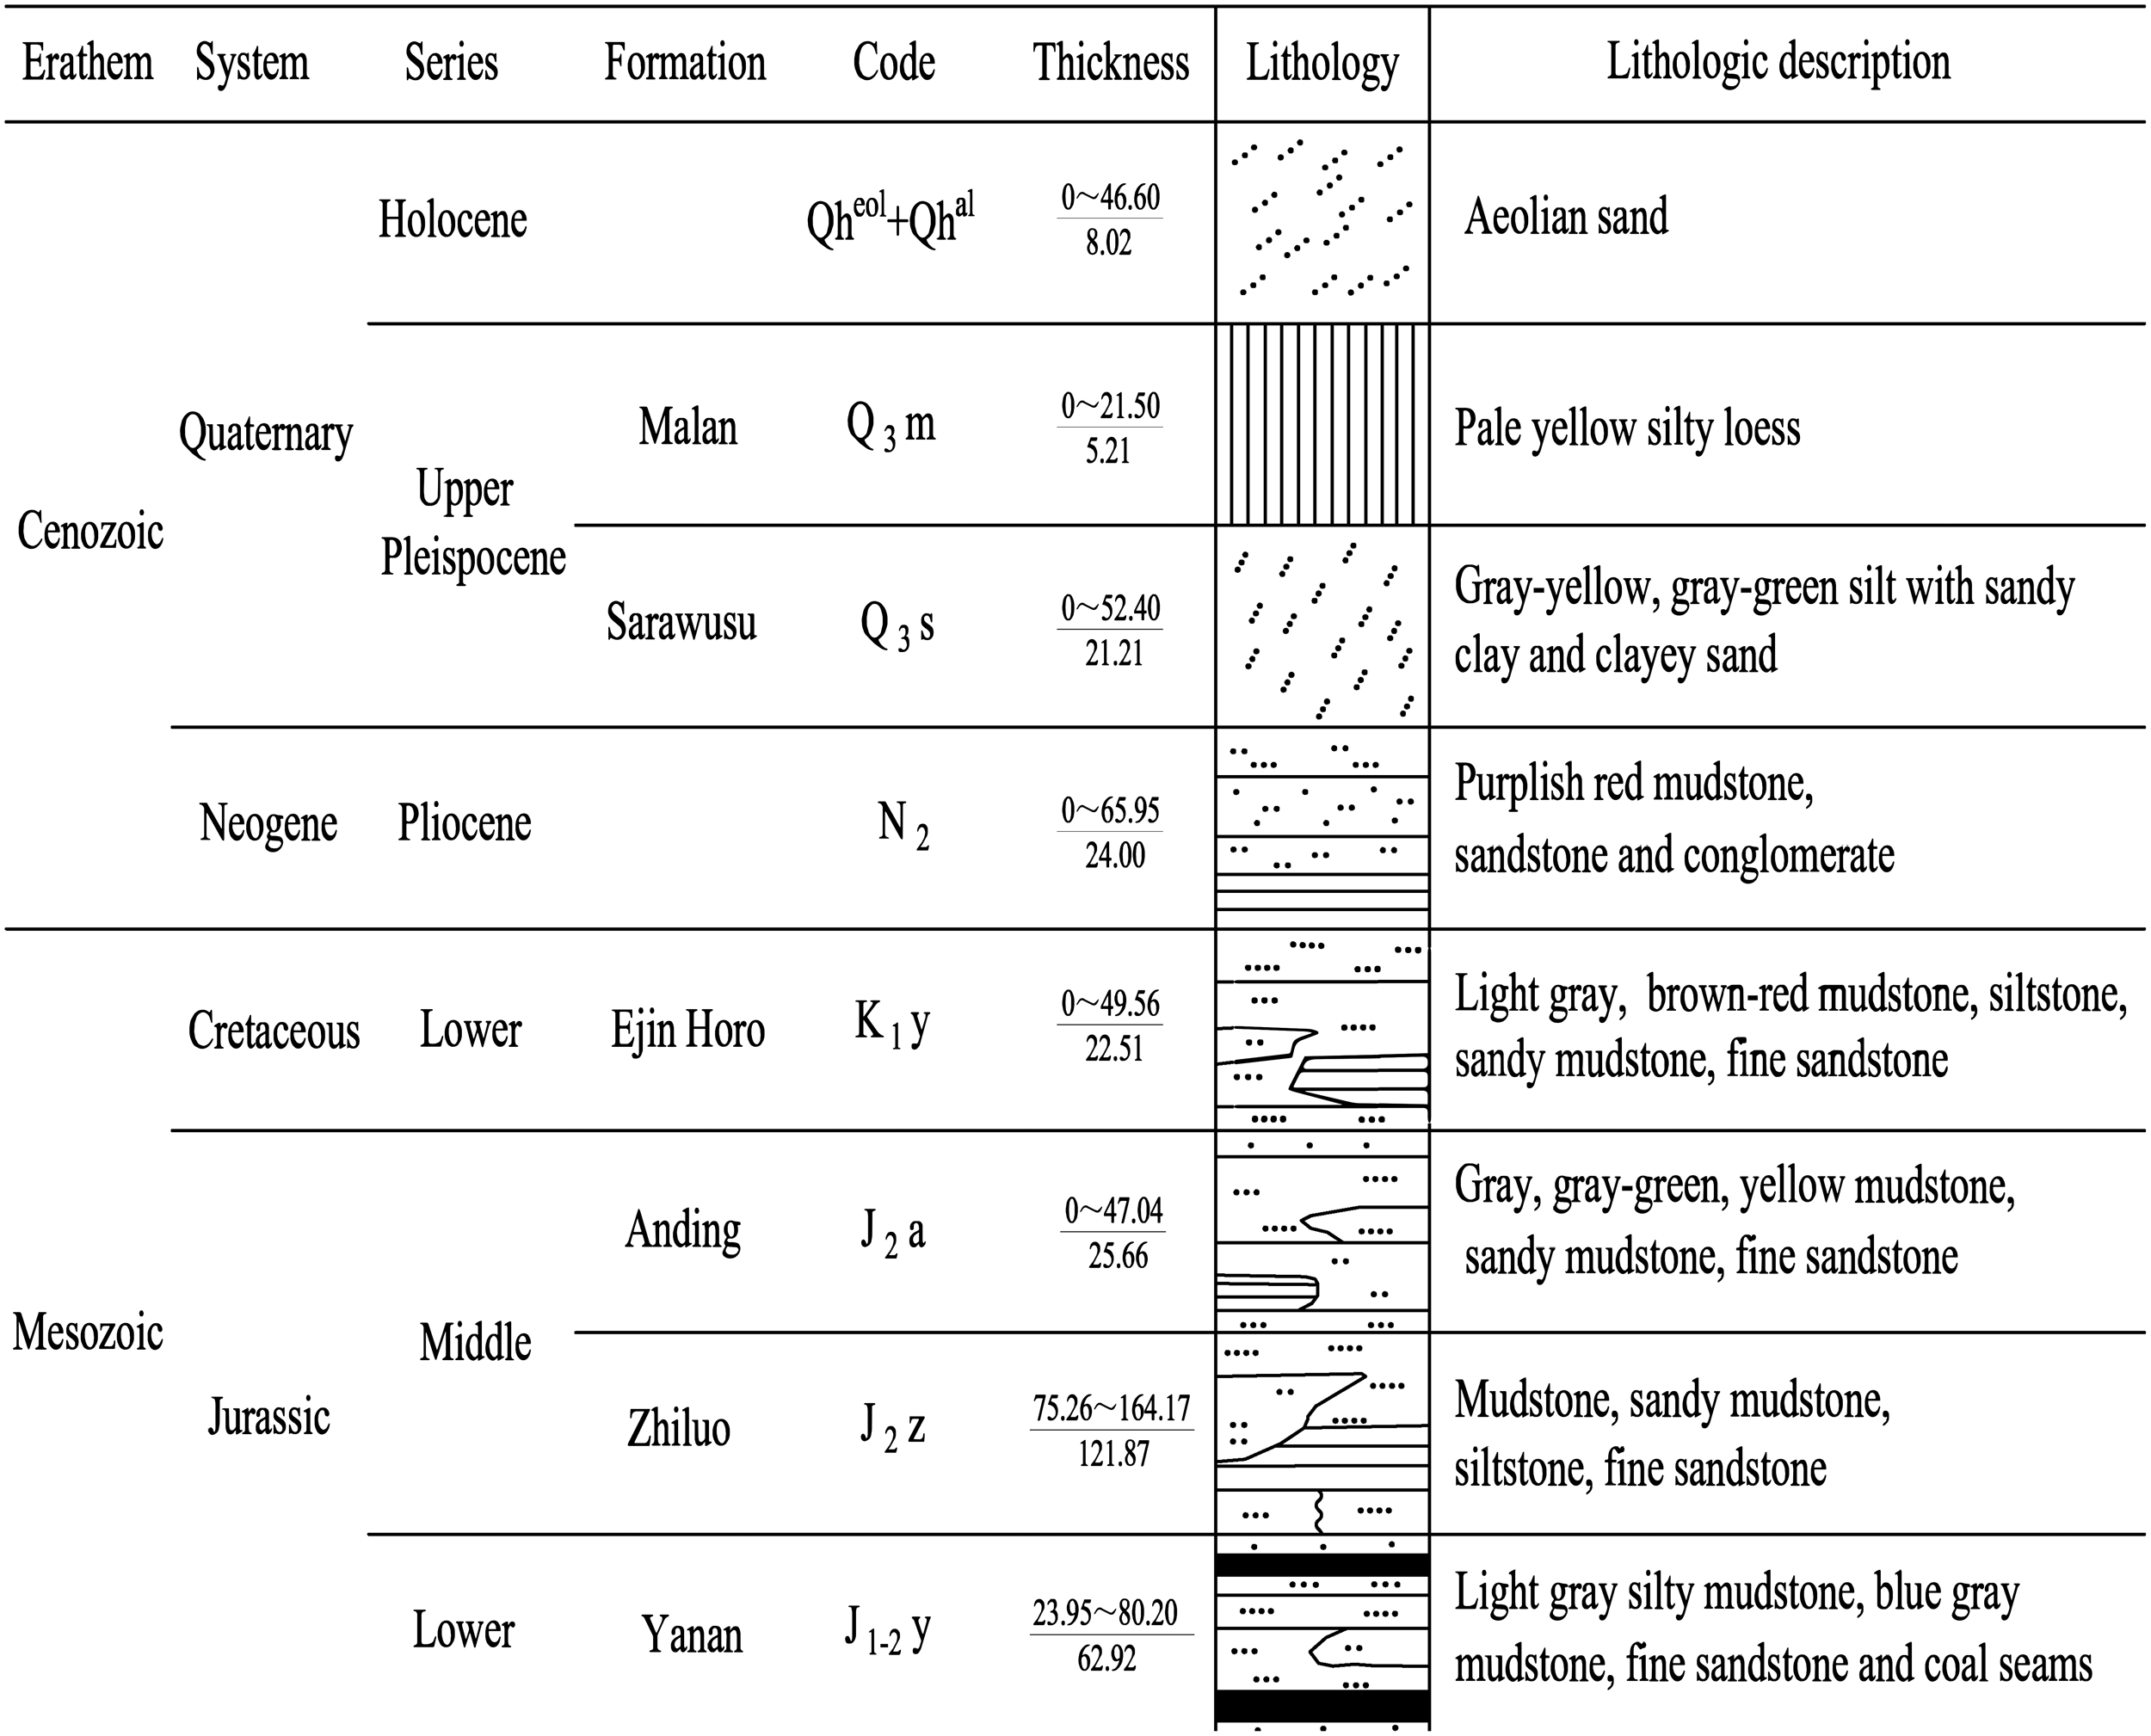
Stratigraphic lithology of the study area.
The mining method with a large mining height is adopted in working face 103, which has extraction height and width of 5.5 and 300 m, respectively. This mining method can easily result in an abnormally high HIFZ, causing the Quaternary water and sand to burst into the gob, thus posing a serious threat to the safety of the mine and ecological environment.
Method 1: Calculation of HIFZ based on the rock mechanical relationships
The initial effective gob space of the study area is enormous, owing to the mining method with a large mining height. In addition, factors such as weak overburden, well-developed cracks, and fast roof caved can lead to a high coefficient of rock fragmentation and bulking.
Establishing equilibrium for critical bending failure of the roof
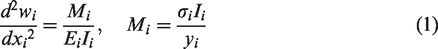
Before the stratum breaks, it undergoes a bending process until the subsidence reaches its critical breaking and flexural deformation. Equation (1) is established for subsidence of the roof stratum before its breakage, where the abscissa axis indicates the top boundary of the stratum and the longitudinal coordinate axis indicates its vertical direction. The material mechanics proposed by Liu (2004) indicate that
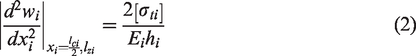
In general, the breakage of the upper stratum in the gob depends on not only the ultimate breaking strength of the roof rock mass but also the effective gob space. Although the bearing capacity of the stratified roof is large, it may still lead to a relatively small equivalent bearing capacity in the case of limited gob space. In this case, the critical deflection deformation during the roof collapse is considered as the standard, and the equilibrium equation of the critical breakage of the roof is obtained:
Determination of the initial and periodic breaking step distance of the basic roof
Initial breaking step distance of the basic roof
As the working face advances, the immediate roof caves irregularly and falls into the gob. The basic roof is embedded at both ends before breaking, which can be regarded as a “two-end fixed-supported beam” structure. The mechanical model is shown in Figure 3, where q is the uniform load of the roof overburden (MPa), L0 is the ultimate span of the roof primary breakage (m), PT is the impedance force of support provided to the roof (MPa), M is the mining height (m), h is the caving zone height (m), H1 is the thickness of the rock beam under basic roof (m), and H2 is the thickness of the follow-up rock beam (m).
Mechanical model of the initial fracture of the basic roof.
The precondition of rock beam movement is to crack at the end of the rock mass, i.e., the actual tensile stress (σA) of the rock beam must be achieved at the maximum tensile strength of the beam support ([σt]): [σA]max = [σt]. When the working face is mined to the limit length (L0) of the overhanging rock beam, the stress condition of the initial fracture of the rock beam can be expressed as follows:

Here, σA is the actual tensile stress at the end of the rock beam (MPa). [σt] is the maximum allowable tensile stress of the supporting layer, whose value is equal to the unidirectional tensile strength of the rock (MPa). MA and WA are the bending moment and section modulus at the beam end, respectively. q is the gravity vertical component of the beam per unit length (MPa), and γ is the corresponding rock bulk density (kN/m3).
According to the analysis result of the fractured rock structure, when the adjacent rock strata constitute different rock beams and move separately, i.e., H2 = 0, the limit step of the primary fracture of a single rock beam can be deduced from equation (3). The result can be expressed as follows:

Periodic breaking step distance of the basic roof
After the application of initial pressure to the basic roof, the rock beam structure becomes a simply supported beam structure and deforms into the gob, with the working face continuously moving forward and reaching the ultimate stress and breaking. The mechanical structural model, shown in Figure 4, comprises a broken rock beam C1 and rock beam C2, which can be regarded as a cantilever beam structure. Using the analyzed stress state of the two rock beams, the breaking step distance of C2, namely the basic roof period fracture step distance, can be calculated.
Mechanical structural model of the periodic fracture of the basic roof.
Next, the mechanical state of C1 is analyzed, using the following structural forces.
The weight of the rock beam itself (G1): Pushing stress (P) of C2 to C1. Friction force (F) of C1 at the hinge point O:
Through the stress analysis of C1, the following equilibrium condition is obtained:

The precondition of breaking and instability of C2 is that the rock beam should be cracked at the end point B. Analyzing the stress condition of C2, the bending moment at point B (MB) is obtained as follows:

At this point, the actual tensile stress of beam C2 can be expressed as follows:

The mechanical conditions of rock beam fracture, combined with equations (3) and (5) to (7), are used to derive the tensile stress of C2, as follows:
Calculating the length of C2, l2, and discarding the negative value, we obtain
By extending the expression of l2, the periodic fracture step of the rock beam can be expressed as follows:
Analysis of equivalent load of critical breaking of the roof
In the early stage of gob formation, the allowable settlement space is larger than the limit bending of the roof stratum structure instability. At this time, the critical breakage load of the roof is the actual load of the overlying rock and the bearing capacity of this layer is the equivalent load of the overburden. The overlying rock layer undergoes continuous breaking and falls into the gob, until a certain rock layer is only bent and deformed without breaking. At this time, the collapse process of the overlying rock ends. The flexural equation of the initial failure of the roof with a simply supported structure under equivalent load, investigated by Liu et al. (2008), can be expressed as

Combining equations (2) and (10), the equivalent load of the roof of a simply supported structure, when it first breaks, can be solved:
Similarly, the equivalent loads of the initial and periodic breaking of the roof strata with a fixed-supported structure are solved, as follows:
Solving the fracture height of overburden
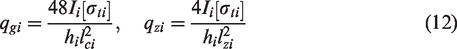
Liu (2004) studied the maximum bending deformation of the roof (wci) of a simply supported structure under the equivalent load of an overlying rock (qci):
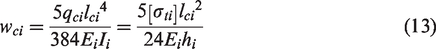
The maximum flexural deformation (wgi) of the roof of layer i of a fixed-supported structure when initial breaking occurs under equivalent load (qgi) and that (wzi) when periodic breaking occurs under equivalent load (qzi) are expressed as follows:
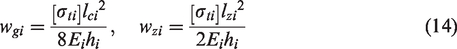
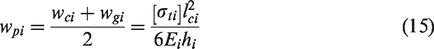
Considering the complex boundary conditions of the coal seam roof, the critical flexural deformation (wpi) of the roof of a single layered rock when it is first broken is regarded as the mean value of the flexural deformation of the roof under two boundary conditions of a simply supported structure and fixed-supported structure:
Combining the above research results with the bulking factor of the broken rock mass, the following relationship between wpi and wzi is obtained:
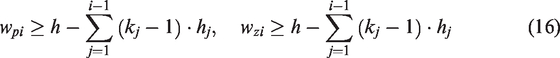
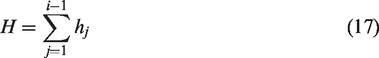
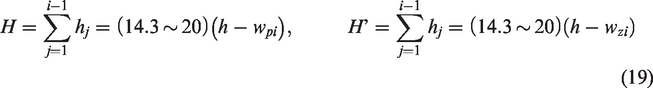
Equations (14) and (15) are used to calculate the maximum flexural deformation of the initial and periodic fractures of each layer from bottom to top of the overburden in the upper stratum of the gob. Until the calculated value satisfies equation (16), the stratification of the overlying rock will not crack. At this point, the roof fracture height (H) is the sum of thicknesses of the lower fracture rock layers:
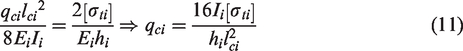
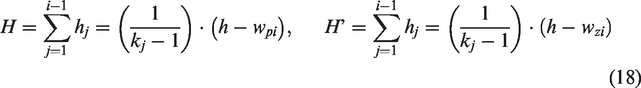
Combining equations (16) and (17), the analytical formula of HIFZ can be obtained as follows:
Through the solution of the critical fracture deflection–deformation amount and the determination of the fracture height of the overburden roof, the factors that affect the HIFZ calculation mainly include the coal seam mining height (h), coefficient of rock fragmentation and bulking (k), and limit deflection–deformation amount of the roof rock mass (wpi, wzi).
Determination of the coefficient of rock fragmentation and bulking by physical simulation
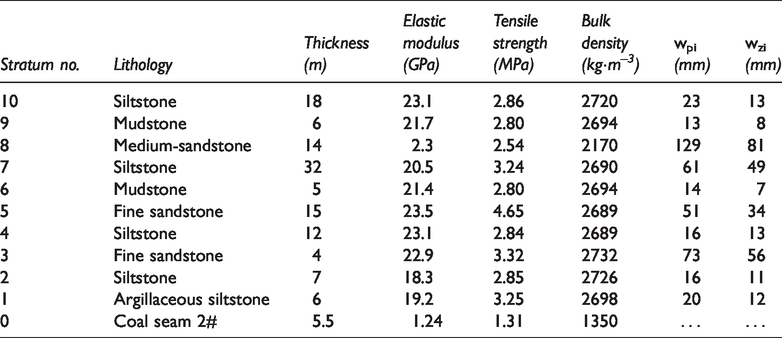
In this study, the overlying bedrock of the mine was stratified, and lithology data were obtained from borehole ZK6331 located in working face 103. For facilitating the modeling, similar strata were combined in the stratification process and the thickness of each layer was taken as an integer. Numbering the upper strata of the gob from bottom to top.
Combining equations (4), (9), (14), and (15), the flexural deformation of the initial and periodic rupture of each layer of the roof was solved. Table 1 shows the physical and mechanical parameters and corresponding flexural deformation.
Parameters of physical and mechanical and the critical flexural deformation amount.
According to the experimental and geo-mining conditions of working face 103, the constant of geometric similarity was 1:200. The length, width, and height of the model were 2000, 200, and 1600 mm, respectively. Sand was used as the aggregate, gypsum and calcium carbonate were used as the binger, and mica was used as the stratified material. The simulated total thickness of stratum, coal seam floor and coal seam thickness were 1600, 160, and 60 mm, respectively. Given the actual mining conditions, the excavation thickness of the coal seam, advancing length, and length of the coal pillars on both sides were 27.5, 1600, and 150 mm, respectively.
Horizontal fractures began to form in the overburden strata after the simulated excavation advanced by 100 mm. By the time the working face advanced by 300 mm, the basic roof caved in and appeared after the application of initial pressure. Before the working face was fully mined, the overlying rock broke and collapsed, and the caving angle of the working face and vertical displacement of the ground gradually increased. Until the working face reached 800 mm, the caving angle and vertical displacement no longer changed. The caving angle became stable at 55°. The vertical displacement of the ground was 2.2 mm, and the maximum subsidence position occurred at the center of the gob space. These results are consistent with those obtained through the on-site investigation.
The development of separation fissure during the process of overburden collapse evolution is shown in Figure 5 where the black arrows are marked in the model to visually reflect the height of the separated fracture. The height of the separation fracture was measured as 25.7 ∼ 26.2 mm. The extraction height was measured as 27.5 mm. Therefore, the fragmentation and bulking coefficient of the overlying rock ranged from 1.05 to 1.07.
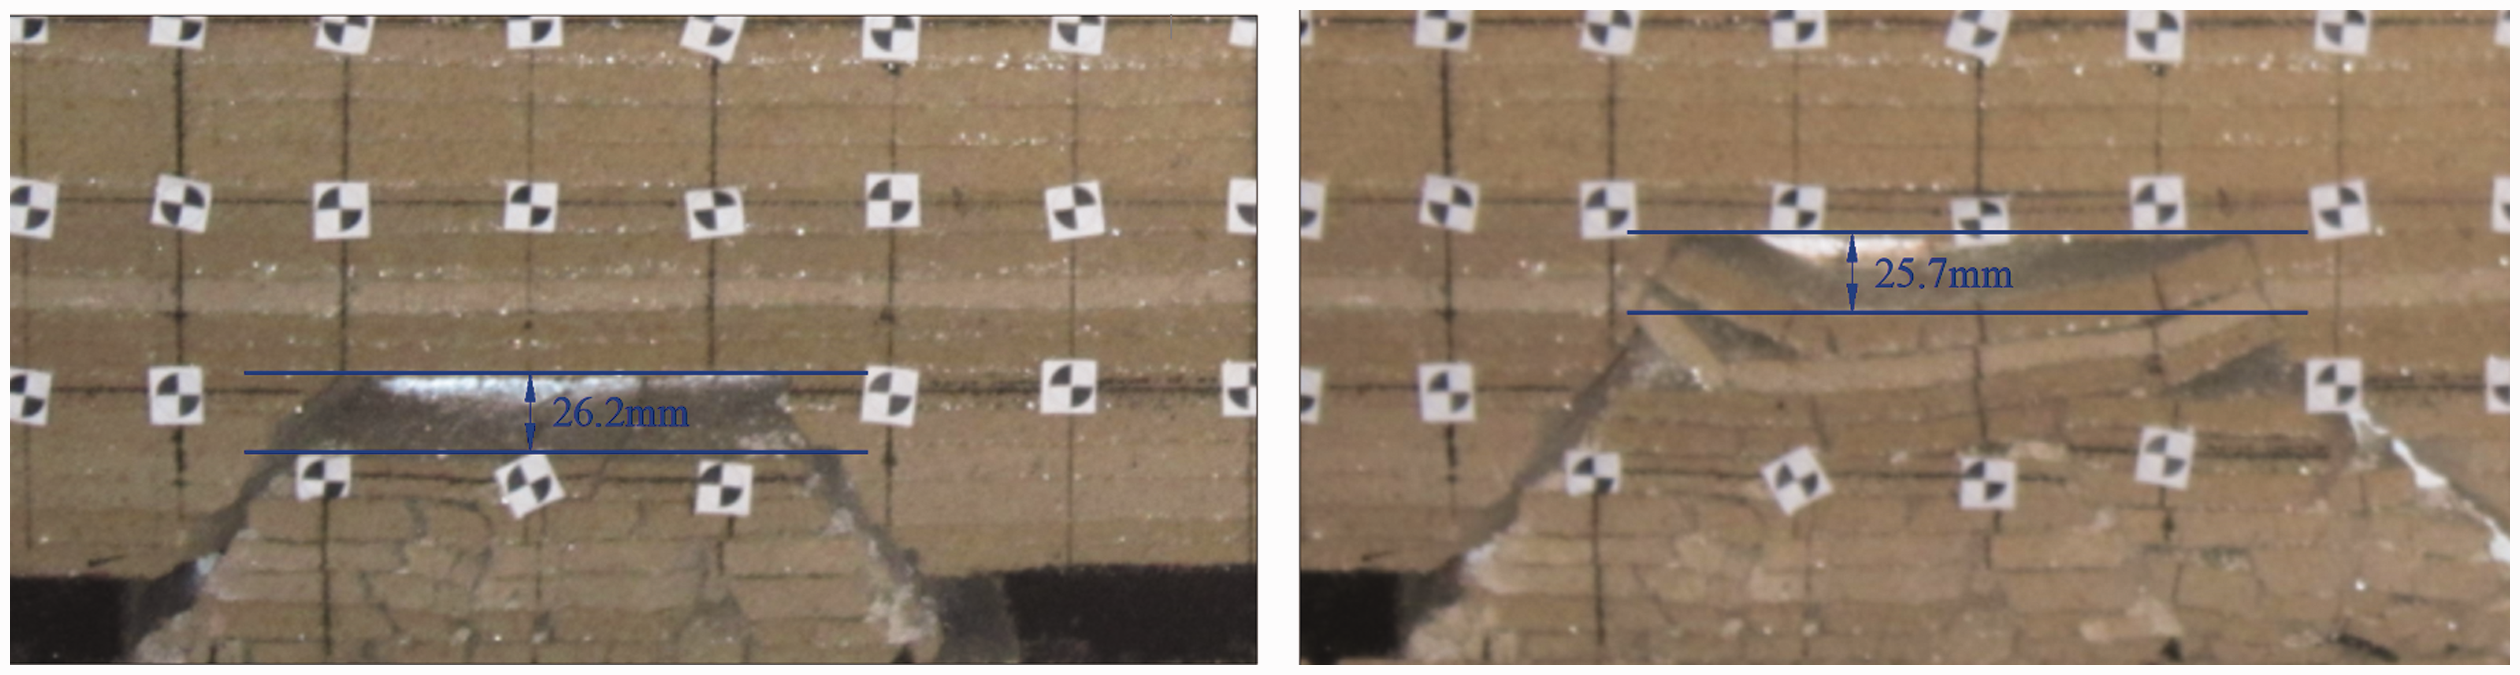
The development of minimum and maximum heights of separation fissures.
Calculation of HIFZ in the study area
Substituting the coefficient of rock fragmentation and bulking into equation (18), the HIFZ prediction formula for the study area can be obtained as
The mining height of the working face 103 used in the study area was 5.5 m. Combining the deflection deformation of the initial and periodic fractures of the strata, as shown in Table 1, the determining standard of HIFZ in the mine was obtained, as shown in Table 2.
Determination the HIFZ of the study area.
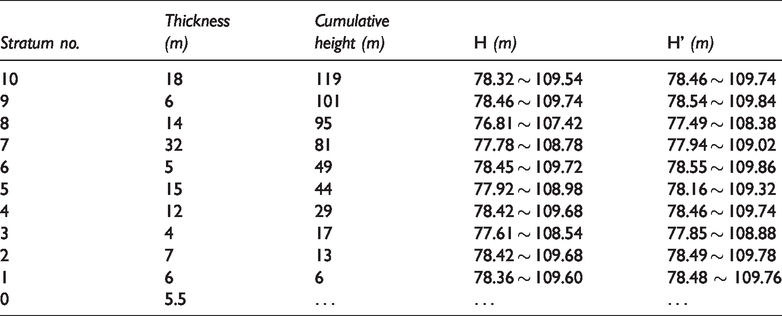
According to the calculation data shown in Table 2, the maximum value of HIFZ was 109 m. The calculated value of stratum no. 10 in the siltstone strata was lower (109.74 m) than the cumulative thickness of the stratum (119 m). It was concluded that the critical deflection deformation in the stratification is larger than the allowable subsidence in the space, and that the strata will not break. Therefore, based on the mechanical relationship of the fractured strata, considering the ultimate deflection of the roof and fragmentation of the fractured strata, the maximum value of HIFZ in the study area was calculated as 109.74 m.
Note that the prediction formula (18) can be obtained using the bending and failure limit conditions of the rock mass, which are characterized by thick coal seams and low-strength weakly cemented overburden in the western mining area. However, this formula is yet to be validated for massive or strong overlying strata. Hence, it is not applicable to the prediction of HIFZ of mines under such conditions.
Method 2: Estimating HIFZ by data fitting and regression analysis
Many factors significantly impact HIFZ, including the extraction height, mining method, properties of rock, stratigraphic sequence, and mine scheduling. Eleven measured data points of the HIFZ of mines were collected, as shown in Table 3. It can be seen that their geological and mining conditions were similar; however, the extraction heights of the coal seams were clearly different. Thus, the next step is to determine the quantitative relationship between HIFZ and the extraction height.
Statistics of the HIFZ of coal mines with similar geo-mining conditions.
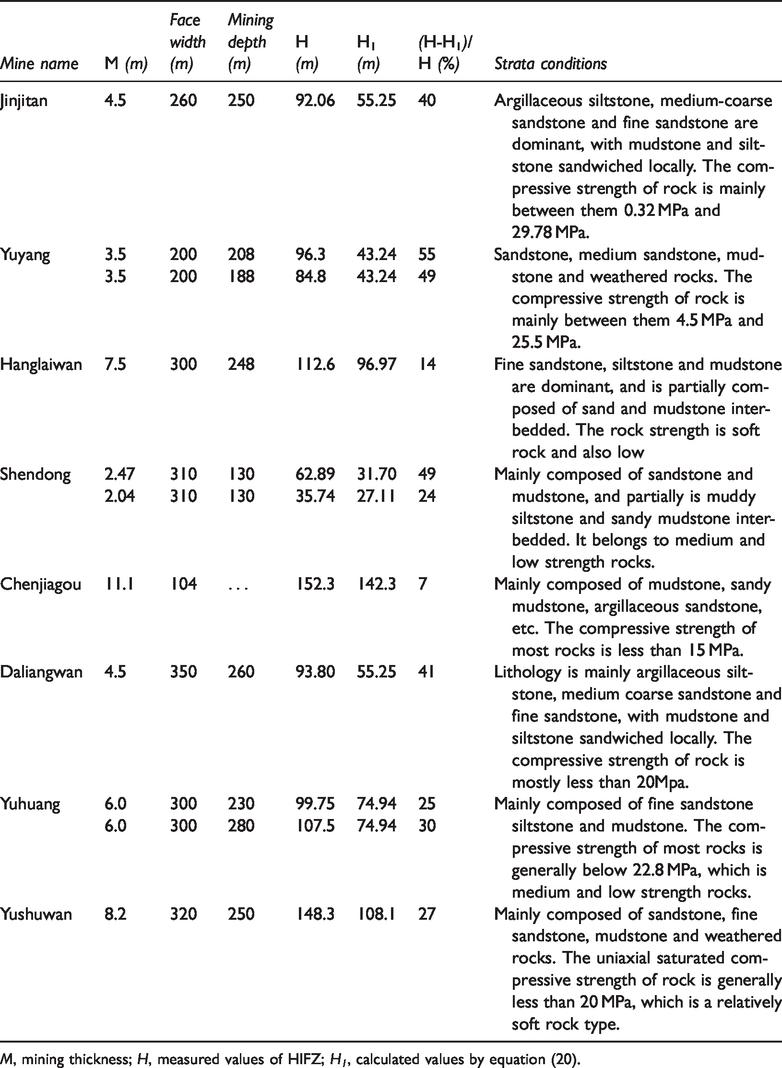
M, mining thickness; H, measured values of HIFZ; H1, calculated values by equation (20).
In general, the HIFZ of medium-weak rock formations can be calculated as

Table 3 shows the HIFZ values calculated by equation (20) in each mine, which are much smaller than the field-measured values. The relative difference is more than 24%, or even 55%.
The empirical formulations are more accurate for HIFZ prediction in the eastern mining area of China. If this is the case, it must be asked why there is such a large error in predicting the Jurassic coal fields in the western mining area. This can be reasonably attributed to the different geological and mining conditions. Most of the coalfields in eastern China, of Carboniferous–Permian age, have an overburden mainly comprising sandstone and mudstone. Layered mining is adopted at the working face, and the extraction width is small. The Jurassic coalfields in western China have weaker rocks with lower compressive strength (<30 MPa), such as siltstone, fine sandstone, and mudstone. Because of the suitable occurrence conditions of coal seams, the working faces are mined by top coal caving or with large mining height, and the extraction width is mostly 200 ∼ 300 m. The above differences result in the empirical formula no longer being applicable to HIFZ prediction in mining areas in western China.
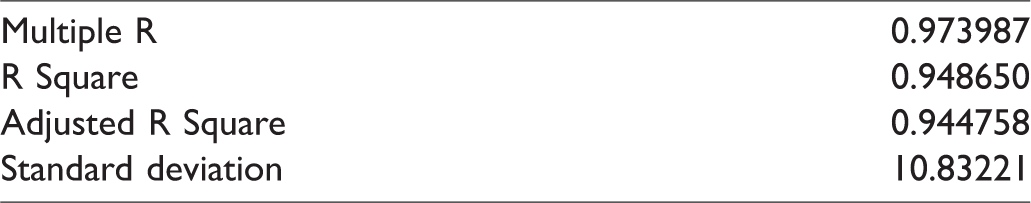
A fit regression analysis on the measured data shown in Table 3 was conducted to obtain the quantitative relationship between HIFZ and coal seam mining thickness, as shown in Figure 6, which is based on a binomial relationship. When the coal seam mining thickness ranged from 2.04 to 11.1 m, the HIFZ (H) value increased with the mining thickness (M). Using regression analysis (Table 4), the standard deviation was calculated as 10.83. Hence, the quantitative relationship between H and M can be expressed as

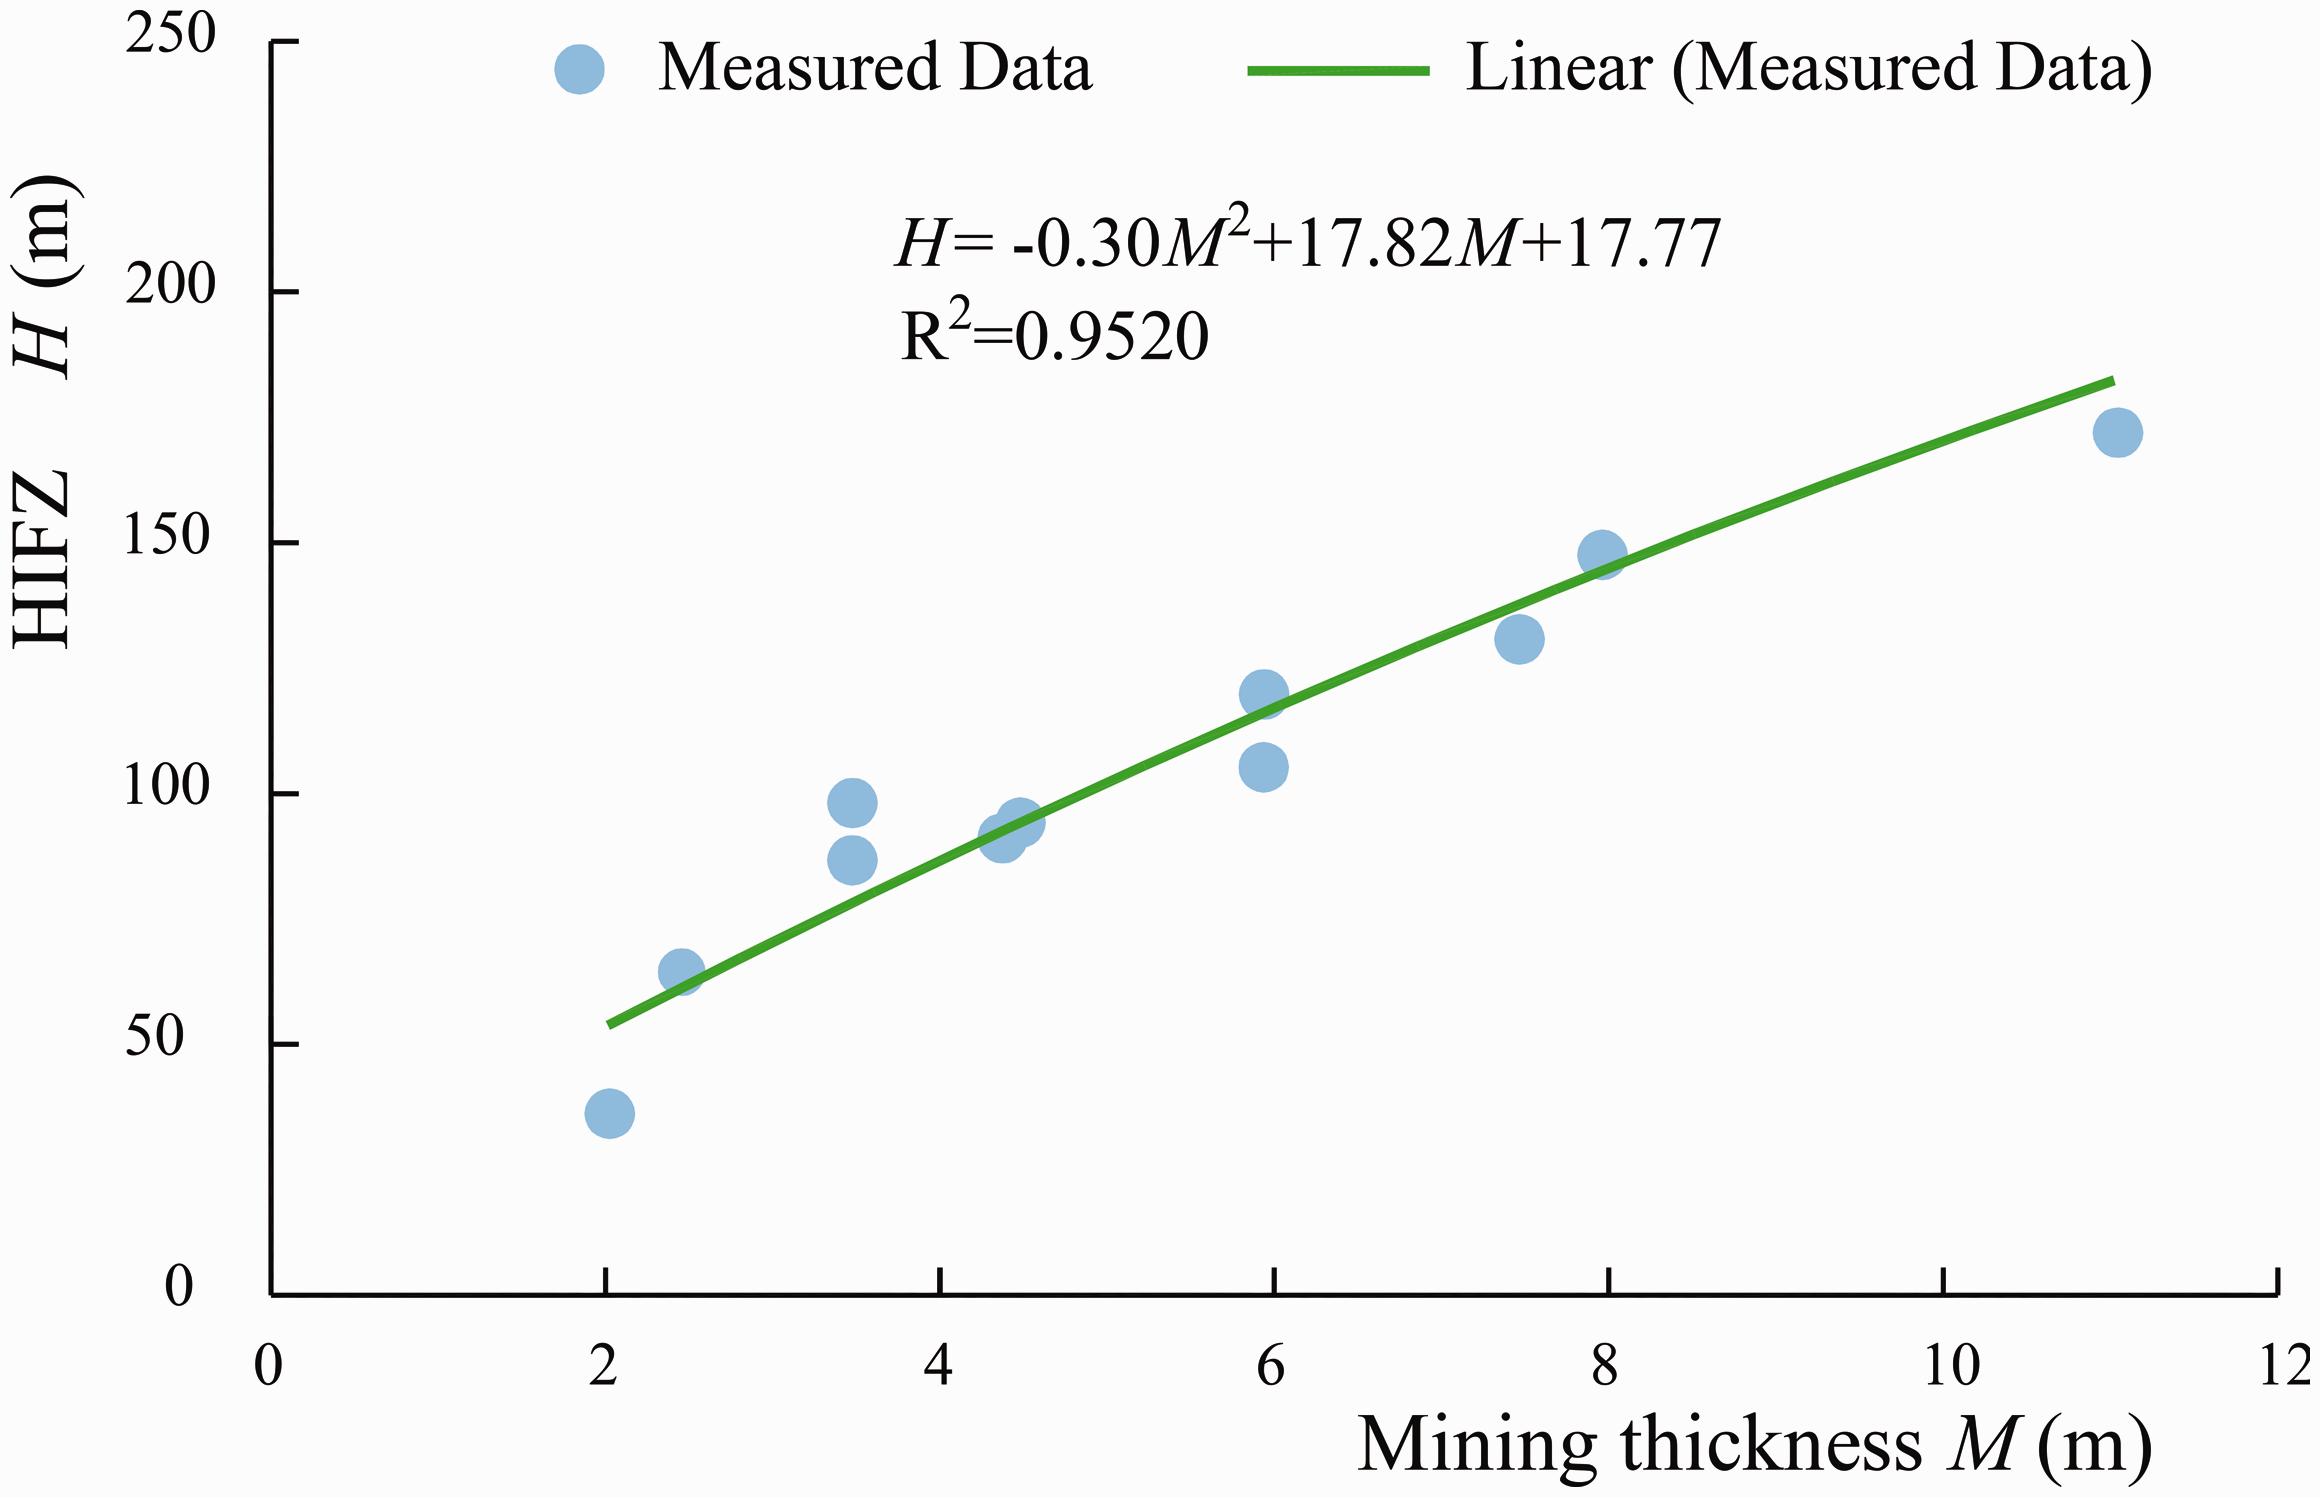
HIFZ (H) versus mining thickness (M).
Data regression analysis.
The mining thickness of working face 103 in the Zhuanlongwan coal mine was calculated as 5.5 m. Using equation (21), the HIFZ was estimated as 92.91 ∼ 114.57 m.
In situ investigation of HIFZ
In general, there are two approaches to field measurements of HIFZ: (i) surface drilling and (ii) underground drilling. Considering the geo-mining conditions in the study area, underground drilling exploration based on the double-end plugging leak detection method was adopted. Here, the drilling was arranged as upward inclined holes, and water was injected into the hole in sections to measure the leakage. The leakage of each section was measured and compared to that of the pre-mining hole. The location where the amount of leakage clearly reduced was determined as the top boundary of the interconnected fracture zone.
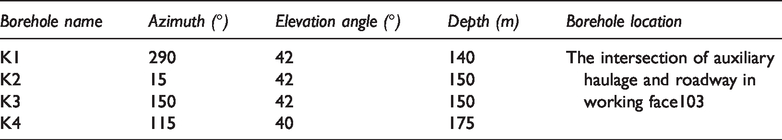
One pre-mining hole (K1) and three post-mining holes (K2, K3, and K4) were arranged in working face 103 of the mine. Table 5 shows the specific parameters of each borehole, and Figure 7 shows their specific layout.
Statistics of borehole parameters.
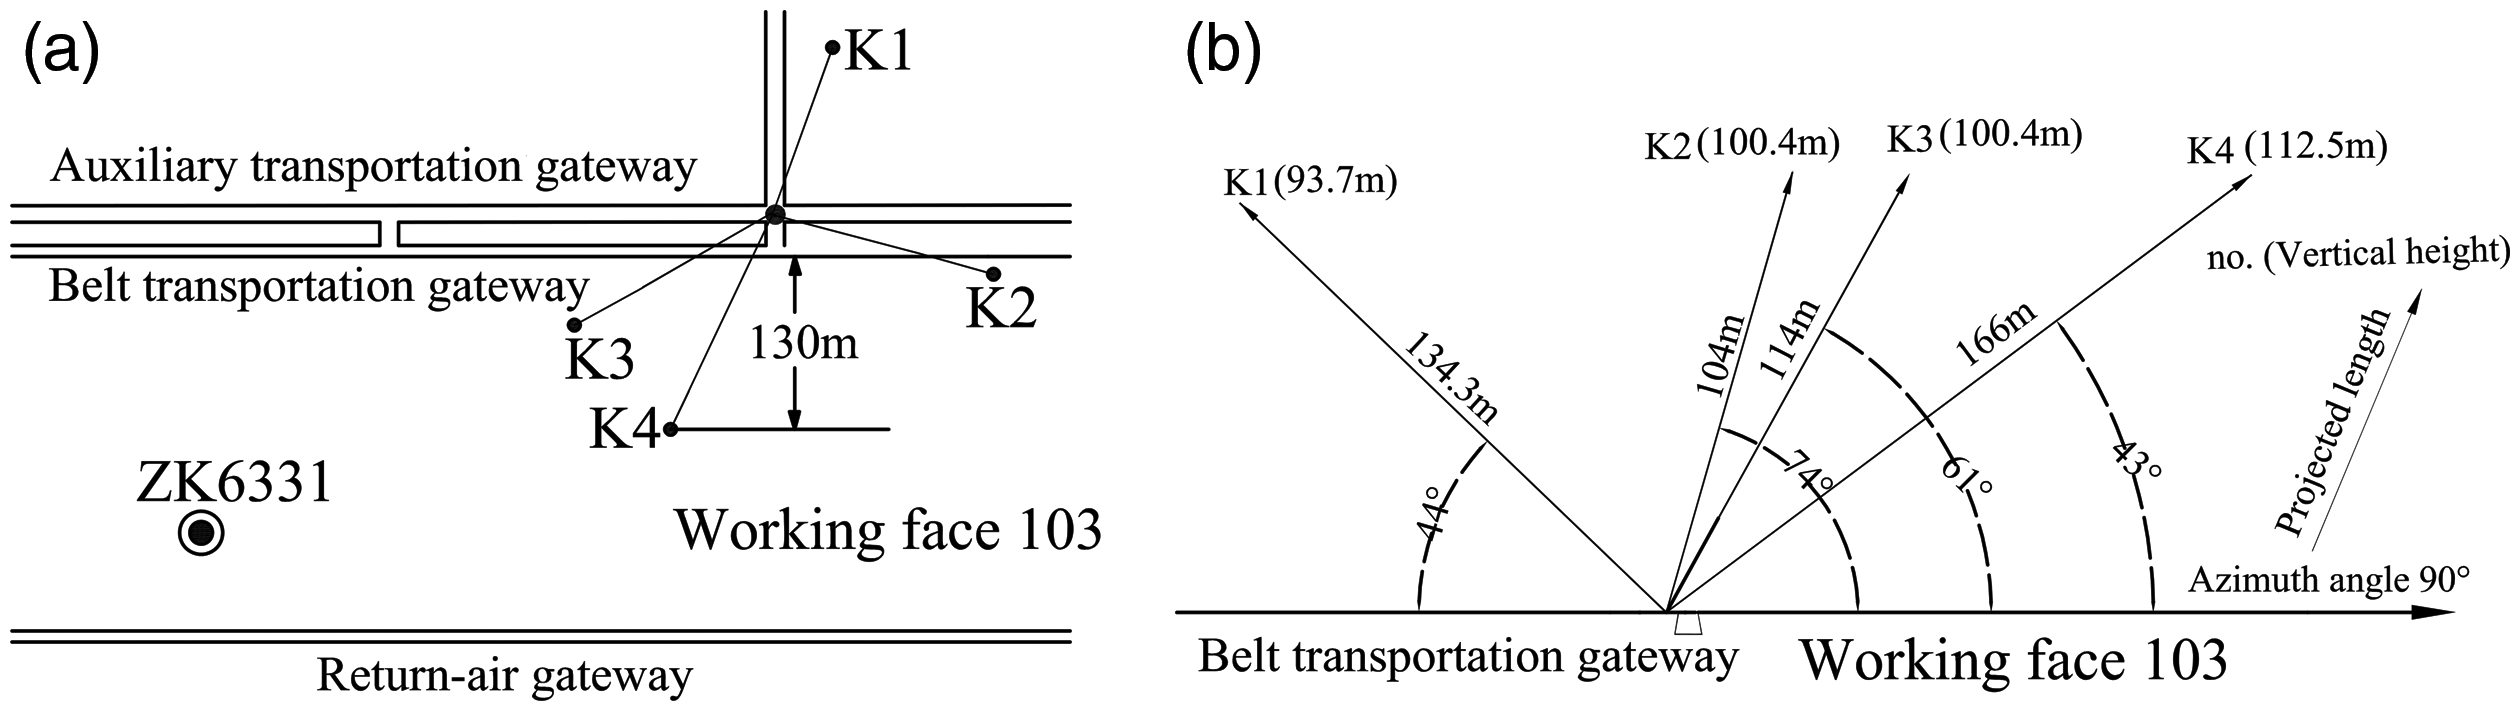
Boreholes layout at working face 103.
The leakage of the drilling fluids varied with the borehole depth, as shown in Figure 8.
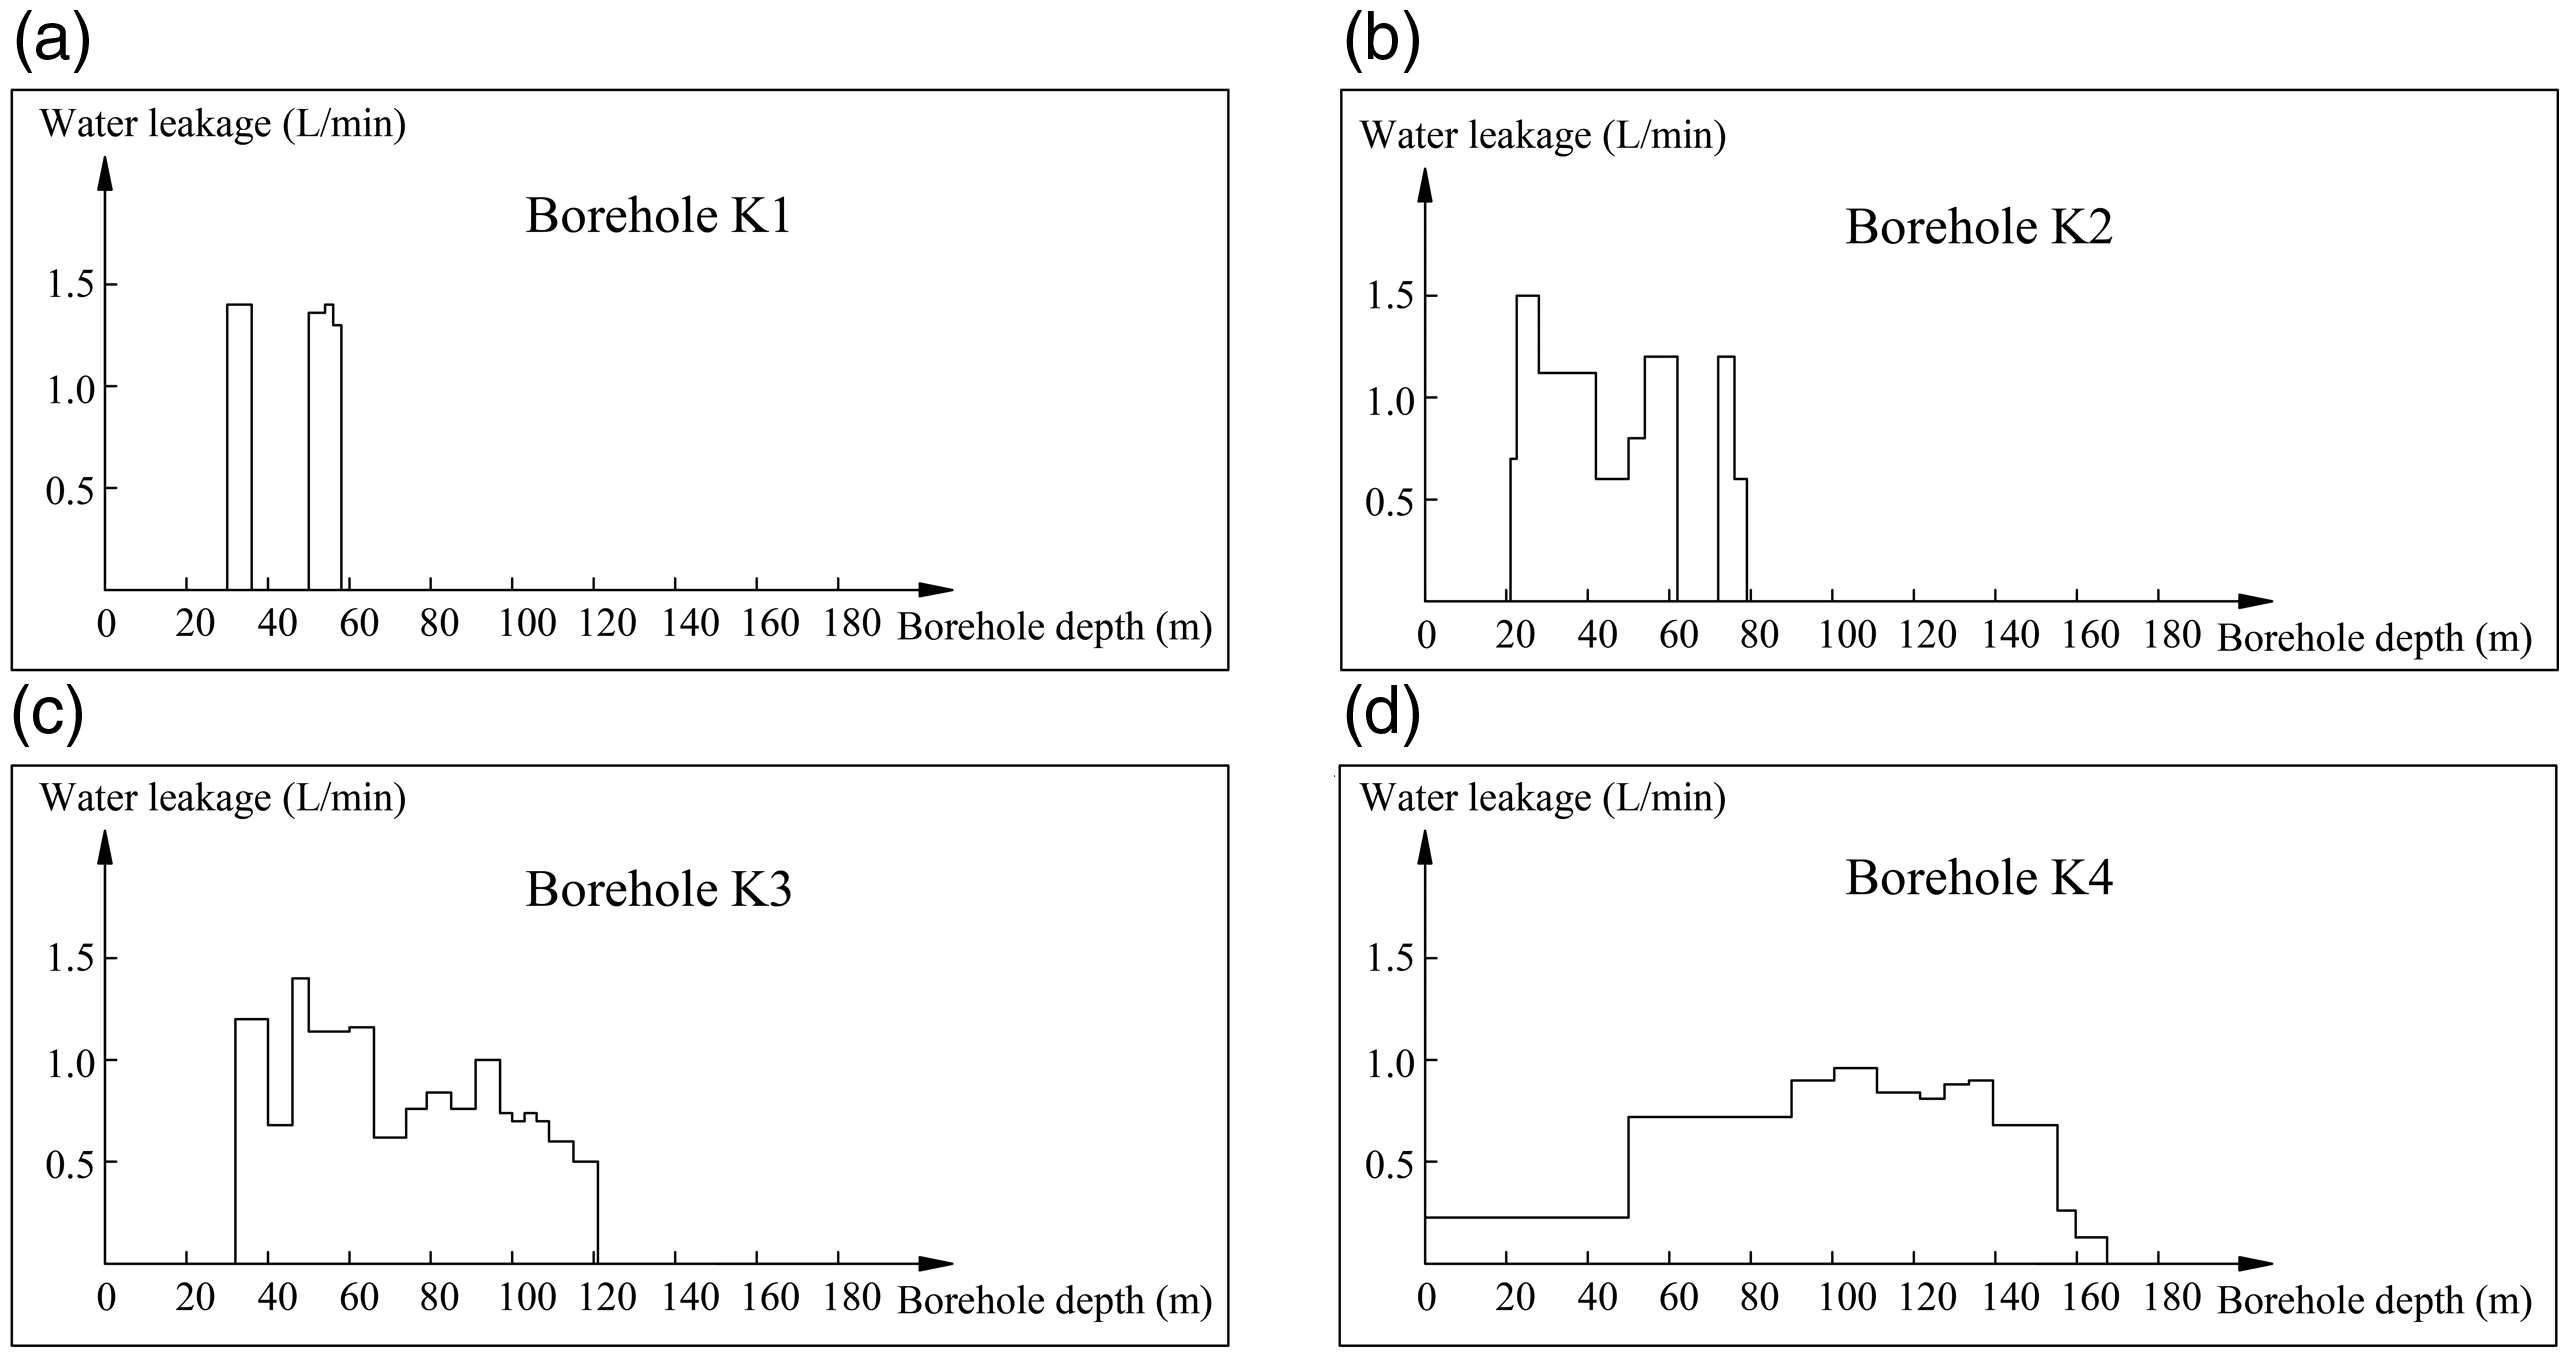
The leakage of drilling fluids varies with the borehole depth in each borehole.
As shown in Figure 8(a), the K1 borehole exhibits leakage of 1.30 ∼ 1.42 L/min at depths of 33 ∼ 38 m and 52 ∼ 59 m. This indicates that the primary fracture of the coal seam roof is not developed, providing necessary comparison conditions for the observation of roof failure depth after mining.
As shown in Figure 8(b), the K2 borehole exhibits no leakage at a depth of 0 ∼ 21.5 m, and a leakage of 0.6 ∼ 1.5 L/min at depths of 22 ∼ 62 and 74 ∼ 79 m. The absence of leakage at depth 62 ∼ 74 m is attributable to the compact cracks. Therefore, the hole depth of 79 m is determined as the top boundary of the interconnected fracture zone.
As shown in Figure 8(c), the K3 borehole leaks in the range of 32 ∼ 121.5 m, with the amount of leakage varying from 0.5 to 1.4 L/min. At a depth of 48.5 ∼ 66 m, the leakage reaches the maximum value, which indicates that the fracture is well developed in this section. Therefore, the top boundary of the interconnected fracture zone is determined at a hole depth of 121.5 m.
As shown in Figure 8(d), the leakage of the K4 borehole at 48.0 ∼ 139.5 m depth is stable in the range 0.63 ∼ 0.96 L/min, while that at 139.5 ∼ 167.5 m depth decreases gradually. Thus, the top boundary of the interconnected fracture zone was determined at 167.5 m hole depth.
Combined with the elevation angles of each borehole, the HIFZ values in boreholes K2, K3, and K4 were calculated as 52.86, 81.30, and 107.67 m, respectively. Therefore, the maximum value of HIFZ in the mine was 107.67 m.
Conclusions
This study showed a substantial difference between the predicted value of HIFZ based on the theoretical equation (20) and the value obtained through in-situ investigation. Therefore, an empirical formula is no longer suitable for predicting HIFZ under the conditions of thick coal seams with mechanically weak overburden in western China. Two theoretical prediction methods were described and verified using in-situ investigation.
First, a method for calculating HIFZ based on the mechanical relationship of the fractured rock strata was determined by considering three influencing factors––(i) the flexural and breaking limit conditions of roof rock mass, (ii) influence of rock fragmentation and bulking, and (iii) thickness of excavated coal seam––which provided a basis for controlling the overburden in thick coal seam mining in Jurassic coalfields in western China.
Second, the relationship between HIFZ and the mining thickness was obtained by conducting fitting regression analysis on the measured values of mines under similar geo-mining conditions. Given the limited measured data, it is necessary to constantly add more measured data to revise and improve the regression analysis in later periods.
Based on the derived formula, the maximum value of HIFZ in the study area was 109.74 m. The analytical formula obtained from the data fitting and regression analysis showed that at a mining thickness of 5.5 m, HIFZ was 92.91–114.57 m. In addition, an in-situ investigation was conducted on working face 103, and the value of HIFZ was measured as 107.67 m. The two theoretical calculation results were mostly consistent with the measured values, which verifies the effectiveness of the two prediction methods. Thus, the research results provide scientific guidance for HIFZ prediction, and can play a significant role in mine safety production.
Footnotes
Declaration of conflicting interests
The author(s) declared no potential conflicts of interest with respect to the research, authorship, and/or publication of this article.
Funding
The author(s) disclosed receipt of the following financial support for the research, authorship, and/or publication of this article: The authors acknowledge the support of Erdos Energy Co. Ltd. for this research. This research was financially supported by the Education Department Foundation of Hebei Province of China (QN2018244), Handan Science and Technology Research and Development Plan (19422121008-42), and National Natural Science Foundation of China (41902088).