
Abstract
Generating systems are known as adequately reliable when satisfying the load demand. Meanwhile, the efficiency of electrical systems is currently being more influenced by the growing adoption of the Wind/Solar energy in power systems compared to other conventional power sources. This paper proposed a new optimization approach called Metaheuristic Scanning Genetic Algorithm (MSGA) for the evaluation of the efficiency of power generating systems. The MSGA is based on a combination of metaheuristic scanning and Genetic Algorithm. The MSGA technique is used for evaluating the reliability and adequacy of generation systems integrated with wind/Solar energy is developed. The usefulness of the proposed algorithm was tested using Reliability Test System ‘IEEE-RTS-79’ which include both of wind power and solar power generation. The result approve the effectiveness of the proposed algorithm in improving the computation time by 85% and 2% in comparison with the particle swarm optimization (PSO) and differential evolution optimization algorithm (DEOA) respectively. In addition, the proposed model can be used to test the power capacity forecasting scheme of the hybrid power generation system with the wind, solar and storage.
Keywords
Introduction
The shortage of energy and the demand for energy-saving and emission reduction have urged the power grids of countries around the world to actively develop low-carbon power technologies (Nazir et al., 2020a). With the deepening of research on the use of renewable energy worldwide and the reduction of power generation costs, more and more different types of renewable energy power generation are connected to the power system. Since, obviously, various energy sources complement one another in time and location (Nazir et al., 2020b; Zhang et al., 2020) Combined generation of renewable energy forms will offset intermittent energy losses and increase the resilience of the grid to intermittent renewable energies (Ahmed et al., 2019; Cai et al., 2020). It is necessary to evaluate the utilization value of complementary power generation using multiple energy forms.
Many researchers have introduced various models and algorithms to assess the reliability of the power system to guide system design and operation by quantitatively evaluating the reliability of the power system (Maleki, 2018; Zhang et al., 2019). The main methods currently used are analytical (Da Silva et al., 2014) and Monte Carlo simulation (MCS) (Jayatheertha and District, 2012). The analytical method applies to small power systems with a simple structure because the amount of calculation and the size of the system are exponential. Da Silva et al. (2014) Focused on analytical methods of assessing the reliability of generating systems in multi-site wind farms. The MCS approach allows the reliability matrixes to be estimated accurately. The MCS may be helpful for this purpose by involving several system states for the penetration of wind energy into operating systems, and there is a need for large computational inputs which could be time-efficient if efficient convergence is paramount. Solomon et al. (2014) applied the Israeli actual power grid to analyze the matching problem of large-scale wind power and photovoltaic power generation systems. By comparing the wind and solar single and complementary operation modes, the wind and solar complementary power generation model was obtained, which improved the power penetration of intermittent energy into the power grid. Madani et al. (2012) and Denholm (2012) has established a generation reliability evaluation model for wind power, photovoltaic power generation, and energy storage systems, and proposed a new coordinated scheduling strategy. Billinton et al. (2012) pointed out that wind-solar resources are highly complementary and have better stability, reliability, and economy when analyzing the distributed generation system of wind-solar-biogas mixed renewable energy. Consequently, the un-concentrated supply of wind power sources further complicates the reliability evaluation process (Billinton et al., 2012; Madaeni et al., 2012; Zhang et al., 2019). Therefore, new equipment are required for assessing generation systems with a large penetration of wind energy sources (Shahzad et al., 2017; Zhang et al., 2019; Nazir et al., (2020)).
Meta-heuristic algorithms, such as genetic algorithm and ant colony algorithm, etc., have become more and more effective methods for solving complex optimization problems (Bonabeau et al., 2000; Dorigo et al., 1996). Most meta-heuristic algorithms are derived from the simulation of biological behavior or physical properties or chemical processes, for example, Ant colony algorithm is to simulate the actual ant colony foraging process (Gambardella and Dorigo, 1997), particle swarm algorithm is derived from the bird and fish groups (Benidris and Mitra, 2014; Green et al., 2010, 2012; Hadow et al., 2010; Huang and Liu, 2013), Evolutionary Computation (EC) and Smart State Space Pruning (ISSP). Despite the series of researches on the reliability of generation system, more appropriate techniques are needed which are computationally scalable and more practical to reflect the soundness of power generation (Almutairi et al., 2015; Kadhem et al., 2017; Athraa et al., 2017). Each algorithm has its advantages and disadvantages, such as: If the cooling process is slow enough, the simulation process is long enough, the simulated annealing algorithm can almost ensure that the optimal solution is found. However, slight adjustments to the parameters will affect the convergence of the algorithm.
The need for models for the simulation of the stochastic characteristics of power generating system behavior is not a new problem for generally population-based intelligent research methods. However, it becomes a serious issue when considering the integration of wind resources with power systems. This paper is attempted to propose a new algorithm called Metaheuristic Searching Optimization Algorithm (MSGA) for the reduction of the computational resources in the MCS and intelligent algorithms. The proposed MSGA optimize output probability model of hybrid power sources of wind turbines and solar generators are established. Then, based on the suitable capacity, a credible capacity and complementary indicators of the wind-solar combined power generation system is proposed to discuss the effects of different energy storage ratios and wind/solar installed ratios on the credible capacity of the combined power generation system, and when the wind-solar combined access Complementary benefits.
Related work
Wind/solar output characteristics
The output characteristics of wind turbines are generally expressed by a piecewise function. If the wind farm has the number of wind turbines with the same parameters, and the wind speed difference of different wind turbines is ignored, the output power of the wind farm can be described by the following piecewise function (Nazir and Abdalla, 2019):
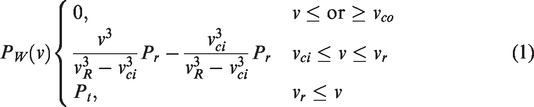
Where:
The hourly solar irradiance is obtained, the power output of the photovoltaic power generation system can be obtained according to the performance parameters of the photovoltaic panel, as follows (Nazir et al., 2020b; Temiz and Javani, 2020):

Where
The battery energy conversion efficiency can be described by
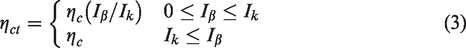
Where:
In general, the battery conversion efficiency remains constant and no longer changes with the incident irradiance change after exceeding the value 150 W/m2.
The power output

Where
Assuming that

On the other hand, because the output of the wind-solar combined power generation system is affected by the light intensity and wind speed,

Where:
The output range of the wind turbine is
Power generation system reliability evaluation indicators
The reliability evaluation methods mainly include network method, state-space method, state enumeration method, Monte Carlo simulation method, etc. (Dąbrowska, 2020). In the reliability evaluation of independent power generation systems with wind complementarity, the commonly used reliability evaluation indicators are Loss of load probability (LOLP), Expected energy not serviced (EENS), and Loss of load expectation (LOLE) (Söder et al., 2020). Since LOLP is closely related to the reliability of the power generation and transmission system, it can more realistically and directly reflect the supply and demand of the power market, and it can also more intuitively quantify the risks caused by the loss of system capacity, which is mainly divided into the following six types (Söder et al., 2020):
Loss of load probability (LOLP)
The load probability that the system cannot meet the power demand within a certain period evaluated by:
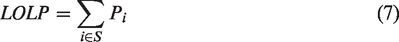
Where:
Loss of load frequency (LOLF)
The load frequency is the number of times that the system cannot meet the demand of supply load.
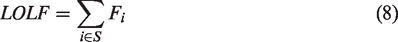
In the formula,
Loss of load expectation (LOLE)
The load expectation that the system cannot meet the expected time value of the power demand evaluated by:

Where
Loss of load duration (LOLD)
In a certain period, the system cannot meet the average duration of the supply to meet the demand.

Expected energy not serviced (EENS)
In a certain period, the system cannot meet the expected value of the load power reduction caused by the supply load demand.

Where
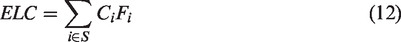
Expected of load curtailments (ELC)
The load curtailment within a certain time, the system was unable to meet the expected value of power reduction due to supply meeting demand which can evaluated by:
The proposed methodology
Principle of the MSGA
Figure 1, shows the proposed MSGA optimization algorithm which has a simple procedure and outstanding performance. The four steps of the MSGA comprise initialization, selection, mutation, and crossover. In the MSGA, the mutation operator is employed for the selection step, while the machine state-space search function is used to guide the search to potential failure conditions in the feasible region.
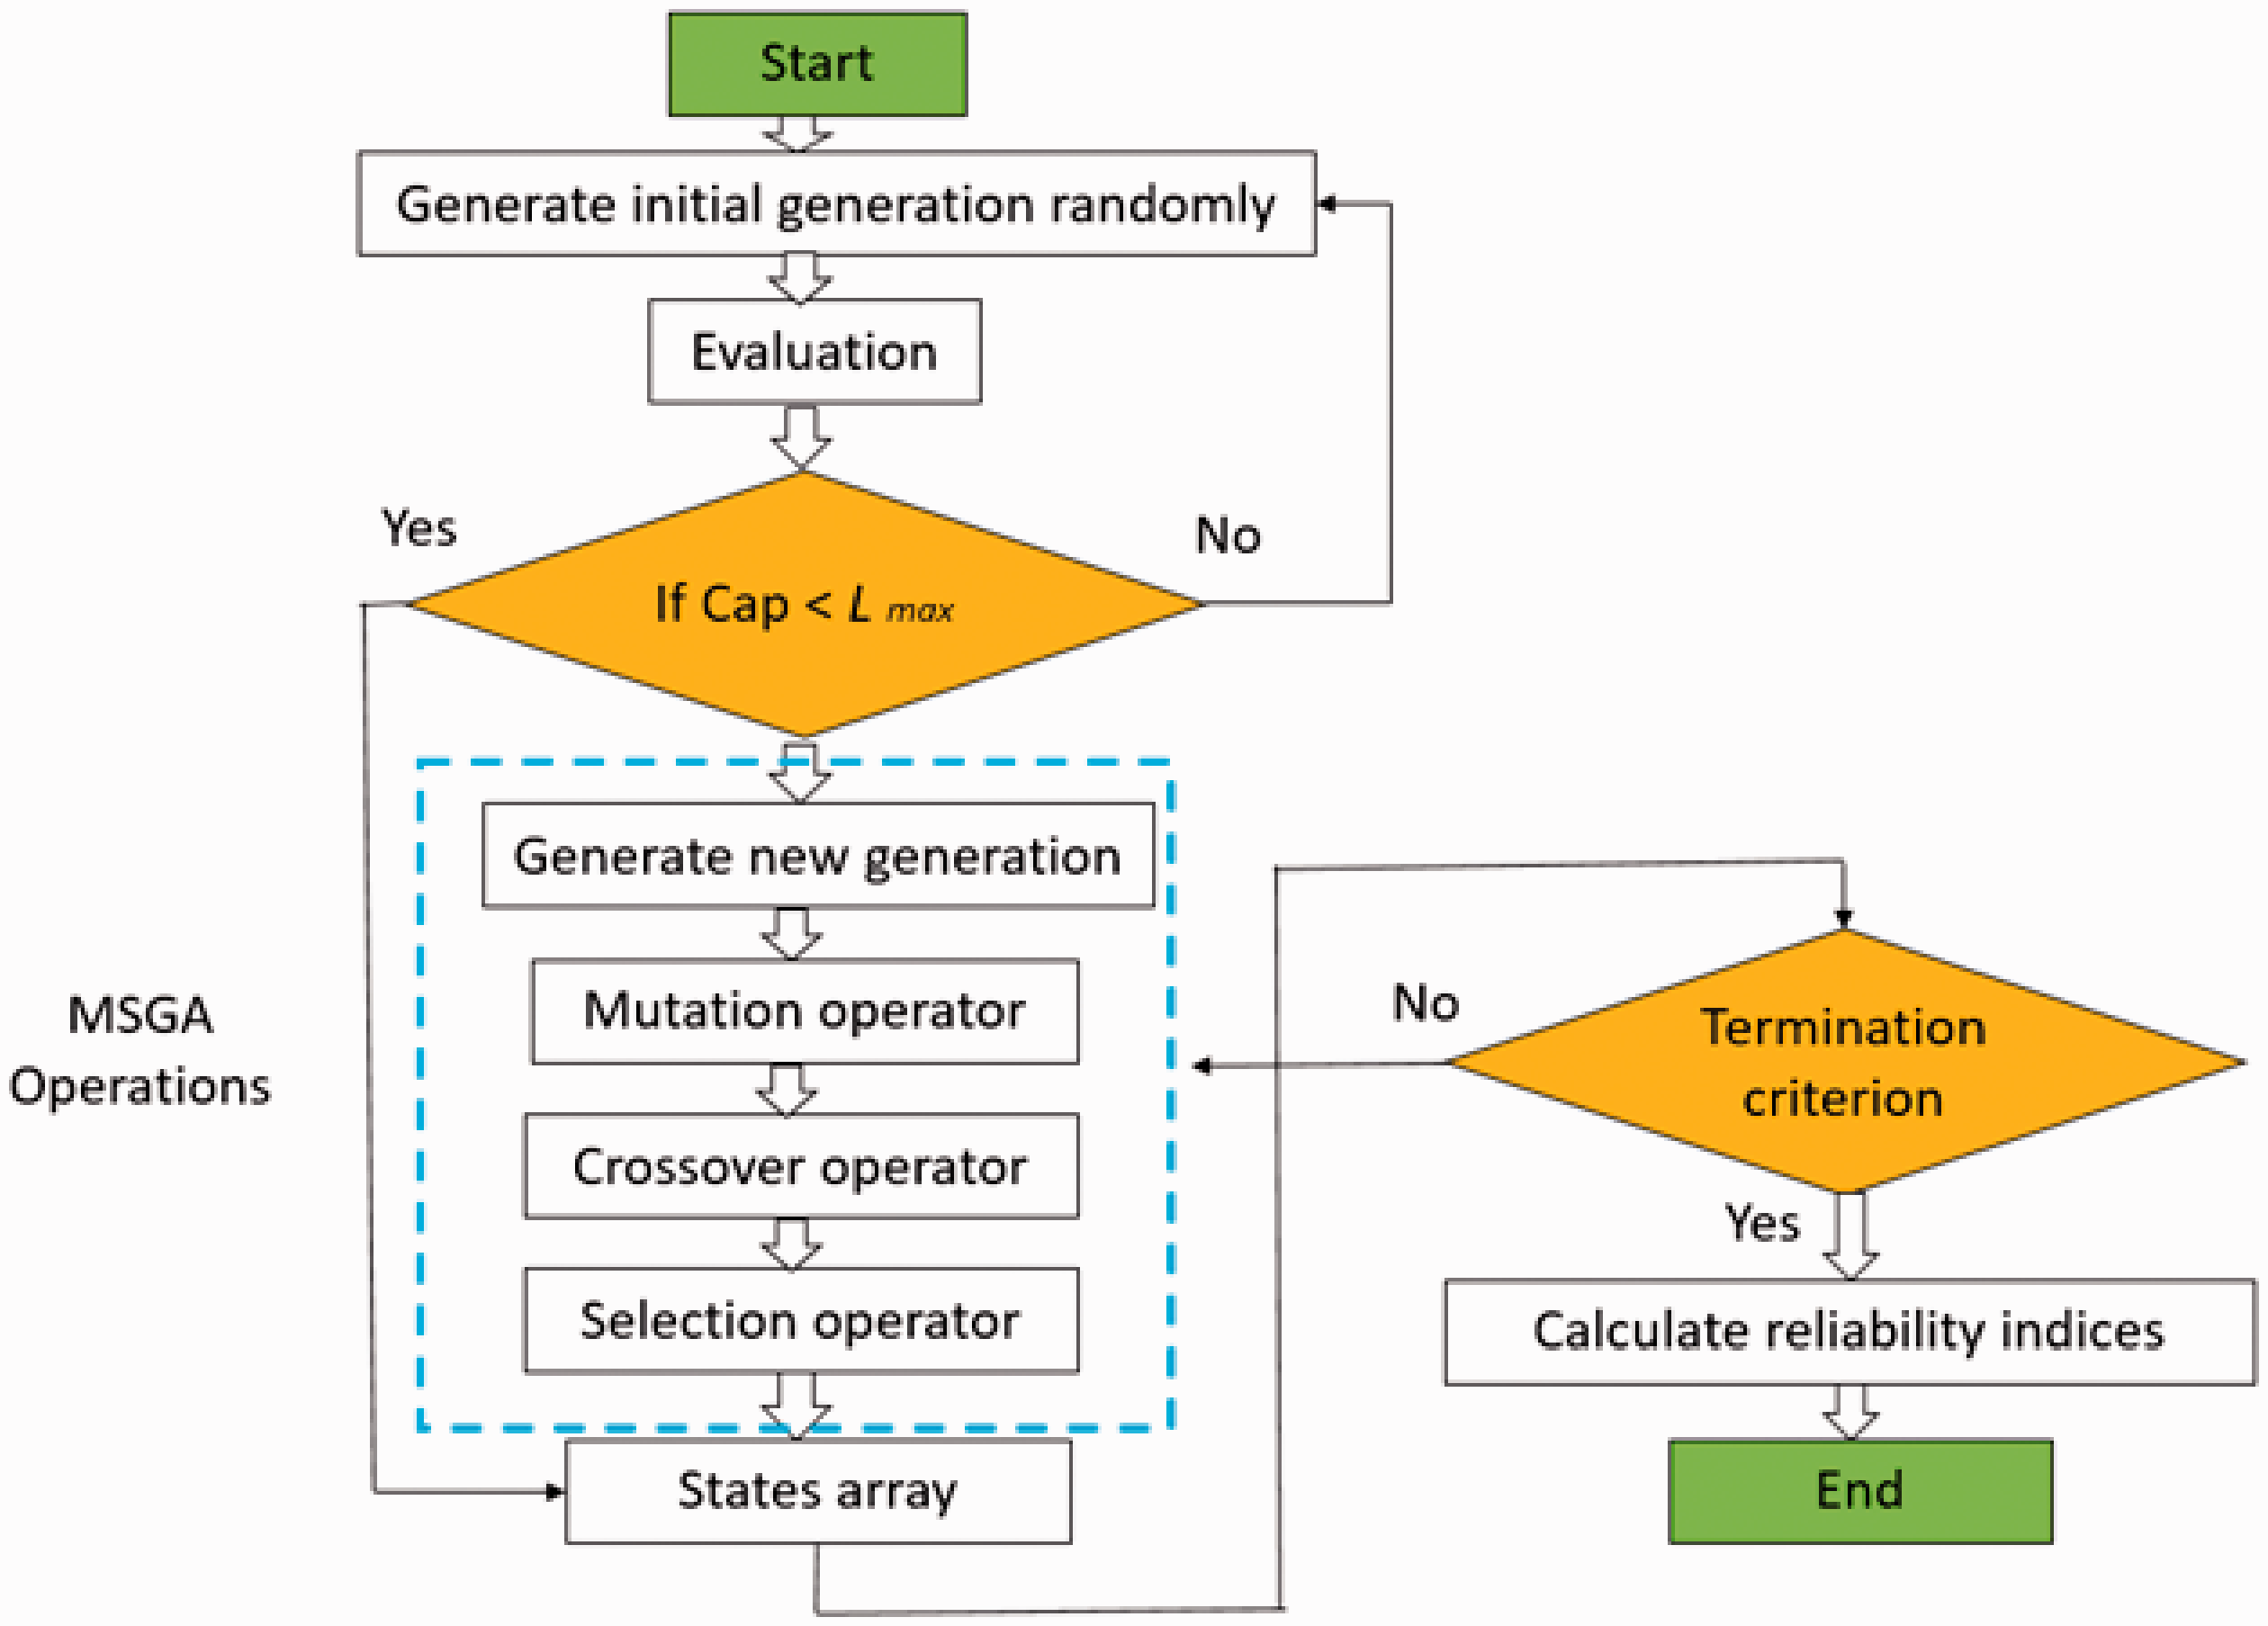
Proposed MSGA technique.
The selection of numerical values in the MSGA for
Implementation procedures for reliability assessment
In this paper the MSGA optimize the available unit output cannot meet the load demand and there is a power difference, and the remaining available capacity of the energy storage device cannot meet this difference. This paper mainly refers to the LOLE indicator for the calculation of equal reliability, to estimate the credible capacity of the wind-solar storage power generation system.
The steps to solve the credible capacity of hybrid power generation system are as follows:
The LOLE can be evaluated as follows:

Where

Where

Where
The calculation of the reliability indicator for LOLE was based on the achieved state array and the sum of the hourly load values. Usually, it is modelled as a random variable with a random variable model using time series approaches such as Weibull distribution. The rating changes over time, but for a given interval, can be regarded as a constant value and this was considered for reliability calculation in this study.
Several criteria are employed for the termination of the algorithm while computing its results and stopping criterion corresponds to the number of generations (Green et al., 2011).
Results and discussion
This paper focuses on developing and testing an approach for assessing reliability generating systems using IEEE-RTS-79 which contain renewable resources. These test systems were deployed to validate the performance of the MSGA developed for the reliability assessment.
The IEEE-RTS-79 test system contains 32 generating units; its unit capacity ranges from 12 to 400 MW, with a total system power output of 3405 MW at a peak load of 2850 MW (Subcommittee, 1979). Having published the IEEE-RTS-79 system, it has become a vital tool for assessing various models of reliability and for evaluating methodologies in various research fields. The rated wind capacity used is 2 MW, and the rated wind velocities are 2.5, 12 and 18 m/s respectively. The maximum power output of the solar array used in the solar power plant is 280 W under standard test conditions, the capacity factor is 14.3%, and the battery area is about 2 m2. The electric utility industry is experiencing few changes to accommodate a multi-area RTS design through the incorporation of additional data.
Case 1: Evaluation of MSGA performance for the IEEE-RTS-79 system
The parameter values of the MSGA control settings were recorded as pop size = 60 and CR = 0.6. The boundary variables that limit the obtainable state-space were identified as L = 0.1 and H = 0.6, while the data previously reported by (Jabr, 2013) were used for the reliability parameters for the unit settings for generation. The set to 1e-15. For producing the hourly values the load period curve and the load model were used. For each year, that gives a total of 8736 individual values. The maximum number of generation (set at100) was the deployed stop criterion for MSGA (Green et al., 2010).
To show the accuracy of the MSGA algorithm, MCS and Differential Modified Simple Genetic Algorithm (DEAO) benchmarked its output against those. These algorithms for the benchmarking were also developed for similar problems. The MSGA stop criteria were when it created 100 individual generations. The MSGA results were compared with those of other previously reported algorithms (Li, 2013; Samaan and Singh, 2002) as shown in Table 1. The findings were compared according to their indexes of reliability. Using MSGA and DEAO (Kadhem et al., 2017) the absolute values used for this analysis were extracted from a single sprint. The MSGA was therefore discontinued because no significant change in the fitness value was observed for consecutive 100 generations.
MSGA results for IEEE-RTS-79.
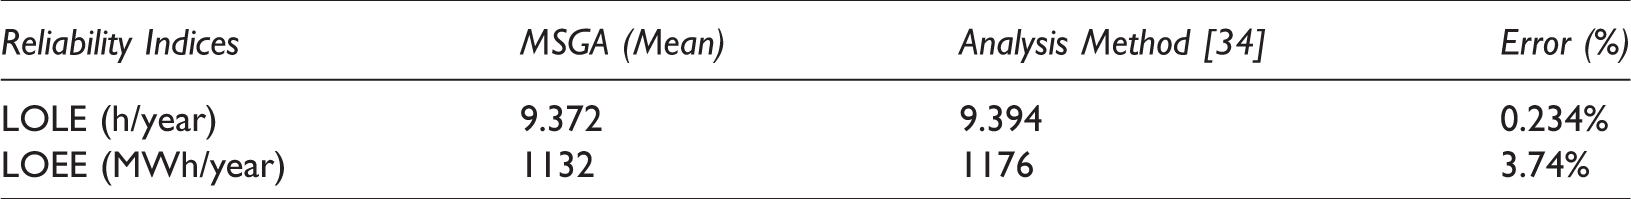
For verification of the MSGA’s confidence and strength, the algorithm was executed under similar conditions for 100 consecutive runs as discussed earlier. Table 2 displays the consequences of executions. The MSGA findings that were obtained were correlated with those reported by (Allan et al., 1986).
Results of 100 repeated runs of MSGA algorithm.
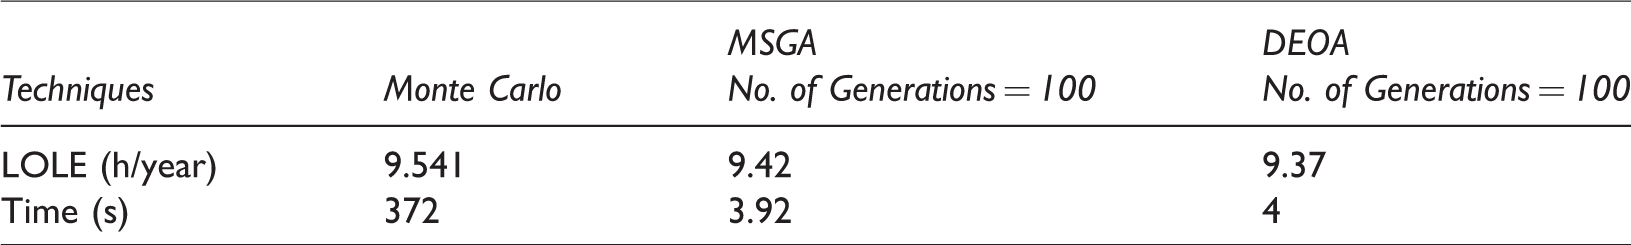
The calculation effort of the proposed approach has also been evaluated and compared with those of MSGA, MCS, and DEOA, as shown in Table 3. The measurement effort of the proposed method has been found to depend on the desired precision. However, when the degree of the coefficient of variance was reached 5 per cent (Pradhan et al., 2020), the simulation evaluation will be stop. This distinction was made with absolute values that were derived from a single run of MSGA and DEOA (Kadhem et al., 2017). The MSGA computation time was shorter compared with the other approaches, as can be seen in Table 3.
Computational time comparison between MCS, MSGA, and DEOA algorithms.
Case 2: Reliability indices for IEEE-RTS-79 using MSGA with WPG
For traditional generating units, the reliability parameters (for, μ, ÿ) previously given by (Li, 2013) were used, while it was taken as 1e-15. The LDC model was used to produce the annual load values which for one year comprise 8736-h values. For the algorithm, the stop criterion was called the maximum number of iterations needed to achieve 100 generations (Green et al., 2010).
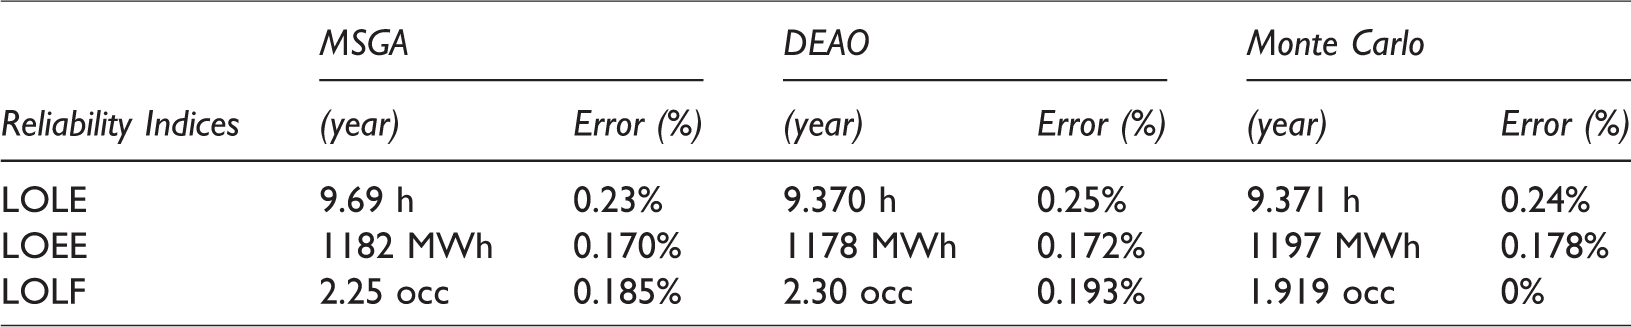
The reliability indexes for RTS-79 with a peak load of 2850 MW and a WPG of 170 MW evaluated by the proposed MSGA, MCS, and particle swarm optimization (PSO) as shown in Table 4. The despite its simplicity, the MSGA showed the slightest computation time compared to the benchmarking PSO algorithm. Besides, MCS algorithm could be assumed to be at its worst convergence time, based on the LOLE index.
Comparison between MCS, BPSO, and the proposed MSGA method.
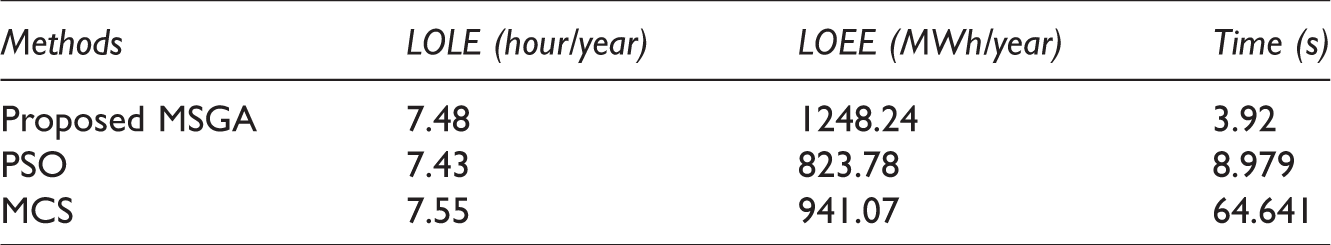
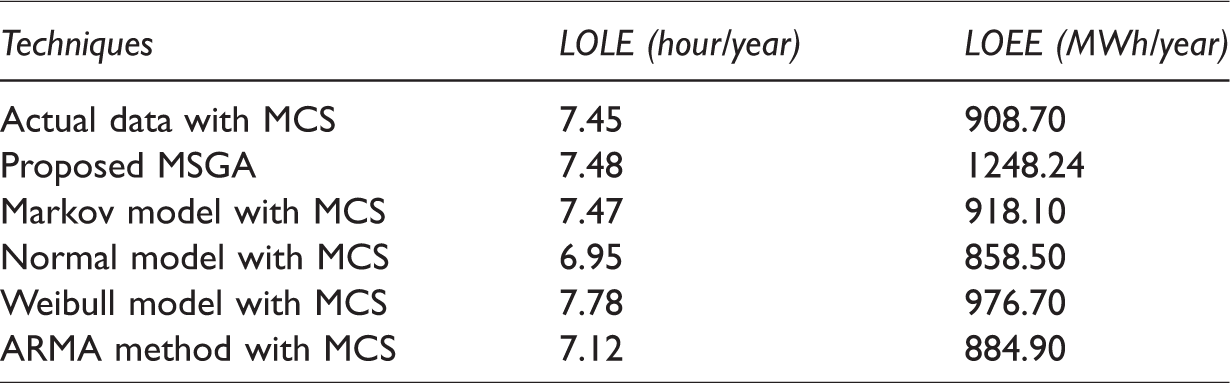
Table 5 summarizes the findings of a comparison between the reliability indices of five models previously published in the literature (Soleymani et al., 2015) and MSGA’s. Both techniques used the MCS method to measure the reliability indexes of various wind speed models (such as Normal distribution, Markov method, ARMA time series model, Weibull distribution, and real wind speeds). It became clear that the findings obtained using MSGA had values of reliability indices that were similar to those obtained using real wind speed data in the MCS process.
Comparison between the proposed MSGA method and suggested methods in the literature.
Case 3: Reliability indices under the combined wind and solar power generation system
The efficiency of the proposed MSGA was ensured through a careful selection of the control parameters used in this study. The analysis of the impact on the reliability of the system when combined wind and solar power generation. In this case, the fixed wind power access capacity is 100 MW, which gradually increases the access capacity of solar power generation. Figure 5 shows LOLE during combined wind and solar power generation. Figure 2 shows that when the energy storage is connected, the system reliability can be better improved as the capacity of the wind-solar combined power generation system is the size of the conventional unit. Figure 3 shows the total installed capacity of Wind/Solar energy to 300 MW, and considers the situation of different installed proportions of wind and solar, and calculates the capacity ratio of the combined wind and power system. It can be observe that the installed capacity of wind power is larger than that of solar power, the capacity ratio is more ideal. This is due to the local climate resources, the wind type used, and the specific parameters of the solar power generation device, which need to be considered in the specific power optimization.
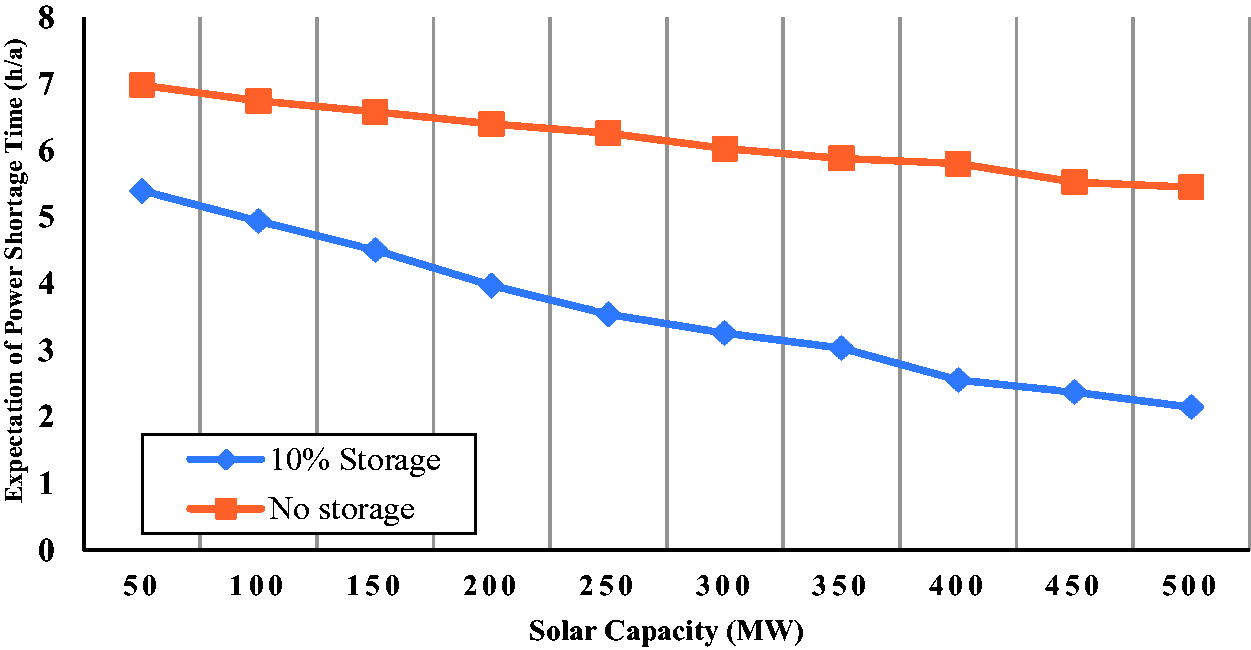
LOLE combined wind and solar power generation.
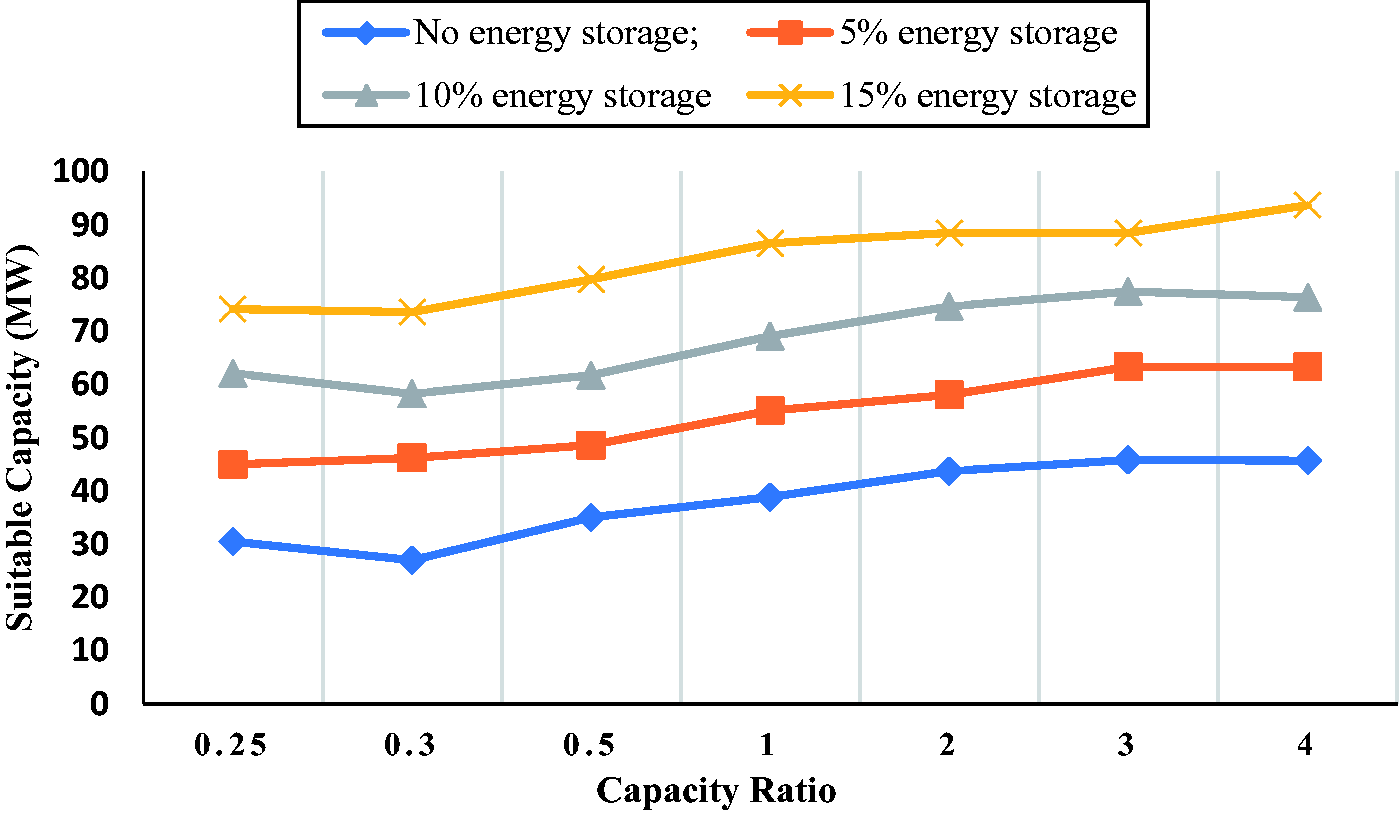
The suitable capacity of the wind-solar combined power generation system.
Case 4: Evaluation of the complementary benefit of installation capacity ratio
The complementary gain capacity is present the power generation benefits brought the combined power generation system. When the proportion of installed wind power and installed solar capacity is different, the complementary gain capacity will also be different. Figure 4 shows the evaluation of the complementary gain capacity under different wind-solar ratios, in which the total wind/solar capacity are 300 MW. It can observe that the complementary gain capacity is greatly affected by the energy storage access capacity, and has different performances at different installed ratios. Therefore, the complementary benefits are better if the installed capacity of wind power is larger than the installed solar capacity.
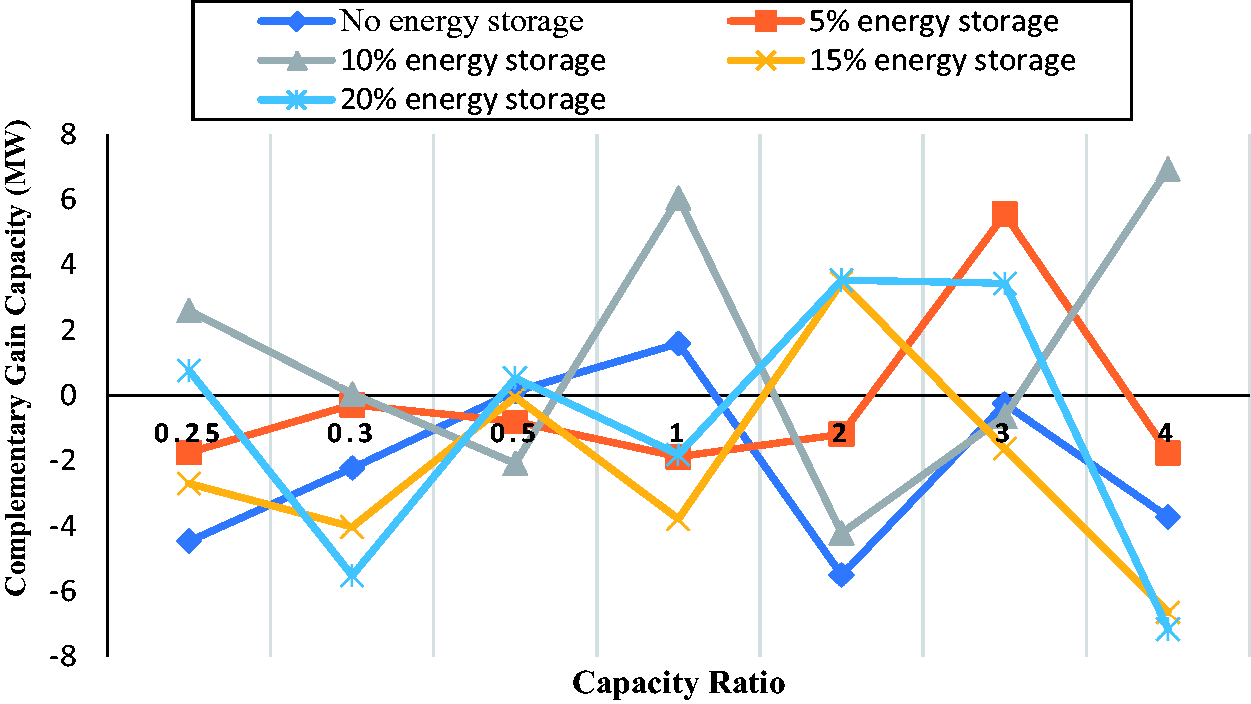
The complementary gain of the wind-solar combined power generation system.
The evaluation of the installed ratio of wind/solar energies under the same rate capacity. To obtain the same reliability, the capacity of a single unit is should be identified. However to obtain the same reliability, in the case of multiple types of power supply access, there can be different sets of unit capacity ratio. Figure 5 lists the combinations of wind and solar power units with size capacities of 20, 30, and 40 MW. The combination of wind and solar power units with equal reliable capacity is affected by local climate resources and the parameters of the selected units. In addition, the combination resources of wind/solar units used to simplify power planning when different new energy sources are connected.
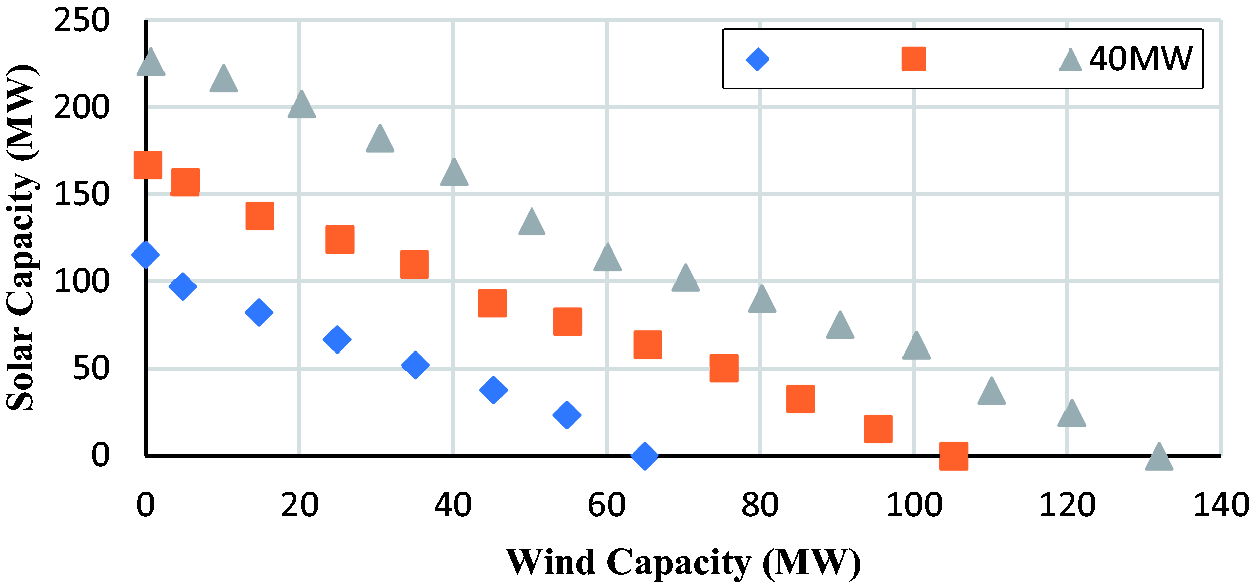
Combination of wind and solar generator units with suitable capacity.
Conclusions
This paper proposed a new Weibull-based MSGA model for reliability evaluation of generation systems with a Wind/Solar energy sources. The suggested intelligent algorithm for evaluating the reliability index of the power generation system will be provided to evaluate the reliability indices of non-chronological systems as a feasible alternative to the non-MCS. This algorithm reduced the calculation time used to measure the reliability indexes. In addition, this algorithm shows significant improvement the complementary gain capacity which greatly affected by the energy storage access capacity, and has better performances at different installed ratios. The combination of wind and solar power systems with enough resources will speed up the integration of various sources of renewable electricity
Footnotes
Declaration of conflicting interests
The author(s) declared no potential conflicts of interest with respect to the research, authorship, and/or publication of this article.
Funding
The author(s) disclosed receipt of the following financial support for the research, authorship, and/or publication of this article: The authors are grateful to Huaiyin Institute of Technology for providing financial support to complete this work grant No.(JAS2018020).