
Abstract
This study proposes economic evaluation of CO2 geological storage with enhanced oil recovery. The procedures consider capital expenditures and operating costs of infrastructures and revenues from oil recovery and carbon tax credits. Extensive CO2 geological storage with enhanced oil recovery simulations was conducted to determine the most promising scenario among cases, where miscibility was controlled by the addition of liquefied petroleum gas. The addition of liquefied petroleum gas into a CO2 injection stream can accelerate reduction of oil viscosity, interfacial tension, and oil density, which cause improved displacement efficiency. The larger was the amount of liquefied petroleum gas injected, the greater was the miscibility due to minimum miscibility pressure reduction, resulting in higher oil recovery and less CO2 sequestration. Although liquefied petroleum gas addition enhances the performance of CO2 enhanced oil recovery, economic analysis should be conducted for CO2 geological storage with enhanced oil recovery due to the higher price of liquefied petroleum gas than that of CO2. Net present value decreased from liquefied petroleum gas mole fraction of 0–2% and started to increase from mole fraction 2–13% due to the miscibility effect. Then, net present value started to decrease, because the purchasing and injecting prices of the required liquefied petroleum gas exceeded that of the oil produced. Economic evaluation showed that addition of 13% liquefied petroleum gas was the most promising scenario, with a net present value of 91 MM$. Thus, we confirmed an optimum liquefied petroleum gas concentration in the CO2 geological storage with enhanced oil recovery process.
Introduction
It is expected that world gross domestic product (GDP) will double from 2016 to 2040 because of the economic expansion and development of non-Organisation for Economic Co-operation and Development (OECD) and OECD countries; more dominant from developing countries (ExxonMobil, 2018). According to the report, the energy consumption will increase in every sector of transportation, industries, and electricity generation mainly due to the development in non-OECD. However, because of the environmental effect, the portion of coal use in global energy mix will decrease, and the demand of oil in transportation sector and gas and renewables in electricity generation sector will increase. Because of the complexity of the relationship from economic growth to energy, many researches have been conducted (Appiah, 2018; Tiba and Omri, 2017; Walheer, 2018). Showing how economies react to an unexpected reduction in oil production, Bastianin et al. (2017) emphasized the importance of energy security with oil.
Worldwide oil demand and carbon emissions are predicted to increase gradually until 2040, and good solutions for this issue are CO2 enhanced oil recovery (EOR) and CO2 geological storage (Alvarado and Manrique, 2010; BP, 2018). The main drawback of CO2 storage in an aquifer is lack of commercial value; CO2 EOR can resolve this problem by enhancement of oil production as part of the carbon capture, utilization, and storage processes (Leung et al., 2014). Coupled CO2 storage and EOR (CCS–EOR) can propose commercial opportunities for oil producers and ensure the geological storage of large quantities of CO2. Nearly, 80 MtCO2 is already being used for CCS–EOR each year (IEA, 2019). CO2-EOR is one of the most effective EOR methods and is performed by injecting CO2, which acts as a solvent to reduce oil viscosity, interfacial tension (IFT), and oil density. This can extend the production period by 15–20 years, with oil recovered at 15–25% of the original oil in place (Dong et al., 2000; Yongmao et al., 2004).
There have been a number of attempts to combine CCS and EOR. Ettehadtavakkol et al. (2014) focused on the sensitivity of economic parameters with various water alternating gas (WAG) ratios during CCS–EOR. However, the effects of reservoir in-situ condition controls, such as miscibility adjustment, impurities in the CO2 stream, and IFT change-triggered relative permeability curve alteration, on net present value (NPV) have not been considered. Hasan et al. (2015) designed a CO2 utilization through CO2 EOR considering economic parameters, not considering fluid flow mechanisms and the operating cost for miscibility while the process. Rognmo et al. (2019) provided an experimental approach to test and upscale a CO2 foam injection as one of injection schemes for CCS–EOR without the economic analysis. Nunez-Lopez et al. (2019) performed reservoir simulation studies with various CO2 injection scenarios for CCS–EOR. However, they only focus the oil production and CO2 storage without economic analysis and constant miscibility mechanisms. Those studies focused only on in-situ mechanisms and performances and neglected the economics of field operation including CO2 capture, transportation, and injection.
Since the optimum operating design and condition to enhance the performance of CCS–EOR at each reservoir is different, it is necessary to develop site-specific design based on economic analysis for the field application. To overcome the limitations of previous studies, CCS–EOR was performed from the viewpoint of economics to derive the most promising scenario with variable miscibility conditions with liquefied petroleum gas (LPG) and economic parameters. Capital expenditures (CAPEX) and operating costs (OPEX) of operation and revenues from oil recovery and carbon tax credits were adopted to evaluate NPV, because it is one of the most practical tools used in investment analysis for evaluating profitability, also known as economic decision criteria (Abdel-Aal and Al Sahlawi, 2013).
First, a numerical study for CCS–EOR was conducted. Oil recovery and sequestered CO2 by each mechanism of solubility trapping, residual trapping, and free CO2 under different miscibility conditions were examined. The results of the fluid model matched the experimental data. Then, minimum miscibility pressure (MMP) was calculated from a slim-tube simulation. The amount of LPG added into the injection gas was controlled to change miscibility conditions. Addition of LPG into the CO2 stream can lower the MMP, which accelerates the reduction of oil viscosity, IFT, and oil density. The effects of IFT change due to miscibility increase were included by modification of liquid–gas relative permeability curves, which led to different flow regimes and performances under different miscibility conditions. Finally, NPVs of various miscibility conditions, which were adjusted by pressure control and LPG addition, were analyzed.
Numerical model
Residual and solubility trappings
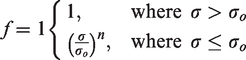
The relative permeability curve follows different paths with imbibition or drainage processes, which causes the hysteresis effect. For the WAG process, CO2 can be stored as water imbibes into a reservoir. Numerous studies have established equations to explain this phenomenon (Blunt, 2000; Jerauld, 1997; Killough, 1976; Land, 1968; Larsen and Skauge, 1998; Lenhard and Oostrom, 1998; Lenhard and Parker, 1987). The Land model, which is the most widely used empirical trapping model and base for subsequent hysteresis models, was used in this study. The hysteresis effect on gas relative to permeability is calculated as follows (equations (1) to (3))


The Peng–Robinson EOS (1976) was applied to calculate the fugacities of components in the oil and gas phases and to determine CO2 solubility and phase behavior of the fluid model with the reservoir oil and CO2. To calculate the fugacity of CO2 in the aqueous phase, Henry’s law was used (Li and Nghiem, 1986)


Relative permeability alteration
Decrease of IFT between oil and gas improves relative permeability for gas and oil (Araujo et al., 2001; Bardon and Longeron, 1980; Jamaloei, 2015; McDougall et al., 1997). The relative curves for oil and gas are linear functions of oil and gas saturations in miscible conditions. The modified relative permeability curves for oil and gas are denoted as


Economic parameters calculation
For CCS–EOR, it is important to examine not only reservoir performances, but also infrastructure-related costs that critically affect economic feasibility. Figure 1 shows a brief schematic of CCS–EOR. Here, CO2 is captured from facilities, such as a pulverized coal and integrated gasification combined cycle (IGCC) plant, boosted for transport to the reservoir site through a pipeline, and injected with the help of surface facilities, such as a pump. Every step needs economic evaluation for successful development in the oil field.
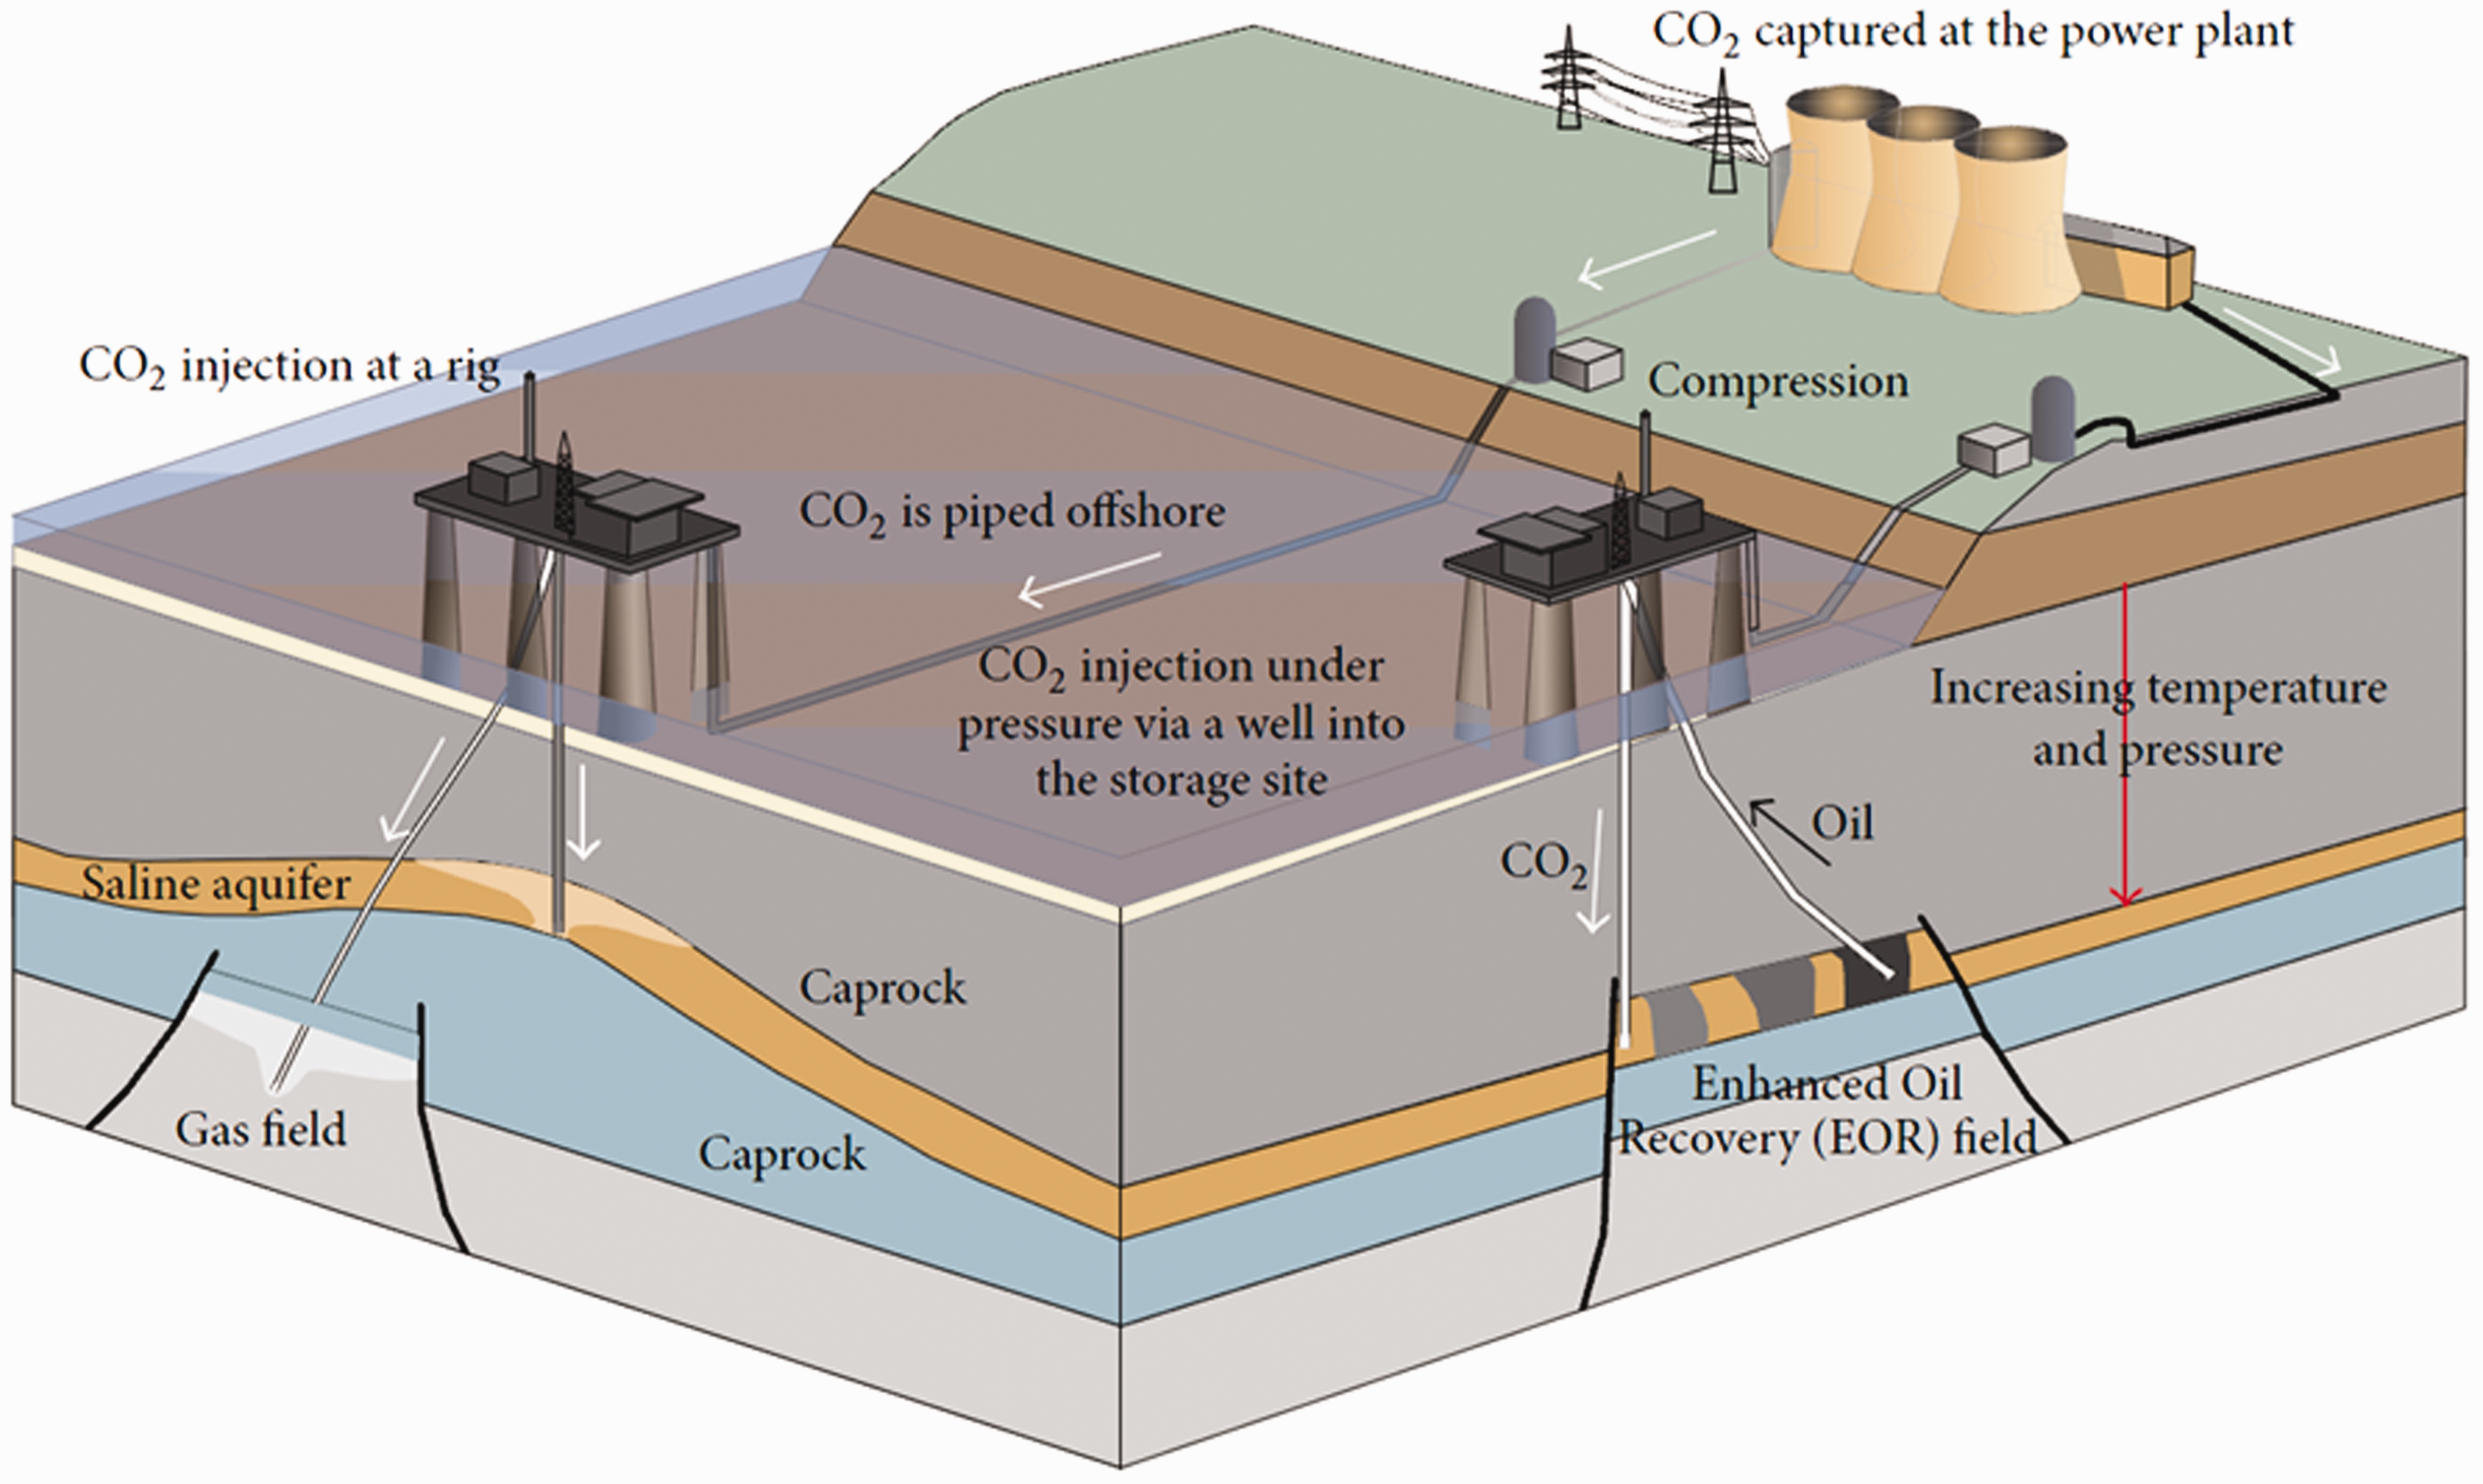
Schematic of CCS–EOR infrastructures (Sheng et al., 2015).
There are several other costs that affect the cost calculation, such as surface equipment lease fee and minor costs for screening, contracts, insurance, and monitoring. The equipment lease fee and other costs, which are dependent on reservoir site, were adopted from the work of Ettehadtavakkol et al. (2014).
Compressor and pump
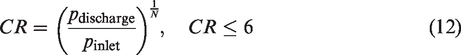
The compression procedure is significant for transporting CO2 from the capture site to the oil field. The compressor and pump are two main facilities that boost CO2 pressure. The compressor is initially used to boost CO2 pressure to its supercritical pressure for transport. Then, CO2 can be delivered through the pipeline as a supercritical dense fluid. The pump is used to further increase the CO2 pressure to injection pressure.
To adopt the compression procedure, equations (12) to (17) are referred from Mohitpour et al. (2000) and McCollum and Ogden (2006). They proposed the compression ratio (CR) as follows
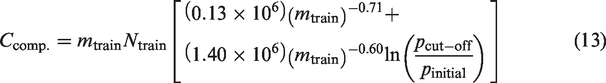
CAPEX and OPEX concepts were considered in this study. CAPEX for the compressor is calculated through the following equation
Like the compressor, CAPEX of the pump is calculated as

Annual OPEX for the compressor and pump,


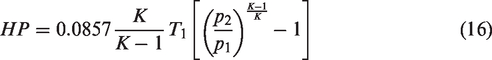
Electric power costs for the compressor and pump are also considered. Electricity power cost is calculated as the product of power use and electricity cost. Compressor power use, HP, can be obtained from the following equation
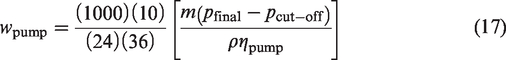
Pump power use can be expressed as follows
Transportation
In CO2 flooding, CO2 flows through a pipeline. In this study, it was assumed that only OPEX for the pipeline was the operator’s responsibility, as was true in a previous study (Ettehadtavakkol et al., 2014). McCollum and Ogden (2006) suggested equations for estimating onshore pipeline annual OPEX,


For ease of calculation,
NPV calculation
Equations (20) to (22) show the calculation of CAPEX and OPEX of overall economical consideration


Revenue in this study was obtained from two major sources: oil recovery and CO2 geological storage carbon tax credit. Discounted revenue from oil recovery is calculated as follows

Discounted revenue from CCS carbon credit is expressed as follows

NPV is calculated by comparing revenue and cost and is briefly expressed as follows

Results
Fluid modeling
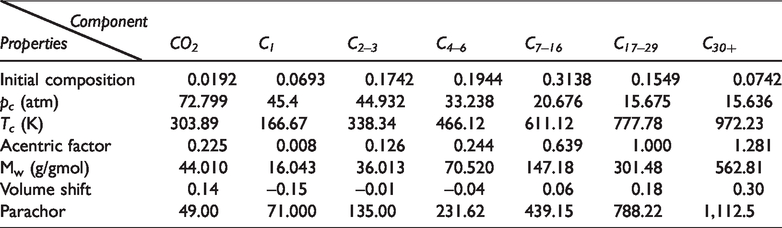
Fluid properties and relative permeability curves were adopted from the work of Ghomian (2008). EOS parameters for pseudo-components are listed in Table 1, and relative permeability curves are presented in Figures 1 and 2. Once the fluid model was developed and MMP was estimated by slim-tube simulation, the results were matched with given MMP data of 1500 psia at a given temperature. Results and interpretation of the slim-tube simulation are shown in Figure 3, with a slope change around 1500 psia and exact MMP was of 1478 psia. These results are acceptable in comparison to the given MMP data of 1500 psia.
EOS parameters for pseudo-components (Ghomian, 2008).
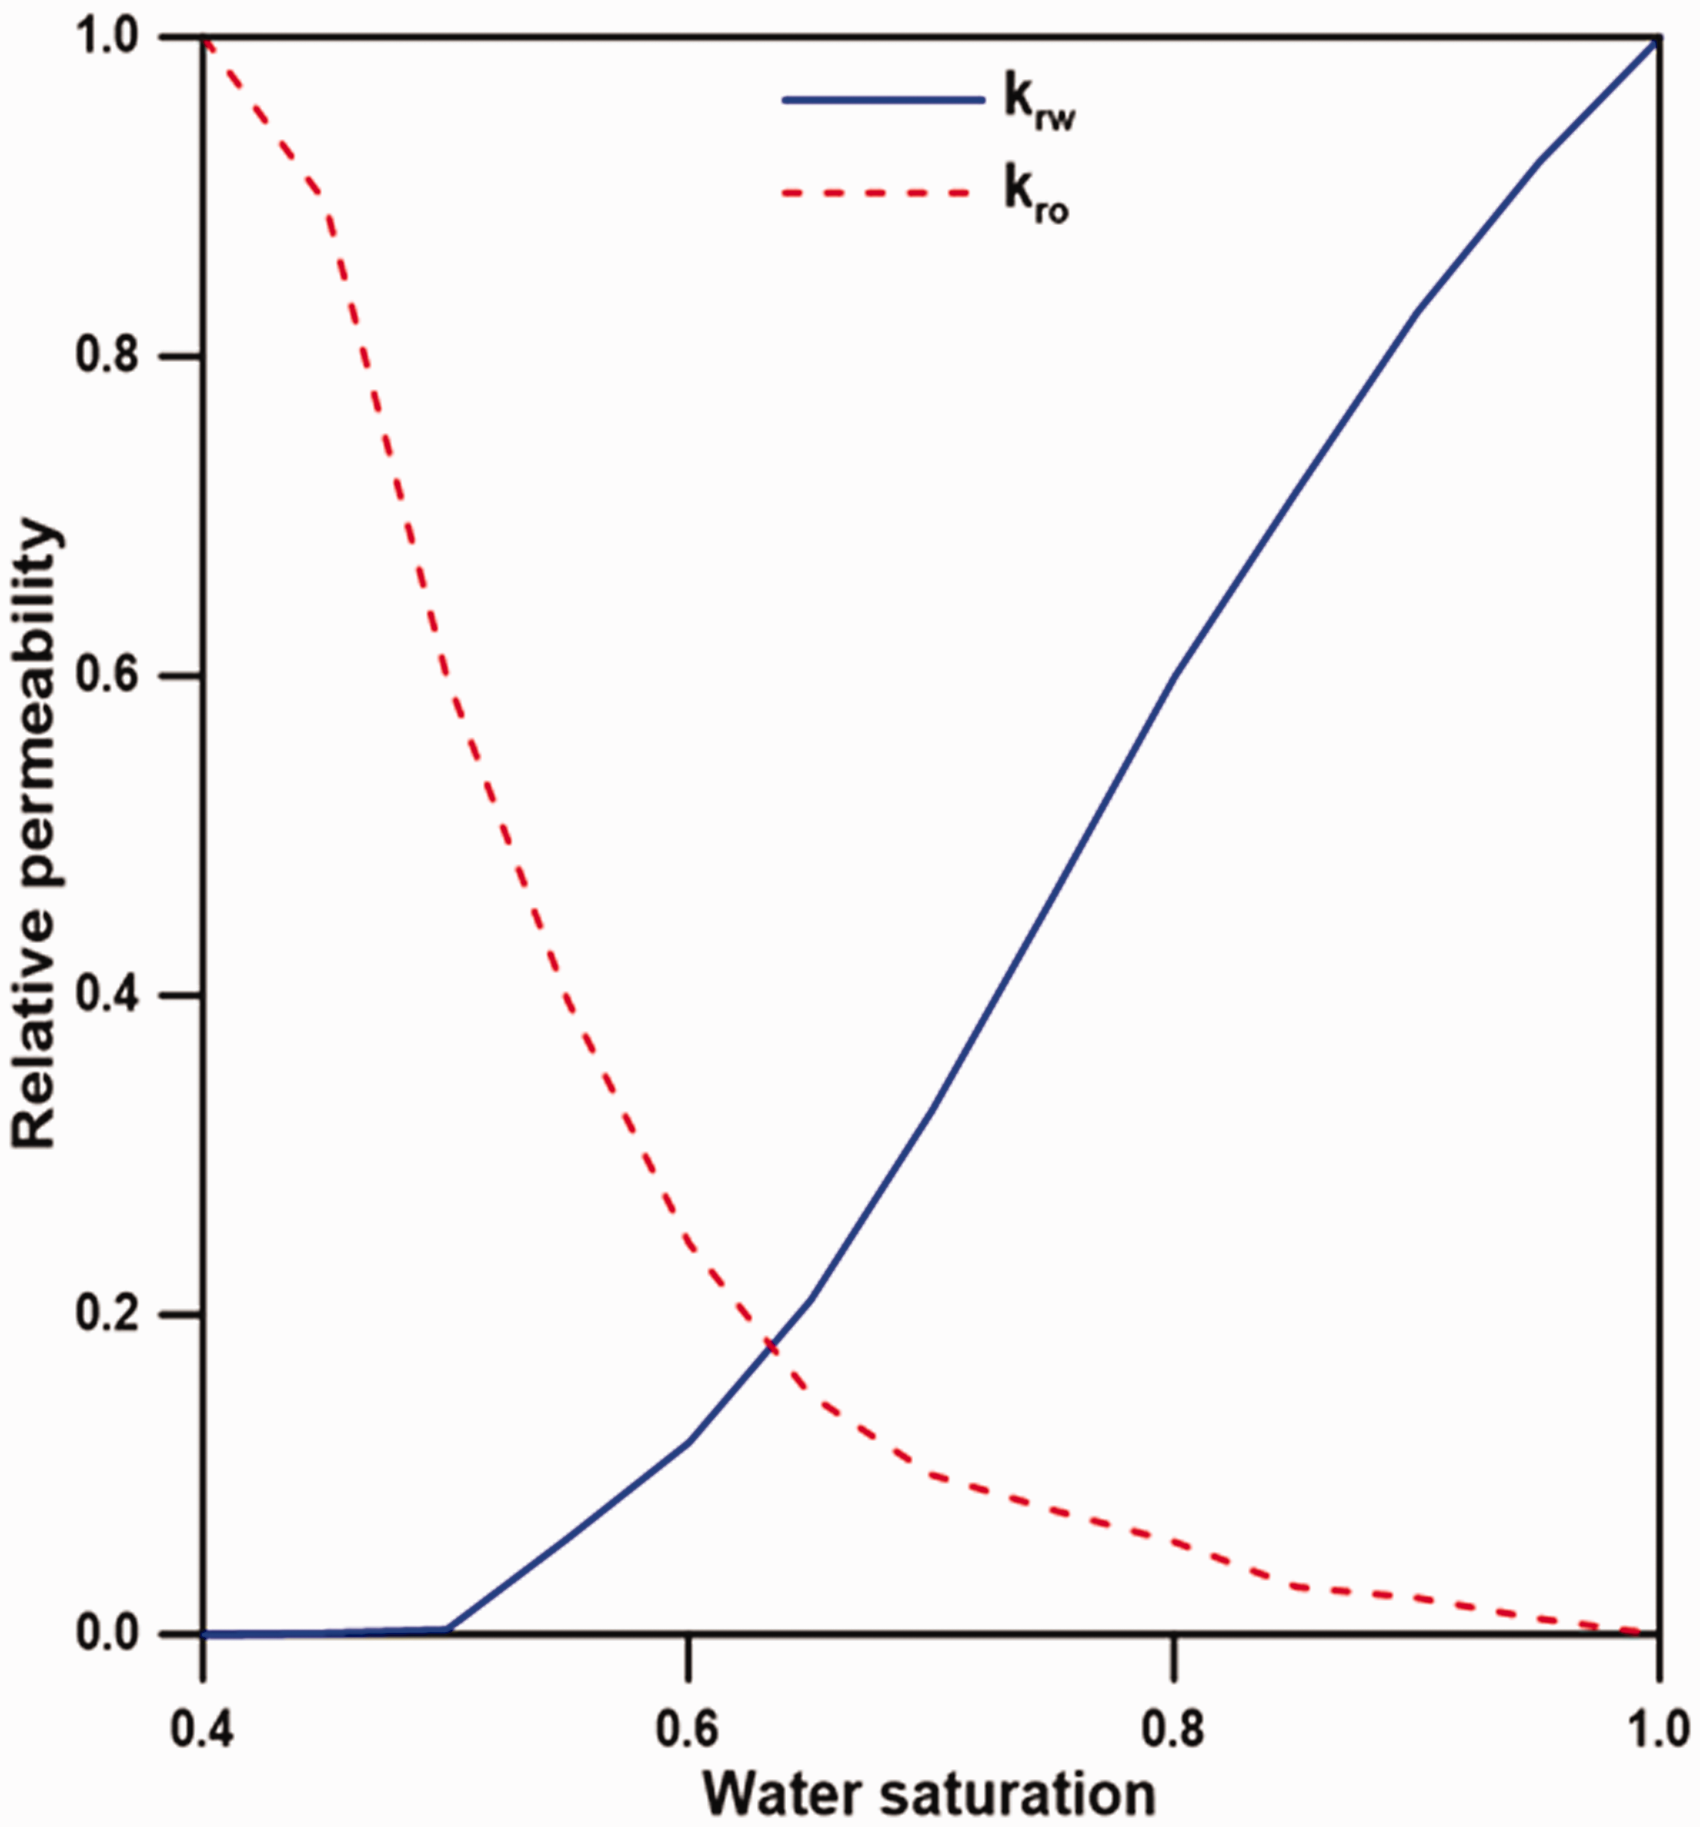
Water-oil relative permeability curves (Ghomian, 2008).
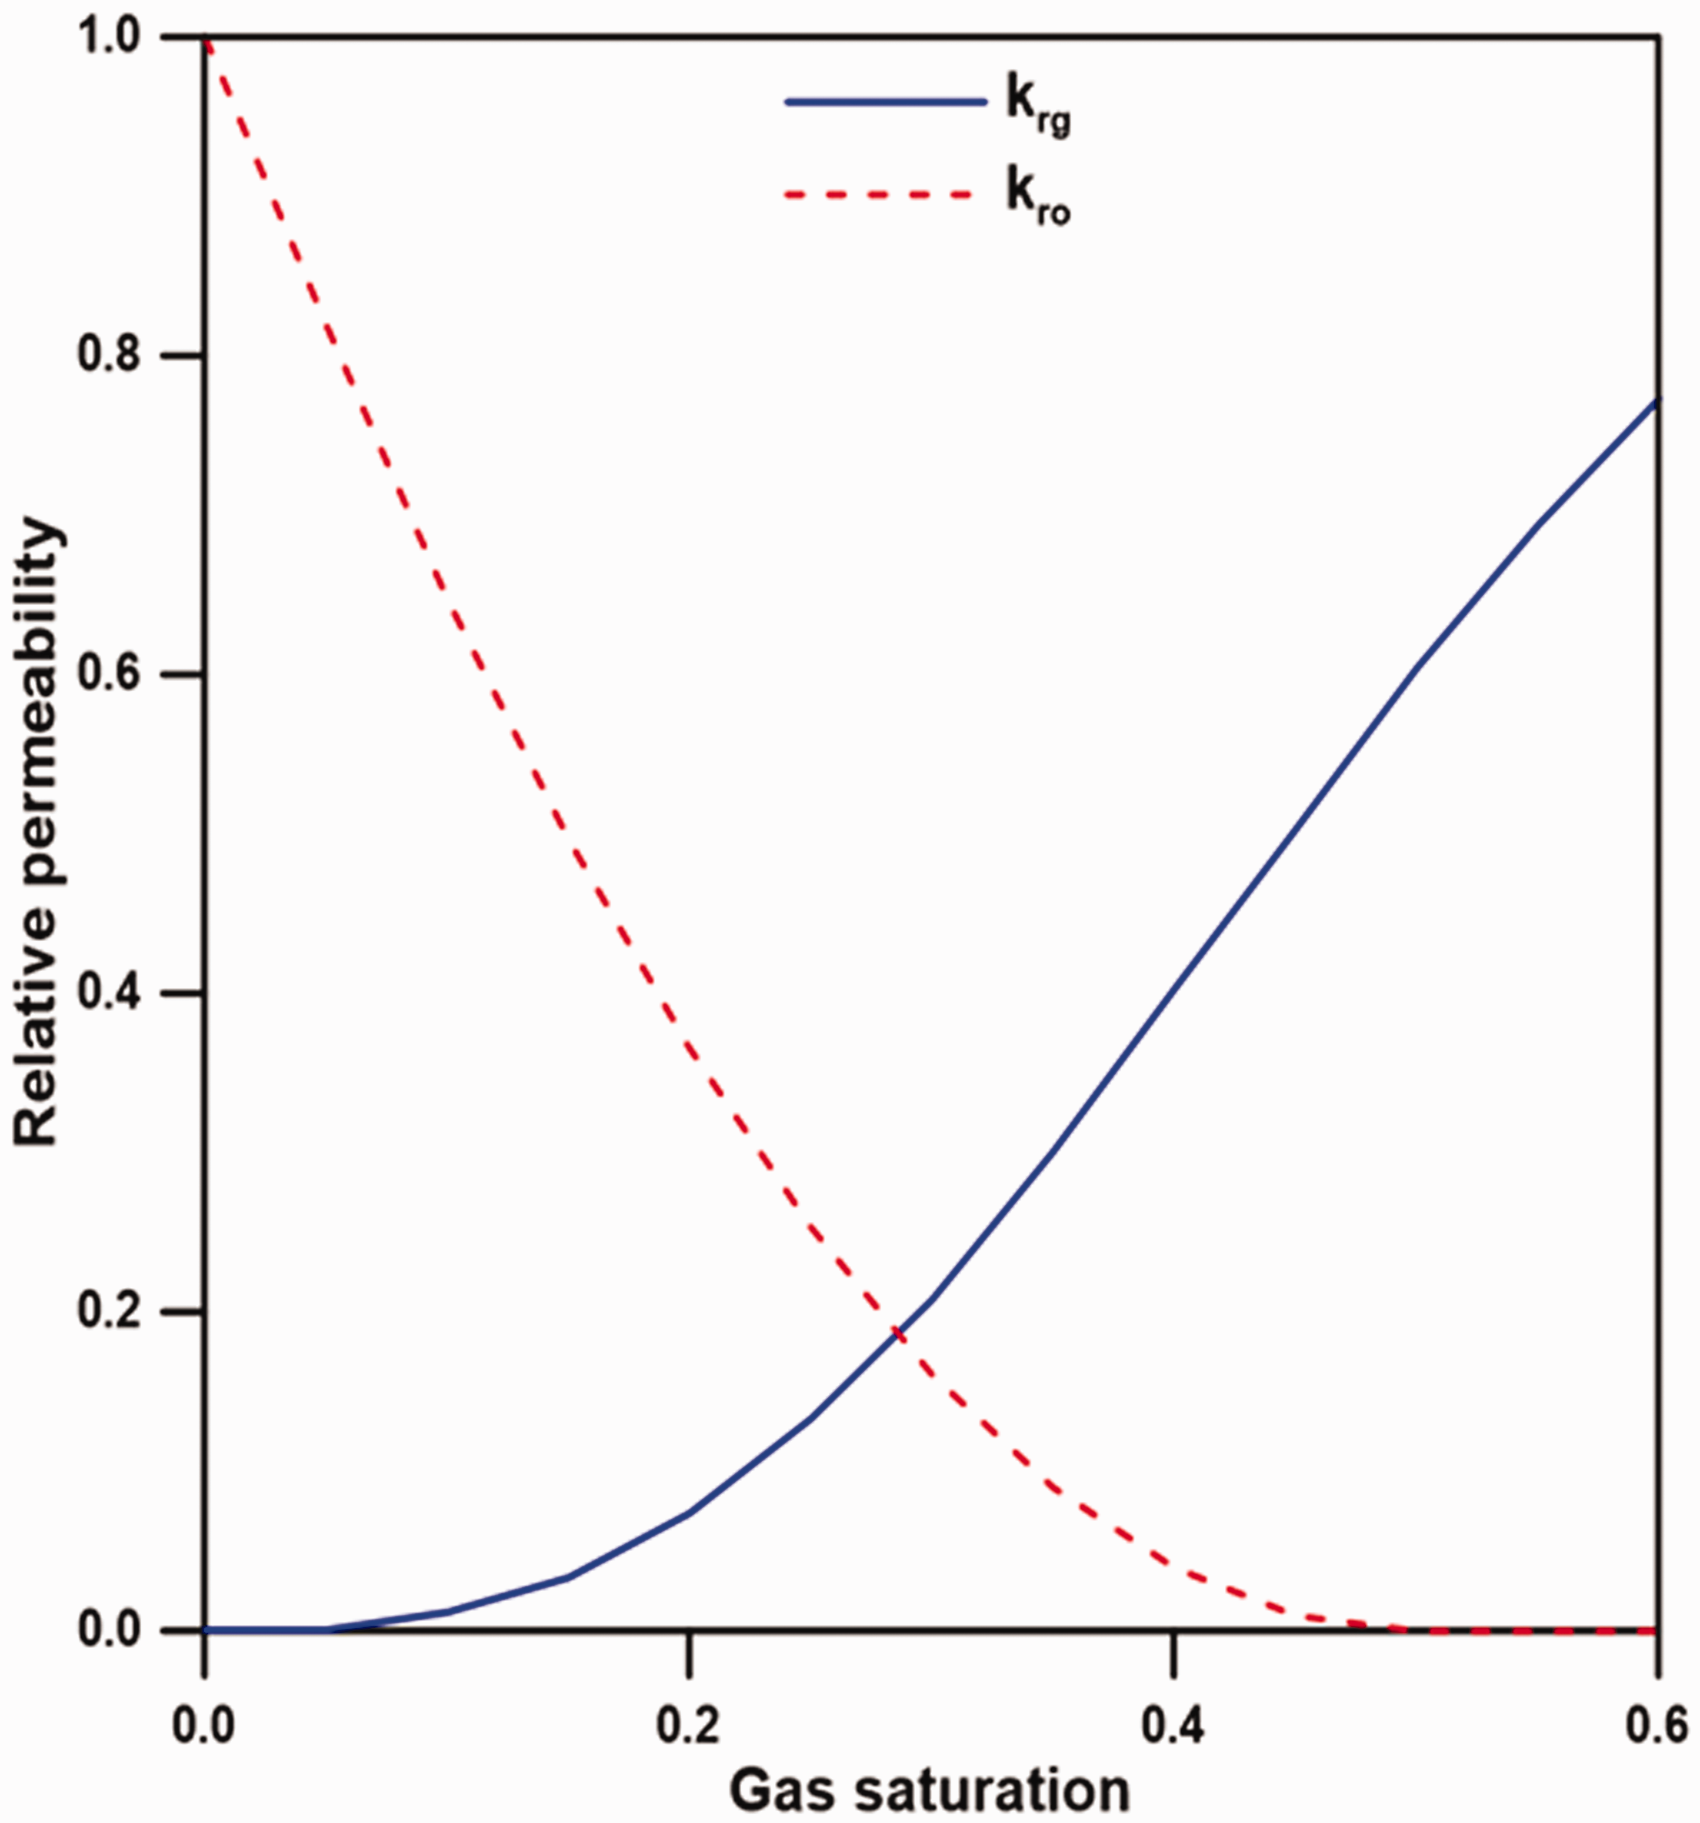
Gas-liquid relative permeability curves (Ghomian, 2008).
Model description
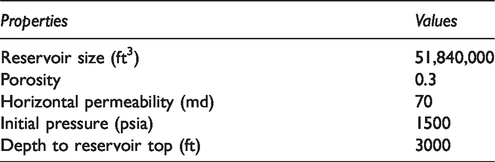
CCS–EOR was applied to a single-layer, two-dimensional reservoir model. A five-spot model was chosen with a 720 ft × 720 ft × 100 ft size of one quarter and reservoir properties as shown in Table 2. Since the reservoir was deeper than 1800 ft, it was applicable to CCS–EOR (Klins, 1984; Kovscek, 2002; Shaw and Bachu, 2002; Taber et al., 1997). The injection scenario was planned to combine five years of pre-water flooding and 20 years of WAG injection with a cycle of six months. For pre-water injection, water was injected at a rate of 300 bbl/day; for the WAG process, water and gas were injected at a rate of 300 bbl/day and 35,760 ft3/day of CO2, respectively, with 0–0.15 mol fraction of additional LPG in each case. One ^PV of water was injected for 10 years during pre-water injection. Since CO2 is a highly compressible fluid, an injection rate of 1 PV for 10 years under near-miscible conditions was chosen. The injector and producer were located at the corners of the model, which were diagonally positioned.
Reservoir model properties.
Miscibility adjustment through LPG addition
The miscibility condition was also adjusted through the addition of LPG, which was composed of half propane and half butane. Propane and butane prices were introduced from the OPIS North America LPG Report (OPIS, 2017). Based on the pressure-controlled immiscible CCS–EOR model, LPG was injected at different mole fractions from 0 to 15% with CO2 as a solvent. The amount of injected CO2 remained constant, while additional LPG produced a larger slug for a higher LPG mole percent. Economic evaluation was then carried out for the models with different LPG mole fractions in injection gas.
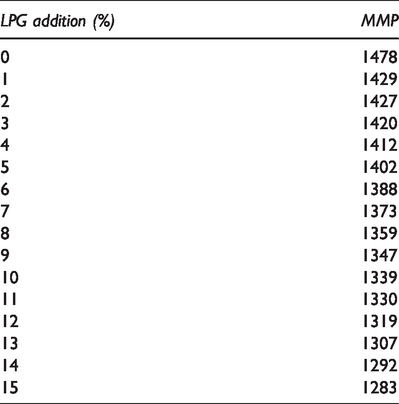
Since LPG acts as an intermediate component in the CO2-oil phase diagram, adding LPG into the CO2 stream resulted in a lower MMP between oil and CO2-LPG gas than that of oil and CO2 only. MMP data obtained by slim-tube simulations between oil and CO2-LPG gas are listed in Table 3 with respective mole fraction of LPG. As more LPG is added into CO2 stream, the MMP becomes low. For LPG-CO2 injection, it was easier to achieve miscible conditions at the same pressure and temperature conditions as for CO2 injection. The case of 15% LPG in injection gas had an MMP of 1283 psia, which was 195 psia lower than that of the 0% LPG injection case. The MMP change must be considered since it affects not only oil recovery and CO2 sequestration but also NPV.
MMPs derived from slim-tube simulations depending on amount of LPG added (psia).
Enhanced oil recovery
Once CO2 was injected into the reservoir, it started to interact with oil. Mixing with CO2 resulted in lighter, easier flowing, and swelled oil. With greater miscibility between oil and injected gas, the IFT decreased. Increased reservoir pressure as well as decreased MMP by LPG injection produced miscible conditions. Figure 4 shows IFT change of cases with LPG fractions of 0, 5, 10, and 15% at the CO2 swept zone. First, IFT remained zero since injected gas had not yet arrived and only oil existed at this location. Once CO2 affected the oil at this location, the IFT started to increase. The IFT between oil and gas was lower in miscibility at earlier stages but higher at later stages due to influx of heavy fractions left behind when the gas removed intermediate fractions of oil through vaporization. The IFT change affected the shape of the relative permeability curves, as presented in Figure 5. Modification of the liquid–gas relative permeability curve due to the decreased IFT between oil and gas allowed easier flow.
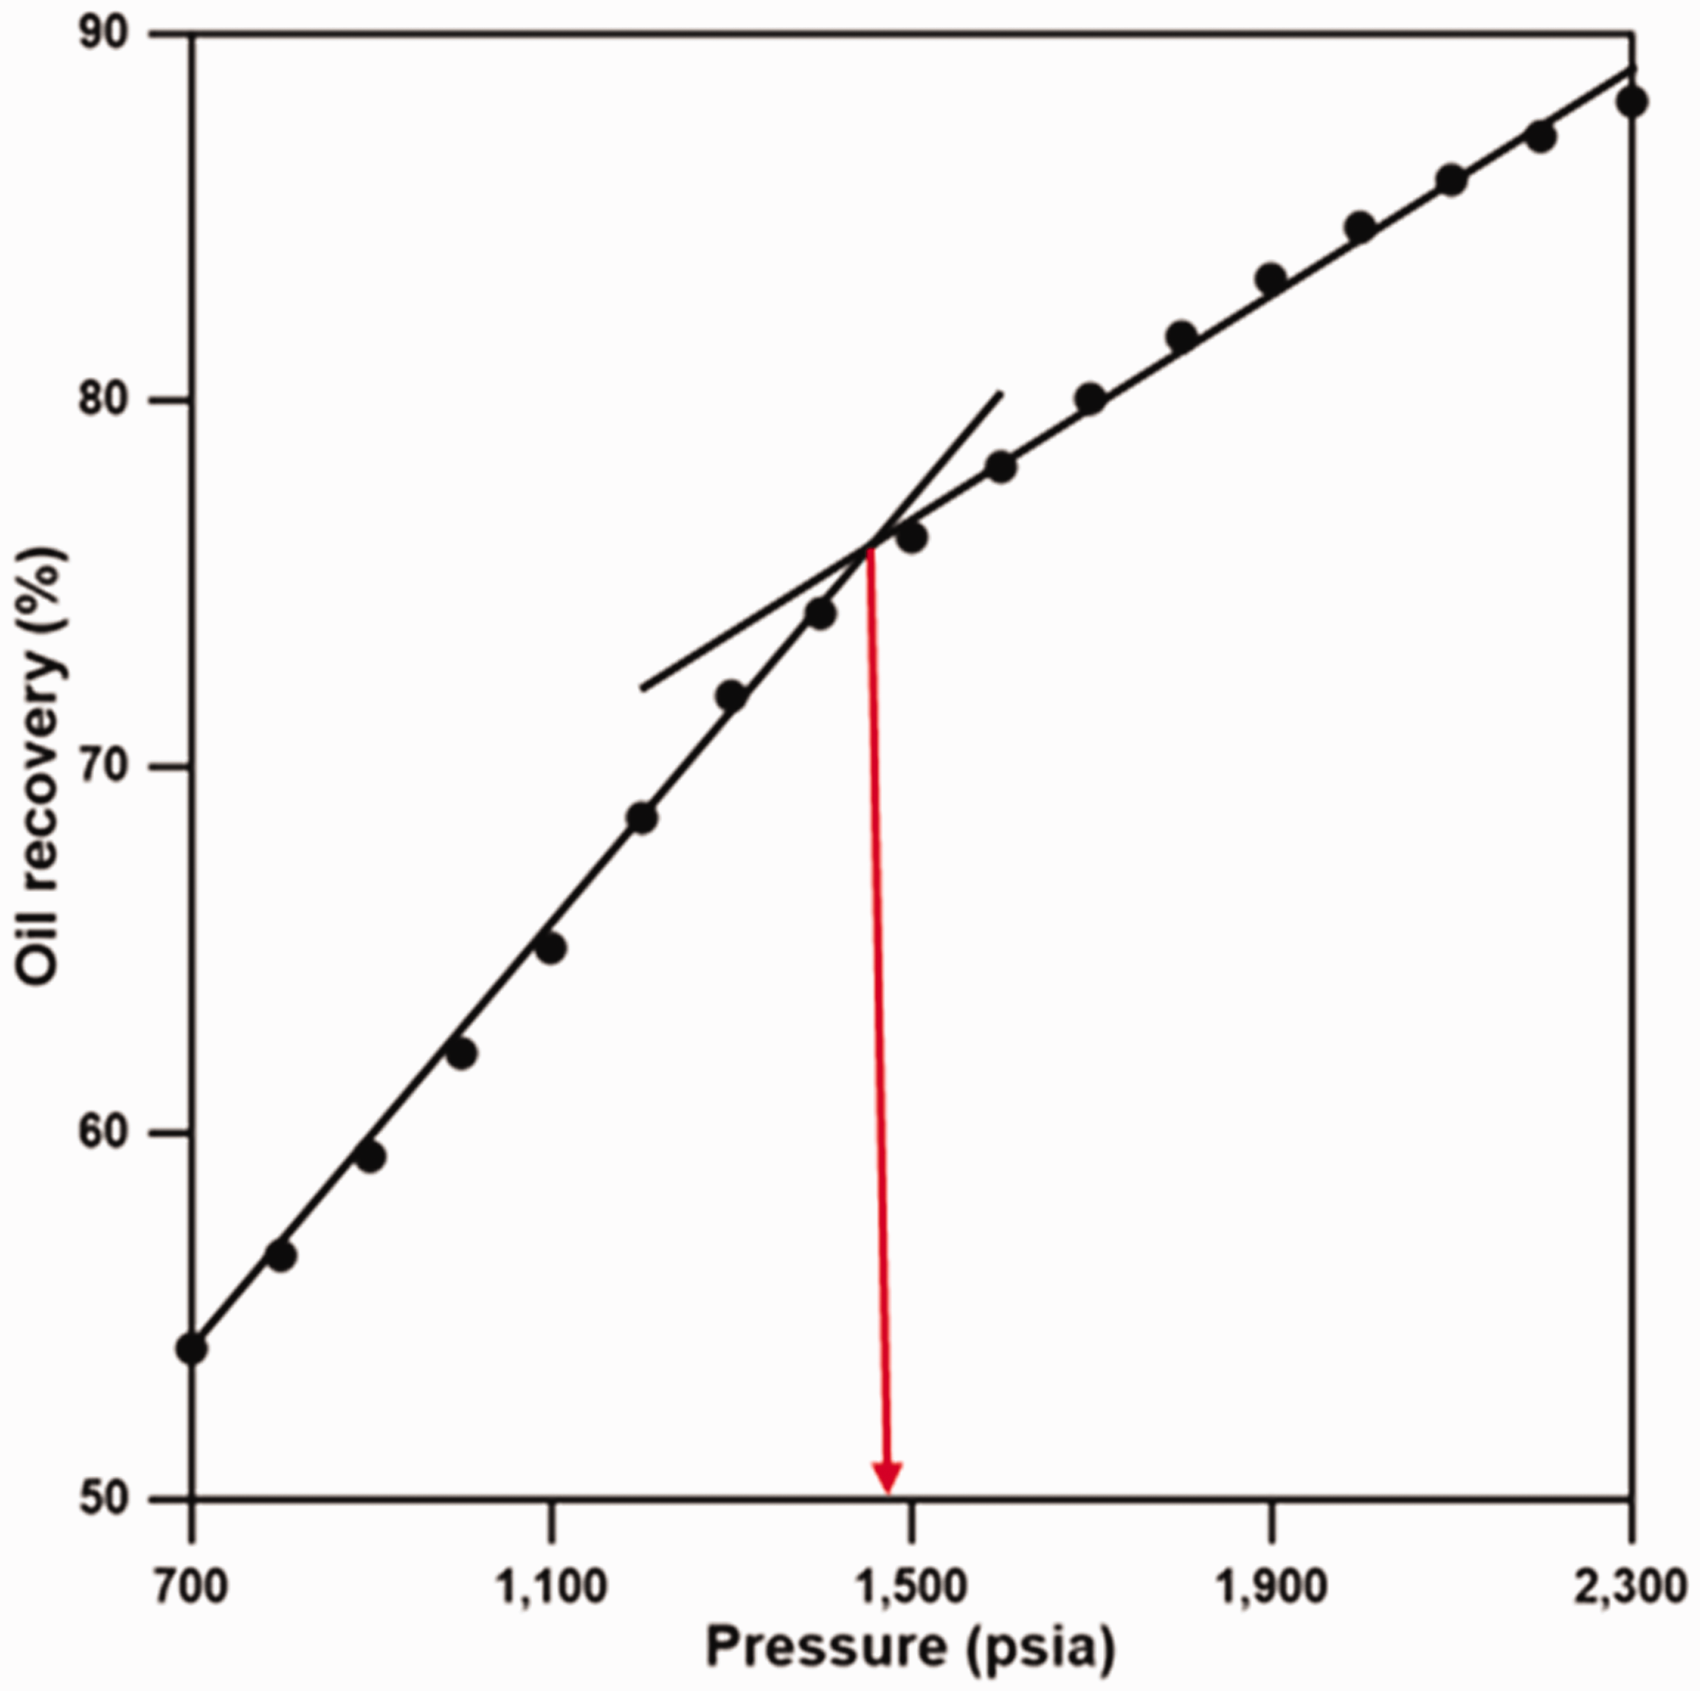
Results of MMP measurements using a slim-tube simulation.
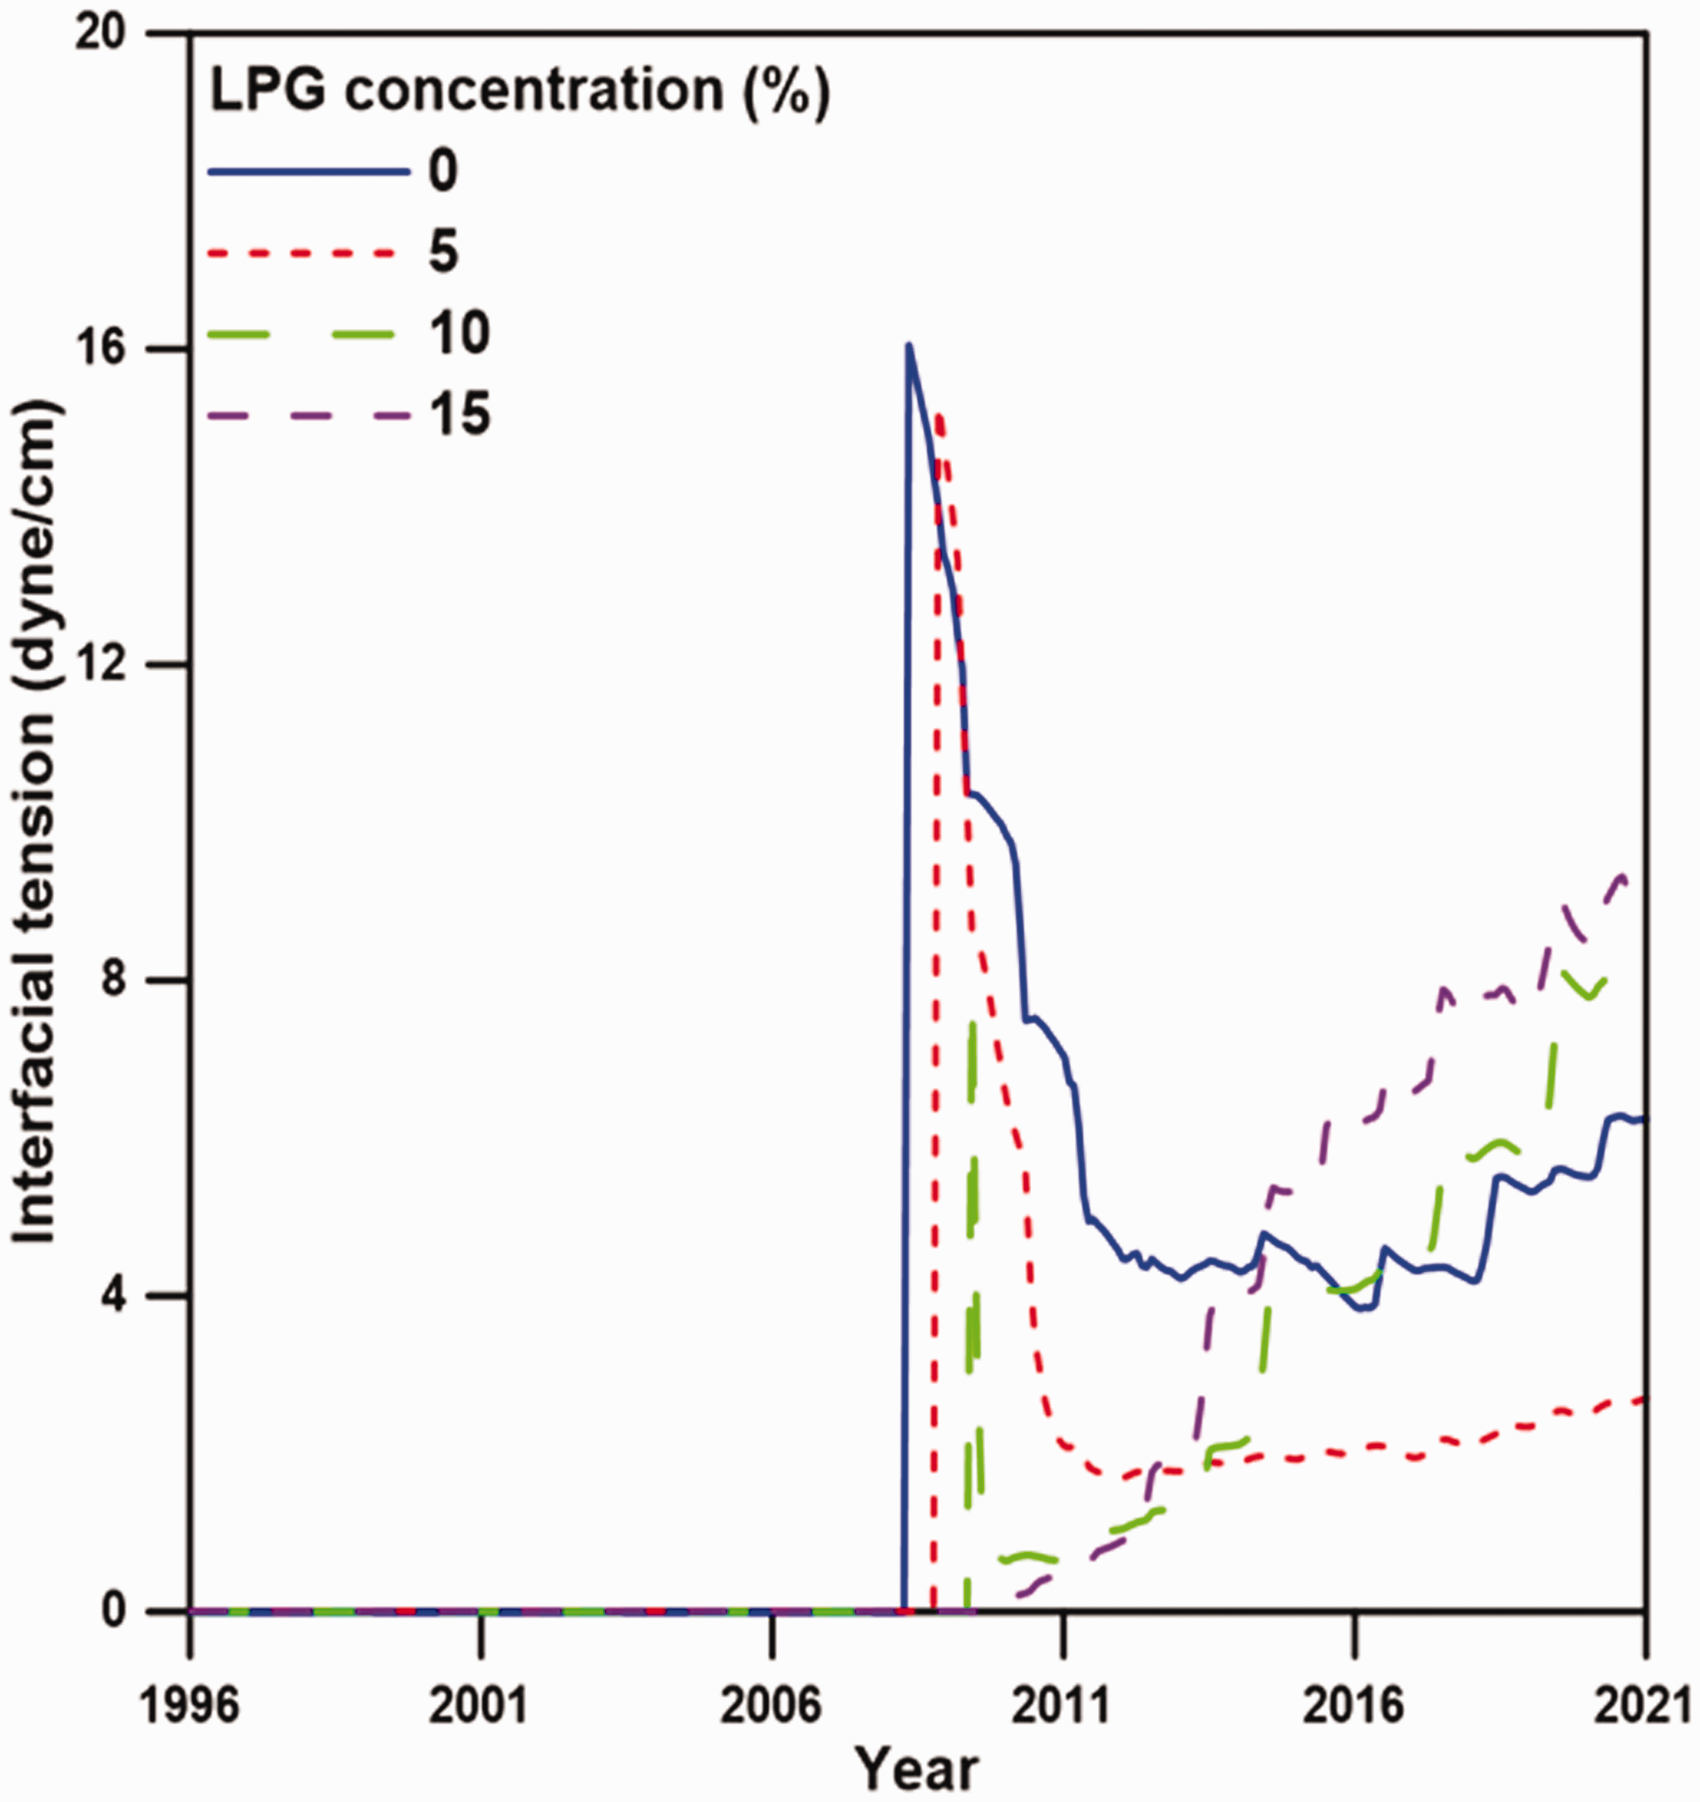
IFT changes at the CO2-swept zone with LPG addition into the injection gas.
Viscosity reduction is one of the major mechanisms of CO2-EOR. With increasing addition of LPG to injection gas, oil viscosity decreased. Figure 6 shows viscosity changes for cases with LPG fractions of 0, 5, 10, and 15% at the CO2 swept zone. Oil viscosity remained constant at the earlier stage since no gas flow had arrived. Once the gas reached this point, oil viscosity decreased to the minimum. The case of 15% LPG had the lowest oil viscosity of 0.08 cp, while the case of 0% LPG mole faction had a value of 0.14 cp. After this reduction, oil viscosity started to increase due to influx of heavy fractions. The lowest IFT and viscosity values at this location are listed in Table 4.
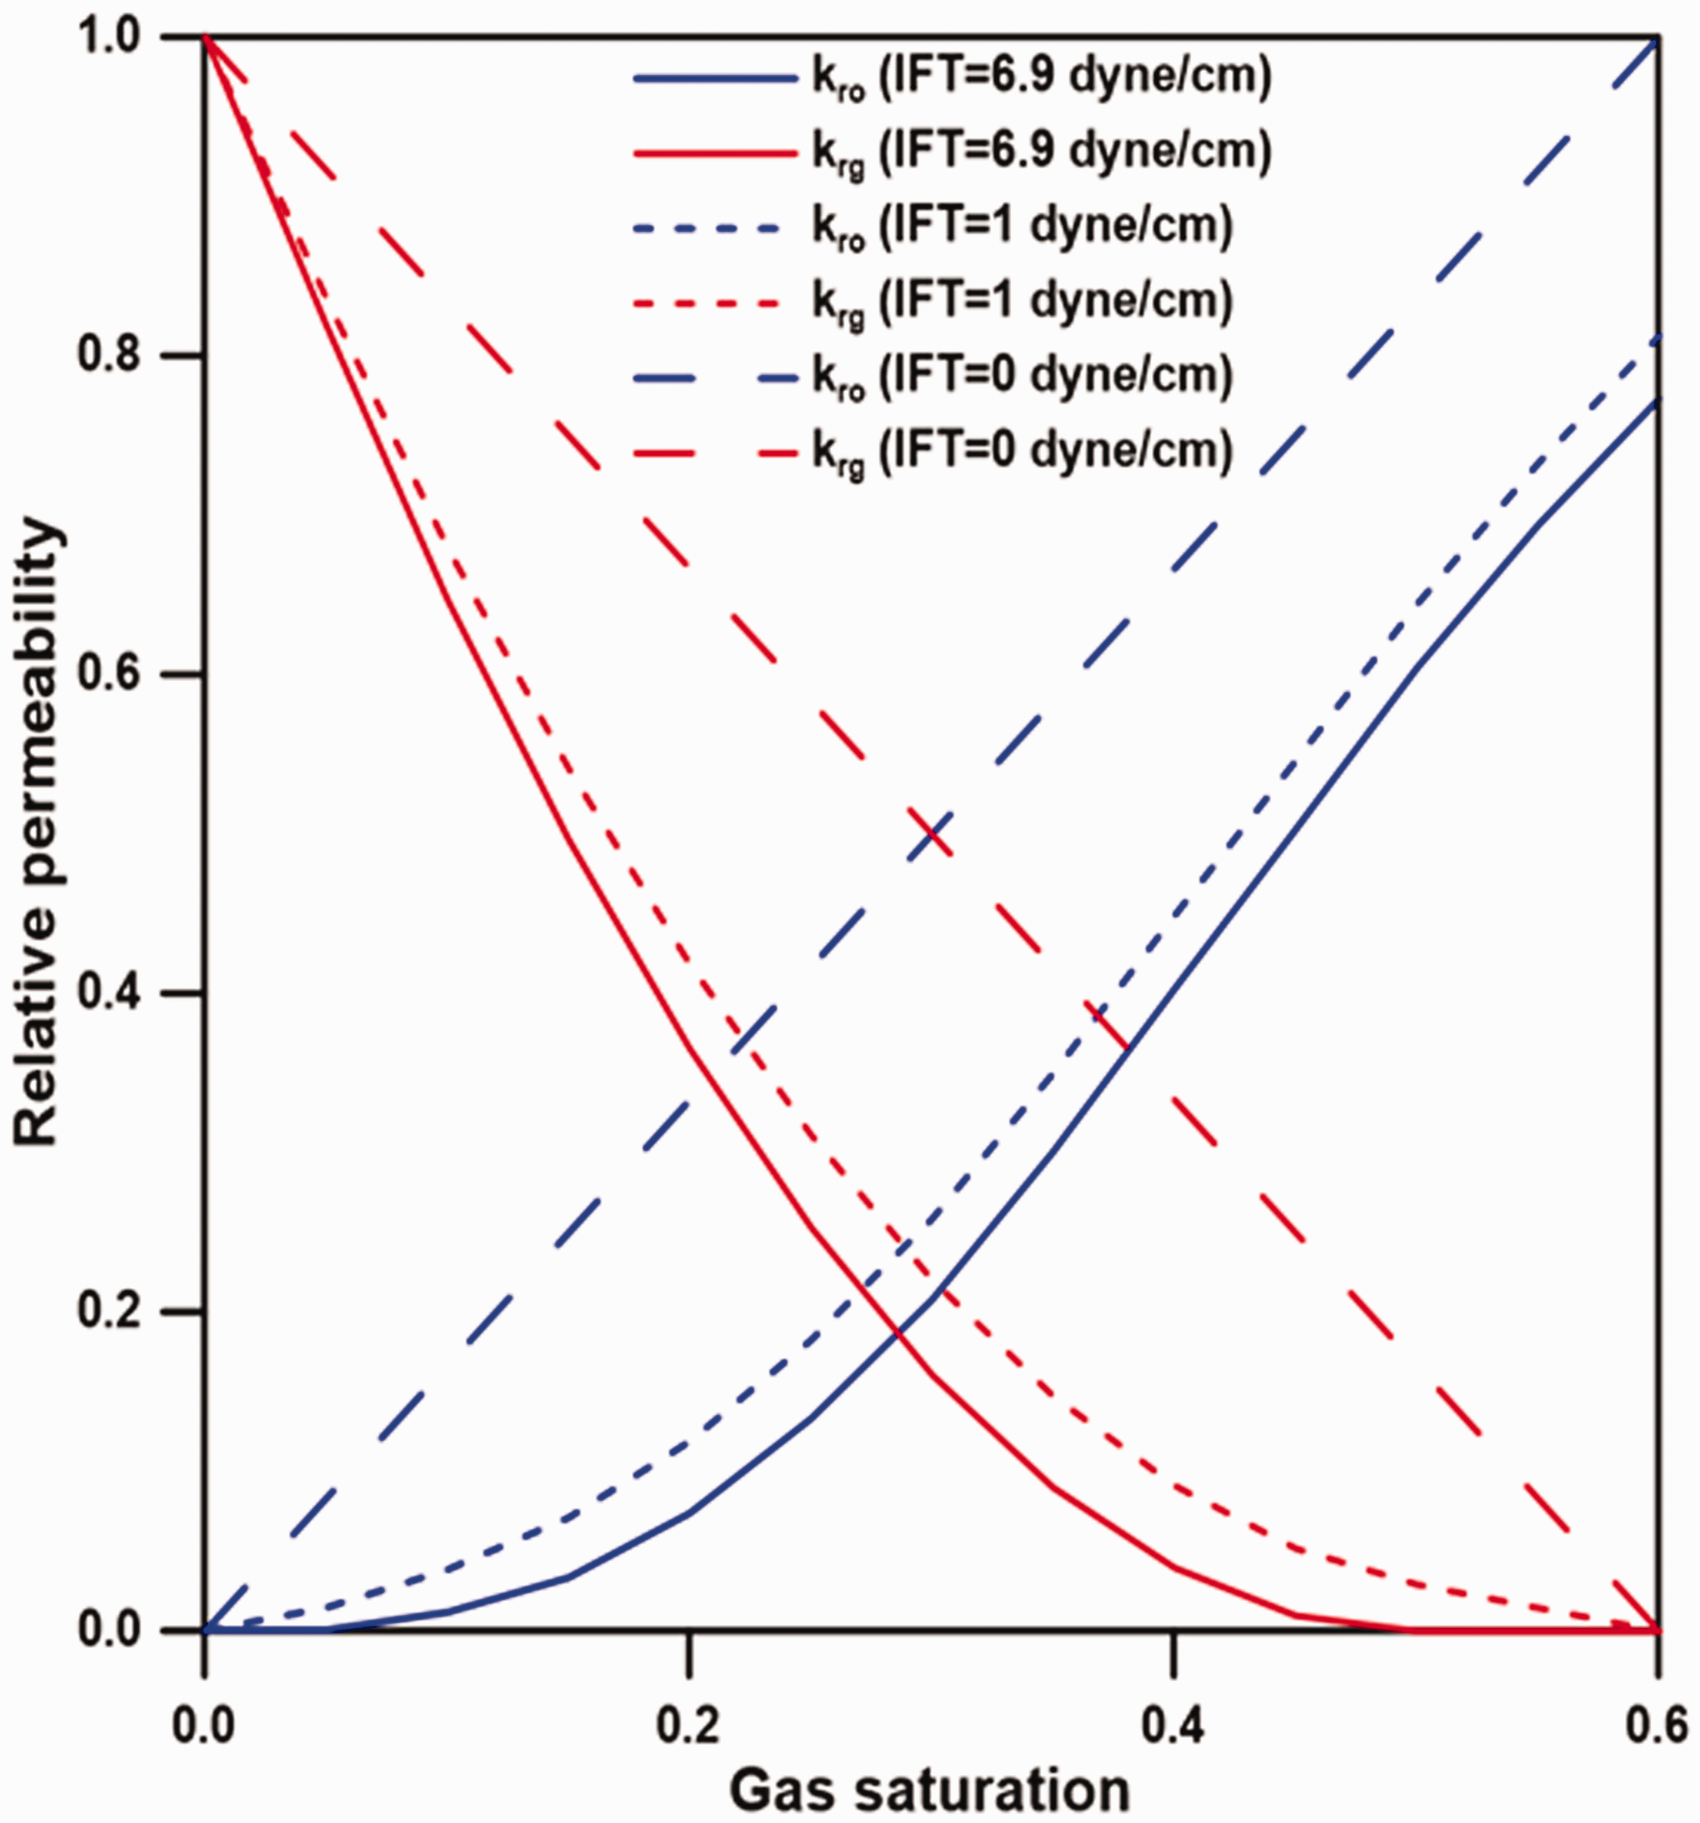
Gradual transition of relative permeability curves due to decreased IFT.
Lowest IFT and oil viscosity values at the CO2 swept zone depending on LPG addition.
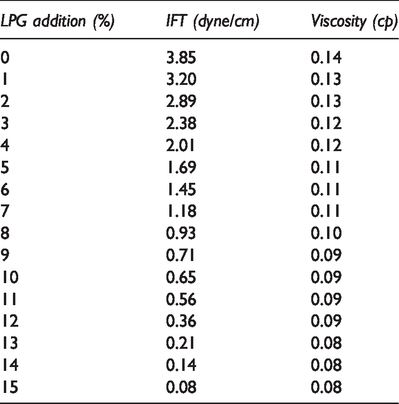
Figure 7 shows the oil recovery factor of every case. Increased addition of LPG injection led to higher miscibility and lower viscosity and IFT, which resulted in higher oil recovery. Since producer BHPs were fixed for every case, oil recovery factor curves showed an increasing tendency with the addition of LPG. The case of 14% LPG injection produced 15% more oil than the 0% LPG injection case.
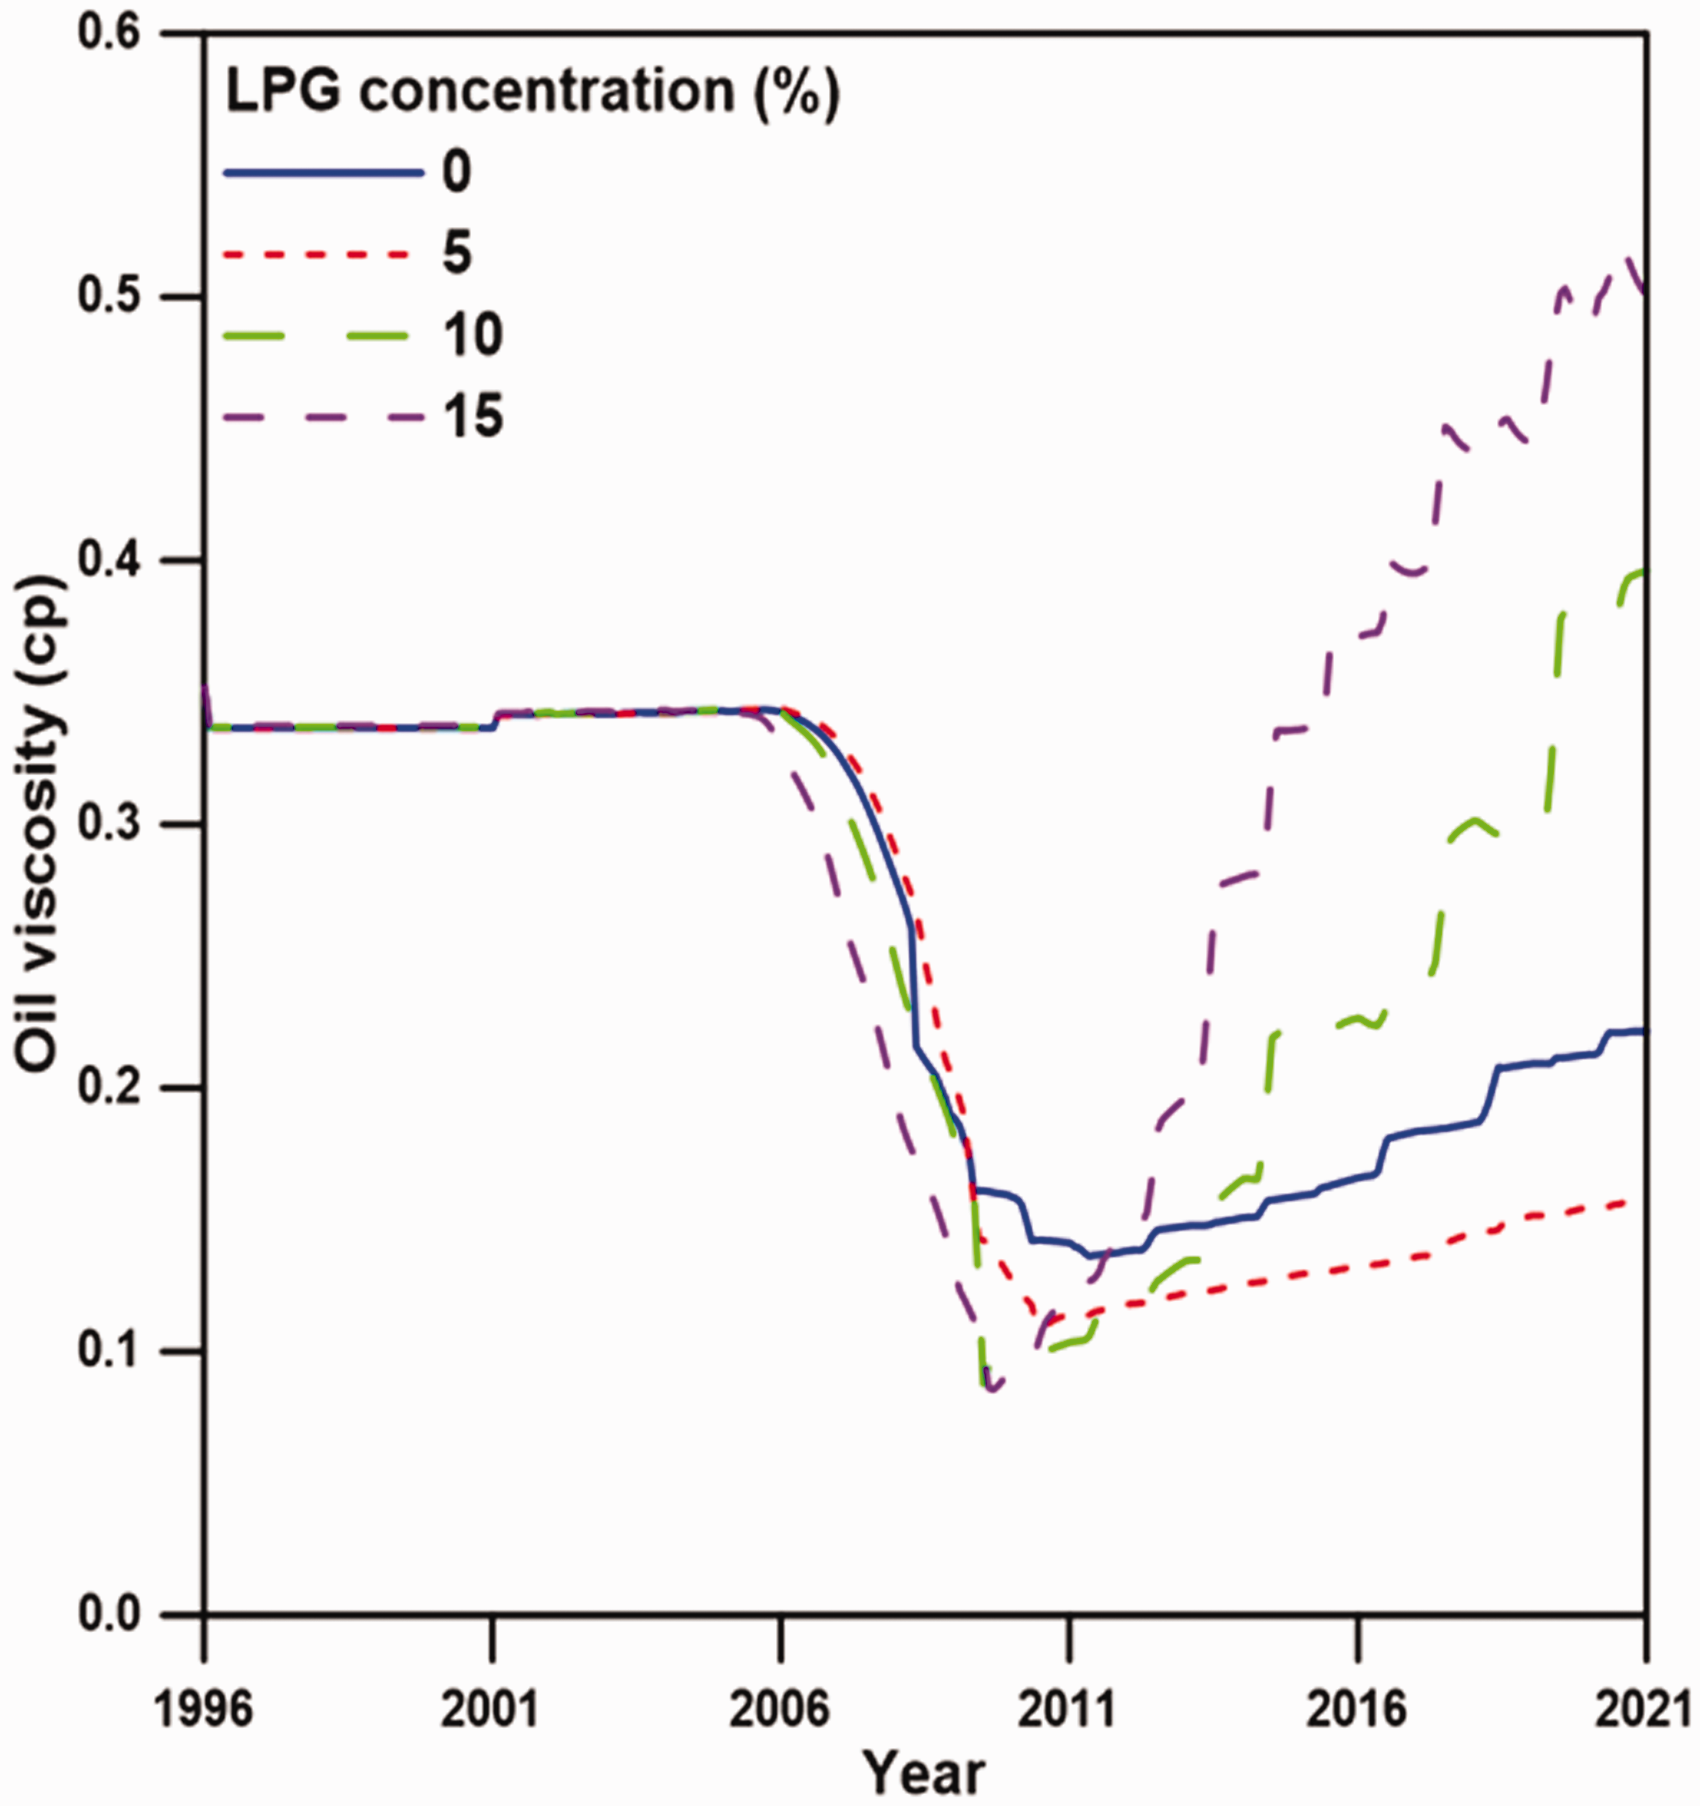
Oil viscosity changes at the CO2-swept zone with LPG concentration in the injection gas.
CO2 sequestration
Figure 8 shows the amount of sequestrated CO2 at the last moment as a function of LPG mole fraction, showing a different tendency than the pressure-controlled CCS–EOR cases. Since the producer bottom hole pressure was fixed, earlier breakthrough, which caused major differences in sequestered CO2 in pressure-controlled miscibility adjustment cases, had minor effects on these cases. However, the greater was the miscibility, the greater was the mixing of gaseous CO2, which had the potential to be trapped by trapping mechanisms, with oil.
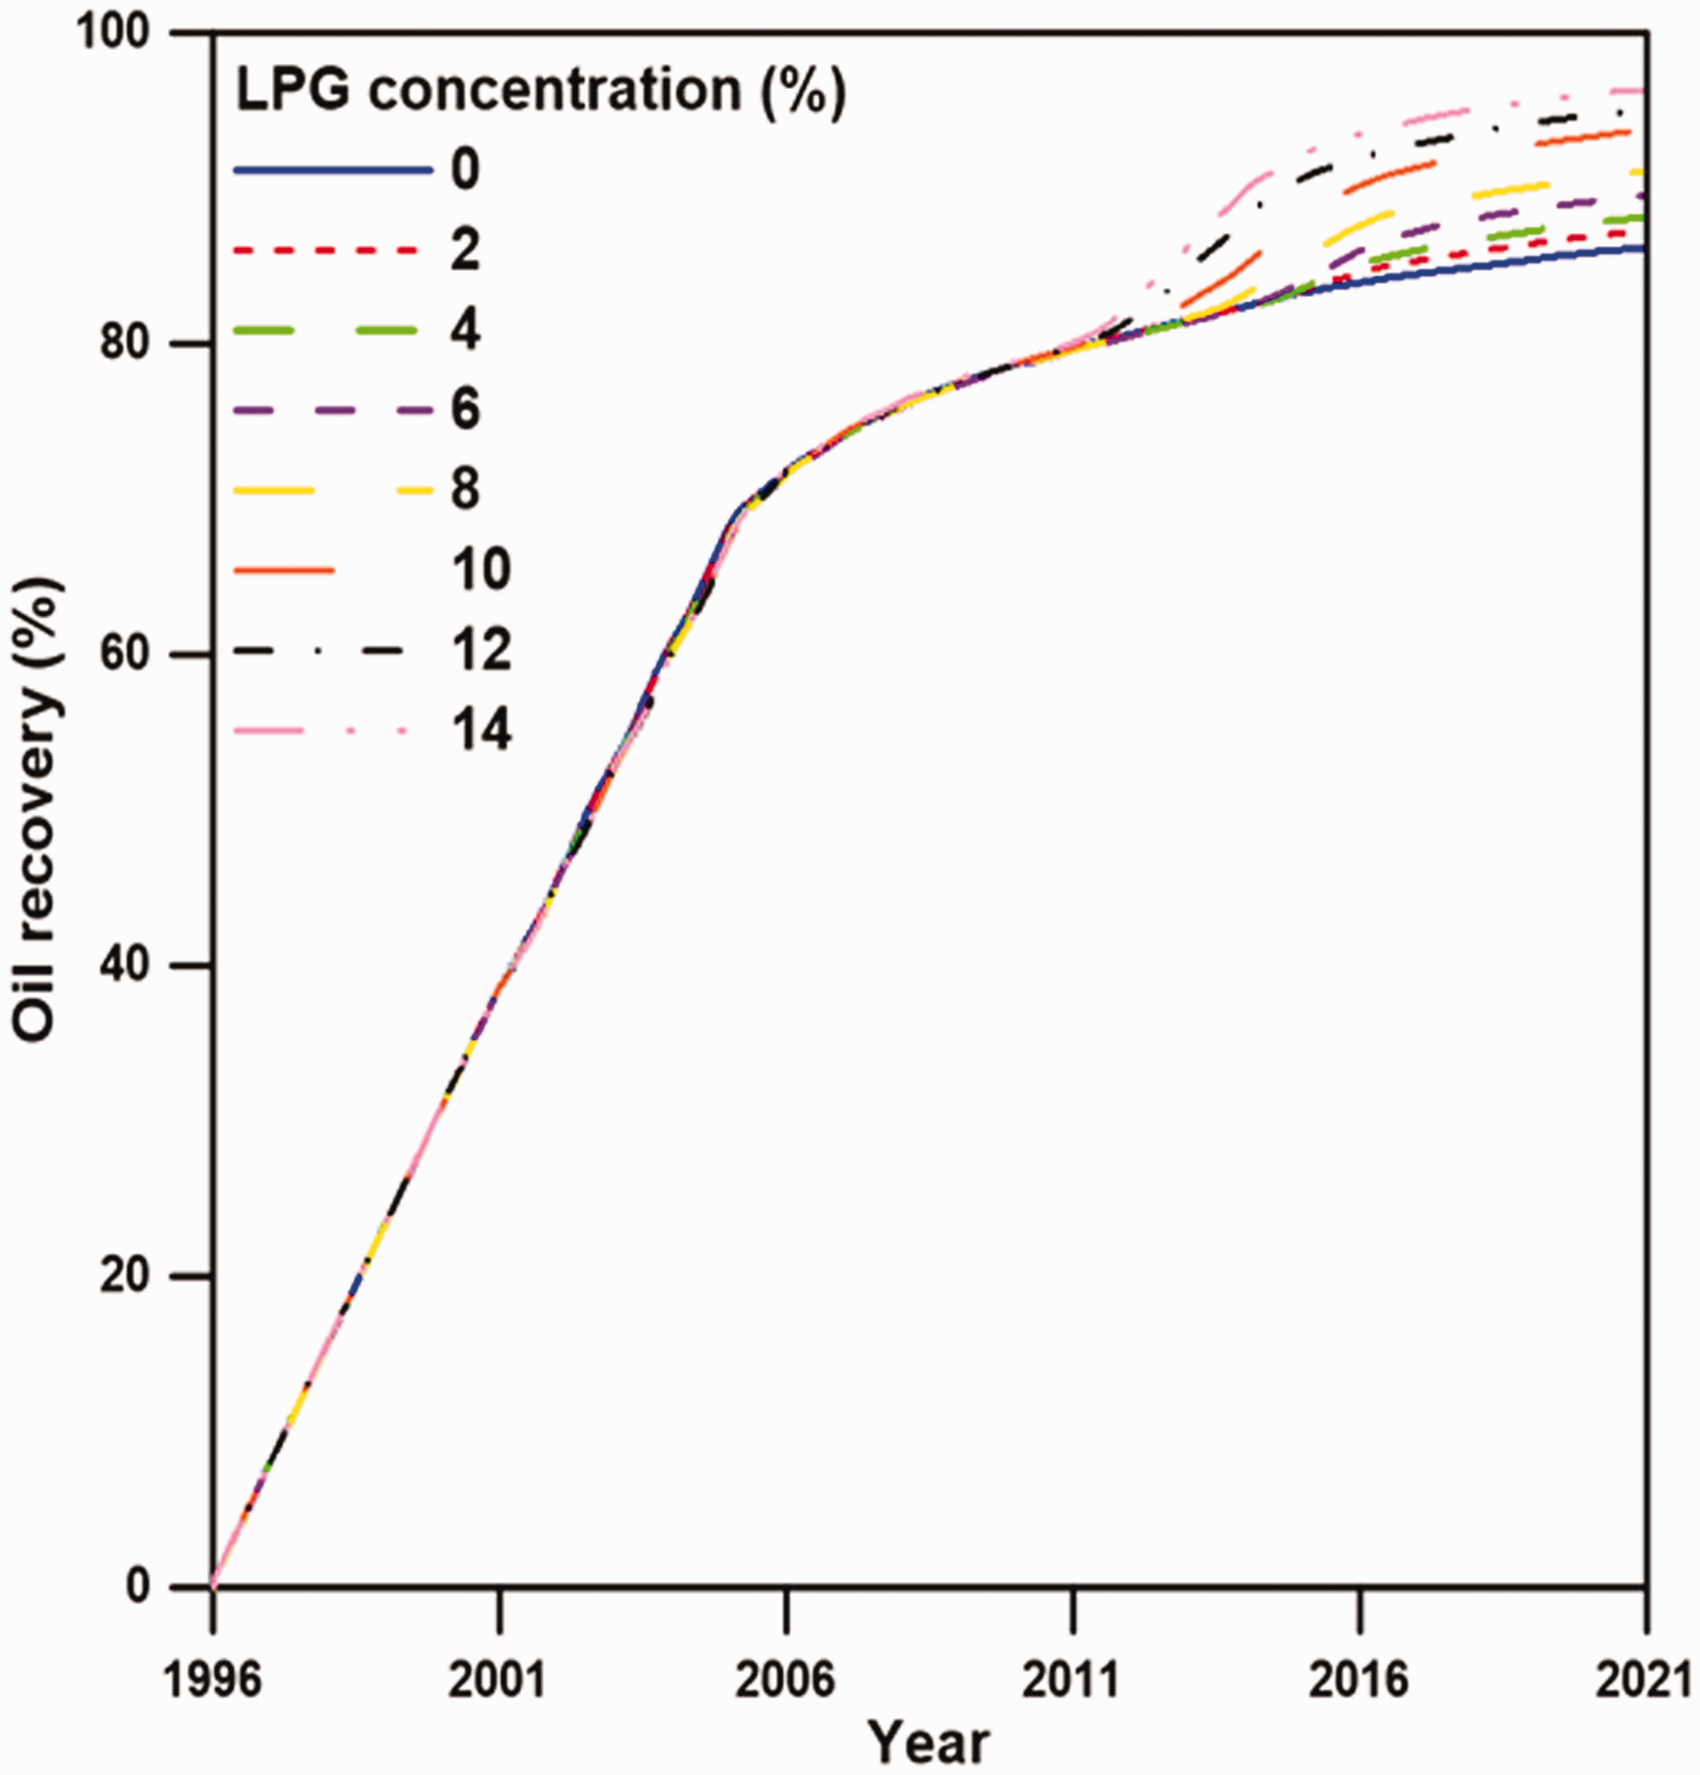
Oil recovery with LPG concentration in the injection gas.
Amount of dissolved CO2 into water had a decreasing tendency as miscibility increased since the fugacity of gaseous CO2, which acts as a major parameter in Henry’s law, decreased. Residually trapped CO2 was primarily dependent on saturation of gaseous CO2. However, the amount of gaseous CO2 was reduced, resulting in reduction of residually trapped CO2.
NPV calculation
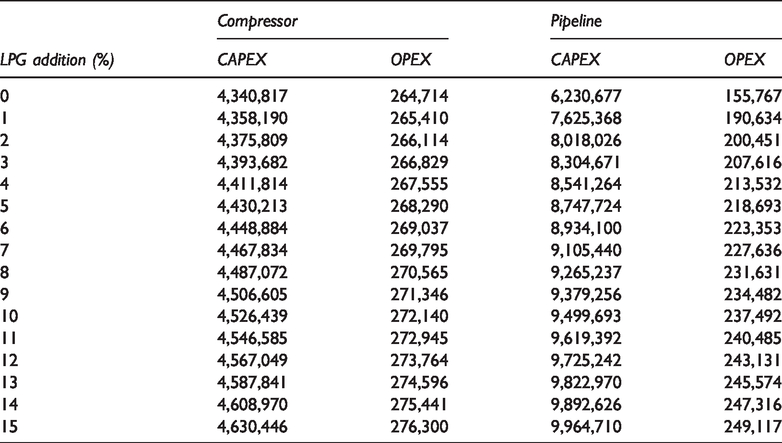
Propane and butane prices were assumed to be $507.324 and $462.05/ton, respectively (OPIS, 2017). Since LPG was very expensive compared to CO2, produced LPG was recycled by separation in a separator, transportation to a compression site, transportation back to a reservoir, and re-injection. Pipeline to transport LPG from reservoir to compression site was constructed and considered in NPV calculation as CAPEX and OPEX. In compression, the adiabatic gas exponent of LPG was determined to be 1.28, which was the same as that of CO2. Also, the discount rate is 2.3% (Advanced Resources International, 2006). Table 5 shows the CAPEX and OPEX of every case. Since WHPs of gas injectors in every case were around 1100 psia, a pump was not installed. As mole fraction of LPG increased, injection mass rate increased, which led to increase in CAPEX and OPEX.
Cost of infrastructure in cases with increasing LPG addition into the injection gas ($).
Purchase of additional butane was not needed until 7% LPG mole fraction. Cases with LPG composition of 8% or more needed additional butane since the amount of injected butane exceeded the produced butane. Likewise, additional propane was needed in cases with LPG composition of 13% or more.
Figure 9 shows NPV as a function of mole fraction and of immiscible, near miscible, and miscible cases. Oil recovery increased and NPV decreased from LPG mole fractions of 0–2% since compression cost increased due to the higher mass flow rate and addition of a pipeline. From LPG mole fractions of 2–13%, NPV increased considerably due to the miscibility effect. NPV started to decrease from 13 to 15% since the purchasing and injecting prices of required LPG exceeded the price of oil produced. As a result, the highest NPV had the value of $90,572,302 when 13% of LPG is added.
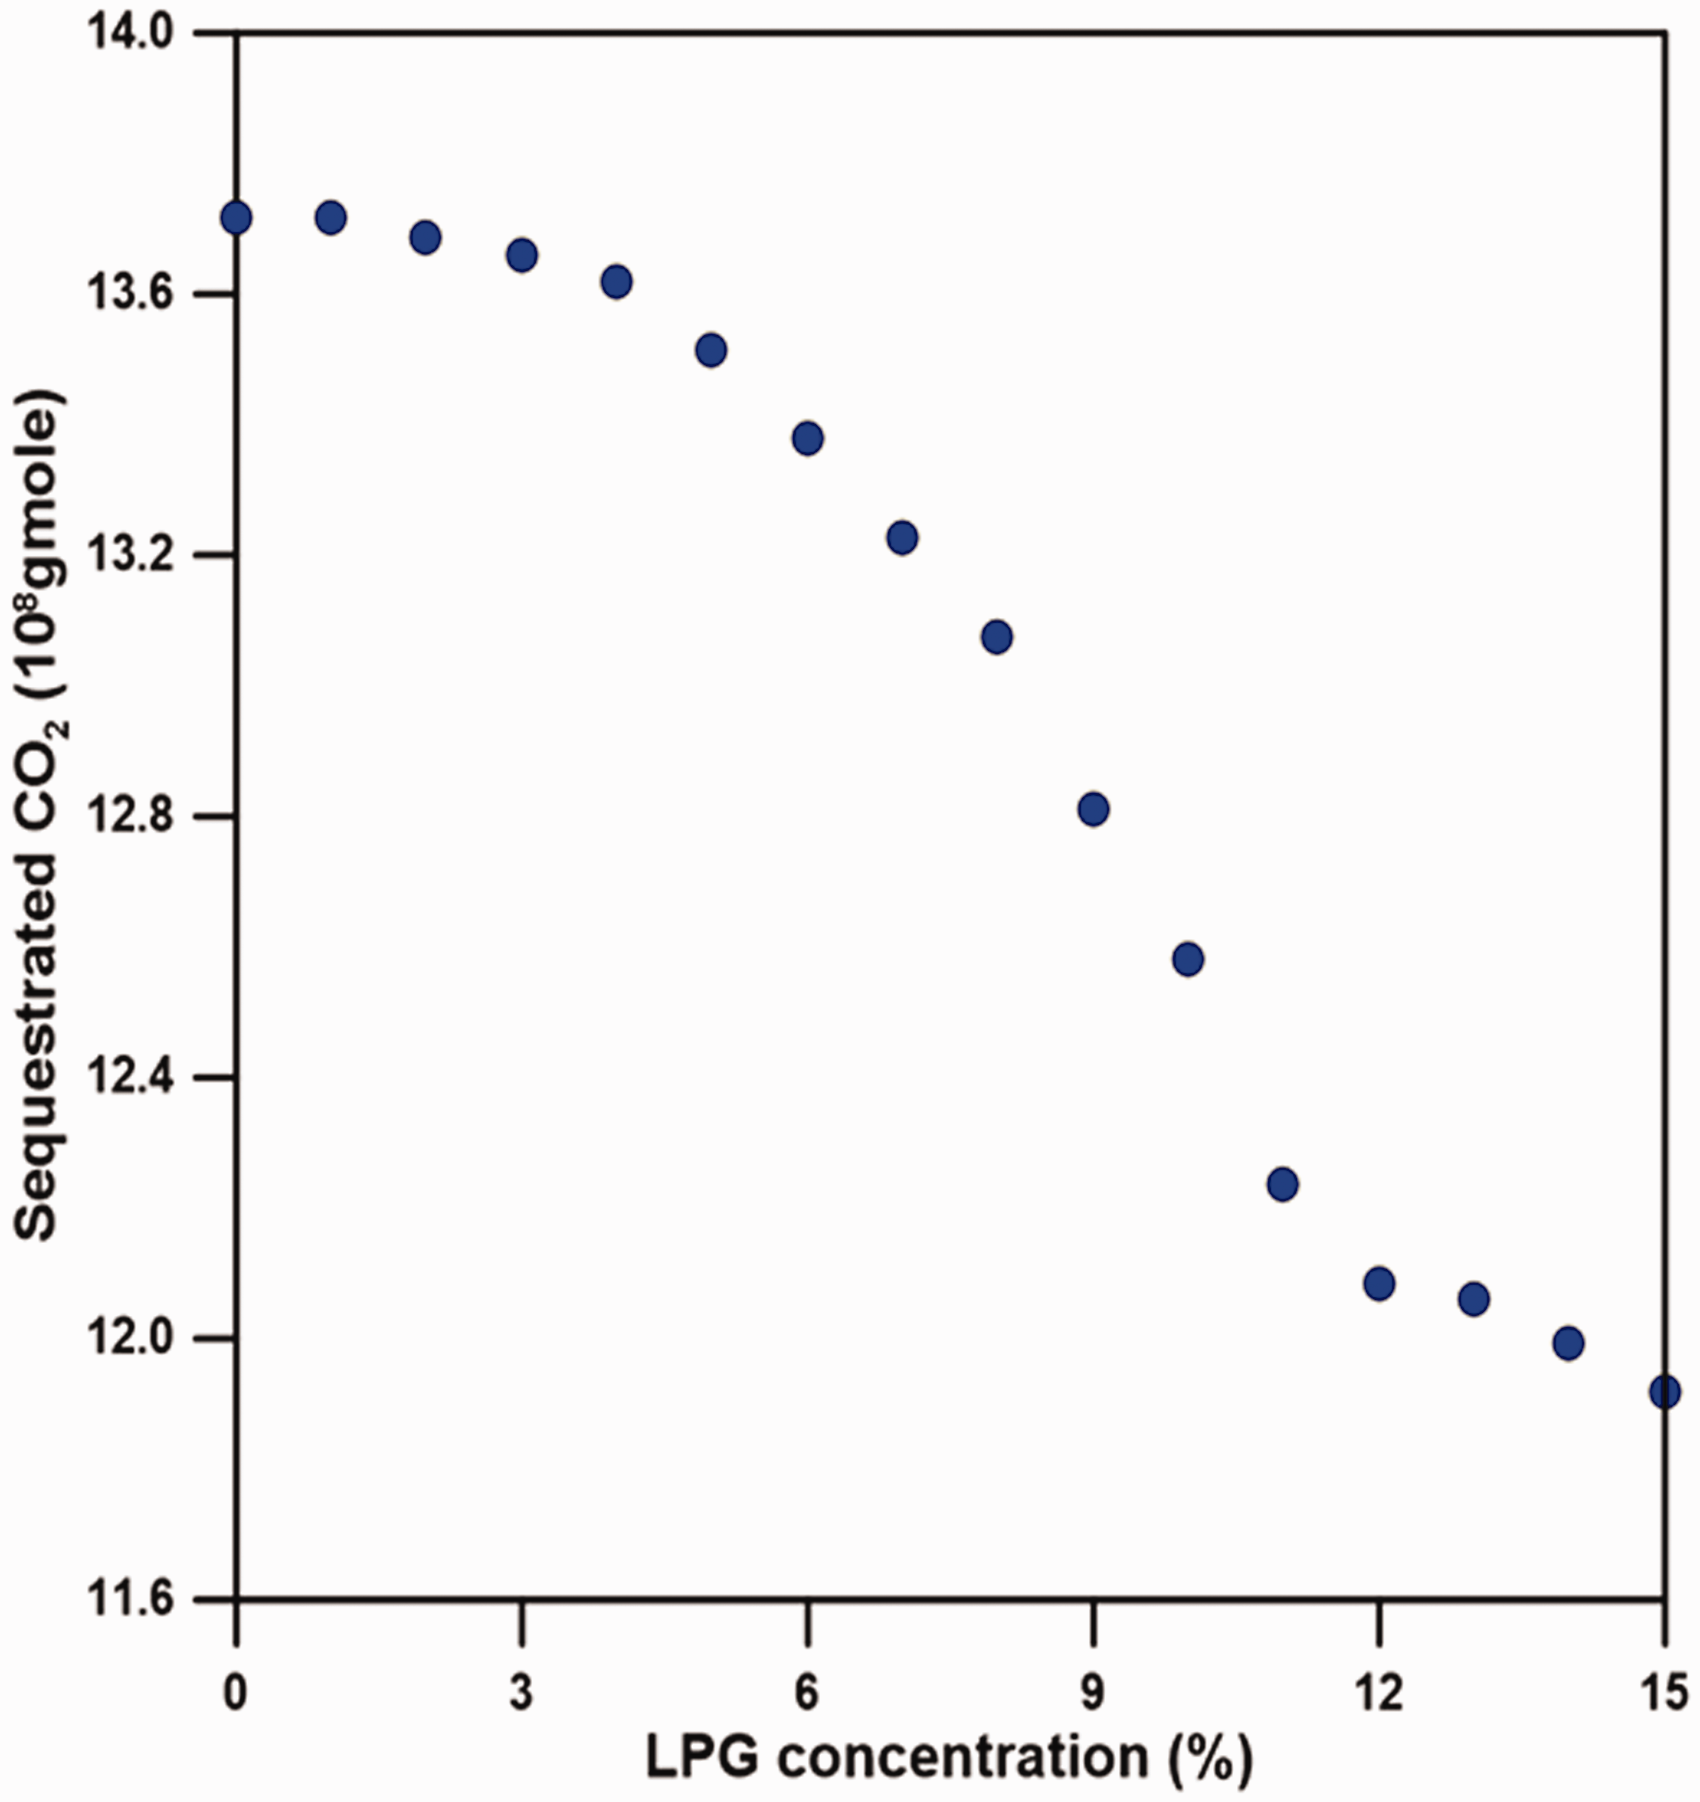
Amount of sequestrated CO2 as a function of LPG concentration.
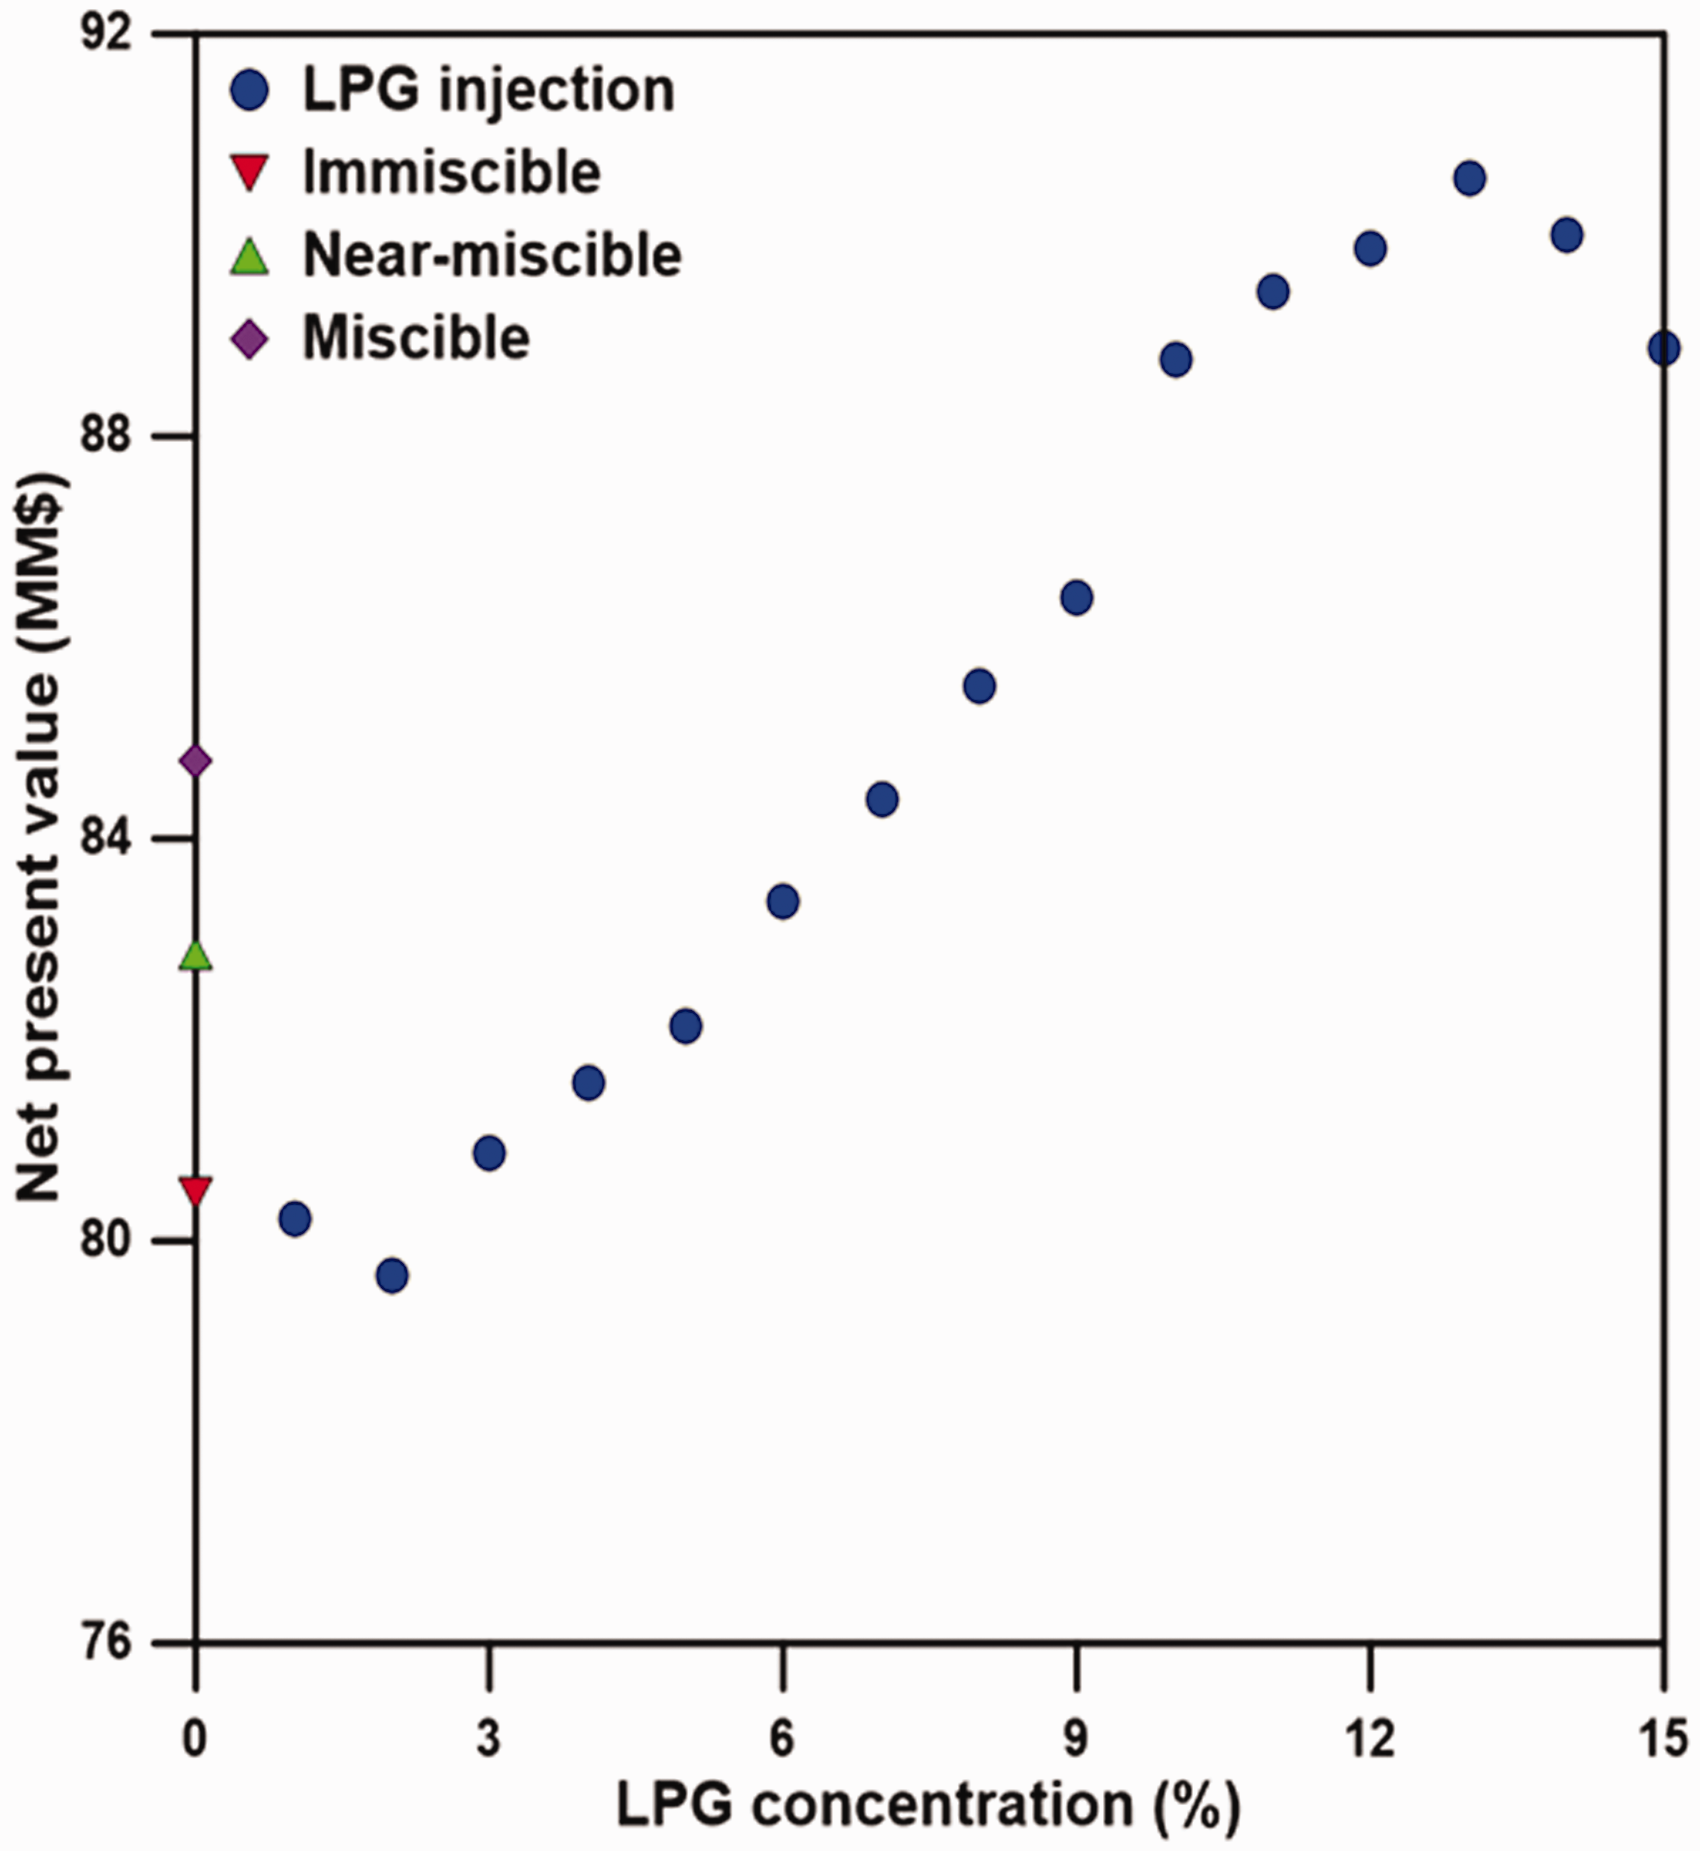
NPV as a function of LPG concentration.
Conclusions
Comprehensive CCS–EOR models were developed and analyzed to evaluate economic feasibility. Additional oil was produced by IFT, viscosity reduction, and relative permeability change, while CO2 was sequestrated through solubility trapping, residual trapping, and free CO2. Economic evaluations were performed considering revenues and costs.
Immiscible, near miscible, and miscible cases were characterized through the addition of LPG. Further reduction of IFT and oil viscosity resulted in higher oil recovery with LPG. Since a larger amount of CO2 was mixed with oil by LPG addition, eventually producing a mixture with oil, a smaller amount of CO2 was sequestrated. Cases of 1–2% LPG addition had a lower NPV than 0% (immiscible case), since costs from the additional infrastructure for LPG injection exceeded additional revenue. However, LPG addition of 3–13% showed gradually increased NPV, with a maximum of 91 MM$. Finally, NPVs from LPG addition of 14–15% decreased due to costs exceeding revenues.
In this study, integrated CCS–EOR models based on economic analysis have been developed and applied for various operating conditions. It overcomes the limitations of previous studies that have not considered the effect of miscibility on economic feasibility of CCS–EOR. The developed model can be extended for the optimum field application with the optimization of various operating factors such as WAG ratio, injection scheme, and LPG composition.
Footnotes
Declaration of conflicting interests
The author(s) declared no potential conflicts of interest with respect to the research, authorship, and/or publication of this article.
Funding
The author(s) disclosed receipt of the following financial support for the research, authorship, and/or publication of this article: Dr Jinhyung Cho was partially supported by the National Research Foundation of Korea (NRF) (Grant No. 2019R1C1C1002574) and Korea Gas Corporation (KOGAS).