
Abstract
A considerable amount of oil contamination is caused by the presence of the trailing oil. This paper aims to simulate and analyze the influences of trailing oil on the quality of oil products in undulating sections. By studying the formation mechanism of mixed oil at inclining pipeline sections and the influences of velocity and oil batches on incline sections, as well as both ups and downs, the correlation is obtained between replacement time of different batches and velocity at various sections. By applying FLUENT 14.5, the maximum time of volume fraction of contaminant oil from 1% to 99% is simulated at cross-sections among different pipeline sections. Aiming at the relationship between oil product replacement time and change time of mixing section volume fraction and flow velocity, the mixing increment of undulating section relative to straight section is obtained. Combining with the empirical mixing length calculation equation, the equation for calculating mixing length considering terrain undulation is obtained. Combined with the actual operation data of Lan-Chengyu’s product oil pipeline, the error of the new mixed oil length calculation equation and actual oil mixing is 0.7966%. Excessive cutting amount of mixed oil will result in the waste of refined oil, and the less cutting amount will cause pollution of refined oil. The new mixed oil length calculation equation can more accurately guide the oil mixing cutting work at the oil station.
Introduction
According to the difference of oil qualities between two batches in product oil pipelines, the contaminant oil is formed, of which the latter one is referred to as trailing oil. Mass transfer of the sub-laminar layer could be restricted by oil viscosity of different batches, thus causing the velocity gradients variation, which would, in turn, faster the formation of contaminant oil. During batch transportation, the boundary layer of former oil gradually infiltrates into the later one, and the trailing oil would be formed.
Due to the difference of density, when the lighter oil of low density replaces the heavier one, the oil may remain on the surface of a heavier oil. Especially in undulated pipelines, heavy oil might be deposited at a low point, where the trailing oil is in existence, and the replacement of heavy oil by light oil would aggravate the formation of contaminant oil. Meanwhile, in hilly areas, when heavy oil replaces light oil in downward sections or when the light one replaces heavy one in upward sections, due to the influence of gravity and connective diffusion, the contaminant oil would enormously form. Figure 1 shows the topographic map of a section of the Lanzhou-Chengdu-Chongqing pipeline.
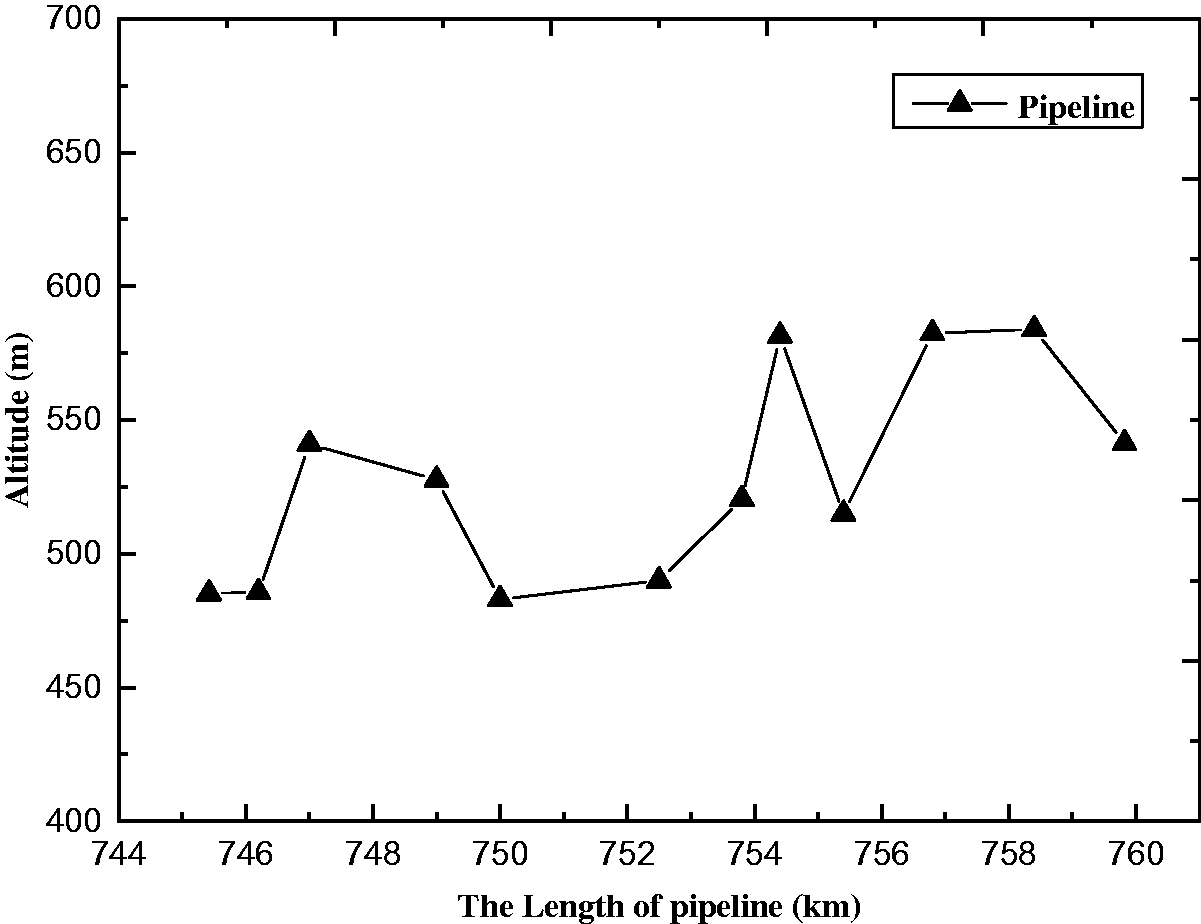
Topographic map of a section of Lanzhou-Chengdu-Chongqing pipeline.
Taylor (1953) found that when mixed oil flows slowly through a tube with a small diameter, it could spread through the cross-section due to the molecular diffusion and velocity variation. Taylor pointed out that the change of velocity is crucial during the mass axial diffusion, and it could be calculated by Fike’s model. Krantz and Wasan (1974) modified Taylor’s method and found that axial dispersion would be more intense when the velocity is close to laminar flow at the straight pipeline sections. Moreover, the roughness of the pipeline would also contribute to the axial dispersion. Austin and Palfrey (1963) also pointed out Taylor’s model might indicate a slight error in accordance with trailing oil at high Reynold number. Besides, they found that the turbulence model at low Reynold number ignores the influence of viscosity close to the wall and came up with an equation to calculate the length of the mixed oil interface. Scott and Dullien (1962) found out that diffusive transfer is the main cause of mixed oil by tremendous experiments. Rachid et al. (2002a, 2002b) predicted the mixing volume between batches by combining the diameter of the pipeline and time and came up with a more practical axial diffusion index. Wang et al. (2009) conducted both thermal and hydraulic simulation of batch pipelines and described the thermal and hydraulic model under the unsteady state. Menter and Egorov (2010) described the turbulence mechanism in pipeline flow simulation based on the scale adaptive simulation method. Liang and Xin (2015) optimized the batch transportation scheme in order to reduce the amount of mixed oil under the conditions of different transportation sequence, gravity, and temperature of western pipelines, and simulated the subsequent oil product concentration and the subsequent changes of oil products in different sections. Li et al. (2017) tended to reduce contaminant oil and relevant cost based on dynamic volume fraction. Wang and Wang (2019) studied the influence of elbow pipe during batch transportation. It could be seen from the above researches that viscosity is the main cause of the formation of trailing oil; however, their researches only focus on the trunk lines, without considering dead oil area in auxiliary valve rooms, as well as the influence of dead oil.
Therefore, Patrachari and Johannes (2012) and Botros et al. (2016) studied dead oil at dead-leg sections; however, their model could be modified by considering the contamination of trailing oil at dead-legs. Sunagatullin et al. (2019) studied the quality evaluation of light oil products in pipelines and determined the indicators. Li et al. (2019) established a mixed oil film diffusion model based on the smooth particle hydrodynamics method. The oil film diffusion process was simulated, and the effects of the oil viscosity coefficient and particle density on oil film diffusion were analyzed. Zhang et al. (2019) used molecular dynamics simulation methods to study the concentration distribution of different components, the orientation of oil molecules at the interface, the morphology of the oil–water interface, and the diffusion behavior of water molecules. Based on Fick’s diffusion law, He et al. (2019) considered the physical properties of oil products and the effects of turbulence and proposed a new model for calculating the diffusion coefficient. This model can better describe the phenomenon of tailing oil in the mixed segment. Liu et al. (2019b) research on the formation mechanism of trailing oil at dead-legs, which indicates approximately 6%–14% more contamination at dead sections. Liu et al. put forward a new contamination model, which proved to be accurate with on-site data. Nevertheless, their models did not consider the fluctuation of pipelines in hilly regions, especially the effects on trailing oil. At present, some scholars have proposed to use artificial intelligence to predict pipeline parameters (Liu et al., 2020a, 2020b; Lu et al., 2020; Qiao et al., 2019, 2020; Qiao and Yang, 2020).
Therefore, this paper would analyze the formation mechanism of trailing oil in both inclining and undulated pipelines. Based on computational fluid dynamics (CFD), the data of contamination at different velocities could be obtained. Then, multiple non-linear fitting with replacement time, the length of dead-legs and velocity is conducted, so as to obtain the length of trailing oil. Based on Liu et al.’s (2019b) contamination model, the model could be further modified to calculate the length of contaminant oil.
Methods and models
Equations (1) and (2) are the modified contamination models by Liu et al. (2019b), which consider the influence of dead-legs based on Austin’s (Austin, 1963; Neutrium, 2019) model.
When Reynolds number is beyond critical Reynolds number, the equation could be modified as (Liu et al., 2019b)

When Reynolds number is below the critical Reynolds number, the equation could be modified as (Liu et al., 2019b)

The critical Reynolds number is (Liu et al., 2019a)

After simulation and data analysis, Matlab is applied to fit multiple nonlinear functions with factors of replacement time, undulated sections and velocity, then the model could be further modified to calculate the length of mixed oil based on Liu’s model (Liu et al., 2019c; Su et al., 2019).
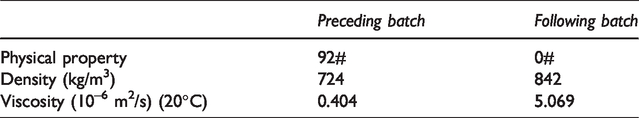
This paper simulates the contaminated oil during batch transportation of the Lan-Chengyu’s product oil pipeline. Based on the on-site production data, the main parameters are shown in Table 1.
Physical property parameters of oil.
Trailing oil is formed during batch transportation when the latter oil tries to replace the former oil adhered to the wall (Liu et al., 2019d; Peng et al., 2019a). Thus, the formation is greatly affected by the viscosity of the wall, especially at the laminar sub-layer (Zhang and Zhang, 2019), so that wall functions cannot be used to simulate in FLUENT, but to choose the near-wall model to calculate simulating wall. Therefore, the multi-phase model and hexahedral mesh are applied to generate the VOF model (Chen et al., 2020; Liu et al., 2019e; Peng et al., 2018).
The pipeline model in Figure 2 is built by FLUENT with a diameter of 508 mm to simulate the batch transportation at the concave section, where the latter oil is replacing the former one. Figure 2 shows the schematic diagram of the concave pipeline.
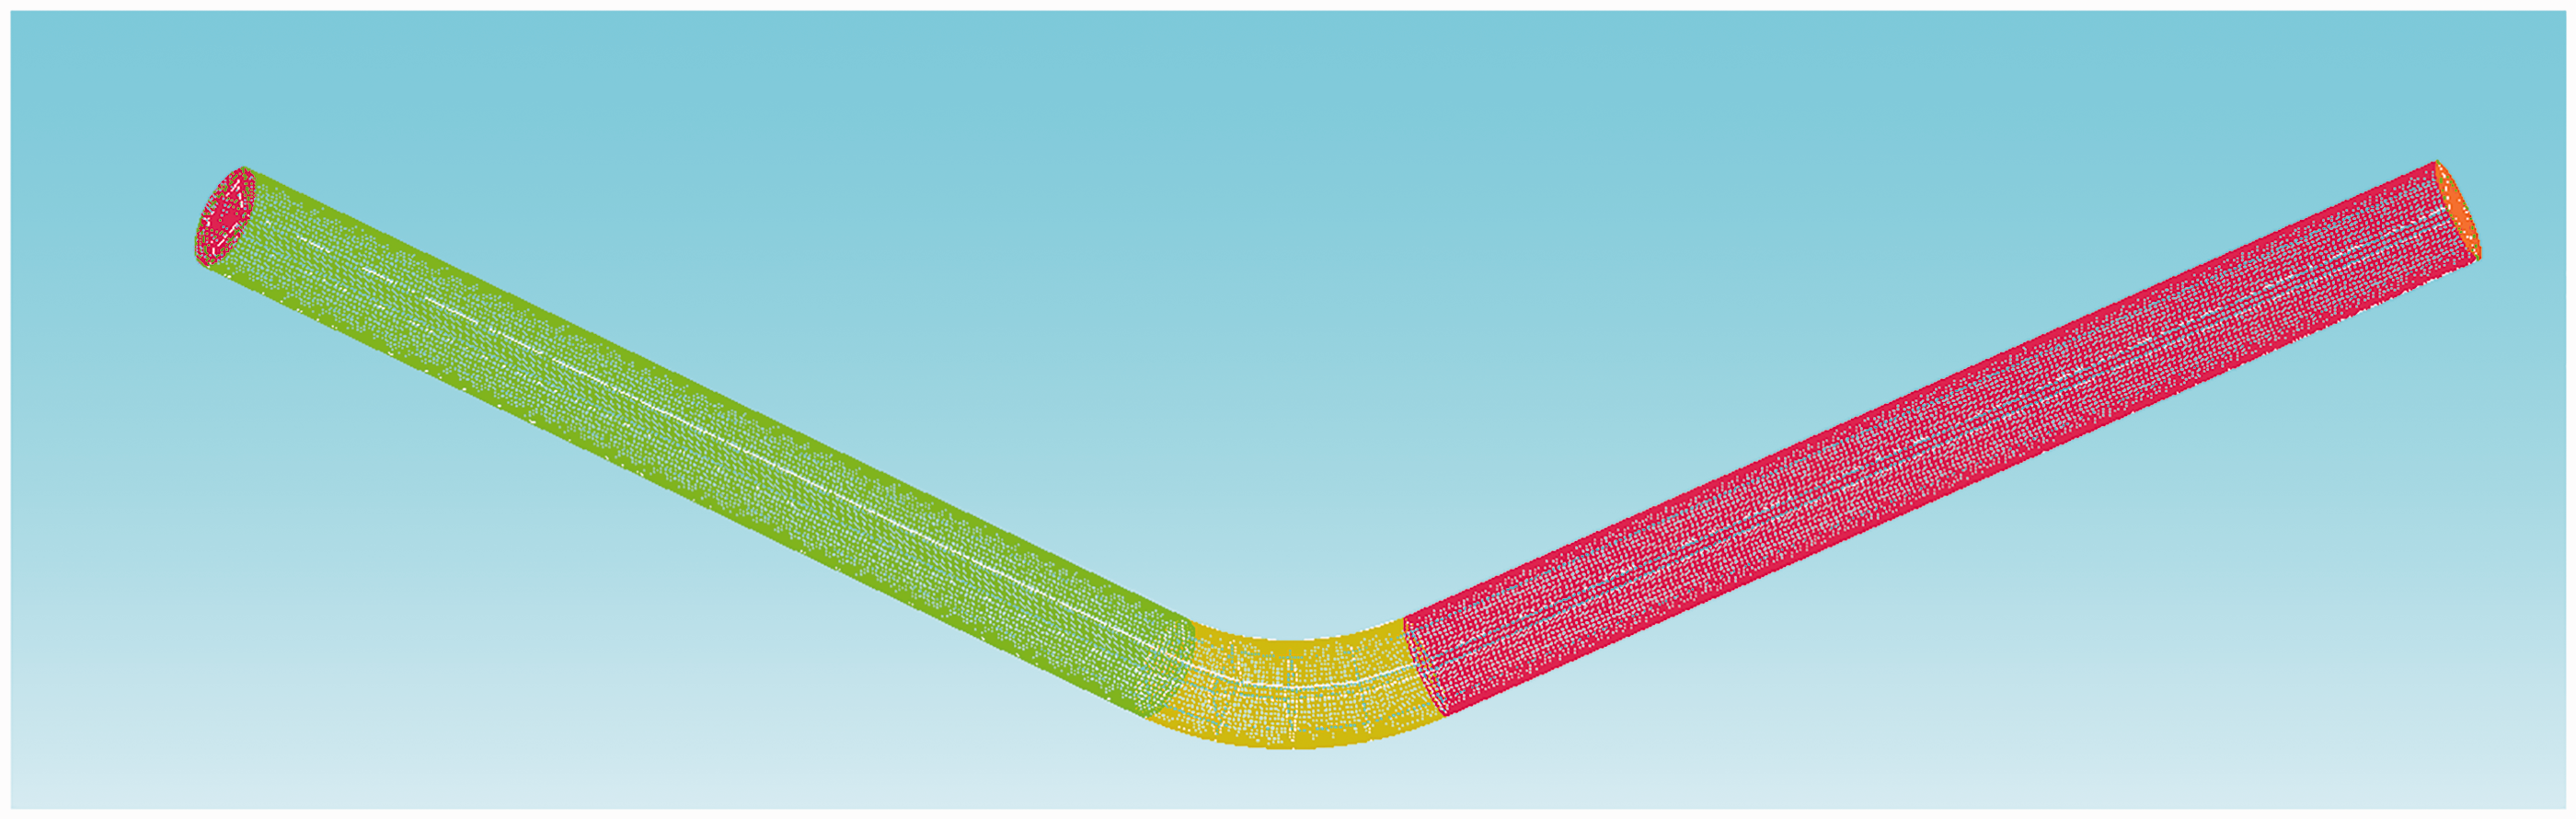
Schematic diagram of the concave pipeline.
According to the result, at 7 s, the latter oil has already flowed through two-thirds of the pipeline section; therefore, the grid independence is validated at this point of time to compare the volume fraction of oil at the lowest point of pipeline section (Peng et al., 2019b; Yong et al., 2019, 2017).
The grid is generated at a number of 1137402, 1741208, 2177564, 3568320, respectively, and the independence is verified (see Figure 3 and Table 2).
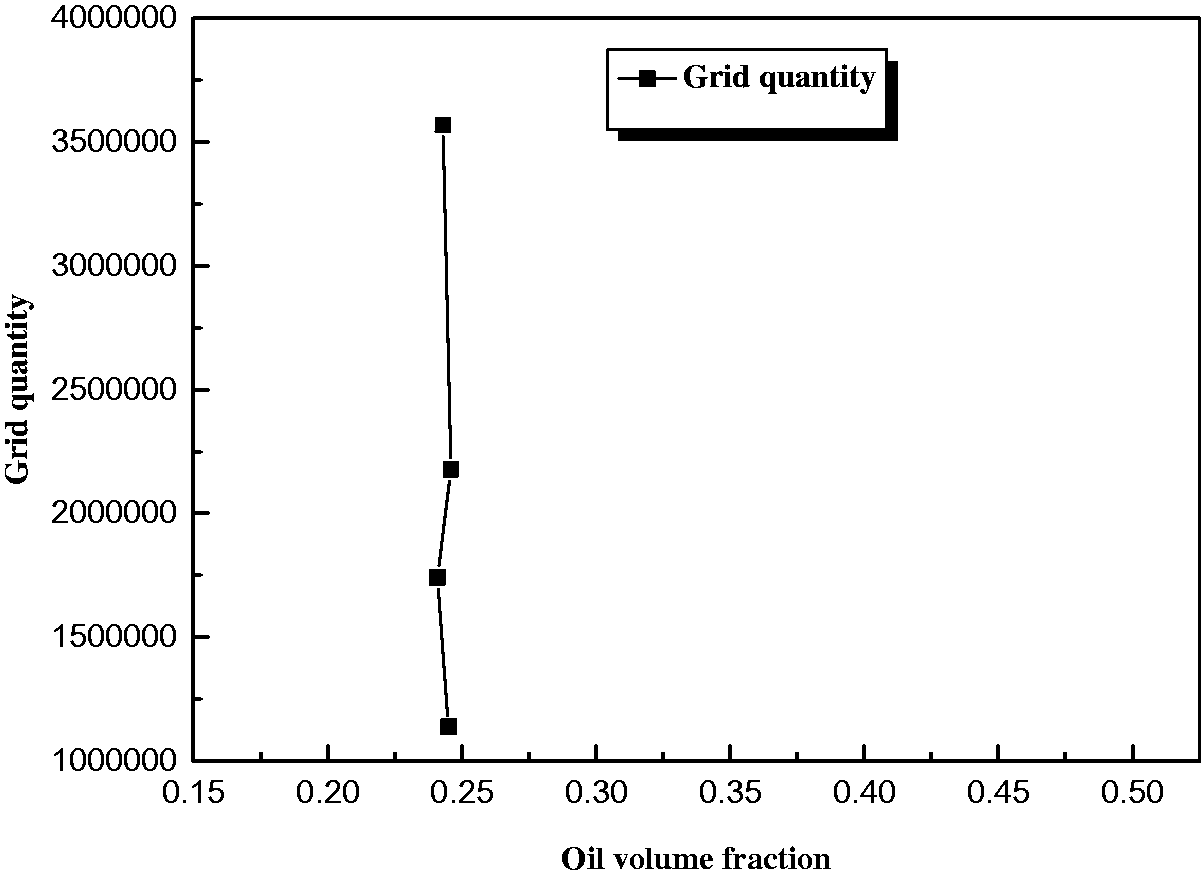
Grid independence verification diagram.
Grid independence verification.

The result shows that the volume fraction of the oil slightly changes with the increase of grid number from 1137402 to 3568320, which indicates that the model could be verified with grid independence at the number of 1137402. In addition, the time interval is set at 0.001 s (Table 3).
Relation between volume fraction and time step when the grids quantity is 1137402.

Results and discussion
Formation mechanism of contamination at inclining pipeline section
Downward pipeline
Figure 4 shows the diagram of the cross-section position of the inclining pipeline.
Diagram of the cross-section position of the inclining pipeline.
For instance, the diesel drains gasoline during batch transportation at the speed of 1 m/s; the distribution of these two oils at different time intervals is shown in Figure 5, where the blue one represents diesel, while the red one represents gasoline.
Distribution chart of mixed oil concentration in the downward pipeline at different times.
At 11 s, the gasoline in the pipeline is isolated as an individual area due to the effect of buoyancy, which would result in more contact area and then cause further contamination during transportation. At 20 s, the individual area tends to be further isolated into two sections. As a conclusion, contamination tends to be isolated as multiple sections by the effect of buoyancy, when diesel drains gasoline at the downward pipeline section.
At the beginning of the drainage, shown in Figure 6, the volume fraction of gasoline decreases sharply. When trailing oil is formed, by the effect of buoyancy, the diesel oil behind could isolate contamination into several sections, which would result in the fluctuation of volume fraction of gasoline at cross-section 4.
Volume fraction of gasoline at cross-section 4 varying with time.
Upward pipeline
Figure 7 shows the volume fraction of gasoline at cross-section 4 of straight pipeline and upward pipeline. From Figure 7, it is indicated that when diesel replaces gasoline, contamination in the upward pipeline would be less affected than that in the straight pipeline.
Volume fraction of gasoline at cross-section 4 of straight pipeline and upward pipeline varying with time.
The oil in the dead-leg will flow out due to gravity, and the two kinds of liquids will form a lock exchange flow at the junction. At this time, the main factor causing the contamination is the convective transmission. When about half of the preceding batch is replaced in the dead-leg, the influence of convection is gradually reduced, and diffusion transfer begins to play a role. After turbulent diffusion, the following batch gradually flows into the dead-leg and the liquid is slowly replaced. In these two processes, the time of turbulent diffusion is obviously longer than that of convection, and the forward batch from the dead-leg will form trailing oil in the main pipe run.
Influence of velocity on the trailing oil in inclining pipeline
When diesel drains gasoline during batch transportation in the downward pipeline, the contamination at cross-section 4 with different velocities at different times is shown in Figure 8. From this figure, with the increase of velocity, the drainage of gasoline would be faster.
Volume fraction of gasoline at cross-section 4 of straight pipeline and upward pipeline varying with time.
The volume fraction of gasoline at cross-section 4 of the downward pipeline with different velocities varying with time is shown in Figure 9. The cause of fluctuation of volume fraction of gasoline results from the turbulence diffusion, as well as gravity and the effect of buoyancy. Gravity would affect the length of contamination, while the number of contamination content may increase by the effect of buoyancy. With the increase of velocity, the fluctuation of volume fraction of gasoline would decrease, also with the length of contamination. The contamination might decrease because of the increase in velocity and turbulence diffusion.
Volume fraction of gasoline at cross-section 4 of the downward pipeline with different velocities varying with time.
When diesel replaces gasoline during batch transportation, the length and quantity of contamination would decrease with the increase of velocity, and the volume fraction would be weaker along with time.
Formation mechanism of contamination in the undulating pipeline
With the upward and downward of pipelines during the transportation of oil products, the concave or convex sections might be shaped, which would greatly influence the formation of trailing oil. In order to compare, the dip would be taken with an angle of 30°, no matter for upward or downward pipeline.
Concave pipeline
Figure 10 shows the diagram of the cross-section position of the concave pipeline. At the speed of 1 m/s, the drainage of gasoline by diesel is simulated with times, as shown in Figure 11.
Diagram of the cross-section position of the concave pipeline.
Distribution chart of mixed oil concentration in the concave pipeline at different times.
The volume fraction of gasoline at cross-section 5, cross-section 6, and cross-section 7 of the downward section of the concaving pipeline is shown in Figure 12. The regulation is close to what has been demonstrated in Figure 11. At the initial state, the volume fraction of gasoline decreases sharply. The effect of buoyancy would facilitate the formation of trailing oil, with the increasing thickness of contamination. Then it would deposit at the lowest point. With time goes by, the fluctuation of the curve would be even with the further drainage of diesel behind and becomes flat.
Curves of volume fraction of gasoline varying with time in different sections.
The volume fraction of gasoline at cross-section 7, cross-section 8, and cross-section 9 of the upward section of the concaving pipeline is shown in Figure 13. It is known that with the sudden decrease in all curves after 5 s, the only fluctuation is at the lowest point. Although gasoline might be drained by diesel to the upward pipeline section, however, at a certain velocity, the drainage is in restriction.
Curves of volume fraction of gasoline varying with time in different sections.
Convex pipeline
Figure 14 shows the diagram of the cross-section position of the convex pipeline. Figure 15 shows the relationship between time and volume fraction of gasoline at cross-section 11 of the convex pipeline and at cross-section 6 of the concave pipeline. At the speed of 1 m/s, the volume fraction decreasing from 1 to 0 is within 9 s at the cross-section of concave pipeline, and the length of contamination is 9 m; the volume fraction decreasing from 1 to 0 is within 13 s at the cross-section of convex pipeline, and the length of contamination is 13 m. At the same velocity and batch transportation, the quantity of contamination of the convex pipeline is larger than that of the concave pipeline.
Diagram of the cross-section position of the convex pipeline.
Curves of volume fraction of gasoline at different cross-sections of concave and convex pipelines varying with time in different sections.
Figure 16 shows the relationship between time and volume fraction of gasoline at cross-section 13 of the convex pipeline and at cross-section 8 of the concave pipeline. The volume fraction of gasoline at the cross-section of the concave pipeline is larger than that of the convex pipeline, for gasoline would deposit at the low point and be drained by diesel to the upward pipeline section to form the trailing oil. Meanwhile, the length of trailing oil might be shorter when diesel drains gasoline in batches of upward pipeline section of the convex pipeline, thus causing less contamination.
Curves of volume fraction of gasoline at different cross-sections of concave and convex pipelines varying with time in different sections.
In all, when diesel drains gasoline in batch transportation, the contamination mainly formed in the downward pipeline section of the concave pipeline with longer trailing oil and more contamination, while in convex pipeline, contamination also happens in the downward pipeline section, with shorter trailing oil and less contamination instead. Whether it is concave pipeline or convex pipeline, the quantity of contamination is larger than that of the straight pipeline.
Influence of velocity on trailing oil in an undulating pipeline
Concave pipeline
Figure 17 shows the concentration of contamination in the concave pipeline at 4 s, 7 s, and 10 s, respectively, with both speeds of 1 m/s and 1.4 m/s. It can be seen that, with the increase of velocity, the drainage would be fast with a short length of contamination. However, when the velocity of the flow is low, the drainage would be weakened by the effect of buoyancy, and gasoline would concentrate at the lowest point, and as a result, it would take time to fully drain the gasoline with a long length of contamination.
Distribution of mixed oil concentration in the concave pipeline with different flow velocities.
From Figure 18, at the initial state, all curves would go down sharply; when trailing oil is formed, the curves become even, the remaining volume fraction of gasoline decreases. The earlier the fluctuation happens, the smaller the peak value is. At 1.8 m/s, the fluctuation almost disappears, for the turbulence diffusion would become intense with the increase of velocity. Therefore, the drainage of diesel would be strong enough, with less concentration of contamination at the lowest point.
Curves of volume fraction of gasoline in cross-section 7 of the concave pipeline with time at different flow velocities.
By analyzing the simulation of gasoline drainage by diesel behind in batch transportation at different velocities, it indicates that the replacement of oil would be faster with the increase of velocity. Moreover, the contamination would be less at the lowest point, with a shorter length and less quantity.
Convex pipeline
It is shown in Figure 19, at the same cross-section, the volume fraction of gasoline from 100% to 0% decreases sharply with the increase of velocity, namely, the shorter the drainage time is, the shorter the length of contamination is, so as with less quantity.
Curves of volume fraction of gasoline in the convex pipeline with time at different flow velocities and sections.
In all, when diesel drains gasoline in batch transportation, no matter of concave pipeline or convex pipeline, the drainage becomes faster with the increase of velocity. The larger the velocity is at the concave pipeline, the lesser the contamination is at the lowest point, thus causing the shorter length of trailing oil and less quantity; meanwhile, the larger the velocity is at the convex pipeline, the shorter the length of contamination is and less quantity.
Equation correction
In actual calculation of the length of contamination, due to the definition of contamination itself and cutting requirement, the equation considers the volume fraction of former oil when it is more than 1%, and it is also applicable for the modified equation, with the ignorant of the influence of trailing oil which is less than 1%.
When diesel replaces gasoline, the influence of inclining pipeline could be ignored, while for the declining pipeline, the influence should be considered in the calculation of contamination. Non-linear fitting is conducted between time and velocity, and it is shown as follows

In the simulation of the declining pipeline at oil speed of 1 m/s during transportation, it takes 29 s for the volume fraction of contamination to grow from 1% to 99%. And then set 
Conducting non-linear fitting between time and velocity in the undulating pipeline, the equations are obtained as


In the simulation of the concave pipeline at oil speed of 1 m/s during transportation, it takes 24 s for the volume fraction of contamination to grow from 1% to 99%; meanwhile, for the convex pipeline, the time would be at most 14 s. And then set 

The correction equations for calculating the length of the contamination for the undulating section are equations (10) and (11).
When Reynolds number is beyond critical Reynolds number, the equation could be modified as

When Reynolds number is below critical Reynolds number, the equation could be modified as

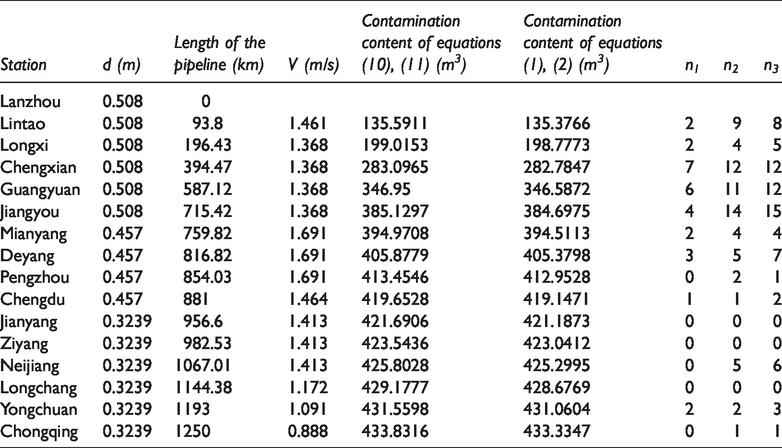
Table 4 and Figure 20 show the calculation and comparison of the contamination quantity of the Lan-Chengyu’s product oil pipeline. The transportation of Lanzhou-Chengdu-Chongqing pipeline was analyzed, and the initial throughput of the pipeline was 21,220.021 t/d, and the contamination content at the endpoint was 334.109 t. The contamination content calculated from the Liu’s model (equations (5) and (6)) was 331.0677 t (the relative error was 0.9103%) and from the modified computational model (equations (10) and (11)) was 331.4474 t (the relative error was 0.7966%).
Calculation and comparison of contamination quantity of Lan-Chengyu’s product oil pipeline.
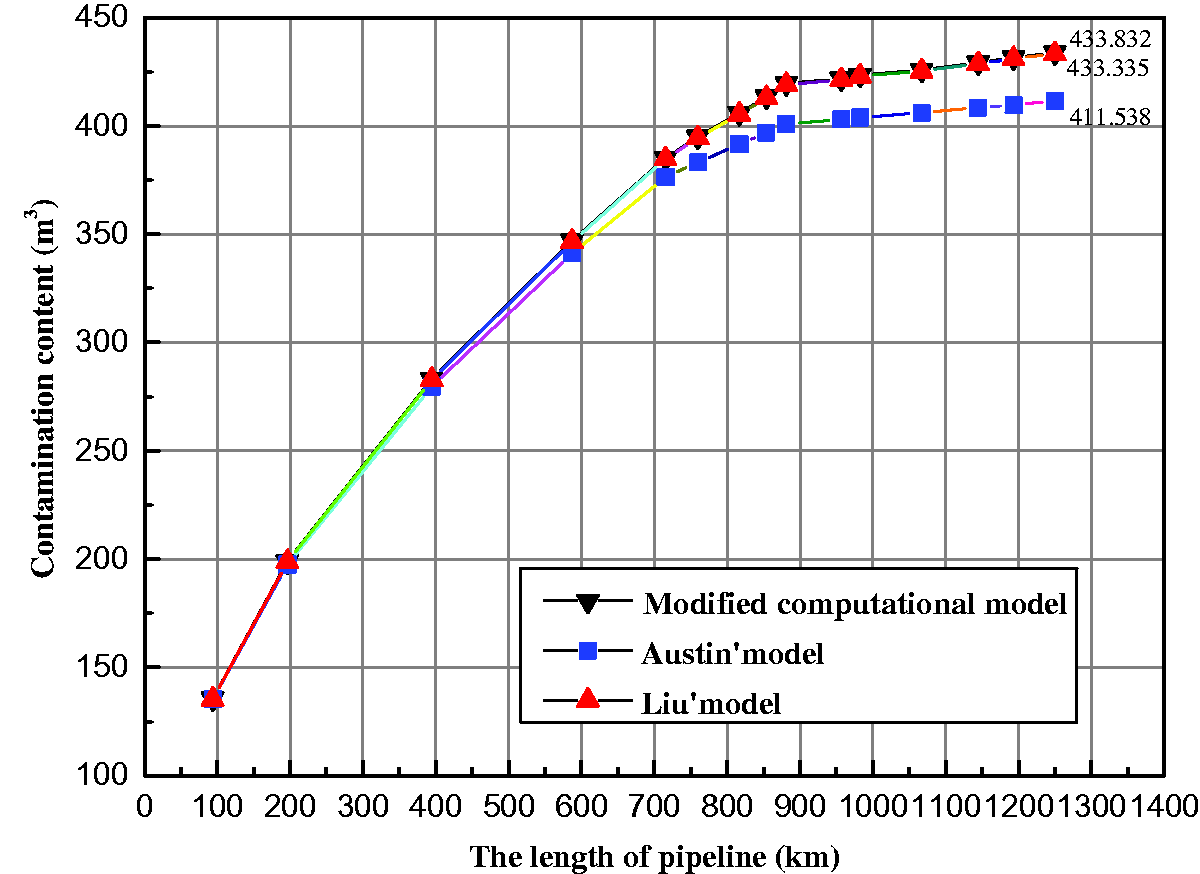
Comparison of the contamination content by three different models.
The above equations yield results that are closer to real data, so they provide a greater guide for accurate cutting of contamination, which has practical significance.
Conclusions
The oil adhered to the walls, forming a laminar bottom, is the main factor for the formation of trailing oil. The diesel in the upward pipe can move the gasoline faster when the turbulent diffusion and the combined force of gravity and buoyancy are combined in the axial direction, so the gasoline volume fraction of the upward pipe drops faster. In the transportation process, if the diesel oil is in the position of higher gravitational potential energy relative to gasoline, the mixing length and the mixing amount are larger than that of straight pipeline; if the gasoline is in the position of higher gravitational potential energy, the mixing length and the mixing amount are smaller than that of straight pipeline. When diesel drains gasoline in batch transportation, no matter of concave pipeline or convex pipeline, the drainage becomes faster with the increase of velocity. The larger the velocity is at the concave pipeline, the lesser the contamination is at the lowest point, thus causing the shorter length of trailing oil and less quantity; meanwhile, the larger the velocity is at the convex pipeline, the shorter the length of contamination is and less quantity. Based on the simulation results, we modified the Liu’s model for calculating the contamination length. The equations include the influence of the trailing oil formed by the undulating sections on the contamination length, which makes the equations more consistent with real data.
Footnotes
Declaration of conflicting interests
The author(s) declared no potential conflicts of interest with respect to the research, authorship, and/or publication of this article.
Funding
The author(s) disclosed receipt of the following financial support for the research, authorship, and/or publication of this article: This work was supported by the Sichuan Applied Basic Research Project (2019YJ0352) and Sichuan Provincial Natural Resources Research Project (KJ-2019-11).