
Abstract
Rock drillability is a comprehensive index that indicates the ease of drilling a hole in the rock mass, which is a main basis for the design of drilling bits, the optimization of drilling operational parameters, and the prediction of rate of penetration. This paper established a conversion relationship between mechanical specific energy measured from micro-drilling tests and mechanical specific energy measured from scratch tests, based on the consistency of rock breaking mechanism between these two types of tests. By incorporating the methodology of calculating rock drillability grade of polycrystalline diamond compact bits, a new mathematical model for predicting rock drillability of polycrystalline diamond compact bits is developed. Subsequently, a new method for acquiring continuous rock drillability profile by scratching the core surface is developed. A wide range of rocks with different hardness were tested by the proposed scratch method. The results show that the new model has high consistency with the results of laboratory micro-drilling tests. For example, the average errors of sandstone, shale, and carbonate test results are only 7.41%, 8.18%, and 4%, respectively. The new method can fully characterize the effect of mineral composition, cementation strength, and microstructure of rock on drillability. Besides, the new model has high utilization efficiency of expensive core samples because the core usually remains nondestructive after scratch tests.
Introduction
Teale (1965) first proposed the concept of mechanical specific energy (MSE, also known as specific crushing energy) and used it to describe the performance of drilling bits. MSE is defined as the mechanical energy required to break rock of a unit volume (Anemangely et al., 2019). It is a parameter that reflects the combined influence of rock mechanical properties (e.g., strength and hardness) and drilling parameters (e.g., weight on bit (WOB) and rate of penetration (ROP)) on rock breaking. The theory of MSE has been widely used in monitoring and predicting drilling performance, designing new drilling techniques and tools, and evaluating the drillability of formation rocks (Alali et al., 2012; Amadi and Iyalla, 2012; Cherif and Bits, 2012; Koederitz and Johnson, 2011; Pei, 2012). This paper will focus on the evaluation of drillability which is a comprehensive index that indicates the ease of drilling a hole in the rock mass and serves as a main basis for drilling bit design, optimization of drilling operational parameters, and prediction of penetration rate of the bit (Anemangely et al., 2018).
Based on Teale’s theory of MSE, Detournay and Defourny (1992) developed a theoretical model for determining MSE using scratch test data and manifested that MSE of rock is approximately equal to its uniaxial compressive strength (UCS). Richard et al. (1998) further demonstrated that the friction coefficient of a scratch test is equal to the intrinsic friction coefficient of the tested rock. Schei et al. (2000) analyzed the force acting on a scratch cutter and found that there is a strong correlation between the hardness of rock and scratch measurements. Based on this finding, Schei et al. presented a preliminary model for rock hardness evaluation using scratch test results; however, the accuracy of the evaluation model is not very satisfactory. Chen et al. (2017a, 2017b) established an empirical model and a theoretical model for assessing rock drillability of polycrystalline diamond compact (PDC) bits using scratch tests. However, the theoretical basis of the models is relatively weak and they are only valid for soft to medium-hard rocks and will lose their accuracy with the increase of rock hardness. Moreover, some input parameters of their models are very difficult to determine, restricting the wide application of the models.
This paper analyzes the inter-relationship of rock breaking mechanism between mirco-drilling tests and scratch tests and then, based on the inter-relationship, establishes the correlation of MSE obtained from these two types of tests. Furthermore, a new mathematical model for predicting rock drillability with PDC bits based on the results of scratch tests is developed. Compared with the model of Chen et al. (2017a, 2017b), the new model has a wider applicable range, valid for soft to very hard rocks. In addition, the model has less parameters, and thus, it is much easier to use.
Review of MSE models
Teale (1965) carried out a large number of fundamental experiments of MSE with different types of bits and rocks and proposed the first MSE model. Since then, a number of researchers have conducted scientific experiments and developed a couple of MSE models. An elegant MSE model should possess the features of: (1) MSE should be approximately equal to UCS of the rock while drilling in different lithologic formations; (2) parameters of the model are easy to measure and calculate; and (3) the application scope of the model is wide - suitable for various types of rocks and drilling bits. Existing MSE models reported in the literature are summarized as follows.
Teale model (Teale, 1965)
Dupriest and Koederitz model (Dupriest and Koederitz, 2005)
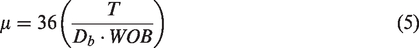
Cherif and Bits model (Cherif and Bits, 2012)
Pessier and Fear model (Pessier and Fear, 1992)
Fan model (Fan et al., 2012)
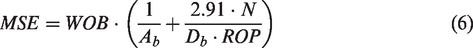
Detournay and Defourny model (Detournay and Defourny, 1992)
where MSE is the mechanical specific energy, MPa; WOB is weight on bit, kN;


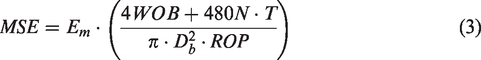
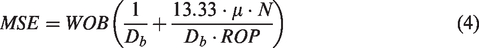

Teale model has the advantage of less parameters. In drilling practices and laboratory tests, WOB, rotational speed (N), and ROP can be directly measured in real time, while torque (T) cannot be measured directly. It is, therefore, often obtained through indirect calculations using other parameters. As a result, Teale model has certain inaccuracy in parameter determination and MSE prediction. The Dupriest and Koederitz model and Cherif and Bits model amended the coefficients in Teale model and introduced the parameter of mechanical efficiency (
Based on the analysis of the MSE models, we can find that the torque of the bit cannot be measured directly, and thus a simple conversion of torque from other factors (e.g., WOB, rotational speed, and bit parameters) should be used as far as possible. Moreover, drillability of rock can be evaluated using scratch test data by establishing a relationship between drillability measured from micro-drilling test and MSE calculated based on Detournay and Defourny model using scratch test data.
Drillability model
Based on the theory of MSE, Chen et al. (2017a, 2017b) developed an empirical model and a theoretical model for evaluating rock drillability with PDC bits, which contribute a preliminary technique for acquiring continuous drillability profiles by scratching the surface of rocks.
The empirical model is expressed as

The theoretical model is expressed as

The empirical model adopted the empirical formula of the power required to break rocks with PDC bits proposed by Ma and Wang (2006). The mechanical energy consumed to drill to an objective depth is obtained through multiplying power by drilling time. And then, MES in the micro-drilling test is calculated through dividing the mechanical energy by the volume of broken rock. Next, the relationship between the MSE of micro-drilling tests and the MSE of scratch tests is established. Finally, combined with the method for calculating drillability of PDC bit, the empirical model of rock drillability based on scratch test data is obtained. The empirical model has some issues on power conversion efficiency and thus possesses some errors. However, the following of this paper will focus mainly on the reconstruction and improvement of the theoretical model, rather than focusing on the empirical model.
The micro PDC bit rotates and cuts the rock under the action of WOB and torque. The theoretical model gives the formula to calculate the MSE of the bit in one circuit, expressed as


Next, the conversion from MSE of scratch test to MSE of micro-drilling test is obtained through data fitting, expressed as

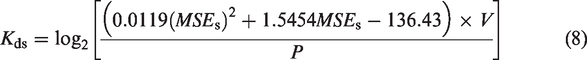
Finally, a mathematical model (equation (10)) for evaluating rock drillability with PDC bit using scratch test data is established by combining equations (11) to (13). However, this theoretical model has some limitations.
First, it is applicable only to soft (Type I) formations to medium-hard (Type II) formations, but not applicable to relatively hard (Type III) formations. The model calculates MSE of the micro PDC bit in one circuit; thus, the harder the formation, the fewer drilling footage per circle and the worse adaptability of the model. Second, parameter
Laboratory tests
Micro-drilling test
In order to study the rock drillability of PDC bits using scratch tests, we have to know the drillability of rock first. Then, based on the theory of MSE, we linked the results of micro-drilling tests and scratch tests to determine rock drillability using scratch test data. In this work, we used micro-PDC bits and micro-drilling tests recommended in standard “SY/T 5426—2000-Rock Drillability Measurement and Its Classification” to measure the drillability of rock. Micro-drilling tests are conducted using the automatic drillability test system manufactured by Shiyi Technology Company of China University of Petroleum (see Figure 1). The system consists of a rock sample holder, a micro drill bit, a load unit, a power transmission unit, a drilling depth measurement device, and an automatic data acquisition system. The micro PDC bit consists of a steel body and two PDC cutters. The micro bit has an outer diameter of 32 mm. The PDC cutters have a dimeter of 13.3 mm and a backrake angle of 20° (see Figure 2).
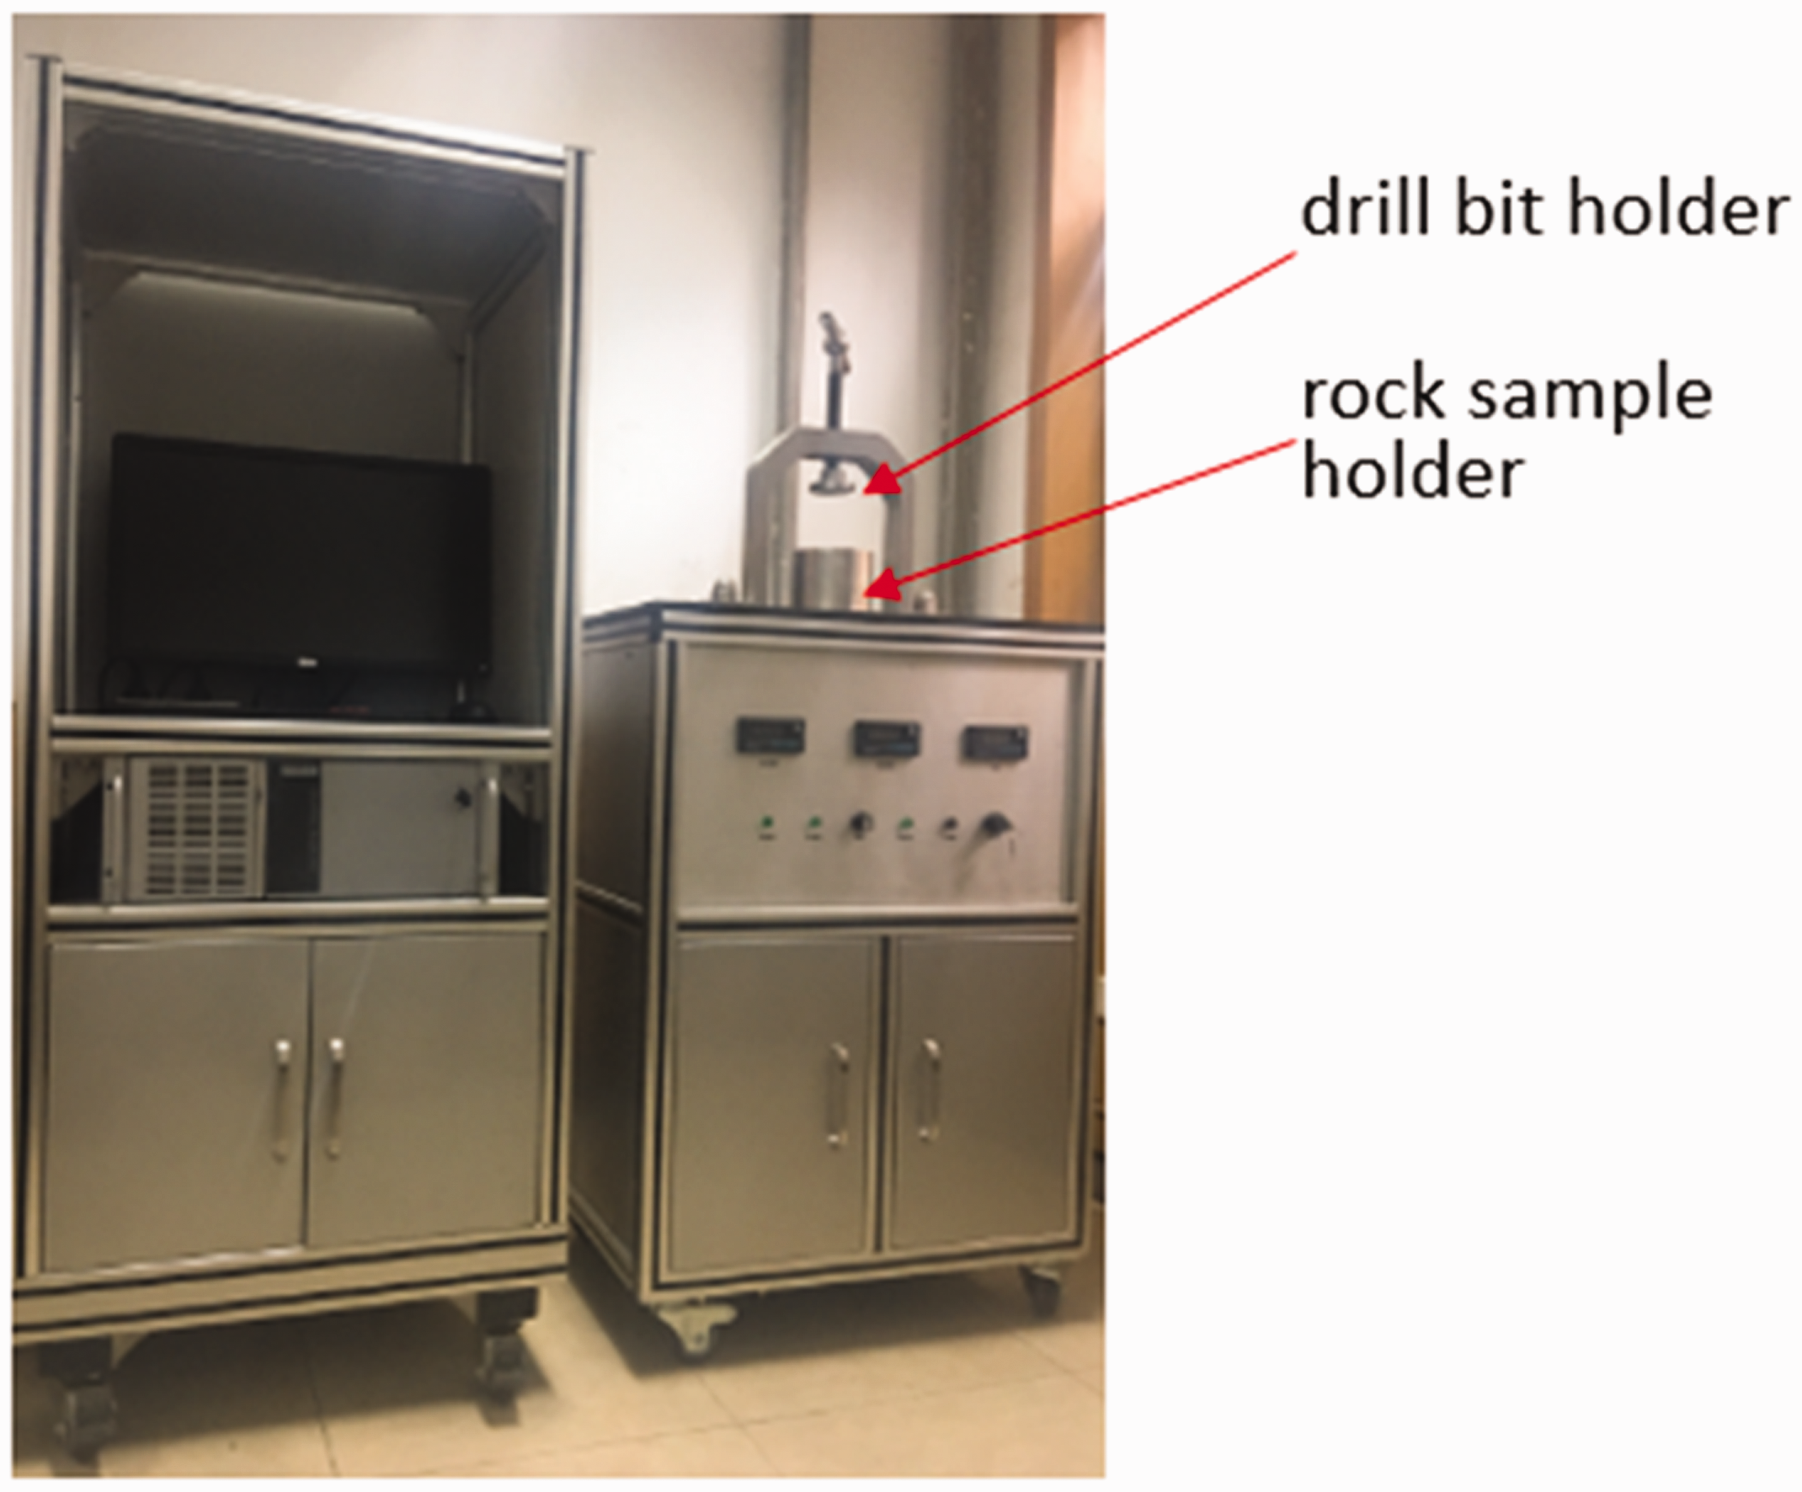
Micro-drilling system for rock drillability measurement.
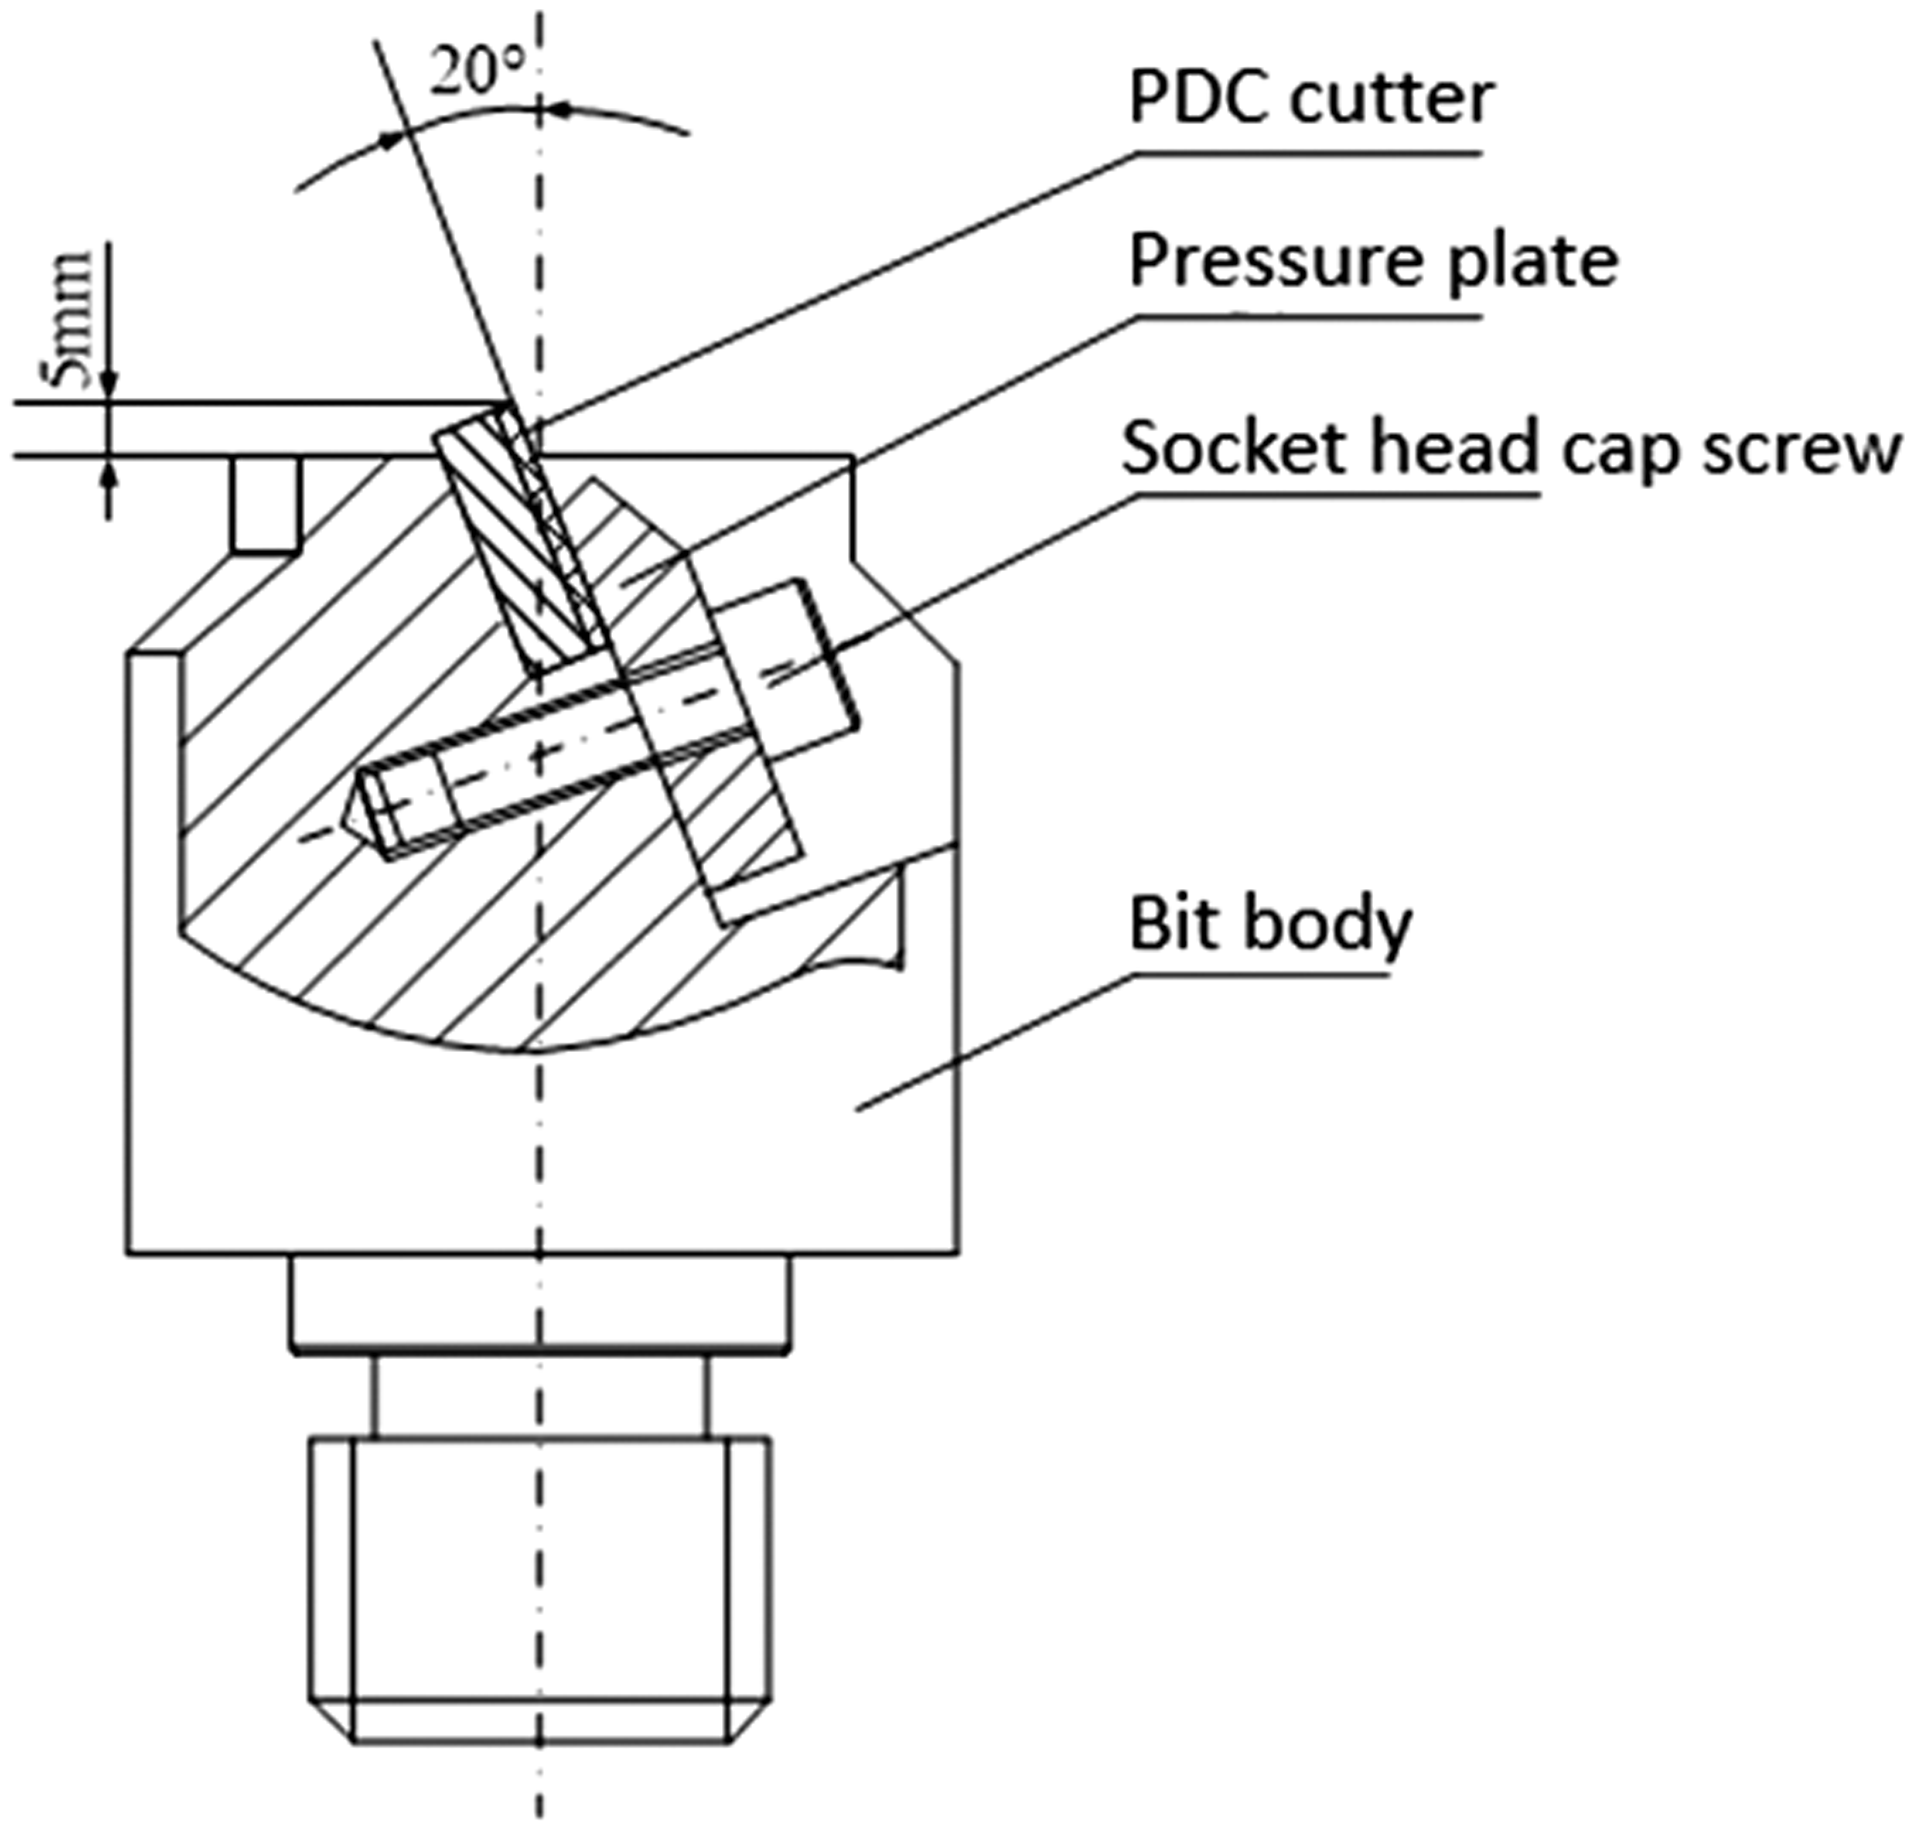
Schematic of micro PDC drill bit. PDC: polycrystalline diamond compact.
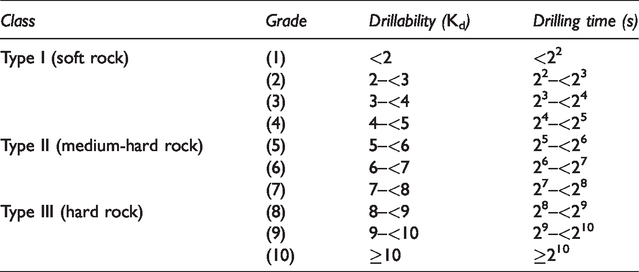
The core samples are drilled perpendicularly to their cross sections with a WOB of 500 N and a revolution speed of 55 r/min. A hole with a depth of 4 mm is drilled in each micro-drilling test. The first 1 mm of each hole is a predrilled depth, and test data (e.g., drilling time) are only recorded for the next 3 mm of the hole. For each test, at least three holes are drilled, and the results are averaged as the result of the test. The drillability of the rock can then be calculated using equation (12). Drillability can be classified into then grades, as shown in Table 1. It should be noted that the vibration of drill strings may also affect drilling efficiency (Wang et al., 2017) and thus drillability of the formation in real drilling practices; however, drill-string vibration is not simulated in the micro-drilling tests and its effect on drillability is beyond the scope of this study. It should also be noted that although we measured the drillability of rock using micro-drilling test with PDC bit in this work, the focus of this paper is to evaluate the drillability of rock, rather than investigating the performance of PDC bits.
Rock drillability grades.
Scratch test
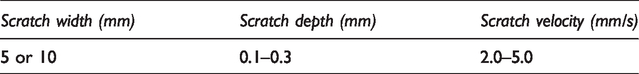
Scratch tests are conducted using the Mechanical Profiler Test System of TerralTek (see Figure 3). The system consists of a drive unit, a load measurement device, a displacement measurement device, a scratch cutter, and an automatic data acquisition system. During the test, the scratch cutter scratches the surface of the rock with a constant depth and velocity (see Figures 4 and 5). In this study, the rock samples are scratched by a 5 mm wide cutter with a scratch depth of 0.18 mm and a scratch velocity of 3 mm/s. Meanwhile, the force acting on the cutter and the displacement of the cutter are monitored and recorded, so the strength parameter profile of rock can be obtained in real time (Detournay and Defourny, 1992). Three or more repeated tests are conducted, and the average value is taken as the final experimental result. The key parameters of the experiment are shown in Table 2. The velocity and depth of scratching are selected according to the strength of rocks to ensure that the scratched rocks fail in a plastic mode.
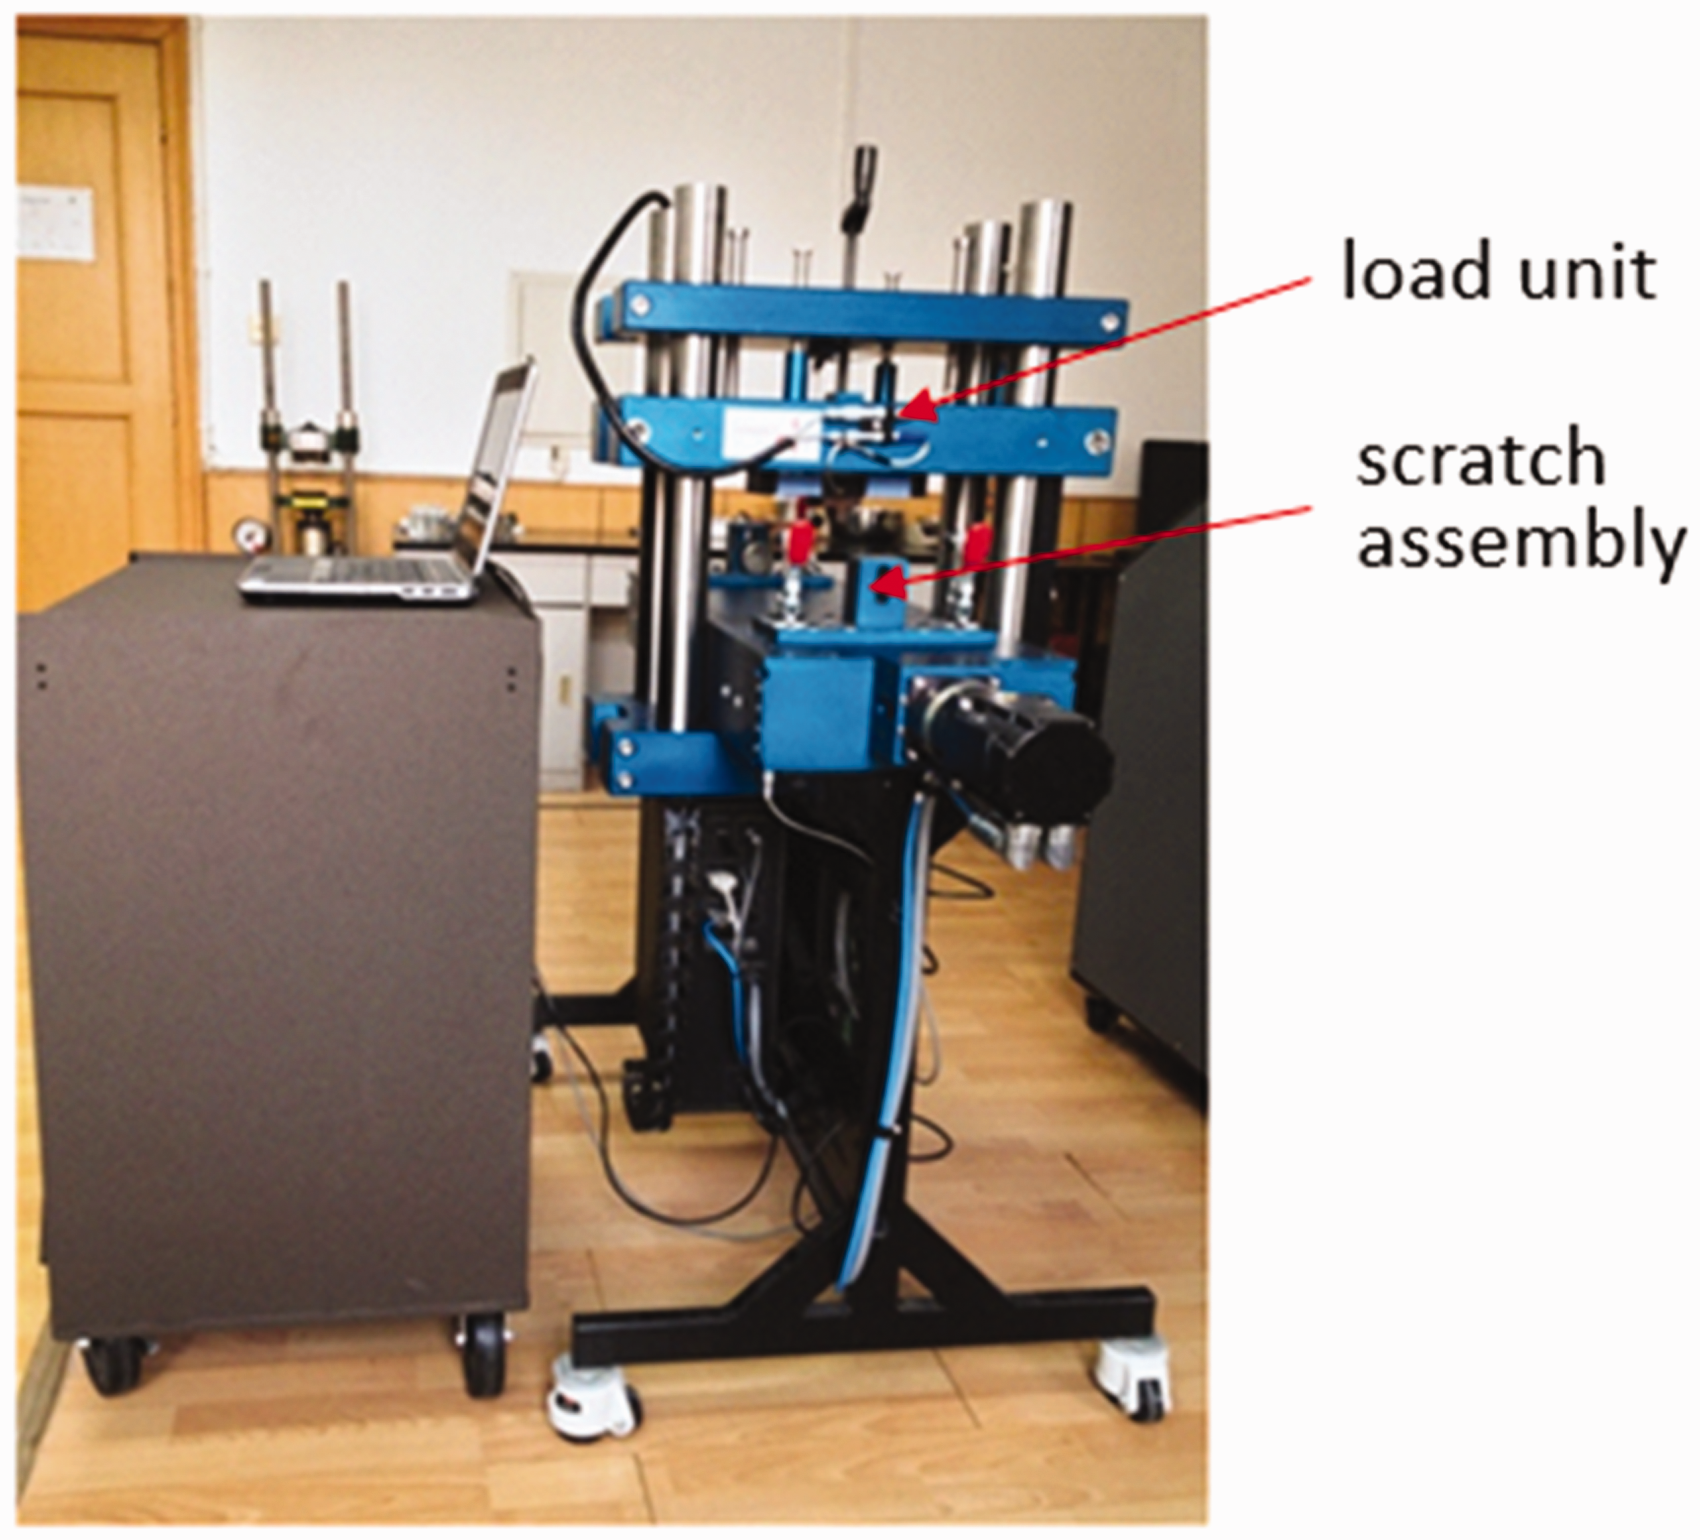
Mechanical Profiler Test System used for scratch tests in this study.
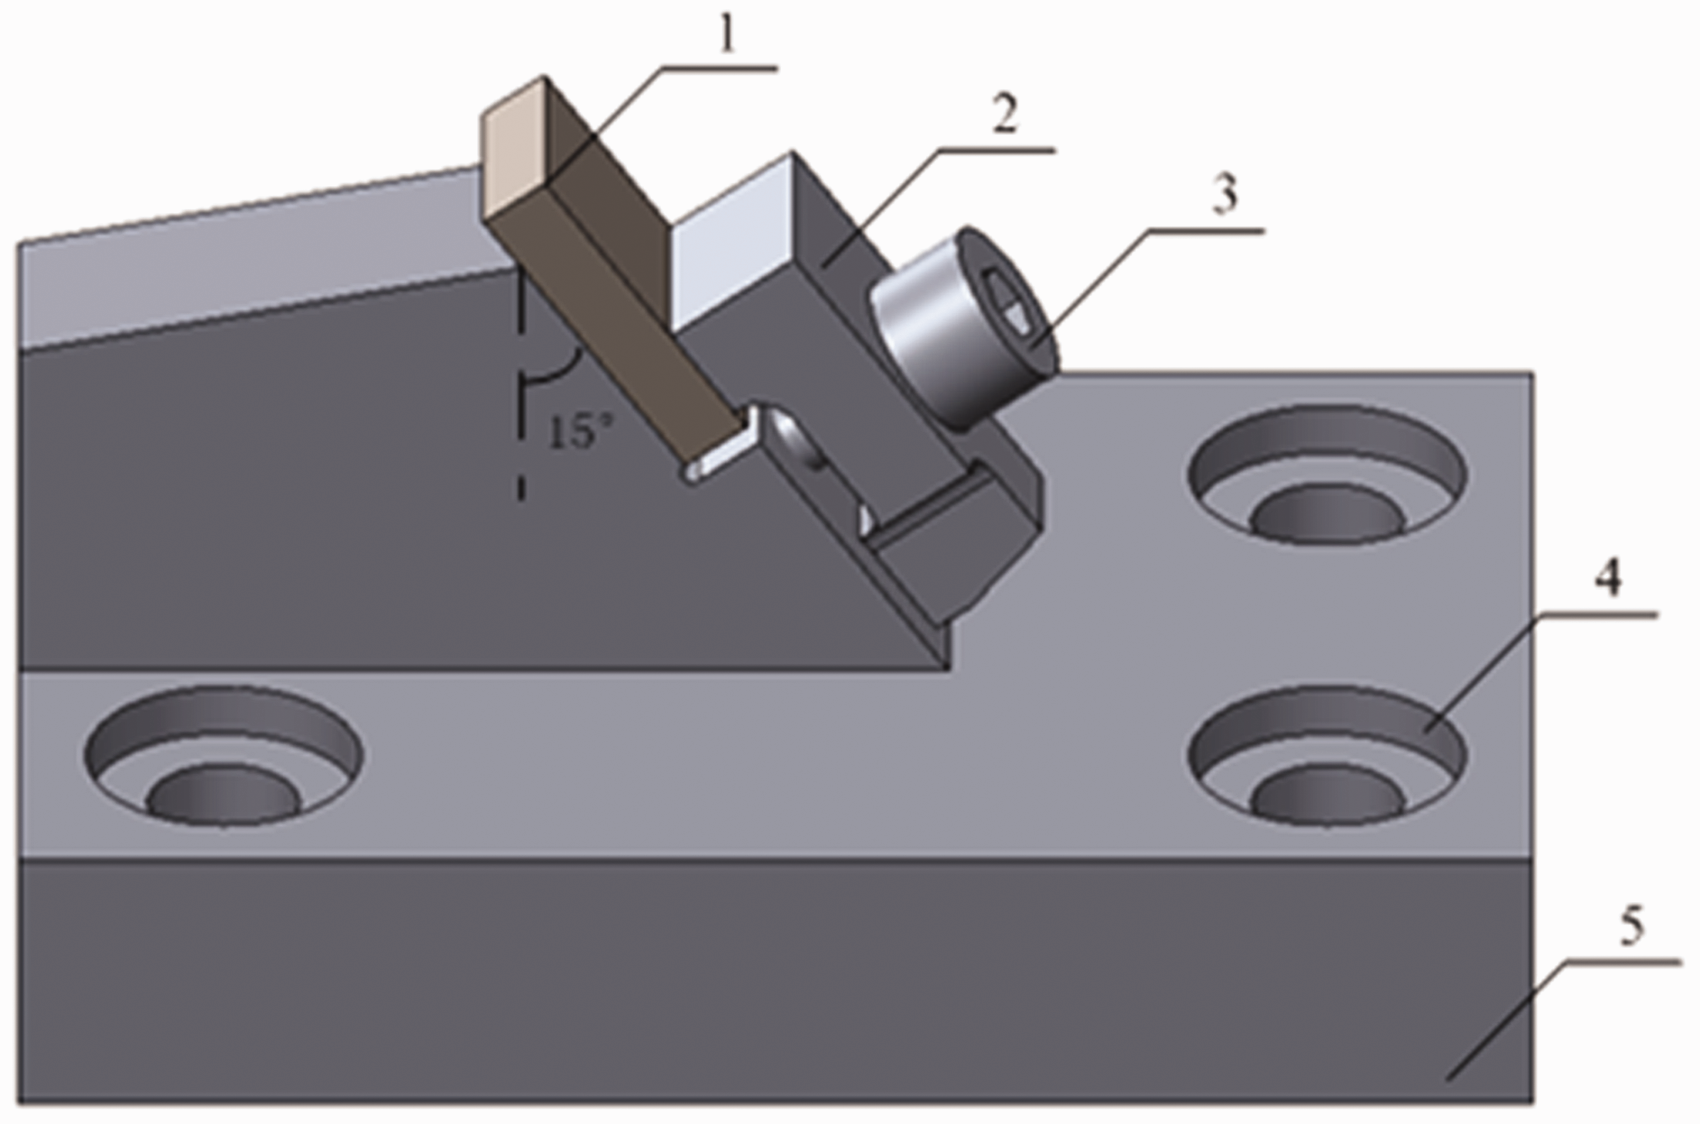
Schematic of the scratch assembly for scratch tests: 1, cutter; 2, chuck; 3, nut; 4, mounting hole; 5, tool rest.
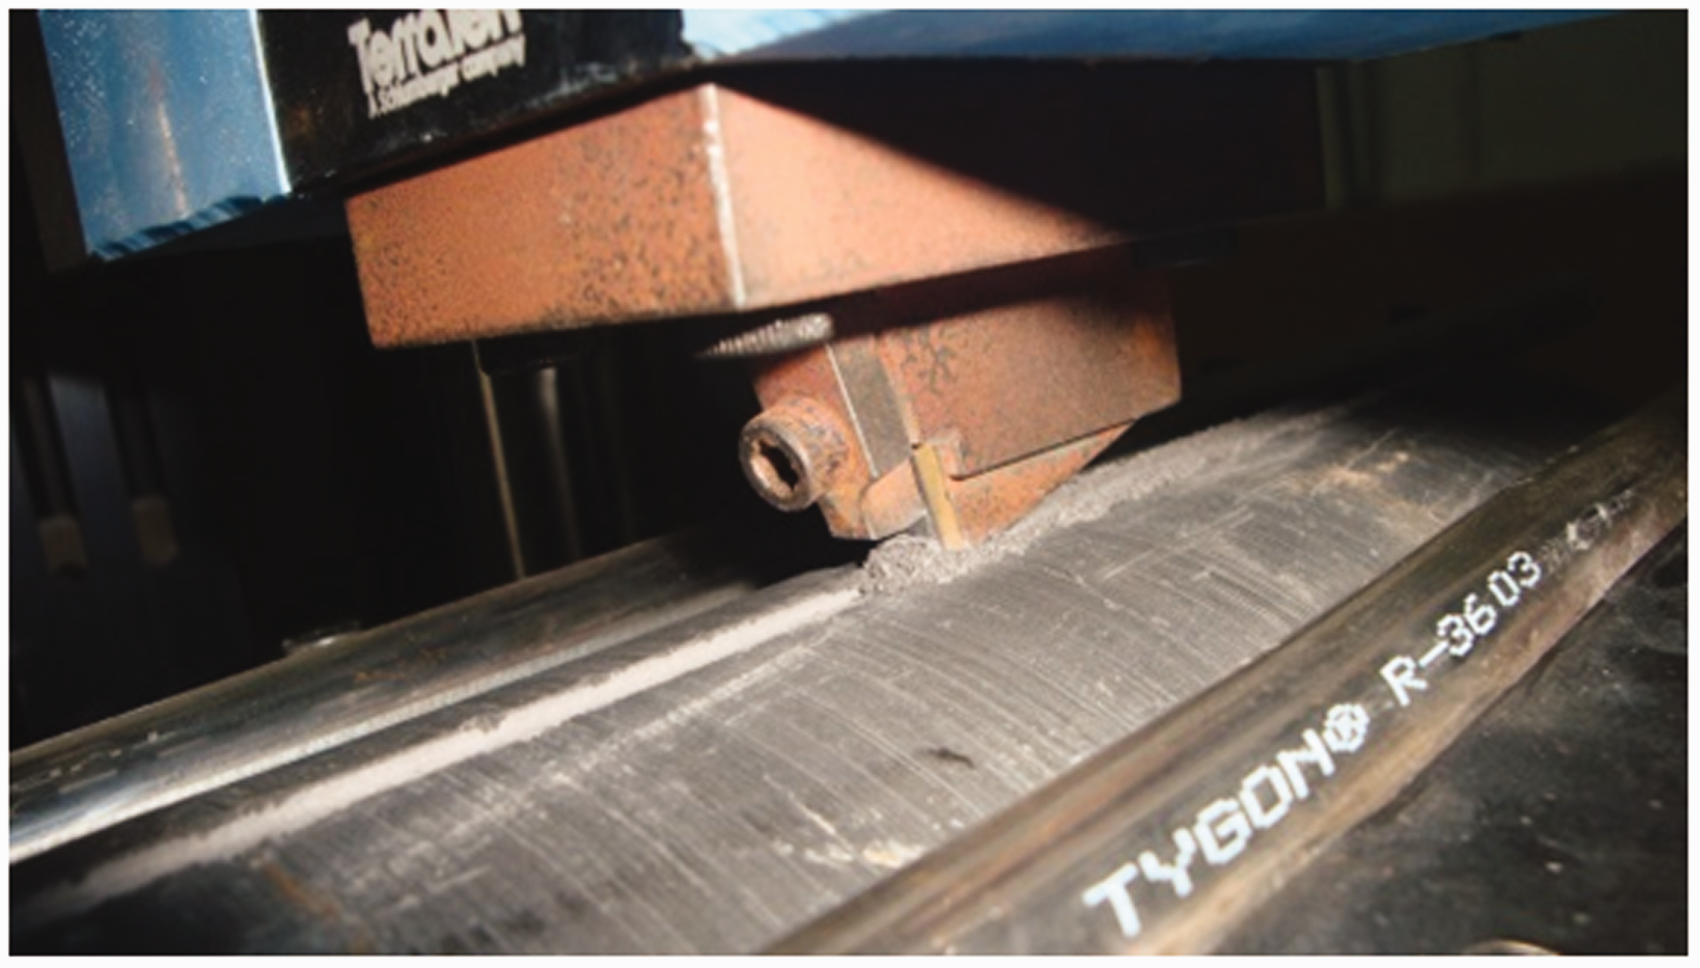
Scratch test on a full-size core.
Key parameters used in scratch tests.
Evaluating drillability of PDC bit using scratch test data
Rock breaking mechanism of micro-drilling test and scratch test
Both micro-drilling test and scratch test break rock by cutting the rock with PDC blade. In micro-drilling tests the micro PDC bit rotates and cuts the rock under the action of WOB and torque, while in a scratch test the cutter scratches the rock surface with axial load and horizontal driving force. Numerous experimental investigations have demonstrated that there are two principal rock failure modes under cutting/scratching—a ductile failure mode and a brittle failure mode. When the cutting depth is less than a threshold depth, the rock fails in a ductile mode; otherwise, it fails in a brittle model (see Figure 6). Under ductile failure mode, the cuttings are fine and uniform and generated in a continuous manner, and the cutting force is proportional to the energy consumed (Adachi et al., 1996; Almenara, 1992; Detournay and Defourny, 1992; Ghoshouni and Richard, 2008; Pei, 2012; Richard, 1999; Richard et al., 1998; Schei et al., 2000). MSE is closely related to inherent mechanical strength and drillability of rocks. This provides the basis for correcting the results of micro-drilling tests and scratch tests. To summarize, under the condition of ductile cutting, MSE can be used to link scratch test data with micro drillability test data, implying that drillability of PDC bits can be evaluated with scratch tests.
Failure modes while cutting a rock (Richard, 1999): (a) plastic failure mode and (b) brittle failure mode.
MSE of micro-drilling tests
The PDC bit rotates and cuts the rock under WOB and torque. The surface of the PDC cutter has a constant inclination angle 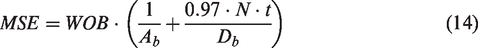
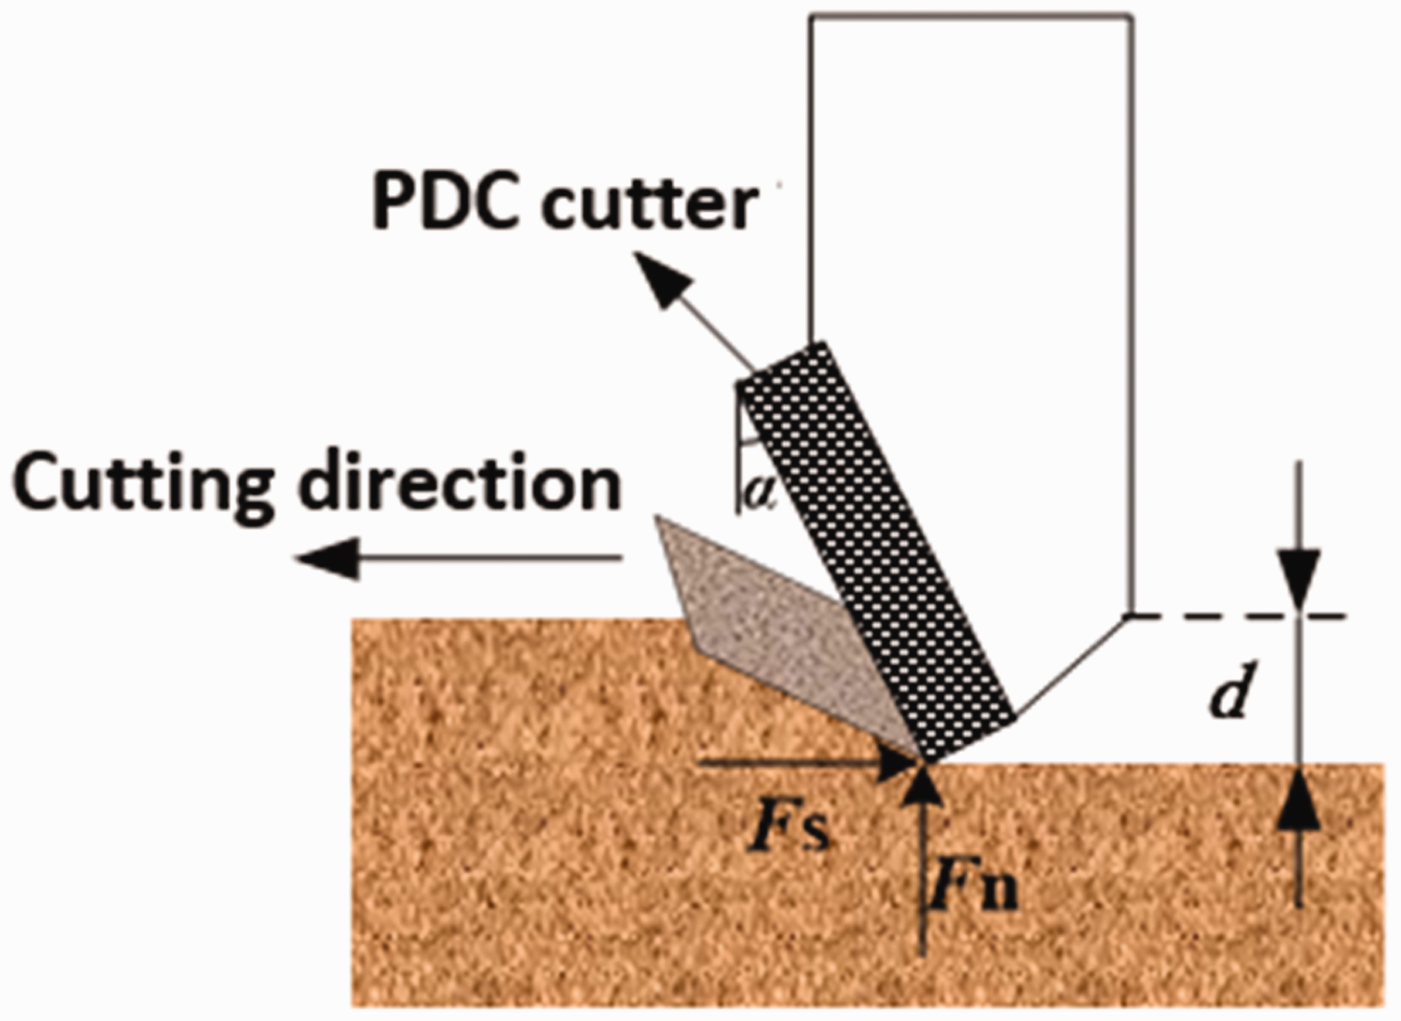
Schematic of the force acting on a cutter of a PDC bit in micro-drilling test. PDC: polycrystalline diamond compact.
MSE of scratch tests
Richard (1999) and Richard et al.(1998) analyzed the stress acting on a cutter under plastic cutting mode in scratch tests. The normal of cutter face keeps at a constant angle θ with respect to the horizontal cutting direction. Ignoring the frictional force at the bottom of the cutter, the total force F acting on the cutter can be decomposed to two components—a tangential force Fs along the direction of scratch and a normal force Fn perpendicular to the scratch surface, as shown in Figure 8. The MSE of scratch test can be determined using equation (6). Continuous MSE profiles of a core sample can be obtained directly from scratch tests. As mentioned earlier, Detournay and Defourny (1992) have demonstrated that the value of MSE in plastic cutting mode is equal to the UCS of the rock.
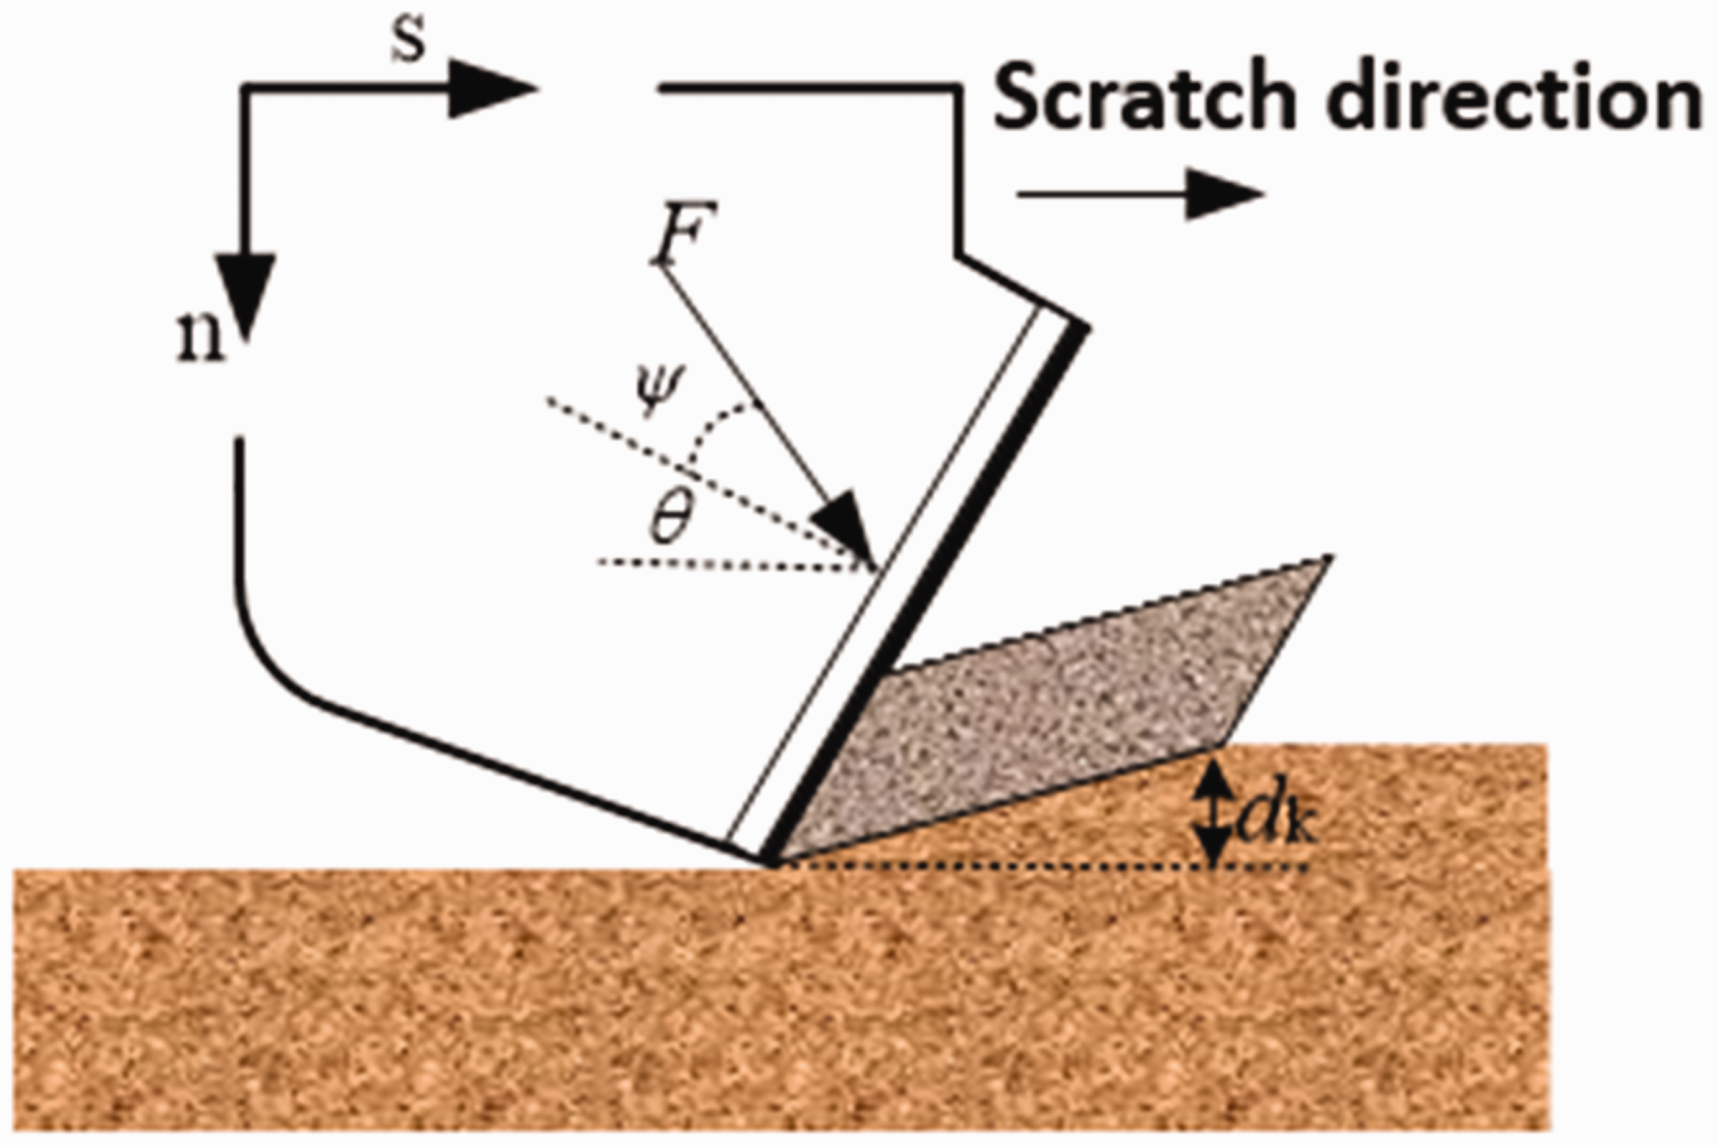
Schematic of the force acting on a cutter in scratch test.
Determining rock drillability of PDC bit using scratch test data
Now we have selected the models to calculate MSE for micro-drilling test and scratch test as described in earlier subsections. Next, we will conduct a large number of experimental tests on different rock samples and use the test data to establish a relationship between MSE of the two types of tests. Finally, based on the inter-relationship of the two tests, a rock drillability evaluation model using scratch test data is developed. In this section, we describe the method of evaluating drillability of PDC bits using scratch tests.
(1)
Due to the complex compositions and structures of rocks, drillability and strength of different rocks can vary significantly. In order to ensure the comprehensiveness and representativeness of the experimental data, a total number of 43 full-scale core samples with four different lithology are tested. These samples include sandstone samples from an oilfield in northeast China, shale samples form an oilfield in southwest China, igneous rock samples from an oilfield in northwest China, and carbonate rock samples from an oilfield in northwest China (see online Appendix 1).
Selection of corresponding micro-drilling test data and scratch test data is very important for building a relationship between them. For example, for the sandstone core sample (B202-7) shown in Figure 9 with homogeneous lithology, the correspondence between the two test results is relatively good. In other words, MSE measured from micro-drilling test and scratch test at different locations does not have strong fluctuation. However, for core samples of strong heterogeneity, if the two tests data are not from the same measurement location, there can be a significant deviation. For example, Figure 10 shows a shale core sample (W1-3) with MSE fluctuating sharply between 50 and 220 MPa with the change of mineral compositions and microstructures along the axial direction of the core. Therefore, in order to ensure good correspondence between data sets of the two types of tests, it is necessary to select micro-drilling test locations according to the MSE profiles of scratch tests. Figure 11 shows cores B202-7 and W1-3 after micro-drilling tests.
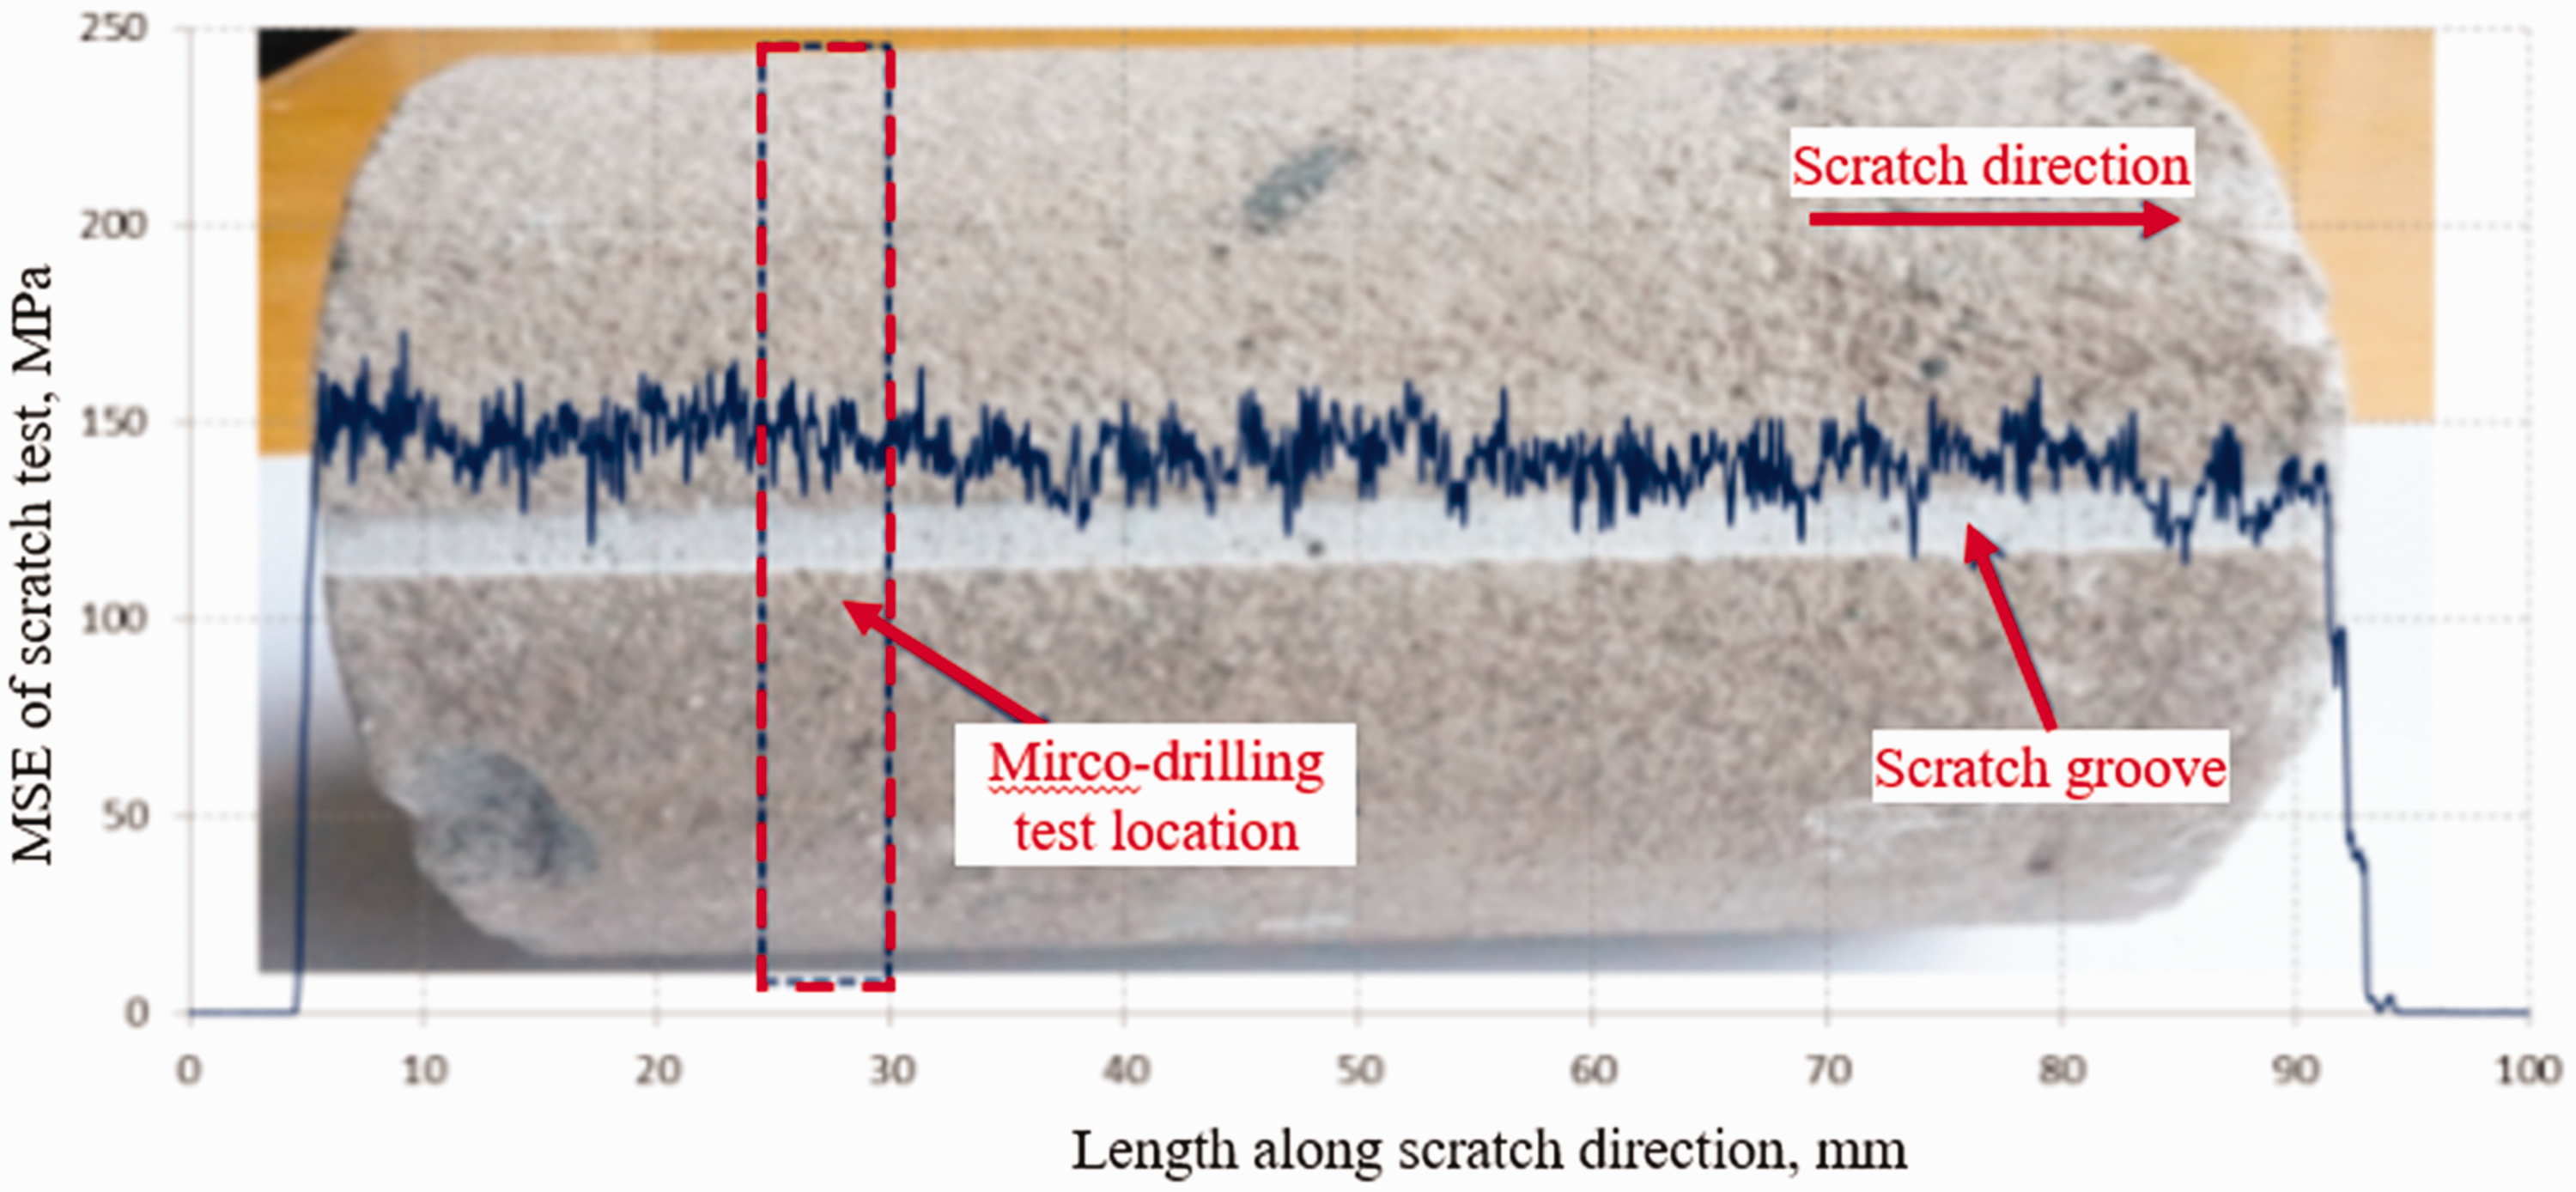
MSE profile of scratch test and micro-drilling test location of sandstone core sample B202-7. MSE: mechanical specific energy.
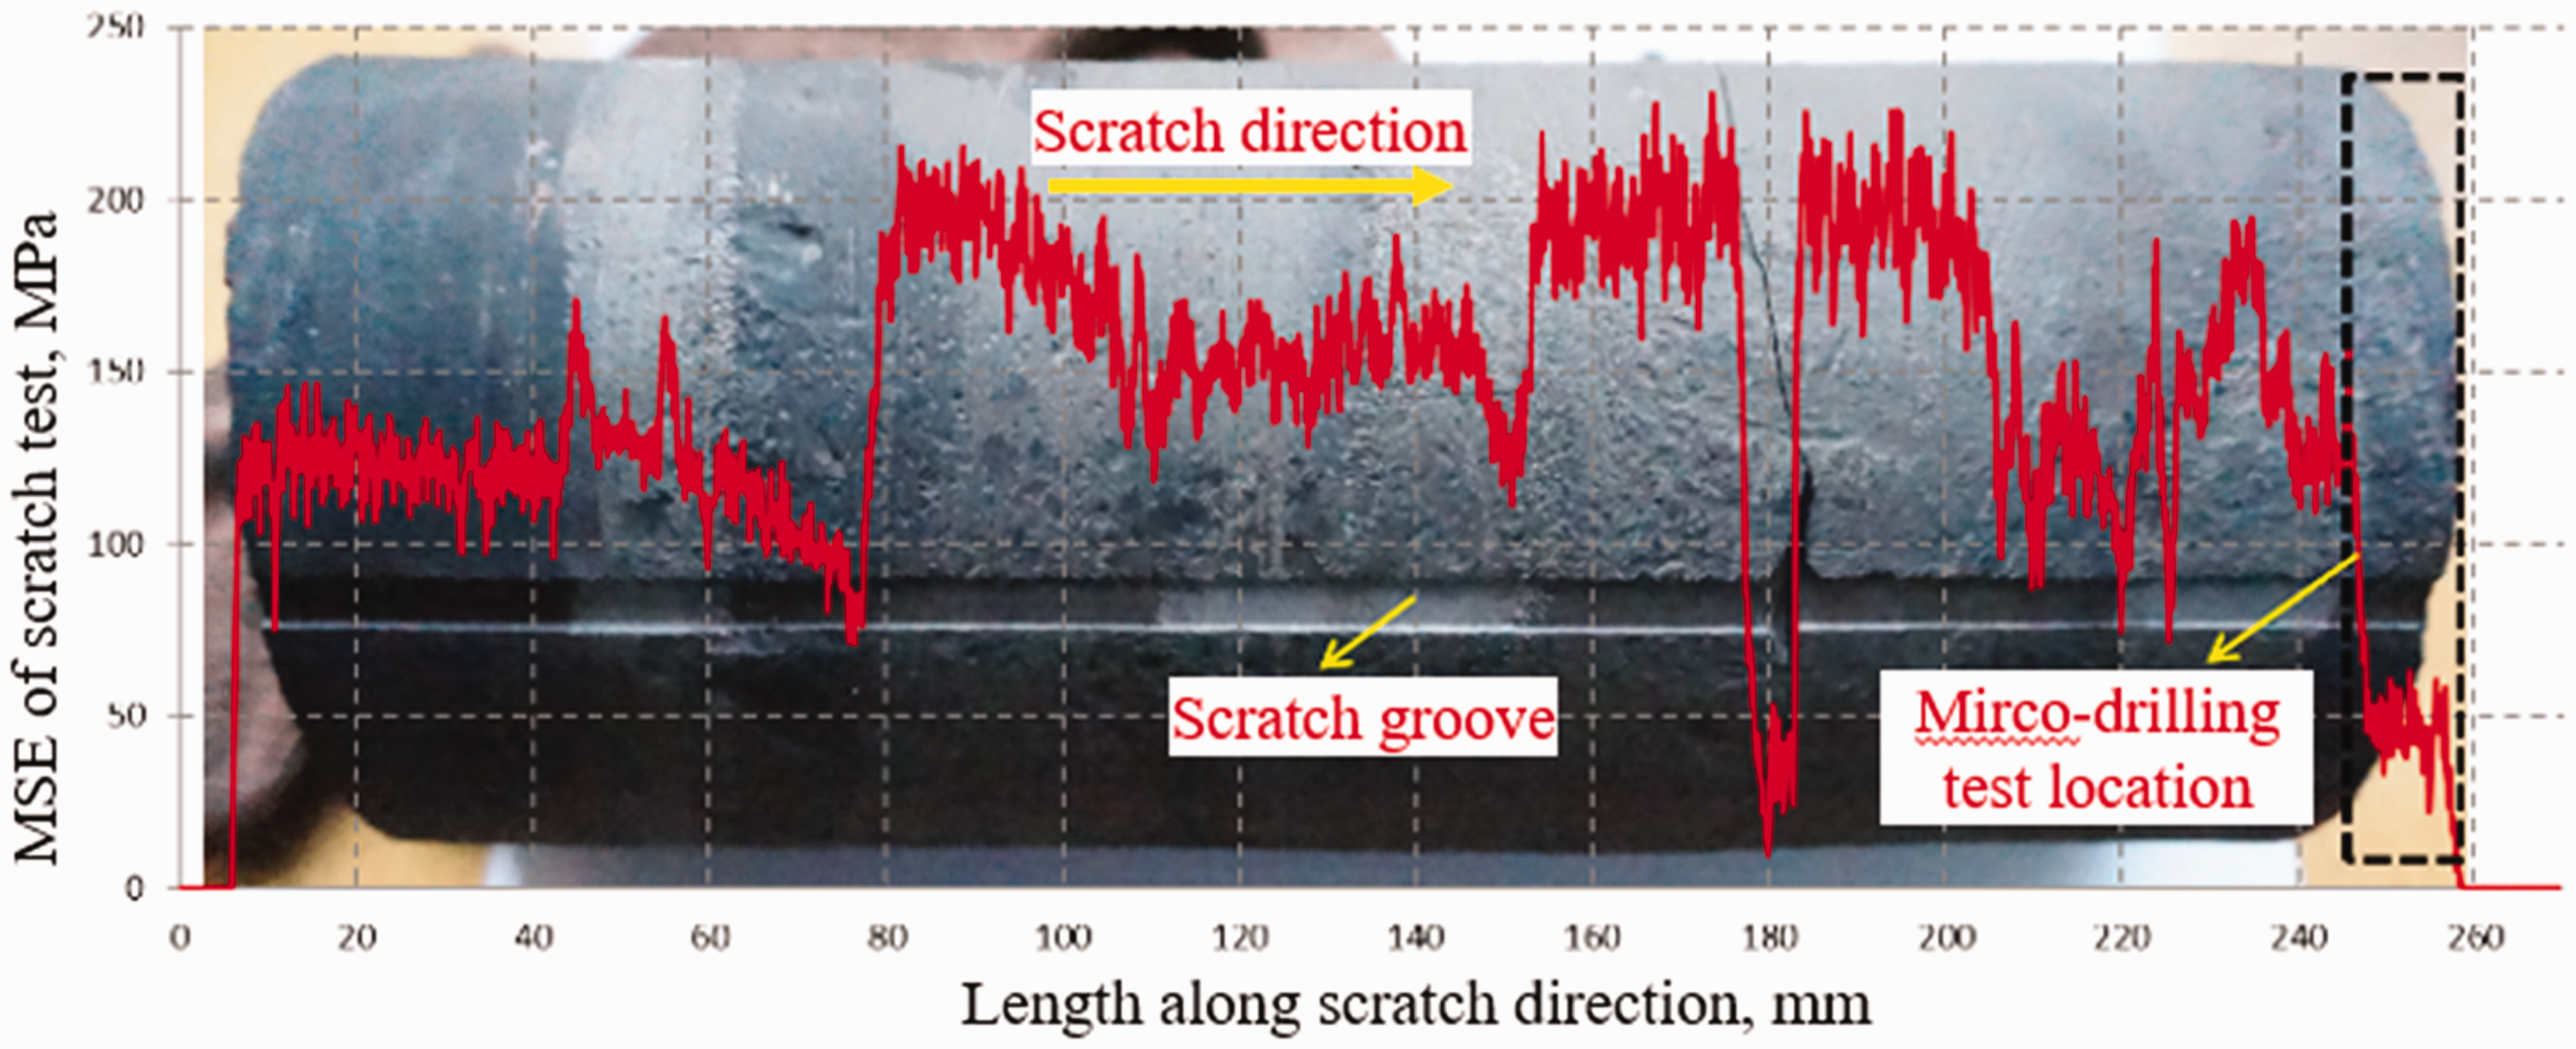
MSE profile of scratch test and micro-drilling test location of shale core sample W1-3. MSE: mechanical specific energy.
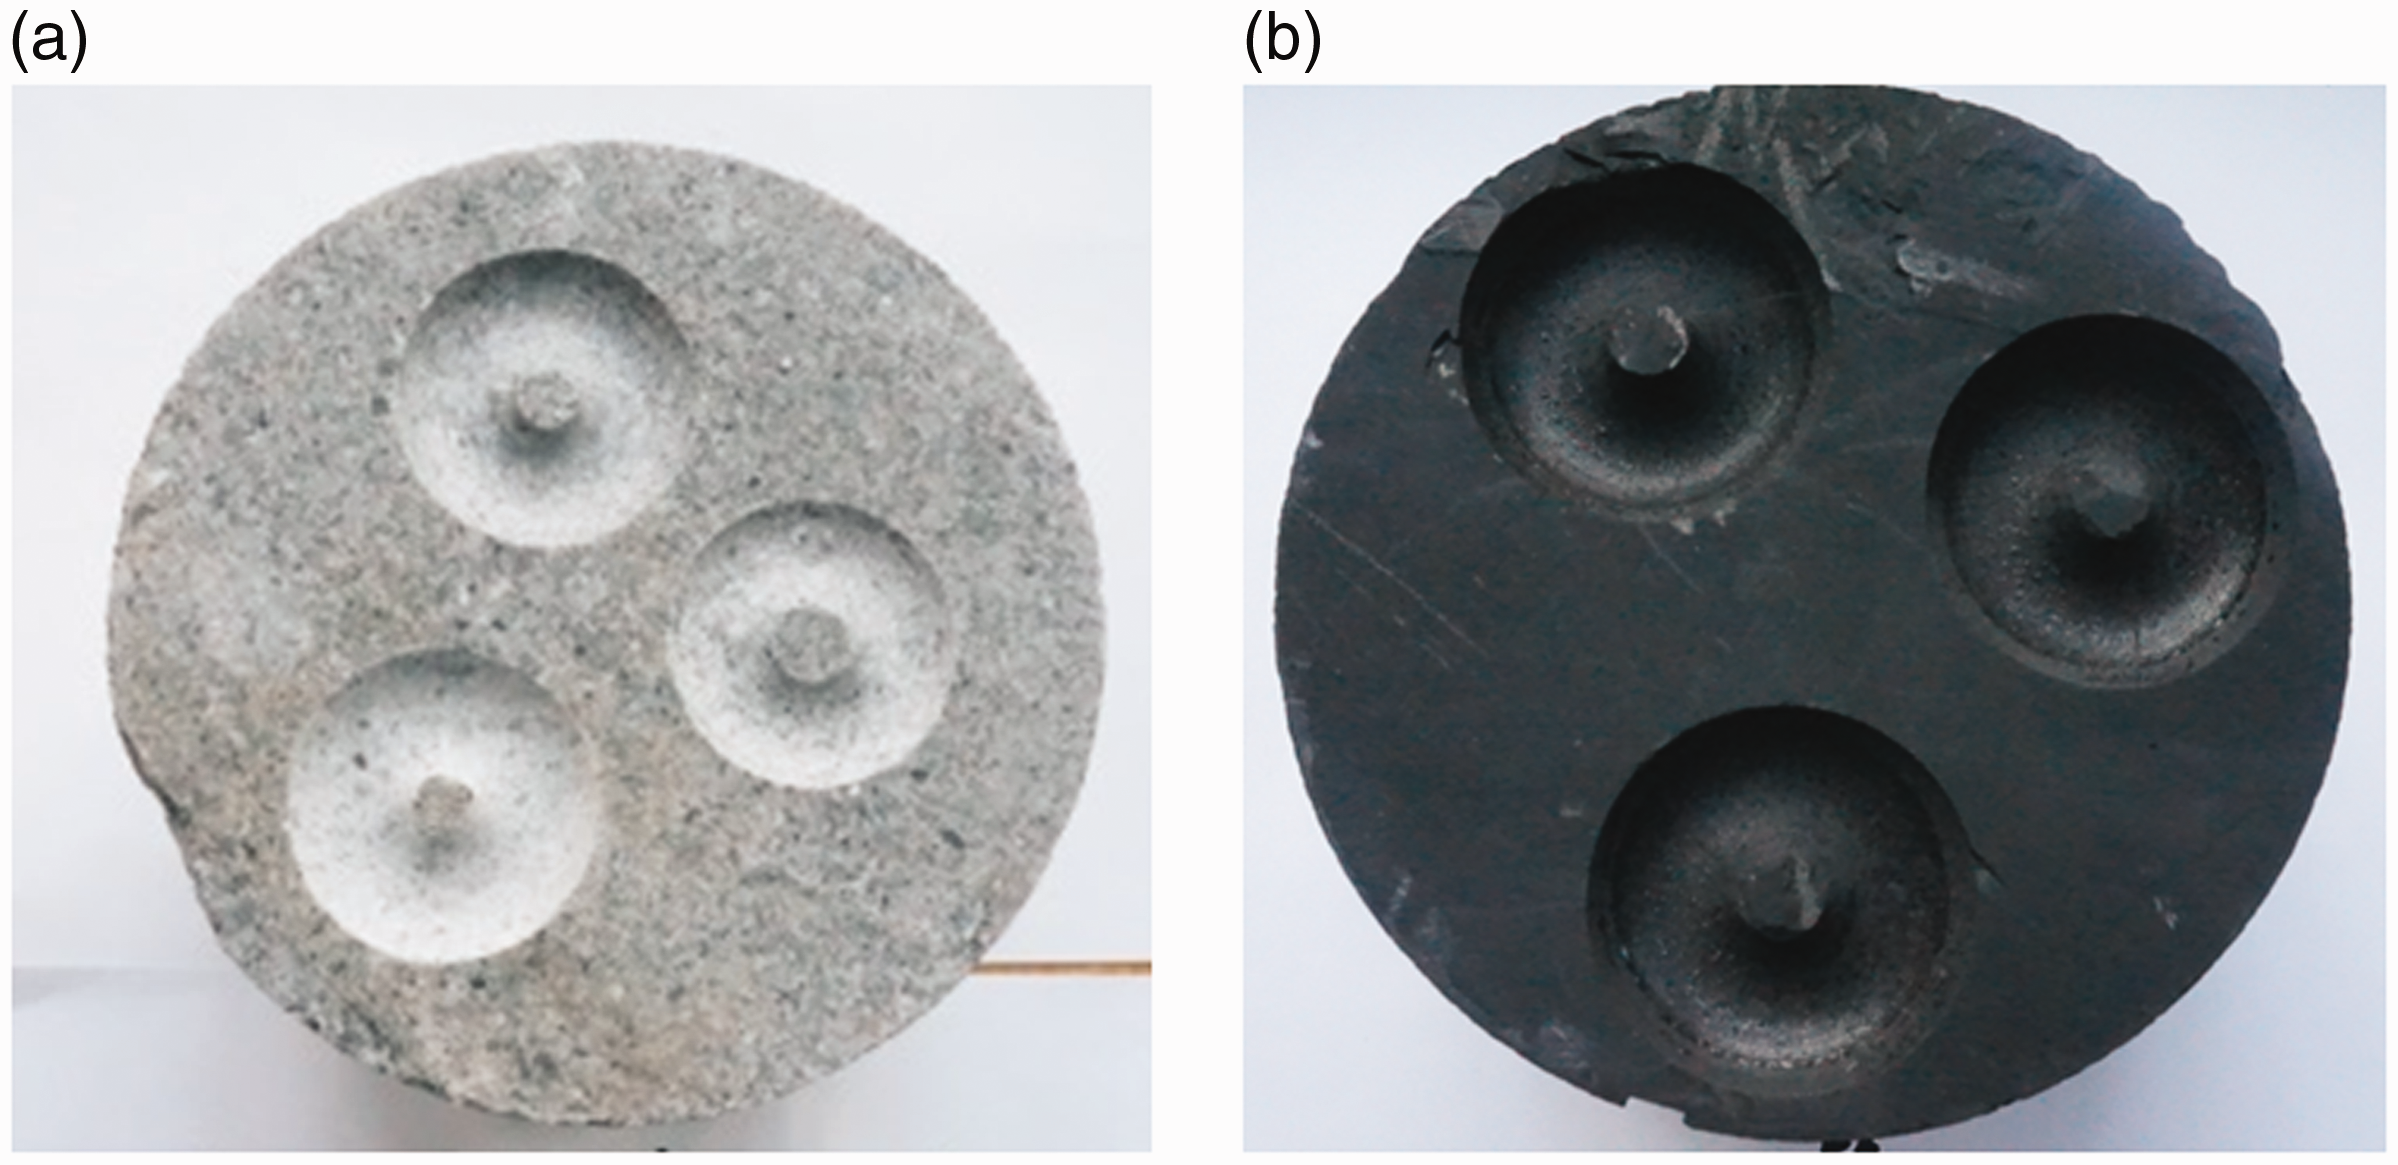
Core sample of (a) B202-7 and (b) W1-3 after micro-drilling tests.
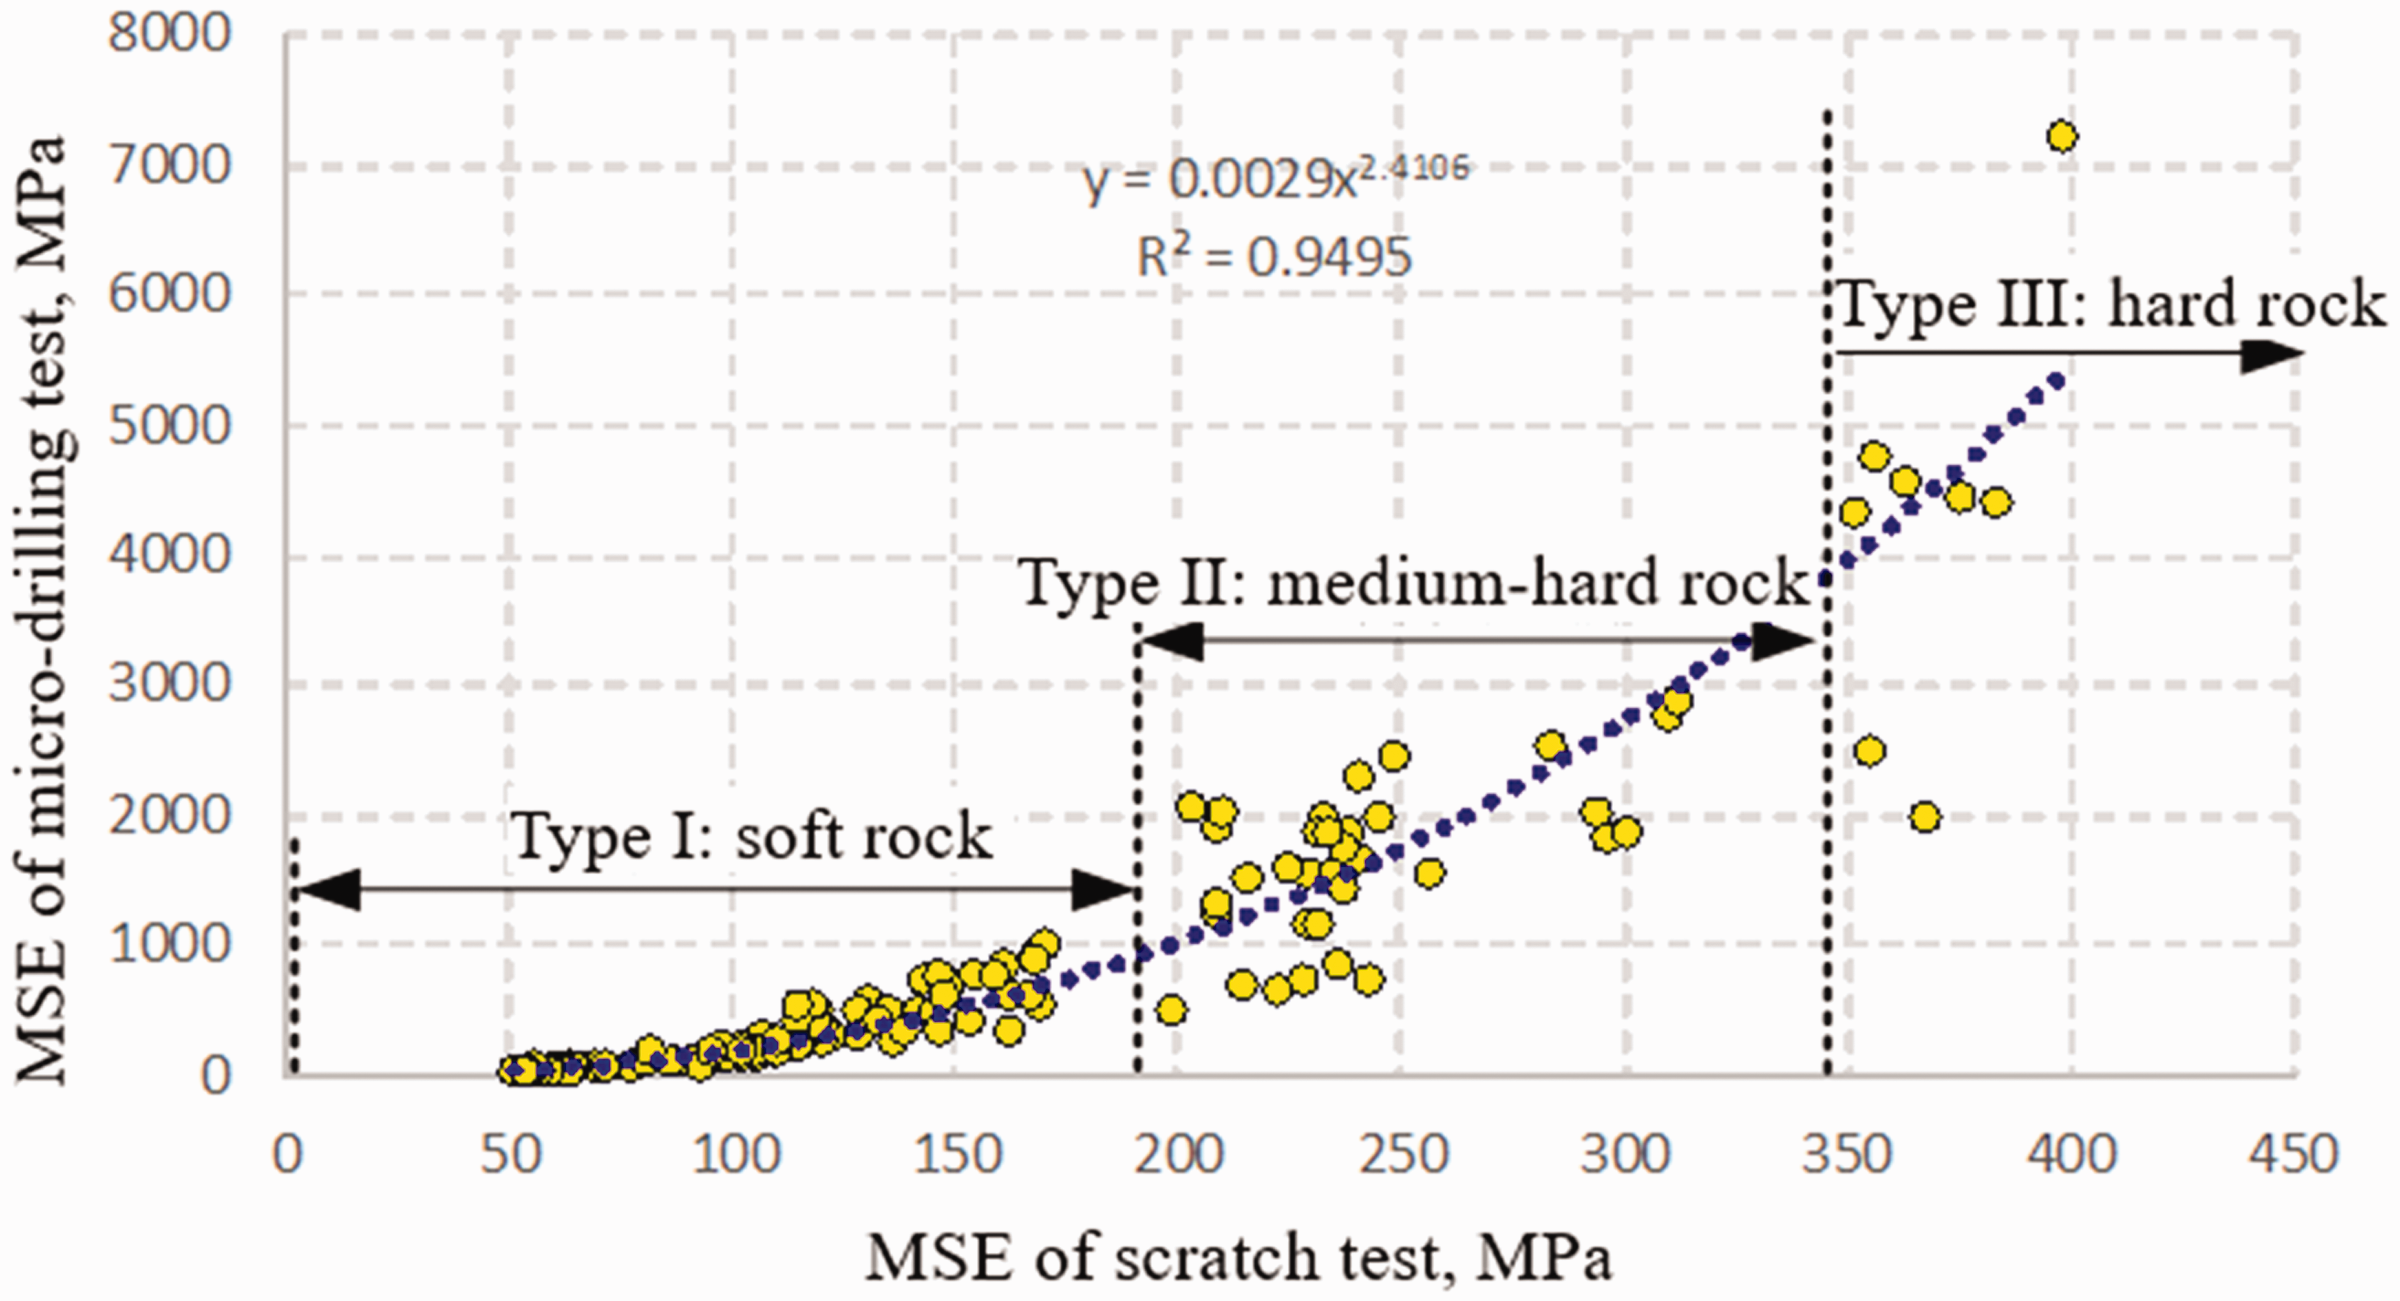
Relationship between MSE of micro-drilling tests and scratching tests. MSE: mechanical specific energy.
A total of 143 sets of micro-drilling test data and scratch test data are obtained for sandstone, shale, igneous and carbonate rocks, as reported in online Appendix 1. Substituting the drill time of micro-drilling tests into equations (12) and (14), the drillability and MSE of PDC bits can be obtained, respectively. MSE of scratch test can be calculated directly with the Detournay and Defourny model using scratch test data as introduced in the Review of MSE Models section. The relationship between the MSE of micro-drilling tests (MSE
d
) and the MSE of scratch tests (MSEs) is given by Equation (15) and shown in Figure 12.
(2) 
Combining equations (12) to (15), an evaluation model of rock drillability of PDC bit using scratch test data can be obtained
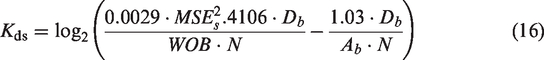
Drillability calculated with this equation for each test is also reported in online Appendix 1.
(3)
Errors of the drillability evaluation model (equation (16)) based on scratch test data are also analyzed, and the results are reported in online Appendix 1. Table 3 presents a set of representative cases with errors that are caused by three main reasons.
Reprehensive cases for error analysis.
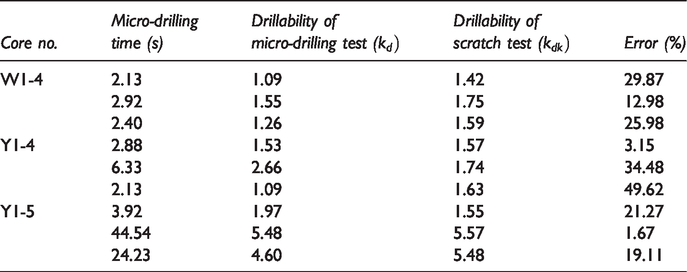
The first type of error is caused by low strength and drillability of the core. For example, core W1-4 in Table 3 has a low average drillability of 1.30 measured directly from micro-drilling tests and a drillability of 1.59 predicted with the drillability model (equation (16)) using scratch test data. Thus, the average relative error of the prediction is 22.9%. However, the difference between the drillability of 1.59 from the scratch test and the average drillability of 1.30 from the micro-drilling test is 0.29, which is considered to be acceptable for practical applications. The drillability of 1.30 and 1.59 indicates that the rock is Type I rock (soft rock) according to the drillability grade classification listed in Table 1. However, if the drillability results from above two types of test can be Type 1 and 2 simultaneously, there might be a significant error and need to re-examine the apparatus and re-test.
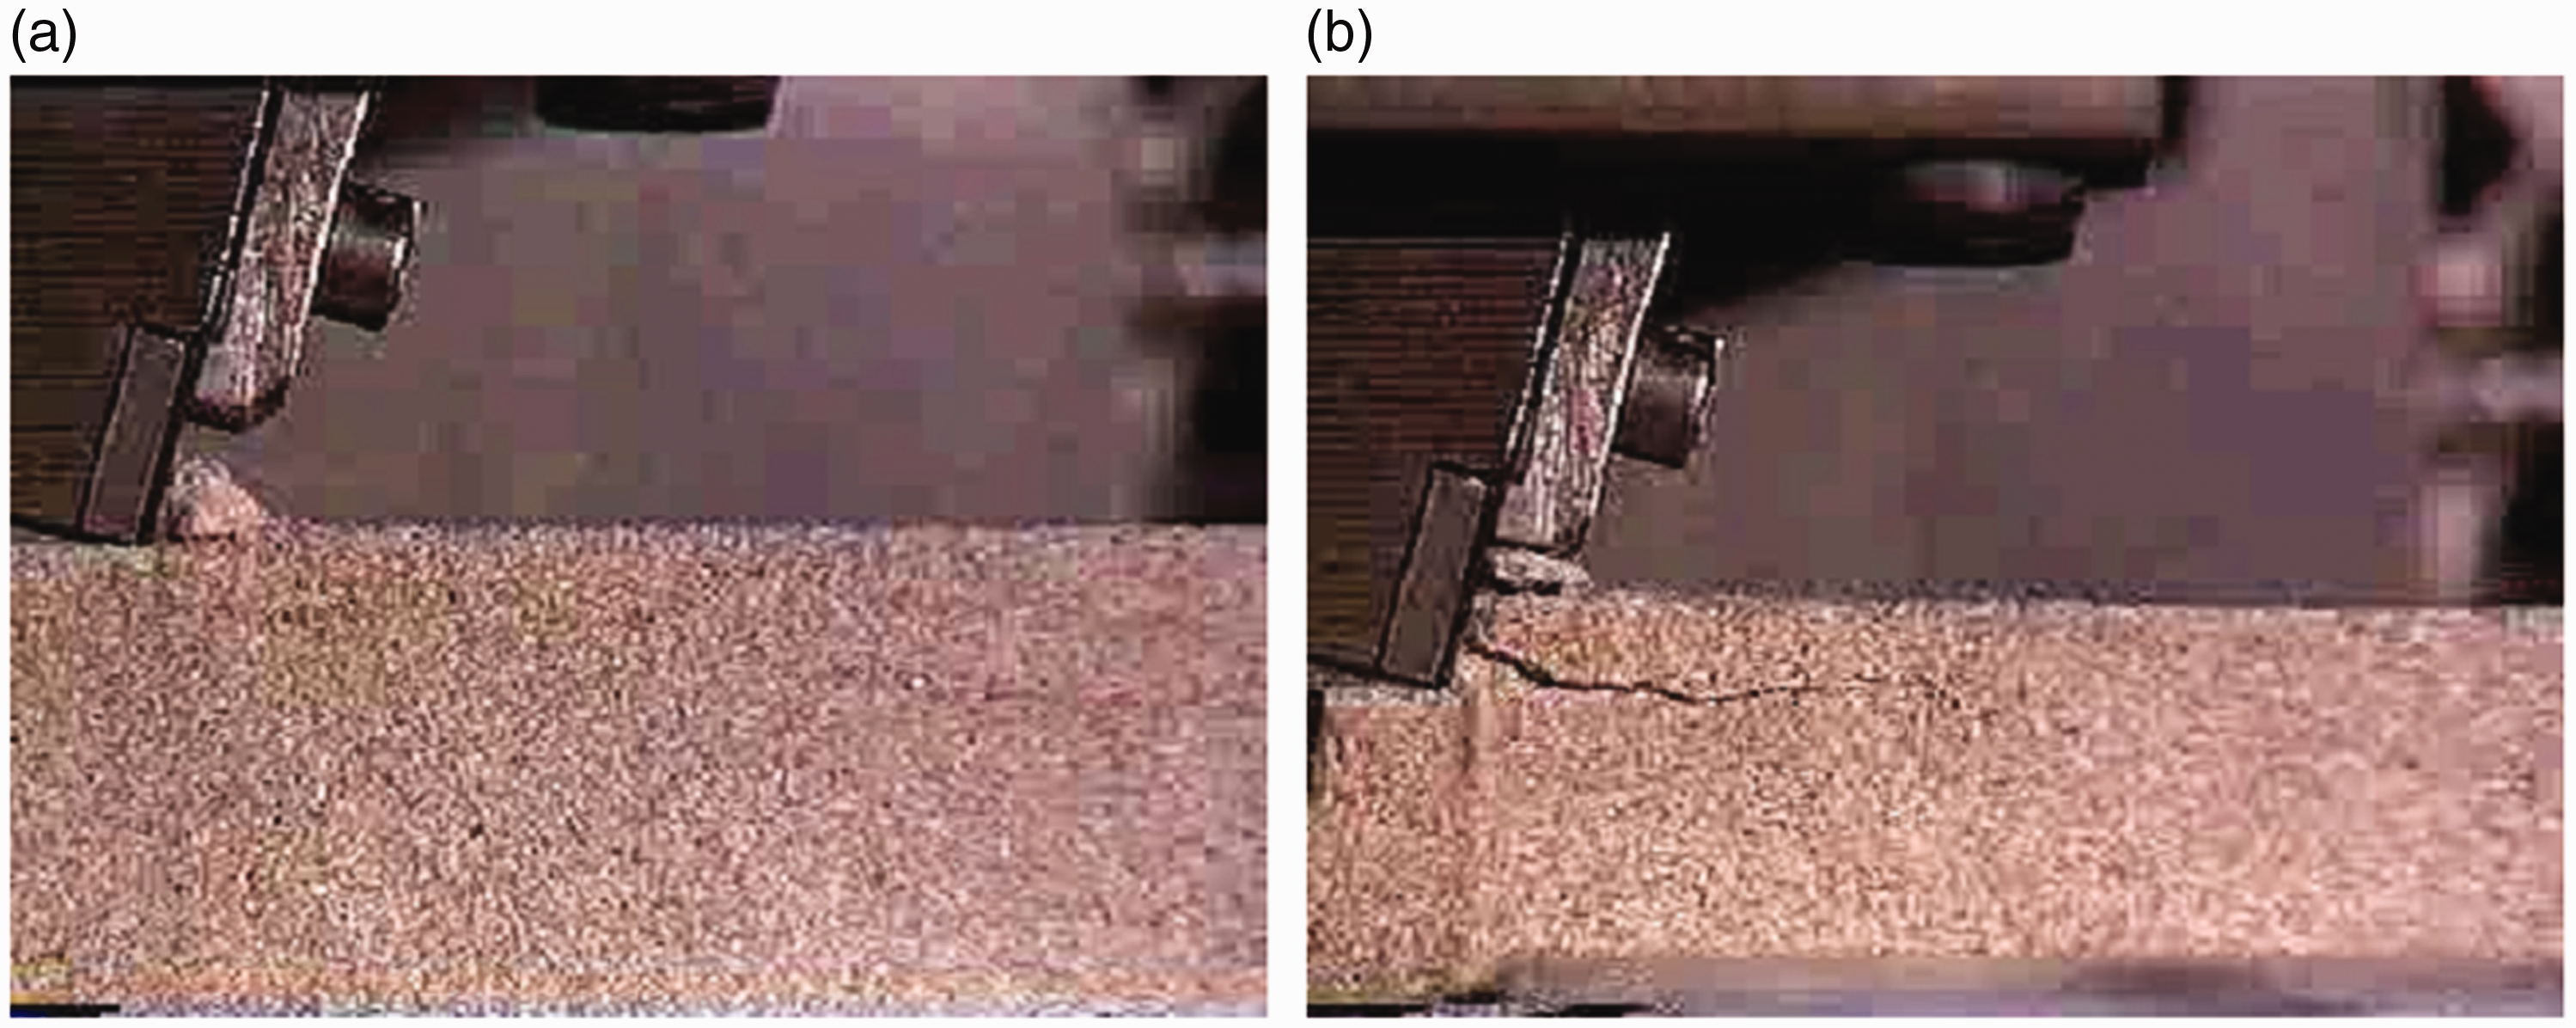
The second type of error is induced by core breakage during micro-drilling tests. For example, the maximum error of shale core Y1-4 in Table 3 is as high as 49.62%. A close observation of this core shows that it is hard and brittle with extensively developed microcracks. During micro-drilling tests, the core was broken; rock fragments spalled off around the drill hole as shown in Figure 13(b). This core failure causes increase or decrease in drilling time, and thus increasing the error. Moreover, reduction of core strength due to breakage also increases the error. The average drillability of core Y1-4 is 1.76 and 1.65 from micro-drilling tests and scratch tests, respectively. Once again, although the relatively error 49.62% is very high, the absolute error is only 0.12 which is acceptable from a practical point of view.
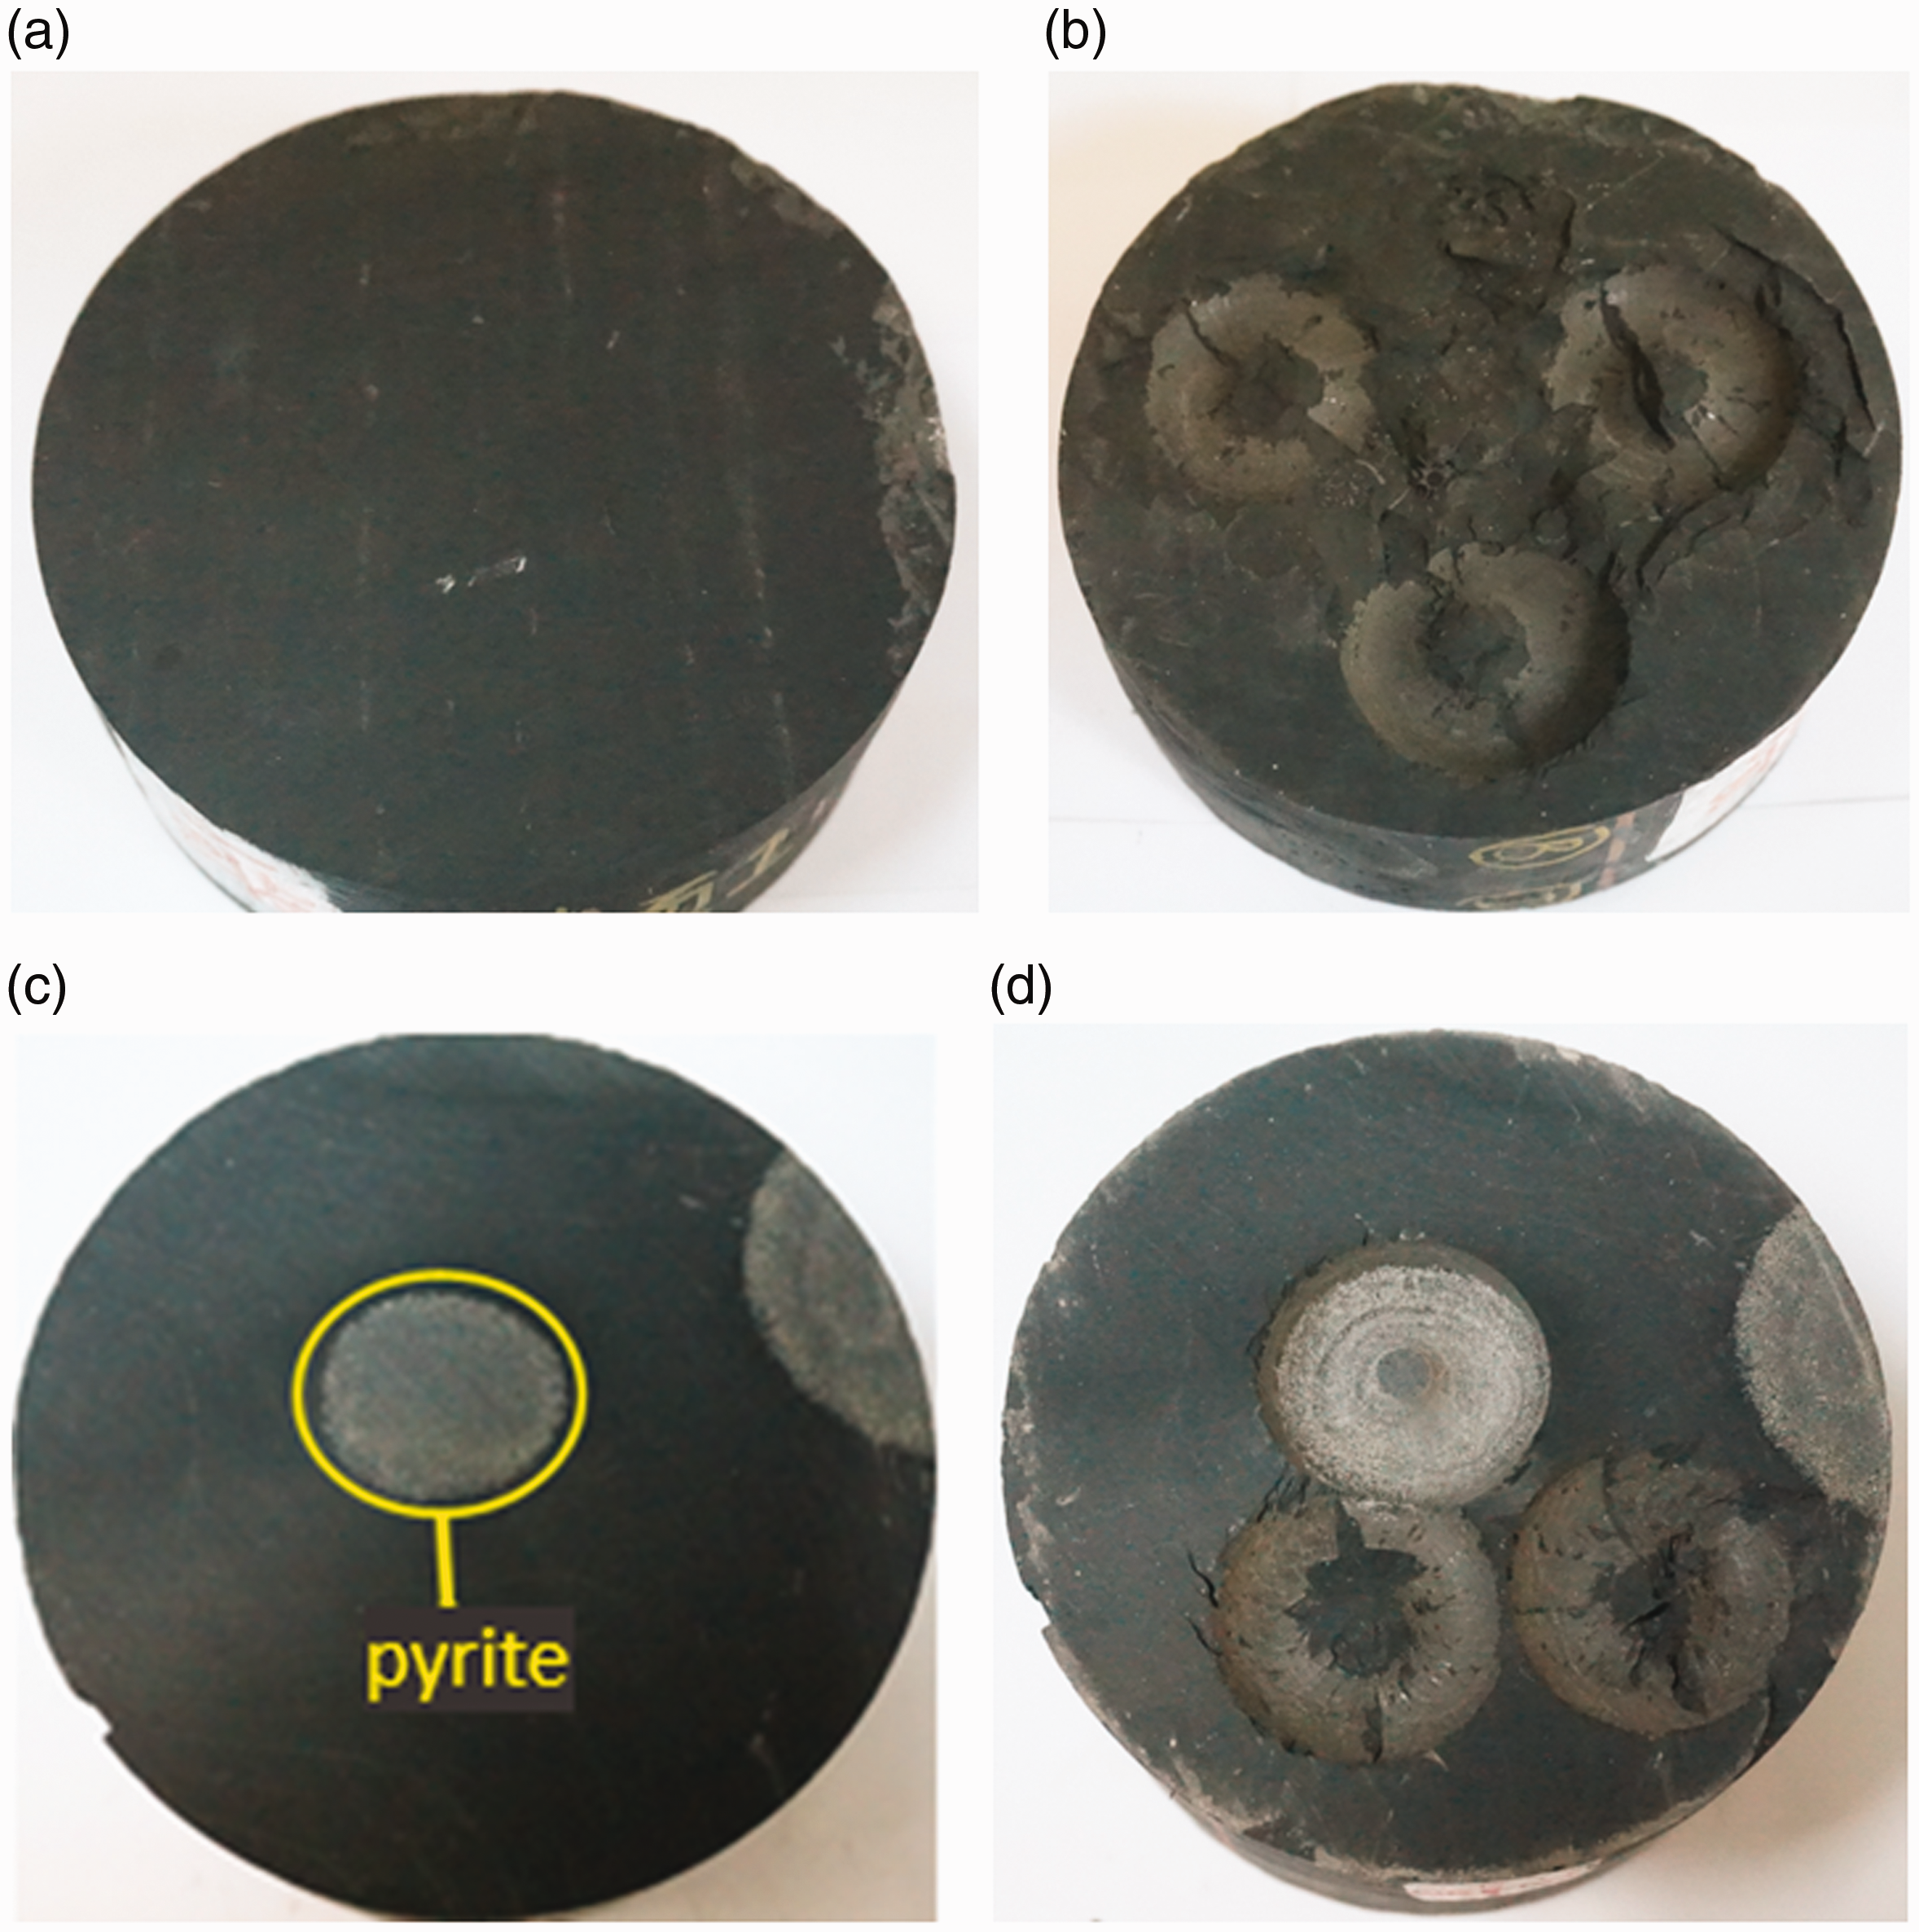
Cores Y1-4 and Y1-5 before and after micro-drilling tests: (a) core Y1-4 before micro-drilling test, (b) core Y1-4 after micro-drilling test, (c) core Y1-5 before micro-drilling test, and (d) core Y1-5 after micro-drilling test.
The third type of error is resulted from lithology variation in the core. For example, shale core Y1-5 has sudden lithology change due to local pyrite development as shown in Figure 13©, resulting in different drilling time at different micro-drilling locations. The drilling time in pyrite-development area is only 3.92 s, while drilling times at the other two locations without pyrite development are 44.54 s and 24.23 s, respectively. However, the variation of drilling time caused by lithology change is real and acceptable.
Figure 14 is a statistical analysis of the errors of all 143 sets of drillability data predicted based on equation (16). It is found that 59 sets have an error less than 5%, 39 sets have an error between 5% and 10%, and 23 sets have an error between 10% and 15%. The percentage of data sets with an error less than 15% reaches 83.45%. The statistical analysis indicates that the drillability prediction model of equation (16) has high precision and good adaptability in either soft or hard formations.
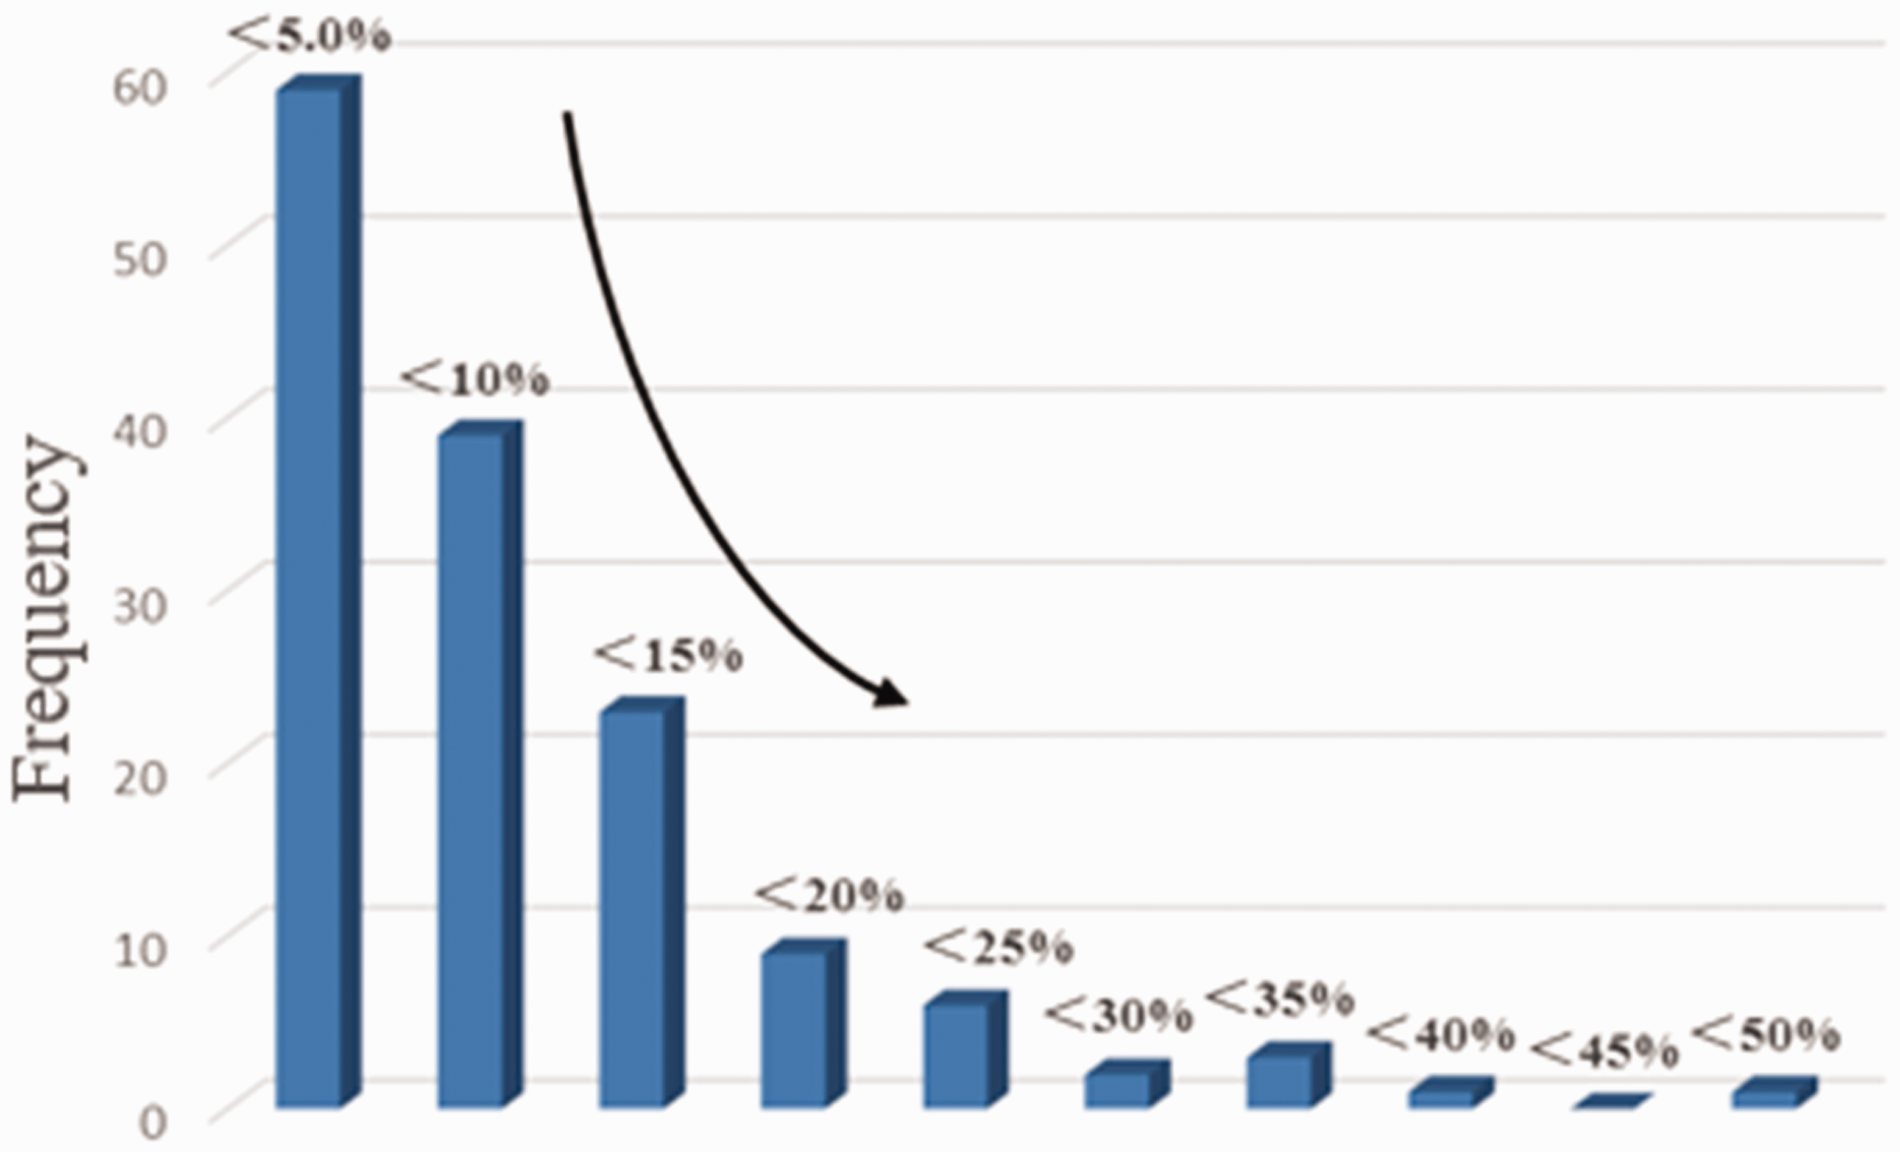
Statistical analysis of drillability prediction error of equation (16).
(4)
Using the 47 sets of micro-drilling and scratch test data reported in Chen et al. (2017a), we calculated rock drillability using the current model and the model of Chen et al. (2017a). It should be noted that all the tests of Chen et al. (2017a) are on soft to medium-hard rock (with drillability between 2.0 and 7.0, see Table 1). A comparison of the prediction results of the two models in Figure 15 shows that the two models agree very well with each other. A further check by comparing the predicted drillability with measured drillability by micro-drilling tests shows that the average errors of the current model and the model of Chen et al. (2017a) are 5.93% and 6.01%, respectively. The small errors indicate that both models work well for soft to medium-hard rock.
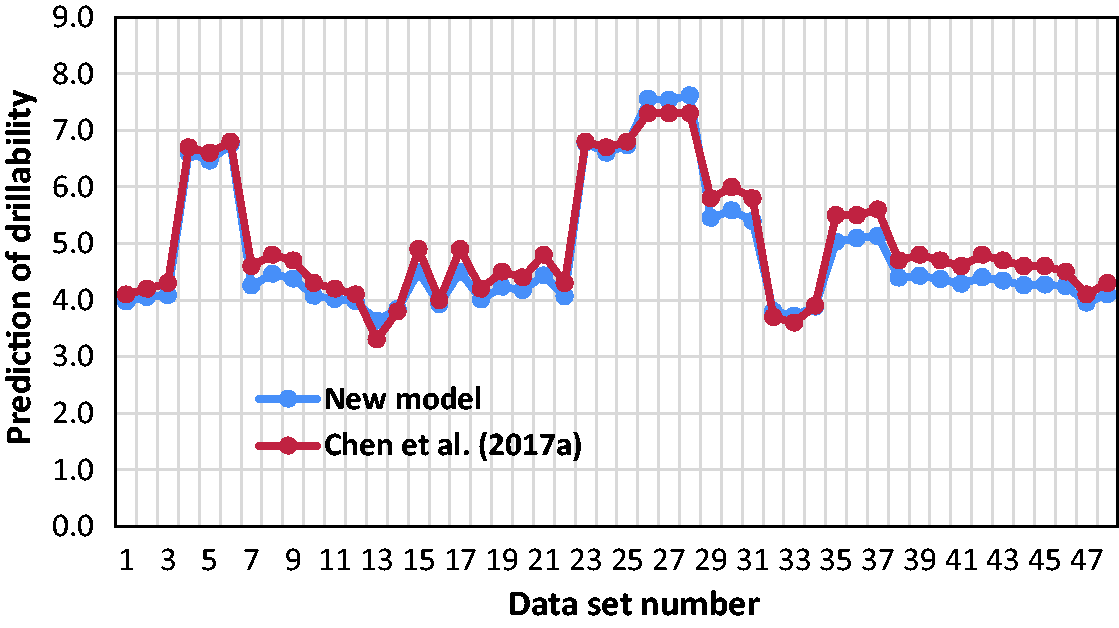
Comparison of drillability predicted with the current model and the model of Chen et al. (2017a) for soft to medium–hard rock.
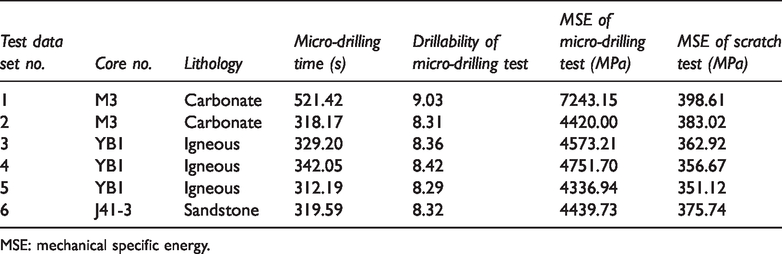
As aforementioned, the new model works better for hard rock compared with the model of Chen et al. (2017a). To illustrate this point, we selected six groups of tests data (summarized in Table 5) from Appendix 1 with measured drillability over 8.0 (hard rock as defined in Table 1) and predicted the drillability using the two models. The prediction errors of each set are shown in Figure 16. The results clearly show that the new model has much smaller errors compared with Chen et al. (2017a), confirming its better applicability for hard rock.
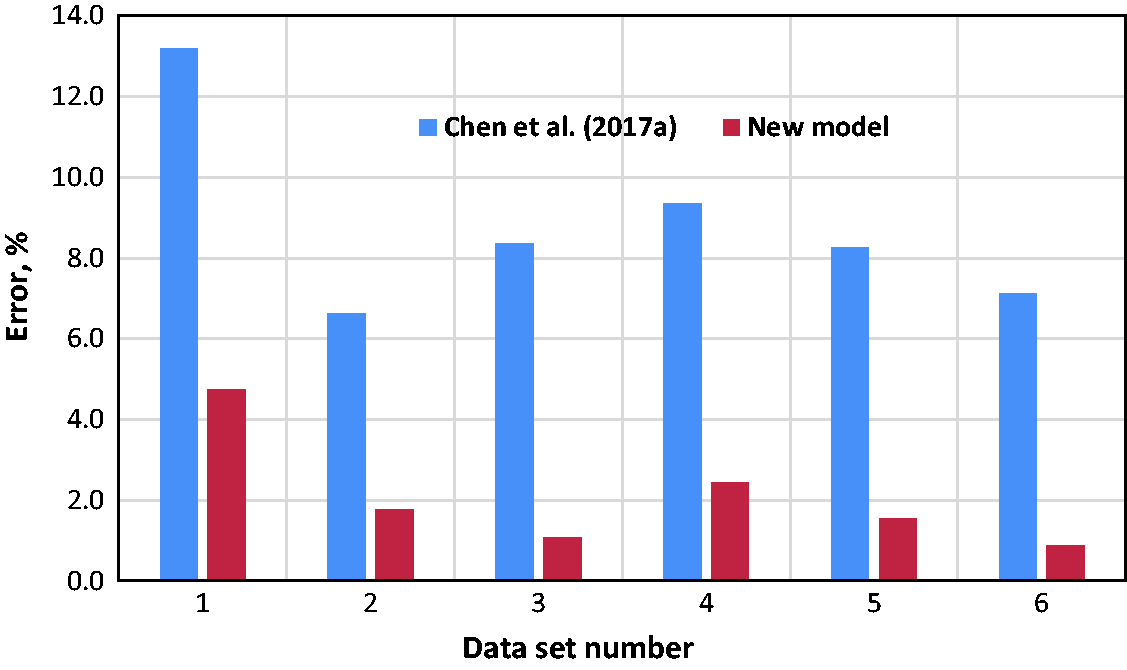
Comparison of the prediction error of the current model and the model of Chen et al. (2017a) for hard rock.
Case studies
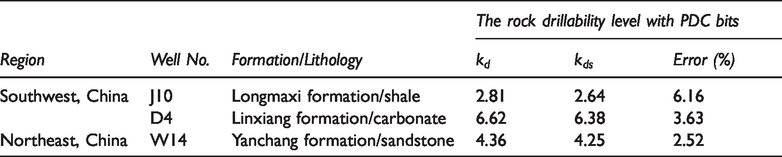
The drillability model of PDC bit using scratch test data has been used in evaluating the drillability of Longmaxi formation in southwest China and Yanchang formation in north China. Figure 17 shows the drillability profile of a relatively homogeneous shale core of Longmaxi formation from Well J10. The drillability predicted using scratch test data along the core is quite uniform and around 2.60, and the average drillability from micro-drilling tests is 2.81, indicating a small error of 6.16%.
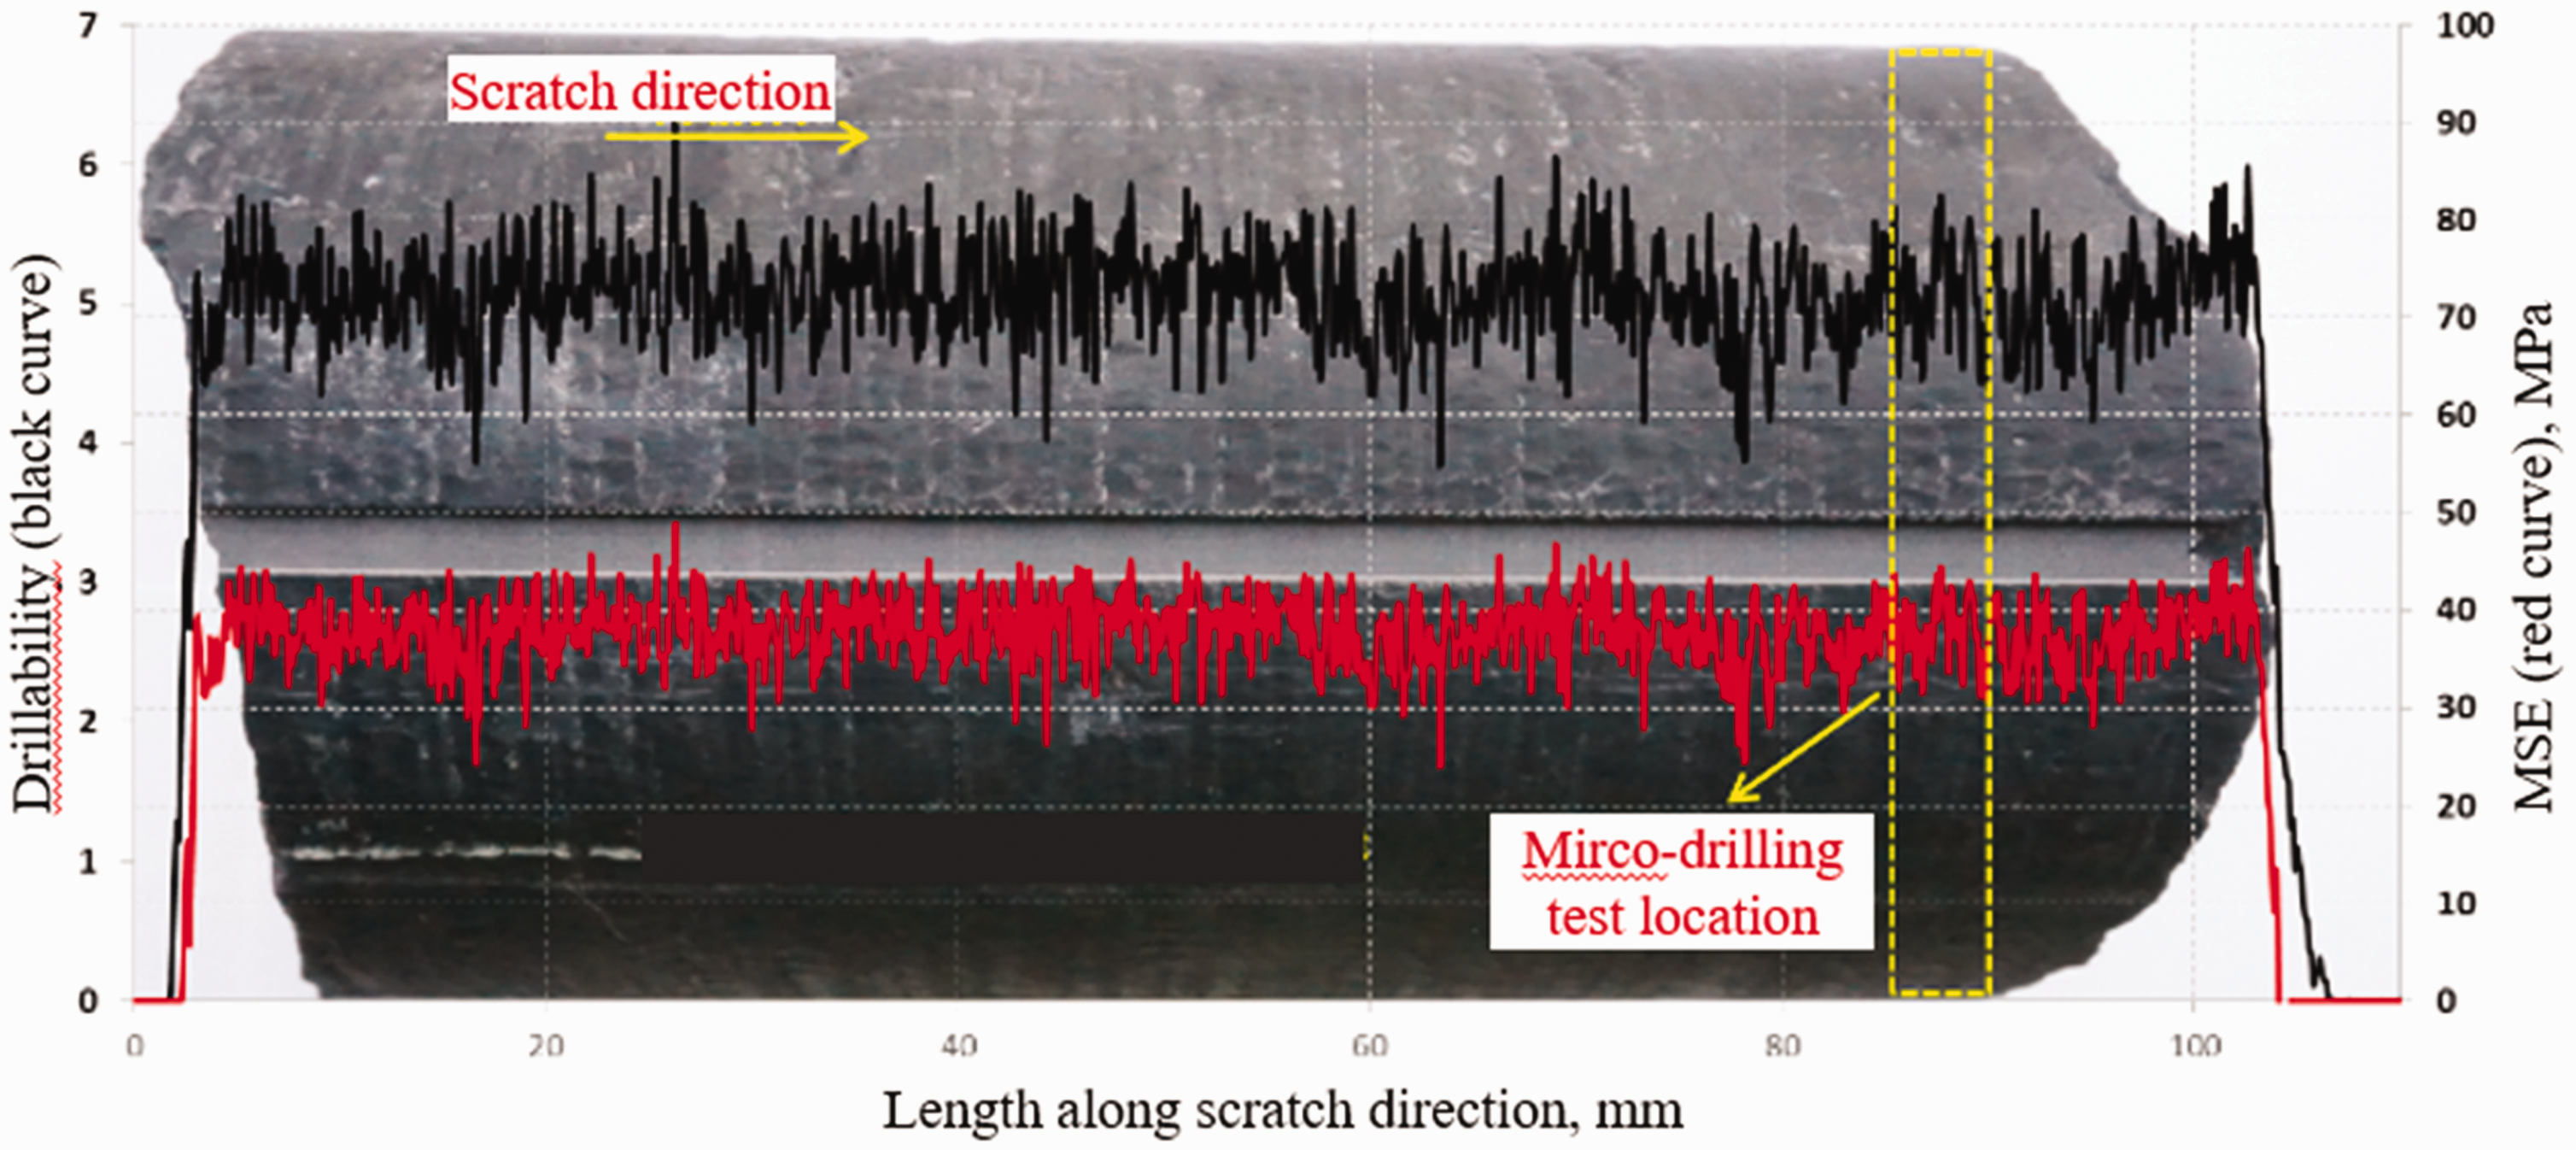
MSE and drillability profiles of a relatively homogeneous shale core from Well J10 in southwest China. MSE: mechanical specific energy.
Figure 18 shows the continuous drillability profile of a sandstone core from Yanchang formation in Well W14, north China. The drillability predicted from scratch test data evenly distributed around 4.20, and the average drillability from micro-drilling tests is 4.36, indicating a small error of 2.52%.
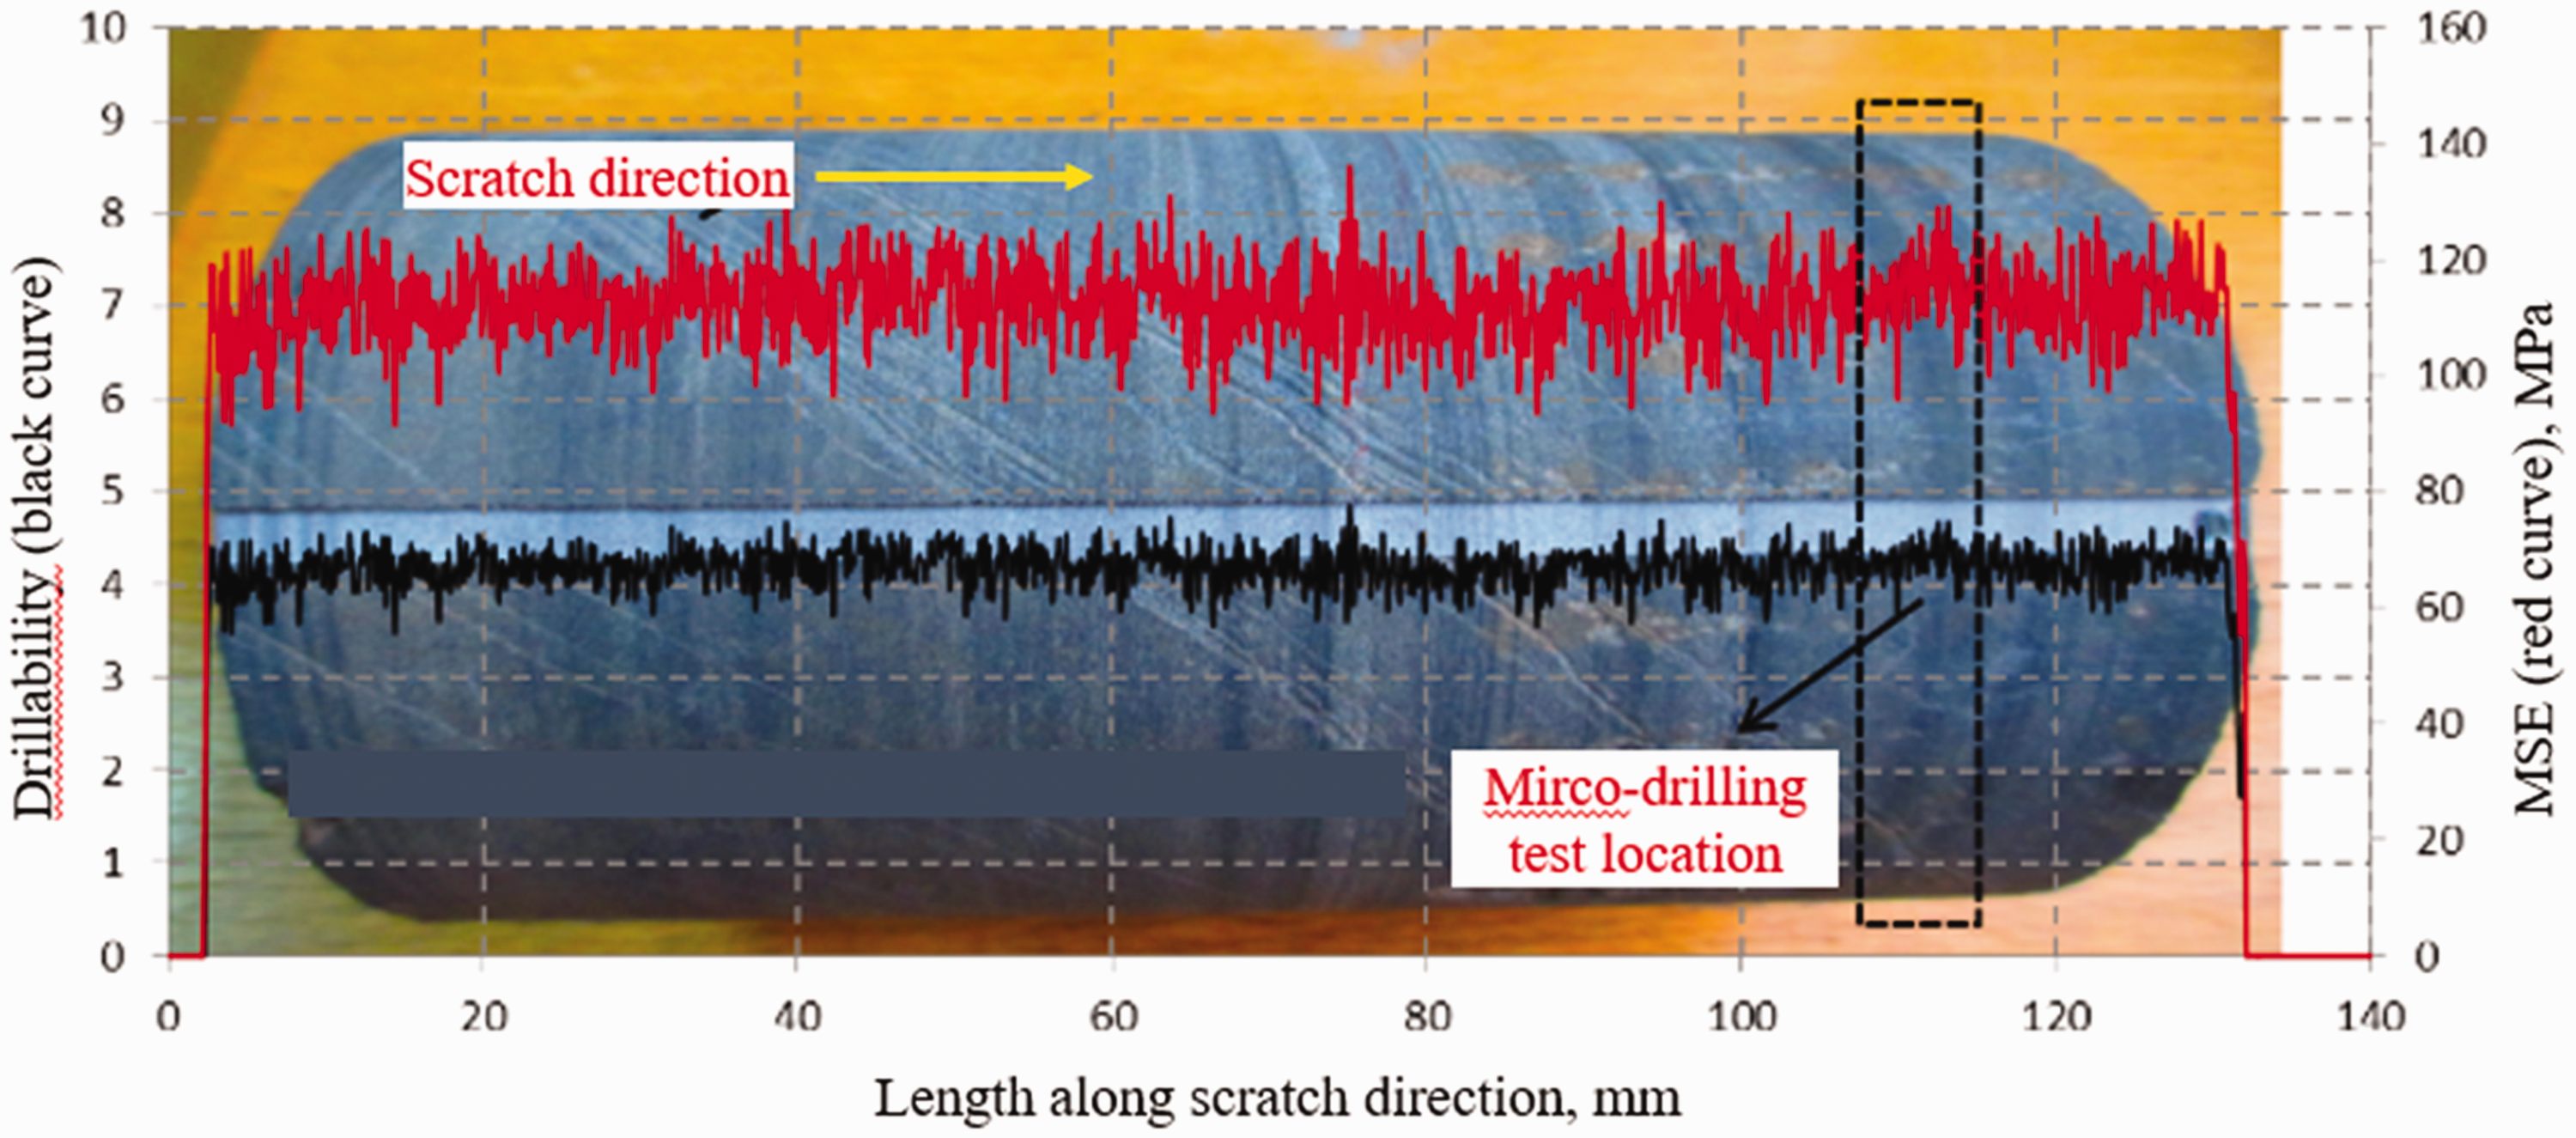
MSE and drillability profiles of a relatively homogeneous sandstone core from Well W14 in north China. MSE: mechanical specific energy.
Figure 19 shows that the continuous drillability profile of a carbonate core from Linxiang formation in Well D14, southwest China. It can be seen that MSE along the core fluctuates dramatically between 100 and 350 MPa and drillability fluctuates between 2.0 and 7.0. These fluctuations reflect the influence of local variations of mineral composition, cementation strength, and microstructure of the rock. In this case, the traditional micro-drilling tests at a few scattered points cannot fully represent the drillability of the entire core section, while scratch tests are superior.

MSE and drillability profiles of a heterogeneous carbonate core from Well D4 in southwest China. MSE: mechanical specific energy.
Table 4 compares rock drillability of PDC bits determined with scratch test data (
Drillability prediction for formations in southwest and north China.
Test data sets used for the comparison of the current model and the model ofChen et al. (2017a).
MSE: mechanical specific energy.
Conclusions and recommendations
A mathematical model for evaluating rock drillability of PDC bits using scratch test data is developed in this paper. Applications of the model to a variety of rocks with different hardness show that it has high consistency with drillability measured directly from laboratory micro-drilling tests. The new method based on scratch tests has the advantages of providing continuous drillability profile along the scratch path and characterizing the influence of mineral composition, cementation strength, and micro structures of rock on drillability, superior to the traditionally used micro-drilling test method which can only measure drillability at scattered points.
Further steps of this study should be extended to laboratory tests under multiple factors (e.g., temperatures, confining pressure, and pore pressure) and develop drillability evaluation models considering the coupling between these factors. Such drillability models would be of great importance for designing and selecting drill bits and improving the efficiency of deep and ultra-deep drilling.
Supplemental Material
EEA901091 Supplemental material - Supplemental material for A new approach to evaluate rock drillability of polycrystalline diamond compact bits using scratch test data
Supplemental material, EEA901091 Supplemental material for A new approach to evaluate rock drillability of polycrystalline diamond compact bits using scratch test data by Yannong Han, Xiaorong Li and Yongcun Feng in Energy Exploration & Exploitation
Footnotes
Declaration of conflicting interests
The author(s) declared no potential conflicts of interest with respect to the research, authorship, and/or publication of this article.
Funding
The author(s) disclosed receipt of the following financial support for the research, authorship and/or publication of this article: This work is financially supported by National Major Project of the 13th Five-year Plan of China (2016ZX05061002-001), Major Science and Technology Projects of Sinopec (P18052-3), and Science Foundation of China University of Petroleum, Beijing (No. ZX20190179 and No. ZX20190070).
Supplemental Material
Supplemental material is available for this article online.
References
Supplementary Material
Please find the following supplemental material available below.
For Open Access articles published under a Creative Commons License, all supplemental material carries the same license as the article it is associated with.
For non-Open Access articles published, all supplemental material carries a non-exclusive license, and permission requests for re-use of supplemental material or any part of supplemental material shall be sent directly to the copyright owner as specified in the copyright notice associated with the article.